Article

Crack Width Calculation Method for Concrete in Hogging Moment Region of Steel–UHPC–NC Composite Girder with Integrated Piers

1
Tongxiang Transportation Construction Investment Group Co., Ltd., Jiaxing 314500, China
2
School of Civil Engineering, Tongji University, Shanghai 200092, China
3
Fujian Provincial Expressway Group Co., Ltd., Fuzhou 350001, China
*
Authors to whom correspondence should be addressed.
Infrastructures 2026, 11(5), 178; https://doi.org/10.3390/infrastructures11050178
Submission received: 25 March 2026 / Revised: 2 May 2026 / Accepted: 13 May 2026 / Published: 19 May 2026

Abstract

The application of ultra-high performance concrete (UHPC) in the hogging moment region significantly enhances the crack resistance of concrete slabs of composite girders with integrated piers, while also providing economic benefits. To investigate the crack resistance performance and develop a calculation method for crack width in hogging moment region of steel–UHPC–normal concrete (NC) composite girders, a full-scale bending test was conducted. Based on the test results, the post-cracking residual tensile strength of UHPC was determined according to the energy equivalence principle. A calculation method for reinforcement stress incorporating the tensile contribution of UHPC at a cracked section was proposed and then the applicability for current design codes for crack width calculation was evaluated. For the UHPC–NC interface, a corresponding crack width calculation method was developed. The results indicate that cracks initiated on the surface of the NC layer beneath the UHPC overlay at the cantilever root. Then cracks developed in sequence at the top surface of the UHPC layer cantilever root, the UHPC–NC interface, and the mid-plane of the girder-to-pier joint. Ultimately, UHPC cracks exhibited a “numerous and closely spaced” distribution, whereas NC cracks were “few and widely spaced.” When the residual tensile strength of UHPC at cracked section was considered, the mean value and average coefficient of variation in the ratios of calculated to measured reinforcement stresses for different sections were 1.07 and 0.10, respectively, which can be further used for crack width calculation. The mean ratios of code-predicted to measured UHPC crack widths for different sections using the Chinese code, French code, and European code were 1.10, 0.98, and 1.13, respectively, with corresponding average coefficients of variation of 0.25, 0.33, and 0.28; the Chinese code is recommended for UHPC crack width prediction. For the UHPC–NC interface, an expression for crack width calculation was derived using the comprehensive theory, and the mean ratio of calculated to measured values and the coefficient of variation were 1.08 and 0.18, respectively, demonstrating good predictive accuracy.

1. Introduction

Prefabricated steel–concrete composite girders have been widely used in modern short- and medium-span bridge engineering due to notable advantages such as construction convenience and quality controllability [1]. However, in continuous composite girders, the concrete slab in the hogging moment region is in tension and the steel girder in compression, which fails to exploit the complementary strengths of the two materials, and renders the concrete slab prone to cracking. Such cracks not only reduce sectional stiffness but also accelerate reinforcement corrosion as well as concrete deterioration, thereby seriously compromising the long-term durability and service life of the structure [2,3].
UHPC, an innovative fiber-reinforced cementitious composite with excellent mechanical properties and durability [4,5,6], has undergone rapid development in recent years, with widespread application in bridge engineering. Shao [7] and Li [8] studied the flexural performance and cracking characteristics of steel–UHPC lightweight composite slabs, and summarized the influence of reinforcement ratio and cover thickness on crack development. Liu [9] and Zhang [10] investigated the flexural performance of steel–UHPC I-shaped composite girders in sagging and hogging moment regions, and identified the typical flexural failure modes. Zhu [11], Yoo [12], and Zhang [13] investigated steel–UHPC waffle slabs and examined the influence of structural parameters on their failure modes and bearing capacity. Existing studies show that compared with steel–NC composite girders, steel–UHPC composite girders feature thinner slabs, greater spanning capacity, and superior durability and fatigue performance.
However, the high cost of UHPC limits its large-scale application. Therefore, exploring a relatively economical approach to incorporating UHPC into steel–concrete composite girders at critical locations constitutes an important design principle for optimizing steel–UHPC composite structures. Liu [14] found that steel–UHPC–NC composite girders exhibit lower material cost and higher flexural efficiency compared with steel–UHPC composite girders. Men [15] found that steel–UHPC–NC composite girders showed a 67% higher cracking load than steel–NC composite girders, and only a 5–6% lower flexural capacity than steel–UHPC composite girders. Push-out tests conducted by Yang [16] demonstrated that the ultimate shear strengths of 19 mm and 22 mm diameter studs in UHPC–NC were only 3.8% and 2% lower, respectively, than those of studs embedded in UHPC. These studies confirm that steel–UHPC–NC composite girders achieve a favorable balance between structural performance and material cost.
Nevertheless, the mechanical behavior of the UHPC–NC interface—particularly the initiation and propagation of cracks—is critical to the durability and long-term serviceability of such composite girders. The interfacial bond between UHPC and NC is primarily composed of chemical adhesion, mechanical interlocking, and dowel action of the reinforcing bars [17]. Mohammed [18] and He [19] found that the substrate surface treatment has a significant effect on the bond strength of the UHPC–NC interface. Hussein [20,21] investigated the cohesive and frictional behavior of unreinforced UHPC–NC interfaces under different degrees of NC surface roughness and developed a traction–separation model. Tayeh [22] conducted slant shear and splitting tensile tests and indicated adequate short-term bond strength, characterized by failure predominantly occurring within the NC. Yang [23] demonstrated that the combined action of mechanical interlocking and dowel effect effectively restrains crack propagation, thereby improving shear resistance of the UHPC–NC interface. While these studies have advanced the understanding of interfacial bond performance, research on crack width calculation for UHPC–NC interfaces remains limited. A comparison of existing UHPC design codes further shows that, although the Chinese code [24] introduces a modification factor to account for the influence of steel fibers, and both the French code [25] and European code [26] incorporate the post-cracking residual tensile strength of UHPC into their crack width formulas, none of these codes can directly reflect the effect of the UHPC–NC interface on crack width.
This study proposes a steel–concrete composite girder with integrated piers, incorporating UHPC in the hogging moment region. A flexural loading test was carried out on a full-scale segmental model to investigate the crack initiation and propagation. The residual tensile strength of UHPC was determined based on a simplified uniaxial tensile constitutive model. Subsequently, a reinforcement stress calculation method that accounts for the tensile contribution of UHPC at cracked sections was proposed, and the applicability of crack width calculation methods in current design codes was evaluated. For the UHPC–NC interface, a corresponding crack width formula was derived based on the comprehensive theory, providing a reference for the design of similar engineering.

2. Test Overview

2.1. Background Project

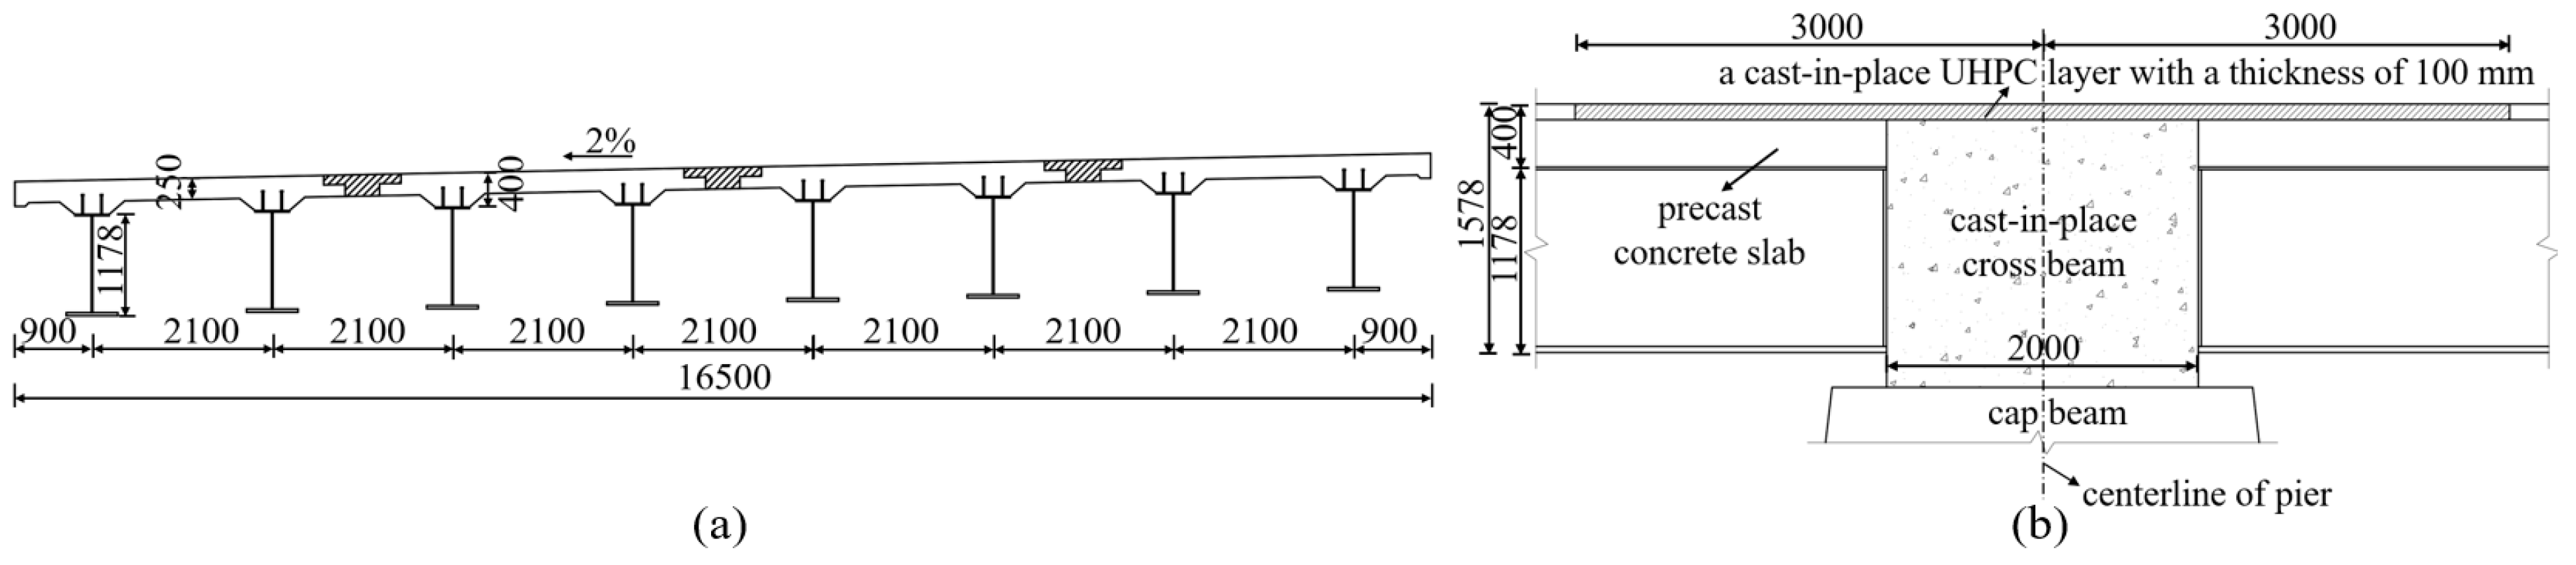
The background project is a 3 × 30 m composite girder bridge. The width of a single carriageway is 16.5 m, consisting of four π-shaped composite girders; the standard cross-section is shown in Figure 1a. A 6 m-long and 10 cm-thick UHPC layer is cast on the top surface of the pier, as shown in Figure 1b.
The construction procedure of the background project is as follows: the steel girders were fabricated in a steel factory and transported to the precast yard, where the concrete slab is cast to form π-shaped composite girders. The girders were then transported to the bridge site as an integral unit and erected using a launching gantry. After the main girders were positioned, the longitudinal wet joints between adjacent π-shaped composite girders in the transverse direction were casted first, followed by casting the concrete crossbeam at the intermediate support, and finally casting the UHPC layer on the top surface of the pier.

2.2. Specimen Design and Fabrication

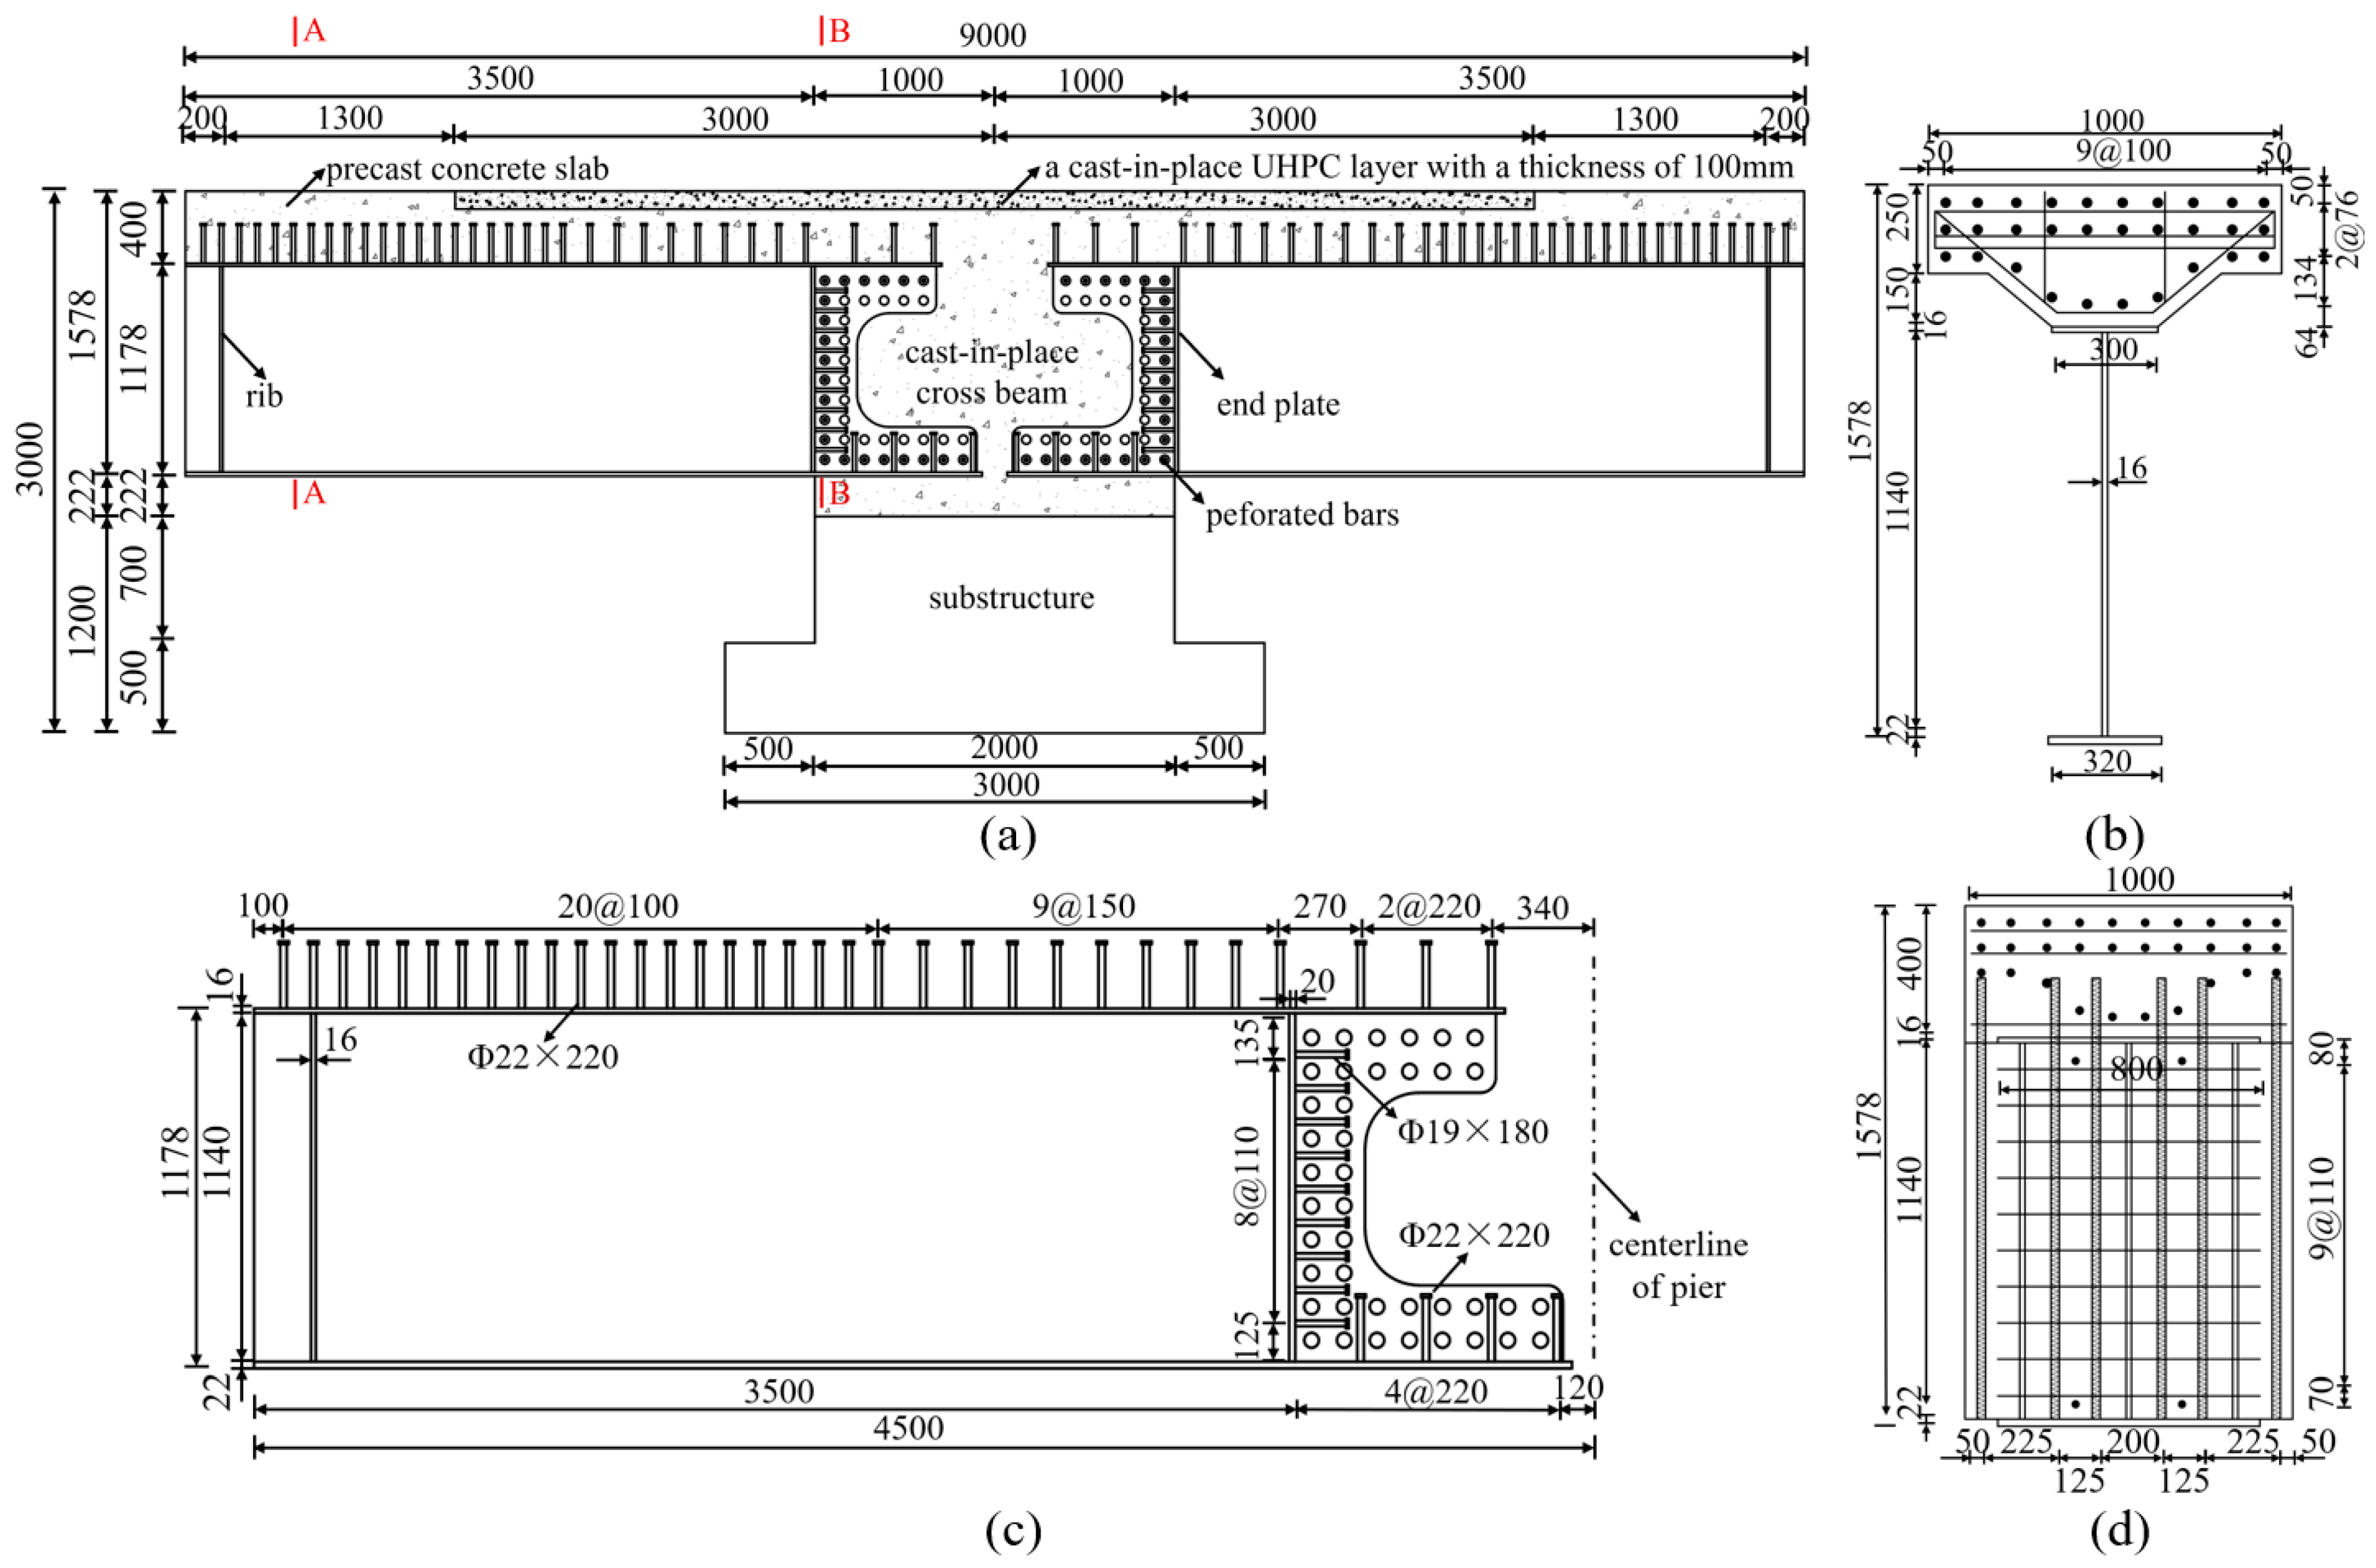
The length of the specimen was determined based on the ratio of bending moment to shear force under dead and lane loads. The total length was taken as 9 m. The specimen configuration is shown in Figure 2. The concrete slab thickness is 25 cm, thickened to 40 cm at the steel girder. A UHPC layer with a thickness of 100 mm and a length of 6 m is cast on the top surface of the pier.
Three layers of longitudinal reinforcement were arranged in the concrete slab. The top-layer bars are 20 mm in diameter, while the remaining longitudinal bars are 25 mm in diameter. The transverse reinforcement diameters in the precast slab and the cast-in-place UHPC layer are 16 mm and 20 mm, respectively. The stud connectors at the top and bottom flanges of the steel girder are 22 × 220 mm, and those welded to the end plate are 19 × 180 mm.
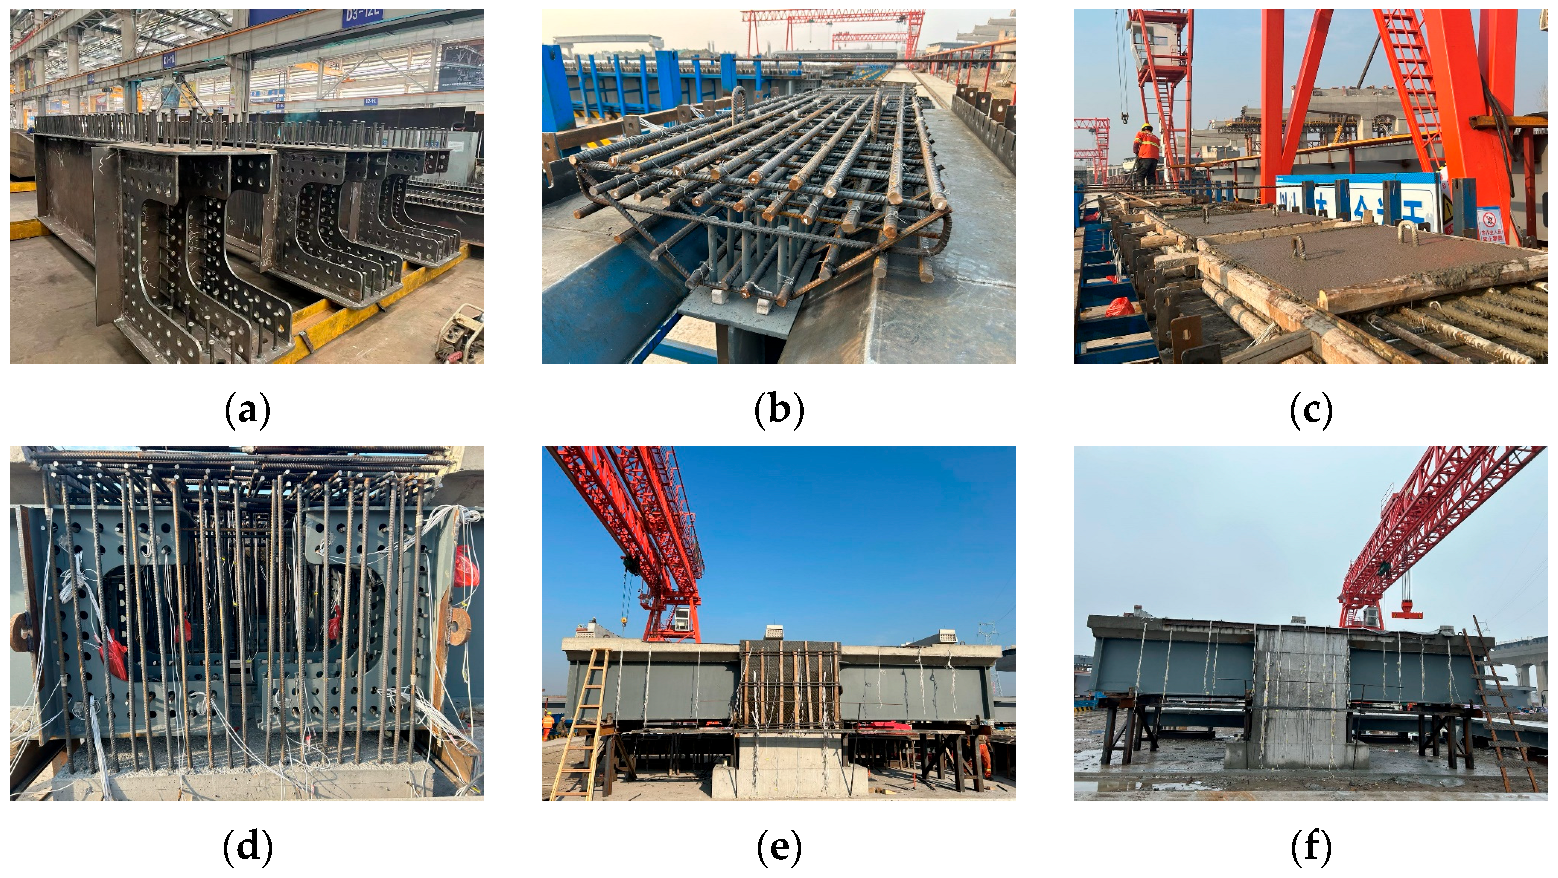
The fabrication procedure of the test specimen was consistent with the construction process of the prototype bridge: (1) the steel girder was fabricated in the factory and transported to the construction site; (2) the concrete slab and the substructure of the composite girder were casted separately, and after the concrete reached the required strength, the composite girder and the substructure were assembled, followed by casting the pier-to-girder joint; (3) the top-layer reinforcement was tied, the UHPC topping layer was cast, and the specimen was then cured outdoors under natural conditions for 28 days after completion. The main fabrication steps are shown in Figure 3. In order to simulate the most unfavorable conditions of the actual bridge, no special treatment was applied to the UHPC–NC interface.

2.3. Loading and Measurement Scheme

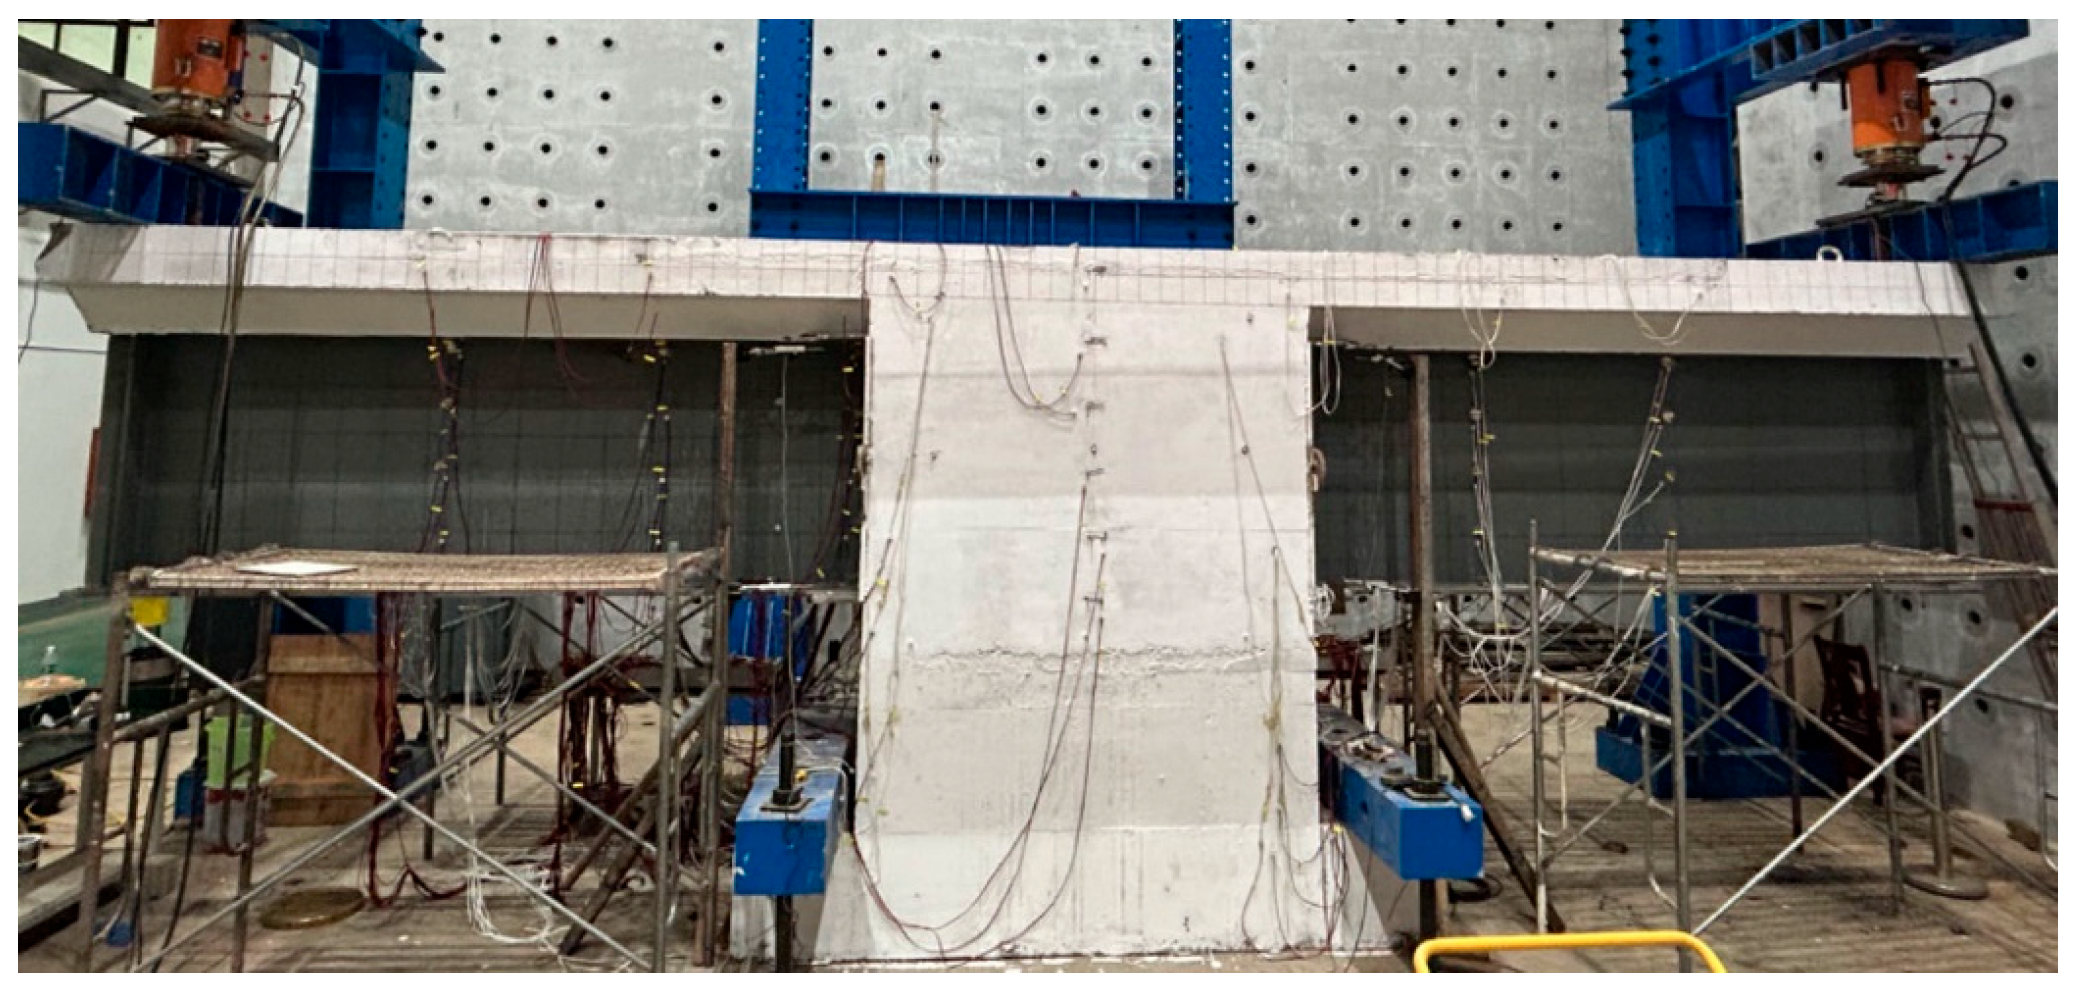
The loading setup of the specimen is shown in Figure 4. Two hydraulic jacks were arranged on both sides of the specimen to perform synchronous monotonic loading. The load was applied to the specimen through a distribution girder positioned between the hydraulic jacks and the specimen. Before the formal loading, a pre-load was carried out to ensure that the loading setup and measuring instruments were working normally and to compact the possible gaps between the components. During formal loading, the load was applied in 50 kN increments up to 60% of the cracking load; beyond 60% of the cracking load, the increment was reduced to 20 kN until concrete cracking occurred in the hogging moment region, after which loading continued in 50 kN increments until specimen failure. The failure criterion was defined as yielding of the reinforcement or the steel plate.
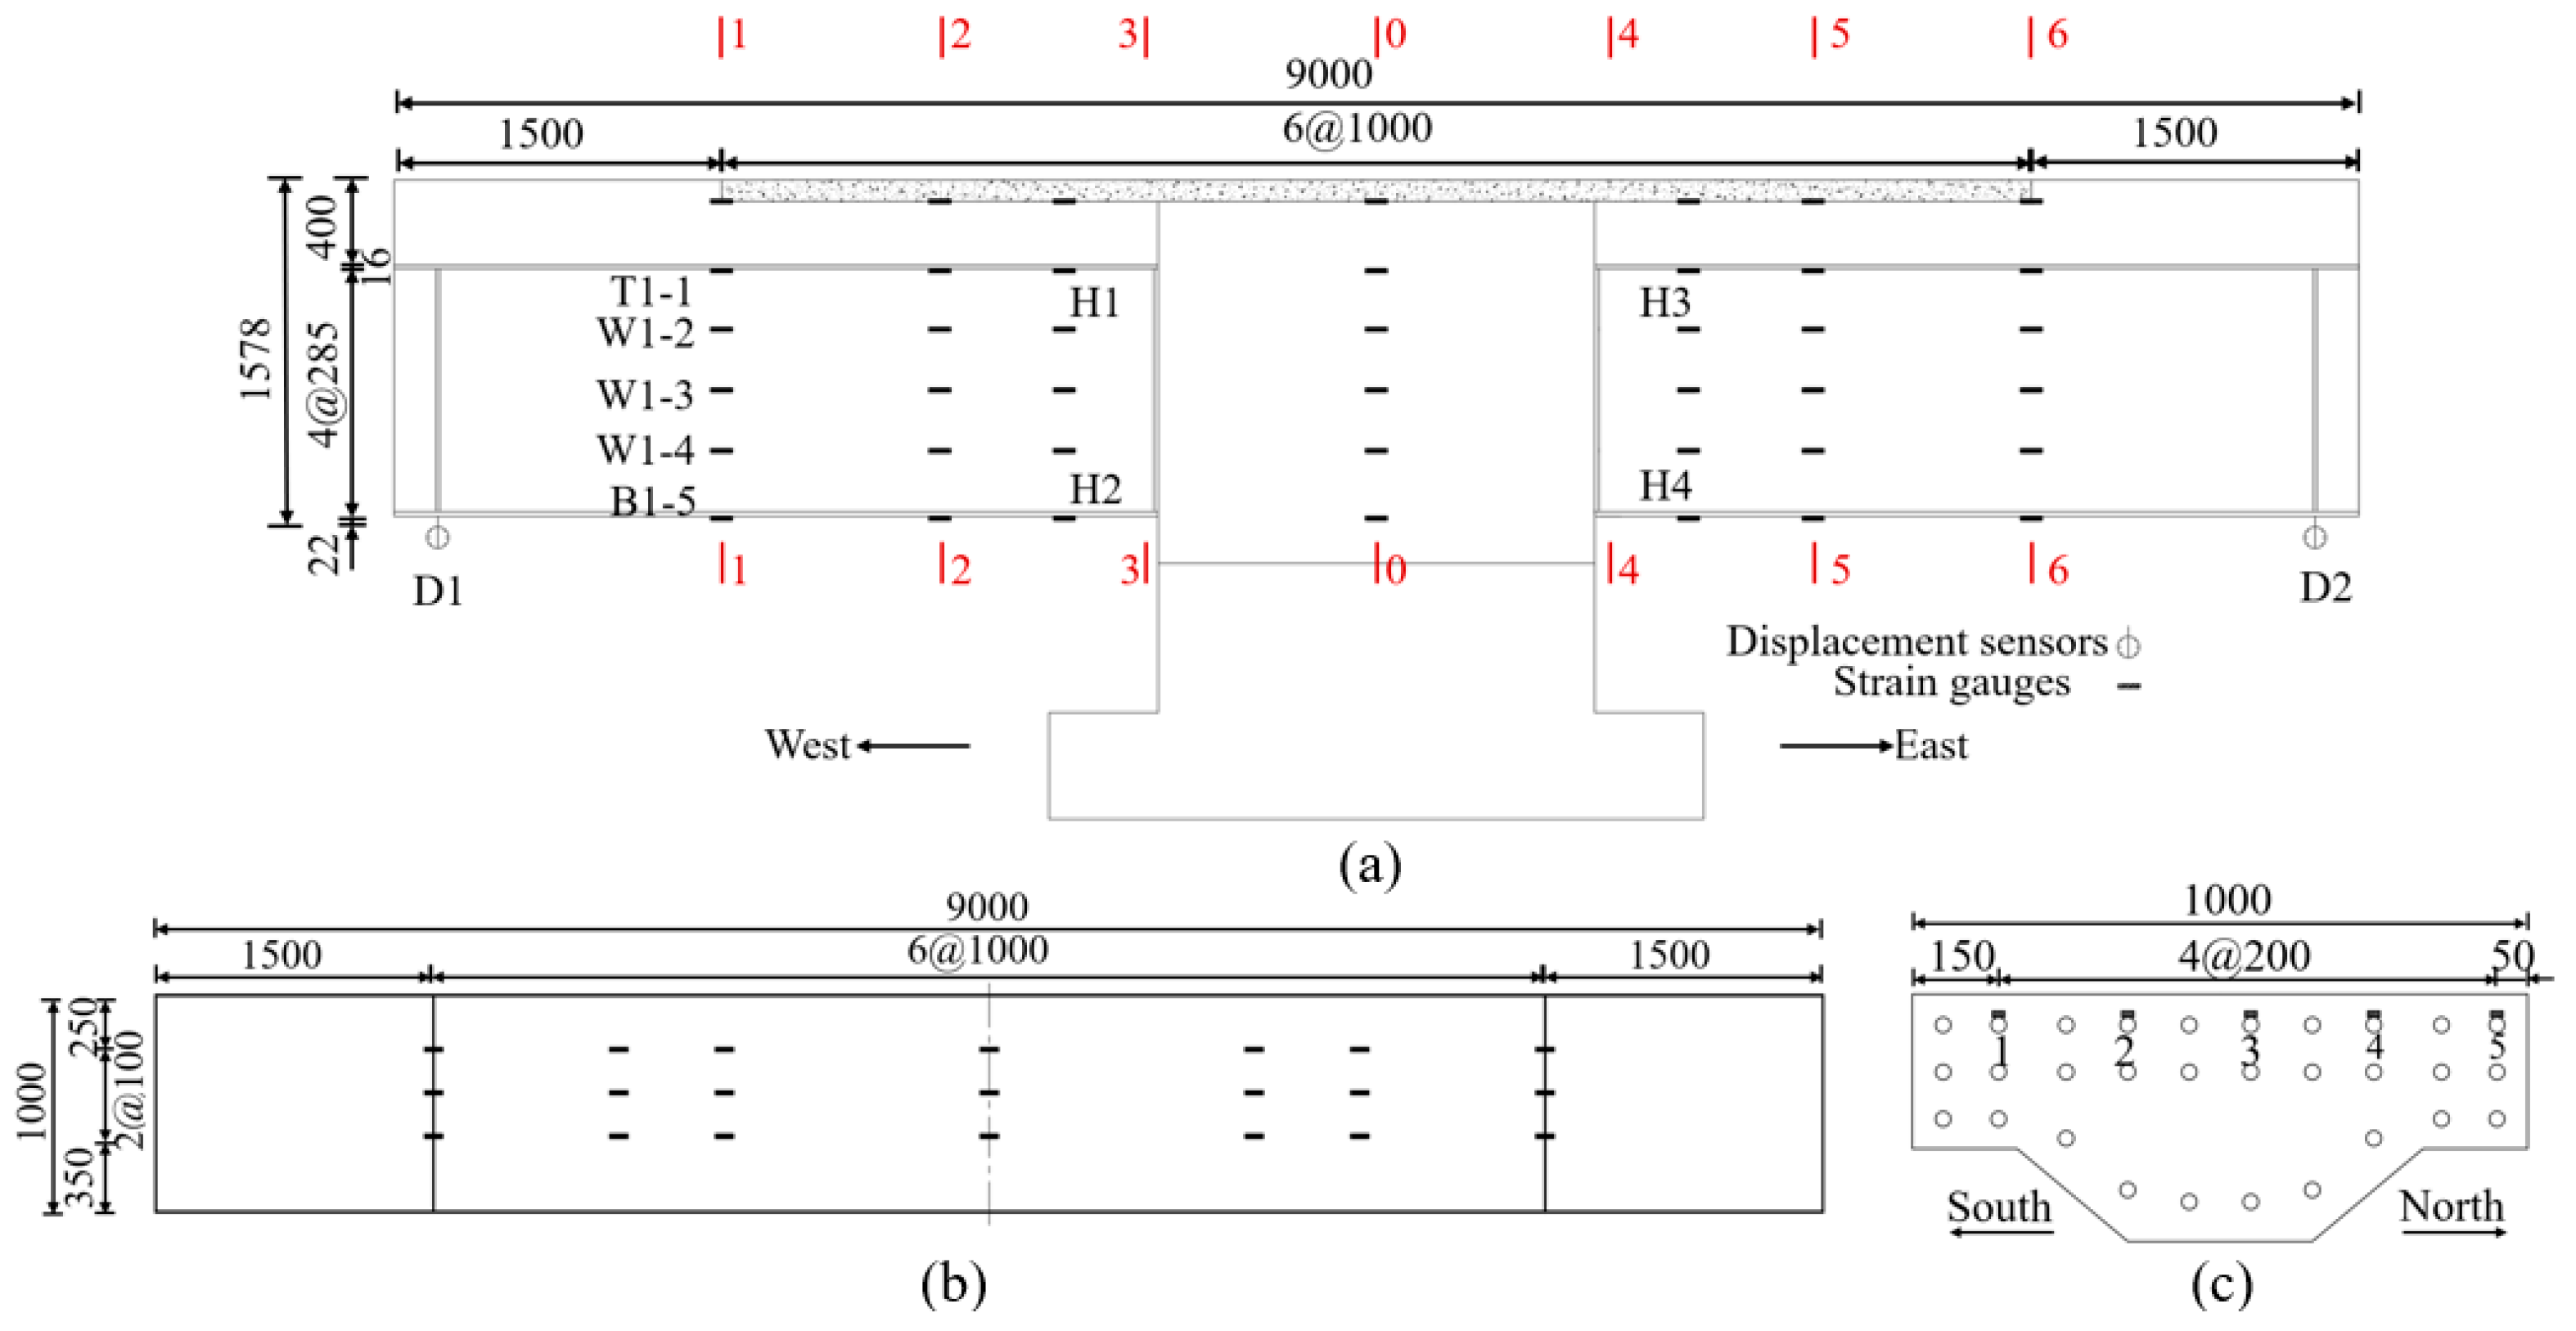
As shown in Figure 5, a total of 7 representative sections along the longitudinal direction were selected for strain monitoring. The displacement at the two loading points was measured. During testing, the development of crack width was recorded using a crack width gauge with an accuracy of 0.01 mm.

2.4. Material Property Tests

The Q355D steel type was used for the steel plates, and the reinforcing bars were HRB400. The manufacture was China Baowu Steel Group Corporation Limited. The mechanical properties of the steel plates and reinforcing bars are listed in Table 1.
All concrete material specimens were cured under the same conditions as the prototype bridge. Material tests were conducted after 28 days of outdoor natural curing. For the C50 concrete, 150 × 150 × 150 mm cubes and 150 × 150 × 300 mm prisms were used to measure the cube compressive strength and elastic modulus, respectively. For UHPC, 100 × 100 × 100 mm cubes, 100 × 100 × 300 mm prisms, and 50 × 100 mm dog-bone-shaped specimens [27] were used to measure the cube compressive strength, elastic modulus, and uniaxial tensile strength, respectively. The concrete material test properties are listed in Table 2.
Table 3 lists the material compositions of 1 m3 UHPC. The volume fraction of steel fibers in UHPC is 2.5%, with fiber dimensions of 13 mm in length and 0.2 mm in diameter.

3. Test Results and Discussion

3.1. Overall Failure Process

The structural behavior of the specimen during loading can be divided into two stages.
Stage I: Elastic stage. In this stage, the UHPC–NC slab remained intact with no visible cracking, and the structure behaved in a linear-elastic manner.
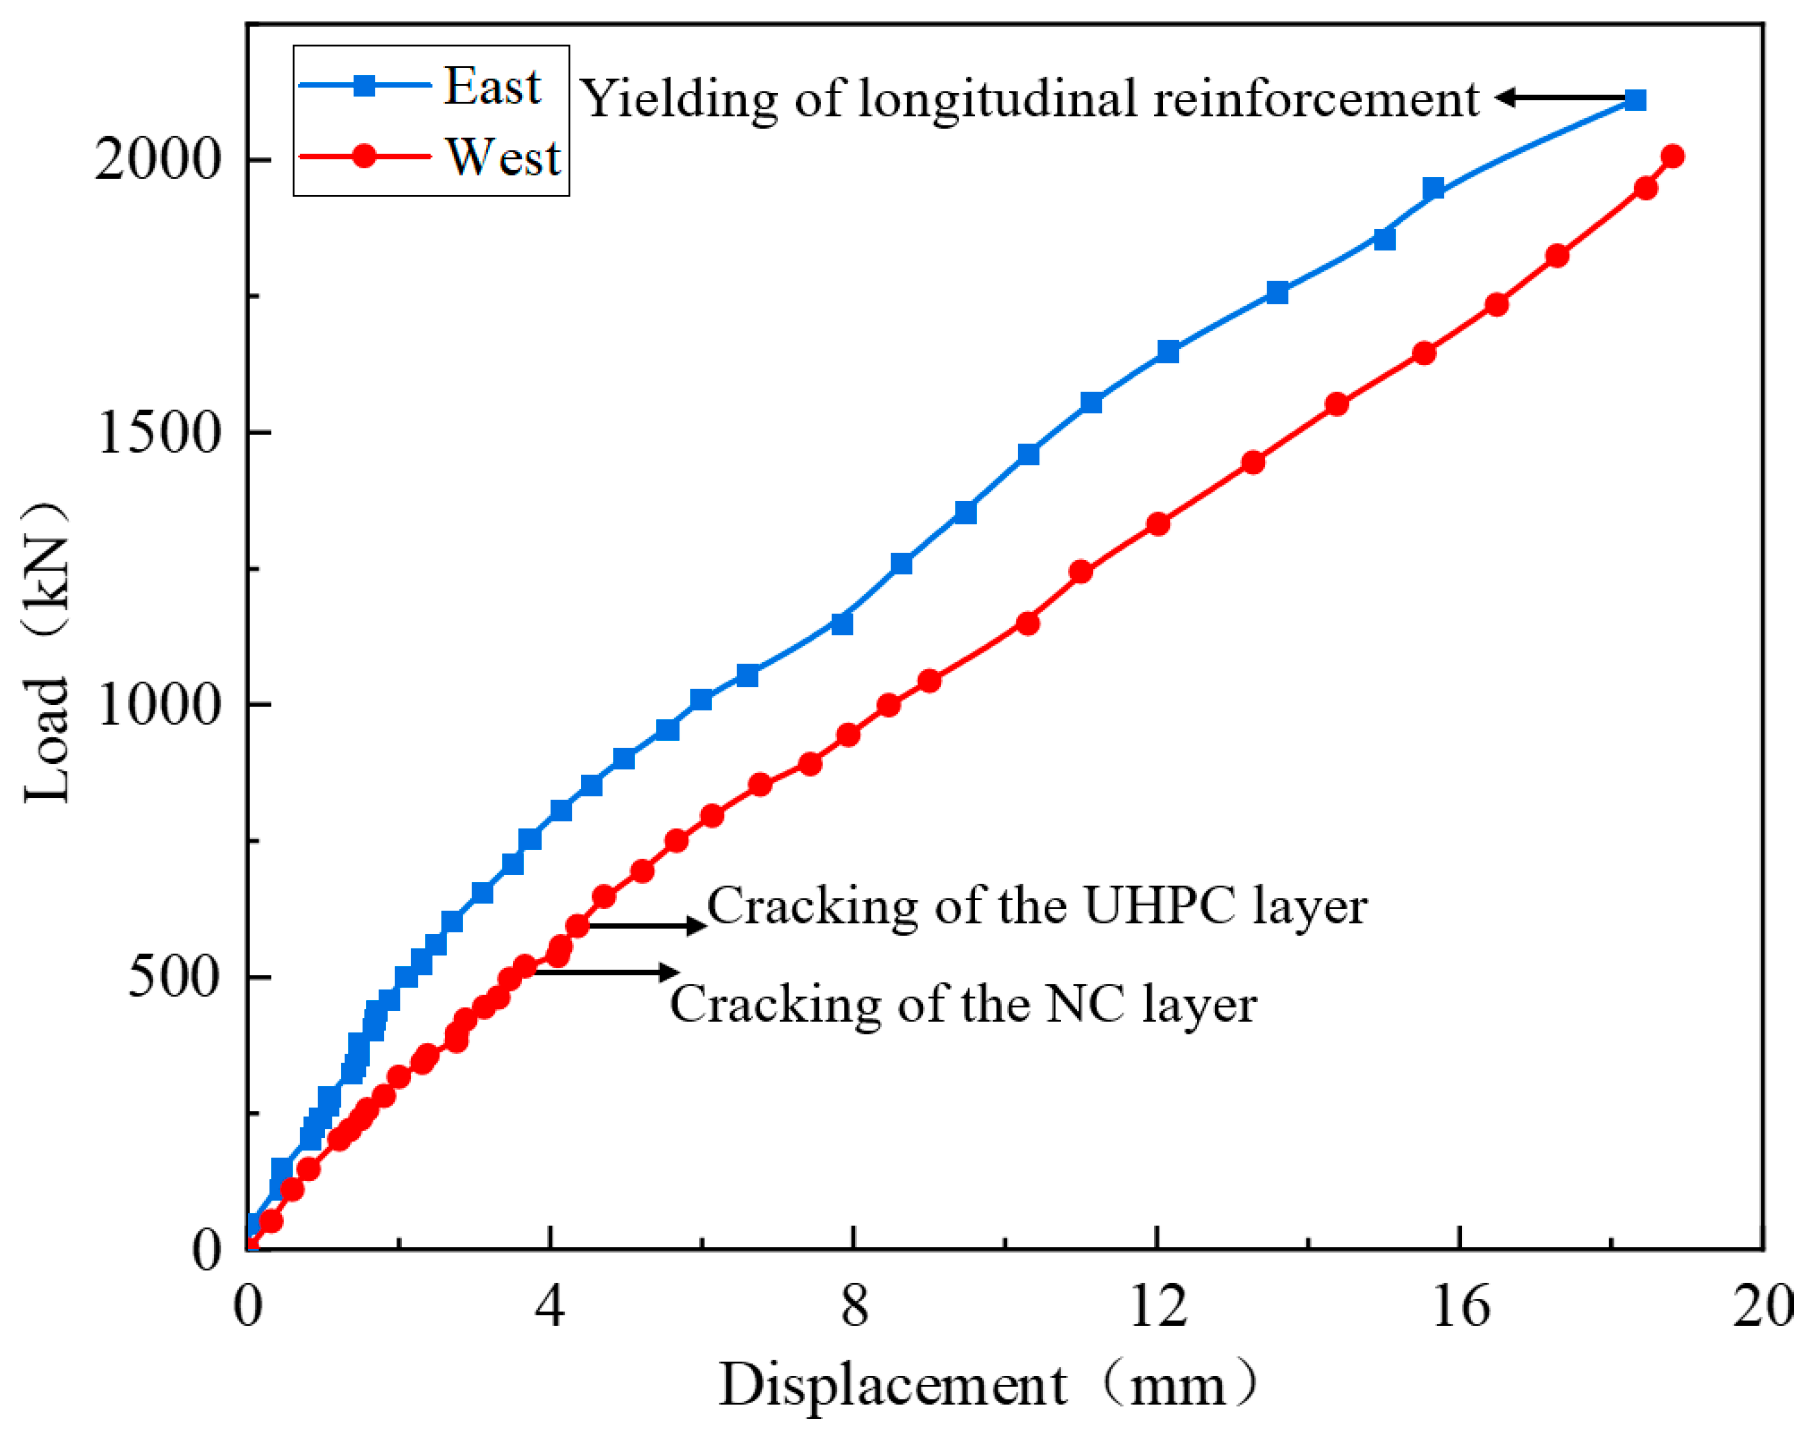
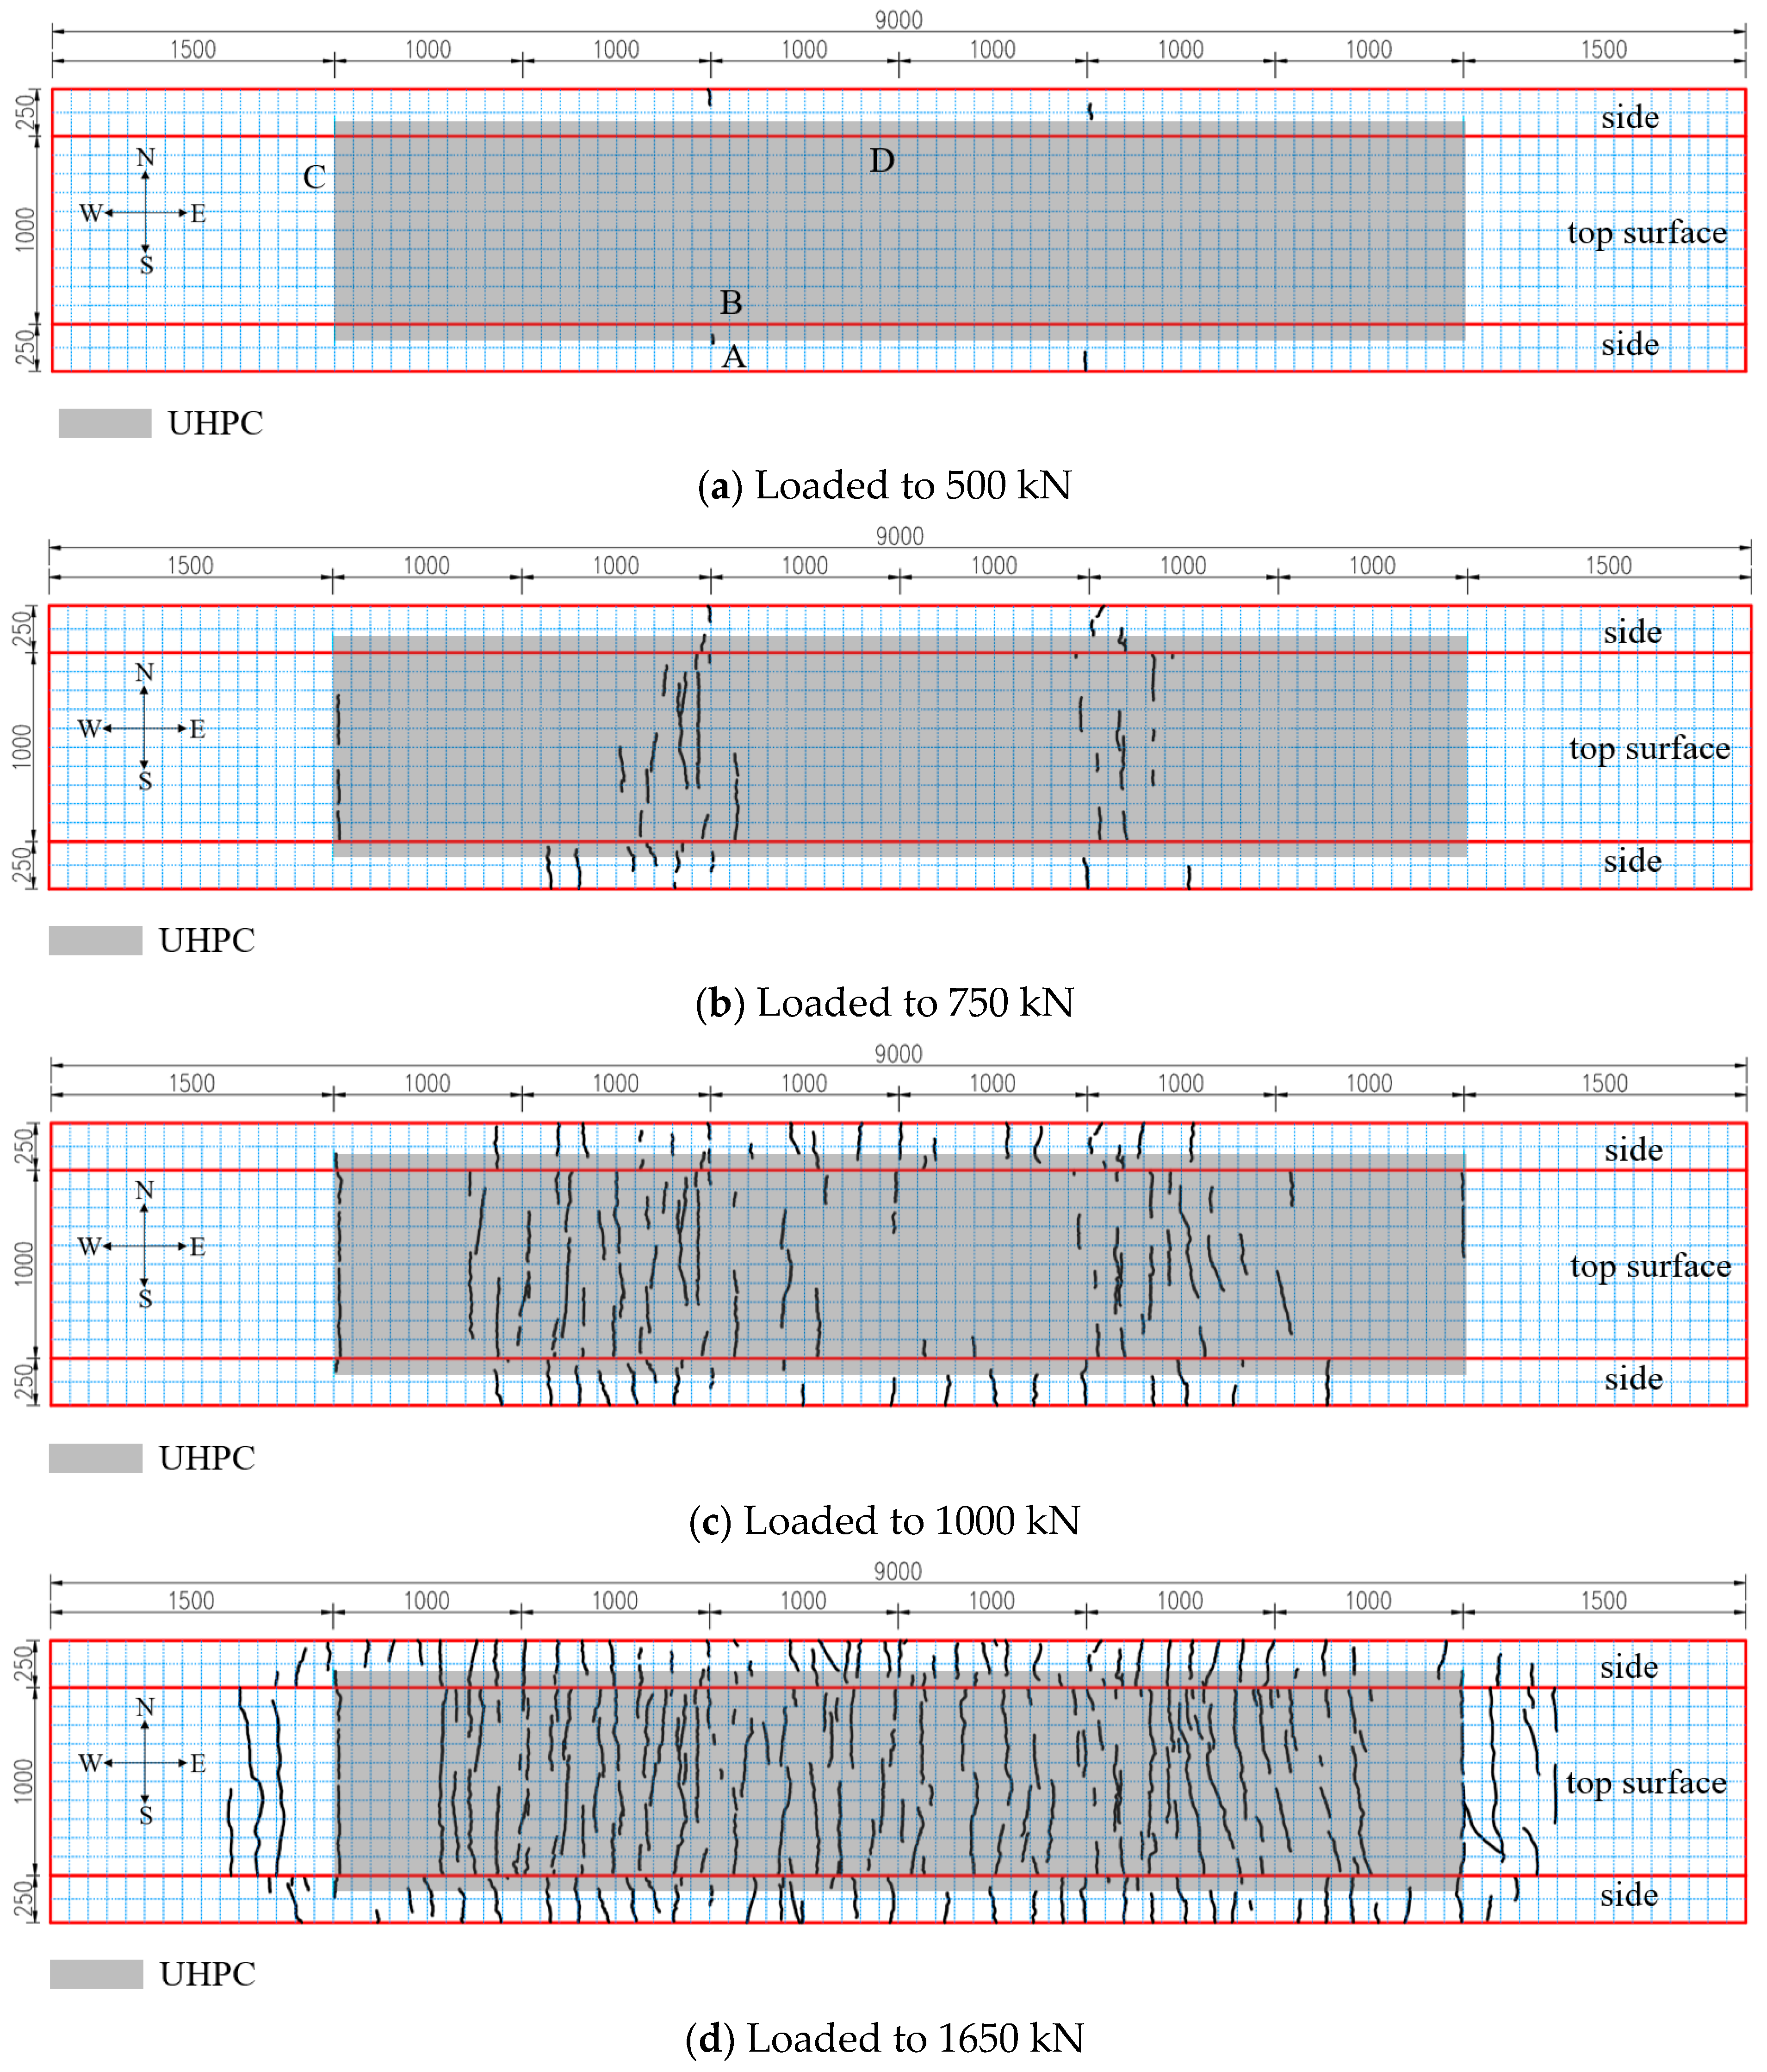
Stage II: Crack propagation stage. When the load reached 500 kN, cracks first appeared on the side surface of the NC layer at the cantilever root section, and then extended to the top surface of the UHPC layer along the thickness direction. When the load reached 750 kN, cracking occurred at the UHPC–NC interface. When the load reached 1050 kN, the maximum crack width on the top surface of the UHPC layer reached 0.2 mm. At this point, both the reinforcement and the steel girder remained elastic. When the load increased to 2058.7 kN, the top-layer longitudinal reinforcement at the cantilever root section just reached tensile yielding. The test was terminated at this load level, with a corresponding vertical displacement of approximately 18 mm.
During loading, no obvious slip or separation between the I-shaped steel girder and the concrete slab was observed.

3.2. Load–Displacement Curve

The load–displacement curves at both sides are shown in Figure 6. As can be seen, the specimen maintained good stiffness throughout the entire loading process. Before the load reached 500 kN, the load–displacement relationship exhibited a linear trend; when the load exceeded 500 kN, the response became nonlinear. This is mainly because the cracks appeared on the side surface of the NC layer beneath the UHPC overlay at approximately 500 kN. With further loading, cracks developed successively at the top surface of the UHPC layer and at the UHPC–NC interface. As the load increased, cracks in these regions continuously propagated, leading to a reduction in structural stiffness. In addition, the load–displacement curves at the two ends of the specimen did not completely coincide, probably due to manufacturing errors.

3.3. Strain Distribution

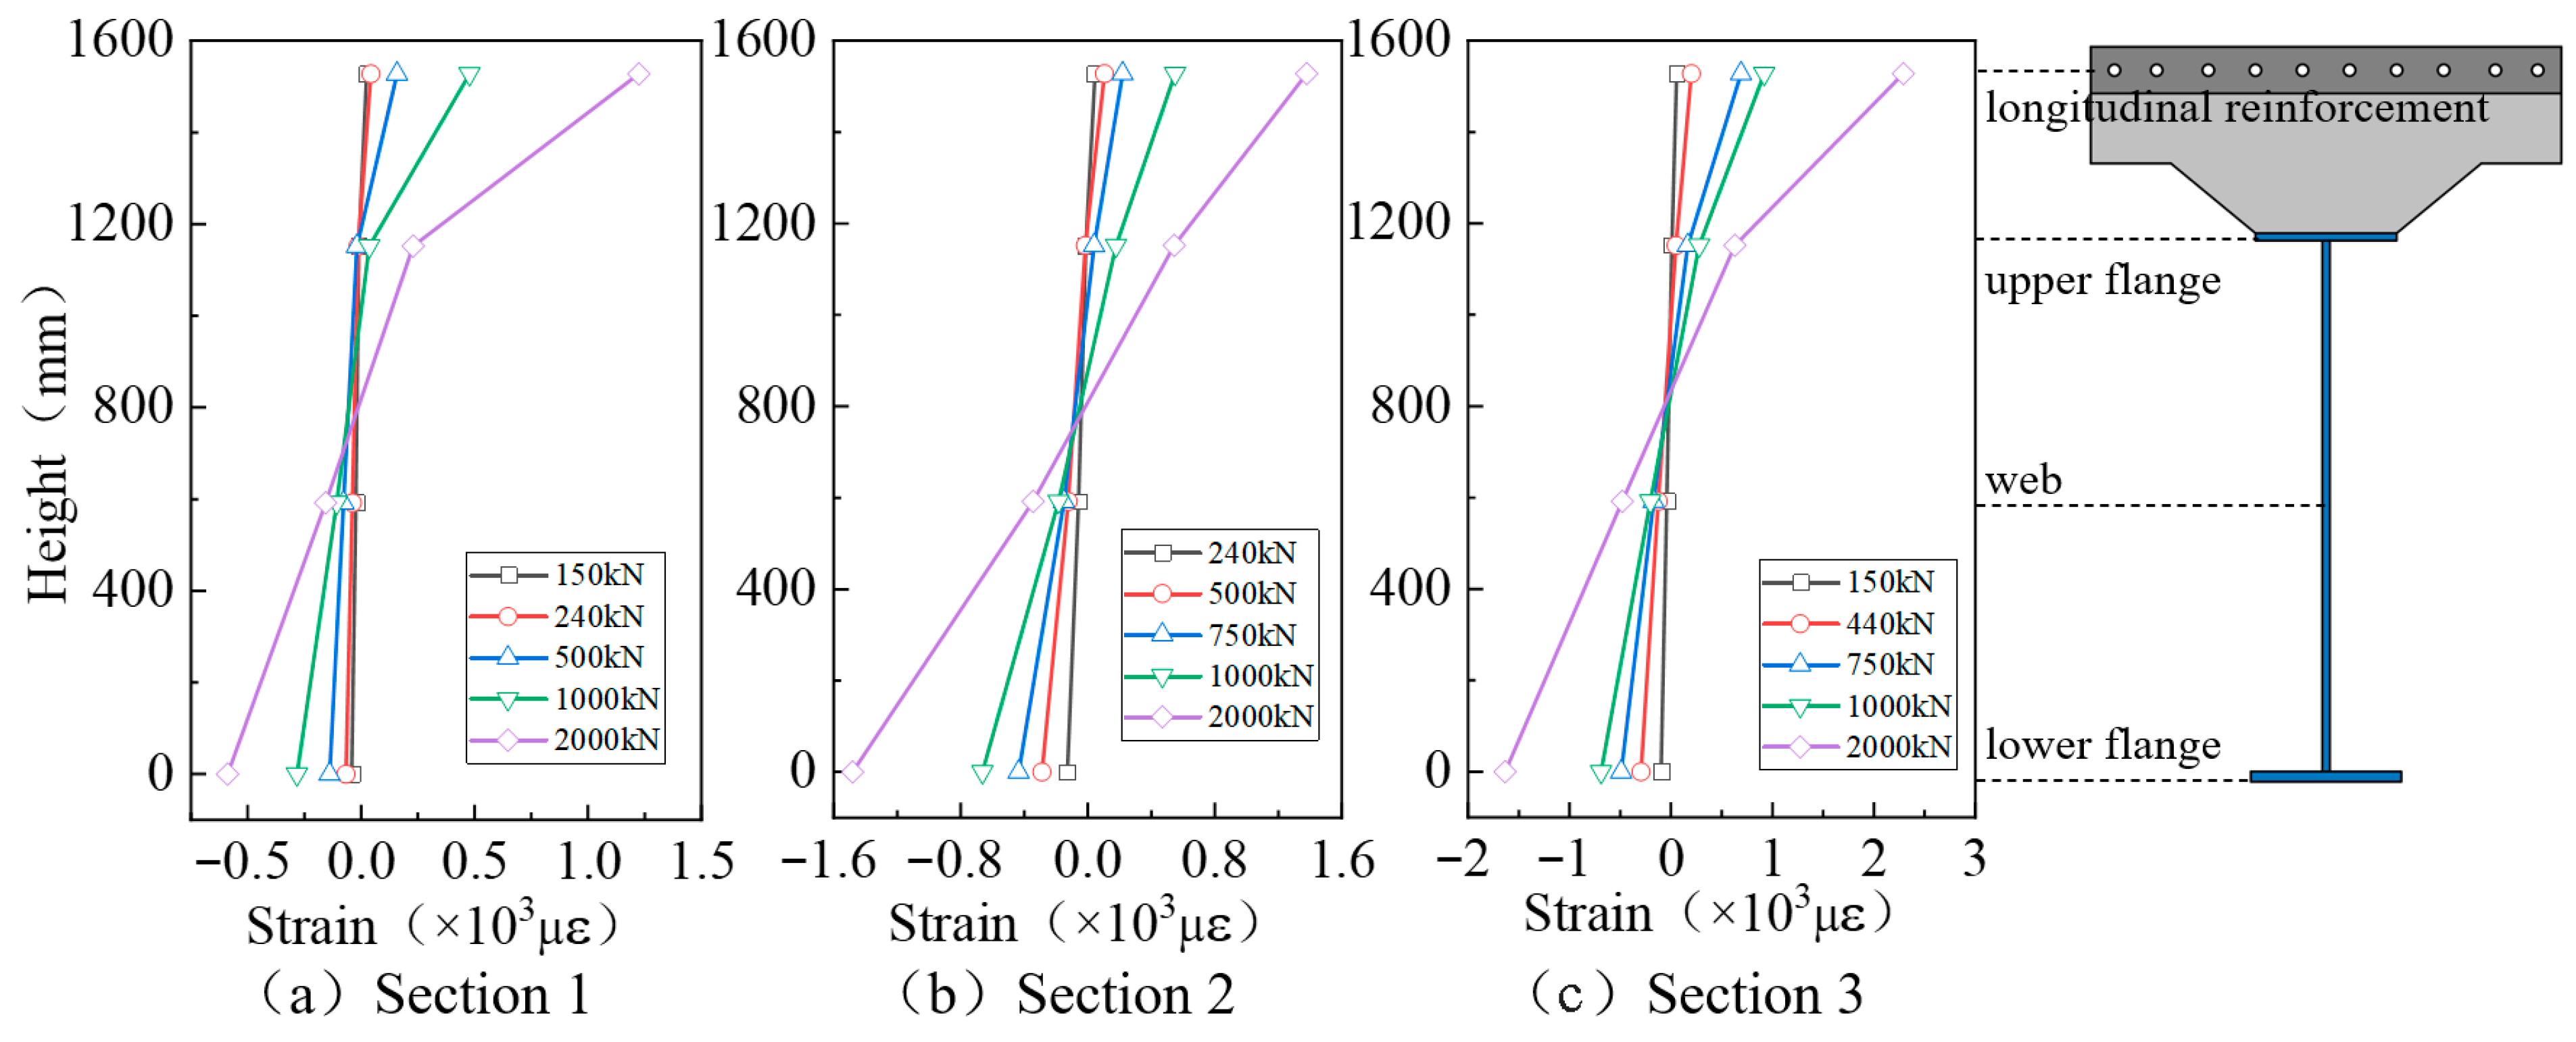
The strain distributions along the depth of the girder at different load levels for each section are shown in Figure 7, and the bottom plate of the steel girder was taken as a zero reference point. As shown, in the initial loading stage, the sectional strain distribution varied linearly with the section depth. With continued loading, the longitudinal reinforcement strain increased abruptly. This is mainly because the tensile stress is carried by both the reinforcement and the concrete before cracking; once cracks occurred, either in the UHPC layer or in the NC layer, the concrete slab loses part of its tensile capacity, and the corresponding tensile stress is then transferred to the reinforcement.
Based on the load levels at which the reinforcement strain shows abrupt increases, the cracking loads of different sections can be approximately inferred. The cracking loads corresponding to Sections 1, 2, and 3 were 750 kN, 1050 kN, and 500 kN, respectively, which agree well with the cracking loads observed in the test. As the load further increased, the concrete slab became fully cracked and almost completely ceased to contribute, causing the neutral axis to shift downward. When the load reached approximately 2058.7 kN, the strain of the top-layer longitudinal reinforcement at the cantilever root section (Section 3) exceeded 2233 με, indicating that the reinforcement reached tensile yielding.

3.4. Crack Development in the Concrete Slab

At each specified loading stage, the crack widths were measured under the certain maintained load. The widest crack in the critical section was selected visually, and three independent readings were taken at the location of maximum opening and averaged.
The crack development of the test girder is shown in Figure 8. Cracks first occurred on the surface of the NC layer at the cantilever root sections (Sections 3 and 4). The corresponding cracking load was 500 kN, and the initial crack width was 0.03 mm. Immediately thereafter, the side crack at the cantilever root propagated along the thickness direction into the UHPC layer. When the load reached 600 kN, the maximum crack width on the UHPC top surface at the cantilever root reached 0.05 mm.
With further loading, cracks appeared earlier outside the pier-to-girder joint than within the joint. When the load reached 750 kN, cracks formed at the UHPC–NC interface. When the load reached 1050 kN, the maximum crack width on the top surface of the UHPC layer reached 0.2 mm. In the later loading stage, frequent sounds associated with pulling of steel fiber were heard in the UHPC layer, and cracks within pier-to-girder joint developed more rapidly. For safety considerations, crack observation was stopped at 1650 kN; at this load level, the maximum crack width on the UHPC top surface was 0.4 mm. As shown in Figure 8d, UHPC cracks exhibited a “numerous and closely spaced” distribution, whereas NC cracks were “few and widely spaced.”
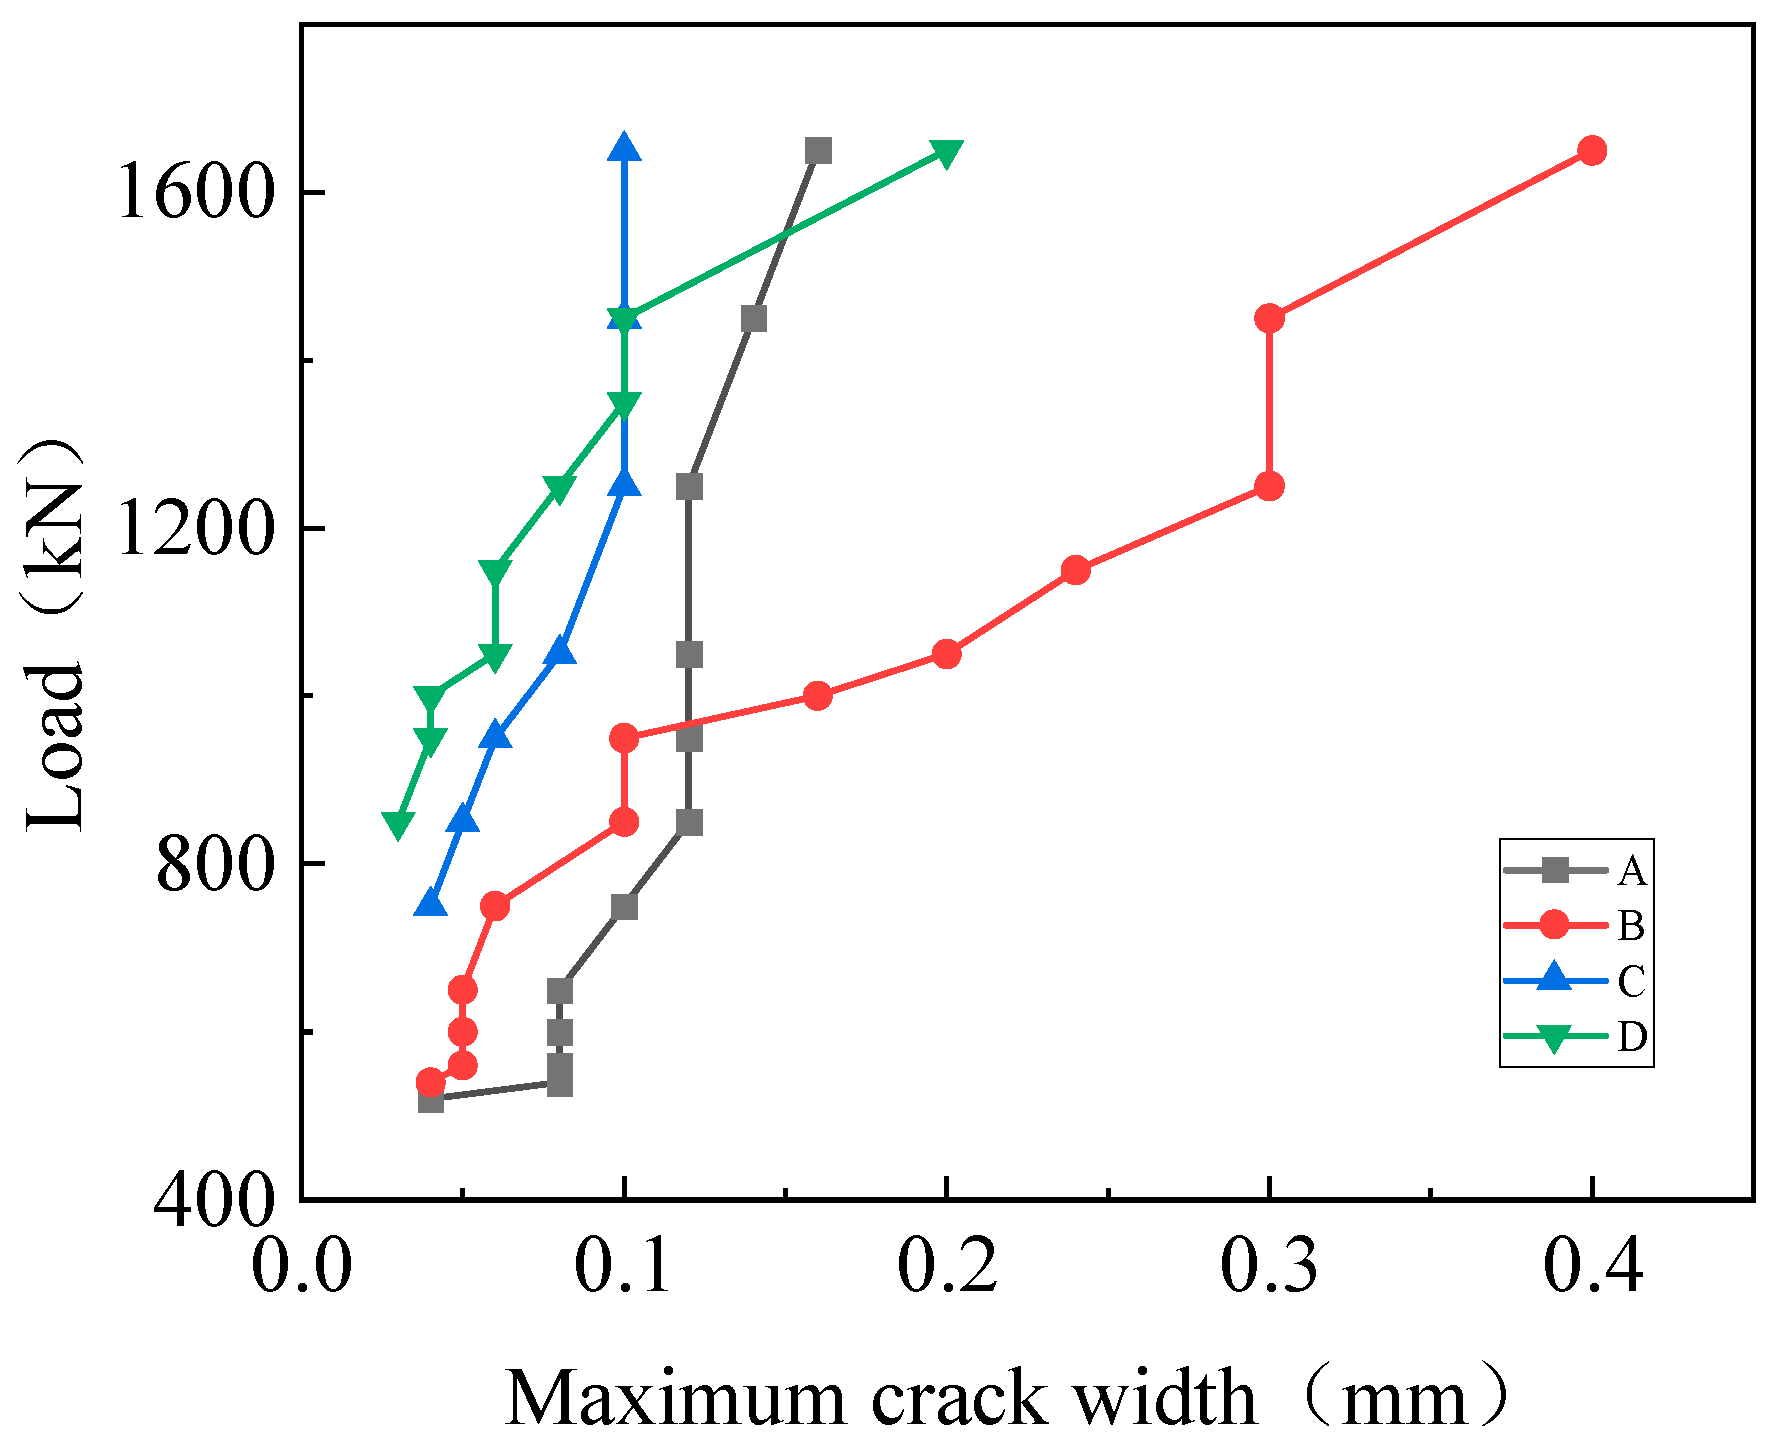
Figure 9 presents the load–maximum crack width for representative sections. The locations of points A–D are marked in Figure 8a. From the starting points of each curve, it can be observed that cracking occurred earliest on the side surface at the cantilever root section, followed by the top surface at the cantilever root section, then the UHPC–NC interface, and finally the mid-plane of the pier-to-girder joint.
Throughout the test, crack width growth on the side surface at the cantilever root and at the UHPC–NC interface was relatively slow; when the load reached 1650 kN, the maximum crack widths at these locations reached 0.16 mm and 0.10 mm, respectively. In the early loading stage, crack development on the top surface at the cantilever root and on the mid-plane of the pier-to-girder joint was also relatively slow; however, once the crack width reached 0.10 mm, crack growth at each section accelerated. At a load of 1650 kN, the maximum crack widths at these two locations reached 0.40 mm and 0.20 mm, respectively.

4. Evaluation and Analysis of Existing Crack Width Calculation Methods

4.1. Existing Crack Width Calculation Methods

Although the UHPC crack width formulas in current design codes domestically and internationally differ slightly, the parameters involved are essentially consistent.

4.1.1. Chinese Code

China’s Technical Specification for Highway Ultra-High Performance Concrete (D60-02-2023) introduces a fixed modification factor, based on the Specifications for Design of Highway Reinforced Concrete and Prestressed Concrete Bridges and Culverts (JTG 3362-2018) to account for the influence of steel fibers on crack width.
w max = C 1 C 2 C 3 σ sr E s ( c + d eq 0.3 + 1.4 ρ te ) ( 1 β w λ f )
In the equation, wmax is the maximum crack width; σsr is the reinforcement stress; Es is the elastic modulus of steel; c is the concrete cover thickness; deq is the equivalent diameter of longitudinal reinforcement; C1 is the shape coefficient of reinforcement (taken as 1); C2 is the long-term effect influence coefficient (taken as 1); and C3 is the force characteristic coefficient, taken as 1.2 for axial tension. βw is the steel fiber influence coefficient (0.4 for ultra-high performance reactive powder concrete); and λf is the characteristic coefficient of steel fiber content, defined as the product of the steel fiber volume fraction and its aspect ratio.

4.1.2. French Code

The French code provides a UHPC crack width expression based on the comprehensive theory and considers the influence of steel fiber orientation on crack width.
w max = s r , m ( ε sm ε cm )
ε sm ε cm = σ sr E s f ctfm K global E cm 1 E s k t ( f ctm , el f ctfm K ) ( 1 ρ te + E s E cm )
s r , m = 2.55 ( l 0 + l t )
l 0 = 1.33 c δ
l t = 2 0.3 k 2 ( 1 f ctfm K global   f ctm , el ) 1 δ η d eq ρ te l f 2
δ = 1 + 0.4 ( f ctfm K global   f ctm , el ) 1.5
In the equation, σr,m is the crack spacing; εsm and εcm are the mean strain difference in the reinforcement and the concrete, respectively, within the crack spacing; fctm,el and fctfm are the elastic-limit tensile strength of UHPC and the mean post-cracking residual tensile strength, respectively; ρte is the longitudinal reinforcement ratio calculated based on the effective tensile area; Ecm is the elastic modulus of UHPC; lf is the steel fiber length; K is the fiber orientation factor; Kglobal and Kglobal are the fiber orientation factors associated with the longitudinal and transverse directions, respectively; kt is the load characteristic factor (0.6 for short-term loading); k2 is the strain distribution factor at the cracked interface (1.0 for axially tension); and in the absence of prestress, η is taken as 2.25.

4.1.3. European Code

The European code also provides a crack width expression for SFRC based on the comprehensive theory and takes into account the effect of SFRC shrinkage strain.
w max = s r , m ( ε sm ε cm ε cs )
ε sm ε cm ε cs = σ sr β 1 σ sr E s η r ε sh 0.4 σ sr E s
σ sr = f ctm f Ftsm ρ te ( 1 + α E ρ te )
s r , m = 2 k c + 1 4 ( f ctm f Ftsm ) τ bm d eq ρ te
In the equation, fctm and fFtsm are the ultimate tensile strength of SFRC and the mean post-cracking residual tensile strength, respectively; αE is the elastic modulus of steel to that of SFRC; τbm is the mean bond stress between the reinforcement and SFRC; k is an empirical coefficient accounting for the influence of concrete cover thickness (taken as 1.0); b1 is an empirical coefficient reflecting load characteristics (taken as 0.6); and ηr is a coefficient accounting for shrinkage contribution, which is taken as 0 for short-term loading.

4.2. Reinforcement Stress Calculation

In existing crack width calculation formulas, reinforcement stress is a key parameter. For UHPC structures, the bridging effect of steel fibers enables the UHPC matrix to sustain a certain tensile stress after cracking, thereby effectively reducing reinforcement stress. Therefore, when calculating the reinforcement stress at cracked sections, the contribution of the post-cracking residual tensile strength of UHPC should be considered. Throughout the test, good composite action was maintained between the steel girder and the concrete slab, with no obvious slip or separation observed.
According to the following basic assumptions, the reinforcement stress at cracked sections can be calculated: (1) the cross-section of the composite girder satisfies the plane-section assumption; (2) the tensile strength of normal concrete is neglected; (3) the “bridging effect” of steel fibers after UHPC cracking is considered, i.e., the post-cracking residual tensile strength contribution of UHPC is included.
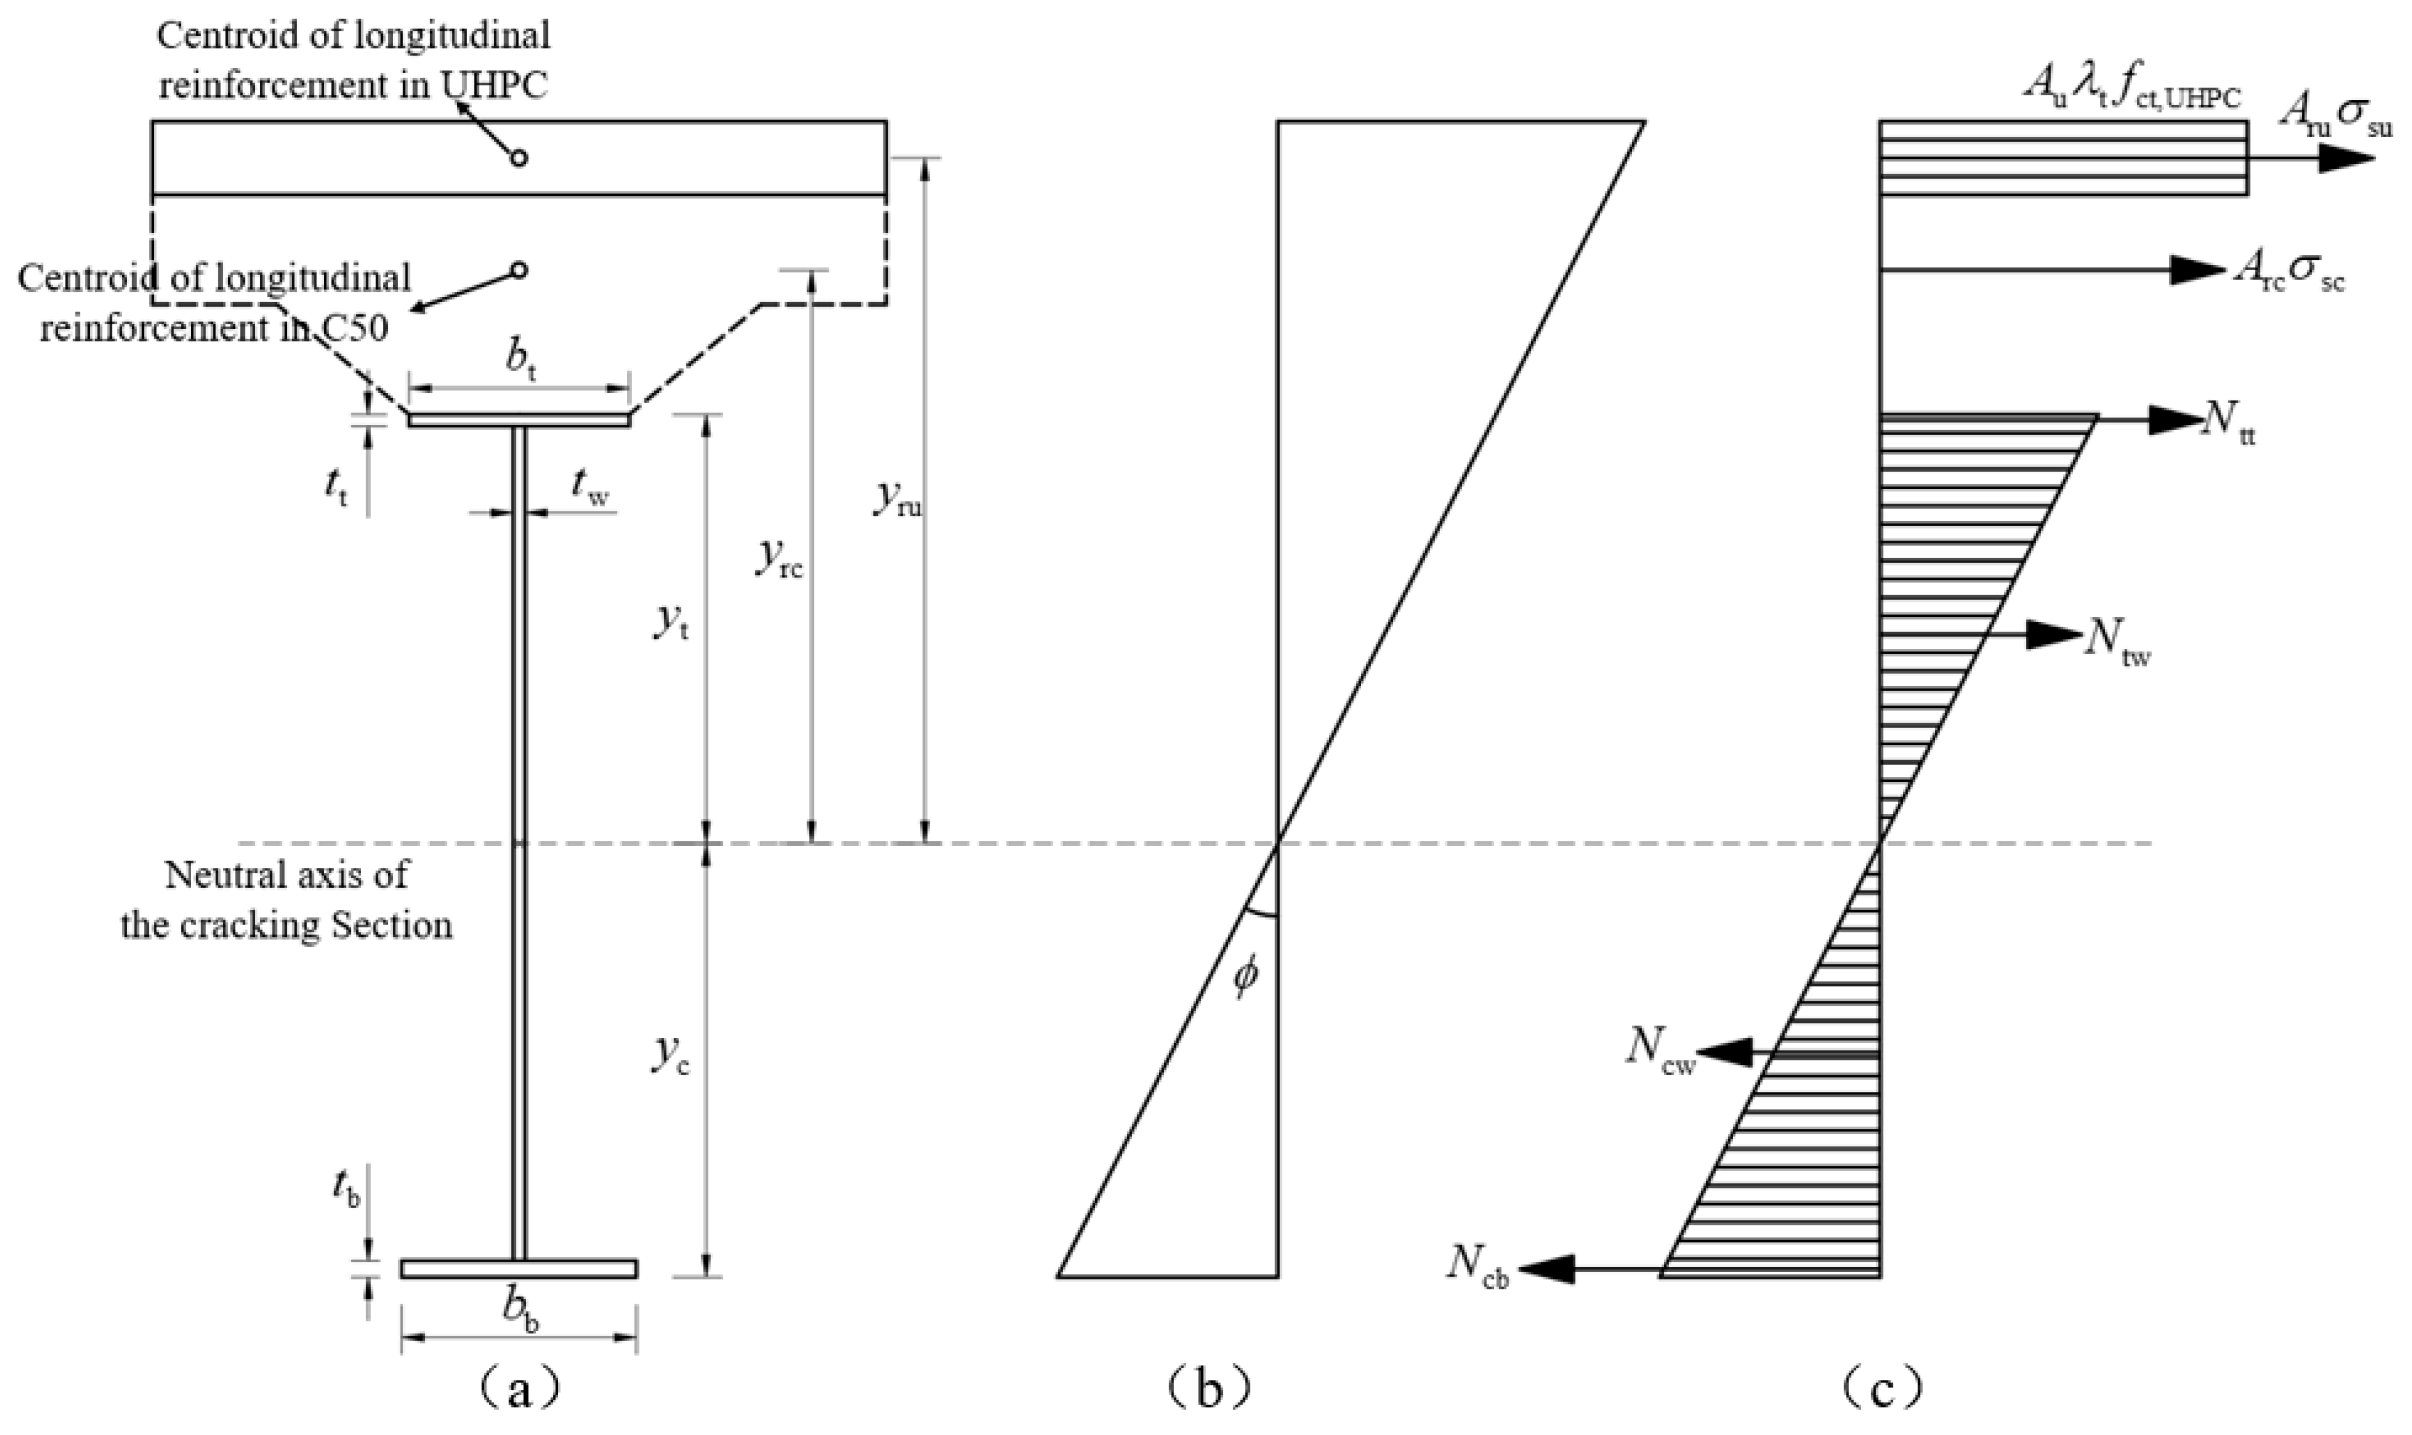
Therefore, the cracked section of a steel–UHPC–NC composite girder consists of UHPC, longitudinal reinforcement, and the steel girder. As shown in Figure 10, the moment–curvature relationship of the section can be obtained from the axial force equilibrium Equation (12) and the moment equilibrium Equation (13). Then, according to Equation (14), the reinforcement stress in the UHPC layer under different load levels can be determined.
Auλtfct,UHPC + Arussu + Arcssc + Ntt + Ntw = Ncw + Ncb
M = Mtt + Mtw + Mcw + Mcb + Auλtfct,UHPCyu + Aruσsuyru + Arcσscyrc
σsu = Esϕyru
where Au is the UHPC area; fct,UHPC is the ultimate tensile strength of UHPC; λt is the ratio of the post-cracking residual tensile strength of UHPC to its ultimate tensile strength; Aru is the area of longitudinal reinforcement in the UHPC layer; σsu is the stress of the longitudinal reinforcement in the UHPC layer; Arc is the area of longitudinal reinforcement in the normal concrete; σsc is the stress of the longitudinal reinforcement in the normal concrete; Ntt and Mtt are the tensile force and bending moment carried by the top plate of the steel girder, respectively; Ntw and Mtw are the tensile force and bending moment carried by the web in the tension zone of the steel girder, respectively; Ncb and Mcb are the compressive force and bending moment carried by the bottom plate of the steel girder, respectively; Ncw and Mcw are the compressive force and bending moment carried by the web in the compression zone of the steel girder, respectively; M is the sectional bending moment; f is the sectional curvature; Es is the elastic modulus of steel; yt is the distance from the neutral axis of the cracked section to the top surface of the steel girder; yc is the distance from the neutral axis of the cracked section to the bottom surface of the steel girder; yrc is the distance from the neutral axis of the cracked section to the centroid of longitudinal reinforcement in the normal concrete layer; yru is the distance from the neutral axis of the cracked section to the centroid of longitudinal reinforcement in the UHPC layer; and yu is the distance from the neutral axis of the cracked section to the centroid of the UHPC.
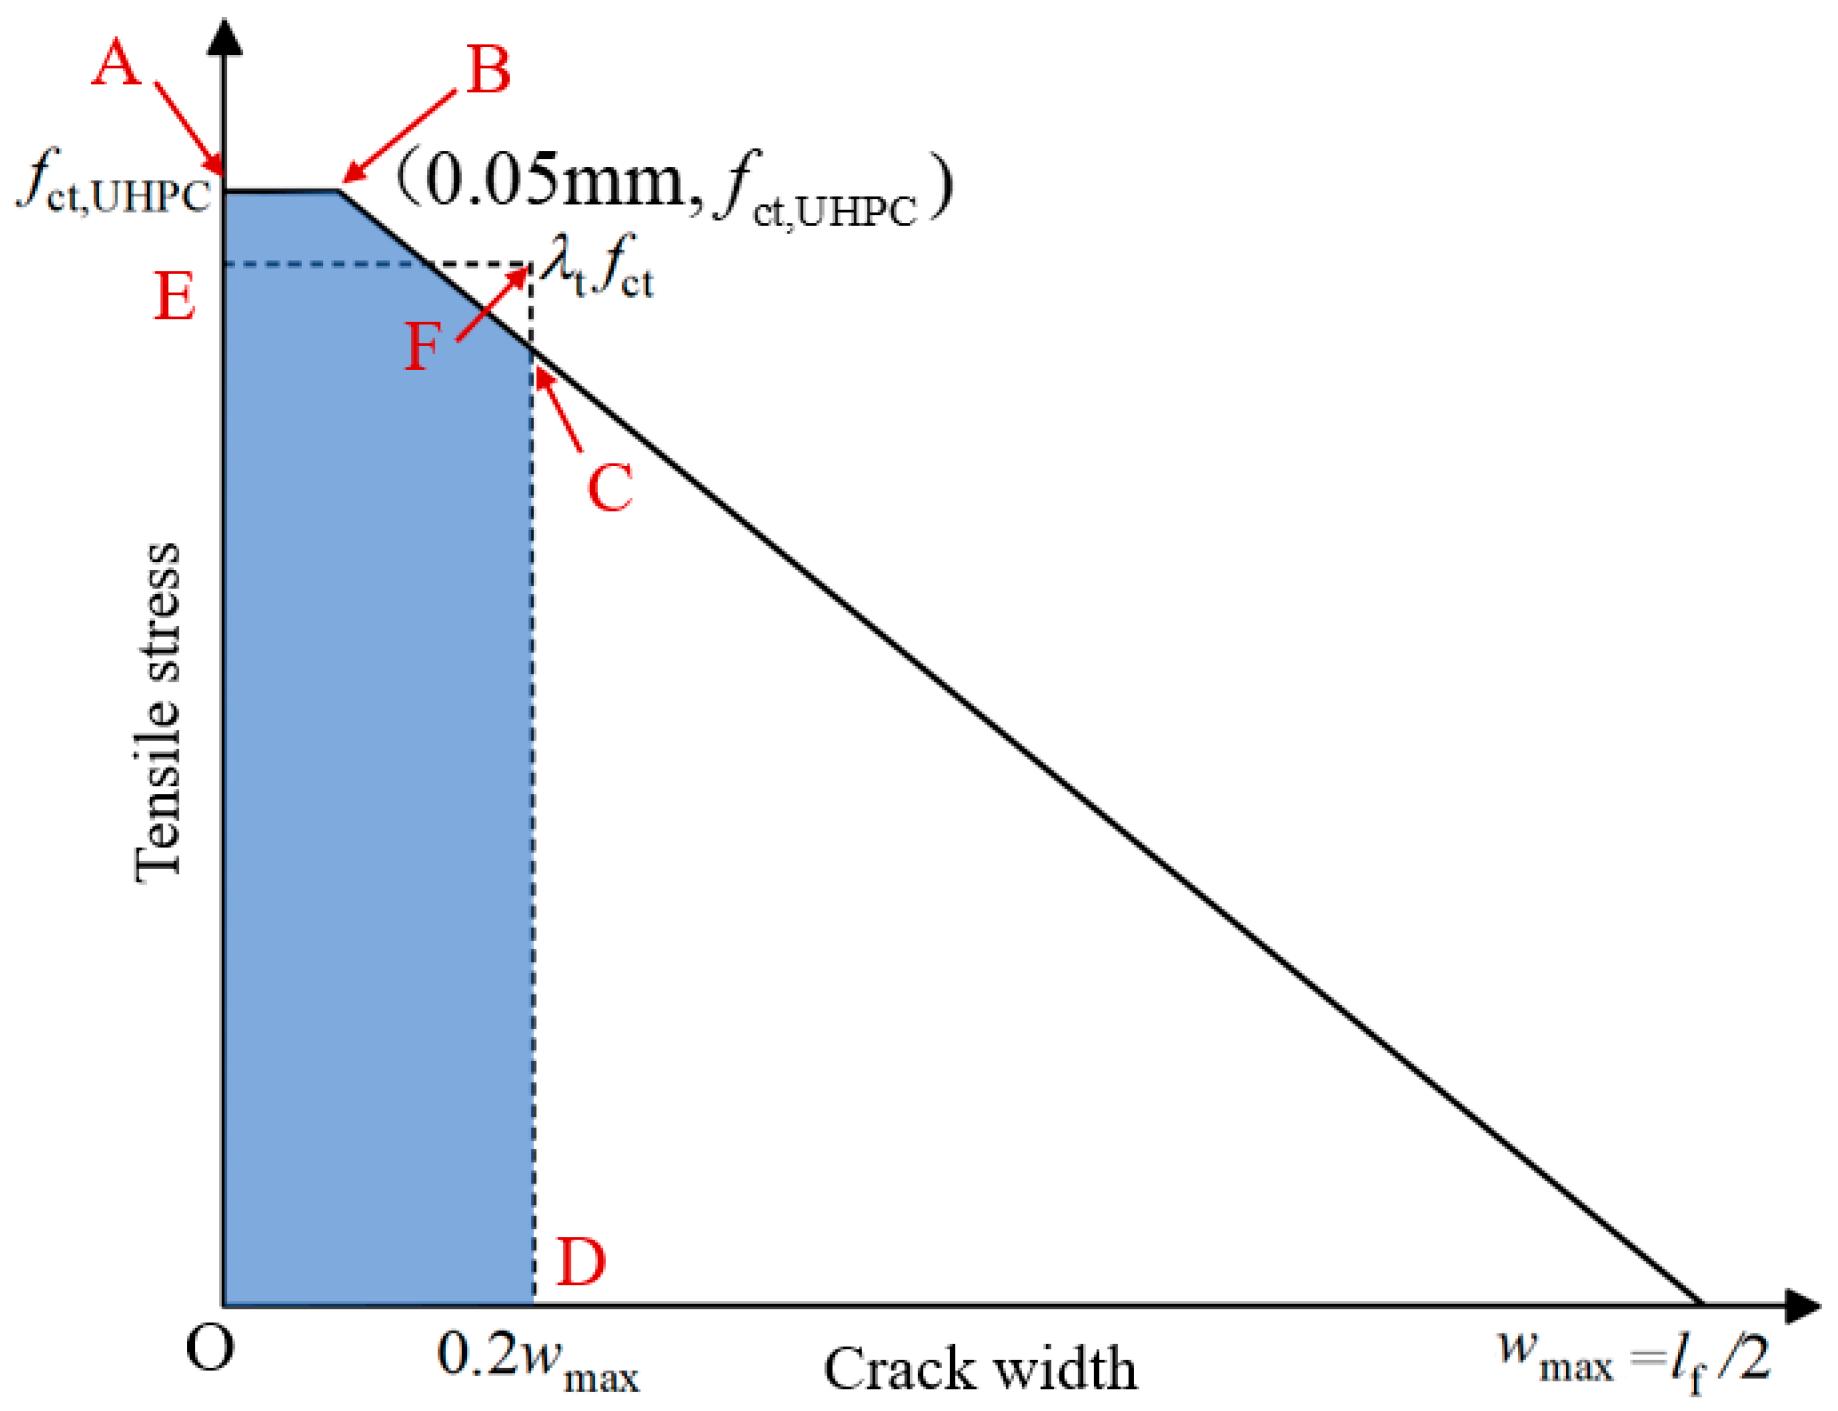
The constitutive model for the softening branch of UHPC adopted the bilinear tensile stress–crack width model recommended by JSCE [28], as shown in Figure 11. In this model, the maximum crack width wmax is assumed to be half of the steel fiber length lf (13 mm). During the softening stage, localized crack concentration occurs in UHPC, and the bridging effect of steel fibers prevents a sharp drop in tensile stress after cracking. The post-cracking residual tensile strength of UHPC was determined based on the energy equivalence principle, and is defined as the average stress within the range where the crack width is less than 0.2 wmax [29]. Based on this constitutive model, according to SOABCD = SOEFD, the ratio of the post-cracking residual tensile strength to the ultimate tensile strength of UHPC λt was calculated to be 0.96.
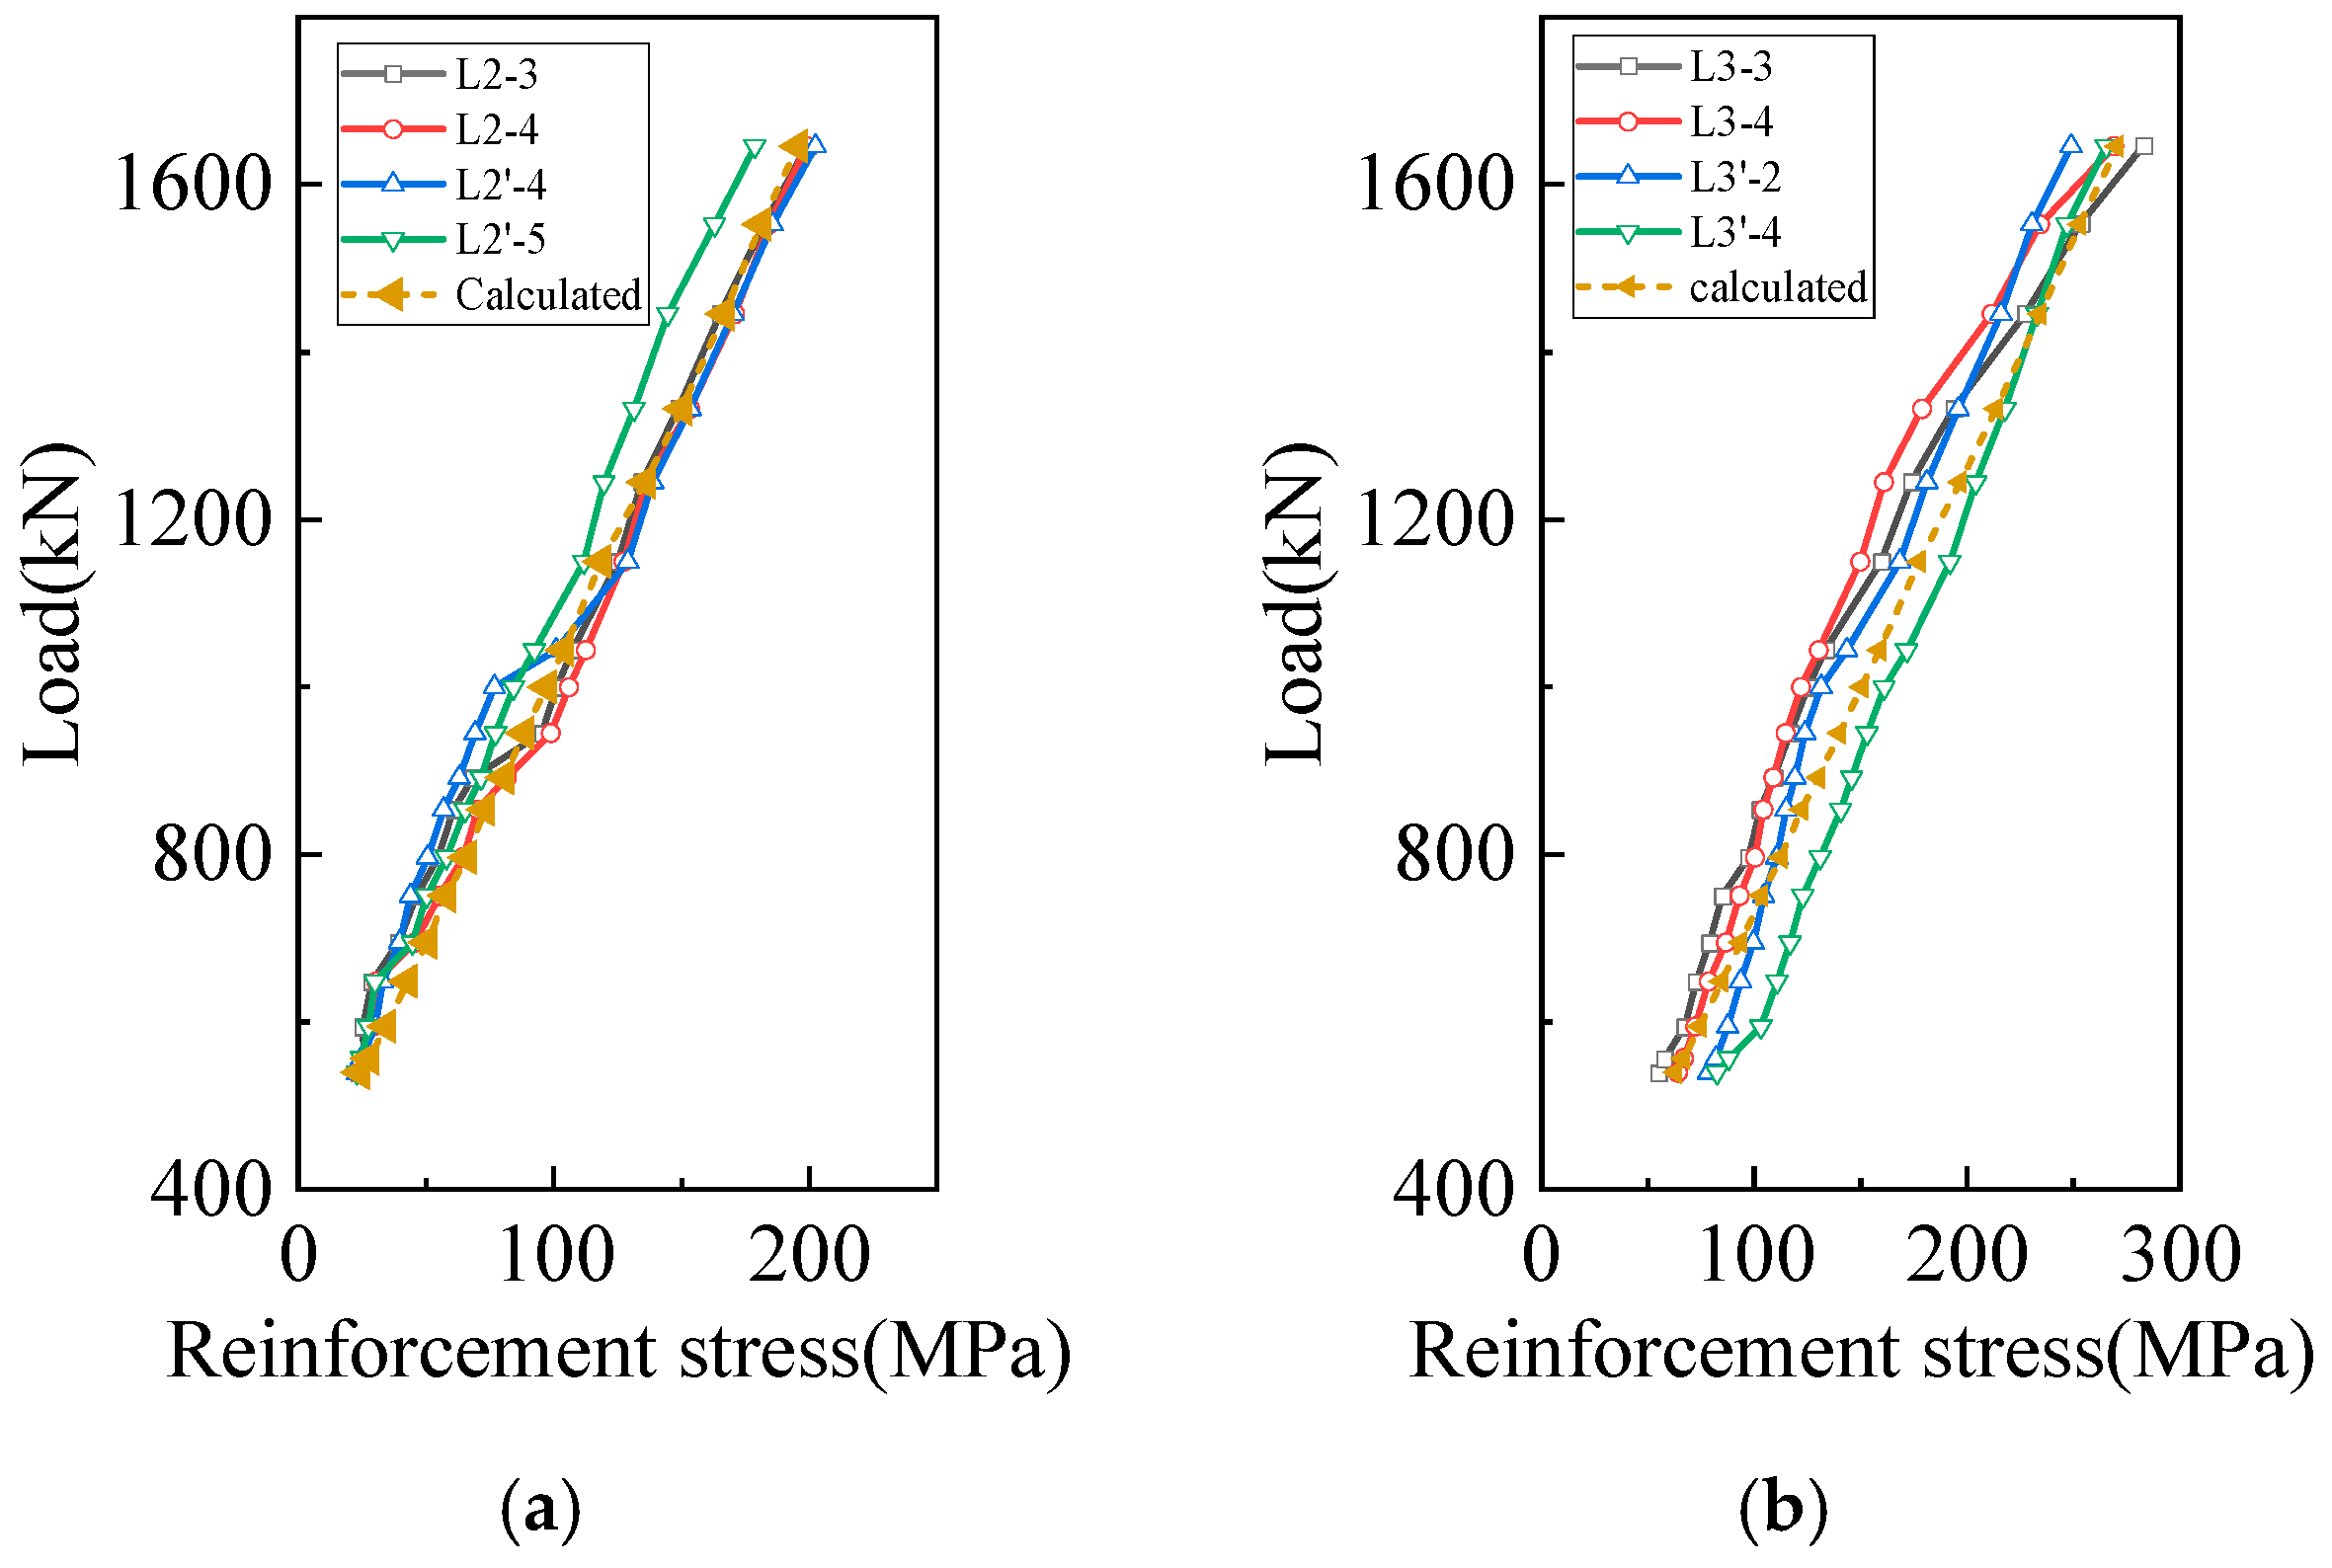
During the specimen fabrication, some strain gauges on the reinforcement were damaged; the calculated and remaining measured longitudinal reinforcement stresses at different sections were compared in Figure 12. Table 4 lists the mean value and coefficient of variation (COV) of the ratios of calculated to measured reinforcement stresses for different sections. As shown in the table, the average mean ratio and the average COV for Section 3 are 1.04 and 0.08, respectively, while those of Section 2 are 1.10 and 0.11, indicating good predictive accuracy, and the results can be further used for crack width calculation.

4.3. Comparison of Existing Crack Width Calculation Methods

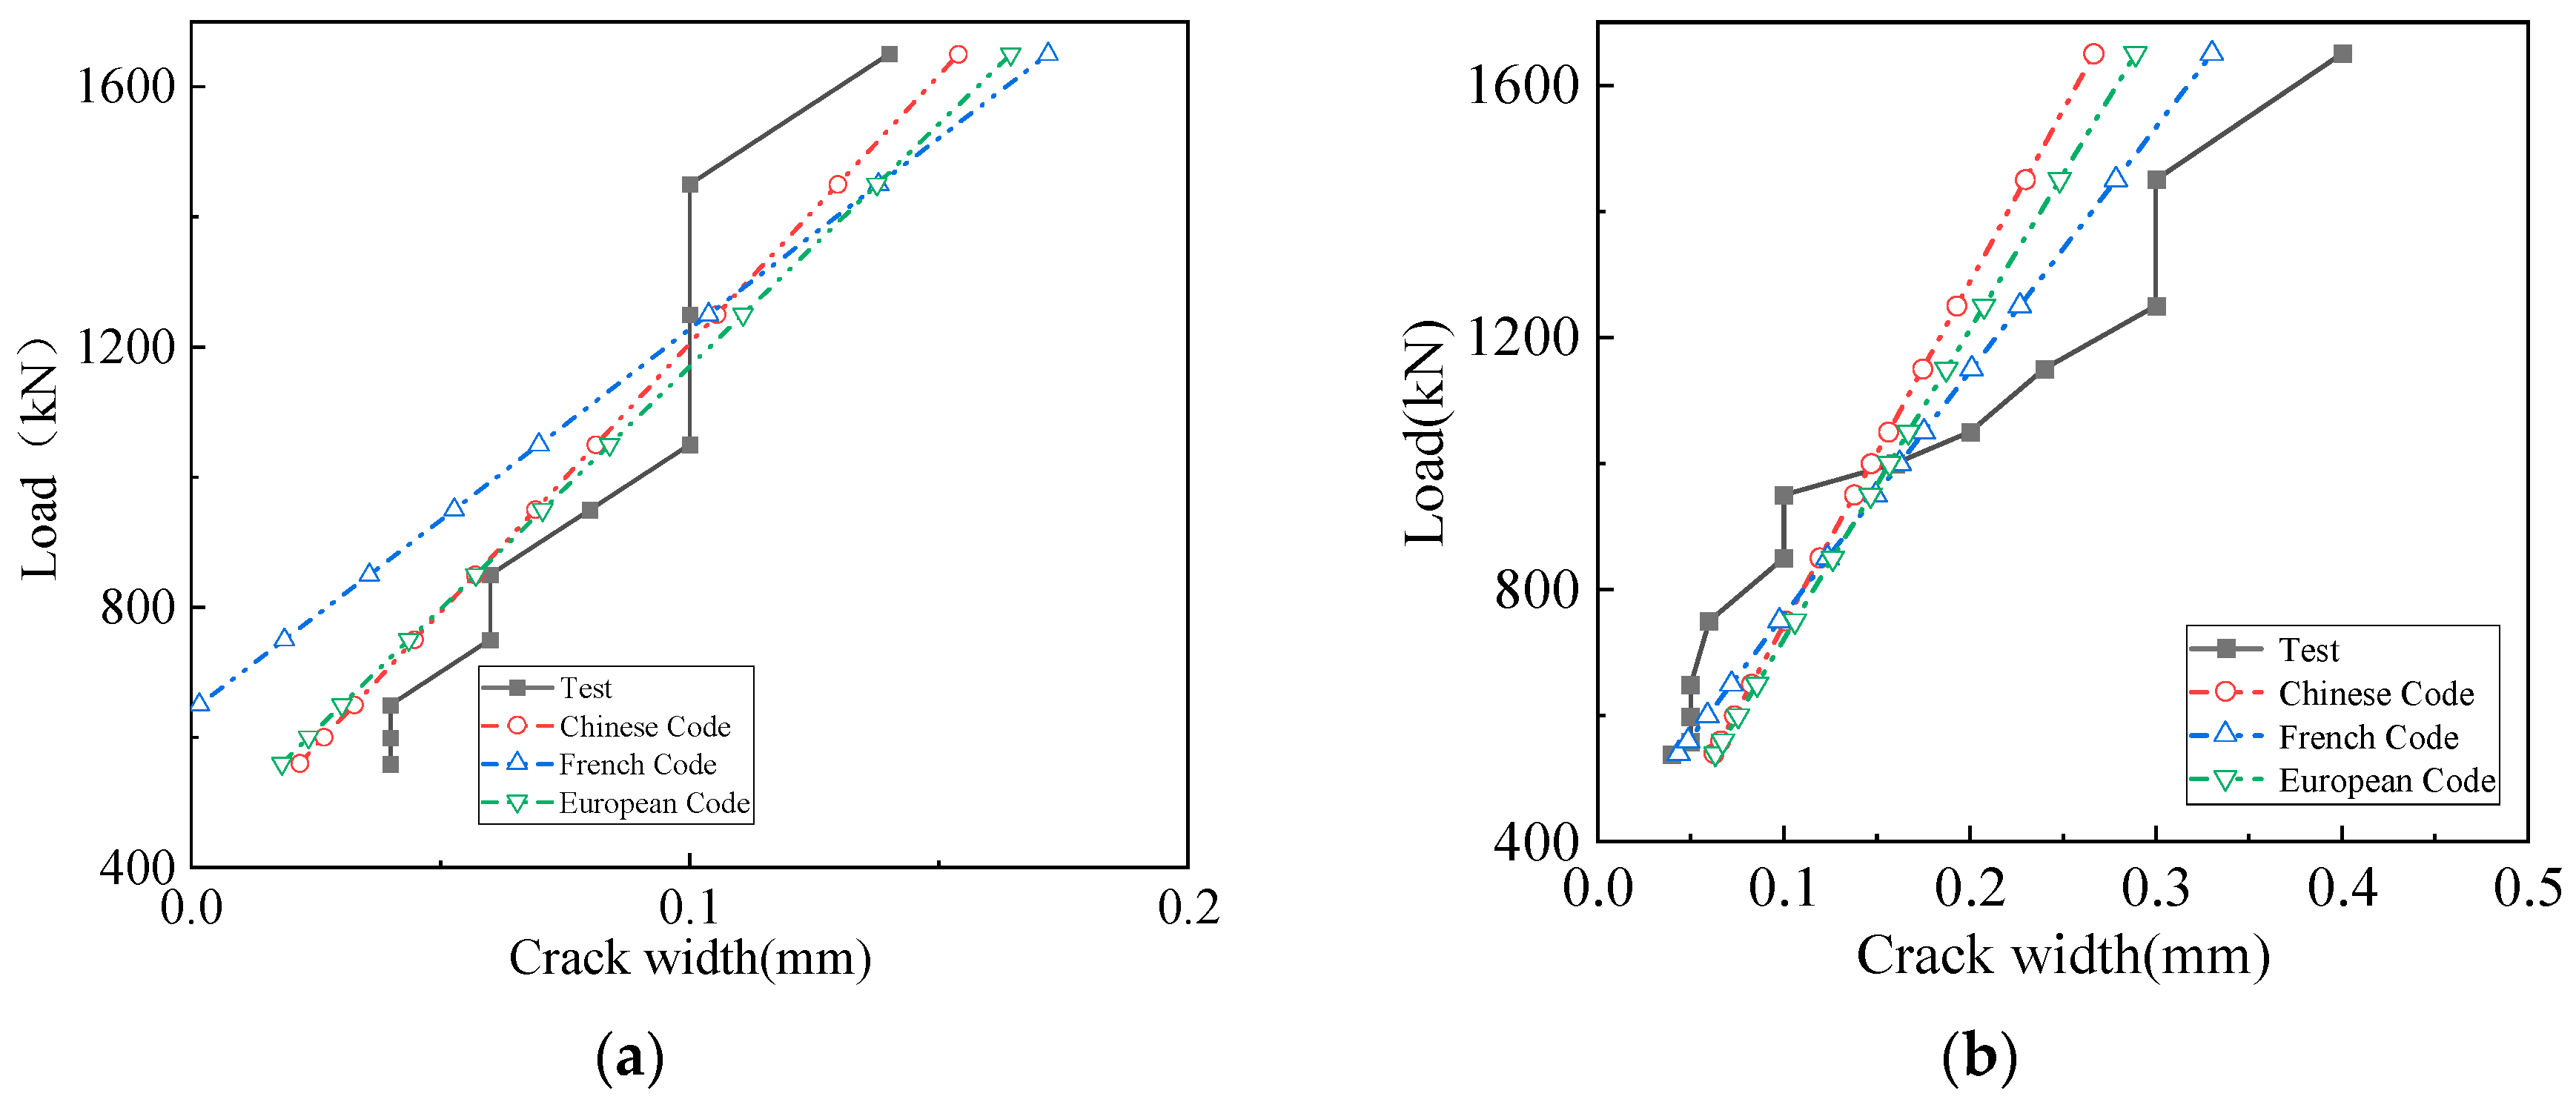
As shown in Figure 13, the crack widths on the UHPC surface of Sections 2 and 3 under different load levels were calculated using the Chinese code, the French code, and the European code, respectively. For Section 2, compared with the French code, the predictions from the Chinese code and the European code were closer to the measured values. For Section 3, when the crack width was less than 0.2 mm, the predictions were conservative; once the crack width exceeded 0.2 mm, the calculated values were all lower than the measured values, and the discrepancy increased with increasing load. It is therefore recommended that the codes examined in this study should be limited to predicting crack widths below 0.2 mm. Table 5 presents the mean values and COVs of the ratios of the code-predicted to measured crack widths, considering only crack widths below 0.2 mm. The average mean ratios for UHPC crack widths at different sections predicted by the Chinese, French, and European codes were 1.10, 0.98, and 1.13, respectively, with corresponding average COVs of 0.25, 0.33, and 0.28. Therefore, the Chinese code is recommended for crack width calculation.

5. Crack Width Calculation for UHPC–NC Interface

Current design codes have not yet provided a method for calculating crack width at the UHPC–NC interface. In this study, a crack width calculation formula for the UHPC–NC interface is derived based on the comprehensive theory.
In bond–slip theory, the crack width at the reinforcement is determined by the difference between the extensions of the reinforcement and the concrete between adjacent cracks, as expressed in Equation (15), where Sr,m is the crack spacing, and εsm and εcm are the mean strain difference in the reinforcement and the concrete, respectively, within the crack spacing.
w m = s r , m ( ε sm ε cm )

5.1. Cracking Space

Existing studies have shown that surface roughness is the most critical factor governing the bond strength between UHPC and NC [18,19]. Due to the segmented casting procedure and the unroughened NC substrate, the UHPC at the joint is assumed to contribute neither tensile resistance nor interfacial bond strength in the crack width calculation. That is, once cracking initiates, the UHPC layer provides no restraint to the NC tension zone, and the predicted crack width represents a conservative upper-bound estimate.
At the initial cracking stage, cracks first occurred at the region with deficiency on the UHPC structure. Because of the presence of bond stress, over a certain length along the reinforcement the concrete tensile stress increases to its tensile strength. The corresponding bond stress transfer length, ltr, is regarded as the theoretical minimum crack spacing. When the spacing between two cracks is less than 2ltr, the available bond transfer length is insufficient, and the bond stress between the reinforcement and concrete will not make the concrete stress reach its tensile strength; therefore, no new crack will form. In this case, the maximum crack spacing is 2ltr. Hence, the crack spacing falls within the range of ltr~2ltr.
Considering the large dispersion in the spacing of major cracks, the average crack spacing is taken as 1.5ltr [28]. Taking into account the influence of the concrete cover thickness c, the crack spacing can be calculated using Equation (16).
s r , m = 1.5 ( c + l tr )
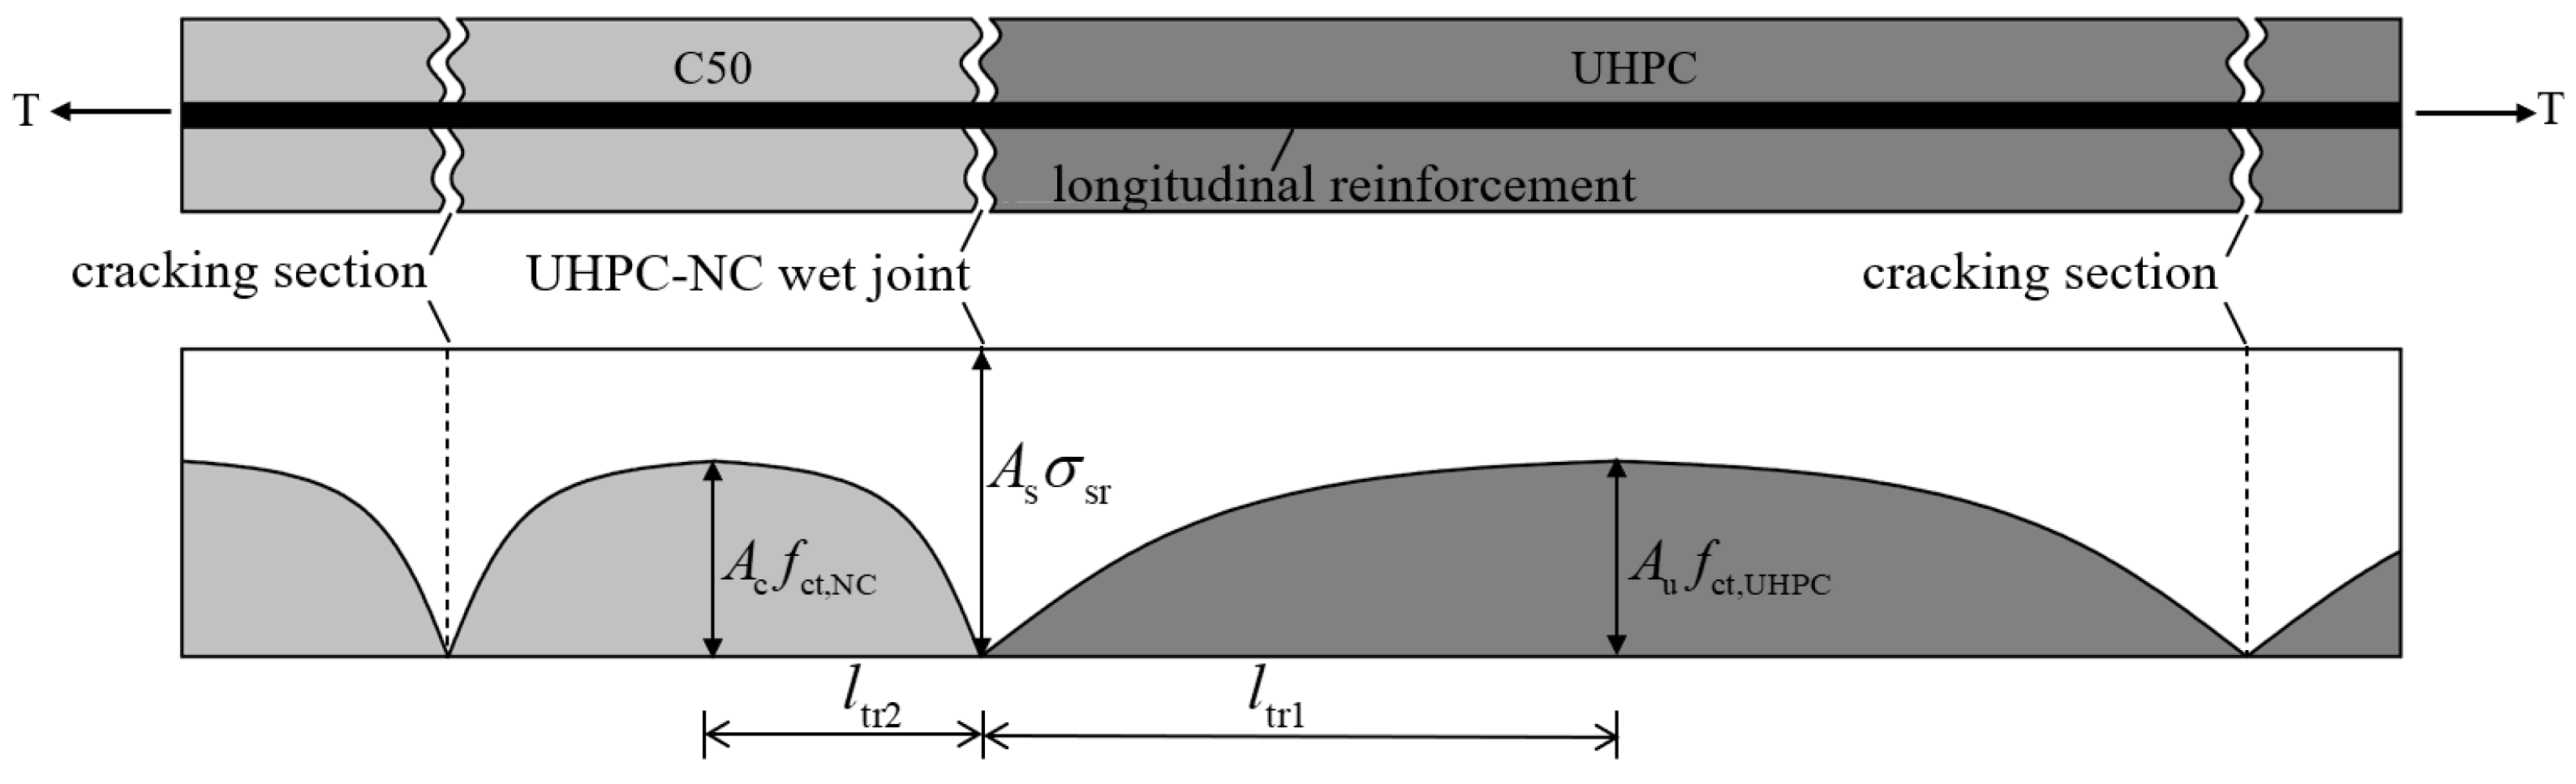
As shown in Figure 14, the UHPC within the bond transfer length range ltr1 on the right side is taken as a free body. From force equilibrium, it can be obtained that:
A u ( f ct , UHPC 0 ) = m π d e q l tr 1 τ bm 1
τ bm 1 = k b 1 f ct , UHPC
where Au is the UHPC area; m is the number of reinforcing bars; τbm1 is the mean bond stress between the reinforcement and UHPC, which is assumed to be linearly related to the ultimate tensile strength of UHPC, and kb1 is taken as 1.8 [30]. Substituting Equation (18) into Equation (17), the load transfer length in UHPC, ltr1 can be obtained as:
l tr 1 = d eq 4 k b 1 ρ te
where ρte is the longitudinal tensile reinforcement ratio calculated based on the effective tensile area.
Therefore, the crack-spacing expression on the UHPC side is given as follows:
s r , m = 1.5 ( c + l tr 1 ) = 1.5 ( c + d eq 4 k b 1 ρ te )
Following the above procedure, the normal concrete within the bond stress transfer length range ltr2 on the left side is taken as a free body. From force equilibrium, the crack-spacing expression on the normal concrete side can be obtained as:
s r , m = 1.5 ( c + l tr 2 ) = 1.5 ( c + d eq 4 k b 2 ρ te )
where kb2 is the ratio of the mean bond stress between the reinforcement and normal concrete to the ultimate tensile strength of normal concrete, taken as 2.5 [31].

5.2. Strain Difference over the Transfer Length

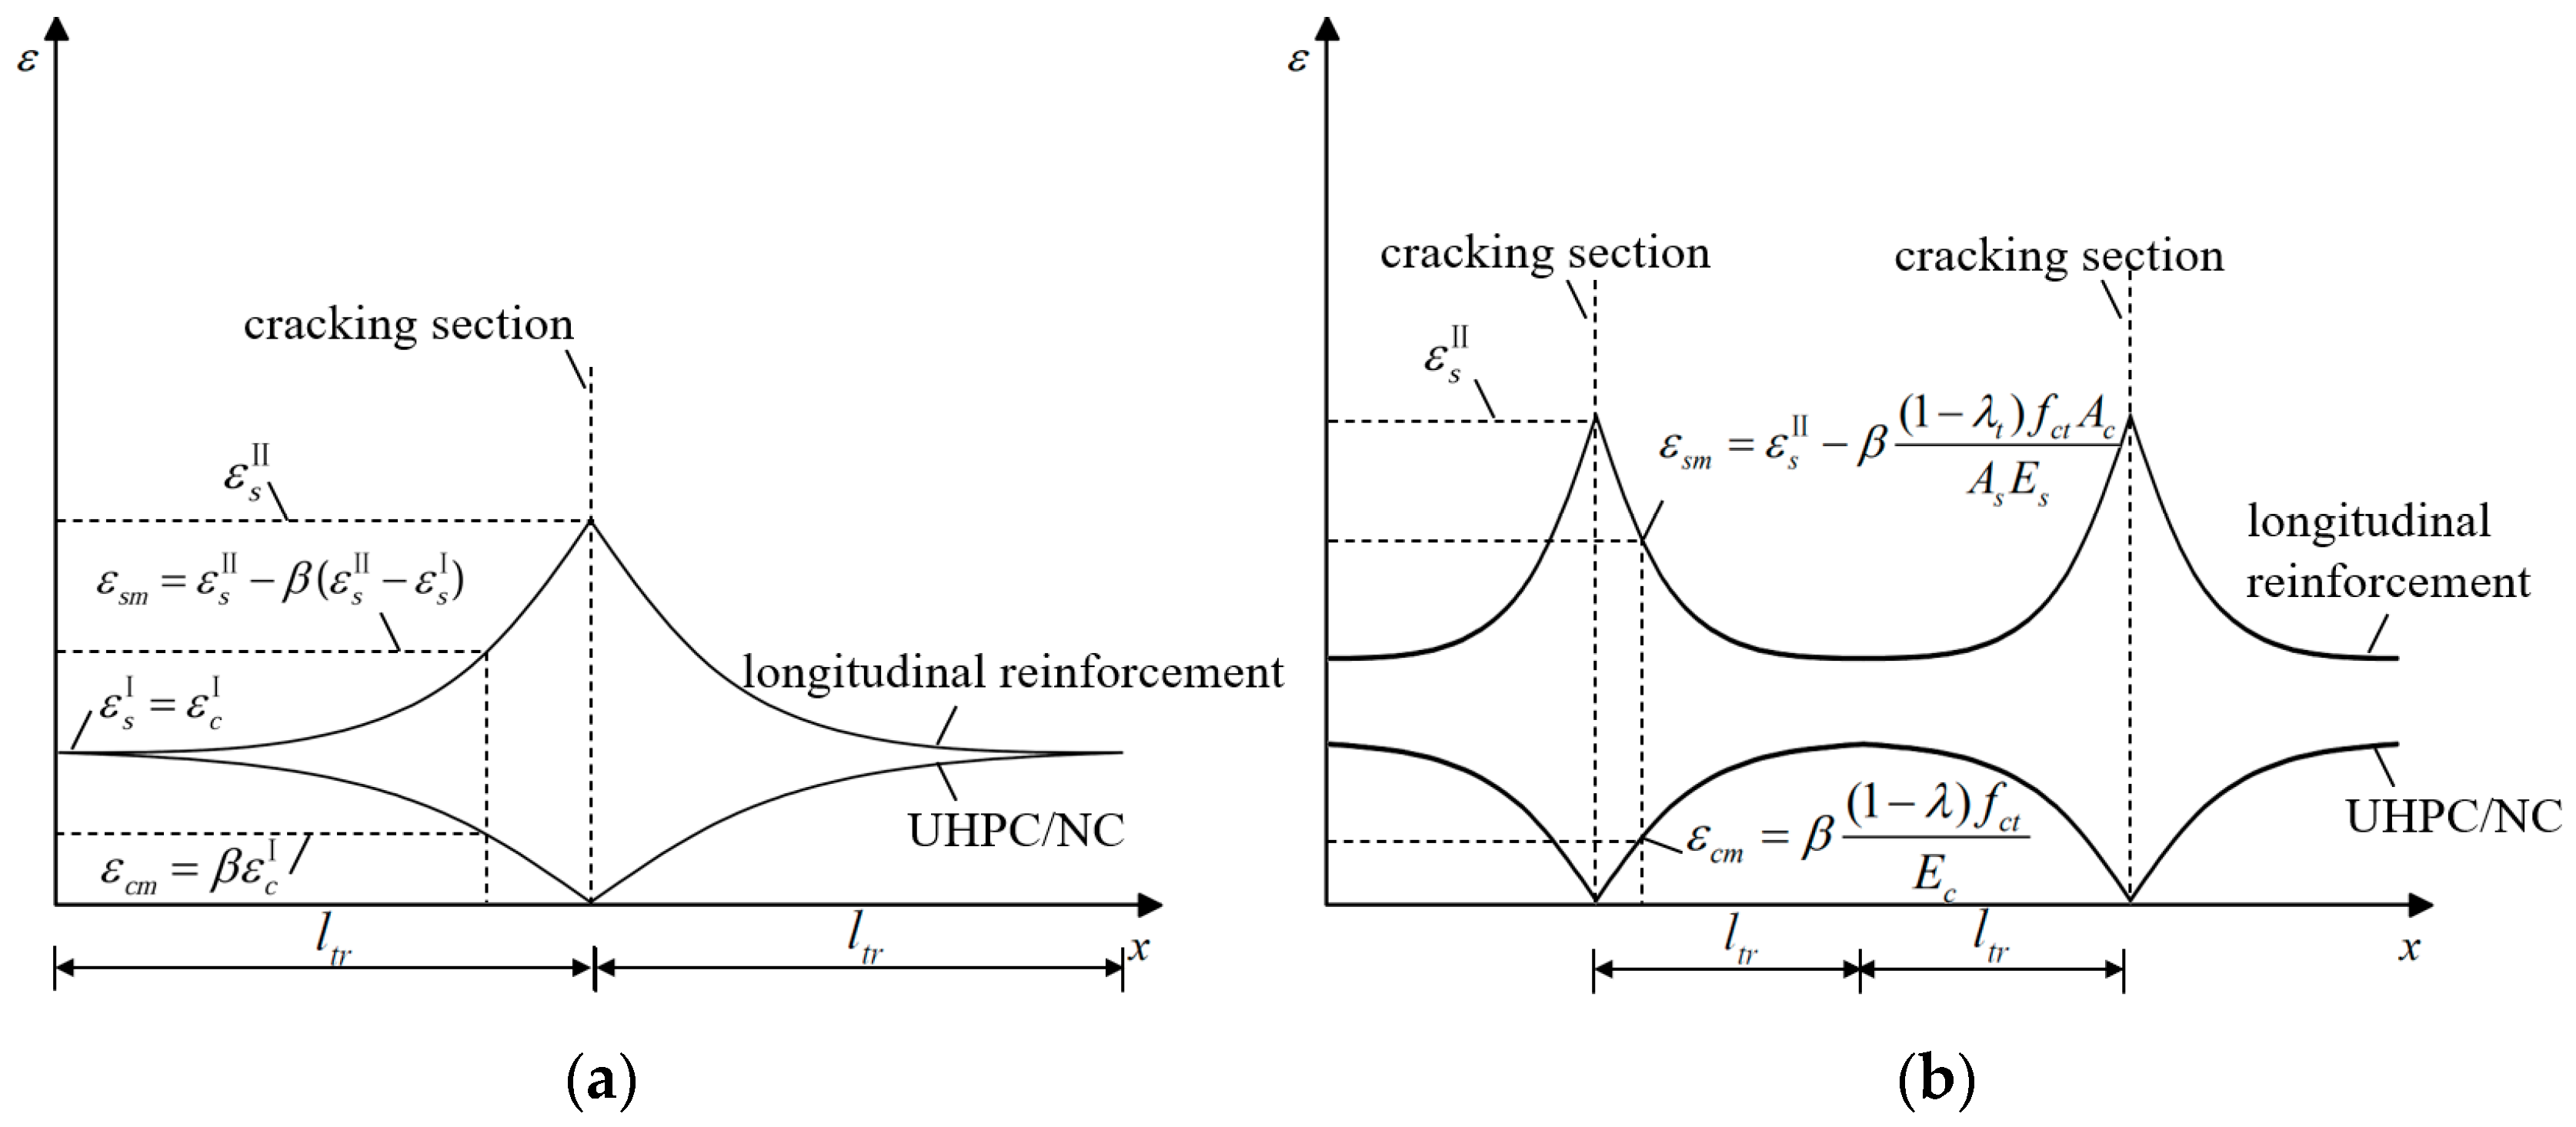
At the initial cracking stage, cracks first occur at the weak region of the UHPC structure, and the strain difference exists only within the load transfer zone near the crack. Based on Leutbecher’s theoretical model, the mean strain difference Δ ε can be expressed as:
ε sm = ε s II β ( ε s II ε s I )
ε cm = β ε c I
Δ ε = ε sm ε cm = ( 1 β ) σ sr E s
where ε s II , ε s I and ε c I denote the reinforcement strain at the cracked section, the reinforcement strain, and concrete strain at the uncracked section, respectively; σsr is the reinforcement stress at the cracked section; and β is the coefficient associated with the equivalent rectangular strain distribution. When the strain distribution of reinforcement or concrete is assumed to be parabolic, β is taken as 0.6 [29].
For the stabilized cracking stage, as shown in Figure 15b, the mean strain difference can be expressed as:
ε sm = ε s II β Δ ε = σ sr E s β Δ σ s E s = σ sr E s β A s Δ σ s A s E s = σ sr E s β A s Δ σ c A s E s = σ sr E s β ( 1 λ t ) f ct ρ te E s
ε cm = β ( 1 λ t ) f ct E c = β ( 1 λ t ) f ct E s α E
Δ ε = ε sm ε cm = σ sr E s β ( 1 λ t ) f ct E s ( 1 ρ te + α E )
For the UHPC side, fct in the equation denotes the ultimate tensile strength of UHPC, and αE is the ratio of the elastic modulus of steel to that of UHPC. For the normal concrete side, fct denotes the ultimate tensile strength of normal concrete, and αE is the ratio of the elastic modulus of steel to that of normal concrete. Therefore, the final expression for the mean strain difference is given as follows:
Δ ε = max ( 1 β ) σ sr E s , σ sr E s β ( 1 λ t ) f ct E s ( 1 ρ te + α E )
Based on the above analysis, the crack width at the reinforcement at the UHPC–NC interface, wm, can be expressed as follows. In the calculation, the crack spacing and the mean strain difference over the load transfer length should first be determined separately for the UHPC side and the normal concrete side, and then the larger of the two products should be adopted.
w m = max ( 1 β ) σ sr E s s r , m , σ sr E s β ( 1 λ t ) f ct E s ( 1 ρ te + α E ) s r , m
The crack width at the surface location of the joint ws is converted from wm as follows:
w s = w m h x h h r x
where hu is the section depth; hr is the distance from the centroid of the reinforcement to the top surface of the concrete slab; and x′ is the depth of the uncracked tensile zone.
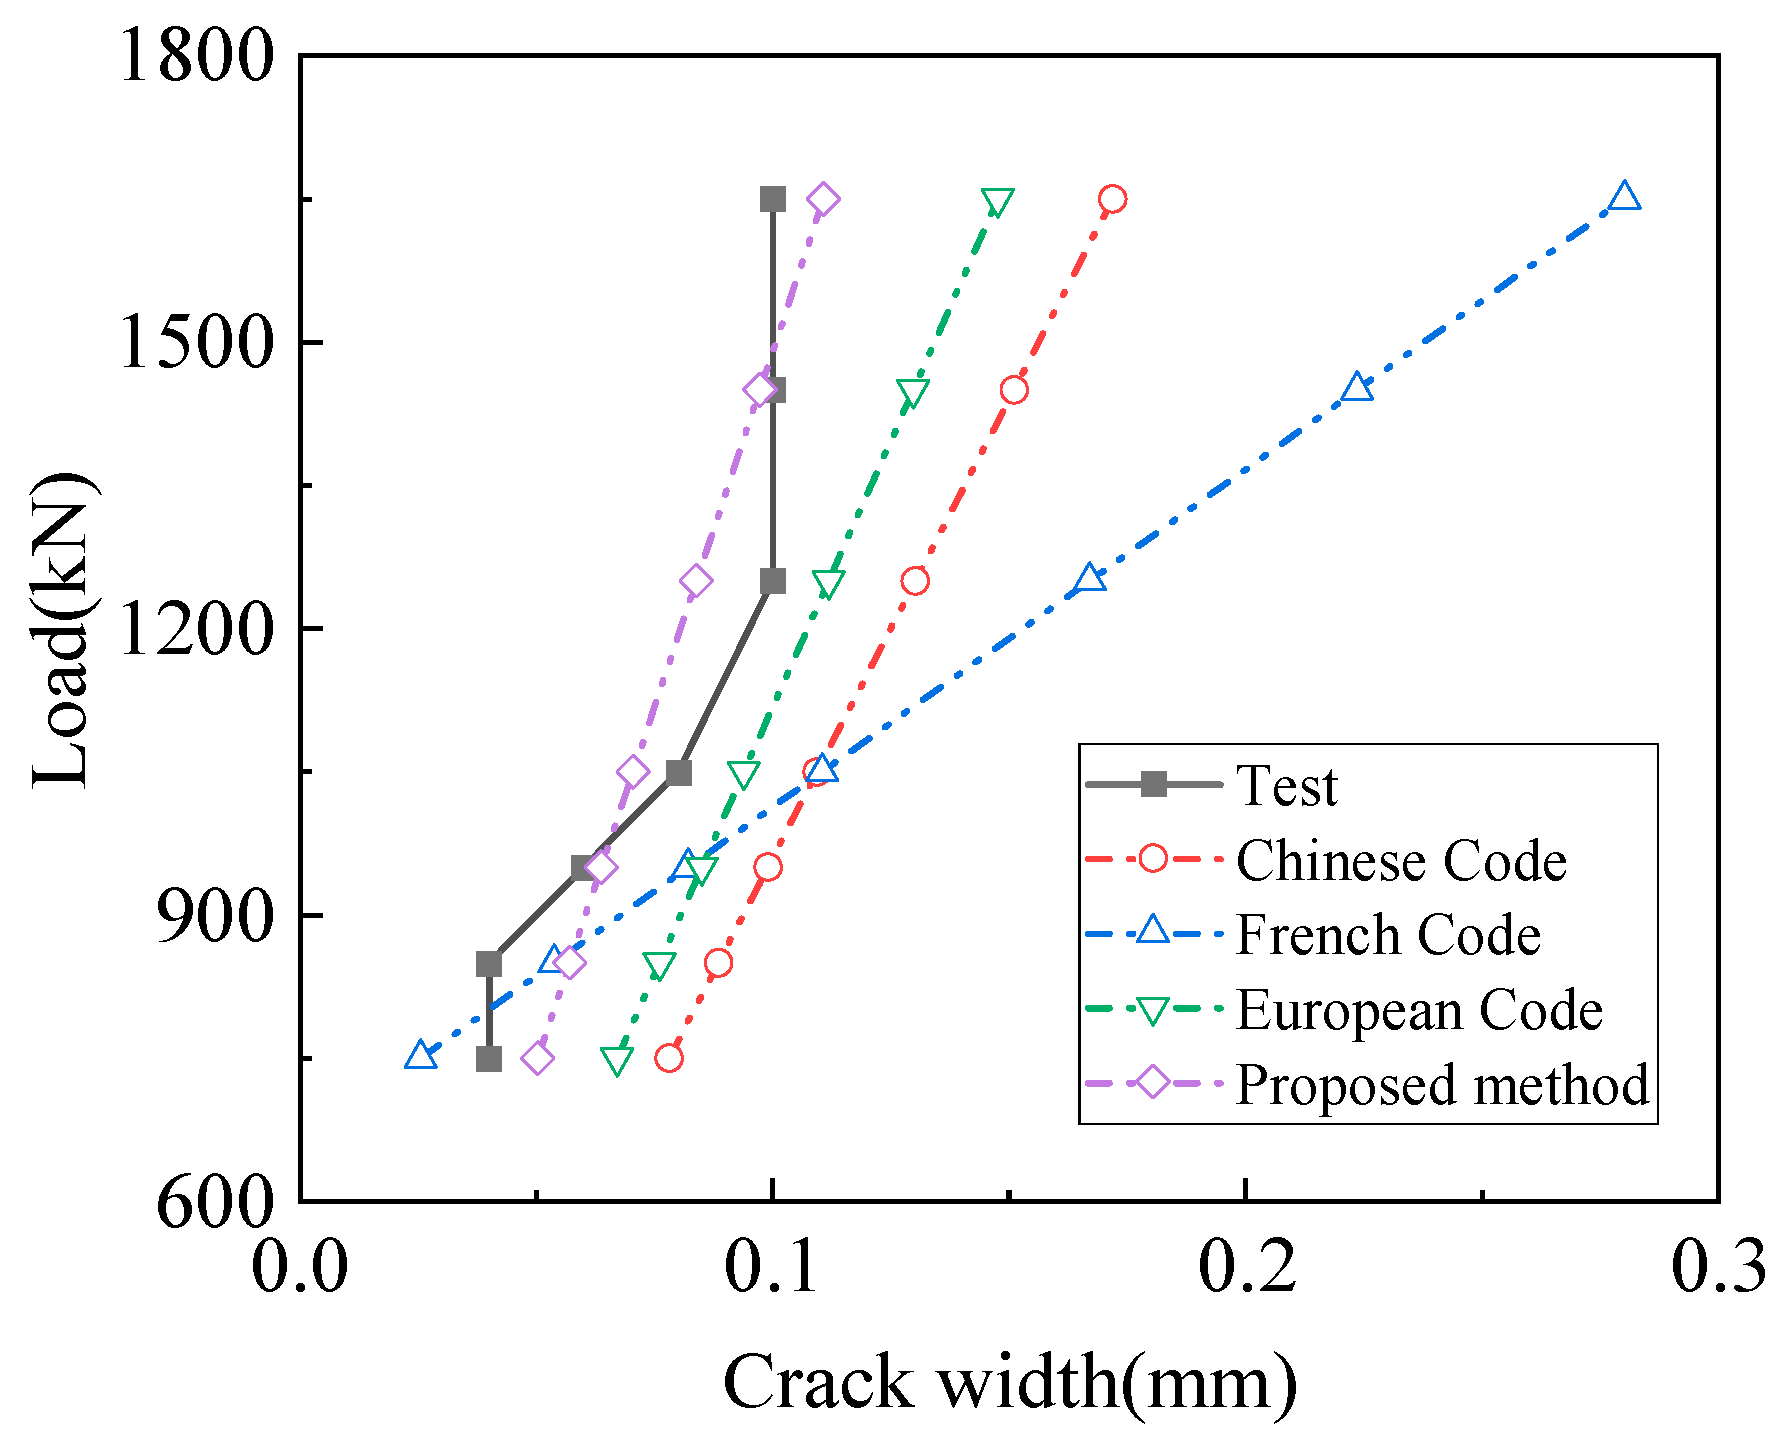
Figure 16 compares the code-predicted and measured crack widths at the UHPC–NC interface. Table 5 presents a comparative analysis of the calculated and measured crack spacings obtained using different codes. The crack spacing predicted by the French code shows a relatively large deviation from the measured values, which leads to crack widths much larger than the test results; moreover, the discrepancy increases with increasing load. The crack spacings and crack widths predicted by the Chinese code and the European code are both slightly larger than the measured values, indicating conservative predictions. Based on the comprehensive theory, this study modifies the crack-spacing expression; the resulting crack spacing deviates from the measured values by less than 10%. The proposed method yields the smallest mean value and average COV of the ratios of the calculated to measured crack widths, which are 1.08 and 0.18, respectively, and can predict the crack width at the UHPC–NC interface with good accuracy.

6. Conclusions

This study experimentally investigated the static performance of the hogging moment region of the steel–UHPC–NC composite girder with integrated piers. Based on the test results, a method was proposed to calculate reinforcement stresses accounting for the post-cracking residual tensile strength of UHPC at cracked sections. The existing design codes for UHPC crack width calculation was evaluated, and a crack width formula specifically for the UHPC–NC interface was developed. The main conclusions are as follows:
(1)
Crack development followed a distinct sequential pattern. Cracks first appeared on the side surface of the NC layer beneath the UHPC layer at the cantilever root section. Subsequently, cracks occurred on the top surface of the UHPC layer, then at the UHPC–NC interface, and finally on the mid-plane of the pier-to-girder joint. Notably, UHPC exhibited a “numerous and closely spaced” crack distribution, whereas NC showed a “few and widely spaced” pattern.
(2)
A reinforcement stress calculation method that incorporates the tensile contribution of UHPC at cracked sections was proposed. The mean value and average coefficient of variation in the ratios of the calculated to measured reinforcement stresses for different sections were 1.07 and 0.10, respectively, indicating good predictive accuracy.
(3)
All three evaluated design codes are recommended for predicting crack widths below 0.2 mm. The mean ratios of the predicted to measured UHPC crack widths for different sections using the Chinese code, French code, and European code were 1.10, 0.98, and 1.13, respectively, with corresponding average coefficients of variation of 0.25, 0.33, and 0.28; the Chinese code is recommended for UHPC crack width prediction.
(4)
For the UHPC–NC interface, a crack width expression was derived based on the comprehensive theory. The mean ratio of calculated to measured values and the coefficient of variation were 1.08 and 0.18, respectively, indicating good agreement with the experimental results.
(5)
Due to the limited number of full-scale test girders, the available crack width data are relatively limited. Further experimental studies are recommended to validate the proposed crack width formula for the UHPC–NC interface.

Author Contributions

L.-T.Y., writing—review and editing, writing—original draft, visualization, validation, methodology, investigation, formal analysis, data curation, conceptualization. C.Y., writing—review and editing, supervision, methodology. F.O.M., writing—review and editing, methodology. Z.L., writing—review and editing. All authors have read and agreed to the published version of the manuscript.

Funding

This work was supported by the Science and Technology Project of Zhejiang Provincial Communication Department (No. 2022-GCKY-03).

Data Availability Statement

Data will be made available on request.

Conflicts of Interest

Author Li-Tao Yu, Chunbin Yu and Zhiping Lin was employed by the company Tongxiang Transportation Construction Investment Group Co., Ltd. and Fujian Provincial Expressway Group Co., Ltd. The remaining authors declare that the research was conducted in the absence of any commercial or financial relationships that could be construed as a potential conflict of interest.

References

  1. Liu, Y.; Gao, Y.; Zhou, X.; Zhang, Z.J.; Zhang, Z.F. Technical and Economic Analysis in Steel-concrete Composite Girder Bridges with Small and Medium Span. China J. Highw. Transp. 2017, 30, 113. [Google Scholar]
  2. Liu, Y.; Liu, J.; Zhou, X.; Wang, Z.; Meng, J.; Zhao, X.; Yang, J.; Ghosn, M. Review on long-life design theory for bridges. J. Traffic Transp. Eng. 2024, 24, 1–24. [Google Scholar]
  3. Nerilli, F.; Ahmadi, H.M.; Imperatore, S.; Vairo, G. Bond–Slip Performance of GFRP Rebars in Concrete Under Alkaline and Thermal Conditioning. J. Compos. Sci. 2026, 10, 131. [Google Scholar] [CrossRef] [Scilit]
  4. Pierre, R.; Marcel, C. Composition of Reactive Powder Concretes. Cem. Concr. Res. 1995, 25, 1501–1511. [Google Scholar] [CrossRef] [Scilit]
  5. Dogu, M.; Menkulasi, F. A Flexural Design Methodology for UHPC Beams Posttensioned with Unbonded Tendons. Eng. Struct. 2020, 207, 110193. [Google Scholar] [CrossRef] [Scilit]
  6. Li, J.; Deng, Z. Tensile Behavior of Ultra-high Performance Concrete Reinforced with Different Hybrid Fibers. Struct. Concr. J. FIB 2023, 24, 1415–1435. [Google Scholar] [CrossRef] [Scilit]
  7. Shao, X.; Luo, J.; Cao, J.; Fan, W.; Wang, Y. Experimental study and crack width calculation of steel-UHPC lightweight compo-site deck structure. China Civ. Eng. J. 2019, 52, 61–75. [Google Scholar]
  8. Li, W.; Shao, X.; Fang, H.; Zhang, Z. Experimental study on flexural behavior of steel-UHPC composite slabs. China Civ. Eng. J. 2015, 48, 93–102. [Google Scholar]
  9. Liu, X.; Zhou, C.; Zhang, J.; Li, L.F.; Shi, X.W. Experiment on negative bending behavior of steel-UHPC composite beams. China J. Highw. Transp. 2020, 33, 110–121. [Google Scholar]
  10. Zhang, Y.; Cai, S.K.; Zhu, Y.P.; Fan, L.; Shao, X. Flexural responses of steel-UHPC composite beams under hogging moment. Eng. Struct. 2020, 206, 110134. [Google Scholar] [CrossRef] [Scilit]
  11. Zhu, J.S.; Ding, J.N.; Wang, Y.G. Numerical and theoretical studies on shear behavior of steel-UHPC composite beams with waffle slab. J. Build. Eng. 2022, 47, 103913. [Google Scholar] [CrossRef] [Scilit]
  12. Yoo, S.W.; Choo, J.F. Evaluation of the flexural behavior of composite beam with inverted-T steel girder and steel fiber rein-forced ultra high performance concrete slab. Eng. Struct. 2016, 118, 1–15. [Google Scholar] [CrossRef] [Scilit]
  13. Zhang, Q.; Han, S.; Jia, D.; Bu, Y. Mechanical performance of novel prefabricated composite girder with top flange of ultra high performance concrete waffle deck panel. J. Southwest Jiaotong Univ. 2019, 54, 445–452. [Google Scholar]
  14. Liu, J.P.; Lai, Z.C.; Chen, B.C.; Xu, S. Experimental behavior and analysis of steel-laminated concrete (RC and UHPC) composite girders. Eng. Struct. 2020, 225, 111240. [Google Scholar] [CrossRef] [Scilit]
  15. Men, P.; Chen, F.; Qin, F.; Peng, X.; Di, J.; Jiao, H. Behavior of composite beams with UHPC concrete composite slabs under negative bending moment. J. Constr. Steel Res. 2025, 227, 109415. [Google Scholar] [CrossRef] [Scilit]
  16. Yang, H.; Zheng, Y.; Mo, S.; Lin, P. Push-out Tests on Studs with UHPC Cover Embedded in UHPC-NSC Composite Slab. Constr. Build. Mater. 2022, 331, 127210. [Google Scholar] [CrossRef] [Scilit]
  17. Zhang, C. Experimental Study: An Various Influence Factors Affecting Interfacial Shear Performance of UHPC-NSC. Master’s Thesis, Hunan University, Changsha, China, 2020. [Google Scholar]
  18. Al-Osta, M.A.; Ahmad, S.; Al-Madani, M.K.; Khalid, H.R.; Al-Huri, M.; Al-Fakih, A. Performance of bond strength between ultra-high-performance concrete and concrete substrates (concrete screed and self-compacted concrete): An experimental study. J. Build. Eng. 2022, 51, 104291. [Google Scholar] [CrossRef] [Scilit]
  19. He, S.; Huang, X.; Zhong, H.; Wan, Z.; Liu, G.; Xin, H.; Zhang, Y. Experimental study on bond performance of UHPC-to-NC interfaces: Constitutive model and size effect. Eng. Struct. 2024, 317, 118681. [Google Scholar] [CrossRef] [Scilit]
  20. Hussein, H.H.; Walsh, K.K.; Sargand, S.M.; Steinberg, E.P. Interfacial properties of ultrahigh-performance concrete and high-strength concrete bridge connections. J. Mater. Civ. Eng. 2016, 28, 04015208. [Google Scholar] [CrossRef] [Scilit]
  21. Hussein, H.H.; Walsh, K.K.; Sargand, S.M.; Al Rikabi, F.T.; Steinberg, E.P. Modeling the shear connection in adjacent box-beam bridg-es with ultrahigh-performance concrete joints. I: Model calibration and validation. J. Bridge Eng. 2017, 22, 04017043. [Google Scholar] [CrossRef] [Scilit]
  22. Tayeh, B.A.; Bakar, B.H.A.; Johari, M.A.M.; Voo, Y.L. Mechanical and permeability properties of the interface between normal con-crete substrate and ultra high performance fiber concrete overlay. Constr. Build. Mater. 2012, 36, 538–548. [Google Scholar] [CrossRef] [Scilit]
  23. Yang, J.; Xia, J.; Zhang, Z.; Zhou, J.; Zou, Y.; Wang, Y.; Shen, X. Mesoscopic shear behavior and strength characteristic of UHPC-NC interface considering the combined effect of mechanical interlocking and dowel action. Eng. Fract. Mech. 2024, 307, 110306. [Google Scholar] [CrossRef] [Scilit]
  24. D60-02-2023; Technical Specifications for Highway Ultra-High Performance Concrete (UHPC) Bridges. People’s Communications Press: Beijing, China, 2023.
  25. NF-P-18-710; Design of Concrete Structures: Specific Rules for Ultra-High Performance Fiber Reinforced Concrete (UHPFRC). AFNOR: Paris, France, 2016.
  26. CEB-FIP. Model Code for Concrete Structures 2010; International Federation for Structural Concrete: Lausanne, Switzerland, 2012. [Google Scholar]
  27. Wang, J.; Geng, L.; Guo, J.; Liu, C.; Liu, G. Experimental Study on Crack Width Control Ability of Ultra-high Performance Concrete. J. Harbin Inst. Technol. 2017, 49, 165. [Google Scholar]
  28. Uchida, Y.; Niwa, J.; Tanaka, Y.; Katagiri, M. Outlines of ‘Recommendations for Designed Construction of Ultra High Strength Fiber Re-inforced Concrete Structures’ by JSCE. In Proceedings of the International RILEM Workshop on High Performance Fiber Reinforced Cementitious Compo-Sites in Structural Applications; RILEM Publications SARL: Paris, France, 2005. [Google Scholar]
  29. Shi, Z.; Su, Q.; Shao, X. Axial Tension Behavior of Segmented-casting Rectangular Joint of Steel-UHPC Composite Bridge Deck. China Civ. Eng. J. 2022, 55, 50–60. [Google Scholar]
  30. Tan, X.; Fang, Z.; Peng, Z.; Zheng, H.; Tang, S.; Liao, Y. Tensile Behavior of a Prefabricated Steel–UHPC Composite Deck System with Notched Perfobond Strips. Eng. Struct. 2022, 268, 114737. [Google Scholar] [CrossRef] [Scilit]
  31. Lee, S.W.; Kang, S.B.; Tan, K.H.; Yang, E.-H. Experimental and Analytical Investigation on Bond-slip Behaviour of Deformed Bars Em-bedded in Engineered Cementitious Composites. Constr. Build. Mater. 2016, 127, 494–503. [Google Scholar] [CrossRef] [Scilit]
Figure 1. Background project (unit: mm): (a) standard cross section; (b) pier–to-girder joint.
Infrastructures 11 00178 g001
Figure 2. Layout of specimen (unit: mm). (a) Elevation of the specimen; (b) Section A-A; (c) layout of studs; (d) Section B-B.
Infrastructures 11 00178 g002
Figure 3. Processing procedures of the specimen. (a) Steel structure fabrication; (b) reinforcement tying; (c) casting of concrete slab; (d) reinforcement tying in the pier-to-girder joint; (e) casting of concrete cross-beam; (f) casting of the UHPC layer.
Infrastructures 11 00178 g003
Figure 4. Loading setup.
Infrastructures 11 00178 g004
Figure 5. Arrangement of measurement points. (a) Measurement points on the side of the specimen; (b) measurement points on the top surface of the concrete slab. (c) Measurement points on the reinforcements.
Infrastructures 11 00178 g005
Figure 6. Load–displacement curve.
Infrastructures 11 00178 g006
Figure 7. Cross-section strain distribution.
Infrastructures 11 00178 g007
Figure 8. Crack propagation.
Infrastructures 11 00178 g008
Figure 9. Load–maximum crack width curve.
Infrastructures 11 00178 g009
Figure 10. Calculation diagram for reinforcement stress at cracked sections. (a) Cracked section, (b) strain distribution, (c) stress distribution.
Infrastructures 11 00178 g010
Figure 11. Softening constitutive model of UHPC under axial tension.
Infrastructures 11 00178 g011
Figure 12. Comparison of the calculated and measured values of the reinforcement stress. (a) Section 2; (b) Section 3.
Infrastructures 11 00178 g012
Figure 13. Comparison of the calculated and measured values of the UHPC crack width. (a) Section 2. (b) Section 3.
Infrastructures 11 00178 g013
Figure 14. Calculation diagram of UHPC–NC components with reinforcement under axial tensile force.
Infrastructures 11 00178 g014
Figure 15. Strain distribution of UHPC–NC components with reinforcement under axial tensile force. (a) Initial cracking stage. (b) Stable crack propagation stage.
Infrastructures 11 00178 g015
Figure 16. Crack width at the UHPC–NC interface.
Infrastructures 11 00178 g016
Table 1. Material properties of steel.
MaterialDiameter/Thickness (mm)Yield Strength (MPa) Tensile Strength (MPa)
Reinforcement20460642
25415622
Steel plate16428532
22433543
Table 2. Material properties of concrete.
Tensile Strength (MPa)Cube Compressive Strength (MPa)Elastic Modulus (GPa)
UHPC7.81121.345.1
C50/52.734.2
Table 3. Material compositions of 1 m3 UHPC (unit: kg).
CementFly AshSilica Fume Quartz SandAdmixtureWaterSteel FibersLiquid Superplasticizer
600150100127537520718826
Table 4. The mean values and coefficient of variations in the ratio of the calculated values to the measured values of reinforcement stress at different sections.
Section 3Section 2
LabelMeanCoefficient of Variation
(COV)
LabelMeanCoefficient of Variation (COV)
L3-41.140.06L2-31.100.14
L3-41.120.07L2-41.020.11
L3′-21.020.10L2′-41.130.13
L3′-40.890.10L2′-51.150.07
Average1.040.08Average1.100.11
Table 5. Comparison of the calculated and measured values of the crack spacing at the UHPC–NC interface.
Crack Spacing (mm)Relative Deviation (%)
Measured value170/
Chinese code//
French code568234.1
Europe code20721.8
Method proposed1568.2
Disclaimer/Publisher’s Note: The statements, opinions and data contained in all publications are solely those of the individual author(s) and contributor(s) and not of MDPI and/or the editor(s). MDPI and/or the editor(s) disclaim responsibility for any injury to people or property resulting from any ideas, methods, instructions or products referred to in the content.