Article

Study on the Optimization Method of TBM Disk Cutter Spacing in Jointed Rock Mass

1
China Construction Tunnel Construction Co., Ltd., Chongqing 401320, China
2
China Construction International Construction Co., Ltd., Beijing 100029, China
3
Beijing Daxing District Housing and Urban-Rural Development Commission, Beijing 102600, China
4
School of Environment and Civil Engineering, Dongguan University of Technology, Dongguan 523808, China
*
Author to whom correspondence should be addressed.
Infrastructures 2026, 11(4), 137; https://doi.org/10.3390/infrastructures11040137
Submission received: 16 February 2026 / Revised: 8 April 2026 / Accepted: 9 April 2026 / Published: 15 April 2026

Abstract

This paper investigates the influence of three key parameters, which are the spacing of cutters, the dip angle of joints and the spacing of joints on the load evolution process of jointed rock masses from the perspective of rock-breaking mechanics. Furthermore, how variations in cutter spacing and joint characteristics affect cutting efficiency is studied from a macroscopic viewpoint, focusing on indicators such as specific energy (SE) for crack propagation and rock fragment formation. Based on the research results, a novel optimization approach for cutter spacing in jointed rock mass conditions is proposed. The optimal cutter spacings under varying joint conditions are calculated, and the effects of joint spacing and dip angle on cutter spacing optimization are systematically discussed. The results show that when the joint dip angle is 60°, the cutter spacing is 100 mm, and the joint spacing is 30 mm, the rock fragmentation efficiency reaches the highest. It is also found that the influence of the joint dip angle on the optimal cutter spacing is greater than that of the joint spacing. When the joint spacing is 70 mm, the corresponding optimal cutter spacing is 100.7 mm. When the joint dip angle increases from 0° to 60°, the optimal cutter spacing gradually increases to 112.8 mm. When the joint spacing is greater than 60 mm, the optimal hammer spacing of the hammer gradually decreases.

1. Introduction

The tunnel boring machine (TBM) cutterhead is a critical component in the tunneling process. As the TBM excavates rock through the cutting action of its cutterhead, the layout of cutters significantly affects both cutting efficiency and cutter service life [1,2,3,4]. With the wider application of TBMs in engineering practice, the geological conditions encountered during construction have become increasingly complex, and the limitations of traditional cutter spacing optimization methods have become increasingly prominent. To improve rock-breaking efficiency in jointed rock masses, it is essential to investigate how varying joint conditions and cutter spacing influence rock-breaking performance. However, owing to the high cost and limited number of experimental tests, it is impractical to conduct physical experiments for all potential cutter spacing schemes. Therefore, developing a theoretical method for optimizing cutter spacing in jointed rock masses has become a necessary research focus.
Researchers have carried out extensive studies on how cutterhead layout and cutter parameters affect rock-breaking performance. Based on the installation positions of the cutterhead, TBM cutters are typically classified into center cutters, face cutters, edge cutters, and transition cutters. Relevant studies have mainly concentrated on cutter types, spacing, and circumferential arrangement. If cutter spacing is excessively large, the synergistic rock-breaking effect between adjacent cutters cannot be fully mobilized. Conversely, if spacing is too small, cutters are prone to overloading, and overall economic efficiency will decline. Regarding the determination of optimal cutter spacing, Wang et al. [5] derived a formula for the optimal ratio of cutter spacing to penetration depth based on the natural fracture angle of rock masses. Liu and Wang et al. [6,7] investigated the influence of cutter spacing on TBM rock-breaking parameters for various rock types and summarized corresponding cutterhead layout principles. Yu et al. [8,9,10] established a predictive formula for the normal rock-breaking force acting on cutters. Lin et al. [11] explored the optimal layout of edge cutters by minimizing the unbalanced force and overturning moment of the cutterhead as objective functions. Through full-scale disk cutter tests, R. Gertsch et al. [12] analyzed the influence of cutter spacing on the rock-breaking efficiency of coarse-grained red granite. Their results showed that both the normal force and rolling force increased with increasing cutter spacing. Based on specific energy (SE) calculations, the highest cutting efficiency for hard and brittle crystalline rocks was achieved at a cutter spacing of 76 mm. Lu et al. [13] performed five groups of linear cutting tests with different cutter spacings using full-scale cutters. By analyzing the average normal force, average rolling force, and SE under various conditions, they found that increasing penetration depth at a fixed spacing generated more rock fragments but did not always improve cutting efficiency. The lowest SE and thus the highest rock-breaking efficiency occurred when the ratio of cutter spacing to penetration depth was approximately 30. Jung-Woo Cho et al. [14] evaluated cutting performance under different spacing conditions using a full-scale linear cutting machine combined with the ShapeMetrix3D photogrammetric system. Using SE as an evaluation index, they determined the optimal cutting conditions for rock fragmentation. The results showed that SE reached its minimum when the ratio of cutter spacing (S) to penetration depth (P) was 15. When the S/P ratio exceeded 15, cutters operated in an independent rock-breaking mode.
However, present existing model tests on cutter-induced rock fragmentation primarily focus on homogeneous and intact rock masses. In practical tunneling projects, geological conditions are often complex, with the presence of discontinuous interfaces such as faults, joints, and fractures within the rock mass. Current studies investigating the efficiency of cutter-induced rock fragmentation under such conditions predominantly employ numerical simulation methods, such as finite element and discrete element modeling. Experimental investigations into the rock-breaking process are mostly based on homogeneous strata, which deviate from real-world engineering scenarios. Based on this context, this study first examines the influence of three key variables—cutter spacing, joint dip angle, and joint spacing—on the load evolution process of jointed rock masses from a rock-breaking mechanics perspective. Subsequently, the effects of varying cutter spacing and joint conditions on cutting efficiency were analyzed from a macroscopic viewpoint, including crack propagation, SE consumption, and rock debris formation. Based on these analyses, a novel optimization method for cutter spacing in jointed rock masses is proposed. The optimal cutter spacing under different joint conditions was calculated, and the influence of joint spacing and dip angle on the optimization of cutter spacing was discussed.

2. Experimental Introduction

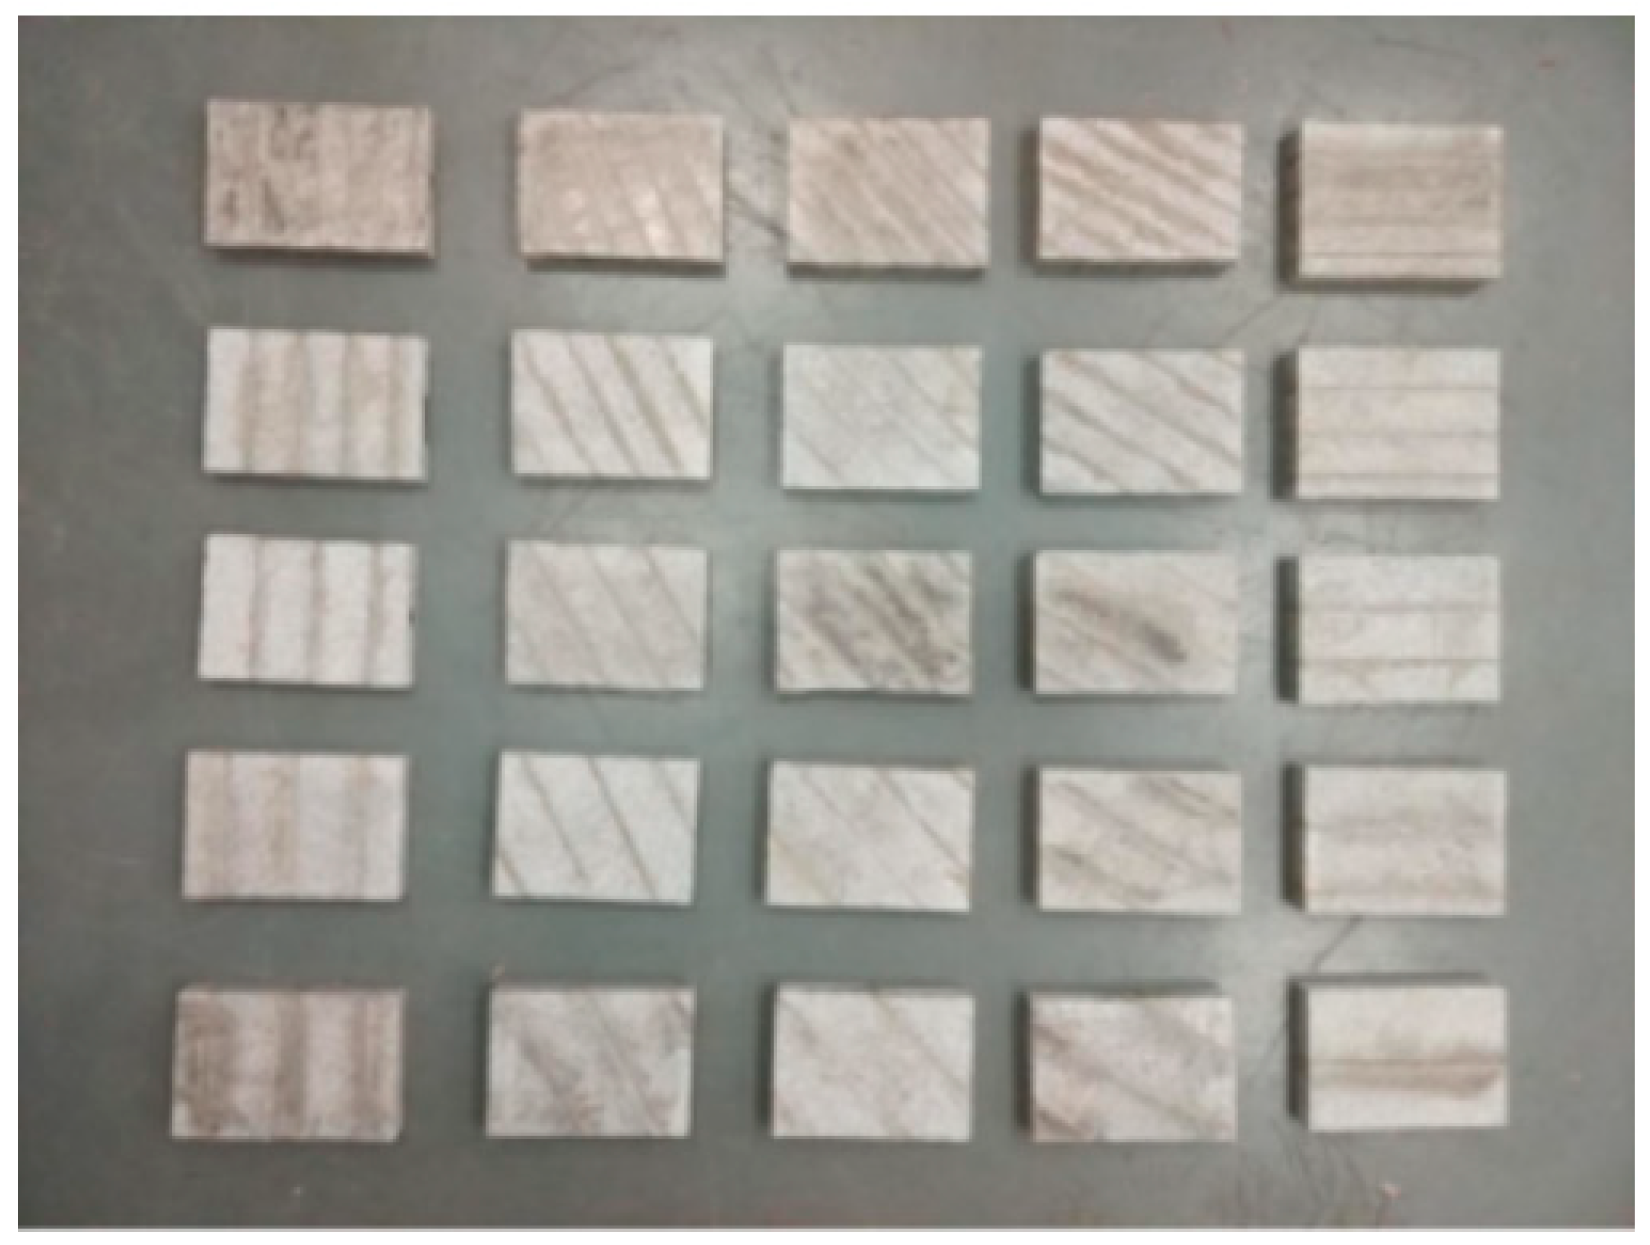
The size design of the rock samples used in this experiment is primarily based on the studies conducted by Johnson and Alehoseein et al. [15,16]. Through both experimental investigation and theoretical analysis, it has been established that to minimize the size effect of the specimens, the ratio of the depth of the plastic zone to the width of the specimen should be maintained below 0.5. In the case of granite, the depth of the plastic zone is approximately 2 mm, resulting in a ratio that is significantly lower than 0.5. Consequently, granite was selected as the specimen material to facilitate a clear observation of the crack-opening process on the surface of the jointed rock mass under the influence of the roller cutter. The specimens were machined from natural granite blocks into plate-shaped forms with dimensions of 200 × 140 × 30 mm, as illustrated in Figure 1.
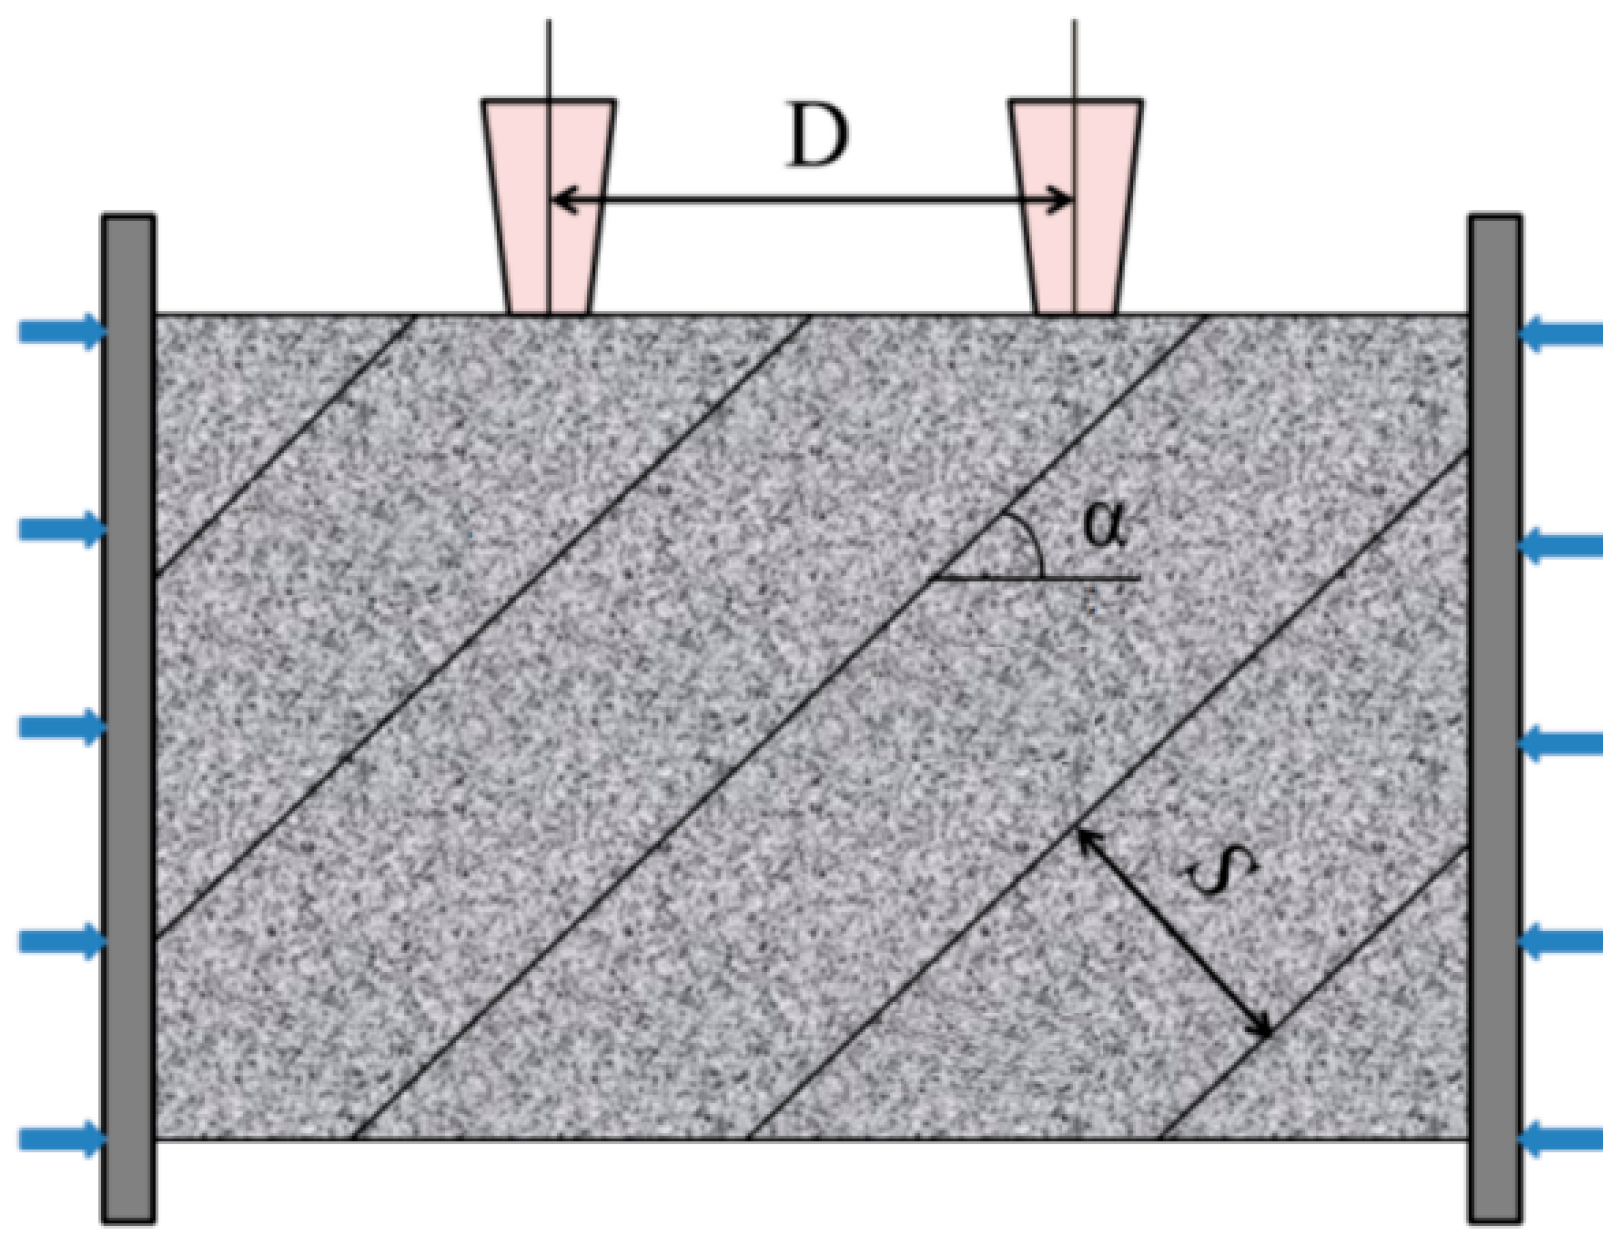
The primary variables in this experiment include the spacing of the cutting tools, the dip angle of the joints, and the joint spacing. To simulate jointed rock masses under varying conditions, water jets were employed to cut through granite plates, creating vertically oriented joints. The experimental design followed an orthogonal testing approach. Joint dip angles were set at 0°, 30°, 45°, 60°, and 90°, joint spacing (D) was configured at 30 mm, 40 mm, 50 mm, 60 mm, and 70 mm, and cutting tool spacing (S) was established at 60 mm, 80 mm, 100 mm, and 120 mm. A total of 4 × 5 × 5 sample combinations were prepared for comparative testing to ensure the reliability and accuracy of the experimental data. The corresponding parameters of the rock samples are presented in Figure 2 [17,18]. It should be noted that in the following text, the symbol α denotes the joint dip angle, S denotes the joint spacing, and D denotes the cutter spacing.
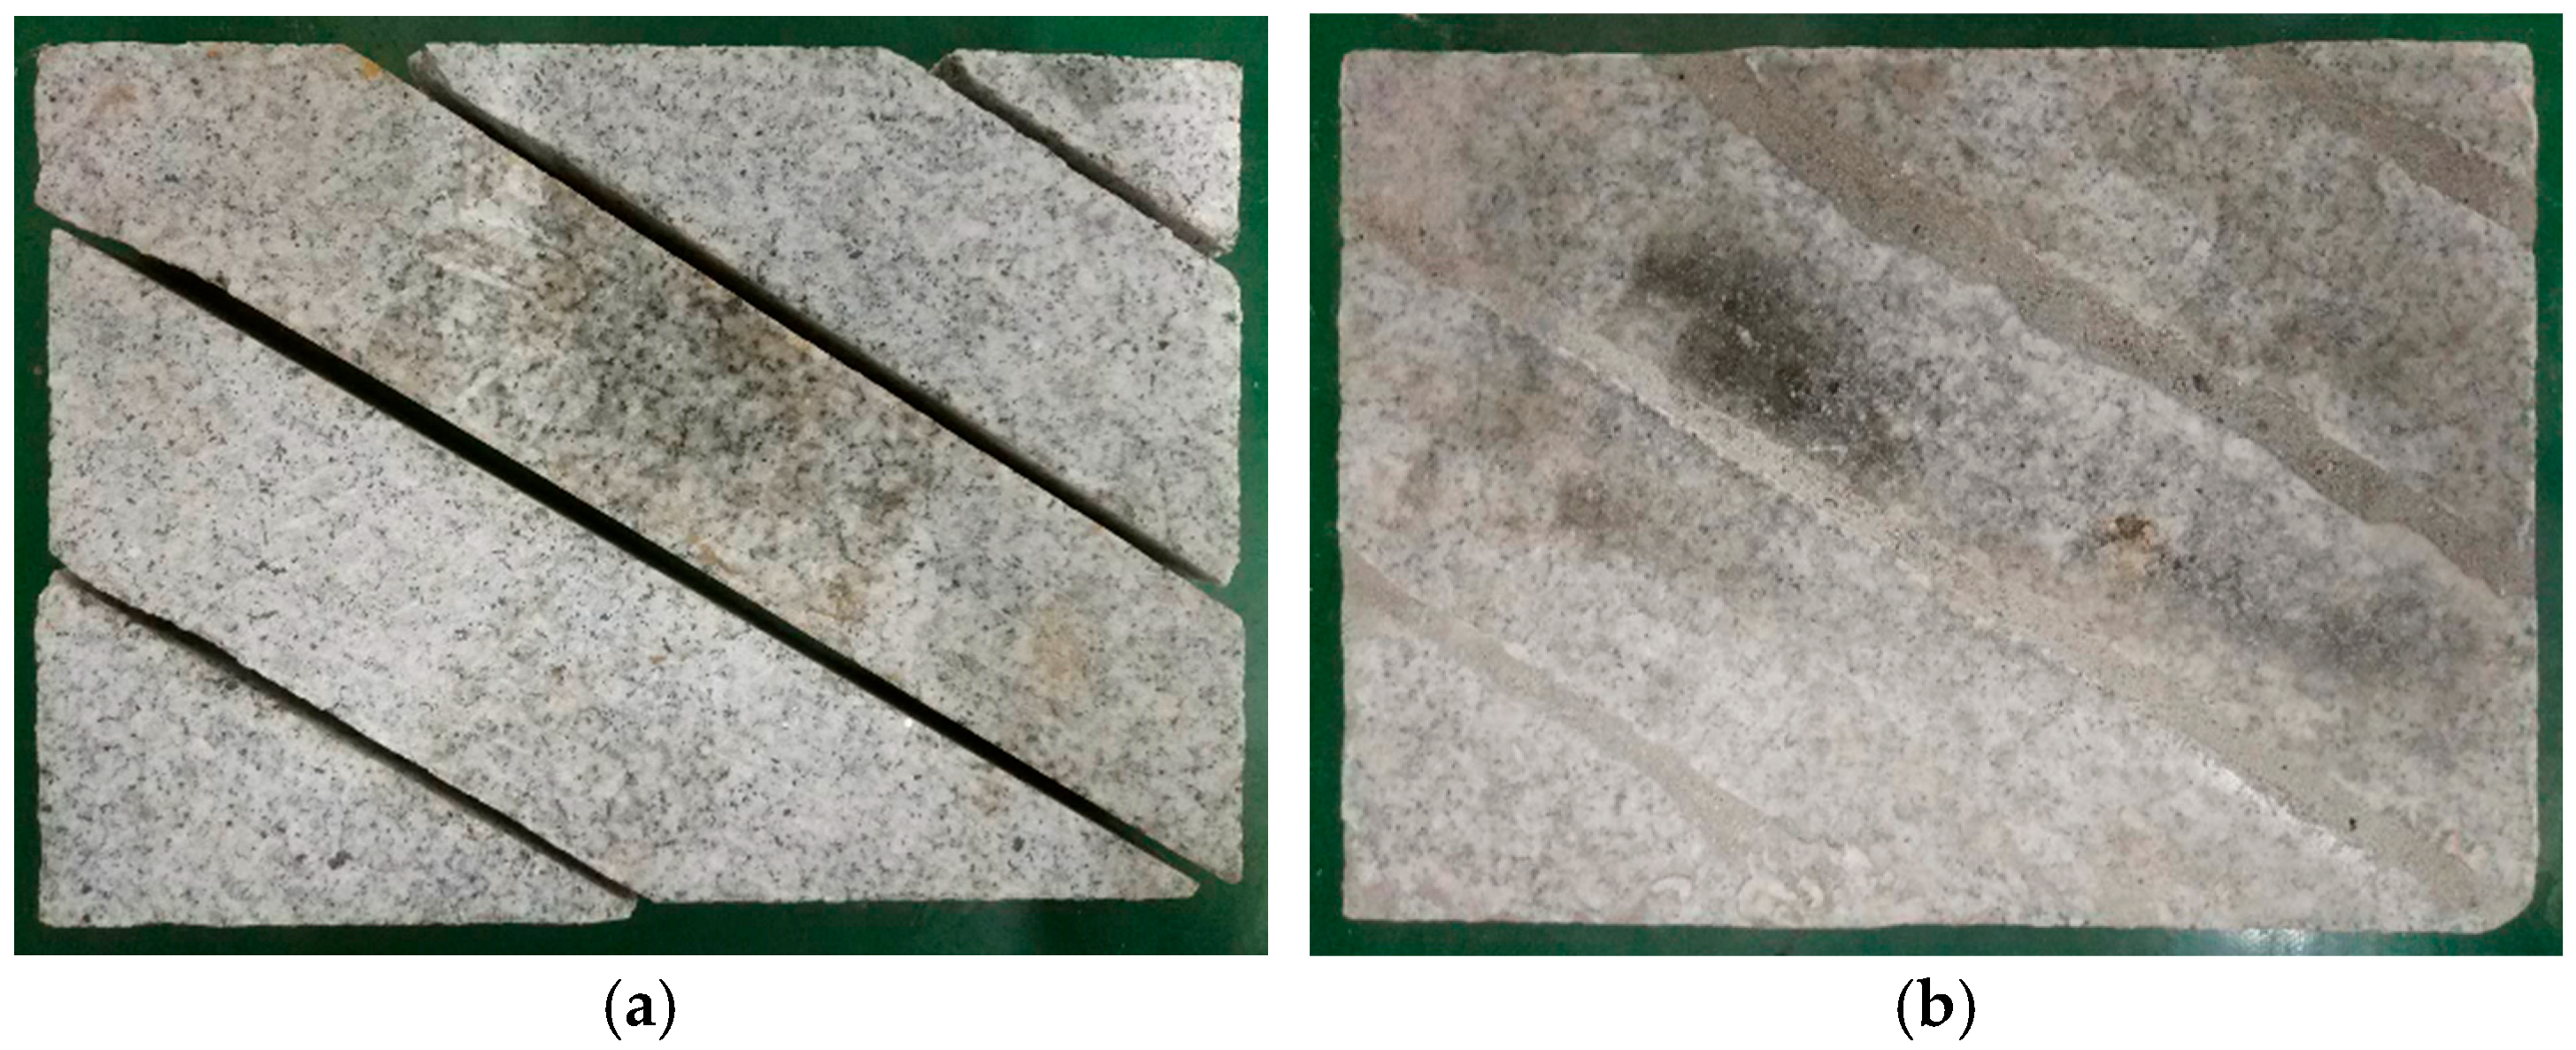
The joint surfaces in the rock mass used in this test were artificially fabricated and bonded using cement mortar. The mortar mix mass ratio was set as cement: water: fine sand: water reducer = 1:1.5:0.4:0.15. The cement used was of grade 32.5R, and the fine sand had a particle size entirely below 0.5 mm, obtained by sieving through a mesh with an aperture size of less than 0.5 mm. Joints constructed with this mix ratio achieved the required strength after a standard 28-day curing period. Following the curing process, the rock surfaces were ground using a sandpaper disk angle grinder to ensure flatness of the rock samples. This step was critical to facilitate subsequent procedures such as painting and to enhance the accuracy of displacement and strain measurements. The resulting surface quality is illustrated in Figure 3.
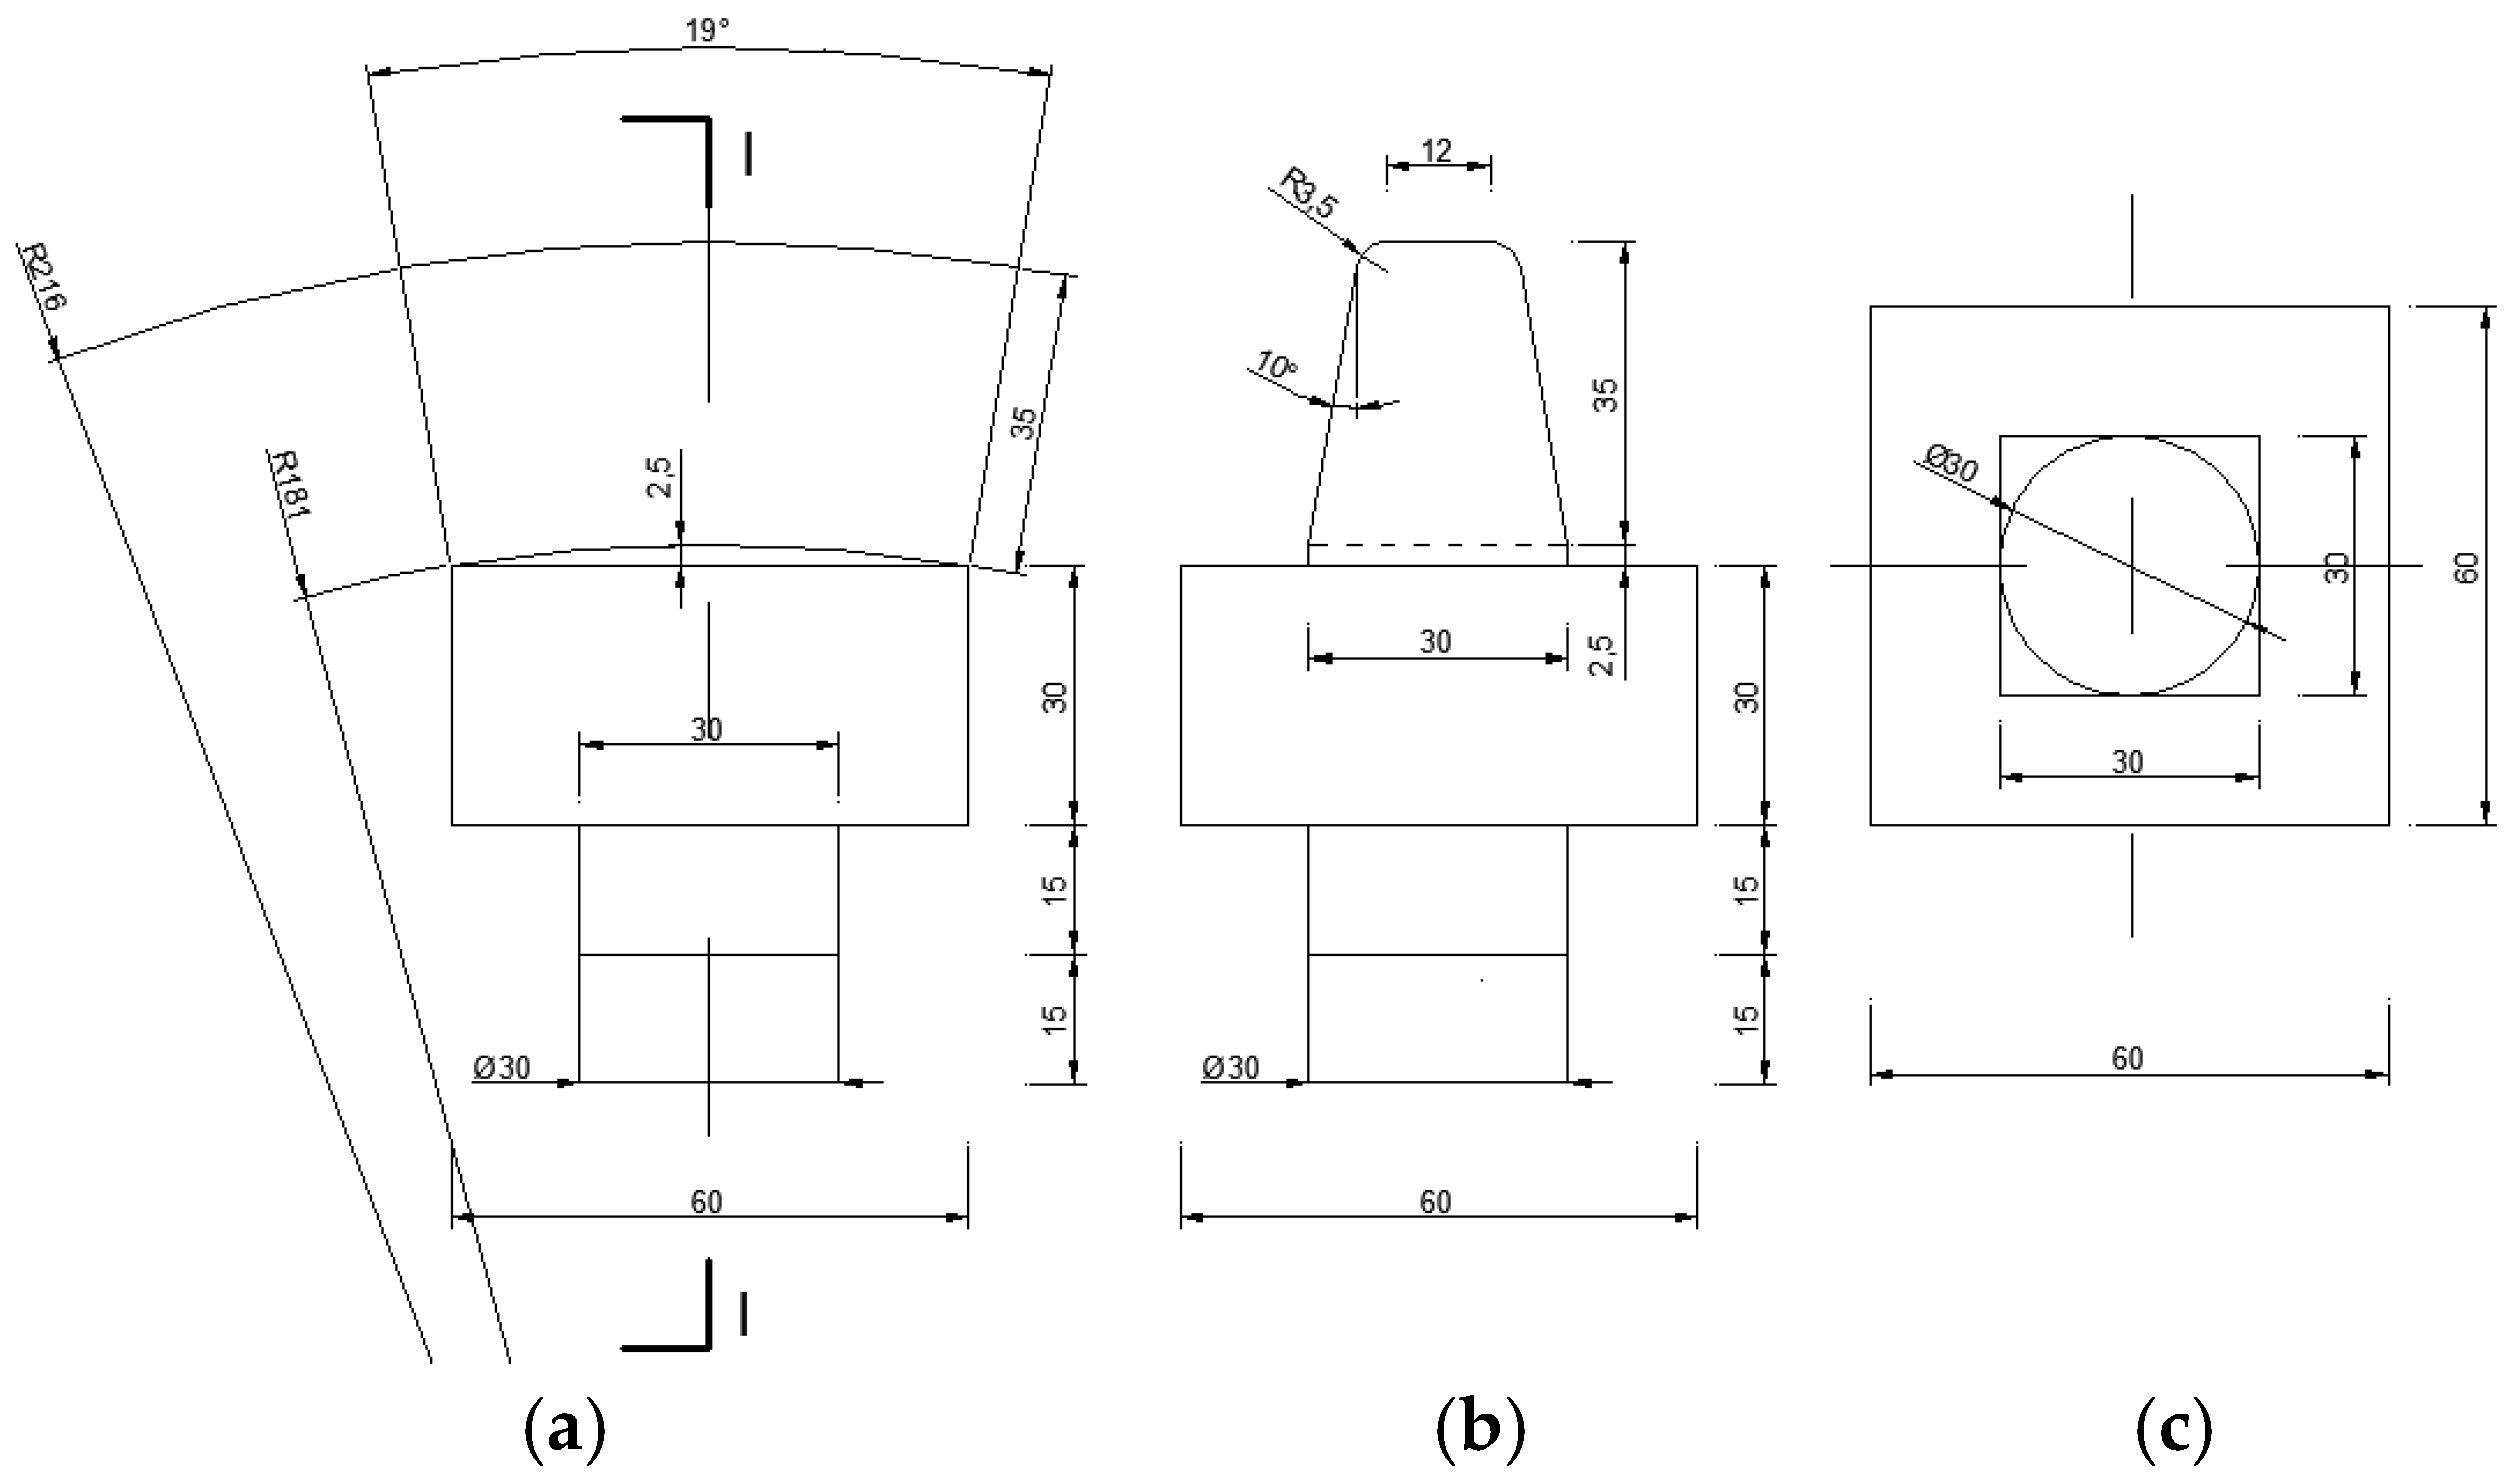
This test employed the static pressure method for axial loading, with lateral confining pressure applied simultaneously. The loading equipment used was the WDAJ-600 rock shear rheological testing machine. The oil cylinder of the testing machine can provide a maximum axial and lateral load of 600 kN, with a loading rate adjustable between 0.1 and 100 kN/min and a deformation rate adjustable between 0.001 and 10 mm/min. The maximum displacement capacity is 30 mm. The frame frequency of the camera is 60 fps. As this was an indoor model test, it was necessary to replicate the cutting tools used in the TBM tunneling process. In the static pressure test, the rotation of the cutterhead was not considered. Therefore, the cutting tools used in this test were designed based on the specifications of a 17-inch constant cross-section disk cutter commonly used in TBMs. The disk cutter was arranged at a central angle of 19° in a double-blade configuration. Its strength, dimensions, and other relevant parameters were consistent with those of actual TBM disk cutters. The material used was H13 high-hardness mold steel, commonly employed for TBM cutters, with a Rockwell hardness ranging from 45 to 55 HRC. The cutting-edge angle of the cutter was 20°, and the tip width was 12 mm. A square base was installed beneath the cutter, which was mounted on the sliding rail at the axial loading end of the test bench and secured with a nut. In this study, the laboratory tests adopt a reduced-scale TBM cutter model, which inevitably induces certain scale effects and inherent limitations. First, geometric scaling changes the cutter tip geometry, contact morphology and cutting configuration, leading to inconsistent interfacial contact conditions compared with the full-scale prototype. Second, the reduced model cannot fully replicate the in situ stress level, natural joint distribution and fracture characteristics of field rock masses, which alter the rock fragmentation mechanism and failure mode during cutting. Since this paper mainly investigates the optimal cutter spacing suitable for rock breaking by disk cutters under different joint dip angles and joint spacing, and aims to obtain the variation trend of the optimal cutter spacing with joint geometric parameters, the influence of scale effect is not considered in this study. This design facilitated the adjustment of cutter spacing under various test conditions. The detailed design dimensions of the cutterhead are illustrated in Figure 4.
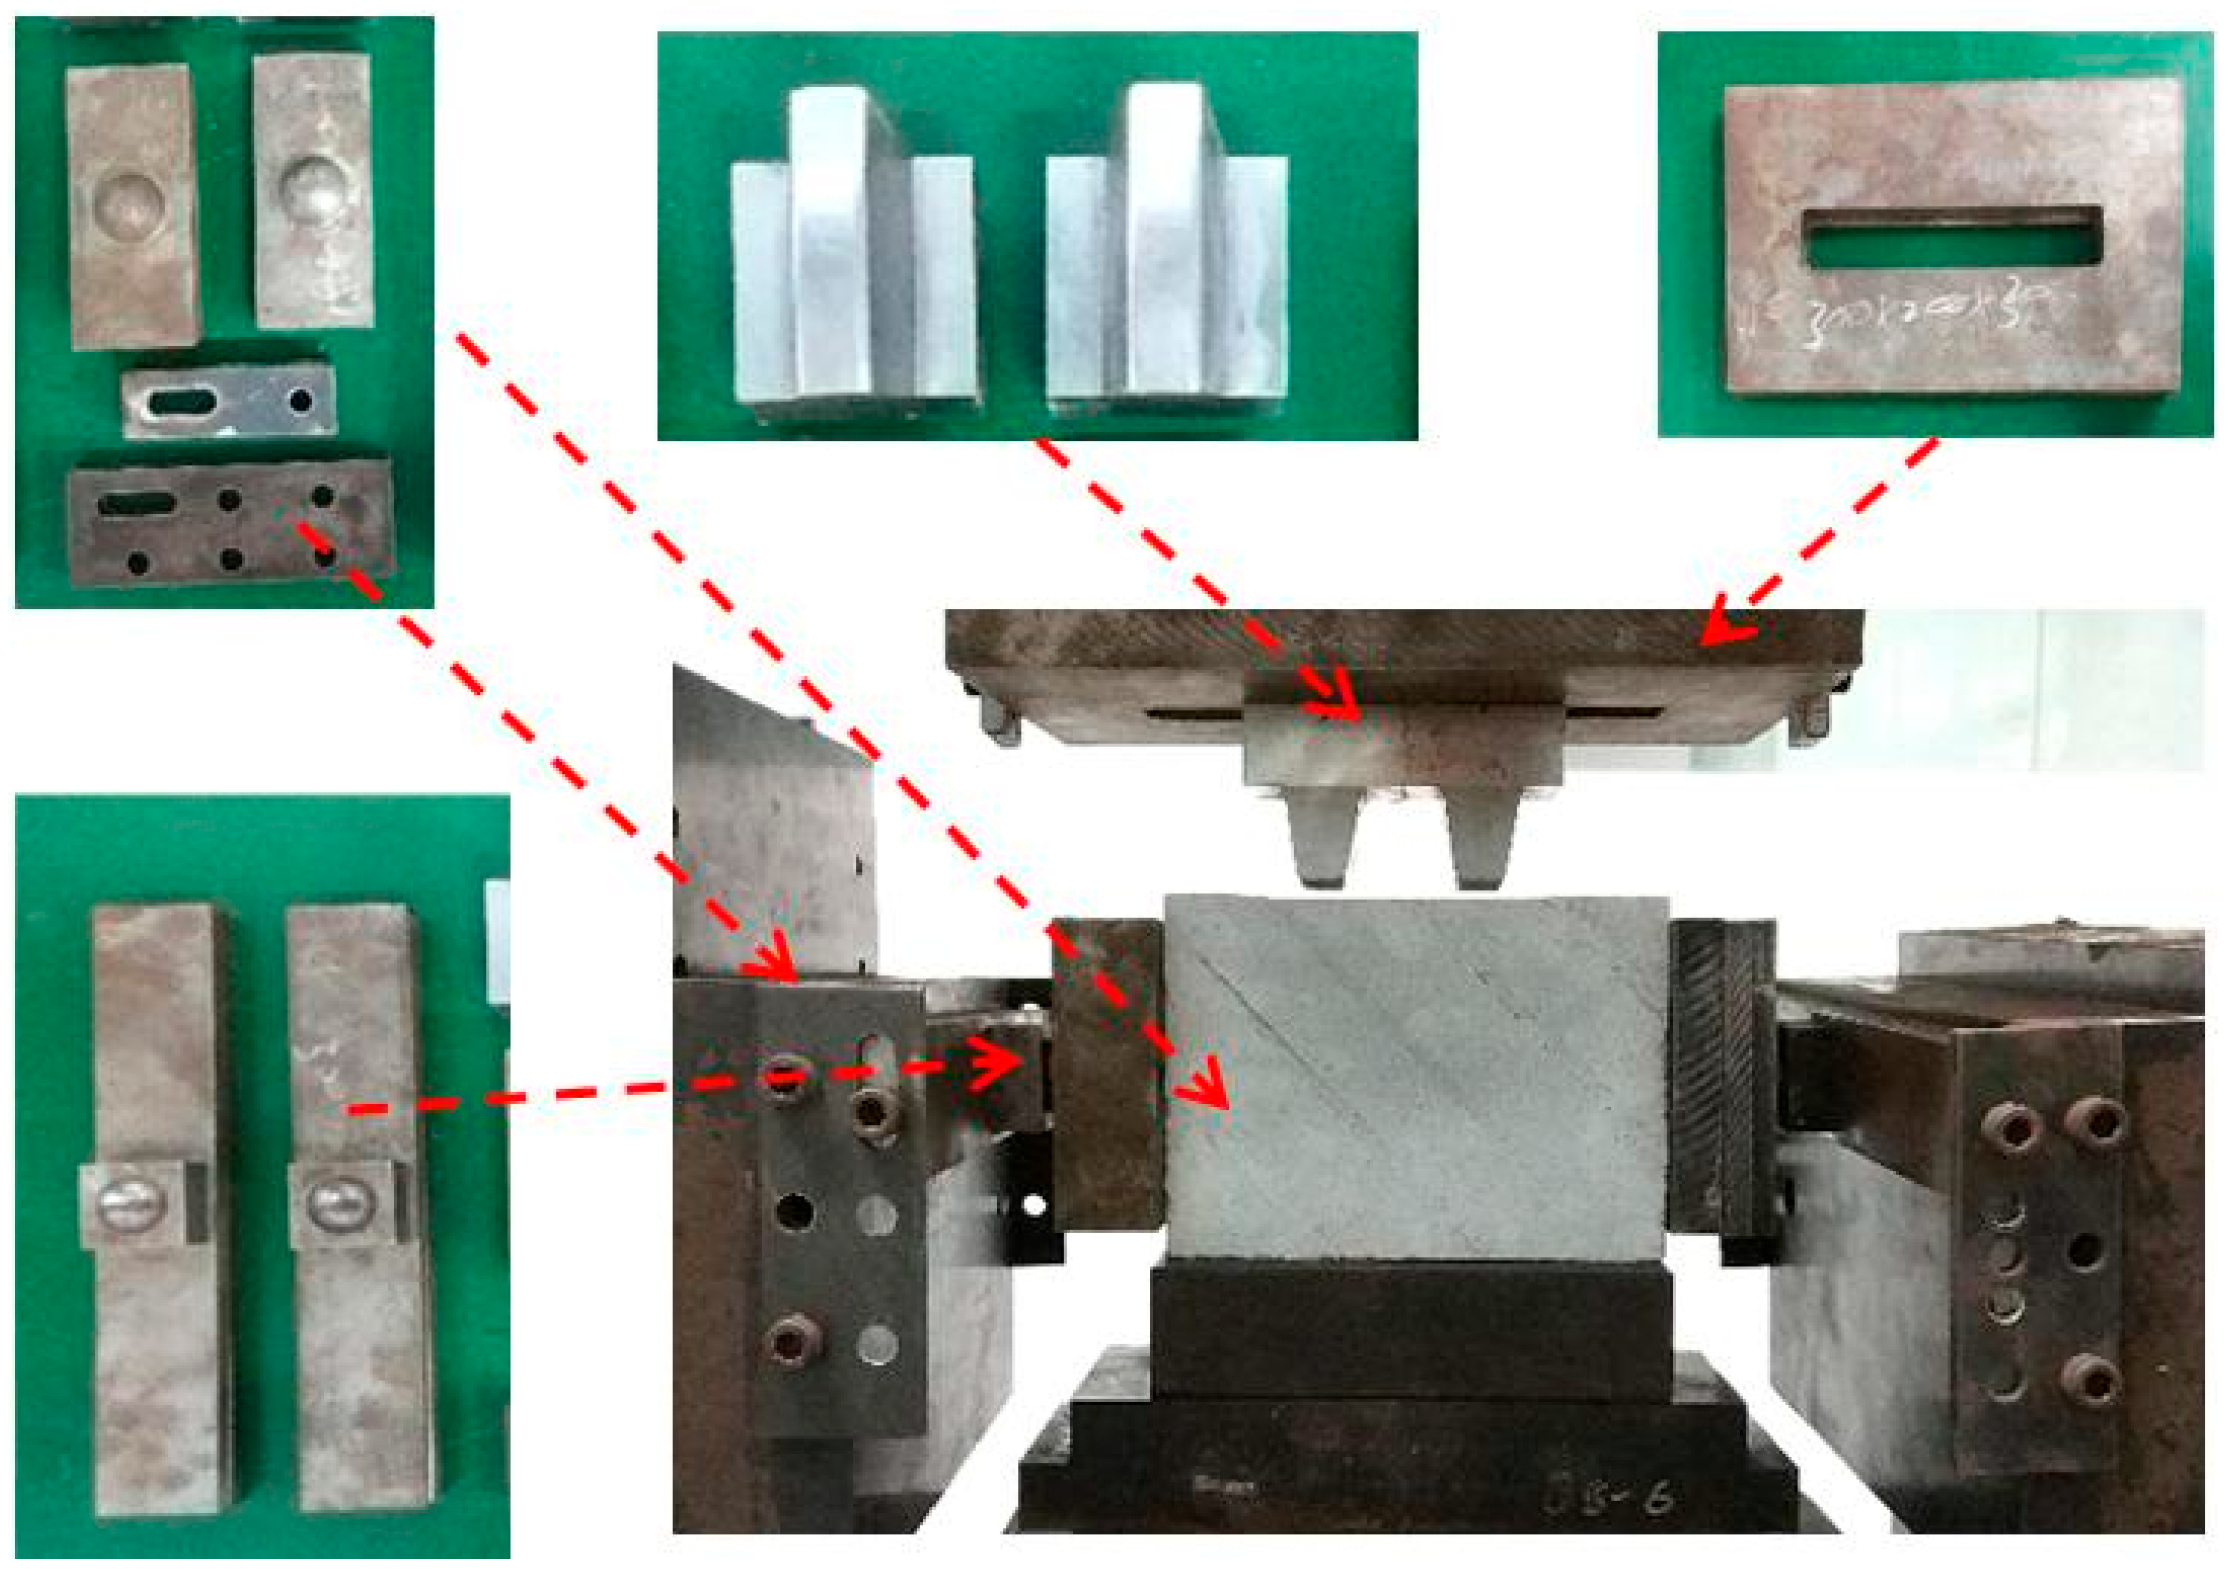
In addition, to ensure the safety of the testing process and the accuracy of the results, a series of fixtures and clamps were specifically designed for the test setup, as illustrated in Figure 5. During the test preparation phase, the two roller cutterheads were first mounted onto the steel plate with slide rails, and the spacing between the cutters was precisely set. Subsequently, the rollers were securely fastened using nuts to prevent any variation in the cutter spacing during the test, which could lead to eccentric loading. The assembled steel plate was then rigidly connected to the axial loading end head of the test bench via a dedicated fixture. After the installation, the relative positions of the two rollers and the central axis of the loading end head were rechecked to ensure that the rollers were symmetrically positioned on both sides of the loading end head’s central axis. Next, the steel bars with hemispherical grooves were mounted onto the lateral loading end head of the test bench using fixtures, and the steel bars on both sides were adjusted to align horizontally. The grooves on the steel bars were connected to universal joint heads to ensure that the lateral loading end head of the test machine maintains full contact with the side surface of the specimen during the application of confining pressure, while simultaneously minimizing the eccentric pressure effect caused by the left and right hydraulic cylinders of the pressure machine. The final assembly configuration of the test bench and the placement of the rock sample are shown in Figure 5.
Before the formal test, a uniformly distributed horizontal load of 10.5 kN was applied to the side of the specimen by the transverse hydraulic cylinder of the microcomputer-controlled testing machine, to simulate a confining pressure of 2.5 MPa in shallow strata. Afterwards, a preload of 1 kN was applied vertically to the specimen and maintained for 5 min to stabilize the specimen state. At the start of the formal test, the vertical hydraulic cylinder and the CCD camera were activated simultaneously, ensuring the time error between cutter loading and formal recording was within 0.5 s. During the test, displacement control was adopted for the vertical hydraulic cylinder with a loading rate of 0.5 mm/min. Meanwhile, force control was applied to the transverse hydraulic cylinder to keep the lateral confining pressure constant at 2.5 MPa. The loading was terminated when the penetration depth of the disk cutter reached 10 mm. After the test, the broken rock debris was collected, the debris and the residual specimen were weighed, and the failure morphology of the specimen was photographed to facilitate subsequent analysis of experimental data. During the test, the loading conditions of the test bench were controlled through the operation of the testing machine’s mainframe. The primary control parameters included the lateral confining pressure applied to the specimen and the axial penetration speed of the roller cutter. Simultaneously, the mainframe was capable of monitoring and recording, in real time, the axial load, displacement, and lateral confining pressure during the roller cutter’s penetration into the rock mass.

3. Analysis of the Infiltration Force Fluctuation During the Penetration

3.1. Analysis of the Infiltration Force Fluctuation During the Process of Rolling Tool Penetration

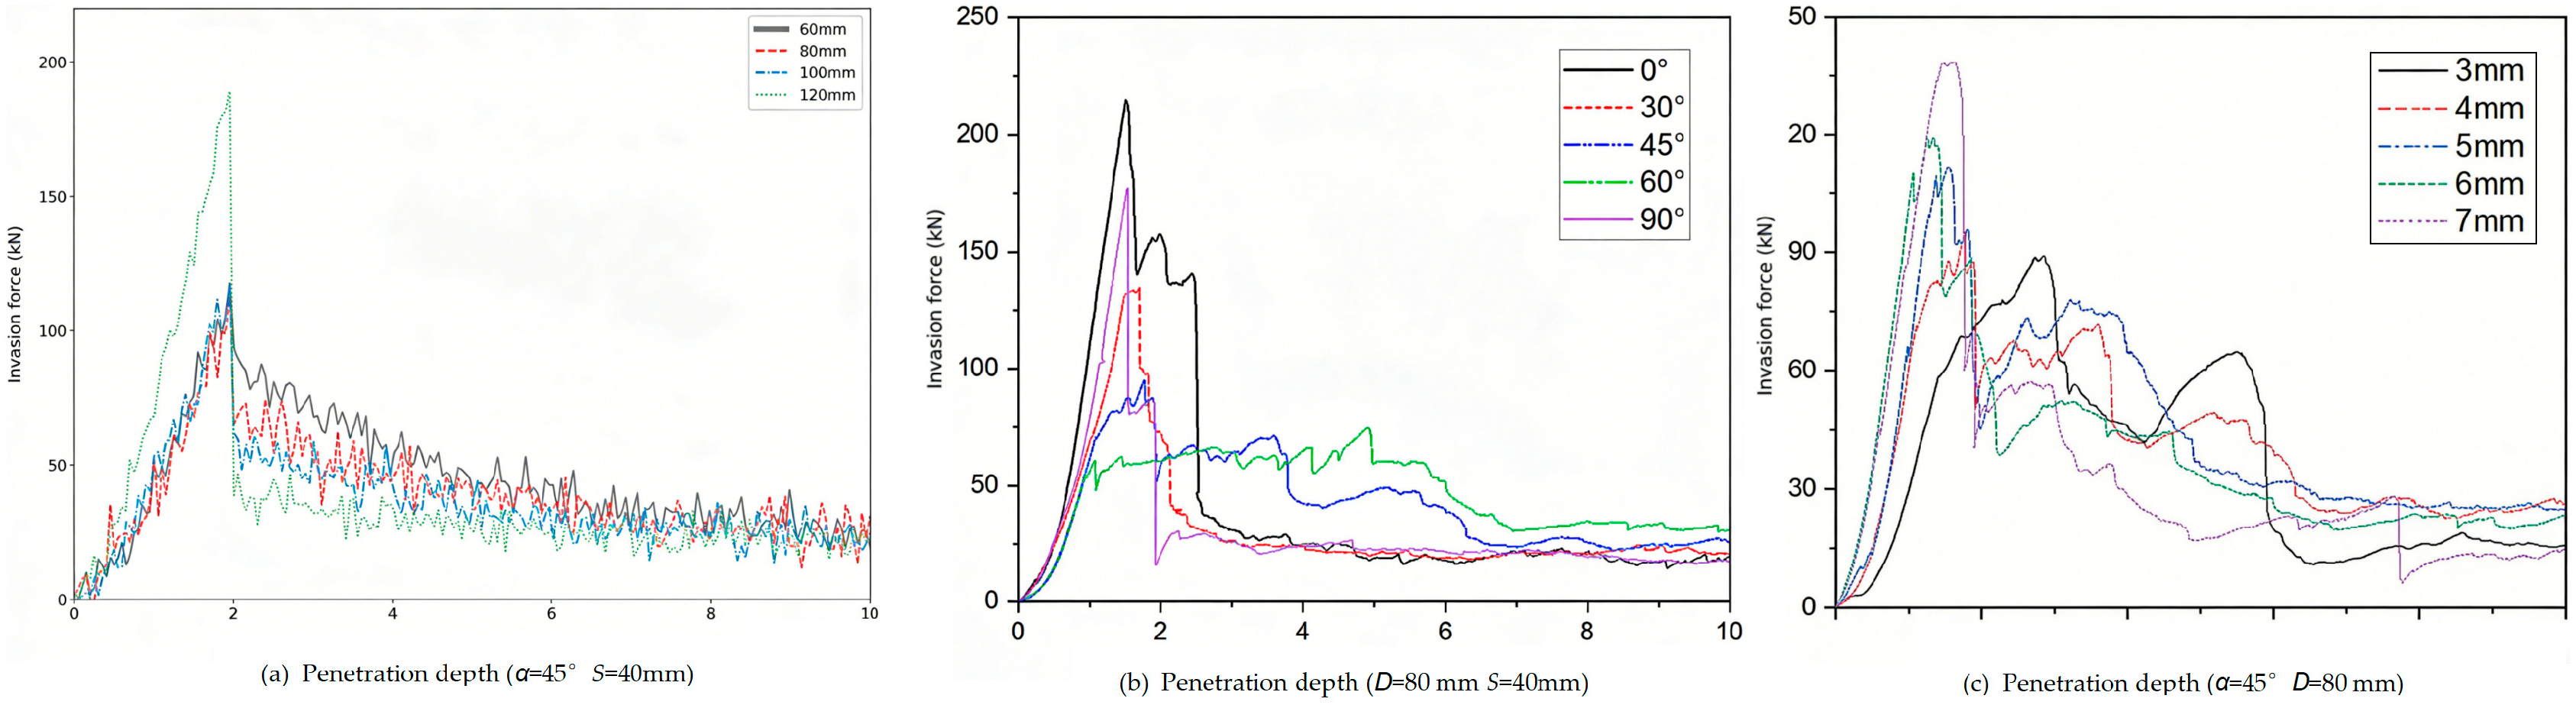
During the penetration of a double-tapered cutter into jointed rock mass, the vertical penetration force was monitored using a shear rheological testing instrument. Based on the collected data, curves representing the relationship between penetration force and depth under varying cutter spacings and joint conditions were plotted, as illustrated in Figure 6. These curves were analyzed in terms of their fluctuation and oscillation characteristics to reveal the evolution of loading behavior under changing test conditions.
For rock masses subjected to penetration under the same joint conditions but with different cutter spacings, the penetration force curves did not exhibit abrupt drops. Instead, after reaching peak force, the curves displayed oscillatory behavior before the rock failure was completed. As the cutter spacing increased, the elastic deformation phase of the jointed rock mass became more pronounced, and a greater amount of energy was released following the peak penetration force.
Further analysis of rock masses under various joint conditions and cutter spacings revealed that, unlike intact rock masses, jointed rock masses exhibited a distinct residual transition phenomenon during failure. This residual transition is characterized by the formation of a dense core beneath the cutterhead during penetration. The propagation of cracks near this core leads to a sudden release of accumulated deformation energy, which is converted into energy for rock disintegration, resulting in oscillations in the penetration force curve. This cyclic process of energy accumulation and release gives rise to a residual transition stage in the curve. This section presents a detailed analysis of how cutter spacing and joint conditions influence the rock-breaking process, based on the fluctuation characteristics and residual load behavior of the penetration force curves.
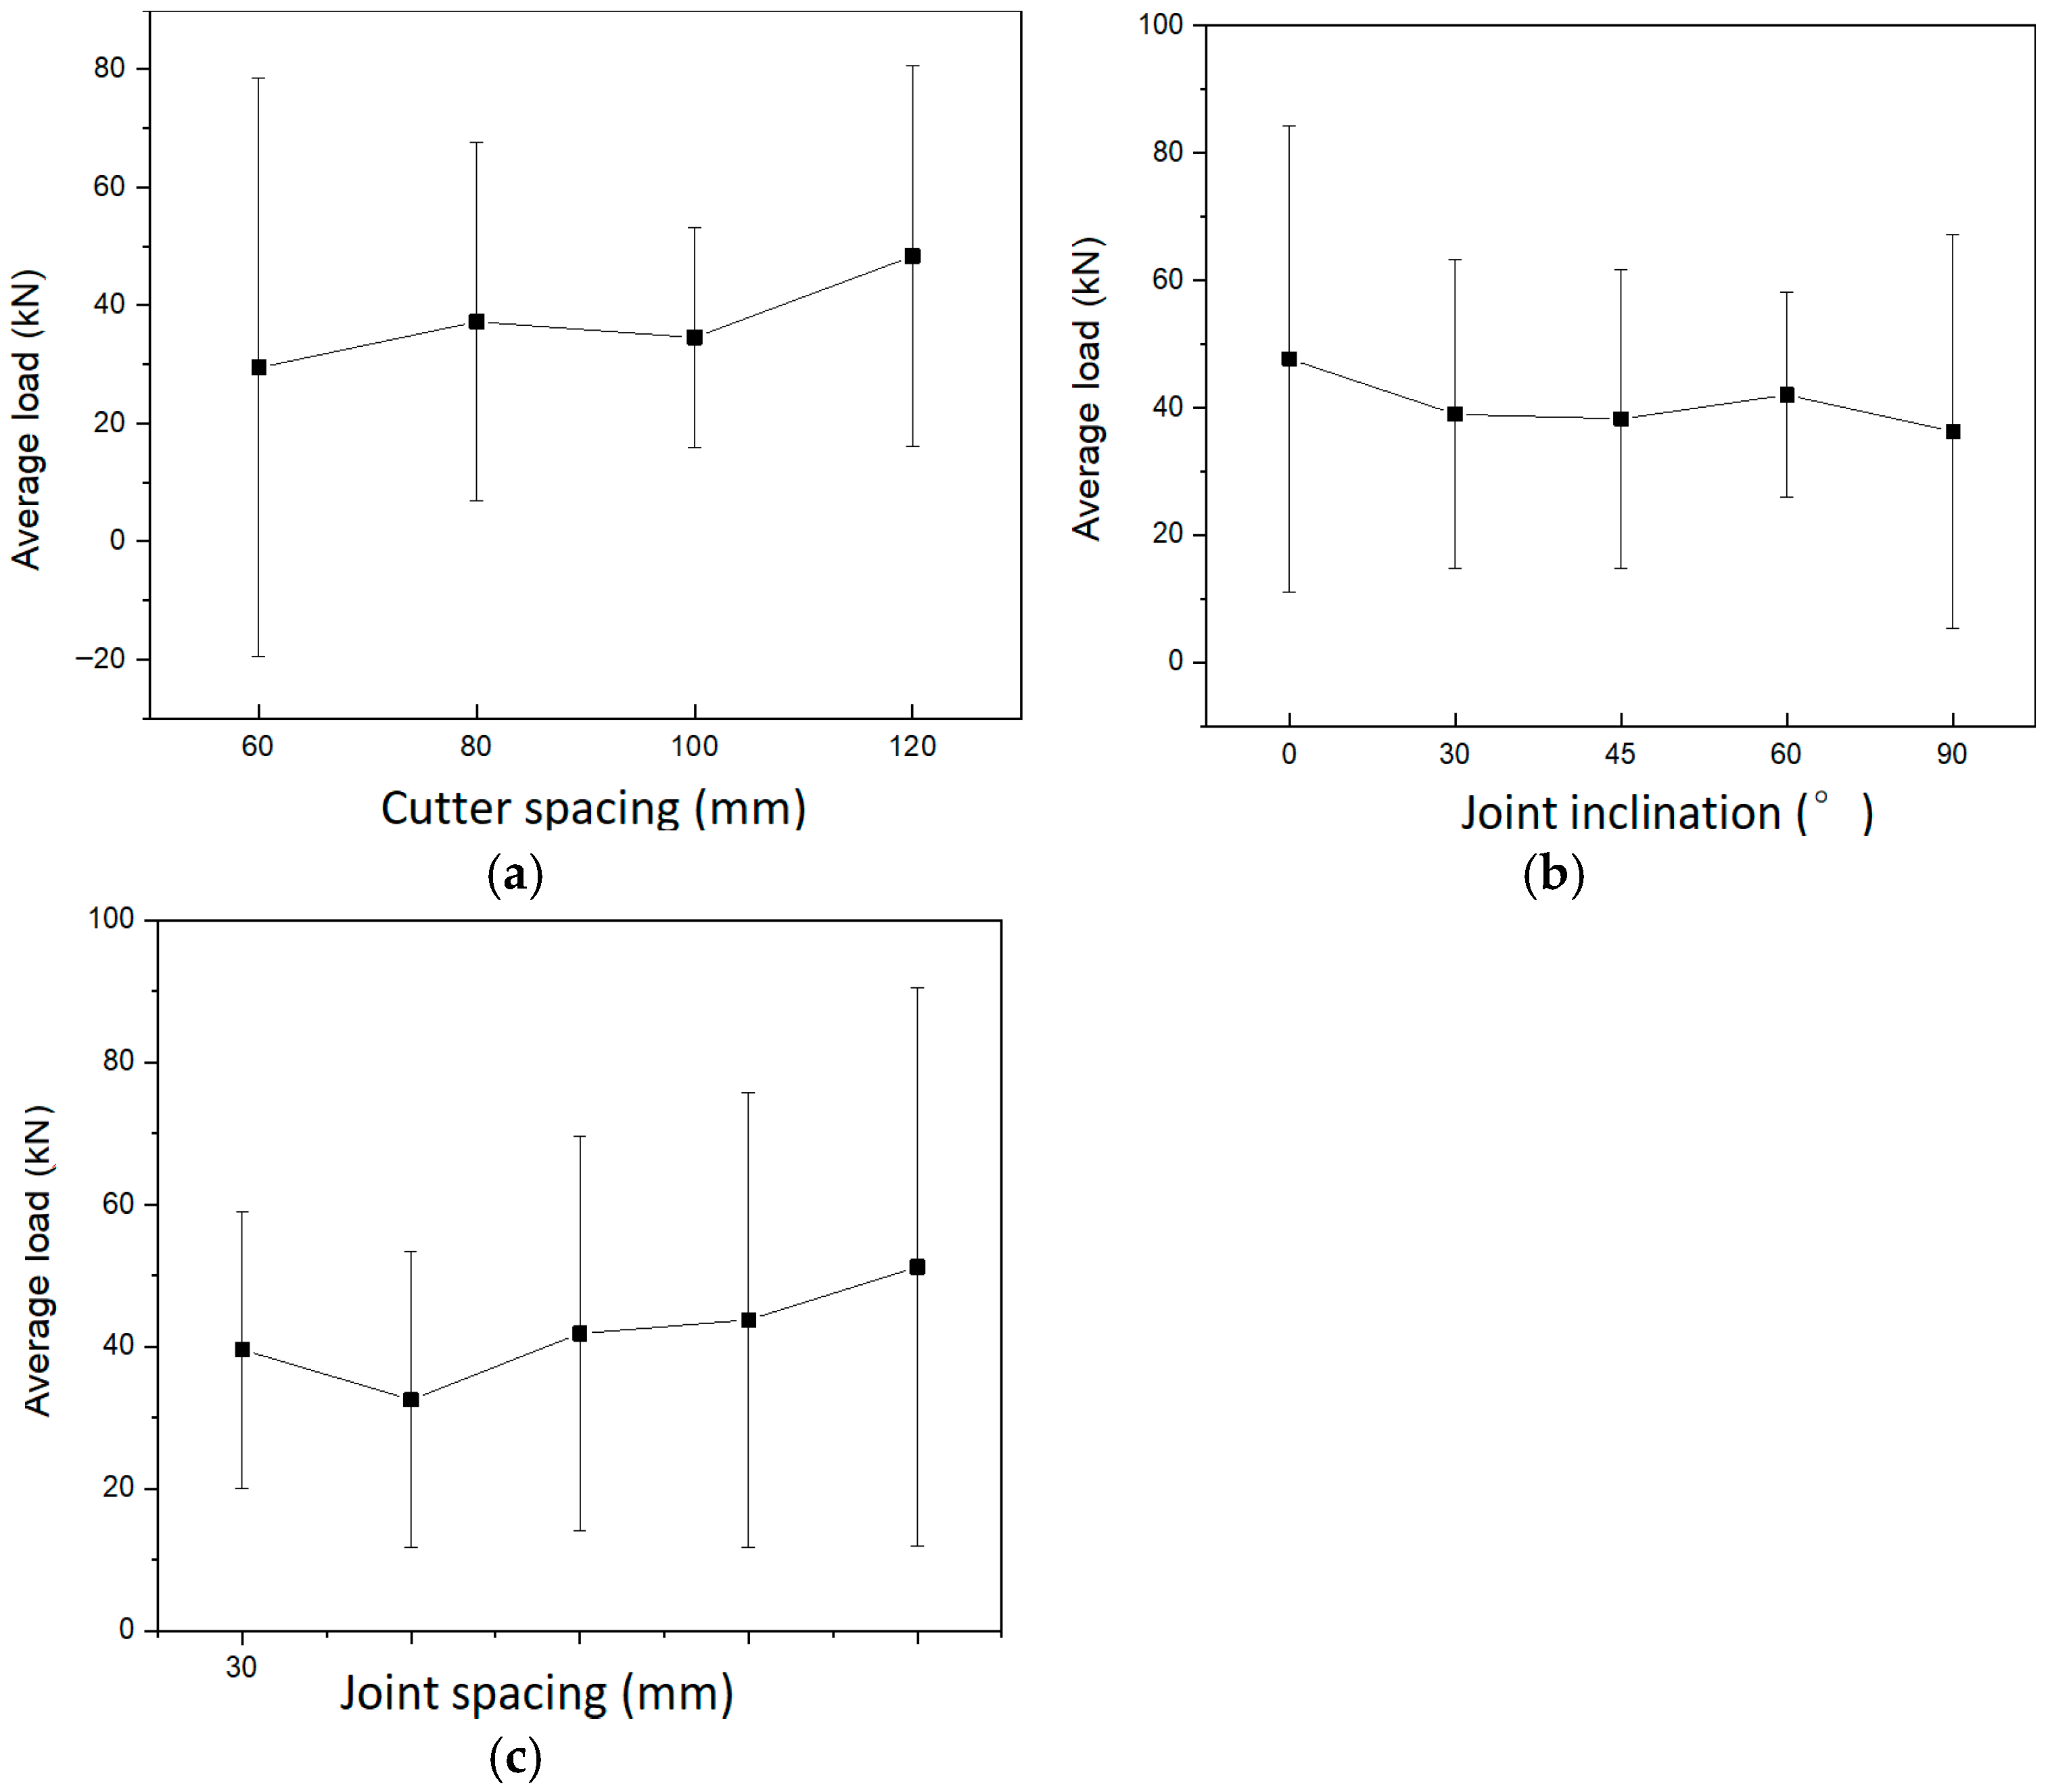
To further analyze the load evolution characteristics during the cutter penetration process, this paper calculates the average intrusion force during rock fragmentation based on intrusion force data corresponding to different penetration depths of the cutter, as illustrated in Figure 7. Average intrusion force and its standard deviation are widely adopted to evaluate the rock-breaking efficiency of TBM cutters because they jointly reflect both load intensity and process stability. The average intrusion force indicates the overall load level required for rock fragmentation, directly relating to cracking efficiency and energy consumption. A higher mean force generally promotes rock fracture and improves cutting efficiency. Meanwhile, the standard deviation characterizes force fluctuation and operational stability. Large fluctuations imply severe vibration and impact, which reduce working stability and accelerate cutter wear. Together, these two indicators provide a comprehensive and objective evaluation of rock-breaking performance. Based on the average intrusion force, the standard deviation of the intrusion force during the rock fragmentation process is computed. This metric reflects the extent to which the intrusion force deviates from the mean value, thereby indicating the stability of the load applied to the rock mass during the loading process. As shown in Figure 7, the average intrusion force does not exhibit a clear pattern with respect to variations in tool spacing, joint inclination angle, or joint spacing. The average intrusion force ranges between 35 kN and 45 kN. However, the standard deviation of the intrusion force demonstrates a discernible trend. When the tool spacing is 100 mm, the standard deviation reaches its minimum value. Deviations from this optimal spacing—either greater or smaller—result in an increase in the standard deviation. The standard deviation is smallest when the joint inclination is 60°. In contrast, when the joint inclination is 0° or 90°, the standard deviation of the intrusion force is significantly higher than for other joint inclinations, indicating greater load fluctuation under these conditions. As joint spacing increases, the fluctuation of the intrusion force gradually intensifies, and the force becomes increasingly unstable. Observations from the tests indicate that specimens with a high standard deviation in intrusion force tend to fail with a loud noise, accompanied by disintegration and a sudden drop in load. Subsequently, crack propagation slows down.
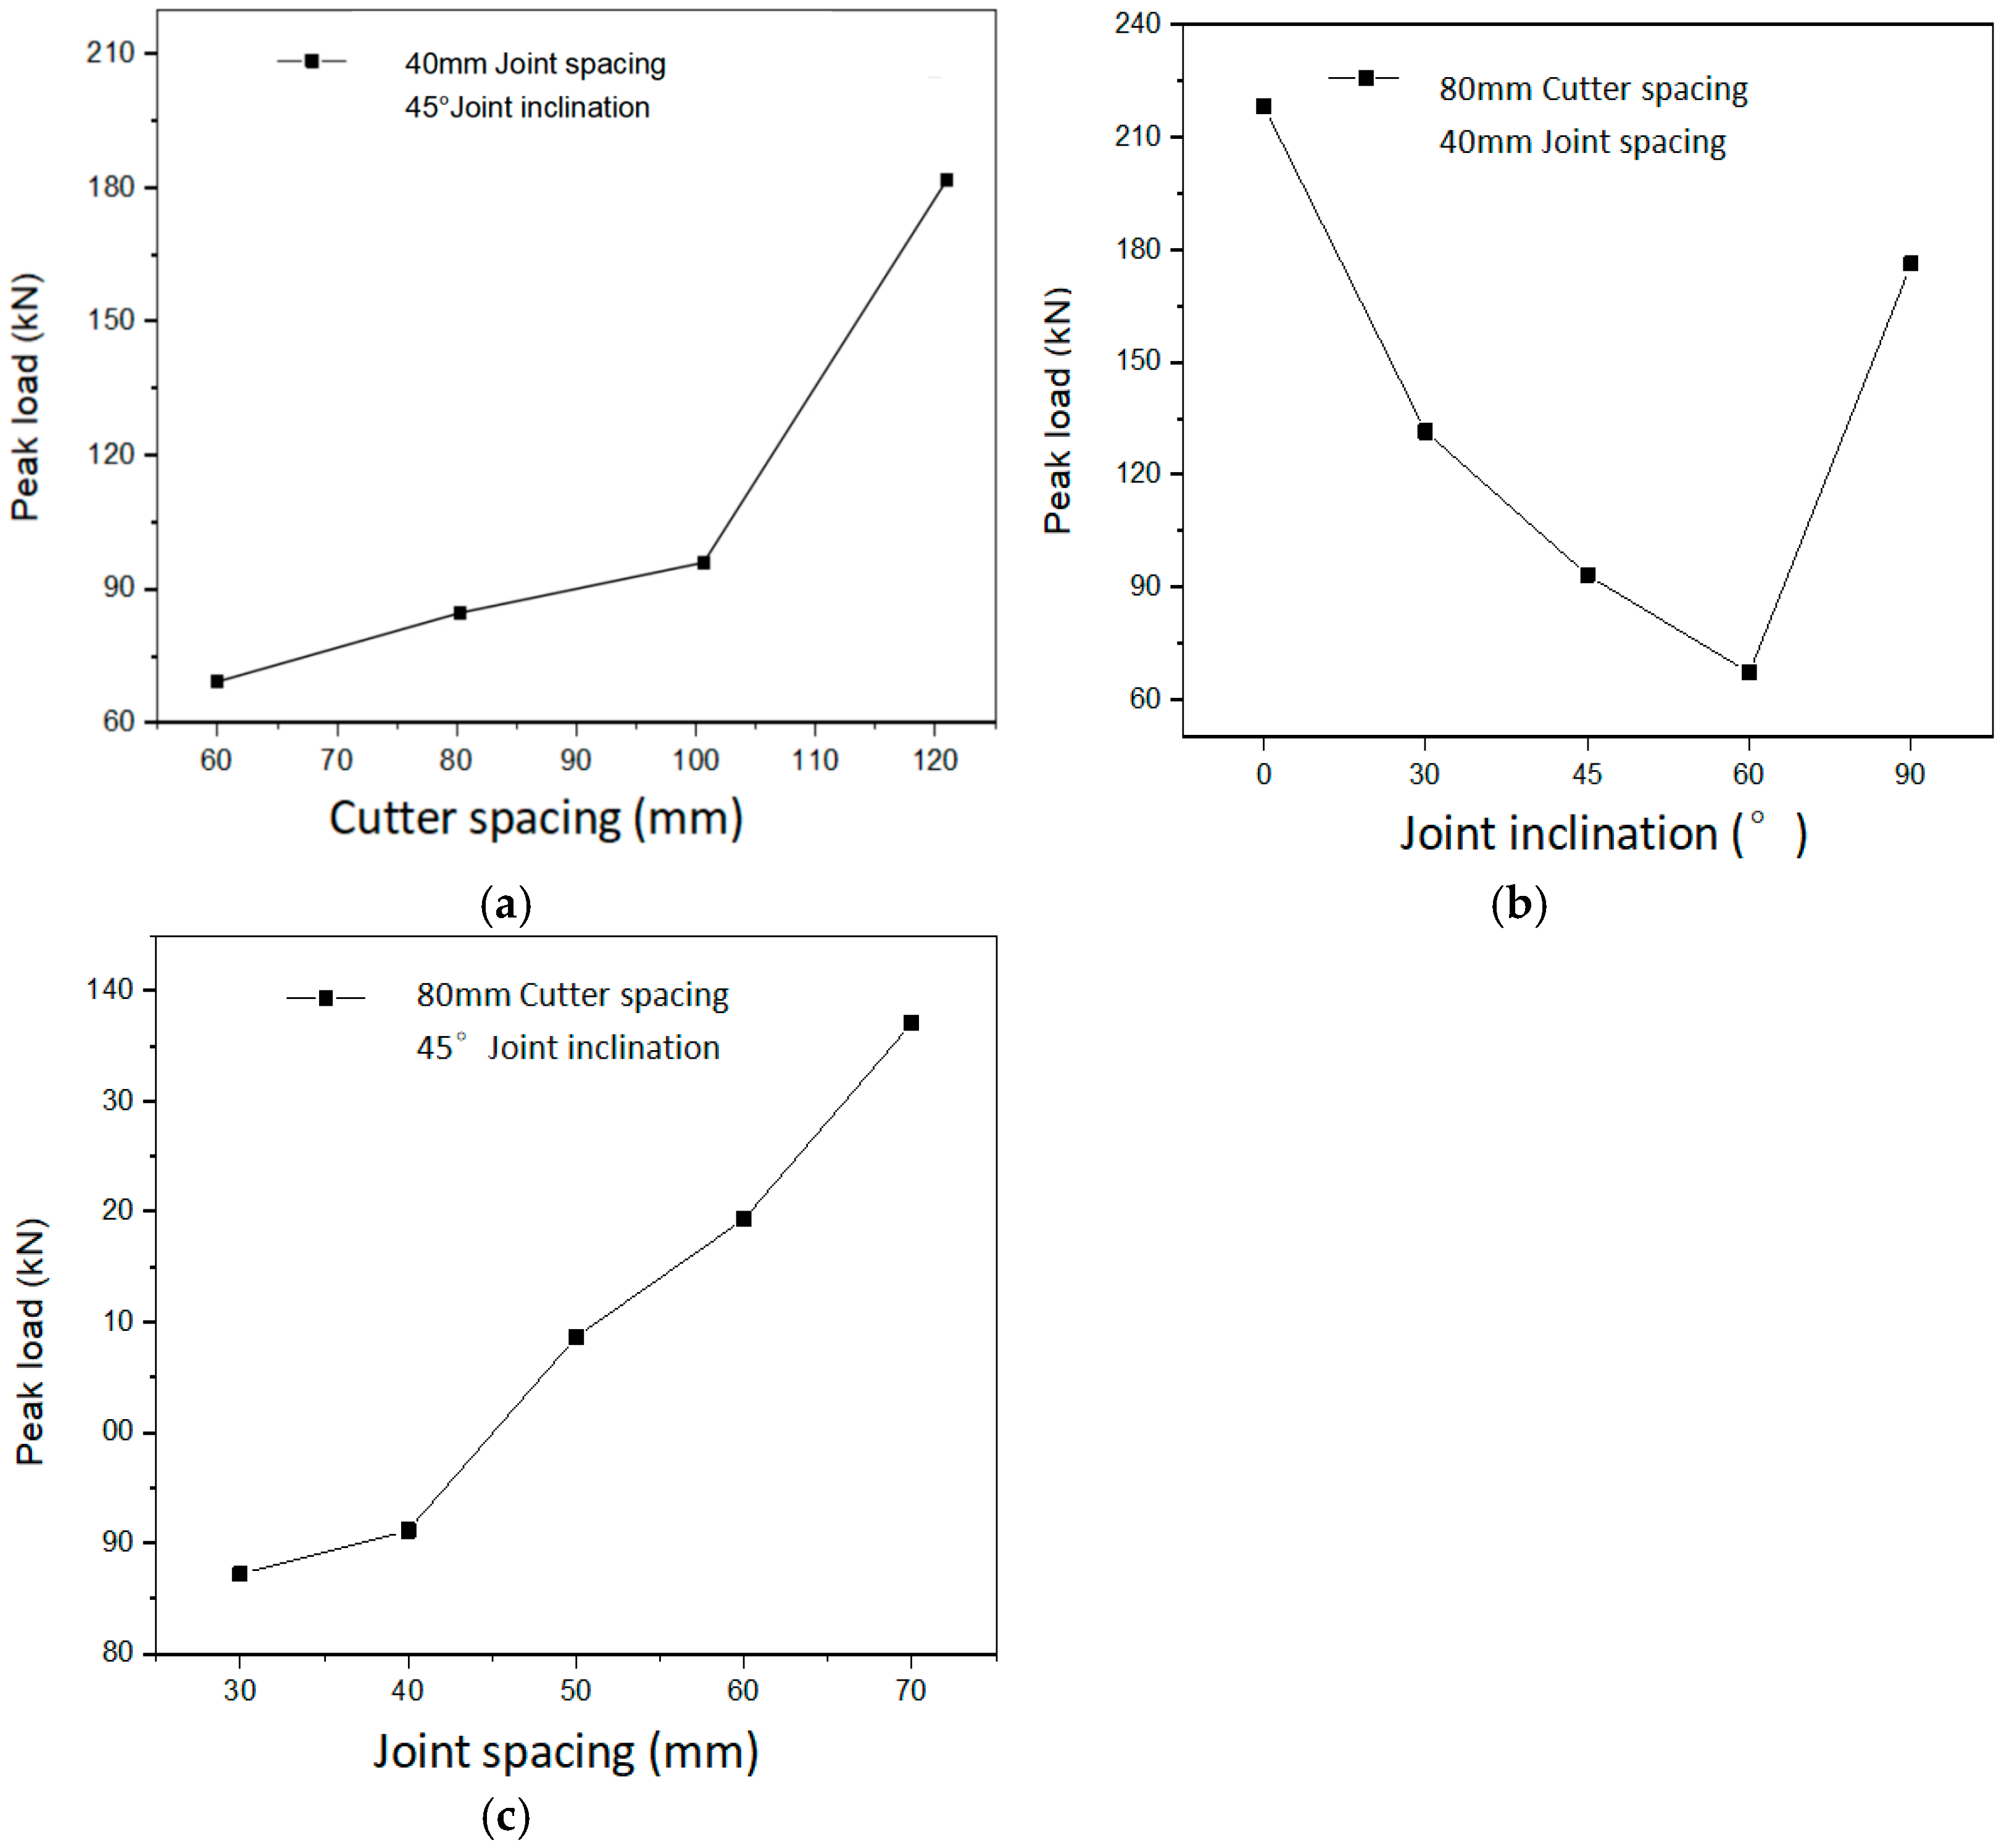
The peak value of the intrusion force serves as a critical parameter for evaluating load fluctuations, which corresponds to the maximum point on the intrusion force-penetration depth curve. When the intrusion force applied to the jointed rock mass exceeds this threshold, the internal structure of the rock mass is significantly compromised, leading to the formation of major cracks, a sharp increase in deformation, and a substantial reduction in load-bearing capacity. This study calculates the peak intrusion forces experienced by the rolling cutter during the intrusion process into the rock mass under varying joint conditions and cutter spacing, as illustrated in Figure 8. As shown in the figure, the peak intrusion force increases with increasing cutter spacing. Notably, when the cutter spacing reaches 120 mm, the rate of increase becomes more pronounced (Figure 8a). At this spacing, the cracks induced by the rolling cutters fail to coalesce, and rock mass failure is primarily attributed to the splitting effect caused by the penetration of the cutters. Given that the tensile strength of the rock mass is higher than its shear strength, the rock-breaking process dominated by tensile failure requires greater intrusion force, resulting in a higher peak value. When the cutter spacing is 120 mm, the mutual stress superposition between adjacent cutters is the strongest, which requires higher indentation force to initiate through-cracking between cutters, thus leading to the maximum peak indentation force. Furthermore, the data indicate that when the joint inclination angle is 60° (Figure 8b) or the joint spacing is relatively small (Figure 8c), the peak intrusion force exerted by the rolling cutter is comparatively lower. Under these joint conditions, the rock-breaking process involves a combination of tensile and shear failure mechanisms or is predominantly shear failure, which requires overcoming a smaller shear expansion component. Consequently, the peak intrusion force required for rock fragmentation is reduced. In addition, the joint orientation is highly consistent with the direction of the maximum shear stress induced by cutter penetration. This promotes shear slip and tensile crack propagation along joint planes, enabling rapid and stable through-cutting between cutters with the lowest specific energy, resulting in the best rock fragmentation performance.
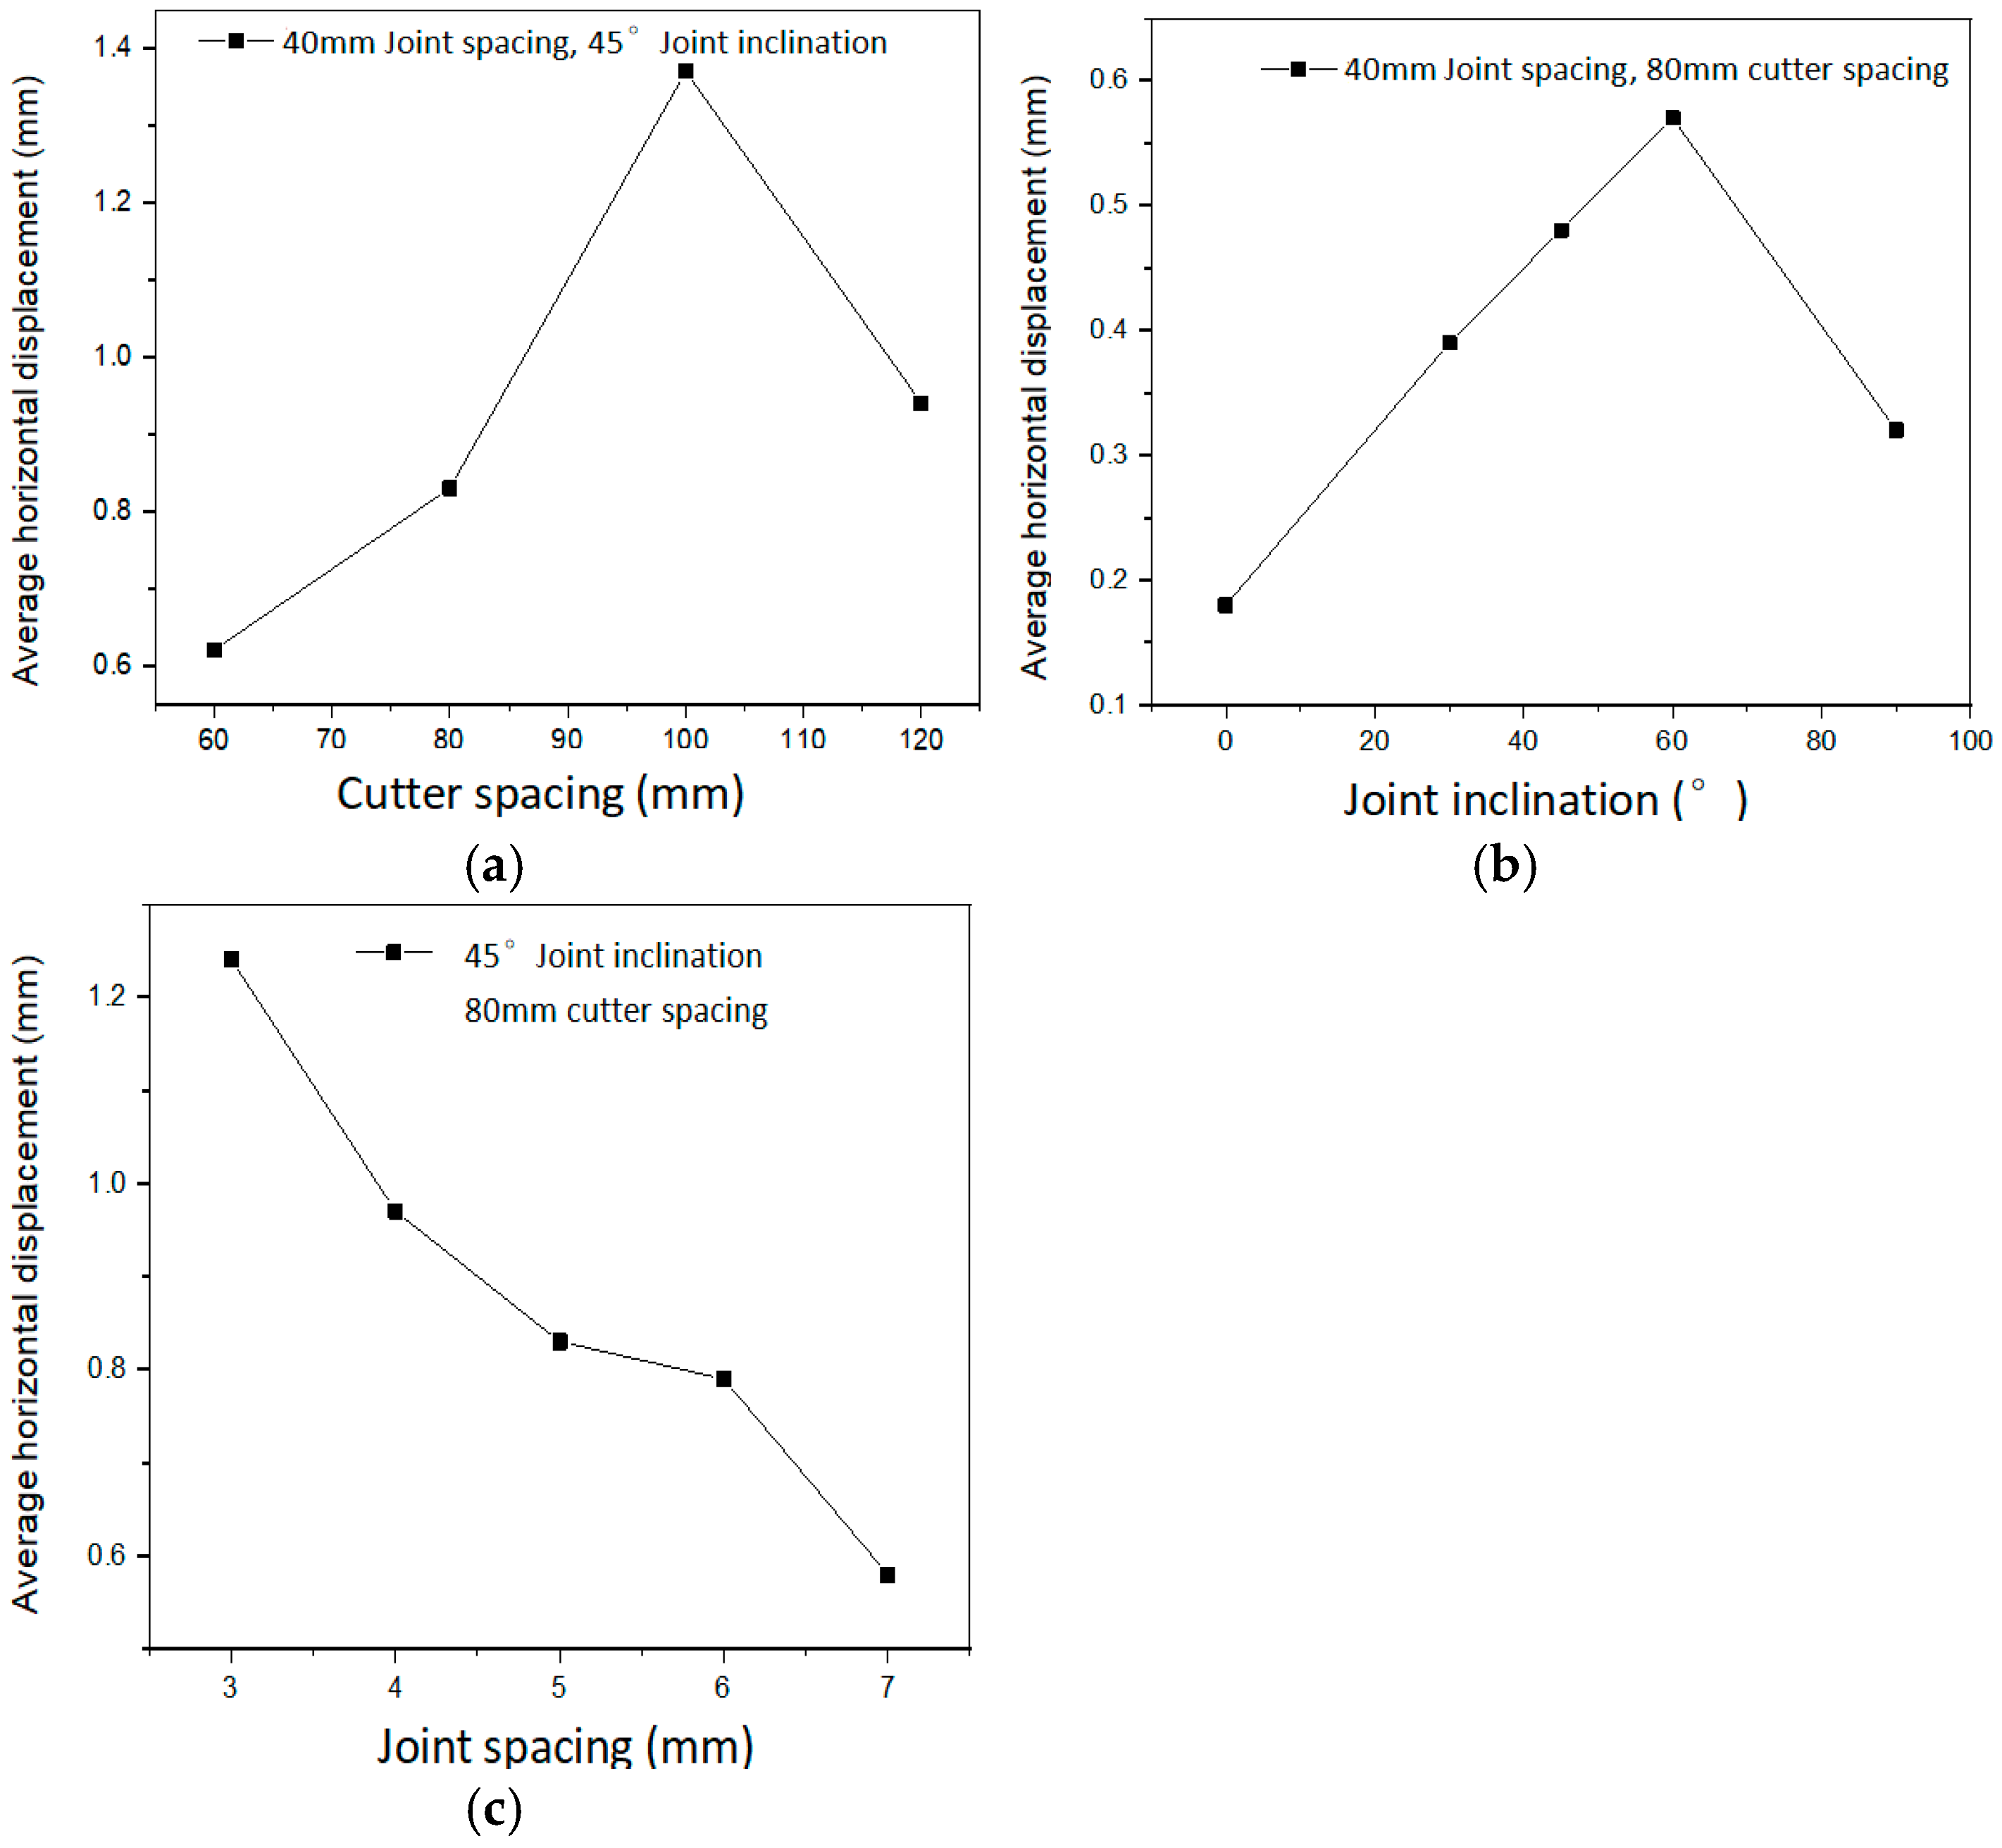
The deformation characteristics of the rock mass during the failure process, acquired using a two-dimensional strain acquisition system, were analyzed to evaluate the displacement and strain behavior of the jointed rock mass. The results indicated that variations in the intrusion force were closely related to the horizontal displacement of the rock mass. As shown in Figure 9, the average horizontal displacement of the rock mass surface was statistically analyzed under different tool spacings and joint conditions. It was observed that the maximum horizontal displacement occurred when the cutter spacing was 100 mm. Additionally, as the joint inclination increased from 0° to 60°, the horizontal displacement of the rock mass continued to increase. However, with further increases in joint spacing, the average horizontal displacement gradually decreased. Examination of the horizontal strain distribution revealed that specimens exhibiting larger horizontal displacements displayed significant strain concentration along the joint planes. This deformation behavior is primarily attributed to changes in cutter spacing and joint conditions. The vertical constraint imposed by the rolling cutters leads to lateral shear deformation, which promotes crack propagation and internal structural damage within the rock mass, thereby resulting in a reduction in the peak intrusion force.

3.2. Residual Load Analysis of Rock Mass During the Penetration of Cutters

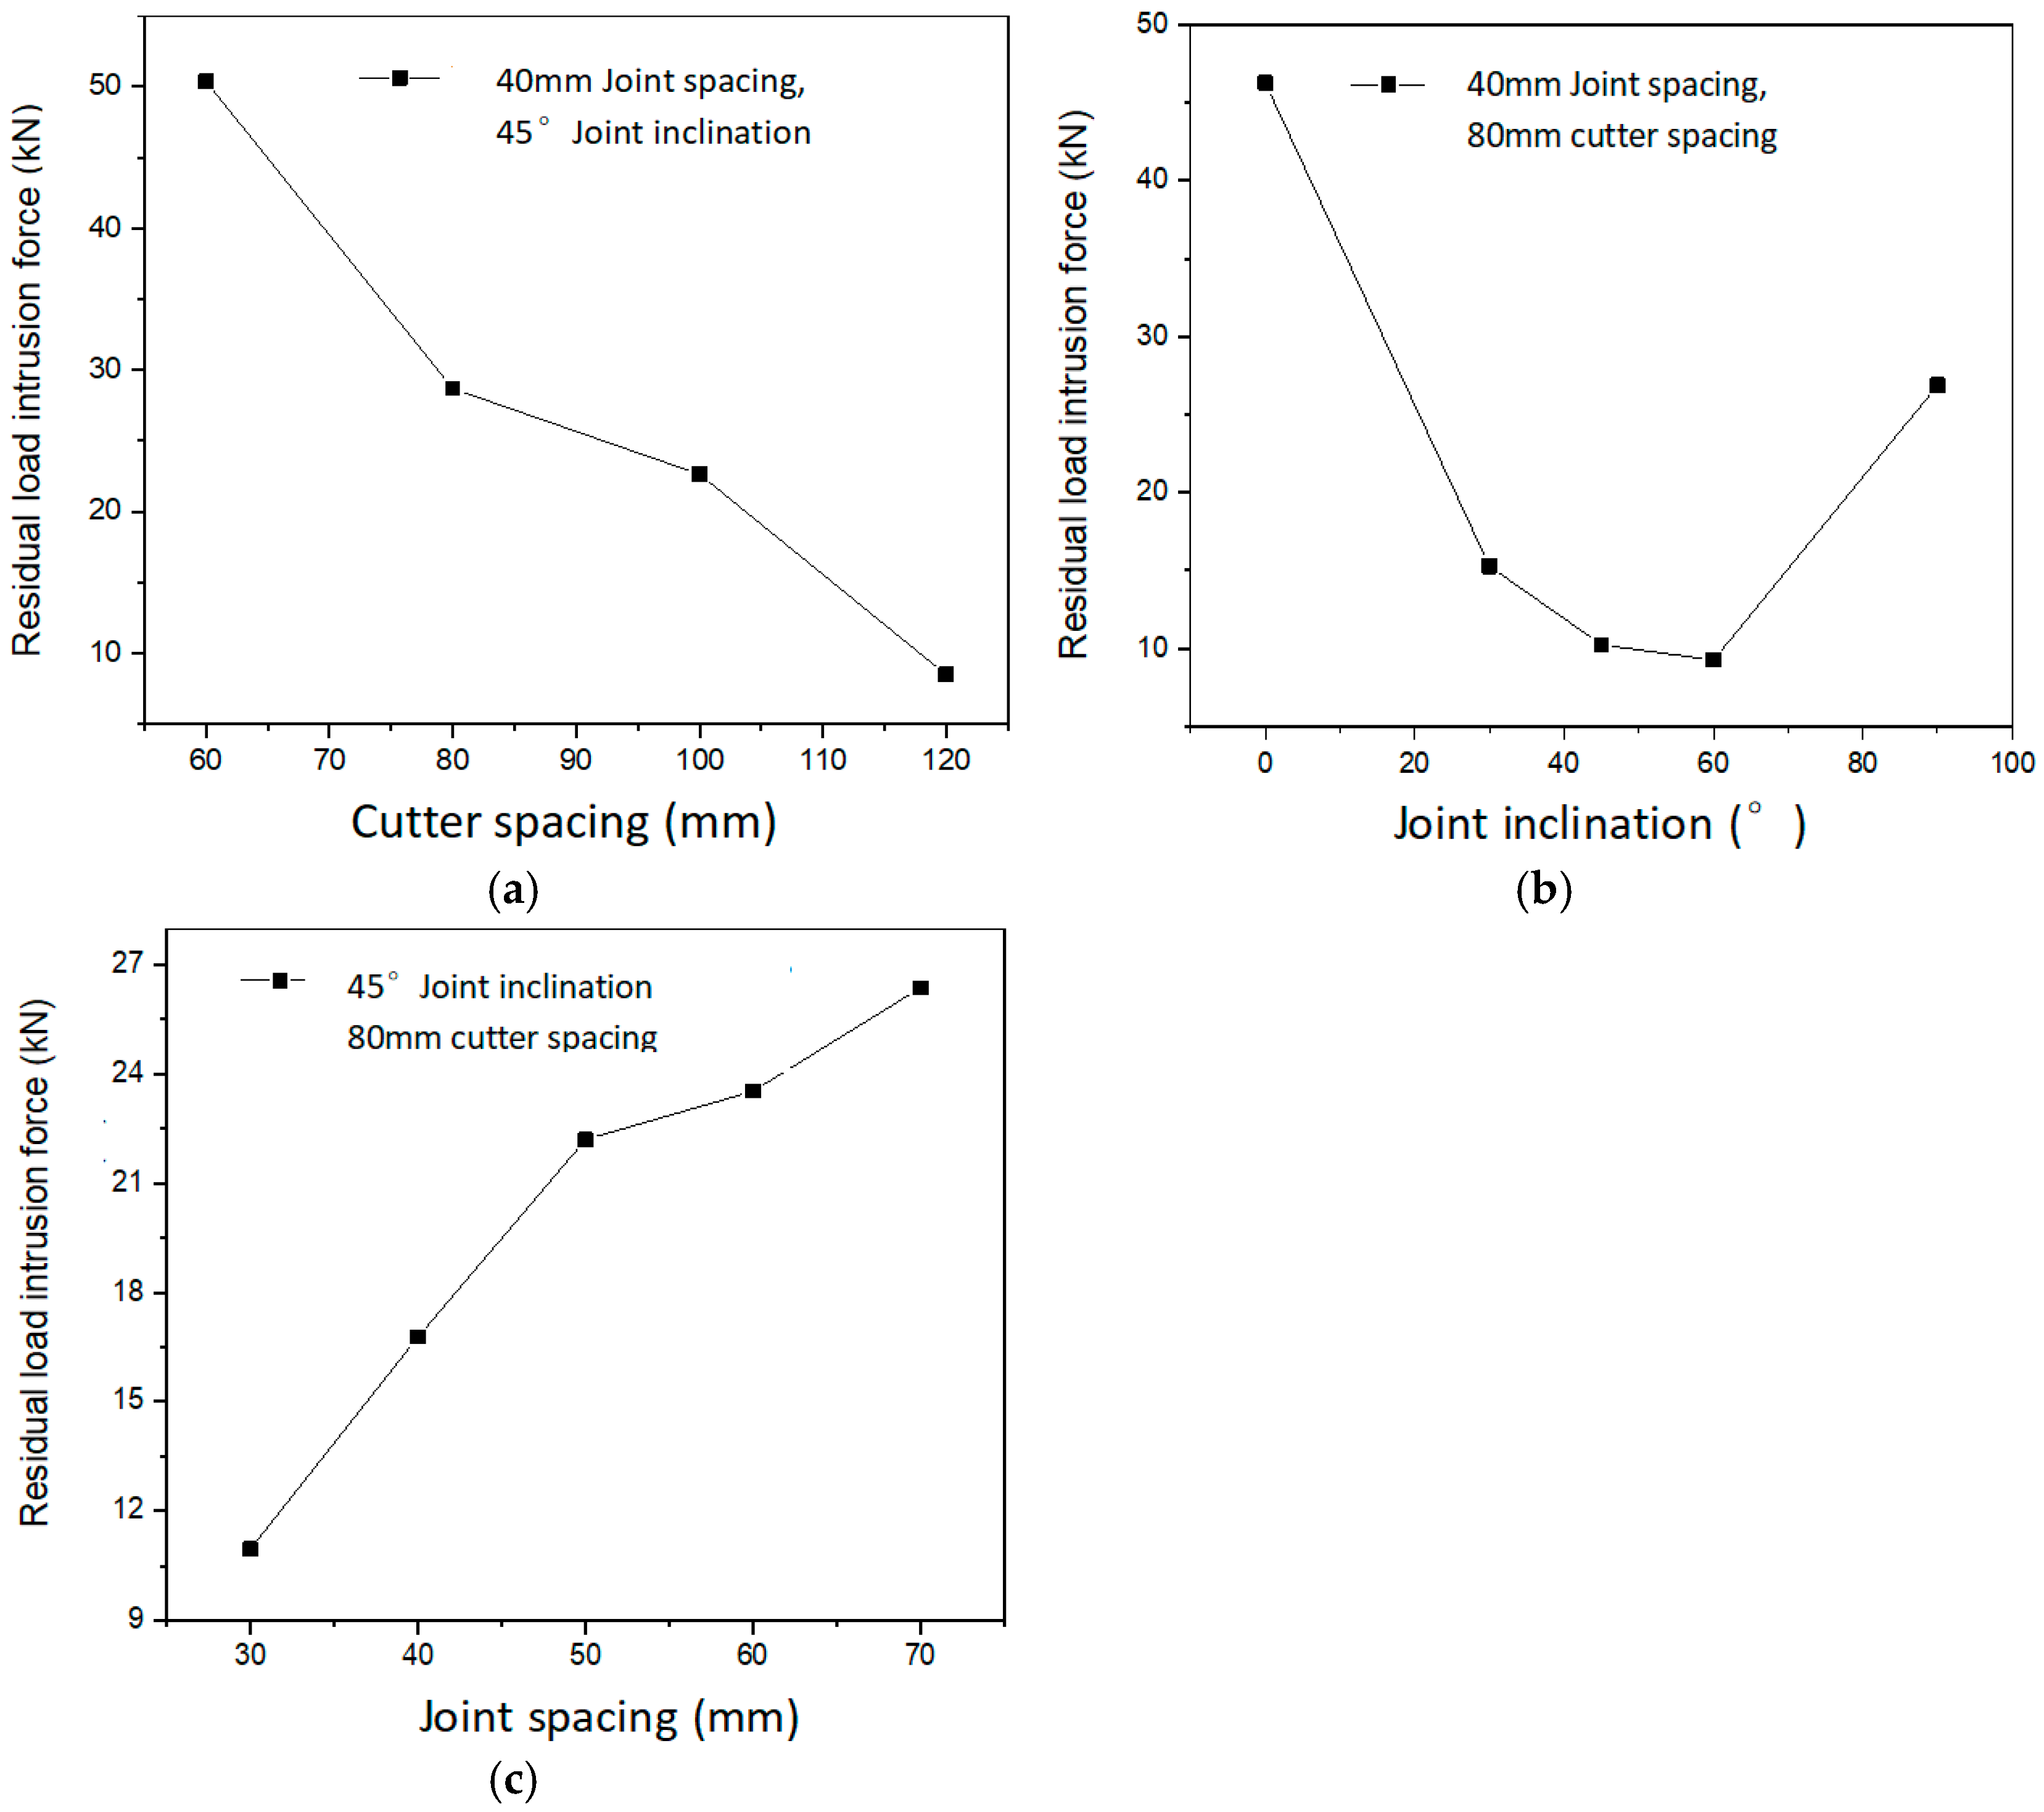
In the evolution characteristics of rock mass loads, residual loads can reflect the strength of the rock mass after failure, specifically the final approximately stable load magnitude after the cutter reaches the peak intrusion force. Figure 10 illustrates the variation in the ratio of residual load to peak load of the cutter under different tool spacings and joint conditions. Both the peak strength and residual strength of the rock mass consist of three components: cohesion, shear expansion, and friction. The cohesive component is associated with the degree of cementation among the crystal particles within the rock mass and along the joint surfaces. The shear resistance on the joint surface is governed by shear expansion and friction during the rock-breaking process and is directly proportional to the normal stress acting on the joint surface. These three components interact and collectively determine the overall strength of the rock mass.
As shown in Figure 10, the variation trend of the residual load to peak load ratio is opposite to that of the peak intrusion force with respect to cutter spacing and joint conditions. As the spacing between cutters increases, the ratio of residual load to peak load gradually decreases, reaching its minimum when the cutter spacing is 120 mm. When the joint inclination angle is 60° or the joint spacing is small, the ratio of residual load to peak load is relatively low, with a minimum value of approximately 9%. This variation in the residual load to peak load ratio is primarily attributed to changes in the shear expansion component. After reaching the peak load, rock samples with a smaller residual-to-peak load ratio exhibit greater shear deformation, resulting in a significant reduction in the shear expansion component after failure, which in turn affects the residual strength of the rock mass.

4. The Influence of Cutter Spacing on Cutting Efficiency of Disk Cutter for Jointed Rock Mass

During the tunneling process using a shield machine, the spacing between cutters significantly affects the cutting efficiency. When the spacing between disk cutters is appropriately arranged, the interaction between adjacent cutting actions enhances the overall rock fragmentation performance, thereby improving the efficiency of rock breaking. In the case of jointed rock masses, the presence of natural structural planes influences the rock-breaking behavior of the rotary cutters, thereby altering the efficiency of rock breaking under different cutter spacing conditions. This part of the paper investigates the variation in cutting efficiency of jointed rock masses under different cutter spacings by statistically analyzing the morphology and particle size distribution of the resulting rock debris. Two key indicators which are the SE and crack propagation SE are calculated to evaluate efficiency, and the variation patterns are summarized.

4.1. The Influence of Cutter Spacing on Failure Modes of Jointed Rock Mass

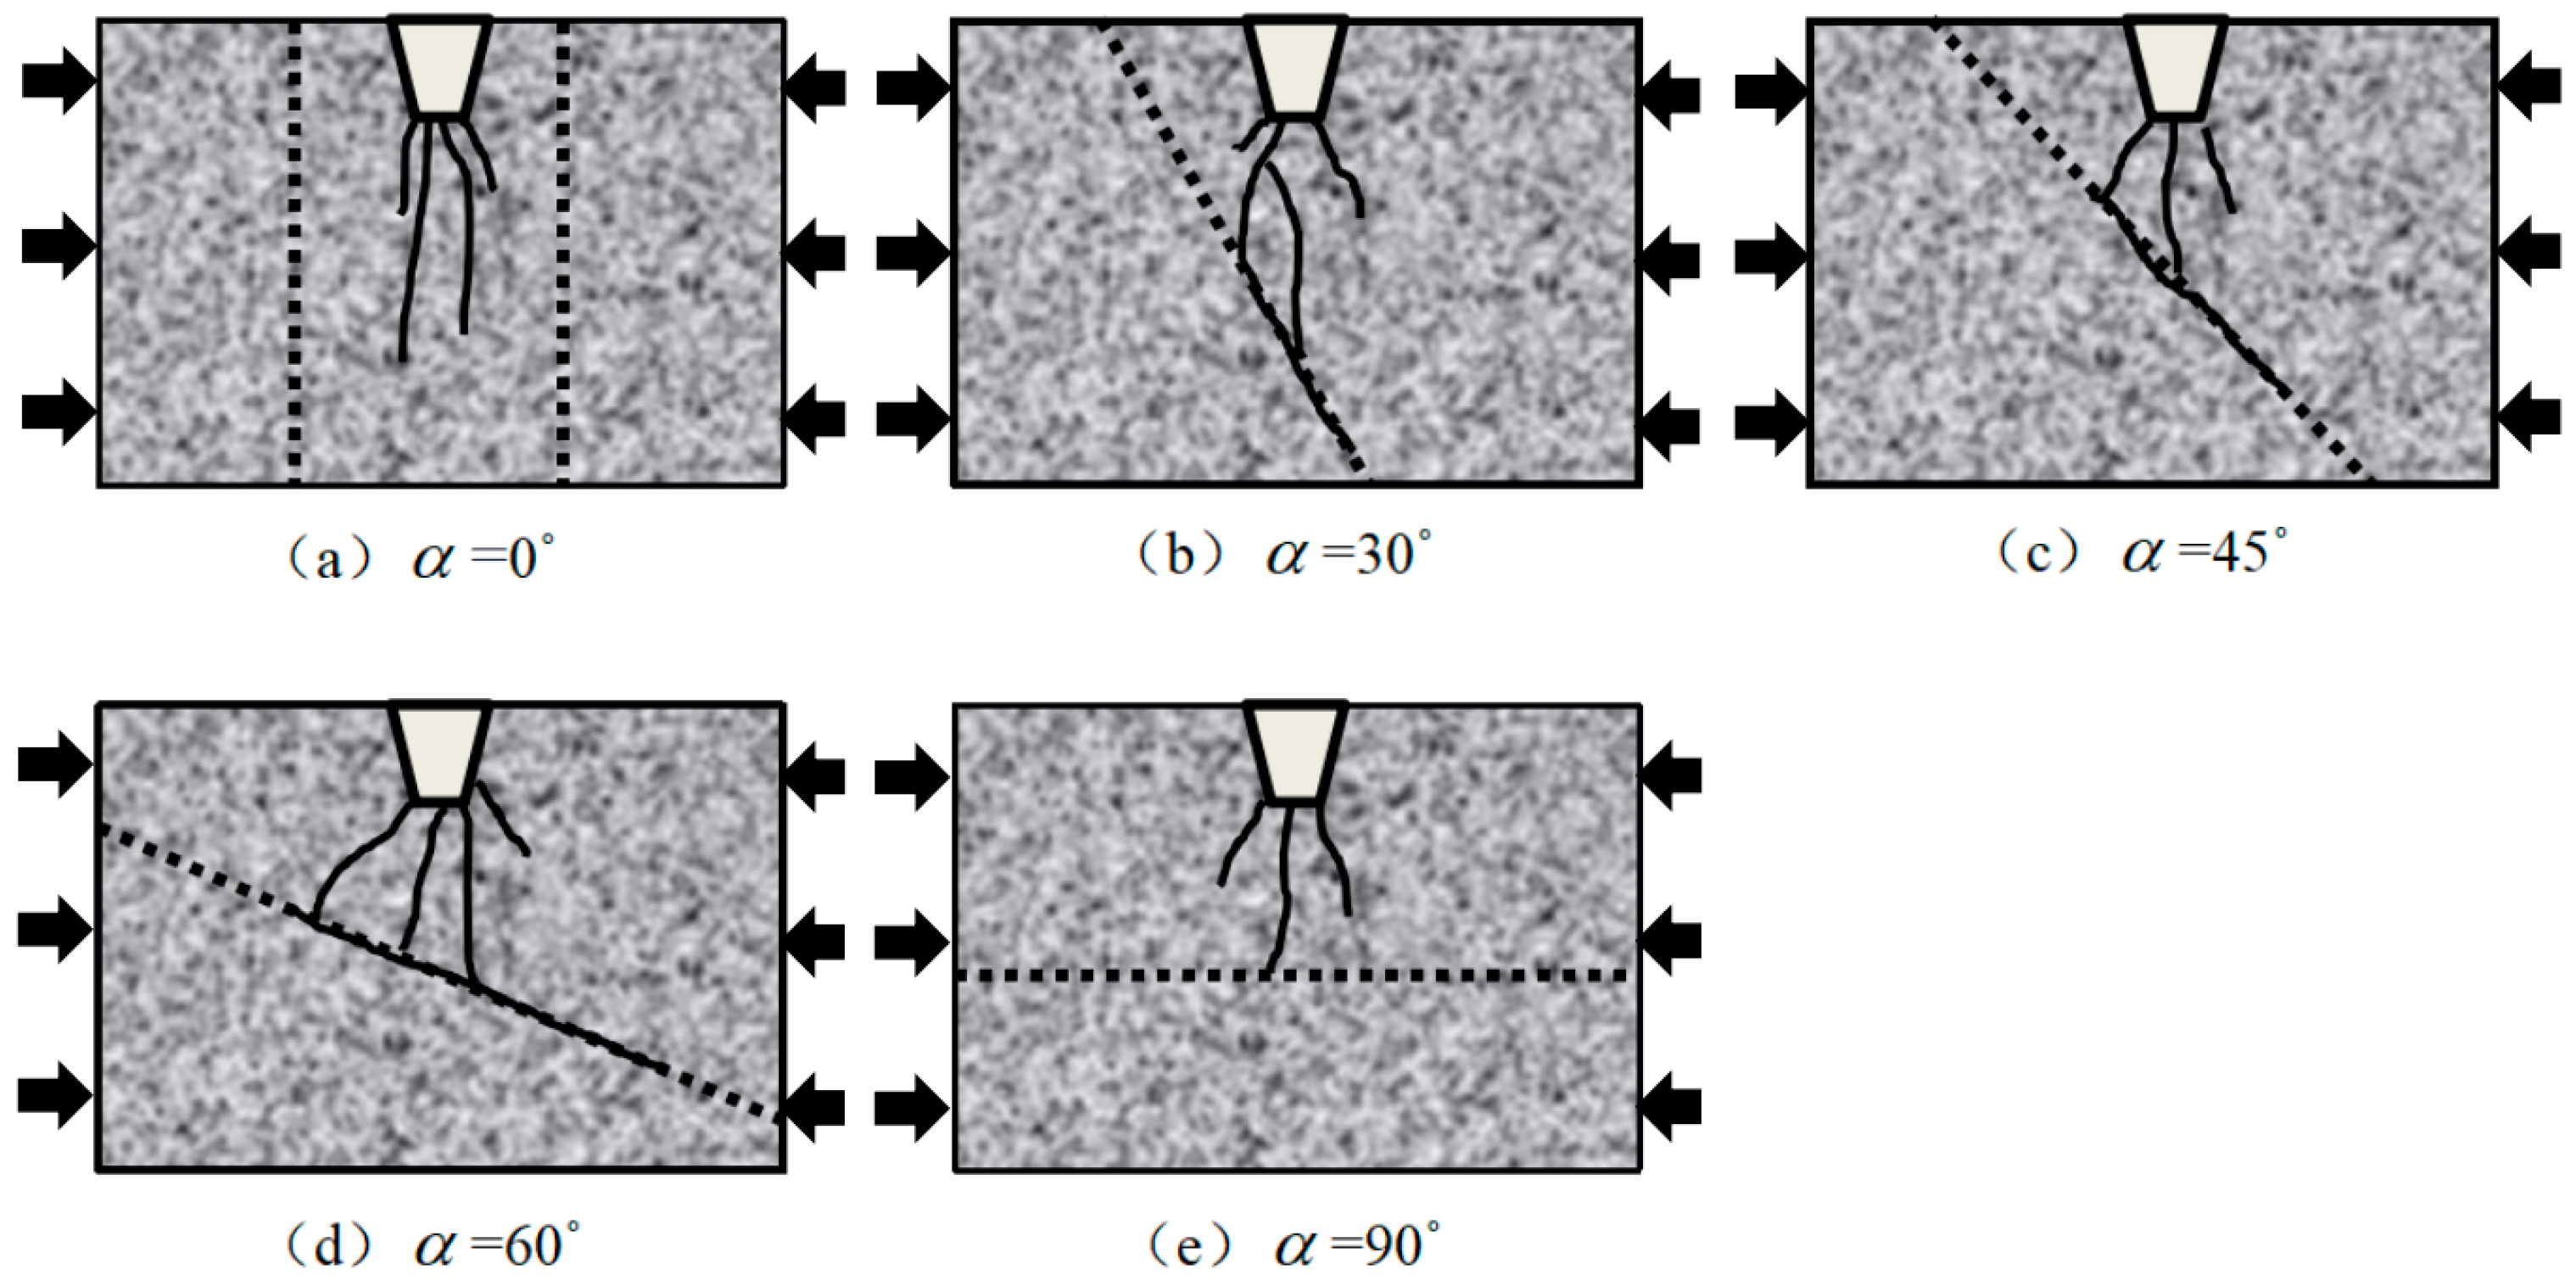
The varying occurrence states of joint surfaces result in their involvement in the rock fragmentation process in different forms during crack propagation. As illustrated in Figure 11, the failure modes of jointed rock masses beneath the roller cutter are presented for different joint inclination angles. It can be observed that when the joint inclination angle α is relatively small, as shown in Figure 11a,b, the joint surface plays a limited role in the rock-breaking process. Particularly when the joint inclination angle approaches 0°, the rock-breaking mechanism resembles that of single-blade independent rock fragmentation, with large rock blocks primarily formed through the coalescence of intermediate and radial cracks induced by the rotary cutter. In contrast, when the joint inclination angle is relatively large, as depicted in Figure 11c–e, the joint surface becomes activated upon crack propagation, connecting with the crack to form rock fragments. Furthermore, when the joint inclination angle is 45° and 60°, the failure tends to propagate along the joint surface, which subsequently acts as a potential crack initiation plane for subsequent fracturing in the jointed rock mass. As shown in the figure, when the joint inclination angle is 60°, the efficiency of crack coalescence leading to rock fragmentation reaches its maximum.
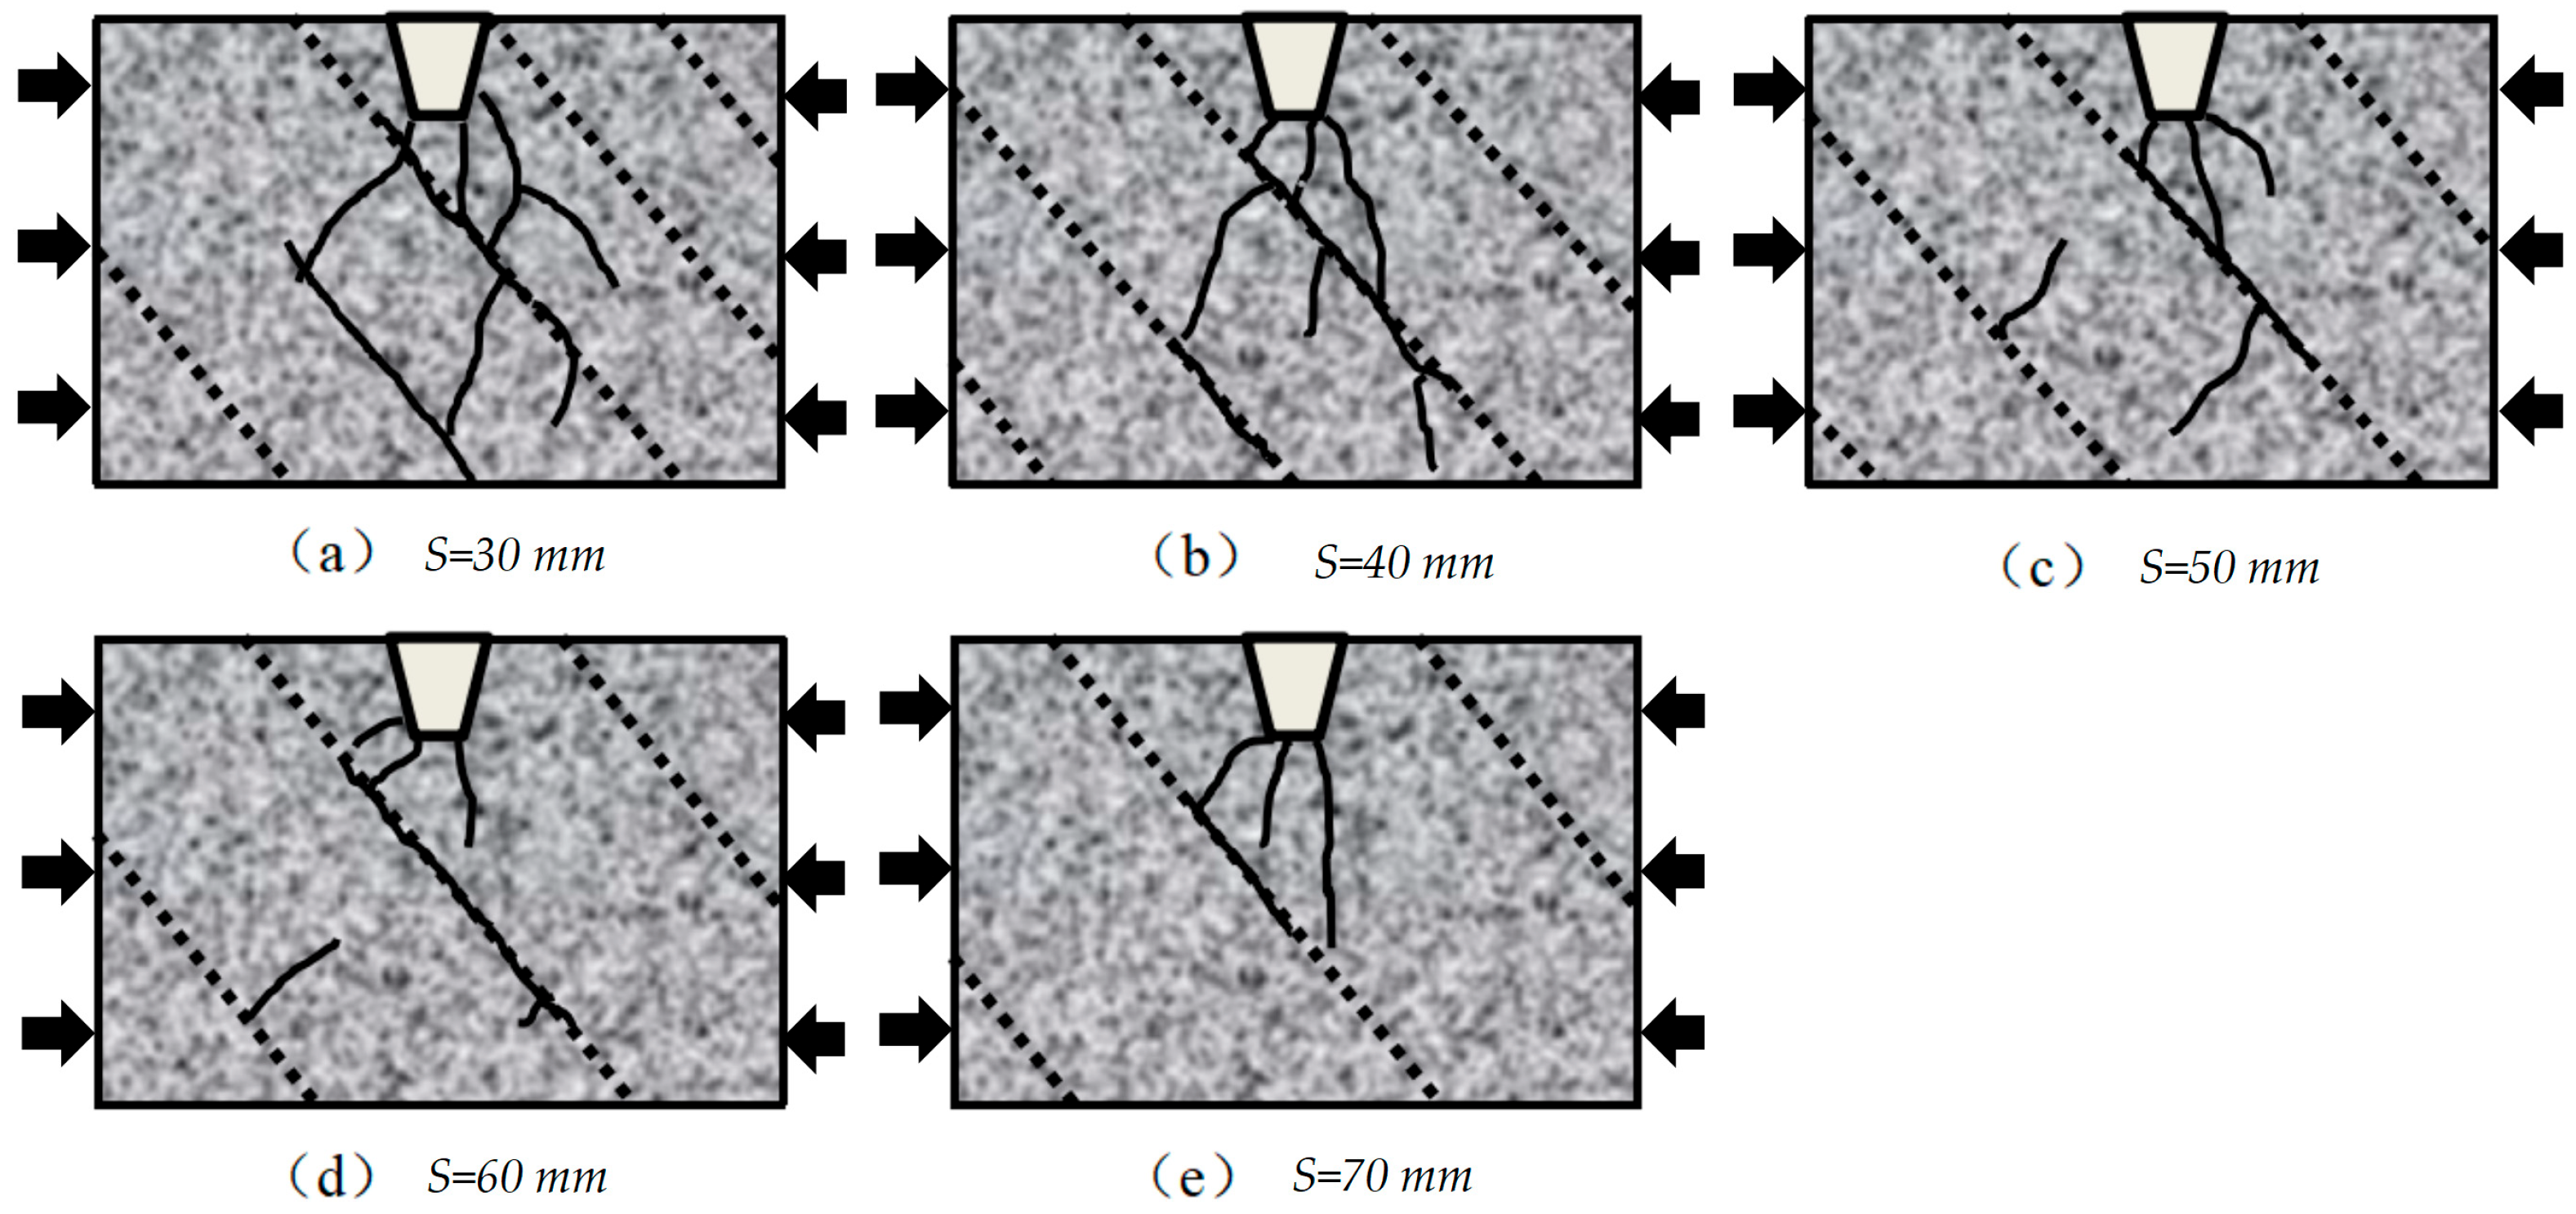
The spacing between joints significantly influences the integrity of the rock mass, thereby affecting the strength of the jointed rock mass under static pressure exerted by the cutters. As illustrated in Figure 12, the failure modes of the rock mass beneath the cutter vary depending on different joint spacings. When the joint spacing is relatively small and the joint surfaces are in states (a) and (b), as shown in the figure, cracks initiated beneath the roller cutter propagate toward the joint surfaces and subsequently extend across them. The jointed rock mass at the subsequent level then forms secondary rock blocks in conjunction with the joint surfaces. However, as the joint spacing increases, and the joint surfaces are in states (c), (d), and (e), the enhancing effect of the joints on rock fragmentation becomes less pronounced and may even impede crack propagation. In such cases, crack propagation beneath the roller cutter ceases before reaching the joint surfaces, and the jointed rock mass at the next level is no longer directly connected to the cracks formed under the cutter. Instead, the connection is achieved through wing-shaped cracks formed between adjacent joint planes. As depicted in the figure, a smaller joint spacing generally results in a more fragmented rock mass, thereby enhancing the efficiency of rock block formation by the cutter.
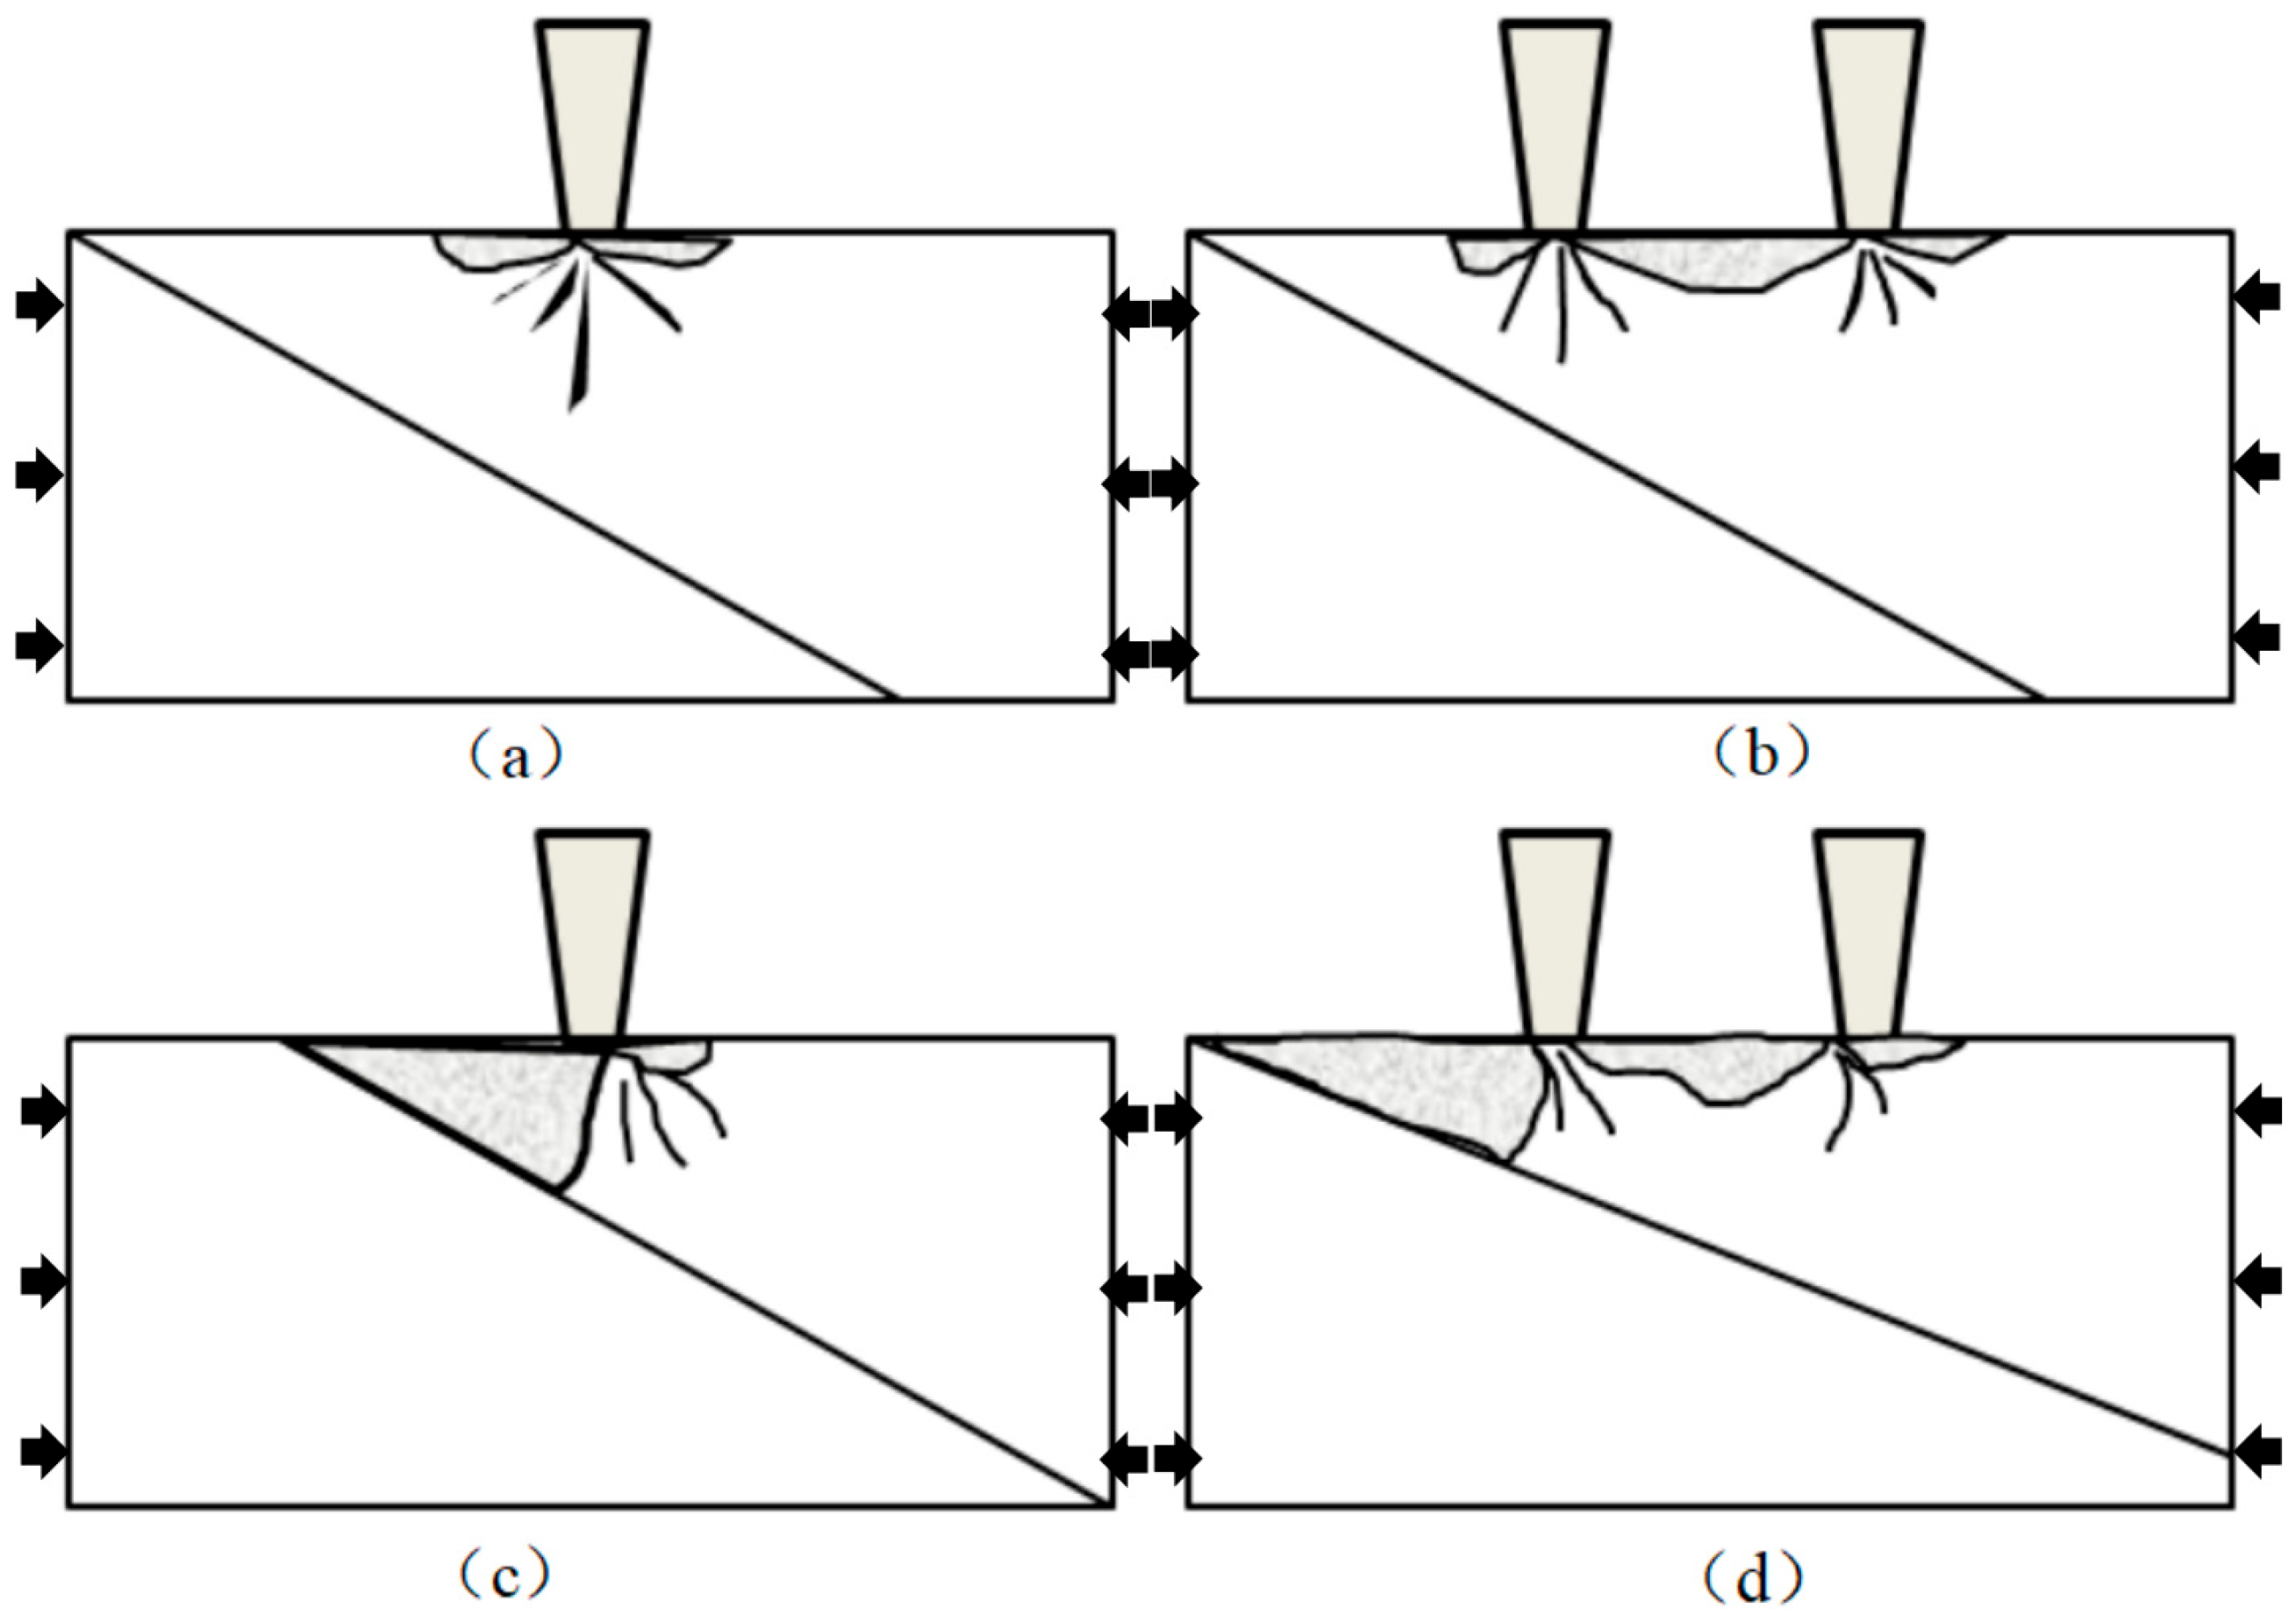
Under the action of double-roller cutters, jointed rock masses exhibit various rock-breaking modes, primarily influenced by the spacing between the cutters. Unlike intact rock masses, joints actively participate in the rock-breaking process, leading to several distinct rock-breaking mechanisms, as illustrated in Figure 13: single-blade independent rock breaking, double-blade coordinated rock breaking, single-blade joint-assisted coordinated rock breaking, and double-blade joint-assisted coordinated rock breaking. As shown in the figure, when the spacing between the cutters is appropriately arranged, the cracks initiated by the two cutterheads interconnect, resulting in the formation of rock fragments and achieving effective coordinated rock breaking. Conversely, when the spacing is too large, the cracks fail to connect, leading to the formation of rock ridges between the cutters. In such cases, each cutter operates independently, resulting in reduced cutting efficiency. The presence of joints also influences the rock-breaking behavior of the cutters based on the distance between the joint and the cutter. When the cutter is in close proximity to a joint, the joint surface can interact with the free surface of the rock mass and the cutter, facilitating coordinated rock breaking and enhancing overall efficiency. Therefore, determining an optimal spacing between cutters is essential to ensure synergistic interaction between the rotary cutters and rock joints, thereby maximizing rock-breaking performance.
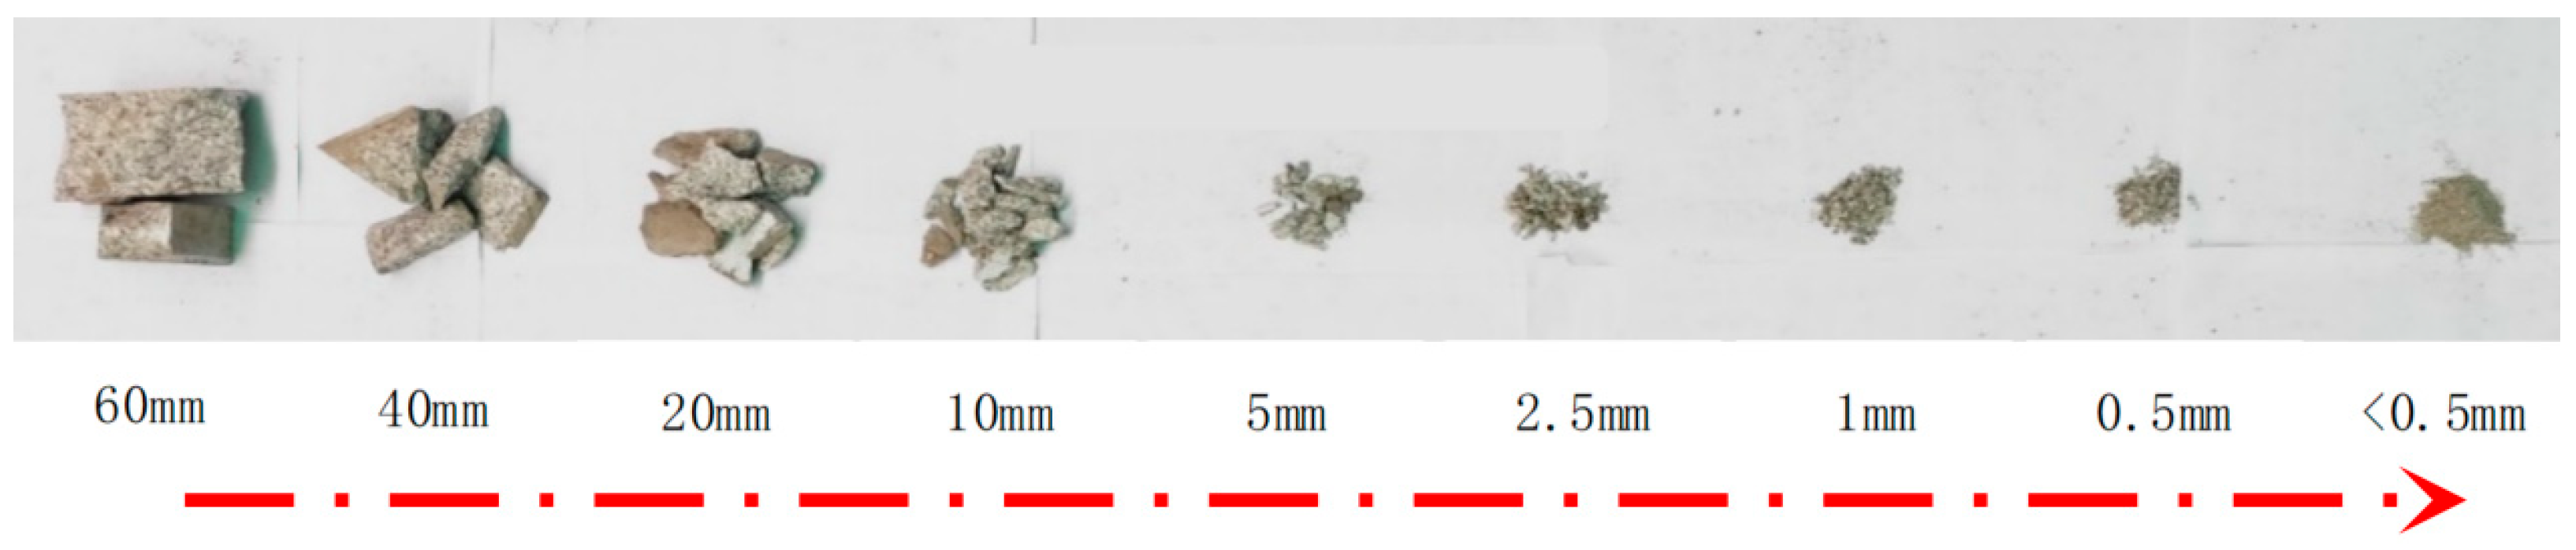
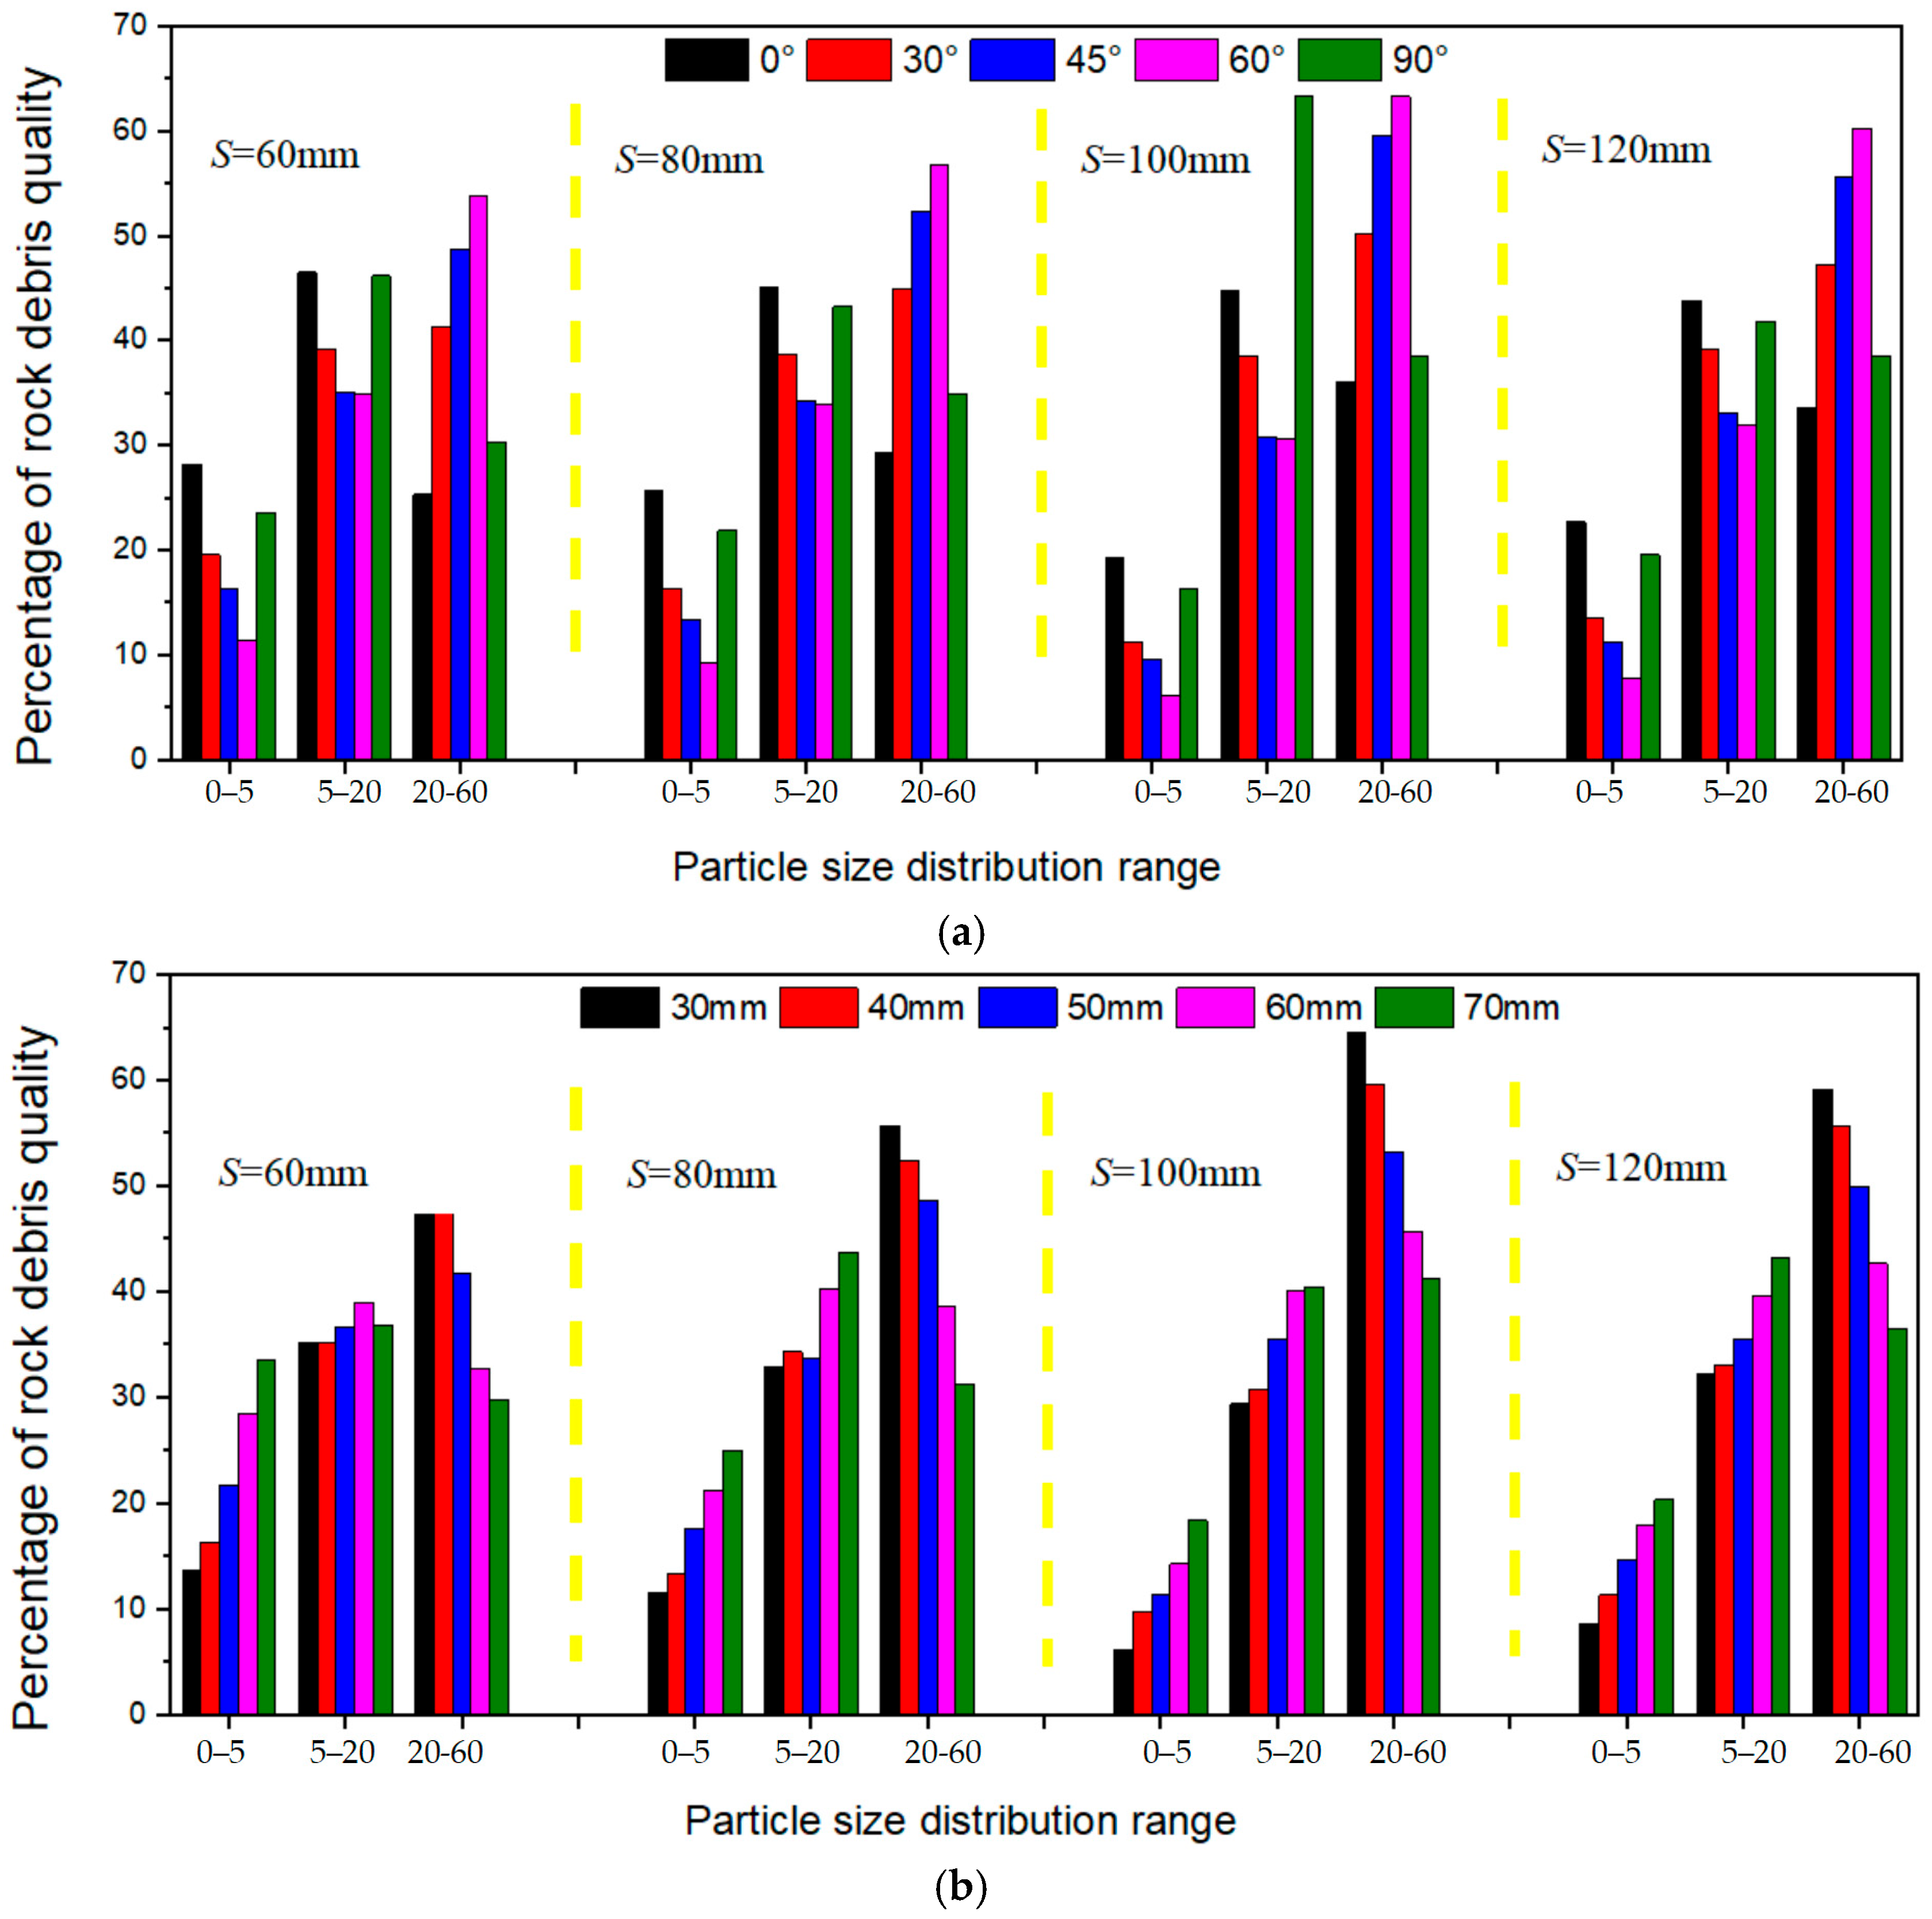
Figure 14 and Figure 15 present the particle size distribution of rock debris in rock masses with different joint conditions after roller intrusion at varying intervals. By collecting and sieving the rock debris after fragmentation, the relative proportions of different particle size ranges in terms of total weight were determined. This study categorizes the rock debris into three particle size intervals: small-sized particles (<5 mm), medium-sized particles (5–20 mm), and large-sized particles (20–60 mm). As shown in Figure 15a, when the joint inclination angles are 30°, 45°, and 60°, the proportion of medium and larger-sized rock debris exceeds 75% of the total weight. Among these, the 60° inclination yields the highest proportion of medium and larger-sized particles. In contrast, when the joint inclination angles are 0° and 90°, the distribution of the three particle size ranges is more evenly distributed. As illustrated in Figure 15b, the proportion of medium and larger-sized rock debris decreases gradually with increasing joint spacing. The highest proportion is observed when the joint spacing is 30 mm.
It is noteworthy that as the cutter spacing increases, the variation pattern of rock slag particle size in rock masses with different joint inclination angles and spacings remains consistent. Specifically, when the cutter spacing increases from 60 mm to 100 mm, the proportion of small-sized rock slag decreases, while the proportion of large-sized rock slag increases, resulting in an uneven distribution of particle sizes. However, when the cutter spacing exceeds 100 mm, the particle size distribution becomes more uniform. The experimental results indicate that when the joint inclination angle is 0° or 90°, or when the joint spacing is excessively large, a significant amount of fine rock debris is generated, leading to excessive fragmentation of rock cutter. Larger joint spacings combined with straight joints hinder lateral deformation of the rock mass, thereby increasing the peak intrusion force required for rock failure. Consequently, a large quantity of rock powder and fine rock slag is produced during the failure process, which consumes the energy input of the cutter and reduces cutting efficiency. In contrast, when the joint inclination angle is 30°, 45°, or 60°, or when the joint spacing is small, the joint surfaces are more susceptible to deformation as the cutters penetrate the rock mass. Cracks propagate continuously as the joint surfaces are damaged, and the relatively large lateral displacement of the rock mass facilitates crack coalescence, resulting in an increased proportion of large-sized rock debris and improved cutting efficiency. The influence of cutter spacing on the particle size distribution of rock slag in jointed rock mass SE can be summarized as follows: when the spacing between cutters is too small, the cracks between adjacent cutters become overly dense, limiting the rock-breaking range and causing fine fragmentation of the rock slag.

4.2. Influence of Cutter Spacing on the Energy Utilization Efficiency of Jointed Rock Mass

Consumption refers to the amount of energy required by the cutter to excavate a unit volume of rock mass. It serves as the most critical parameter for evaluating cutting efficiency during tunnel excavation, and the optimal cutter spacing for rock fragmentation yields the lowest SE consumption. Therefore, minimizing SE is a fundamental objective in the practical tunnel excavation process. SE can be expressed as
E s = W V = W v + W r V = F v p + F r J V
Among these parameters above, ε represents the SE required for rock-breaking, W denotes the total work performed by the cutterhead during the rock-breaking process, Wv is the work done by the vertical force of the cutter, and Wr refers to the work contributed by the rolling force of the cutter. Additionally, Fv and Fr represent the vertical and rolling forces exerted during the cutter’s tunneling process, respectively, p indicates the penetration depth, J stands for the rolling distance of the cutter, and V corresponds to the volume of rock debris generated at the respective penetration depth.
The CSM (Colorado School of Mines) force model is highly suitable for TBM disk cutter force analysis because it is developed specifically for constant cross-section (CCS) disk cutters based on real rock-breaking mechanisms, including indentation and crack propagation. It uses readily available parameters such as rock uniaxial compressive strength, cutter geometry, spacing, and penetration, which are fully consistent with actual TBM design and construction conditions. The model can accurately predict normal and rolling forces with reliable engineering accuracy, supported by extensive laboratory and field verification. It is computationally efficient and widely applicable to hard and medium-hard rock conditions, making it the most widely accepted and practical semi-empirical model for TBM cutter load assessment. The CSM model [19,20] is employed to predict the rolling force. This model is based on a well-established mathematical framework and has been validated through linear cutting experiments. It has been widely applied and verified across numerous engineering projects, demonstrating higher reliability compared to other rolling force prediction models. The rolling force derived from this model is originally expressed in imperial units and is subsequently converted into international (SI) units. The corresponding formulas for the vertical force and cutting force of the cutter based on the CSM model are as follows:
F v = F t cos ( ϕ 2 ) = T R ϕ P 0 cos ( ϕ 2 )
F r = F t sin ( ϕ 2 ) = T R ϕ P 0 sin ( ϕ 2 )
ϕ = cos 1 ( R p R )
In detail, Ft is the resultant force acting on the roller cutter during the tunneling process, R is the diameter of the cutter, ϕ is the contact angle between the cutter and the rock, and p0 is the basic pressure of the crushing zone.
By conducting logarithmic regression analysis on the test data and using the dimensional analysis method for calculation, we can obtain the basic pressure of the crushing zone around the dense core below the rolling cutter as follows:
p 0 = C s ϕ R T σ c 2 σ t 3
In which C ≈ 2.12 is a dimensionless coefficient, σ c is the compressive strength of the rock, and σ t is the tensile strength of the rock.
By combining Equations (1) and (2), the SE required for the tool to break rocks can be obtained as
E s = T R ϕ P 0 V cos ( ϕ 2 ) p + sin ( ϕ 2 ) J
When the rolling distance of the cutting tool is J, and the volume of rock debris in the dual-rolling cooperative rock-breaking state can be obtained through Equation (7):
V = λ l p s
Among them, λ is a dimensionless function introduced to simplify the calculation, which is defined as the ratio of the thickness of the rock debris to its width. Depending on the different values of the tool spacing, the value of λ refer to Table 1:
According to the study of previous scholars, the natural fracture angle of various rocks is generally in the range of 116°~150°, and the spacing of the cutter P is between 6 mm and 12 mm in general. Therefore, when the extension length of the oblique crack on the roller surface L < p tan β , the volume model of rock fracture can be derived as
V = λ J p s 0 < s < 2 L + T J ( T p + p 2 tan β ) s > 2 L + T
By combining Equations (6) and (8), the formula for calculating the SE can be obtained as follows:
S E = T R ϕ p 0 [ cos ( ϕ 2 ) p + sin ( ϕ 2 ) J ] / ( λ J p s ) 0 < s 2 L + T T R ϕ p 0 [ cos ( ϕ 2 ) p + sin ( ϕ 2 ) J ] / ( T p J + p 2 J tan β ) s > 2 L + T
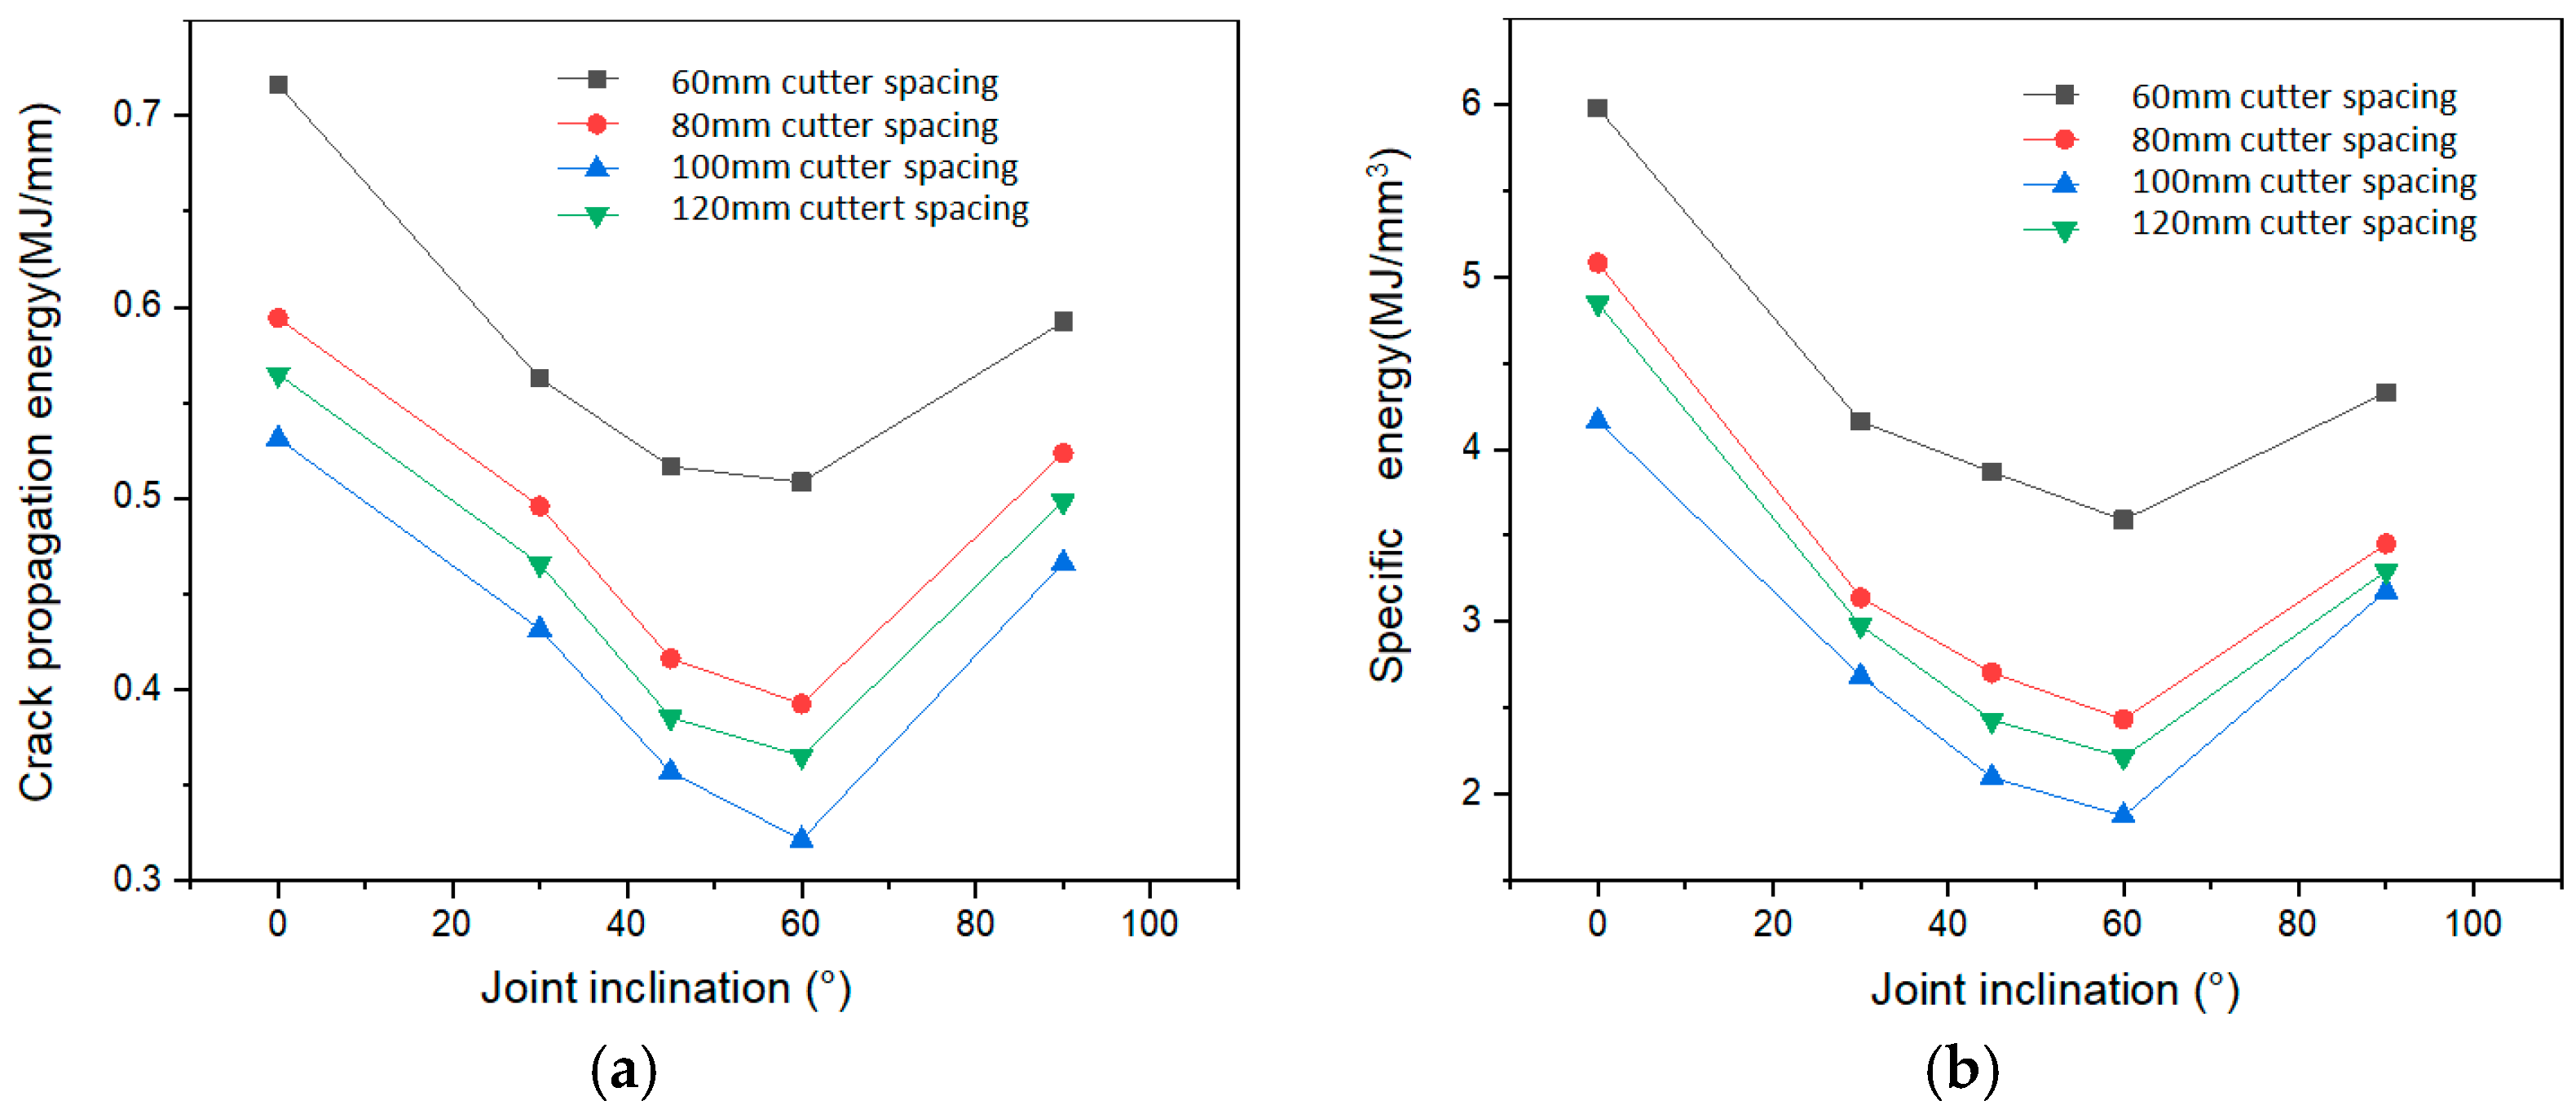
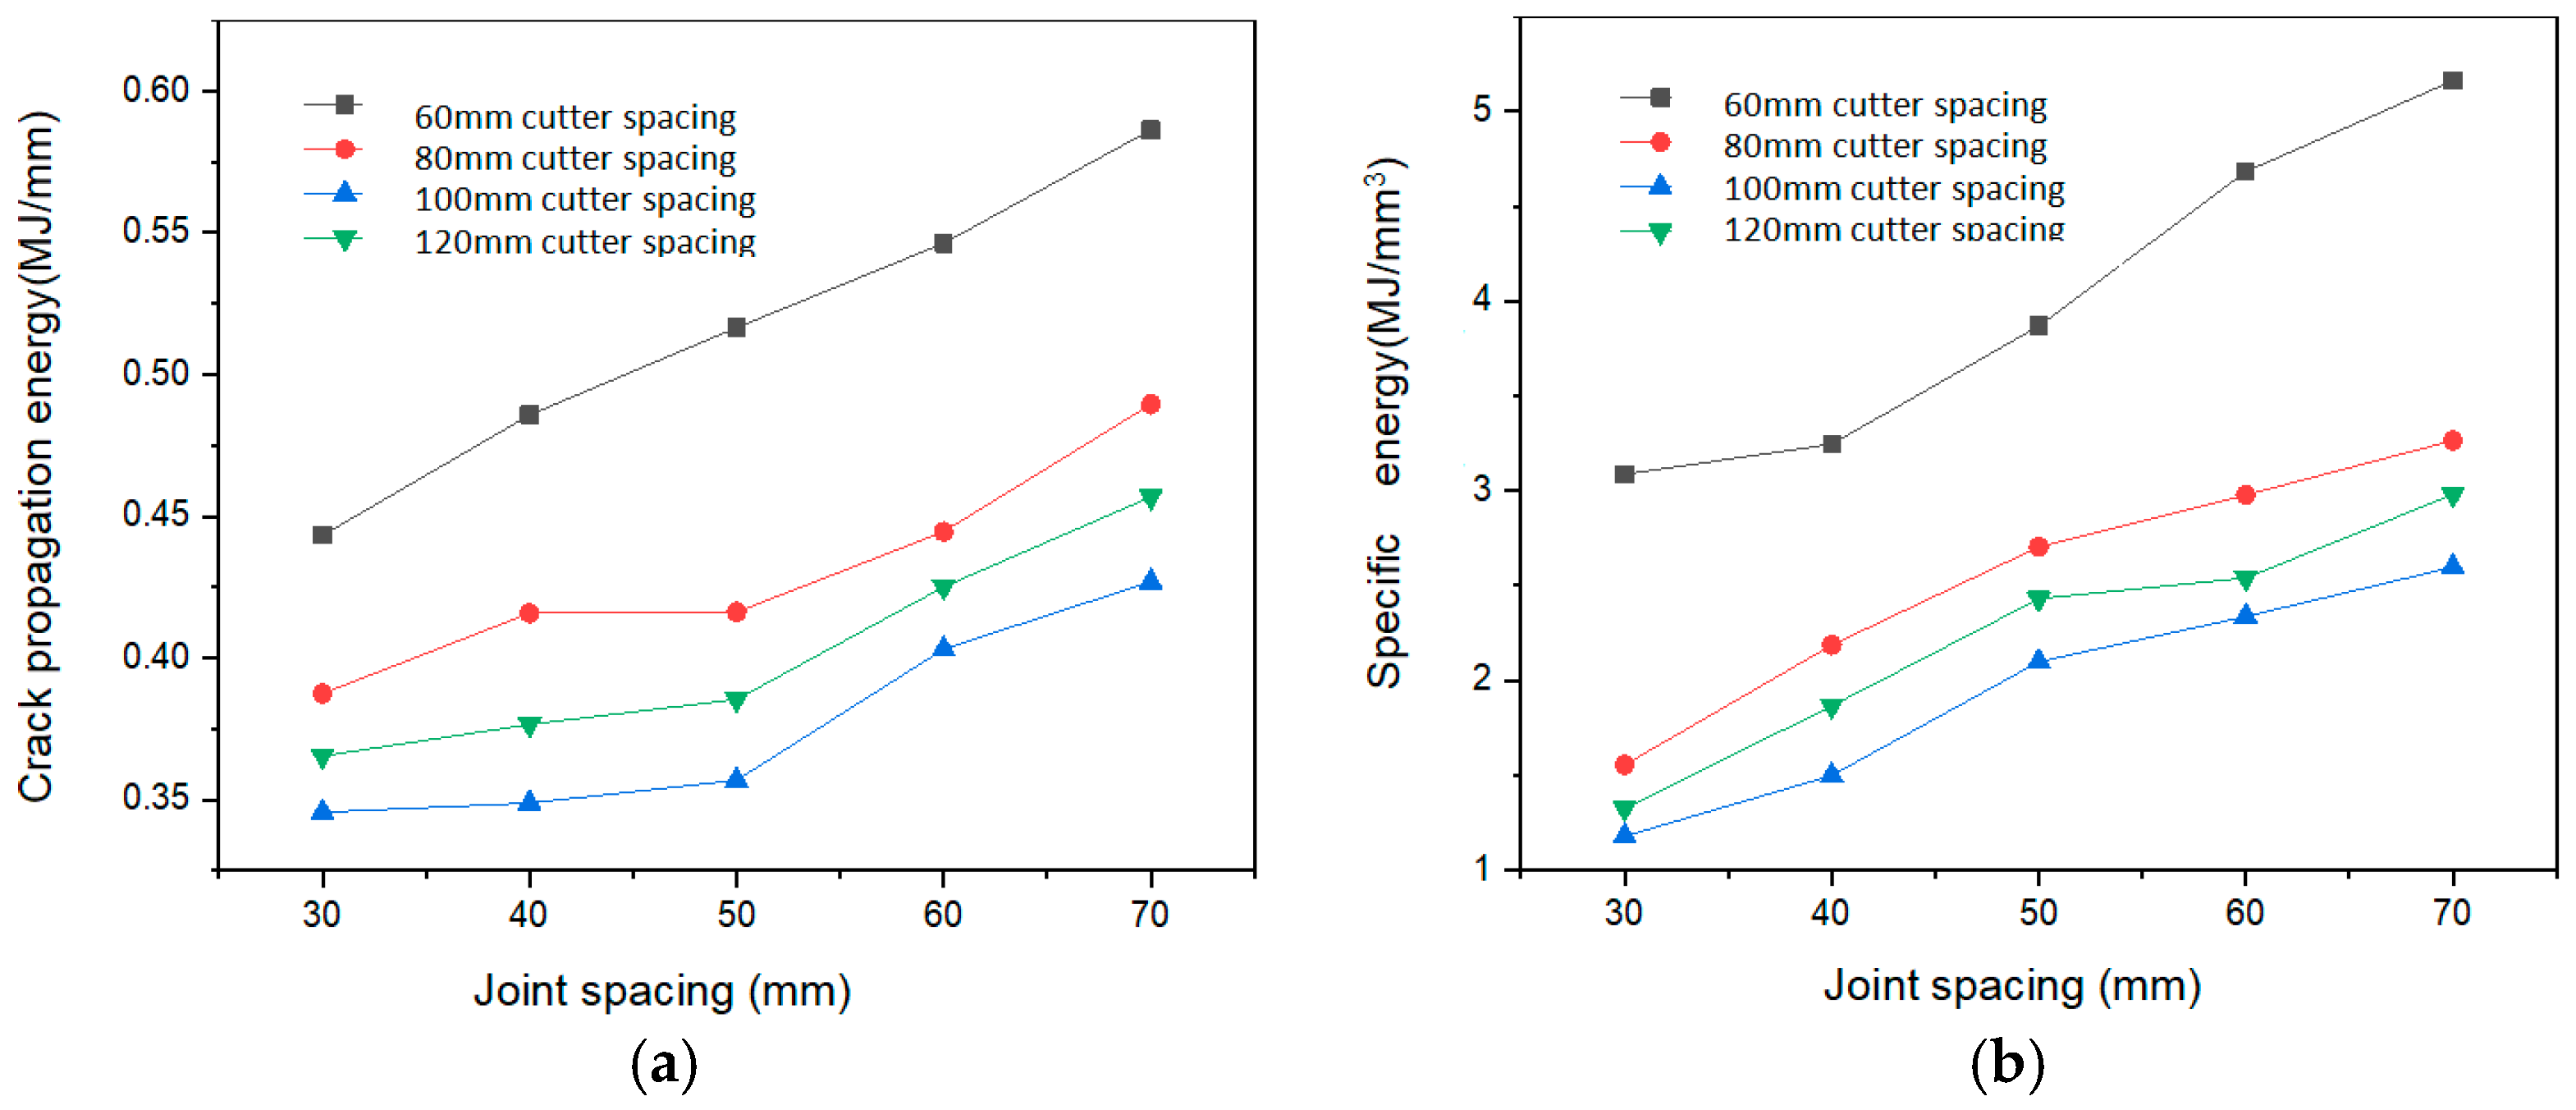
In this experiment, the roller bit was advanced into the rock using a hydrostatic loading method, ensuring that the rolling force of the bit performed no mechanical work. By analyzing the vertical work measured at the roller bit and the mass of the rock fragments produced after rock failure, along with the corresponding fragment volume calculated from the rock’s density, the energy consumption associated with rock fragmentation under varying bit spacings, joint inclinations, and joint spacings was determined. The results are presented in Figure 16 and Figure 17.
To investigate the optimal cutting distance of the roller bit under varying penetration depths, it is essential to evaluate the rock fragmentation energy ratio at each penetration depth across different cutting distances. However, due to experimental constraints, this study was limited to a small number of test groups at a fixed penetration depth of 10 mm. To address the resulting insufficiency of experimental data, this paper leverages the capability of a two-dimensional strain data acquisition system to capture real-time grayscale images of crack propagation on the rock surface during roller bit penetration. Based on these grayscale images, crack extension lengths at various penetration depths are quantitatively analyzed using ImageJ (1.8.0) software. Consequently, a new evaluation index El, which termed the crack extension energy ratio, is proposed. It should be noted that the SE of TBM disk cutter cutting and the crack extension energy for internal crack propagation in rock masses are closely related in physical mechanism. The SE represents the external mechanical energy input per unit volume of rock excavated, reflecting the overall excavation efficiency. The crack extension energy for crack propagation describes the energy consumed to generate and extend internal cracks per unit length or volume, characterizing the meso-scale fracture behavior. Essentially, most of the energy input by the disk cutter is dissipated in the initiation, propagation and coalescence of internal cracks. This index is defined as the energy consumed per unit length of crack extension under the static pressure exerted by the roller bit on the rock, as expressed in Equation (10).
E l = F v p l
where L represents the total length of surface cracks (in millimeters) at the corresponding penetration depth. A higher value of this ratio indicates a lower cutting efficiency of the TBM. The crack extension energy ratio and rock-breaking energy ratio El under different cutting distances, joint inclinations, and joint spacings are illustrated in Figure 16b and Figure 17b, respectively. In addition, to validate the effectiveness of the proposed index in characterizing cutting efficiency, the results for a joint spacing of 50 mm are presented as a case study, showing the variation in both the crack extension energy ratio and rock-breaking energy ratio with cutting distance under different joint inclination angles. As shown in Figure 16, it can be seen that when the joint inclination is 60°, the crack extension energy ratio and energy ratio both reach the minimum value, and the cutting efficiency reaches the highest. Similarly, for the condition of a joint inclination of 45°, the crack extension energy ratio and rock-breaking energy ratio for different joint spacings are calculated, and the results are shown in Figure 17. The results indicate that when the joint inclination is 45°, the cutting efficiency is the highest when the joint spacing is 30 mm, and the cutting efficiency gradually decreases as the cutting distance increases. In terms of the cutting distance, under different joint conditions, the cutting efficiency of the roller bit reaches the optimal when the cutting distance is 100 mm, and the cutting efficiency is significantly lower than other cutting distances when the cutting distance is 60 mm. It is speculated that this is because the cutting distance is too small, the effective range of the roller bit is relatively reduced, the crack extension is restricted, and thus the cutting efficiency is reduced. The trend of cutting efficiency with cutting distance and joint conditions in Figure 16a and Figure 17b is consistent, indicating the effectiveness of the crack extension energy ratio in measuring the cutting efficiency. According to Figure 16, at a joint inclination of 60° (for different joint spacings) and a joint spacing of 30° (for different joint inclinations), the dominant type of shear fracture in the crack total number is shear fracture, and many shear failures occur on the joint surface. Therefore, it can be concluded that the cutting efficiency of the shear failure mode is higher than that of the tensile failure mode.

5. Optimization of Cutter Spacing Based on Rock Crack Propagation Characteristics

A reasonable cutter spacing can significantly enhance the working efficiency of the TBM and reduce the costs associated with cutter installation. However, in practical engineering applications, the determination of optimal cutter spacing is challenging due to the complexity of geological conditions and the difficulty in acquiring subsurface data. This study establishes the optimal cutter spacing for granite rock masses under varying joint inclinations and spacings by employing the crack propagation ratio energy index in conjunction with a two-dimensional strain acquisition system. Furthermore, the influence of joint inclination and spacing on optimal cutter spacing is systematically analyzed and interpreted.

5.1. Determination of Optimal Cutter Spacing in Jointed Rock Masses

For different joint inclinations (with a representative joint spacing of 50 mm) and different joint spacings (with a representative joint inclination of 45°), the optimal S/P ratio remains constant. In the experiments, the cutter penetration depth was maintained at 10 mm, indicating that the optimal cutter spacing across various joint conditions is consistently 100 mm. This suggests that the proposed method can be effectively utilized to estimate cutting efficiency during TBM excavation. Nevertheless, due to the limited number of experimental test groups, it is not feasible to exhaustively evaluate all potential cutter spacing values within the optimal range, nor can it be guaranteed that the true optimal S/P ratio lies within the selected experimental values. To address this limitation, this study leverages a two-dimensional strain measurement system to capture crack propagation patterns in rock masses under various penetration depths. This approach enables the collection of comprehensive data on crack propagation under different S/P ratios.
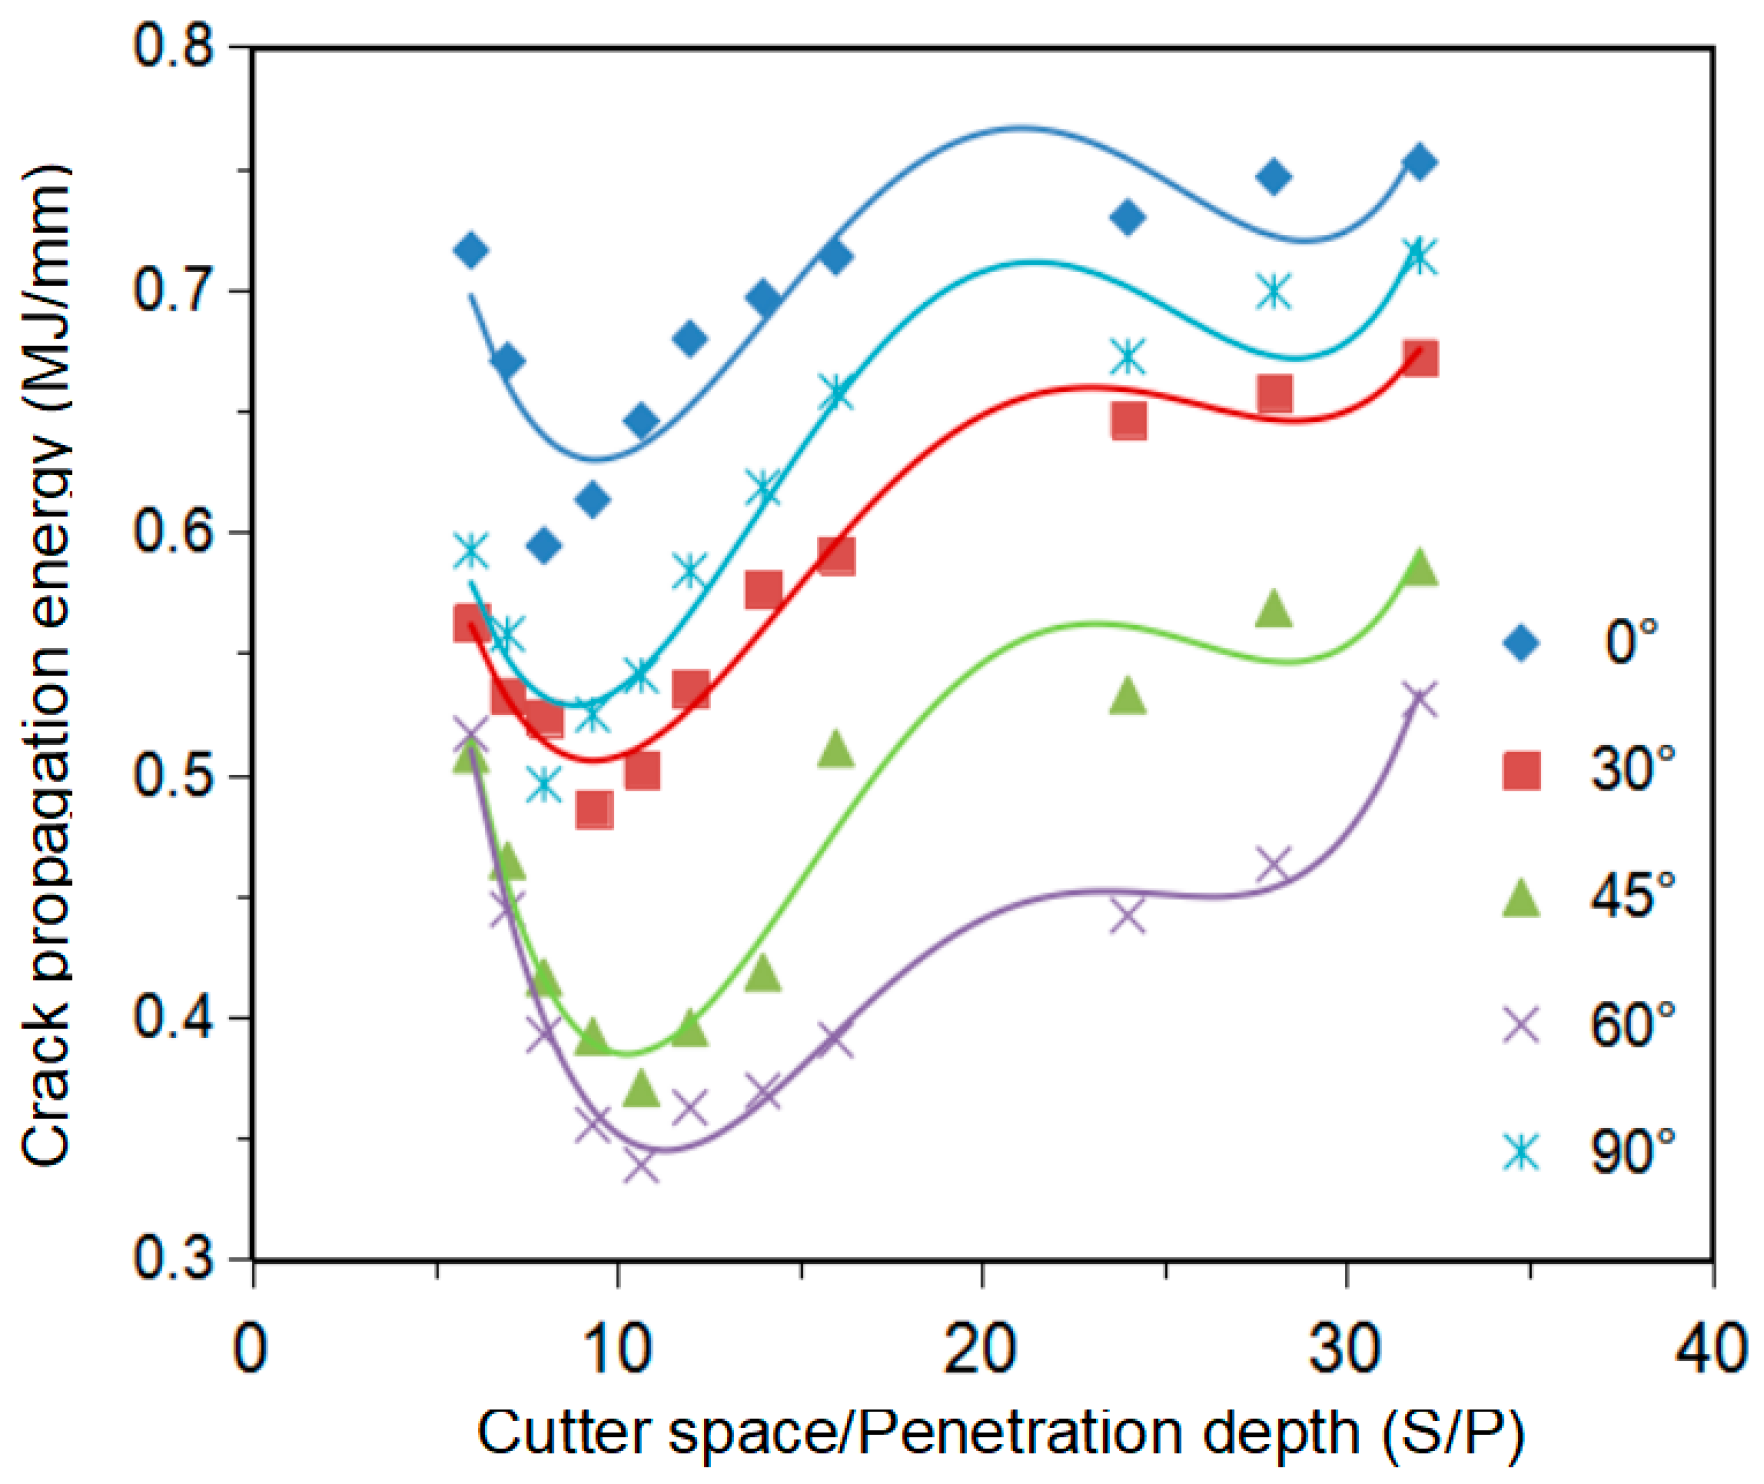
To enhance the general applicability of the calculated optimal S/P ratio, this study evaluated crack propagation enthalpy under varying joint spacings, as illustrated in Figure 18. The resulting data points were subjected to polynomial regression analysis, yielding a high correlation coefficient. The corresponding fitting equation and correlation coefficient are presented in Table 2. As shown in Figure 18, across different joint rock mass inclination angles, the trend of crack propagation enthalpy exhibits consistent behavior. Specifically, when the S/P ratio increases from five to approximately 10, the crack propagation enthalpy gradually decreases, reaching its minimum value at around S/P = 10. As the S/P ratio further increases from 10 to 20, the enthalpy rises steadily with a pronounced upward trend; when S/P increases from 20 to 35, the rate of increase slows down significantly. These results indicate that the experimentally derived optimal S/P ratio is approximately 10. Deviations from this value—either higher or lower—are associated with reduced rock fragmentation efficiency. Furthermore, at identical S/P ratios, the crack propagation enthalpy under a joint inclination angle of 60° is notably lower than that observed at other inclination angles. This suggests that rock-breaking conditions for rolling cutters are most favorable at a joint inclination angle of 60° compared to other orientations. In contrast, when the joint inclination angle is 0°or 90°, a higher crack propagation enthalpy is required for rock failure. These findings can serve as a reference for tunnel alignment selection and facilitate the rational design of cutter spacing based on the characteristics of jointed rock masses. By multiplying the optimal S/P ratio obtained within each interval by the corresponding penetration depth, the optimal cutter spacing can be determined for various joint inclination angles and penetration depths.
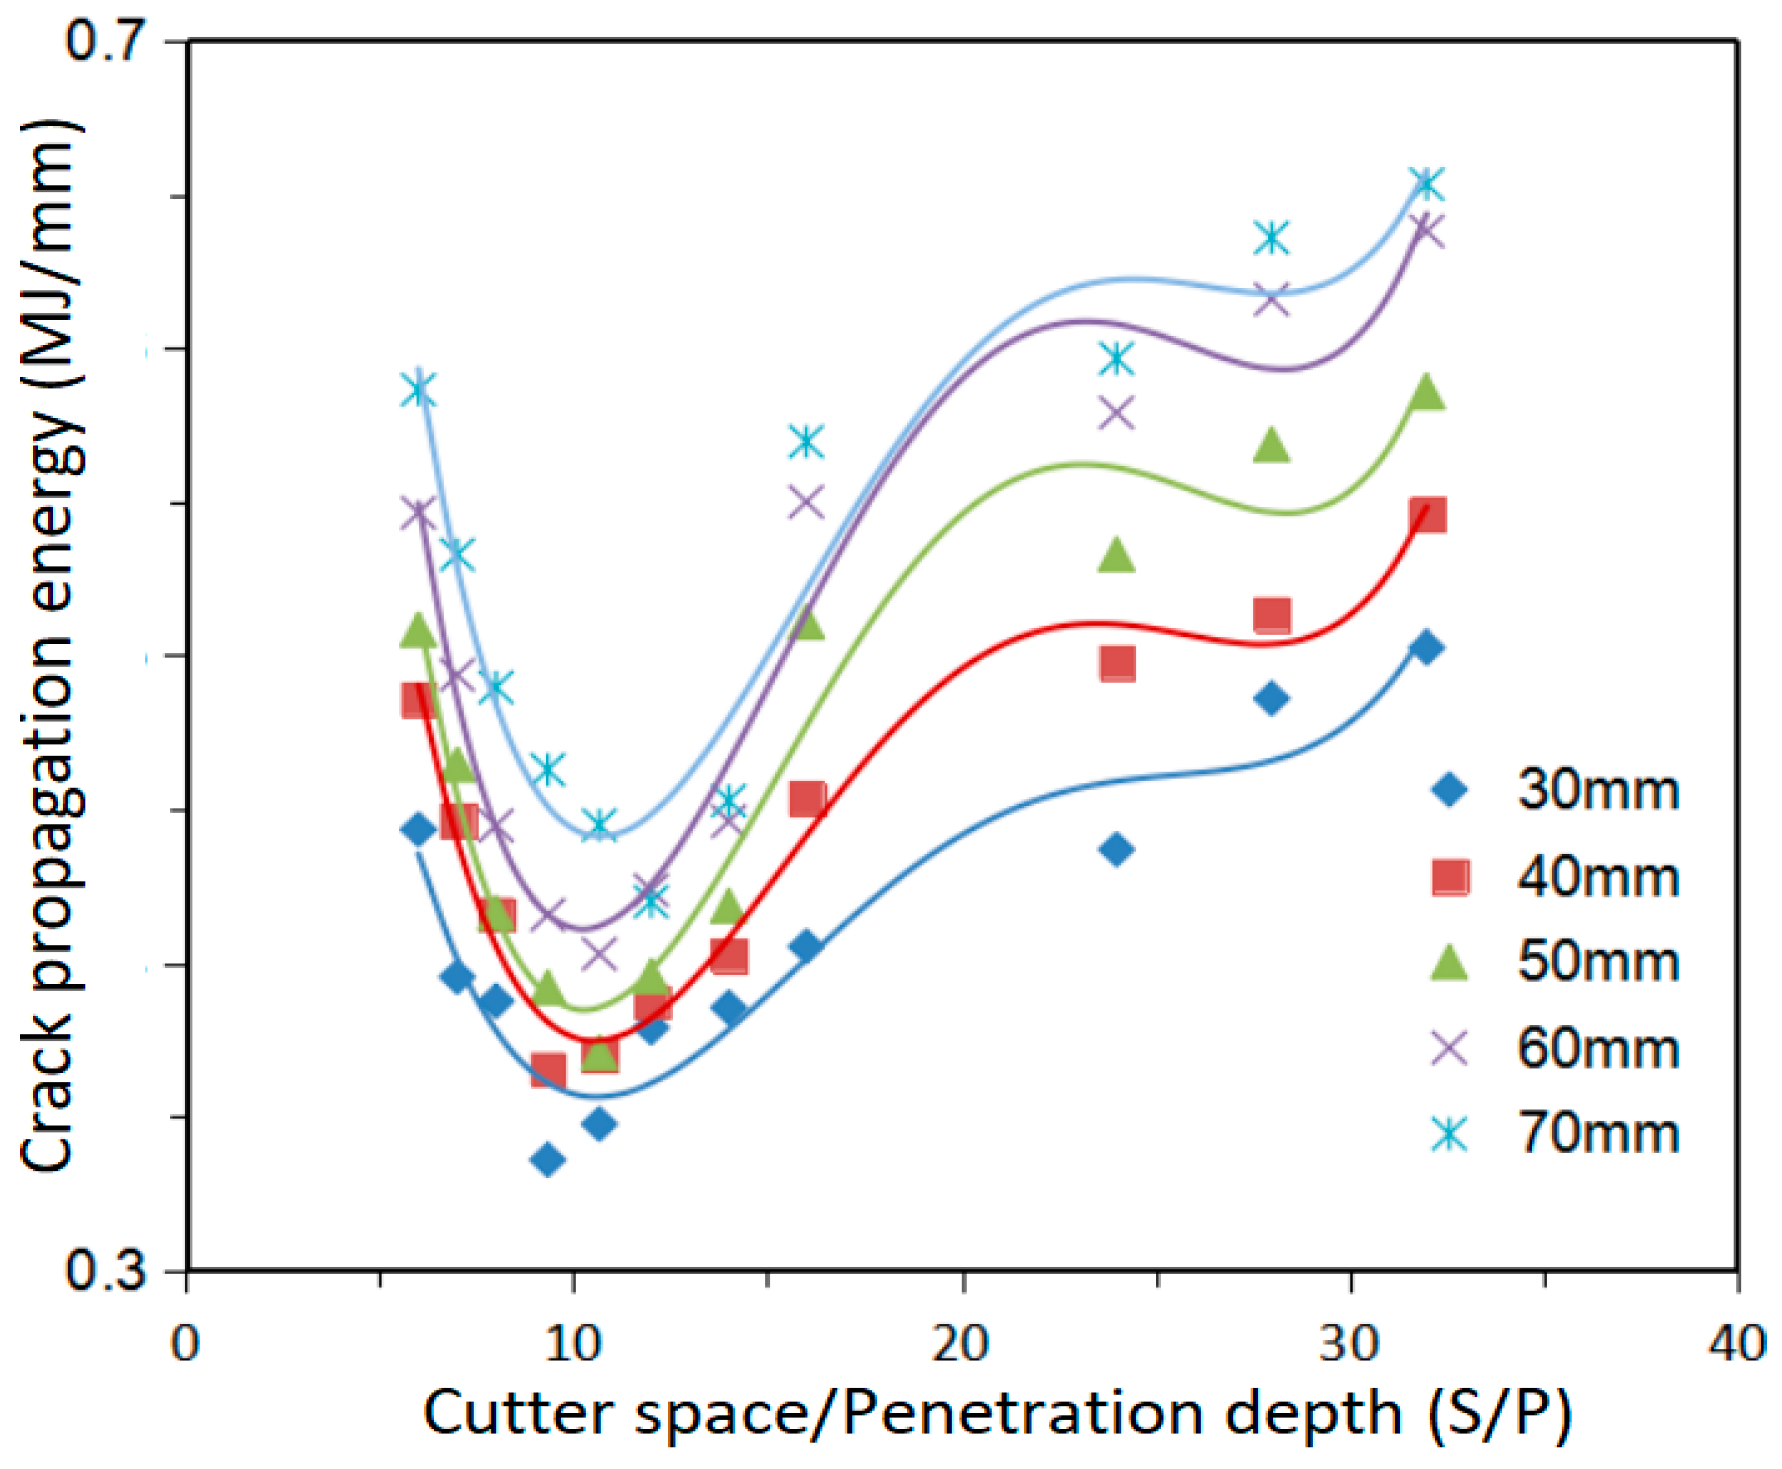
Figure 19 illustrates the energy consumption associated with crack propagation under varying cutting depths, as determined through high-speed photography observations of roller cutter operations. Consistent with the analytical approach employed for rock masses featuring different joint inclinations, the dispersed data points are fitted using a polynomial curve. The corresponding correlation coefficients and the ratios of optimal cutting distance to penetration depth (S/P) are summarized in Table 3. As shown in Figure 19, the trend in crack propagation energy consumption required for rock fragmentation exhibits a similar pattern across different joint spacings. The minimum energy consumption occurs when the S/P ratio is approximately 10. Computational results indicate that the optimal S/P value for jointed granite is 10, which aligns well with findings from prior studies. Deviations from this value—either higher or lower—lead to a significant reduction in rock fragmentation efficiency. When the S/P ratio equals to 10, rock failure is induced by the synergistic effect of pre-existing joints and the dual action of the roller cutters. For jointed granite specimens with roller cutter spacings ranging from 30 to 70 mm, smaller cutter spacing is more favorable for effective rock fragmentation.

5.2. Influence of Different Joint Conditions on the Optimization of Cutter Spacing

Maximum fragmentation efficiency is achieved when cutting is performed at the optimal S/P distance. Under such conditions, a dense crack network characterized by extensive crack development appears on the rock surface. The greater the number and length of cracks, the more efficient the fragmentation process. This phenomenon can be quantitatively described by the crack density Ks on the surface of the jointed rock mass after roller cutter-induced damage. Crack density Ks is defined as the total crack length per unit area and can be expressed as
K s = l S a b = l a b
Among these parameters, the rock fracture density Ks of the rock mass is defined as the average crack length per unit area within a specified region. S represents the cross-sectional area of the jointed rock mass, and a and b represent the length and width of the rock mass. In this study, the values of a and b are set to 200 mm and 140 mm, respectively. Rock fracture density serves as an indicator of the degree of rock fragmentation, and a higher rock fracture density corresponds to a more effective rock fragmentation performance.
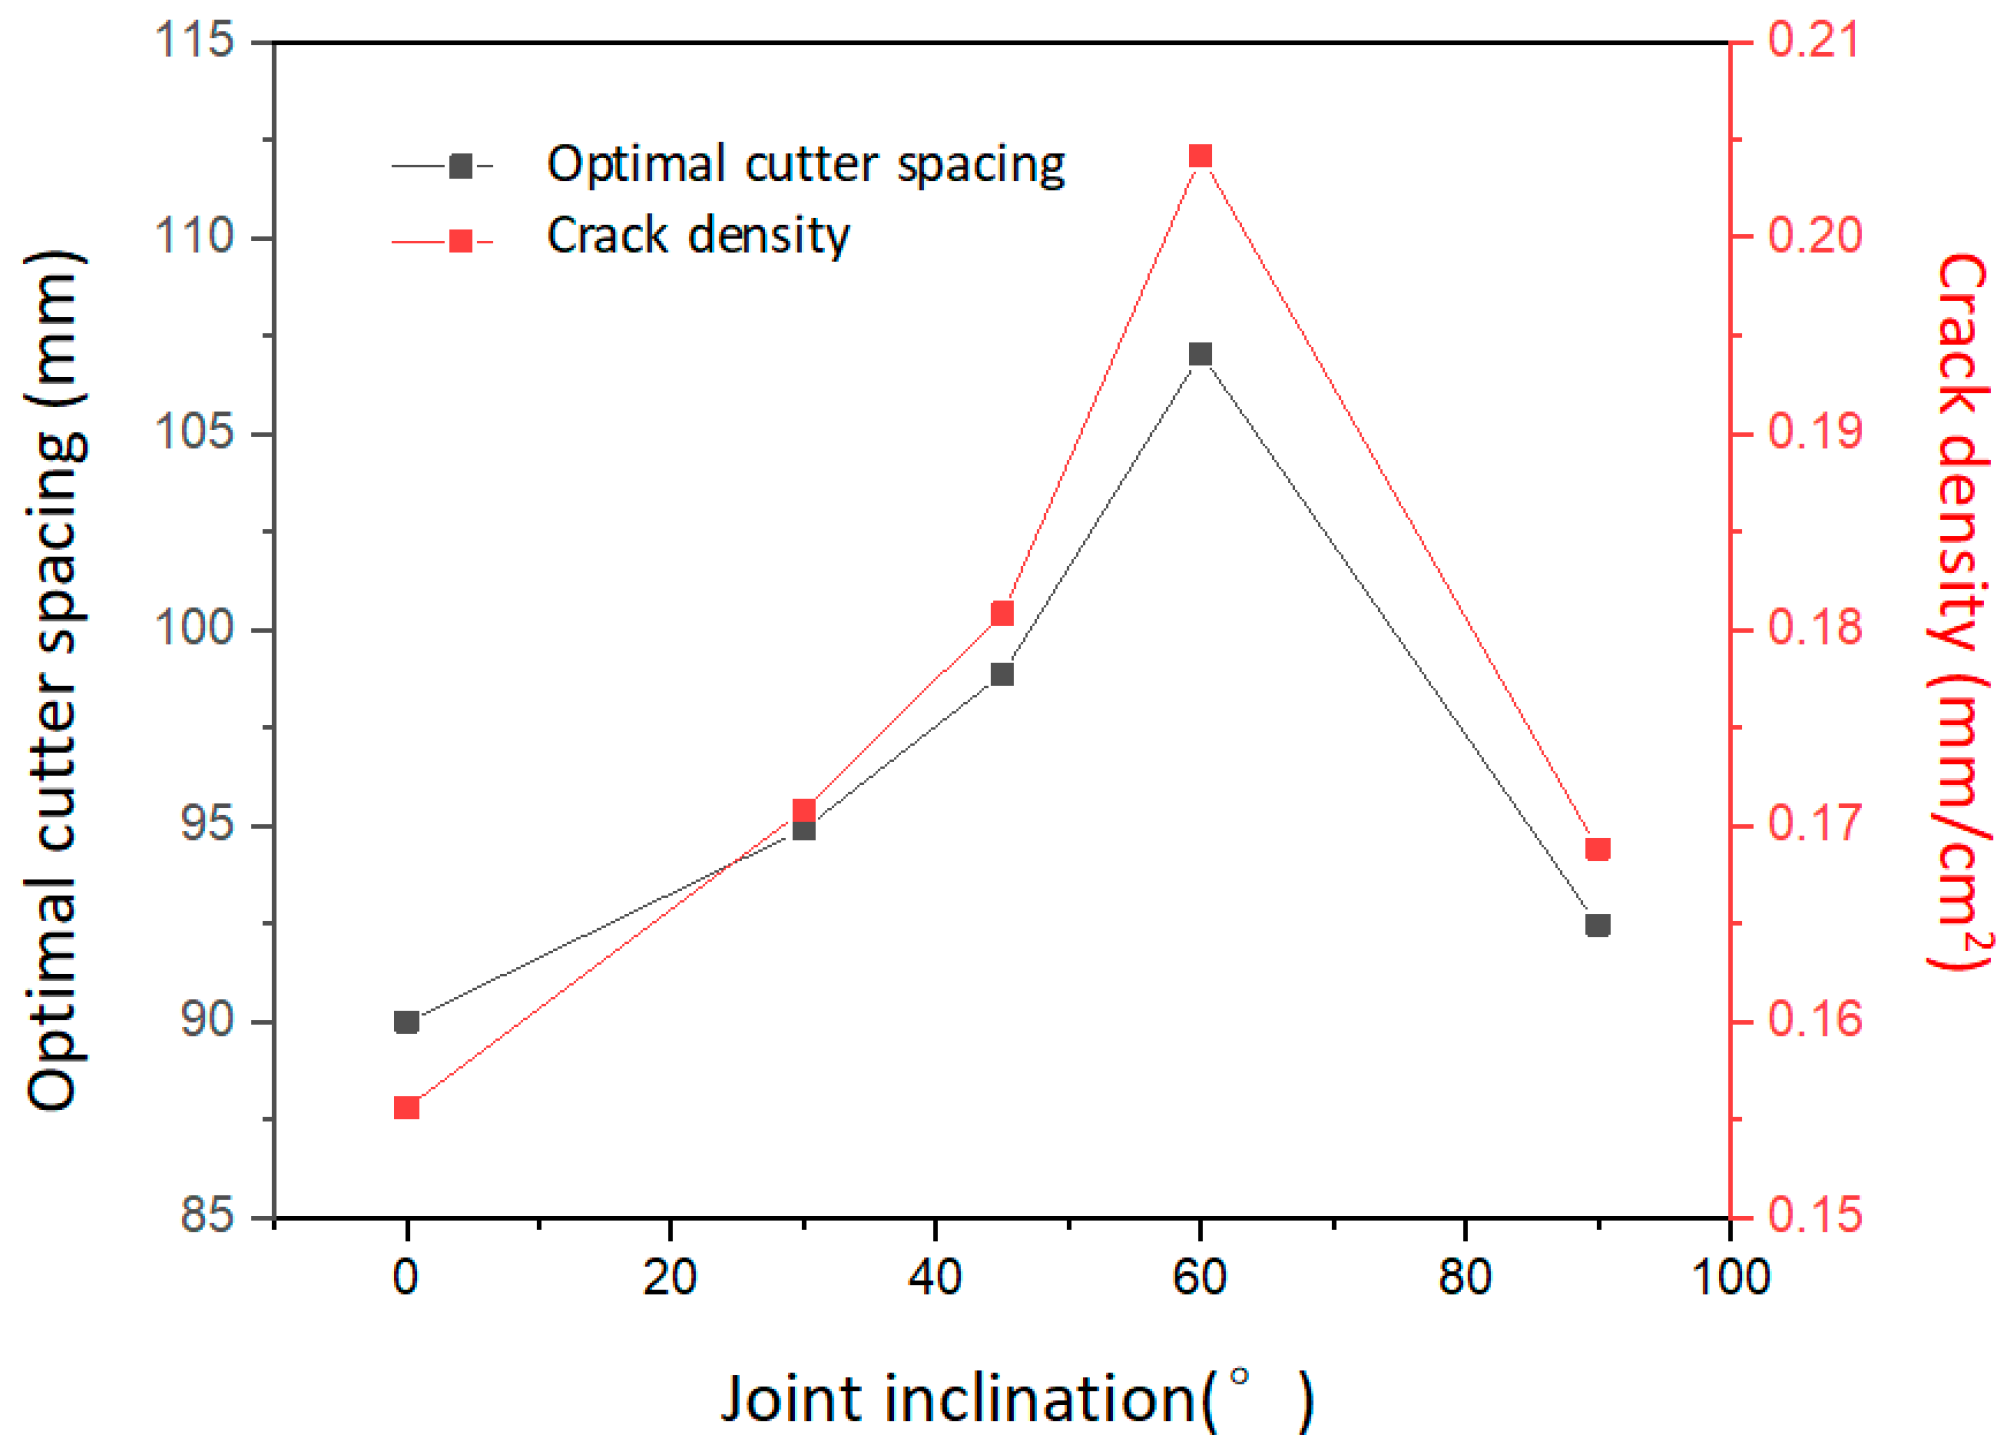
By comparing the optimal cutting spacing under varying joint dip angles with the corresponding rock fracture densities, the results illustrated in Figure 20 demonstrate a consistent trend between the variation in optimal cutting spacing and that of rock fracture density with respect to joint dip angle. When the joint dip angle is 60°, the average horizontal displacement of the rock mass reaches its maximum, promoting slippage along the joint surfaces during cutter penetration. This facilitates the formation of numerous wing-shaped cracks on the damaged joint surfaces. As these wing-shaped cracks propagate, they progressively coalesce into interconnected networks, leading to the generation of discrete rock blocks. Under this specific joint dip angle, the ratio of shear crack length to total crack length is also maximized. Consequently, among various failure modes, shear failure exhibits the highest failure efficiency. Therefore, when TBMs excavate rock masses with different joint dip angles, those with higher rock fracture density tend to exhibit greater rock fragmentation efficiency. The optimal cutting spacing refers to the cutter spacing that yields the highest rock fragmentation efficiency during TBM excavation, while rock fracture density reflects the overall efficiency of rock breakage. Therefore, the variation laws of rock fracture density and optimal cutting spacing with joint spacing in Figure 20 are consistent with the prediction.
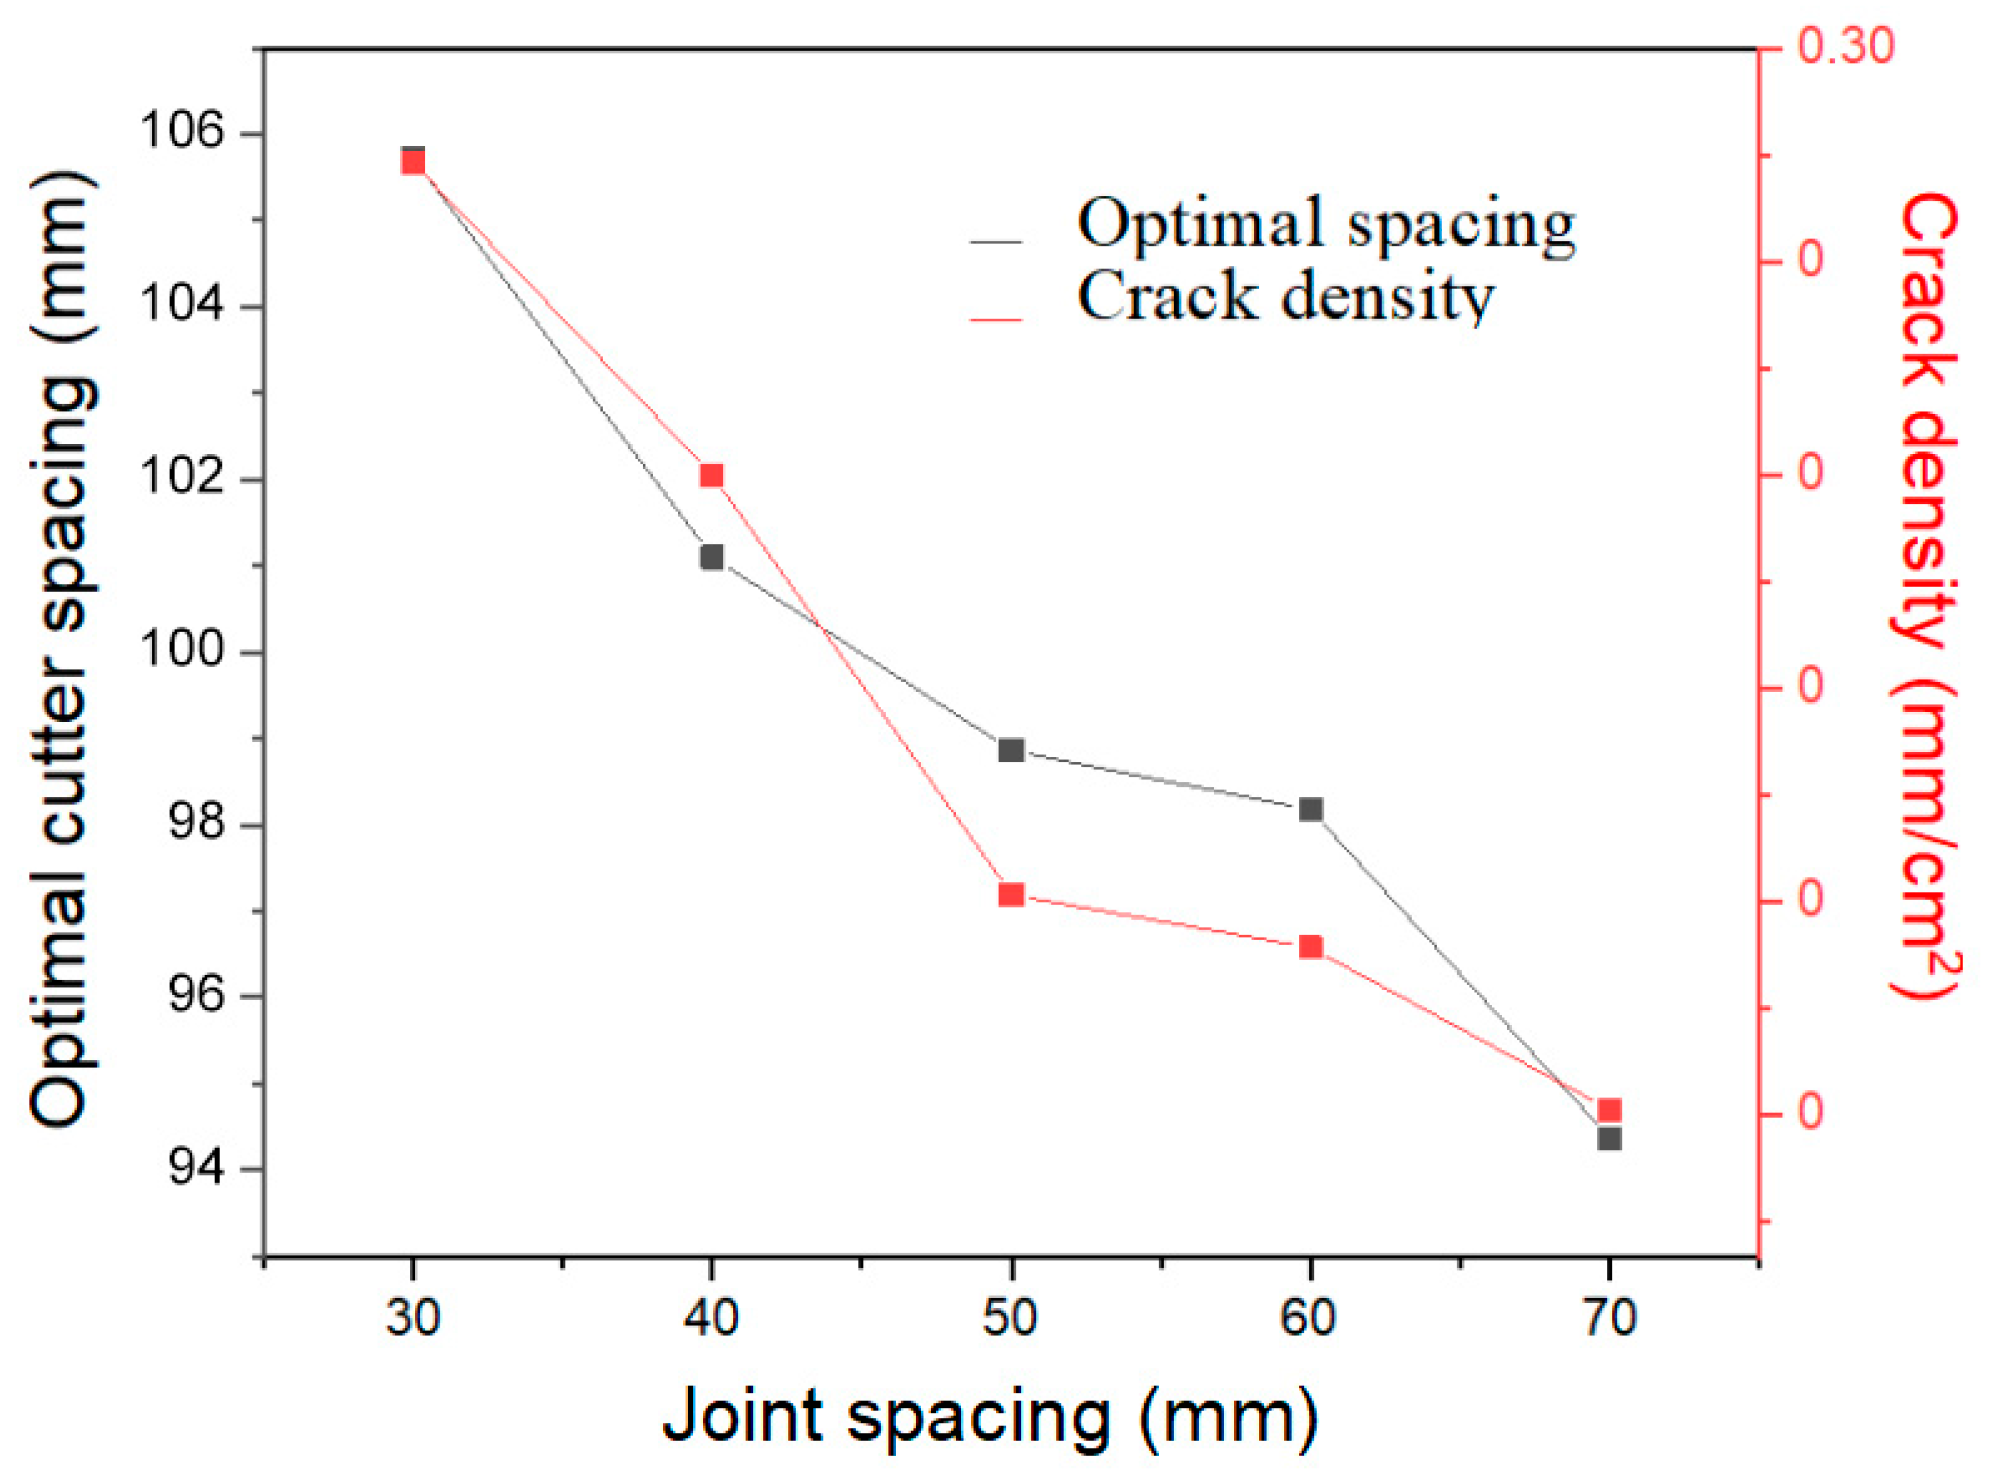
Generally, when the rock mass is intact, fragmentation induced by roller penetration initially occurs beneath the roller. As the roller progressively penetrates the rock, cracks propagating around the compact core located between the two rollers coalesce, leading to the formation of rock fragments. However, in the presence of a series of joint surfaces within the rock mass, cracking not only results from roller penetration but also predominantly initiates along these joint planes, which thereby actively participate in the fragmentation process. The smaller the joint spacing, the lower the overall integrity of the rock mass. In rock masses with reduced joint spacing, greater horizontal displacement occurs during roller penetration, increasing the likelihood of joint surface failure. Cracks developing along closely spaced joints exert a more significant destructive influence on the rock mass. Furthermore, in rock masses characterized by poor integrity and small joint spacing, shear cracks constitute a higher proportion of the total crack length. Due to the reduced joint spacing, under identical penetration depths, the rock mass experiences more extensive fragmentation, exhibits higher crack density, and achieves improved fragmentation efficiency, as illustrated in Figure 21. Consequently, as joint spacing increases, crack coalescence becomes less favorable, and the synergistic effect between the roller and joint surfaces in promoting fragmentation diminishes. This leads to a reduction in fragmentation efficiency and, accordingly, a decrease in the optimal cutting spacing for the rock mass.

6. Conclusions

This study examines the characteristics of penetration force-depth curves under varying cutter spacings during the failure process of jointed rock masses. It systematically evaluates the effects of cutter spacing, joint dip angle, and joint spacing on load fluctuation and residual load. From the perspective of rock-breaking mechanics, the influence of cutter spacing on rock fragmentation mechanisms is elucidated. By analyzing SE, crack propagation energy, and rock fragment formation patterns, the impact of cutter spacing and joint conditions on cutting efficiency is clarified. Based on the SE associated with crack extension, an optimization method for cutter spacing in jointed rock masses is proposed. The main conclusions are as follows.
(1)
The joint characteristics and cutter spacing significantly influence the rock-breaking performance and load behavior of rolling cutters. When the joint spacing exceeds 60 mm and the cutting tool spacing is approximately 100 mm, or when the joint inclination angle is 0° or 90°, lateral deformation at the joints of the rock mass is constrained, leading to pronounced fluctuations in the rolling cutter’s penetration force and elevated peak loads. During the residual phase, due to limited joint involvement and reduced frictional resistance, the penetration force remains relatively low. Conversely, under other conditions, the joint participation increases, resulting in higher rock-breaking forces.
(2)
The comparison of the calculation results of the energy consumption for rock fragmentation and the crack propagation energy ratio indicates that the crack propagation energy ratio proposed for the cutter penetration process can well characterize the rock fragmentation efficiency of jointed rock masses. The results show that in the tested groups, when the joint dip angle is 60°, the cutter spacing is 100 mm, and the joint spacing is 30 mm, rock fragmentation efficiency reaches its highest.
(3)
Through the calculation results of the crack propagation energy ratio of hammer rock fragmentation at different penetration depths, the fitting formulas of the crack propagation energy ratio under various joint conditions are proposed. In addition, it is found that the influence of the joint dip angle on the optimal cutter spacing is greater than that of the joint spacing. As the joint spacing increases, the value of the optimal cutter spacing of the hammer decreases. When the joint spacing is 70 mm, the corresponding optimal cutter spacing is 100.7 mm. When the joint dip angle increases from 0° to 60°, the optimal cutter spacing gradually increases to 112.8 mm. When the joint spacing is greater than 60 mm, the optimal hammer spacing of the hammer gradually decreases.
The relevant research results of the present study can provide certain technical references for TBM shield tunneling construction under jointed rock mass conditions. It should be noted that this study is limited to tests under a single penetration depth of 10 mm and only uses granite as the research object, and the static indentation is used to simulate actual rolling cutting. Future work will further expand the present study to cover other rock types and more practical engineering conditions.

Author Contributions

Conceptualization—P.S.; methodology—Z.T.; data collection and analysis—B.L.; data curation and writing—J.X. and J.L.; original draft preparation, C.Y., J.S. and D.Y.; writing—review and editing and supervision, Y.P. All authors have read and agreed to the published version of the manuscript.

Funding

This research is funded by the Basic and Applied Basic Research Foundation of Guangdong Province, China (2022A1515110766).

Data Availability Statement

The original contributions presented in this study are included in the article. Further inquiries can be directed to the corresponding author(s).

Conflicts of Interest

Authors Pengfei Song, Zhiwen Tan, Chengzhi Yi, Jia Shi and Daibiao Yin were employed Company China Construction Tunnel Construction Co., Ltd. Authors Bingquan Liu and Yunchong Peng were employed Company China Construction International Construction Co., Ltd. The authors declare no conflicts of interest.

References

  1. Yang, H.Q.; Liu, B.L.; Wang, Y.Q.; Li, C.C. Prediction Model for Normal and Flat Wear of Disc Cutters during TBM Tunneling Process. Int. J. Geomech. 2021, 21. [Google Scholar] [CrossRef]
  2. Farrokh, E. Optimum design specifications of TBM cutterheads in soft ground conditions based on field data analysis. Tunn. Undergr. Space Technol. 2025, 161, 106522. [Google Scholar] [CrossRef]
  3. Zhang, R.Q.; Su, D. Study on the influence of revolving patterns of cutterheads on tunneling operations concerning the box-jacking construction with an extra large rectangular tunnel profile via discrete-continuum coupling. Comput. Geotech. 2024, 176. [Google Scholar] [CrossRef]
  4. Mo, X.D.; Xia, M.Y.; Mei, S.P.; Hu, X.F.; Zhou, X.W. Deep reinforcement learning-based optimization for machining process: Cutting parameters dynamic optimization considering tool condition degradation. J. Manuf. Process. 2025, 156, 1006–1031. [Google Scholar] [CrossRef]
  5. Wang, T.; Yan, C.Z.; Zheng, H. Investigation on rock breaking and optimum spacing of TBM cutters under confining stress using a continuum-discontinuum method. Eng. Anal. Bound. Elem. 2024, 165, 105775. [Google Scholar] [CrossRef]
  6. Liu, B.; Yu, H.; Li, B.; Wang, Y.X. Full-scale rotary cutting tests to investigate the predictive model for TBM disc cutter three-directional cutting forces. Tunn. Undergr. Space Technol. 2026, 170, 107327. [Google Scholar] [CrossRef]
  7. Wang, T.; Yan, C.Z.; Zheng, H.; Ke, W.H.; Ali, S. Optimum spacing and rock breaking efficiency of TBM double disc cutters penetrating in water-soaked mudstone with FDEM. Tunn. Undergr. Space Technol. 2023, 138, 105174. [Google Scholar] [CrossRef]
  8. Yu, H.; Li, B.; Li, H.X.; Ren, K.Y.; Li, Y.H. Study on disc cutter rock breaking performance under confining conditions based on a novel platform with full-scale rotary cutting tests. Eng. Fract. Mech. 2026, 331, 111717. [Google Scholar] [CrossRef]
  9. Wang, Z.Y.; Liu, C.L.; Jiang, Y.S. Study on Wear Prediction of Shield Disc Cutter in Hard Rock and Its Application. KSCE J. Civ. Eng. 2022, 26, 1439–1450. [Google Scholar] [CrossRef]
  10. Geng, Q.; Wei, Z.Y.; Meng, H. An experimental research on the rock cutting process of the gage cutters for rock tunnel boring machine (TBM). Tunn. Undergr. Space Technol. 2016, 52. [Google Scholar] [CrossRef]
  11. Ling, J.X.; Sun, C.; Wang, Q.T.; Zhang, H. Analysis of Rock Breaking Load Characteristics and Efficiency Optimization of Roller Cutters under Multi-Factor Coupling. KSCE J. Civ. Eng. 2024, 28, 4055–4066. [Google Scholar] [CrossRef]
  12. Gertsch, R.; Gertsch, L.; Rostami, J. Disc cutting tests in Colorado Red Granite: Implications for TBM performance prediction. Int. J. Rock Mech. Min. Sci. 2006, 44. [Google Scholar] [CrossRef]
  13. Lu, G.; Liu, Z.; Zhang, Y.; Fan, W. Experimental research on the rotary rock-breaking effect of tunnel boring machine cutters assisted by microwave irradiation. Tunn. Undergr. Space Technol. 2025, 159, 106512. [Google Scholar] [CrossRef]
  14. Cho, J.W.; Seokwon, J.; Jeong, H.Y.; Chang, S.H. Evaluation of cutting efficiency during TBM disc cutter excavation within a Korean granitic rock using linear-cutting-machine testing and photogrammetric measurement. Tunn. Undergr. Space Technol. Inc. Trenchless Technol. Res. 2013, 35, 37–54. [Google Scholar] [CrossRef]
  15. Johnson, K.L. Contact Mechanics; Cambridge University Press: Cambridge, UK, 1985; pp. 7–13. [Google Scholar]
  16. Alehoseein, H.; Detournay, E.; Huang, H. An analytical model for the indentation of rocks by blunt tools. Rock Mech. Rock Eng. 2000, 33, 267–284. [Google Scholar] [CrossRef]
  17. Jeong, Y.; Choi, J.; Chae, B.G. Interpretation of geometrical characteristics of joints using drill core. J. Eng. Geol. 2024, 28, 95–106. [Google Scholar] [CrossRef]
  18. Yang, H.Q.; Liu, J.F.; Liu, B.L. Investigation on the Cracking Character of Jointed Rock Mass Beneath TBM Disc Cutter. Rock Mech. Rock Eng. 2018, 51. [Google Scholar] [CrossRef]
  19. Guo, Z.G.; Wang, J.; Lv, S.; Yu, D.Y.; Zhang, X. Rock Breaking Performance of Two Disc Cutters of Tunnel Boring Machine for Safe Tunneling in Unstable Coal Rock Stratum. Int. J. Saf. Secur. Eng. 2020, 10, 639–646. [Google Scholar] [CrossRef]
  20. Du, W.R.; Fang, Y.; Wang, Y.B.; Yang, Q.Z.; Zhuo, B.; Gao, J.Q. Wear characteristics and prediction of SPB shield disc cutter in cemented sand pebble stratum. Wear 2026, 15, 206416. [Google Scholar] [CrossRef]
Figure 1. Preparation and maintenance of rock samples.
Infrastructures 11 00137 g001
Figure 2. Schematic diagram of rock samples, where α denotes the joint dip angle, S denotes the joint spacing, and D denotes the cutter spacing.
Infrastructures 11 00137 g002
Figure 3. The picture of the joints in the specimen before and after bonding: (a) before bonding; (b) after bonding and grinding.
Infrastructures 11 00137 g003
Figure 4. Dimension drawing of cutter: (a) front view; (b) I-I section drawing; (c) bottom view.
Infrastructures 11 00137 g004
Figure 5. Design and assembly renderings of other devices.
Infrastructures 11 00137 g005
Figure 6. Invasion force-penetration depth curve of cutter under different cutter spacings (a), different joint dip angles (b), and different joint spacings (c).
Infrastructures 11 00137 g006
Figure 7. Average intrusion force and standard deviation of rock-breaking process under different cutter spacings: (a) α = 45°, S = 40 mm; (b) D = 80 mm, S = 40 mm; (c) α = 45°, D = 80 mm.
Infrastructures 11 00137 g007
Figure 8. Peak strength of cutter under different cutter spacings: (a) 40 mm joint spacing, 45° joint inclination; (b) 80 mm cutter spacing, 40 mm joint spacing; (c) 80 mm cutter spacing, 45° joint inclination.
Infrastructures 11 00137 g008
Figure 9. Horizontal displacement of jointed rock mass under different cutter spacings: (a) 40 mm joint spacing, 45° joint inclination; (b) 40 mm joint spacing, 80 mm cutter spacing; (c) 45° joint inclination, 80 mm cutter spacing.
Infrastructures 11 00137 g009
Figure 10. Ratio of cutter residual load to peak load under different cutter spacings and different joint conditions: (a) 40 mm joint spacing, 45° joint inclination; (b) 40 mm joint spacing, 80 mm cutter spacing; (c) 45° joint inclination, 80 mm cutter spacing.
Infrastructures 11 00137 g010
Figure 11. Rock-breaking state diagram of cutter under different joint dip angles.
Infrastructures 11 00137 g011
Figure 12. Rock-breaking state diagram of cutter under different joint spacings.
Infrastructures 11 00137 g012
Figure 13. Formation mode of rock slag in jointed rock mass under different cutter spacings: (a) single cutter rock-breaking mode; (b) dual cutter cooperative rock-breaking mode; (c) single cutter and joint rock-breaking mode; (d) dual cutter and joint rock-breaking mode.
Infrastructures 11 00137 g013
Figure 14. Particle size distribution of rock slag.
Infrastructures 11 00137 g014
Figure 15. Histogram of particle size distribution of rock slag: (a) distribution of rock particle sizes for different joint inclination angles; (b) distribution of rock particle sizes for different joint spacings.
Infrastructures 11 00137 g015
Figure 16. Variations in the crack propagation SE (a) and SE (b) with joint orientation for different cutter spacings when joint spacing equals 50 mm.
Infrastructures 11 00137 g016
Figure 17. Variations in the crack propagation SE (a) and SE (b) with joint spacing for different cutter spacings, when joint orientation equals 45°.
Infrastructures 11 00137 g017
Figure 18. The variations in crack propagation SE with joint orientation at different S/P.
Infrastructures 11 00137 g018
Figure 19. The crack propagation SE versus S/P for different joint spacings.
Infrastructures 11 00137 g019
Figure 20. Variations in the optimal cutter spacing and crack density with joint orientation.
Infrastructures 11 00137 g020
Figure 21. Variations in the optimal cutter spacing and crack density with joint spacing.
Infrastructures 11 00137 g021
Table 1. Value table of broken thickness ratio of rock slag.
Cutter Space/mm6080100120
λ 0.2370.2280.2130.203
Table 2. The optimal S/P at different joint orientations determined by the fitting equation.
Joint Dip Angle/°Fitting FormulaR2Optimal S/P
0y = 9.473e − 6x4 − 0.0007501x3 + 0.02046x2 − 0.2174x + 1.4150.81618.8097
30y = 7.311e − 6x4 − 0.0005938x3 + 0.01665x2 − 0.1796x + 1.1580.9695 9.4134
45y = 1.072e − 5x4 − 0.0008826x3 + 0.02539x2 − 0.2886x + 1.5070.94710.2612
60y = 1.012e − 5x4 − 0.0008229x3 + 0.02381x2 − 0.2812x + 1.5050.984611.2883
90y = 1.012e − 5x4 − 0.0007937x3 + 0.02133x2 − 0.2187x + 1.2820.93289.3599
Table 3. The optimal S/P at different joint spacings determined by the fitting equation.
Joint Dip Angle/°Fitting FormulaR2Optimal S/P
30y = 5.633e − 6x4 − 0.0004648x3 + 0.01357x2 − 0.1578x + 0.98660.920310.5913
40y = 8.689e − 6x4 − 0.0007158x3 + 0.02071x2 − 0.2387x + 1.320.97610.5394
50y = 1.072e − 5x4 − 0.0008826x3 + 0.02539x2 − 0.2886x + 1.5070.94710.2612
60y = 1.171e − 5x4 − 0.0009634x3 + 0.02771x2 − 0.3145x + 1.6320.954810.2186
70y = 9.982e − 6x4 − 0.0008406x3 + 0.02487x2 − 0.2924x + 1.6210.92410.0776
Disclaimer/Publisher’s Note: The statements, opinions and data contained in all publications are solely those of the individual author(s) and contributor(s) and not of MDPI and/or the editor(s). MDPI and/or the editor(s) disclaim responsibility for any injury to people or property resulting from any ideas, methods, instructions or products referred to in the content.