Article

Impact of the Accessibility Generated by the Mexicali–San Felipe Highway on Reduction in Marginalization Levels in the Urban Periphery and Sub-Urban Areas


by
Leonel García
,
José Manuel Gutiérrez-Moreno
,
Alejandro Sánchez-Atondo
*,
Alejandro Mungaray-Moctezuma
,
Marco Montoya-Alcaraz
and
Julio Calderón-Ramírez
*
Facultad de Ingeniería, Universidad Autónoma de Baja California, Mexicali 21280, Mexico
*
Authors to whom correspondence should be addressed.
Infrastructures 2026, 11(3), 82; https://doi.org/10.3390/infrastructures11030082
Submission received: 31 December 2025 / Revised: 17 February 2026 / Accepted: 28 February 2026 / Published: 5 March 2026

Abstract

The objective of this research is to determine whether levels of road accessibility in urban, peri-urban, and sub-urban localities within the municipalities of Mexicali and San Felipe, in Baja California, Mexico, can be associated with processes of territorial expansion, population growth, and changes in urban marginalization levels. This is assessed through a methodology that combines ex-ante and ex-post analysis, the use of the Urban Marginalization Index (UMI) at the AGEB scale, and a hierarchical accessibility classification (Levels A, B, and C), thereby contributing a replicable tool for analyzing socio-spatial impacts derived from road infrastructure. To this end, modernization, maintenance, and reconstruction works, as well as the construction of an interchange carried out between 2006 and 2017 along Federal Highway No. 5—specifically the Mexicali–San Felipe section—were examined in relation to the accessibility they provide to ten nearby localities. UMI values were estimated for 134 AGEB using data from 2000, 2010, and 2020, which enabled the assessment of changes in quality of life before, during, and after the execution of these works. The results show significant population growth in six localities, accompanied by territorial expansion processes. Localities with direct connection to the study corridor tended to exhibit middle to low marginalization levels, while those with indirect accessibility or direct access through another federal highway section tended toward middle to high levels, with some shifting to middle to low. It is concluded that road accessibility constitutes a relevant factor in the progressive improvement in socioeconomic conditions and quality of life in urban, peri-urban, and sub-urban areas.

1. Introduction

Road accessibility is a strategic factor that should be considered as a public policy instrument for the territorial, economic, and social development of localities in any state, region, or country, given that goods and people are transported through these networks [1,2,3,4,5]. Moreover, road infrastructure promotes, in its immediate surroundings, the construction of facilities related to education, healthcare, and basic household services, among other uses [6,7], all of which are fundamental elements for the development of populations and of sparsely urbanized or isolated territories [8].
In addition to contributing to a country’s improved competitiveness—derived from increased productivity and the optimization of the movement of goods and passengers—road infrastructure generates positive effects on well-being by helping to reduce social inequality and poverty [9,10]. At present, it is the primary means of transporting goods and connecting people across regions in Mexico, mobilizing 96.0% of annual passengers and carrying 55.0% of freight nationwide [11].
In Mexico, road infrastructure is primarily categorized into three types, each distinguished by specific geometric characteristics and physical conditions: federal corridors, feeder or secondary roads, and rural roads [12]. On the one hand, the federal network serves to connect the country’s major population, production, and consumption centers through extensive corridors that generally consist of four or more lanes and often traverse multiple states [13]. On the other hand, the feeder or secondary network integrates sub-urban localities with urban centers and productive hubs by means of road links that typically comprise two lanes and connect directly to the federal network [13]. In turn, the rural network provides access to small, hard-to-reach rural localities via roads with basic design features that may be either paved or unpaved [13].
Thus, accessibility to a federal highway corridor can serve as a significant factor enabling a wide spectrum of productive activities for residents of localities situated along the corridor’s alignment [14]. This effect is even more pronounced for those located in sub-urban areas or at a considerable distance from the municipal seat, given their need to consolidate and expand urban development [15]. Consequently, the territorial impact of federal road infrastructure depends on several factors, among which the layout, distances, and intersections with other axes are particularly significant [1,16,17]. Additionally, secondary road sections and rural roads, together with federal highway corridors, form an integrated network that enhances territorial accessibility and thereby supports the population’s basic needs [18], underscoring that secondary and rural roads are just as important as the federal highway network [19,20].
In light of the above, it is essential to make full use of the resources invested in road infrastructure, particularly in countries where opportunity costs directly affect the social development of regions with high marginalization levels, as is the case in Mexico [21]. It is therefore crucial to invest not only in the construction of new infrastructure but also in the maintenance and modernization of existing systems, given that the social and economic development of each region—as well as long-term sustainability—depends on the performance and reliability of these networks [7,22,23,24].
For this reason, the objective of the present study is to determine whether levels of road accessibility in localities characterized by different urban conditions (urban, peri-urban, or sub-urban) within the municipalities of Mexicali and San Felipe, Baja California, Mexico, can be associated with territorial and population growth, as well as with changes in urban marginalization levels, through improvements in housing conditions and access to basic services such as education and healthcare. It is also important to clarify that the analysis considers only the road accessibility generated by the federal and feeder (secondary) networks in peri-urban and sub-urban areas. This decision follows from the choice to use the Basic Geostatistical Area (AGEB, the acronym in Spanish) as the unit of territorial delimitation, given that AGEB can be located in urban and sub-urban zones. Rural areas and the rural roads are therefore excluded from the analysis.
However, in order to measure the impact generated by road infrastructure and the accessibility that it provides to a territory, it is necessary to evaluate the level of marginalization experienced by the population, which in turn reflects overall quality of life [1]. For this reason, the study also develops an Urban Marginalization Index (UMI) for urban, sub-urban, and peri-urban localities in the southern periphery of the municipal seat of Mexicali, Baja California, Mexico. These localities are connected, either directly or indirectly, to Federal Highway No. 5 along the Mexicali–San Felipe section. The index is constructed using the following indicators: educational conditions—(1) population aged 15 years or older with no schooling or incomplete primary education; access to healthcare—(2) population without access to health services; and housing conditions—(3) occupied housing units with earthen floors, (4) occupied housing units without electricity, (5) occupied housing units without piped water, and (6) occupied housing units without drainage.
In 1995, the National Population Council (CONAPO, the acronym in Spanish) carried out the first calculation of the Urban Marginalization Index (UMI) in Mexico, applying the indicator to each federal entity and municipality [25]. It should be noted that this indicator has been evaluated in the country every five years since it was first calculated, using the AGEB as the minimum territorial delimitation, as well as the population and housing data published by the National Institute of Statistics and Geography (INEGI, the acronym in Spanish) during the five-year period, through quick counts, and in the zero-year period, through censuses [26]. This approach provides estimates that make it possible to understand marginalization patterns within urban and sub-urban localities, and it has become one of the principal analytical and operational tools for designing social policies and strategies aimed at addressing the population’s socioeconomic disadvantages [1,25,26,27].
However, this research used the methodology developed by CONAPO to create its own estimate of the UMI, considering specific socioeconomic variables from 10 localities, and taking into account the population and housing censuses of 2000, 2010, and 2020. Furthermore, there is evidence that this methodology has been used in other studies to develop their own indicator in specific geographical areas with territorial inequalities [1,28,29,30,31,32].

2. Background and Area of Study

This section presents the characteristics that define the study corridor, organized into its main subsections, to determine the impact on the territory and the population in the case study. The Mexicali–San Felipe corridor covers a distance of 190 km, beginning in the city of Mexicali—the principal urban center and the municipal seat of Mexicali—and extending to the locality and municipality of San Felipe, heading south within the state of Baja California (Figure 1).
It is important to note that the corridor provides access to the regional road network for several localities, most of which are located in the agricultural zone of the Mexicali Valley, in the southeastern portion of the municipality of Mexicali. Within this area, six localities are classified as sub-urban and face shortages of basic infrastructure and services, including potable water supply and sanitation systems [25,26]. For the purposes of the present study, ten localities were selected based on their proximity to the highway corridor, as well as their population size and territorial extent. Nine of these localities are situated within the municipality of Mexicali, and one is located within the municipality of San Felipe.
The municipality of Mexicali serves as the capital of the state of Baja California and covers slightly more than 10,000 km2. It is located in the northeastern part of the state and borders the city of Calexico, situated in Imperial Valley County, California, United States [34]. The municipality of San Felipe, in turn, spans nearly 11,000 km2 and is located in the eastern portion of the state, sharing a large stretch of coastline with the Gulf of California [35].
Over time, the Mexicali–San Felipe corridor has undergone multiple modernization, maintenance, and reconstruction efforts, as well as the construction of an interchange. For the period considered in this study, the analysis begins with the modernization works carried out from early 2006 through 2011, aimed at improving connectivity among cities, ports, the border region, and tourist destinations, with plans to integrate secondary or feeder roads into the corridor [15,36]. Maintenance activities completed in 2013 between km 106 and km 111 were also reviewed [37]. In addition, construction of the El Faro Interchange began in 2014 at km 38 and was completed in 2015, with the objective of enhancing safe access to the Mexicali Valley [37]. Furthermore, in 2017, reconstruction works were conducted starting at km 181, along a 10 km section that leads to a feeder road [37].
The planning and execution of these maintenance and modernization works were carried out by the state and federal governments with the objective of strengthening the corridor running from north to south [37]. This corridor begins in the city of Mexicali and follows the coastline of the Gulf of California, crossing the municipality of San Felipe and its principal locality of the same name, before connecting with other routes such as Federal Highway No. 3, which provides access to the Pacific Ocean and, further south, to additional localities within the municipality.
This study demonstrates that the modernization of the Mexicali–San Felipe corridor contributes to improved economic and social conditions in six of the ten localities with the largest populations and territorial extent. To assess these effects, ex-ante UMI estimates (for the year 2000) and ex-post estimates (for 2010 and 2020) were generated, following the methodological framework that guides investment decisions within Mexico’s Ministry of Infrastructure, Communications and Transportation (SICT, the acronym in Spanish), in accordance with the guidelines established in the Federal Expenditure Budget.

2.1. Road Sections and Geometric Characteristics

To better analyze the territorial impact of the Mexicali–San Felipe corridor, it was divided into three sections (Figure 2).
The first section extends from km 0 to km 38, beginning in the municipal seat of Mexicali and ending at the El Faro Interchange. This section provides direct or indirect access to nine of the ten selected localities. Throughout the 38 km, the corridor comprises two asphalt-paved roadways—one for southbound travel and one for northbound travel—separated by a central median ranging from 3 m to 6 m in width (Figure 3). Each direction includes two 3.5 m lanes and a 3 m outer shoulder.
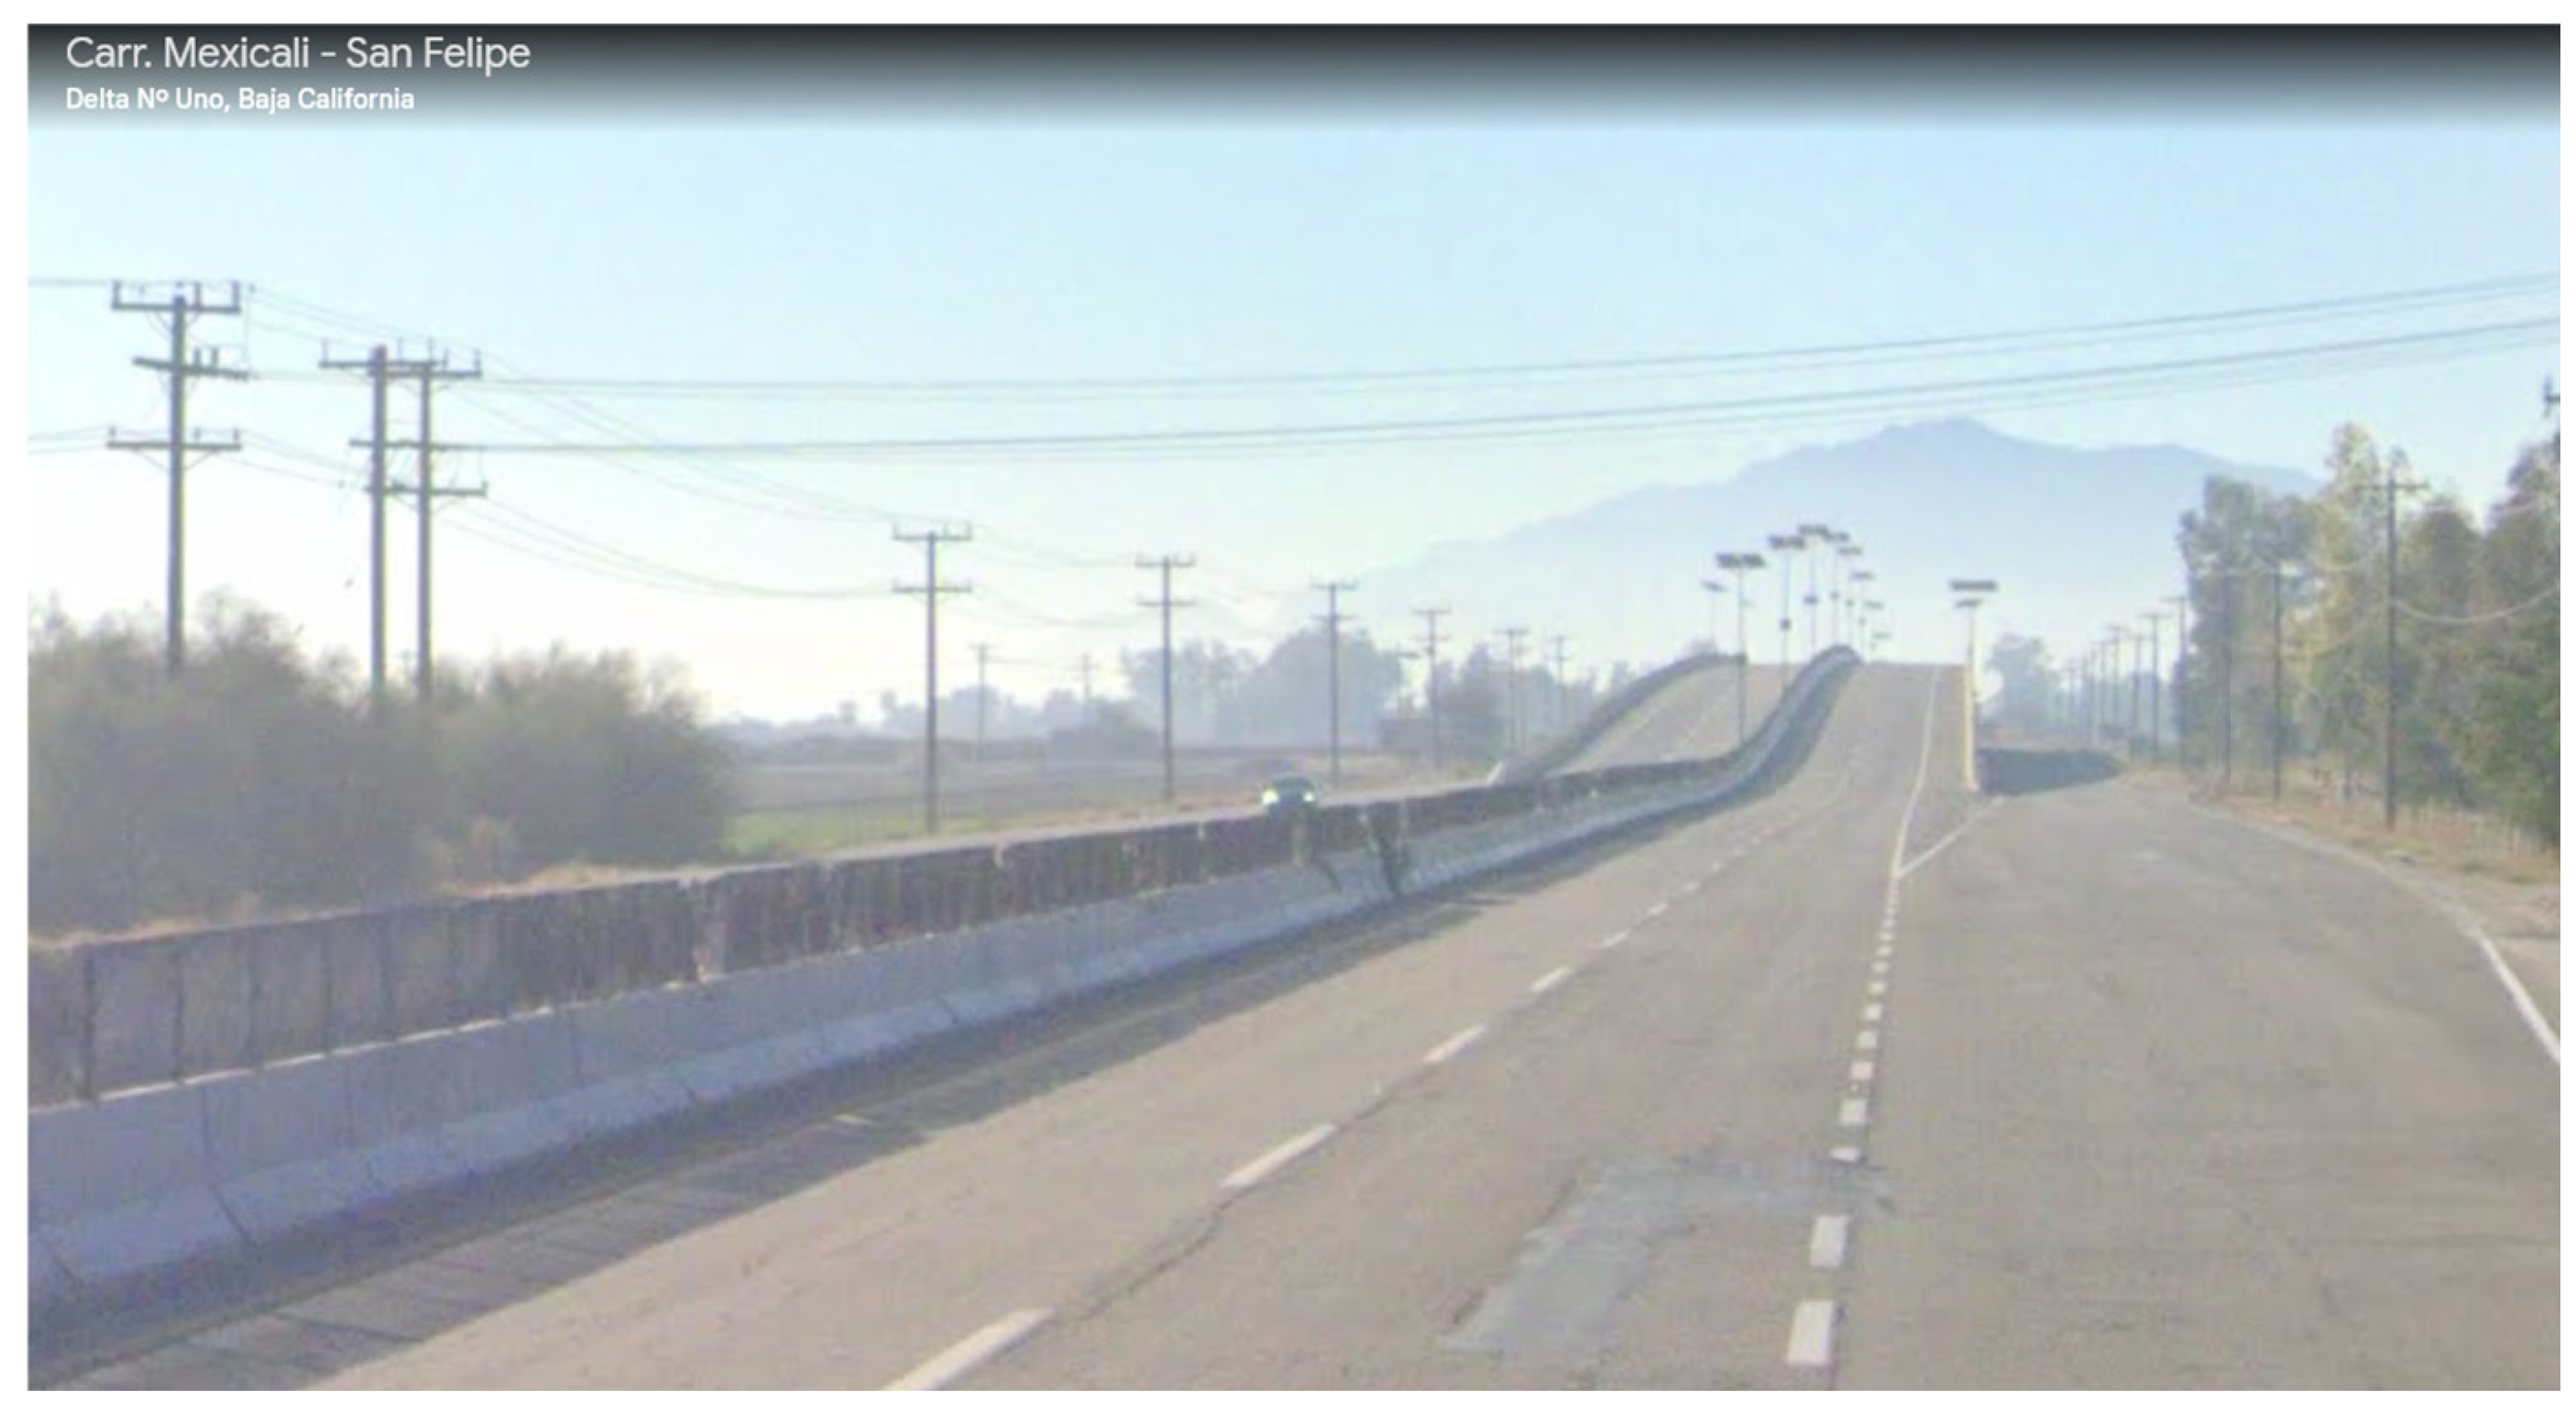
The second section begins south of the El Faro Interchange and covers approximately 122 km, from km 38 to km 160, reaching the area known as El Chinero. At the start of the interchange, the corridor consists of two separate asphalt-paved roadways, one in each direction, separated by a central concrete barrier (Figure 4).
Each direction includes two 3.5 m lanes and a 2.5 m outer shoulder. However, beyond the interchange and up to km 160, the corridor becomes a two-lane undivided section, with one 3.5 m lane in each direction and 2.5 m outer shoulders (Figure 5).
It is important to note that before reaching km 141, the El Chinero Interchange appears, where Federal Highway No. 5 (Mexicali–San Felipe) intersects with Federal Highway No. 3 (Figure 6).
Regarding the third section, which extends from the area known as El Chinero to the city of San Felipe, from km 160 to km 190, the corridor consists of two asphalt-pavement roadways—one for outbound traffic and one for inbound traffic—separated by a central median strip measuring 3 m in width (Figure 7). Each one has two lanes of 3.5 m each and an external shoulder measuring 3 m.

2.2. Economic and Demographic Impacts Along the Study Corridor

The combined population of the ten localities increased from 611,823 inhabitants in 2000 to 774,957 in 2010 and 813,092 in 2020 [33,39,40] (Table 1), representing a 32.0% growth from 2000 to 2020. Despite this overall trend, population growth in some localities has stabilized or increased only slightly (Ciudad Coahuila, Delta, Michoacán de Ocampo, and Nuevo León), whereas others experienced more pronounced growth (Mexicali, Guadalupe Victoria, San Felipe, Ejido Puebla, Progreso, and Carranza). It is worth noting that this region, structured around the study corridor, supports tourism, agriculture, fishing, mining, commercial activities, service provision, and industrial operations from Mexicali to San Felipe. Several industries are established throughout the corridor, along with direct connectivity to a network of roads under various administrative levels and to railway infrastructure, creating an economic development hub for the region [41].
In the first section (km 0–38), access points connect the corridor to the Mexicali Valley, providing connectivity to sub-urban areas and fostering the development of economic activities associated with agriculture, commerce, services, and industry. Secondary activities such as manufacturing and construction, as well as tertiary activities including service provision, commerce, transportation, education, and health, are primarily concentrated in the municipal seat of Mexicali [42]. In contrast, primary activities such as agriculture are concentrated in the Mexicali Valley area [43]. Nevertheless, the economic growth driven by agricultural activity during the 1950s and 1970s has undergone significant transformation, giving way to industrialization and the expansion of the service sector, a trend that continues to the present day [44,45].
In the second section (km 38–160), which begins at the El Faro junction and extends to El Chinero, mining activities represent a major source of employment and form part of the primary sector in this area [15].
In the third section (km 160–190), extending from El Chinero to the main settlement of the municipality of San Felipe, bearing the same name, primary activities such as fishing stand out, along with tertiary activities such as tourism and commerce [46,47].
The Mexicali–San Felipe corridor is one of the key axes in the state that can enhance tourism-oriented development toward the southern and regional areas of the territory. Consequently, it has been subject to ongoing modernization and construction aimed at improving accessibility and user safety.
To provide a concise overview of the economic structure of the study corridor, Table 2 summarizes the number of economic units by activity sector across the ten localities. As shown, tertiary activities dominate the corridor economy, particularly other services and retail trade, followed by temporary accommodation and food services, while manufacturing represents a relevant share of economic units [48]. Detailed locality-level counts are reported in the Supplementary Materials (Table S1).

3. Literature Review

The term urban marginalization is associated with the concentration of deprivations within specific geographic spaces, such as localities or municipalities, rather than with the individual conditions of the people residing in those spaces, but instead with collective conditions [28,29,30,31]. In other words, a territory may exhibit high levels of urban marginalization even when certain residents have access to basic services such as piped water, electricity, or finished flooring. This perspective frames marginalization as an indicator of territorial inequalities and has generated strong interest in examining the level and variation in marginalization across different geographic scales [26].
Regarding Mexico, the UMI is used as an indicator to identify deprivations in goods and services, as well as levels of well-being experienced by the population across different territorial contexts. Since that time, the UMI has become a key tool for the formulation of public policies and programs aimed at anticipating or mitigating the impacts of urban expansion, while supporting timely planning of essential public services such as infrastructure, road paving, electricity supply, water provision, hospitals, and schools—elements required to ensure adequate housing and to improve population quality of life [1,32].
Internationally, deprivation and marginalization indices are constructed using similar multidimensional approaches focused on structural vulnerabilities. In the United Kingdom, the Townsend and Carstairs indices incorporate unemployment, overcrowding, car ownership, and housing tenure, while the Index of Multiple Deprivation (IMD) combines seven domains: income, employment, health, education, barriers to housing/services, crime, and living environment [49]. European indices, such as those used in France, emphasize education, health access, and housing quality [50]. In Latin America, multidimensional poverty indices highlight school attendance, healthcare, and basic housing infrastructure [51]. These align closely with the UMI’s core dimensions—education, health, and housing—ensuring methodological comparability across contexts.
On the other hand, assessing the relevance of investment projects in road infrastructure requires the consideration of socioeconomic, environmental, and technical studies, using a methodology that allows evaluation of project significance across multiple scales, ranging from the local to the international level [52,53,54,55,56]. This approach is necessary for public administrations or organizations responsible for promoting actions related to road construction and maintenance, which currently rely on a range of methods to support decision-making and to evaluate risks and adaptation measures. Commonly used approaches include cost–benefit analysis (CBA), cost-effectiveness analysis (CEA), and multi-criteria analysis (MCA), which are among the most frequently applied methods [54]. Nevertheless, public administrations typically employ cost–benefit analysis as the primary tool for the socioeconomic evaluation of investments in road infrastructure [57,58,59]. However, there are other alternatives to analysis such as impact assessment, which focuses on measuring the real changes generated by a project, program or policy, and determining whether those changes are actually due to the intervention or to other factors [1,60].
Both developed and developing countries adopt good governance practices in transport infrastructure planning, grounded in impact assessments conducted both ex-ante and ex-post [61,62,63]. Although ex-ante evaluations are more common for this type of infrastructure, ex-post assessments often prove to be highly valuable [63,64,65]. The main difference between these approaches lies in the timing of benefit consideration: under an ex-ante approach, benefits are projected, whereas under an ex-post approach, benefits have already materialized, even when project implementation remains ongoing [64,65,66,67].
These evaluations support improved decision-making by helping to identify potential risks, optimize resource use, and ensure that projects respond to actual mobility needs and economic development objectives. In addition, such assessments promote transparency, accountability, and citizen participation, thereby strengthening the legitimacy and effectiveness of public policies in the field of road transport [63,67]. Furthermore, investment project evaluation seeks to enhance operational efficiency and to estimate changes experienced by the beneficiary population, allowing assessment of the extent to which the objectives defined at the outset have been achieved [68,69]. In this context, evaluating the impacts associated with the construction of new road infrastructure, as well as other types of infrastructure, constitutes a fundamental component of public policy.
International evidence highlights the positive effects of road improvement initiatives on productivity. Konno [70] notes that, on a global scale, road infrastructure contributes to increased overall productivity by reducing transportation costs, expanding market access, and generating spatial externalities. In developing countries, productivity is estimated to increase between 0.05% and 0.15% for every 1% increase in road network extent. Laborda and Sotelsek [71] stipulate that, in Global South economies, higher road density and a greater proportion of paved roads are associated with significant increases in labor productivity and employment. These gains exhibit non-linear behavior, with more pronounced effects at middle-income levels. Furthermore, studies by the International Monetary Fund indicate that improvements in road infrastructure quality are correlated with higher average transport speeds, increases in business productivity, and higher GDP per capita in economies of the Global South [72]. In Latin America, the modernization of logistics corridors has contributed to reducing transport costs and territorial gaps [73].
Therefore, allocating resources to appropriate road infrastructure in developing countries is strictly necessary in order to build and maintain corridors that articulate the territory and ensure societal benefits [74]. This task involves substantial investment of financial and technological resources, as well as strong institutional and managerial capacity [75]. The importance of such investment lies in the promotion and strengthening of productive sectors such as industry, commerce, services, and agriculture, thereby fostering economic growth along the corridor [76].
Likewise, authors such as Kantianis et al. [77], Levkovich et al. [78], and Tegebu and Seid [79] discuss the influence of road infrastructure on territorial dynamics, particularly regarding effects on population distribution and economic activities. In turn, the accessibility enabled by road infrastructure, by affecting transport costs, becomes a key element of competitiveness, as it improves the movement of people and goods, including flows associated with infrastructure construction activities [80]. This effect is especially significant in peripheral or rural areas with limited infrastructure, where road development can function as a driver of development [81,82,83]. Consequently, in isolated regions, the construction of transport routes can reduce territorial inequalities by integrating such areas into production and consumption circuits [84]. In this way, road infrastructure not only facilitates economic growth but also contributes to improved quality of life and promotes more balanced territorial development [85,86], particularly through roads that provide access to peripheral areas [2].
Derived from the above, territorial development constitutes a valid argument for supporting the construction of road infrastructure [15,87], given that road networks form an integrated system that evolves in response to space–time dynamics, destination-related decisions, node selection, user accessibility, and adaptation to different travel speeds, among other factors, as infrastructure conditions change over time [88]. In this context, addressing population accessibility needs through the provision of appropriate infrastructure represents one of the most relevant functions and one of the highest responsibilities assumed by public administrations [89,90,91,92].
On the other hand, Ge et al. [93], Ng et al. [94], and Gómez [95] indicate that municipal seats or areas with higher levels of urbanization tend to exhibit higher accessibility levels than other zones. This condition is associated with factors such as geographic location, population density, service availability, and the presence of infrastructure. In contrast, regions with limited accessibility often experience more negative socioeconomic outcomes as a result of insufficient road networks or poor connectivity [93,96,97]. For this reason, the present study treats accessibility as a key component of territorial analysis, primarily linked to the location of urban and sub-urban areas, as well as to the characteristics of the existing road network.

4. Materials and Methods

This section presents the methodology used to evaluate the impact of road accessibility on changes in urban marginalization associated with the population of a given territory (Figure 8). To this end, the UMI must be assessed at different points in time, which requires statistical information on population and housing, as well as the adoption of a territorial scale as the unit of analysis linked to urban conditions. This approach involves examining critical aspects related to three dimensions: education, health, and housing. In addition, guidelines are established for determining road accessibility levels associated with each locality included in the analysis.

4.1. Definition of the Analysis Period

As a first step, the analysis periods must be defined, as these periods determine the territorial and population impacts of road infrastructure actions before, during, and after implementation. To achieve this, the study adopts an ex-ante and ex-post methodological approach [64,65,66,67].
Transport infrastructure evaluations commonly distinguish ex-ante and ex-post approaches. Ex-ante analyses often employ CBA to project economic profitability by monetizing costs and benefits [65,98]. However, other analytical alternatives exist, such as impact assessment, to measure changes before the project stage, prior to the execution of improvement works (ex-ante analysis) [1]. In contrast, ex-post evaluations assess realized socioeconomic impacts, such as changes in quality of life, without requiring benefit monetization. This study adopts an ex-post impact evaluation framework using the Urban Marginalization Index (UMI) at the AGEB level to quantify territorial and social changes associated with road accessibility improvements [66,98].

4.2. Identification of Territorial Conditions of Localities and Determination of Minimum Analysis Areas

Before proceeding with the evaluation of quality of life in the study localities, these areas must be subdivided into smaller territorial units in order to identify, in greater detail, variations in population and housing characteristics within each area. To this end, information produced by governmental and planning institutions can be employed. In the Mexican context, this role is fulfilled by the INEGI, which defines the Área Geoestadística Básica (AGEB) as the minimum territorial delimitation unit representing an urban or sub-urban area [26].
On the other hand, it is necessary to identify the urban condition of the localities included in the analysis, as this allows assessment of the impact that public policies have on territorial development. Such conditions may correspond to urban, sub-urban, or other contexts associated with an urban environment.

4.3. Determination of Road Accessibility Levels

In addition, it is necessary to identify the accessibility level of each locality by considering geographic location, road typology, and connectivity and distance with the federal network [1,16,17]. This type of accessibility analysis considers the degree of connection between two points located in the same territory, incorporating the distance factor. Connectivity with different routes and proximity to major urban centers are fundamental for a territory [93,94,95]. Accordingly, a hierarchical accessibility classification is proposed. Level A includes localities with direct connection to the federal highway corridor under study; Level B includes localities that access the road network through a federal highway other than the one analyzed; and Level C includes localities with indirect connection to the federal highway through the feeder or secondary road network.

4.4. Evaluation of Urban Marginalization

To assess quality of life in Mexico, the UMI is used as a proxy indicator [25,26]. The index is calculated using information provided by INEGI, with territorial disaggregation at the AGEB level.
In infrastructure investment projects aimed at evaluating the reduction in marginalization levels in impacted areas, the use of the UMI as a monitoring tool proves to be highly effective for verifying objective achievement. This index enables the classification and ranking of analysis units, facilitating territorial stratification based on criteria that reflect homogeneity or heterogeneity across territorial areas, using the principle of minimum variance [15,25,26]. For this purpose, AGEB are used as analysis units, encompassing urban, peri-urban, and sub-urban zones. These units represent one of the three main territorial divisions defined within the MGN (National Geostatistical Framework, the acronym in Spanish) of INEGI and have been employed in multiple studies related to population analysis [99,100,101,102,103].
The socioeconomic dimensions and indicators selected to calculate the UMI make it possible to assess progress in the population’s quality-of-life level in each AGEB through the analysis of access to fundamental services such as education, health, and housing (Table 3). It is worth mentioning that, since 1995, CONAPO has considered these three dimensions and six indicators as the structural and minimum elements that guide UMI development, which are supported by a theoretical–conceptual basis [25], seeking to capture the lack of accessibility to education (indicator 1), and the lack of access to health services (indicator 2) and housing conditions (indicators 3–6). However, since 2020, more indicators related to overcrowding and access to goods in housing have been added [26]. Therefore, the main argument for choosing these indicators is based on the dimensions that structure the marginalization indices presented in national and international studies, as well as the availability of information, comparability at the AGEB level in an ex-ante and ex-post analysis, and the relevance of monitoring the social impact through infrastructure projects.
To calculate this index, statistical data from population and housing censuses are used, based on three structural dimensions: educational status—(1) population aged 15 years and over with no schooling or incomplete primary education; access to healthcare—(2) population without entitlement to health services; and housing conditions—(3) occupied housing units with dirt floors, (4) occupied housing units without access to electricity, (5) occupied housing units without access to potable water, and (6) occupied housing units without drainage.
Following Figure 9, threshold values are defined to classify the level of urban marginalization. An AGEB is classified as Middle–High when the indicator value is between the mean and one standard deviation; High when it is between one and two standard deviations above the mean; and Very High when it exceeds two standard deviations. Conversely, an AGEB is classified as Middle–Low when the value is between the mean and one standard deviation below the mean; Low when it lies between one and two standard deviations below the mean; and Very Low when it exceeds two standard deviations below. This analysis was performed using SPSS (version 28.0), and the results obtained allow the categorization of the UMI to be established.
To determine the UMI for each selected AGEB, the calculation is based on the weighted sum of the selected indicators, in accordance with CONAPO guidelines [25,26]:
UMI =   j = 1 6   a j   Z ij
where
UMI = Urban Marginalization Index by AGEB;
j = the indicators that contribute to the level of marginalization (j = 1 ... 6);
aj = weight assigned to indicator j (derived from the principal components matrix generated using SPSS);
Zij = standardized value of indicator j (obtained by subtracting the mean and dividing the result by the corresponding standard deviation for each indicator).
After summing the values of the socioeconomic indicators corresponding to each AGEB, the level of marginalization is established using a normal distribution (Figure 9). Subsequently, the UMI is compared under ex-ante and ex-post conditions, and a Geographic Information System (GIS) is used to visualize the results.
Subsequently, the urban marginalization results for each locality can be associated with the levels of accessibility provided by the road network. This approach makes it possible to define the impact on the population from different territorial perspectives.

5. Results

This section presents the results of the UMI-based quality-of-life assessment for the AGEB within the study localities under ex-ante and ex-post conditions. It then examines how changes in urban marginalization relate to the local territorial setting and to road accessibility associated with the highway infrastructure.

5.1. Analysis Period

To conduct this study, baseline (ex-ante) conditions were assessed using population and housing census data from 2000 for the ten localities. Ex-post conditions were assessed using the 2010 and 2020 censuses to examine conditions during and after the implementation of modernization, conservation, interchange construction, and reconstruction works along the Mexicali–San Felipe highway section.
This assessment is based on modernization works carried out along the Mexicali–San Felipe highway section, as recorded in the SHCP’s fiscal calendar for 2006–2011 [15,36], and on information reported by SCT in the Balance de Obras and project portfolio records for 2013, 2014, 2015, and 2018 [37]. It should be noted that pavement conservation works were conducted in 2013; interchange construction activities took place between 2014 and 2015; and reconstruction works were implemented in 2017, consisting of pavement repair and rehabilitation of part of the substructure.

5.2. Population and Territorial Conditions by Locality and AGEB: Ex-Ante vs. Ex-Post

The study localities exhibit territorial conditions that may be urban, urban-peripheral, or sub-urban (Table 4), where the population may be distributed across one or more AGEB that comprise each locality (Figure 10).
It can be observed that eight of the ten localities present a sub-urban territorial condition, with a population within the area of analysis representing 46.6% in 2000, 43.1% in 2010, and 42.4% in 2020. The remaining share of the population resides in urban areas; however, a large proportion is concentrated in the urban periphery south of the locality of Mexicali, accounting for 40.9% in 2000, 46.4% in 2010, and 48.4% in 2020. These figures indicate a population trend toward residence in urban areas.
With regard to the total number of AGEB across the ten localities, an increase of 72.0% is observed from 2000 to 2020, rising from 75 to 129, respectively. However, the urban or sub-urban growth derived from the emergence of new AGEB has not been uniform among the localities. A more accelerated process is identified in four localities—Mexicali, Ejido Puebla, Progreso, and Guadalupe Victoria—while a less accelerated process is observed in Delta, San Felipe, Nuevo León, and Carranza. In contrast, Michoacán de Ocampo and Ciudad Coahuila maintain the same number of AGEB throughout the period. These results indicate that localities with larger populations and higher population growth are generally those that have experienced a greater increase in the number of AGEB between 2000 and 2020. In most cases, such localities are also located closer to the municipal seat, with the exceptions of Guadalupe Victoria and San Felipe, although the latter functions as the municipal seat of the municipality with the same name.
In the case of the locality of Mexicali, this area corresponds to an urban zone that contains 429 AGEB [33]. However, 40 of these AGEB are considered to be directly impacted by the Mexicali–San Felipe highway section, as these are located in the southern urban periphery of the locality and together concentrated a total population of 89,976 inhabitants in 2020. It is worth noting that, from 2000 to 2020, the number of AGEB in this peripheral area almost doubled, increasing from 21 to 40. In addition, these AGEB are contiguous with the AGEB of Ejido Puebla, resulting in a total of 57 AGEB within this zone.
With respect to the total number of sub-urban AGEB concentrated in eight localities, an increase of 87.2% is observed, rising from 39 to 73 between 2000 and 2020. However, the cases of Ejido Puebla and Progreso stand out, as these localities increased the number of AGEB by 325.0% and 128.6%, respectively.

5.3. Analysis of Road Accessibility Levels by Locality

According to the geographic location of the ten localities, and after analyzing the road typology that connects them with the rest of the road network, two localities—Mexicali and San Felipe—were identified as presenting accessibility level A, since direct connectivity exists with the Mexicali–San Felipe federal highway segment (Table 5). Two additional localities—Progreso and Ejido Puebla—exhibit accessibility level B, as access to the road network occurs through another federal highway section, specifically Federal Highway No. 2, which provides connectivity to other localities in Baja California and to the state of Sonora (Figure 1). In contrast, six localities located in the Valle de Mexicali present accessibility level C, namely Delta, Michoacán de Ocampo, Nuevo León, Ciudad Coahuila, Guadalupe Victoria, and Carranza, since connectivity to the federal road network occurs indirectly through secondary or feeder roads. It is important to note that multiple feeder or secondary roads connect with these localities (Figure 1), facilitating connectivity to municipal seats and, in turn, to the main sources of economic activities and service availability, generating greater benefits for the population and contributing to improvements in quality of life. However, it was identified that the localities of Delta, Guadalupe Victoria and Ciudad Coahuila are the ones that have the greatest distance from the route to a section of the federal highway, respectively.

5.4. UMI Analysis by AGEB in Ex-Ante and Ex-Post Conditions

Considering the ex-ante and ex-post evaluation approaches, UMI values were calculated for 134 AGEB belonging to the ten localities (Supplementary Materials, Table S2), taking into account three points in time: the year 2000 as the stage prior to road infrastructure works; 2010 as the period during road works execution; and 2020 as the phase following road works completion.
It should be noted that some AGEB appear only in the year 2000 and were no longer reported in 2010. Specifically, four AGEB fall into this situation: 3954 and 4064 in the locality of Mexicali, 5077 in Delta, and 3102 in Guadalupe Victoria. This occurs because these AGEB were reassigned new codes in subsequent years or were merged into other AGEB. Conversely, 40 AGEB emerged in 2010 and remains present to date, 18 AGEB emerged in 2020, and 72 AGEB have been consistently reported since the year 2000.
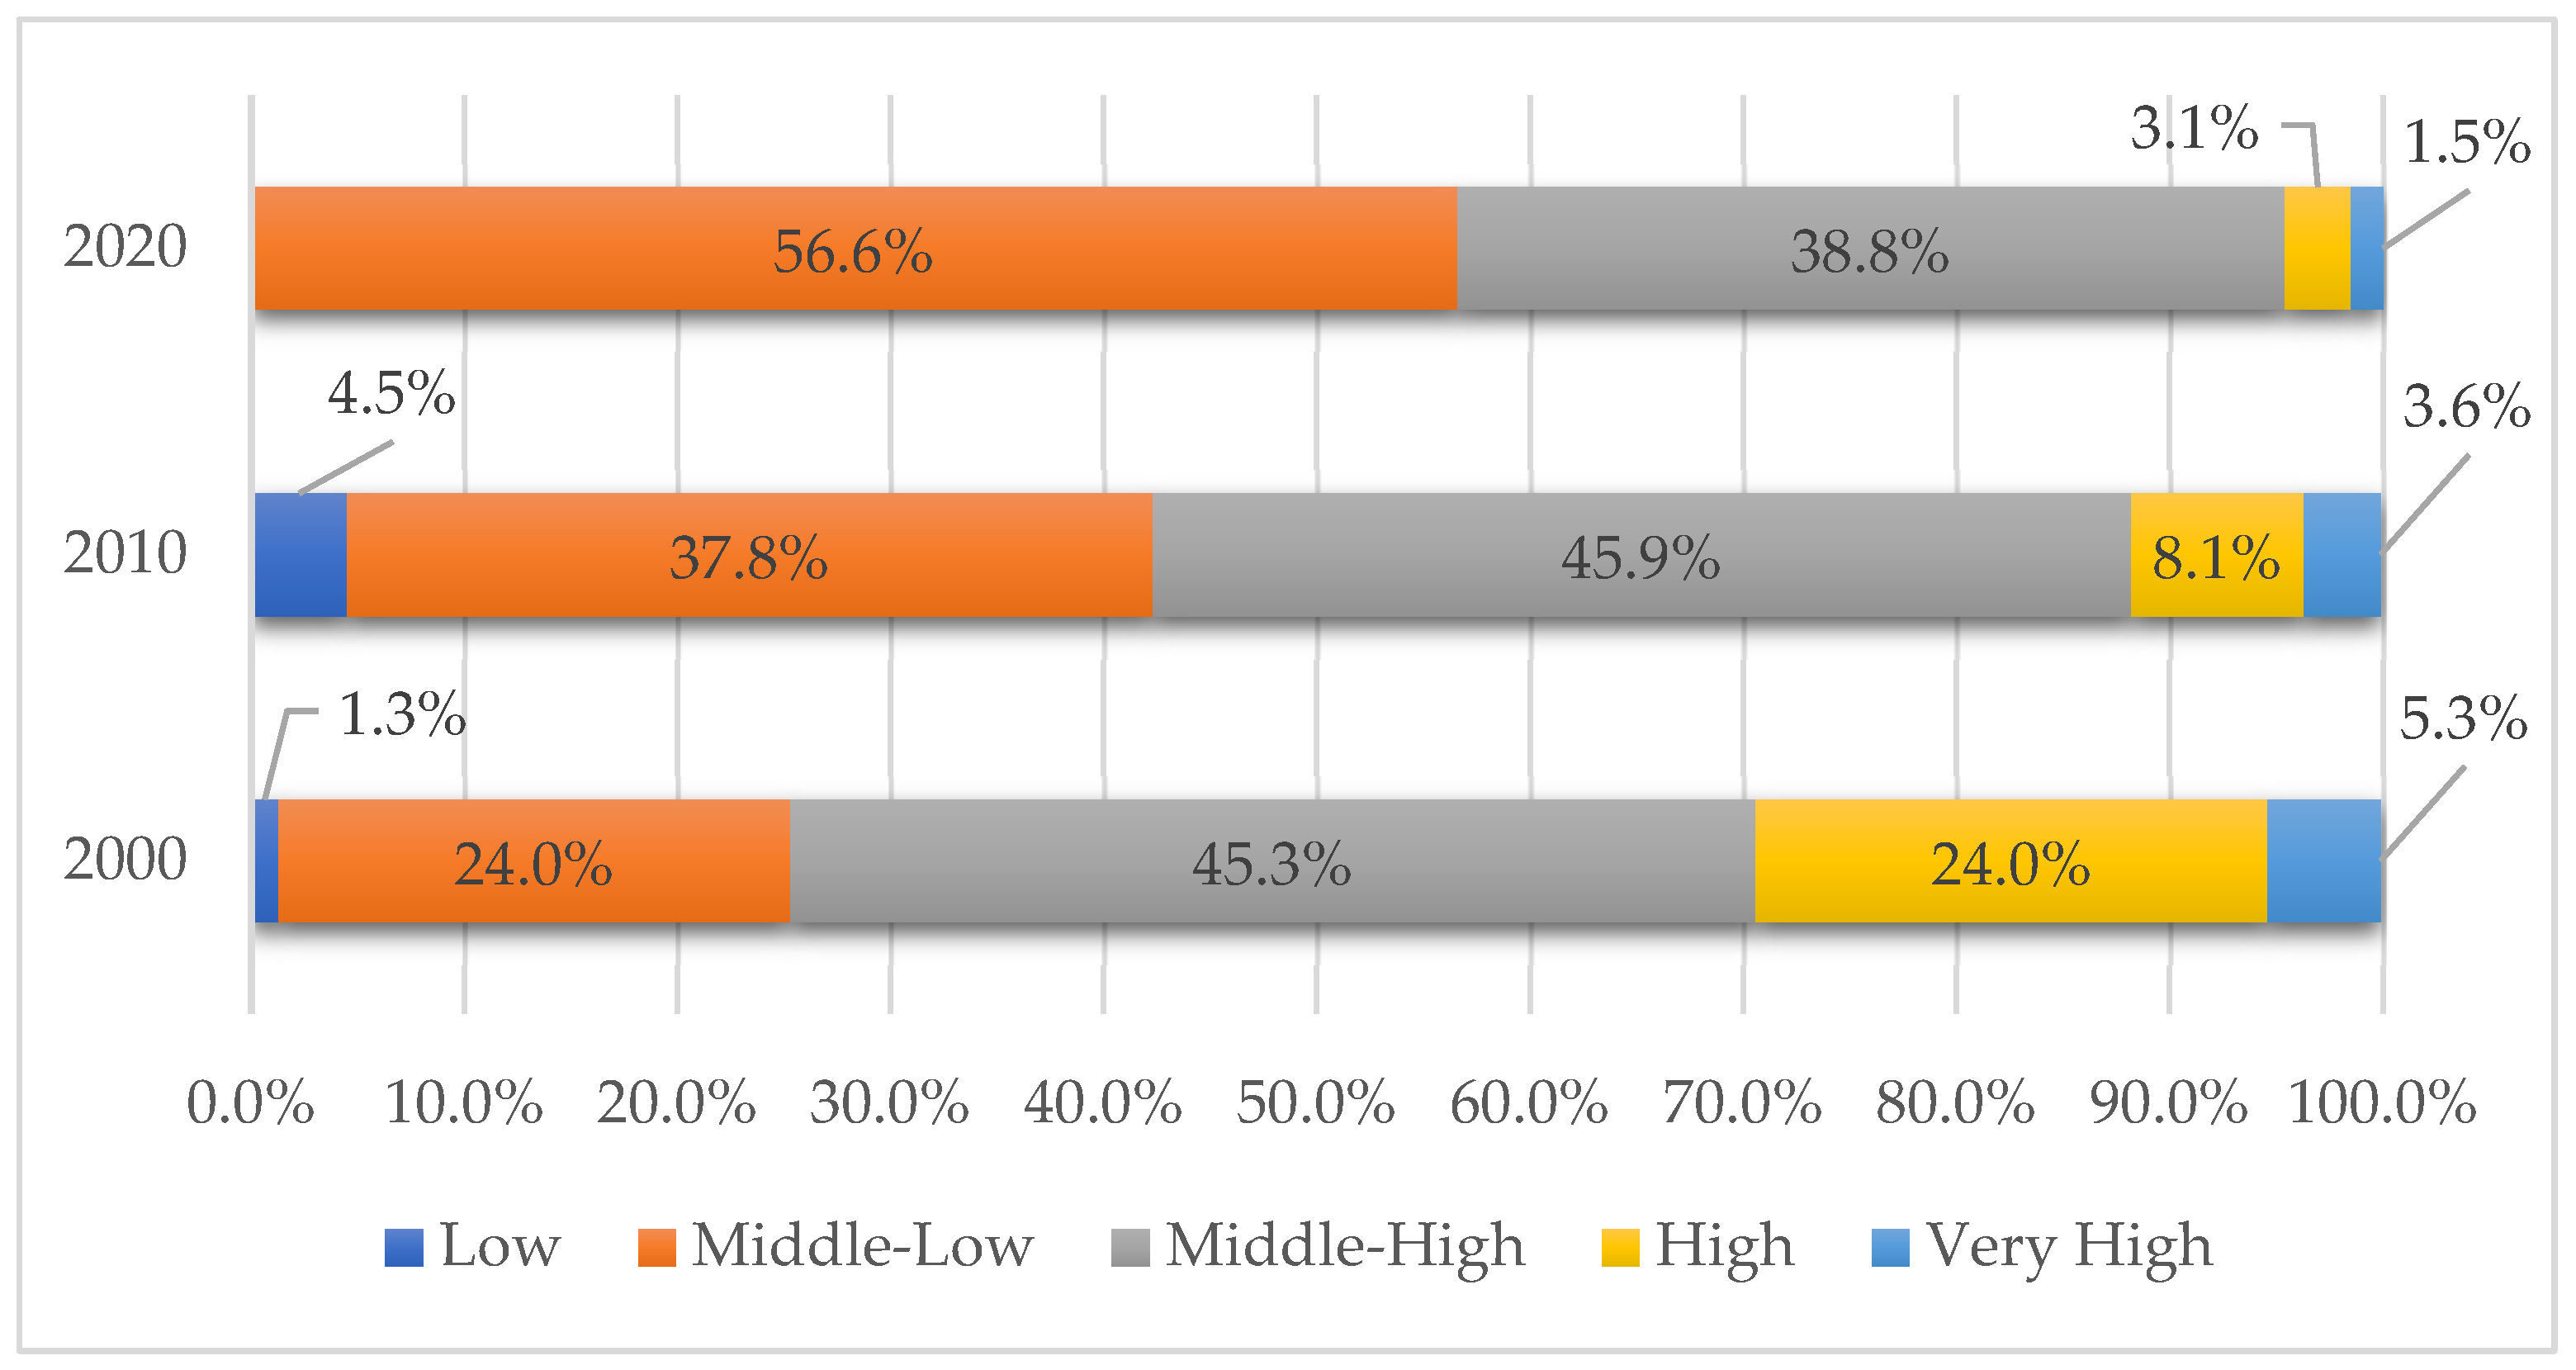
Figure 11 summarizes the overall distribution of UMI levels across all AGEB for the three census years, highlighting a progressive shift away from critical categories (High/Very High) towards less severe levels.
In 2000, the UMI distribution indicates that 29.3% of the AGEB (22 out of 75) were classified in the High and Very High levels, 45.3% (34 out of 75) in Middle–High, and 25.3% (19 out of 75) in the combined Middle–Low and Low levels (Figure 11). By 2010, the share of AGEB classified at critical levels (High and Very High) decreased to 11.7% (13 out of 111), while Middle–Low and Low together represented 42.3% (47 out of 111) (Figure 11). In 2020, High and Very High together accounted for 4.7% (6 out of 129), whereas Middle–Low reached 56.6% (73 out of 129), and the Low category was no longer observed (Figure 11). Overall, Middle–High and Middle–Low together accounted for 95.3% (123 out of 129), suggesting a more balanced territorial condition in terms of access to basic housing services, health services, and education.
At that time, modernization works on the road corridor had not yet begun; therefore, the corridor allowed a maximum speed of 80 km/h along much of the alignment, with a surface in fair physical condition and cross-section widths limited to a single lane per direction along the 190 km corridor length. These conditions implied a high risk of traffic accidents due to the circulation of private vehicles, motor homes, buses, and freight transport.
Between 2002 and 2007, the Annual Average Daily Traffic (AADT) along this corridor increased from 2910 to 7357 vehicles per day. In addition, an accident analysis conducted in 2006 estimated material losses of approximately 3.8 million pesos, identifying excessive speed, encroachment into the opposing lane, and improper overtaking as the main causes [104].
By 2010, as interventions along the Mexicali–San Felipe corridor progressed, safety and accessibility conditions improved, allowing a higher level of service. This was achieved through the redesign of the pavement surface and roadway geometry to support maximum operating speeds between 105 and 110 km/h, along with wider cross-sections [36]. It should be mentioned that these speeds remain the maximum allowed to this day.
Consistent with these changes, the share of AGEB classified at critical levels (High and Very High) decreased in 2010 compared to 2000, from 29.3% (22 of 75) to 11.7% (13 of 111). At the same time, the distribution became more concentrated in the Middle–High level, which accounted for 45.9% (51 of 111), which is slightly higher than the 45.3% observed in 2000 (34 of 75). AGEB classified as Middle–Low and Low together represented 42.3% (47 of 111), exceeding the 25.3% observed in 2000 (19 of 75). Overall, these results suggest a reduction in territorial marginalization in 2010, which is consistent with improved quality-of-life conditions for the population. It should be noted that modernization works were completed in 2011, confirming improvements in connectivity among localities, ports, the border, and tourist destinations, while anticipating the complementary role of secondary or feeder roads [36]. The above substantially increased the AADT to a total of 9117 vehicles per day in 2011 [105].
In 2020, the distribution of UMI levels across the AGEB shows a marked improvement. A clear reduction is observed in the High and Very High categories, which together accounted for 4.7% (six of 129), compared with 29.3% (22 of 75) in 2000, representing a decrease of 24.6 percentage points. A decline is also observed in the Middle–High category, which accounted for 38.8% (50 of 129), compared with 45.9% (51 of 111) in 2010, reflecting a reduction of 7.1 percentage points. Conversely, in 2020 there is a clear shift toward the Middle–Low level, which reaches 56.6% (73 of 129), representing an increase of 32.6 percentage points relative to 2000. However, the Low category is no longer observed in 2020, indicating a concentration in the Middle–High and Middle–Low levels, which together account for 95.3% (123 of 129) of the total AGEB. Overall, this distribution suggests a more balanced territorial condition in terms of access to basic housing services, health services, and education.
These changes are consistent with the program of interventions implemented along the corridor, including pavement conservation works in 2013 and reconstruction works in 2017 [37], as well as the construction of the El Faro Interchange in 2015. Together, these actions likely contributed to improving comfort and safety conditions, along with accessibility through feeder or secondary roads [37]. These works made it possible to reach AADT of up to 10,293 vehicles per day on the road section during the year 2016 [41] and up to 11,427 vehicles per day in the year 2017 [106].
Focusing on individual localities, the following analysis summarizes how UMI levels evolved between 2000, 2010 and 2020 in each of the ten localities. To improve readability and avoid excessive small-area detail, Table 6 reports aggregate indicators by locality, whereas the full AGEB level results are available in the Supplementary Materials (Tables S3–S6).
Table 6 summarizes locality-level differences in the evolution of UMI categories between 2000 and 2020, highlighting heterogeneous trajectories across the corridor. Overall, the results indicate that the two main localities directly served by the Mexicali–San Felipe corridor (Mexicali and San Felipe) are predominantly characterized by Middle–Low marginalization in 2020. A similar pattern is observed in Delta, Michoacán de Ocampo, Nuevo León, and Ejido Puebla, despite differences in their connectivity to the federal highway network (via feeder/secondary roads or through a different federal highway). By contrast, Progreso, Ciudad Coahuila, Guadalupe Victoria, and Carranza remain predominantly Middle–High in 2020, indicating that improvements are spatially uneven and may not be explained by accessibility alone.

6. Discussion

The results obtained in the present research make it possible to corroborate that road accessibility constitutes a relevant factor in the territorial configuration of localities located under peripheral and sub-urban conditions. However, it is important to note that such influence does not manifest uniformly across the territory, since the degree of impact depends on the type of existing connection, the hierarchy of the road network, and the level of integration of each locality with respect to the corridor under analysis.
In this regard, the application of the UMI at the AGEB scale made it possible to identify with greater precision the intra-urban differences present among the analyzed localities, demonstrating that the benefits derived from modernization, conservation, reconstruction, and interchange construction works carried out along the Mexicali–San Felipe corridor are not distributed uniformly. Instead, such benefits respond to specific conditions of accessibility, location, and availability of complementary infrastructure, such as feeder or secondary roads. This finding highlights the relevance of employing micro-territorial units of analysis, since at broader scales, such as the municipal level, these differences tend to become diluted or remain undetected.
In addition, the classification of localities according to levels of direct and indirect accessibility to the road corridor under study made it possible to understand why certain localities exhibit more favorable patterns in urban marginalization levels compared with others, even when forming part of the same road corridor. This finding suggests that primary infrastructure alone does not guarantee generalized improvement processes; rather, the presence of feeder roads or secondary routes, as well as interchanges that strengthen the integration of more distant localities or those with limited connectivity alternatives, proves to be essential.
Beyond connectivity, the results also suggest that road accessibility has also influenced the configuration of economic activity specialization along the corridor. In this regard, a greater consolidation of industrial, agricultural, commercial, and service activities is identified in the northern sector, primarily linked to the urban locality of Mexicali; whereas toward the southern end, in the direction of the urban locality of San Felipe, economic dynamics associated with mining, tourism, and fishing activities are observed. This territorial differentiation reinforces the notion that road infrastructure does not function solely as a transport element, but rather as a structuring axis of economic functions and spatial organization of the territory.
To contextualize local economic change, a macro-regional comparison was conducted using Economic Census data for Mexico and Baja California, for the 2003–2018 period (Table 7). Over this interval, total economic units increased by 57.8% at the national level and 66.6% in Baja California. In contrast, the Mexicali–San Felipe corridor increased from 13,807 to 23,233 establishments, representing a 68.2% growth rate.
Sectoral dynamics further clarify this pattern. Between 2003 and 2018, secondary activities in the corridor grew by 102.4%, exceeding the national secondary growth rate (74.0%). Tertiary activities increased by 65.1% locally, compared to 55.6% nationally. Primary activities grew modestly in both contexts.
To explicitly control for differences in initial economic structure, a sectoral counterfactual projection was estimated, applying national sector-specific growth rates to the corridor’s 2003 baseline. Under this scenario, approximately 21,700 establishments would have been expected by 2018 under national structural trends. The observed total (23,233) exceeds this benchmark, indicating a positive differential relative to national dynamics. In aggregate terms, the corridor’s final position was therefore moderately stronger than it would have been under national sectoral growth dynamics.
While causality cannot be strictly established, this differential performance suggests that local economic dynamics were not limited to a passive replication of broader macroeconomic trends.
Although the results reveal a general trend toward improved conditions associated with quality of life, it must be considered that such transformations may also be influenced by external factors, including regional economic dynamics, sectoral public policies, demographic processes, or urban development strategies independent of road infrastructure. In this regard, the present study does not establish a strictly causal relationship but rather identifies a consistent association between road accessibility and the evolution of socio-spatial conditions within the analyzed territory.
Overall, the methodology employed proved to be appropriate for capturing medium- and long-term changes associated with interventions in the road network, which opens the possibility for application in other territorial contexts with similar characteristics. At the same time, the findings encourage reflection on the importance of incorporating accessibility and territorial equity criteria into the planning of future infrastructure projects, particularly in localities with lower levels of connectivity, in order to promote more balanced and sustainable development processes.
It is worth mentioning that, as future lines of research, it is intended to add to the road accessibility evaluation processes with other aspects that allow identifying improvements in service levels on the roads under study, such as improvements in travel speed, reduction in travel delays and reduction in accidents that occur on the same.

7. Conclusions

This research shows that road accessibility exerts a territorial influence on urban, urban-peripheral, and sub-urban environments along the Mexicali–San Felipe segment of Federal Highway No. 5. Differences in accessibility conditions were associated with differentiated effects on connectivity, service provision, and opportunities for improving population quality of life. In addition, the methodological approach integrated an ex-ante and ex-post analysis to evaluate the Urban Marginalization Index (UMI) at the AGEB scale, which proved effective for assessing the socioeconomic impacts derived from a series of works carried out between 2006 and 2017, including road modernization, conservation, and reconstruction, as well as the construction of an interchange that links the analyzed corridor with other feeder or secondary roads. Within this context, the study identified the following main findings:
  • The hierarchical classification of accessibility was confirmed as an appropriate framework for explaining the different levels of territorial impact associated with road infrastructure.
  • The main argument for choosing the UMI and its indicators is based on a methodology that has been proven for years, the availability of information to develop it, and the studies that support its implementation when it comes to analyzing territorial inequalities.
  • The use of the UMI at the AGEB scale made it possible to identify intra-urban and sub-urban inequalities that would not be observable at the municipal or locality scale.
  • The ex-ante and ex-post methodological approach proved effective for identifying gradual and cumulative changes in quality of life through the use of the UMI, in direct association with road works and the accessibility conditions enabled by such interventions.
  • The road corridor functions not only as transport infrastructure, but also as a structuring element that influences urban expansion, land use patterns, economic distribution, and territorial reorganization.
  • Complementary works, such as feeder roads, secondary road networks, and interchanges, are decisive for the consolidation of accessibility and for the functional integration of the territory.
  • The proposed methodological framework is replicable in other contexts where census data and AGEB spatial delimitation are available.
The results indicate that improved operational conditions along the corridor were associated with stronger social and economic conditions of the population in ten surrounding localities, although with varying degrees of intensity. A more significant impact was observed in localities with larger population size and territorial extent, such as Mexicali and San Felipe, where marginalization levels tended to decrease more noticeably and a process of urban expansion became evident through the increase in the number of AGEB. In contrast, other localities—particularly those with a lower degree of direct connectivity—exhibited more moderate yet positive improvements, as observed in Delta, Michoacán de Ocampo, Ejido Puebla, and Nuevo León. An even lower level of improvement was identified in Progreso, Ciudad Coahuila, Guadalupe Victoria, and Carranza; however, this situation highlights the need to develop additional branches or feeder connections that strengthen territorial integration.
In addition, complementary works—such as the construction of interchanges and the presence of feeder or secondary road networks providing access to sub-urban localities and connecting them with major urban centers such as Mexicali and San Felipe—were identified as playing a key role in the functional integration of the corridor. These elements promote processes of urban redistribution and strengthen specific economic sectors along the corridor. In the first section, economic development is mainly associated with industrial and agricultural activities; in the second one, activities are oriented toward mining; and in the third section, dynamics related to tourism and fishing become evident. In several cases, these effects proved to be more decisive than the geographic distance between the localities and the corridor.
These findings suggest that, when designing and intervening in a road corridor, it is essential to account for the accessibility conditions of localities that are farther from the main alignment or have limited connectivity. In this regard, incorporating specific interconnection alignments should be considered to promote more direct communication with the main corridor, while simultaneously strengthening links with major population centers or municipal seats.
The methodological proposal based on the hierarchical classification of accessibility, through the establishment of accessibility levels (Levels A, B, and C) and the use of the UMI at the AGEB level, proved to be a robust and replicable tool for evaluating long-term territorial transformations. In this context, the study demonstrates that road infrastructure not only fulfills a transport function but also operates as a structuring element of the territory, capable of modifying land use patterns, promoting urban expansion and economic development, and contributing to socio-spatial cohesion. Furthermore, the methodology for deriving UMI levels relied exclusively on variables associated with quality of life, such as education, health, and housing, which made it possible to identify that localities with lower accessibility exhibited less favorable marginalization outcomes when compared with better-connected localities.
On the other hand, to conduct a more detailed analysis of the territorial and population-related information of the localities located within the study area and adjacent to the Mexicali–San Felipe highway, georeferenced map representations were developed using a Geographic Information System (GIS). This approach made it possible to examine the relationship between road accessibility levels and urban marginalization levels.
Finally, it is concluded that improvements in road accessibility are consistently associated with processes of territorial transformation and reductions in urban marginalization in urban, urban-peripheral, and sub-urban areas. While a strictly causal relationship cannot be definitively established, the evidence suggests that accessibility constitutes a relevant structuring factor in shaping socio-spatial dynamics. These findings highlight the importance of incorporating accessibility criteria into the planning of road infrastructure projects, particularly in localities with lower levels of connectivity, in order to promote more balanced and inclusive development.

Supplementary Materials

The following supporting information can be downloaded at https://www.mdpi.com/article/10.3390/infrastructures11030082/s1, Table S1: Units by economic activity in localities impacted by the Mexicali–San Felipe corridor. Table S2: AGEB selected in relation to the Mexicali–San Felipe corridor. Table S3: Comparison of UMI by AGEB under ex-ante and ex-post conditions in the locality of Mexicali. Table S4: Comparison of UMI by AGEB under ex-ante and ex-post conditions in the localities of San Felipe, Delta, Michoacán de Ocampo, and Nuevo León. Table S5: Comparative analysis of UMI by AGEB in ex-ante and ex-post conditions in the localities of Ejido Puebla and Progreso. Table S6: Comparison of UMI by AGEB in ex-ante and ex-post conditions in the localities of Ciudad Coahuila, Guadalupe Victoria, and Carranza.

Author Contributions

Conceptualization, L.G.; methodology, L.G. and J.M.G.-M.; software, L.G. and A.S.-A.; validation, L.G., J.M.G.-M., A.S.-A., J.C.-R., M.M.-A. and A.M.-M.; formal analysis, L.G. and A.S.-A.; investigation, L.G., J.M.G.-M., A.S.-A., J.C.-R., M.M.-A. and A.M.-M.; resources, L.G., J.M.G.-M., A.S.-A., J.C.-R., M.M.-A. and A.M.-M.; data curation, L.G., J.M.G.-M. and A.S.-A.; writing—original draft preparation, L.G.; writing—review and editing, A.S.-A.; visualization, J.M.G.-M., A.S.-A., J.C.-R., M.M.-A. and A.M.-M.; supervision, L.G. and A.S.-A.; project administration, L.G. All authors have read and agreed to the published version of the manuscript.

Funding

This research received no external funding.

Data Availability Statement

The database of the population and housing census can be found in https://www.inegi.org.mx/programas/ccpv/2020/ (accessed on 4 November 2024).

Acknowledgments

We would like to express our gratitude to everyone who has contributed to this research, especially especially students from the Faculty of Engineering of the Autonomous University of Baja California, who assisted in the collection of data.

Conflicts of Interest

The authors declare no conflicts of interest.

Abbreviations

The following abbreviations are used in this manuscript:
AADTAnnual Average Daily Traffic
AGEBBasic Geoestatistical Areas (The acronym in Spanish)
CBACost–Benefit Analysis
CEACost-Effectiveness Analysis
CONAPONational Population Council (The acronym in Spanish)
GISGeographic Information System
Gob-BCGovernment of Baja California (The acronym in Spanish)
Gob-MxlGovernment of Mexicali (The acronym in Spanish)
INEGINational Institute of Statistics and Geography (The acronym in Spanish)
MCAMulti-Criteria Analysis
MGMNational Geostatistical Framework (The acronym in Spanish)
SHCPMinistry of Finance and Public Credit (The acronym in Spanish)
SCTMinistry of Communications and Transportation (The acronym in Spanish)
SICTSecretariat of Infrastructure, Communications and Transportation (The acronym in Spanish)
SIDUESecretariat of Infrastructure and Urban Development of the State of Baja California (The acronym in Spanish)
SPSSStatistical Package for the Social Sciences
UMIUrban Marginalization Index

References

  1. García, L.; Mungaray-Moctezuma, A.; Calderón, J.; Sánchez-Atondo, A.; Gutiérrez-Moreno, J. Impacto de la accesibilidad carretera en la calidad de vida de las localidades urbanas y suburbanas de Baja California, México. EURE 2019, 45, 99–122. [Google Scholar] [CrossRef]
  2. Pérez, G. Caminos Rurales: Vías Claves Para la Producción, la Conectividad y el Desarrollo Territorial; Comisión Económica para América Latina y el Caribe (CEPAL): Santiago, Chile, 2020. [Google Scholar]
  3. Petráš, M.; Květoň, V. Spatial patterns of transport accessibility and traffic load in Czechia: Towards a typology of the new road infrastructure impacts. J. Maps 2022, 18, 33–42. [Google Scholar] [CrossRef]
  4. Sifuentes-Ocegueda, E.L.; Huerta-García, R.; Vences-Macedo, L. Infraestructura carretera, desarrollo local y turismo en la ciudad de Mazatlán, Sinaloa. Horiz. Territ. 2023, 3, 1–23. [Google Scholar] [CrossRef]
  5. Rivera, L.; Baguec, H., Jr.; Yeom, C. A study on causes of delay in road construction projects across 25 developing countries. Infrastructures 2020, 5, 84. [Google Scholar] [CrossRef]
  6. González, O.C.S.; Pinto, H.C. Transformación Económica y Desarrollo Regional: Impacto de la Carretera Soná-Pixvae, en Veraguas. Rev. Multidiscip. Innova Sci. 2025, 1, 8–13. [Google Scholar] [CrossRef]
  7. Rangel, J.A.F. Infraestructura carretera: Construcción, financiamiento y resistencia en México y América Latina. Rev. Transp. Y Territ. 2015, 13, 122–148. [Google Scholar]
  8. Ibañez, N.; Mujica, M.; Castillo, R. Componentes del desarrollo humano sustentable. Negot. Rev. Cienc. Gerenciales 2017, 12, 63–77. [Google Scholar]
  9. Ben, S.O. Significance of Road Infrastructure on Economic Sustainability. Am. Int. J. Multidiscip. Sci. Res. 2019, 5, 1–9. [Google Scholar] [CrossRef]
  10. Chiatchoua, C.; García Álvarez, V.F.; Neme Castillo, O. Contribución de las exportaciones en la reducción de la pobreza en México, 2008–2018. Análisis Económico 2022, 37, 61–77. [Google Scholar] [CrossRef]
  11. Secretaría de Comunicaciones y Transportes (SCT). 5 Informe de Labores (2022–2023); SCT: Ciudad de México, México, 2023. [Google Scholar]
  12. Secretaría de Infraestructura, Comunicaciones y Transportes (SICT). Método Para Calificar el Estado Físico de las Carreteras Federales 2022; SICT: Ciudad de México, México, 2024. [Google Scholar]
  13. Secretaría de Infraestructura, Comunicaciones y Transportes (SICT). Anuario Estadístico del Sector Infraestructura, Comunicaciones y Transportes 2023; SICT: Ciudad de México, México, 2024. [Google Scholar]
  14. Freiria, S.; Sousa, N. The impact of accessibility changes on local development: A spatial approach. J. Transp. Geogr. 2024, 120, 103975. [Google Scholar] [CrossRef]
  15. Mungaray Moctezuma, A.; García Gómez, L.G. La influencia de la carretera Mexicali-San Felipe en la calidad de vida de sus inmediaciones. Estud. Soc. (Hermosillo Son.) 2015, 23, 190–212. [Google Scholar]
  16. Coronado Tordesillas, J.M.; Garmendia Antín, M. Carreteras-planeamiento: Algunas claves de la evolución histórica de una relación imperfecta. Ciudad. Rev. Inst. Univ. Urbanística Univ. Valladolid 2008, 11, 33–51. [Google Scholar] [CrossRef]
  17. Yang, R.; Xu, Q.; Xu, X.; Chen, Y. Rural settlement spatial patterns and effects: Road traffic accessibility and geographic factors in Guangdong Province, China. J. Geogr. Sci. 2019, 29, 213–230. [Google Scholar] [CrossRef]
  18. Varela-García, F.-A. Análisis Geoespacial para la Caracterización Funcional de las Infraestructuras Viarias en Modelos de Accesibilidad Territorial Utilizando Sistemas de Información Geográfica; Universidade da Coruña: La Coruña, España, 2013. [Google Scholar]
  19. Zeng, C.; Song, Y.; Cai, D.; Hu, P.; Cui, H.; Yang, J.; Zhang, H. Exploration on the spatial spillover effect of infrastructure network on urbanization: A case study in Wuhan urban agglomeration. Sustain. Cities Soc. 2019, 47, 101476. [Google Scholar] [CrossRef]
  20. Ortega-Reig, M.; Schürmann, C.; Ferrandis Martínez, A.; Copus, A. Measuring access to services of general interest as a diagnostic tool to identify well-being disparities between rural areas in Europe. Land 2023, 12, 1049. [Google Scholar] [CrossRef]
  21. Hernández García, S.; Torres Vargas, G.; González García, J.; Cruz González, G.; Arroyo Osorno, J. Evaluación ex Post para Proyectos de Inversión en Carreteras: Dos Estudios de Caso; Publicación Técnica: Sanfandila, México, 2018. [Google Scholar]
  22. Chávez Rodríguez, J.R.; Frías Sarmiento, E. Modernización regional y centralidad en el caso de Guamúchil, Sinaloa, México (1940–1960). América Lat. Hist. Económica 2016, 23, 174–203. [Google Scholar] [CrossRef][Green Version]
  23. Aruçi, S.; Sinani, F. Basic factors impact on the Development and Modernization of the Road Infrastructure in the Republic of Macedonia. JAS-SUT J. Appl. Sciences.-SUT 2018, 4, 57–67. [Google Scholar]
  24. Majstorović, A.; Jajac, N. Maintenance management model for nonurban road network. Infrastructures 2022, 7, 80. [Google Scholar] [CrossRef]
  25. Consejo Nacional de Población (CONAPO). Índice de Marginación por Localidad 2020; CONAPO: Ciudad de México, México, 2021. [Google Scholar]
  26. Consejo Nacional de Población (CONAPO). Índice de Marginación Urbana 2020; CONAPO: Ciudad de México, México, 2021. [Google Scholar]
  27. García Gil, G.; Oliva Peña, Y.; Ortiz Pech, R. Distribución espacial de la marginación urbana en la ciudad de Mérida, Yucatán, México. In Investigaciones Geográficas; Universidad Nacional Autónoma de México: Ciudad de México, México, 2012; pp. 89–106. [Google Scholar]
  28. Gaytán Bohórquez, L.I.; González García, V.; González García, I. Asentamientos humanos irregulares en la Zona Metropolitana de Oaxaca. La lógica de la marginación urbana. In Estudios Sobre Cultura y Desigualdad en las Regiones; Gasca Zamora, J.Y.H.E., Hazel, E., Eds.; Universidad Nacional Autónoma de México, Instituto de Investigaciones Económicas y Asociación Mexicana de Ciencias para el Desarrollo Regional: Ciudad de México, México, 2021; Volume 4. [Google Scholar]
  29. Peláez Herreros, Ó. La marginación a lo largo del tiempo: Cálculo del Índice de Marginación Absoluta (IMA) para las entidades federativas de México, 1970–2010. In Economía: Teoría y Práctica; Universidad Autónoma Metropolitana: Distrito Federal, México, 2017; pp. 115–137. [Google Scholar] [CrossRef]
  30. Guzmán-Ramírez, A.; Gómez-Hidalgo, J.A.; Muñoz-Brito, C.D. Estudio sobre la configuración y función del espacio público en zonas de marginación urbana. Caso de estudio “La Joya” en la ciudad de León, Guanajuato, México. Legado Arquit. Y Diseño 2019, 10, 139–162. [Google Scholar]
  31. Cortés, F. Consideraciones sobre la marginación, la marginalidad, marginalidad económica y exclusión social. Papeles Población 2006, 12, 71–84. [Google Scholar]
  32. Romo Aguilar, M.D.L.; Maldonado, J.D. Justicia social: Accesibilidad a espacios públicos en contextos de marginación urbana en Ciudad Juárez, Chihuahua, México. Perspect. Geográfica 2022, 27, 11–31. [Google Scholar] [CrossRef]
  33. Instituto Nacional de Estadística, Geografía e Informática (INEGI) de México. Censo de Población y Vivienda 2020. Available online: https://www.inegi.org.mx/programas/ccpv/2020/ (accessed on 4 November 2024).
  34. Comité de Planeación para el Desarrollo Municipal de Mexicali. Plan Municipal de Desarrollo 2025–2027; COPLADEMM: Mexicali, México, 2025. [Google Scholar]
  35. Secretaría de Infraestructura, Desarrollo Urbano y Reordenamiento Territorial (SIDURT). Plan Municipal de Desarrollo Urbano San Felipe, Baja California; SIDURT: Mexicali, México, 2024. [Google Scholar]
  36. Secretaría de Comunicaciones y Transportes (SCT). Dictamen de Factibilidad Técnica, Económica y Ambiental de la Carretera Mexicali-San Felipe; SCT: Mexicali, México, 2011. [Google Scholar]
  37. Secretaría de Comunicaciones y Transportes (SCT). Balance de obras 2013–2018 Baja California; SCT: Ciudad de México, México, 2018. [Google Scholar]
  38. Google. Google Earth Pro. Available online: https://www.google.com/earth/versions/ (accessed on 6 November 2024).
  39. Instituto Nacional de Estadística, Geografía e Informática (INEGI) de México. XII Censo General de Población y Vivienda 2000. Available online: https://www.inegi.org.mx/programas/ccpv/2000/ (accessed on 4 November 2024).
  40. Instituto Nacional de Estadística, Geografía e Informática (INEGI) de México. Censo de Población y Vivienda 2010. Available online: https://www.inegi.org.mx/programas/ccpv/2010/ (accessed on 4 November 2024).
  41. Secretaría de Infraestructura y Desarrollo Urbano del Estado de Baja California (SIDUE). Directrices Generales de Desarrollo Urbano Corredor Regional Carretera San Felipe; SIDUE: Mexicali, México, 2016. [Google Scholar]
  42. De los Ángeles Santos-Gómez, M.; Camacho, O.L. Patrones de viaje hacia el empleo en una ciudad fronteriza México–USA con sistemas de información geográfica: Mexicali. Proyección 2017, 21, 190–211. [Google Scholar]
  43. Bringas-Burgos, B.; Mendoza-Muñoz, I.; Navarro-González, C.; González-Ángeles, Á.; Jacobo-Galicia, G. Análisis de sistemas de riego por gravedad y goteo subsuperficial basada en una encuesta de muestra de conveniencia en el valle de Mexicali. Rev. Vínculos ESPE 2020, 5, 13–32. [Google Scholar] [CrossRef]
  44. Ley García, J.; Fimbres Durazo, N.A. La expansión de la ciudad de Mexicali: Una aproximación desde la visión de sus habitantes. Región Y Soc. 2011, 23, 209–238. [Google Scholar] [CrossRef]
  45. Alvarado, A.A. Economic Growth in Mexicali: Trends and Perspectives. In Industria, Trabajo y Migración Internacional en la Frontera Norte de México; El Colegio de la Frontera Norte: Tijuana, México, 2021; pp. 179–212. [Google Scholar]
  46. Jiménez Esquivel, V.; López-Sagástegui, C.; Cota Nieto, J.J.; Mascareñas Osorio, I. Comunidades costeras del noroeste mexicano haciendo ciencia. In Relaciones. Estudios de Historia y Sociedad; El Colegio de Michoacán: Zamora, México, 2018; Volume 39, pp. 129–165. [Google Scholar] [CrossRef]
  47. Cisneros-Montemayor, A.M.; Townsel, A.; Gonzales, C.M.; Haas, A.R.; Navarro-Holm, E.E.; Salorio-Zuñiga, T.; Johnson, A.F. Nature-based marine tourism in the Gulf of California and Baja California Peninsula: Economic benefits and key species. In Proceedings of the Natural Resources Forum; Blackwell Publishing Ltd.: Oxford, UK, 2020; pp. 111–128. [Google Scholar]
  48. Instituto Nacional de Estadística, Geografía e Informática (INEGI) de México. Directorio Estadístico Nacional de Unidades Económicas. Available online: https://www.inegi.org.mx/app/mapa/denue/ (accessed on 4 November 2024).
  49. Smith, T.; Noble, M.; Noble, S.; Wright, G.; McLennan, D.; Plunkett, E. The English indices of deprivation 2015. Lond. Dep. Communities Local Gov. 2015, 9, 1–94. [Google Scholar]
  50. Rey, G.; Jougla, E.; Fouillet, A.; Hémon, D. Ecological association between a deprivation index and mortality in France over the period 1997–2001: Variations with spatial scale, degree of urbanicity, age, gender and cause of death. BMC Public Health 2009, 9, 33. [Google Scholar]
  51. Alkire, S.; Foster, J. Counting and multidimensional poverty measurement. J. Public Econ. 2011, 95, 476–487. [Google Scholar] [CrossRef]
  52. Mtweve, P.; Moseti, V.; Mahmoud, N.; Kramm, T.; Bogner, C.; Ibisch, P.; Biber-Freudenberger, L. Exploring socioeconomic and environmental impacts of road infrastructure development in Sub-Saharan Africa: A systematic literature review. Environ. Dev. 2025, 54, 101177. [Google Scholar] [CrossRef]
  53. Arshad, H.; Thaheem, M.J.; Bakhtawar, B.; Shrestha, A. Evaluation of road infrastructure projects: A life cycle sustainability-based decision-making approach. Sustainability 2021, 13, 3743. [Google Scholar] [CrossRef]
  54. Secretaría de Comunicaciones y Transportes (SCT). Marco Metodológico para la Adaptación de la Infraestructura Carretera ante el Cambio Climático en México; SCT: Sanfandila, México, 2019. [Google Scholar]
  55. Alamgir, M.; Campbell, M.J.; Sloan, S.; Goosem, M.; Clements, G.R.; Mahmoud, M.I.; Laurance, W.F. Economic, socio-political and environmental risks of road development in the tropics. Curr. Biol. 2017, 27, R1130–R1140. [Google Scholar] [CrossRef]
  56. Secretaría de Comunicaciones y Transportes (SCT). Criterios de Sustentabilidad Para Carreteras en México; SCT: Sanfandila, México, 2014. [Google Scholar]
  57. De Rus, G. Evaluación Económica de Políticas, Programas y Proyectos de Infraestructura; Catalogación en la fuente proporcionada por la Biblioteca Felipe Herrera del Banco Interamericano de Desarrollo: Washington, DC, USA, 2025. [Google Scholar]
  58. Riera-Spiegelhalder, M.; Campos-Rodrigues, L.; Ensenado, E.M.; Dekker-Arlain, J.D.; Papadopoulou, O.; Arampatzis, S.; Vervoort, K. Socio-economic assessment of ecosystem-based and other adaptation strategies in coastal areas: A systematic review. J. Mar. Sci. Eng. 2023, 11, 319. [Google Scholar] [CrossRef]
  59. Gómez-Lobo, A.; Belmar, C. Aspectos institucionales para potenciar la evaluación social de proyectos en transporte: Lecciones de América Latina. Ser. Doc. Trabajo. 2011, 337, 1–44. [Google Scholar] [CrossRef]
  60. Rogers, P.J. Introducción a la Evaluación de Impacto. Universidad RMIT (Australia) y Better Evaluation: The Rockefeller Foundation. 2012. Available online: http://www.clear-la.cide.edu/sites/default/files/3%20-%20Introduction%20to%20Impact%20Evaluation%20-%20Spanish_0_0.pdf (accessed on 15 October 2016).
  61. Varbova, V. Ex-Ante Assessment of the Thematic Area “Greening Cities” under the Urban Agenda for the EU; Final Report; European Commission: Bruxelles/Brussel, Belgium, 2022. [Google Scholar]
  62. Mottee, L.K.; Arts, J.; Vanclay, F.; Howitt, R.; Miller, F. Limitations of technical approaches to transport planning practice in two cases: Social issues as a critical component of urban projects. Plan. Theory Pract. 2020, 21, 39–57. [Google Scholar] [CrossRef]
  63. De Jong, G.; Vignetti, S.; Pancotti, C. Ex-post evaluation of major infrastructure projects. Transp. Res. Procedia 2019, 42, 75–84. [Google Scholar] [CrossRef]
  64. Bos, E.; de Swart, L. Towards a better comparison of ex-post and ex-ante BCA’s by decomposing potential causes of difference. Transp. Policy 2024, 151, 36–45. [Google Scholar] [CrossRef]
  65. Odeck, J.; Kjerkreit, A. The accuracy of benefit-cost analyses (BCAs) in transportation: An ex-post evaluation of road projects. Transp. Res. Part A Policy Pract. 2019, 120, 277–294. [Google Scholar] [CrossRef]
  66. Oliveros-Romero, J.; Aibinu, A.A. Ex post impact evaluation of PPP projects: An exploratory research. Built Environ. Proj. Asset Manag. 2019, 9, 315–330. [Google Scholar] [CrossRef]
  67. Samset, K.; Christensen, T. Ex ante project evaluation and the complexity of early decision-making. Public Organ. Rev. 2017, 17, 1–17. [Google Scholar] [CrossRef]
  68. Naim, M.; Mufariq, A.; Winarno, A.; Hermana, D. Identifying the actual beneficiaries of toll road development policies in rural communities: Ex-ante evaluation approaches. Cogent Soc. Sci. 2024, 10, 2328387. [Google Scholar] [CrossRef]
  69. Sitányiová, D.; Gogola, M. Data Analysis Based on CBA Concept; European Union, European Reginal Development Fundi: Lille, France, 2021. [Google Scholar]
  70. Konno, A.; Kato, H.; Takeuchi, W.; Kiguchi, R. Global evidence on productivity effects of road infrastructure incorporating spatial spillover effects. Transp. Policy 2021, 103, 167–182. [Google Scholar] [CrossRef]
  71. Laborda, L.; Sotelsek, D. Effects of road infrastructure on employment, productivity and growth: An empirical analysis at country level. J. Infrastruct. Dev. 2019, 11, 81–120. [Google Scholar] [CrossRef]
  72. Moszoro, M.; Soto, M. Road Quality and Mean Speed Score; International Monetary Fund: Washington, DC, USA, 2022. [Google Scholar]
  73. Briceño-Garmendia, C.; Moroz, H.; Rozenberg, J.; Lv, X.; Murray, S.; Bonzanigo, L. Road Networks, Accessibility, and Resilience: The Cases of Colombia, Ecuador, and Peru; World Bank: Washington, DC, USA, 2015. [Google Scholar]
  74. Schindler, S.; Kanai, J.M. Getting the territory right: Infrastructure-led development and the re-emergence of spatial planning strategies. Reg. Stud. 2021, 55, 40–51. [Google Scholar] [CrossRef]
  75. Rouhani, O.M.; Geddes, R.R.; Do, W.; Gao, H.O.; Beheshtian, A. Revenue-risk-sharing approaches for public-private partnership provision of highway facilities. Case Stud. Transp. Policy 2018, 6, 439–448. [Google Scholar] [CrossRef]
  76. Liu, Z.; Schindler, S.; Liu, W. Demystifying Chinese overseas investment in infrastructure: Port development, the Belt and Road Initiative and regional development. J. Transp. Geogr. 2020, 87, 102812. [Google Scholar] [CrossRef]
  77. Kantianis, D.; Polyzos, S.; Krabokoukis, T. Land Use Changes, Environmental Impact and Socio-Economic Effects of Road Infrastructure Mega Projects: The Combined Case of the Rio–Antirio Bridge and the Ionian Road in Greece. Land 2025, 14, 486. [Google Scholar] [CrossRef]
  78. Levkovich, O.; Rouwendal, J.; van Ommeren, J. The impact of highways on population redistribution: The role of land development restrictions. J. Econ. Geogr. 2020, 20, 783–808. [Google Scholar] [CrossRef]
  79. Tegebu, F.N.; Seid, E.H. Quantifying the road influence zone on socio-economic developments in rural Tigray, Ethiopia. Afr. Dev. Rev. 2017, 29, 601–614. [Google Scholar]
  80. Levine, J.; Grengs, J.; Merlin, L.A. From Mobility to Accessibility: Transforming Urban Transportation and Land-Use Planning; Cornell University Press: Ithaca, NY, USA, 2019. [Google Scholar]
  81. Kaiser, N.; Barstow, C.K. Rural transportation infrastructure in low-and middle-income countries: A review of impacts, implications, and interventions. Sustainability 2022, 14, 2149. [Google Scholar] [CrossRef]
  82. Rosik, P.; Stępniak, M. Monitoring of changes in road potential accessibility at municipality level in Poland, 1995–2015. Geogr. Pol. 2015, 88, 607–620. [Google Scholar] [CrossRef]
  83. Torre, A.; Wallet, F. Towards new paths for regional and territorial development in rural areas. Eur. Plan. Stud. 2015, 23, 650–677. [Google Scholar] [CrossRef]
  84. Fernández, J.; Fernández, M.I.; Soloaga, I. Enfoque Territorial y Análisis Dinámico de la Ruralidad: Alcances y Límites para el Diseño de Políticas de Desarrollo Rural Innovadoras en América Latina y el Caribe; Naciones Unidas: Ciudad de México, México, 2019. [Google Scholar]
  85. Cárdenas-Aguilar, C.C.; Vázquez Rueda, L.; Flores-Estrada, I.C. Factores de infraestructura local que influyen en la calidad de vida poblacional y en el desarrollo empresarial: Revisión de literatura. Rev. Cienc. Económico Adm.—UAS RECEA 2024, 2, 35–56. [Google Scholar]
  86. Quium, A.A. Transport corridors for wider socio–economic development. Sustainability 2019, 11, 5248. [Google Scholar] [CrossRef]
  87. Howe, J. Criteria for road planning. In Rural Roads and Poverty Alleviation; Routledge: London, UK, 2019; pp. 18–47. [Google Scholar]
  88. Bazzan, A.L.; Klügl, F. Introduction to Intelligent Systems in Traffic and Transportation; Springer Nature: Cham, Switzerland, 2022. [Google Scholar]
  89. Rosas-Ferrusca, F.J.; Rodríguez-Sánchez, V.; Miranda-Rosales, V.; Calderón-Maya, J.R. La Administración Pública del Estado de México ante los Objetivos del Desarrollo Sostenible. GIGAPP Estud. Work. Pap. 2019, 6, 3–27. [Google Scholar]
  90. Aportela, F.; Durán, R. IDEAL 2011. La Infraestructura en el Desarrollo Integral de América Latina. Diagnóstico Estratégico y Propuestas Para Una Agenda Prioritaria. Financiamiento: Retos y Oportunidades; CAF: Asunción, Paraguay, 2011. [Google Scholar]
  91. Lucioni, L. La Provisión Reciente de Infraestructura en América Latina: Tendencias, Inversiones y Financiamiento; Comisión Económica para América Latina y el Caribe (CEPAL): Santiago, Chile, 2009. [Google Scholar]
  92. Rozas, P.; Sánchez, R. Desarrollo de Infraestructura y Crecimiento Económico: Revisión Conceptual; 9213225776; Comisión Económica para América Latina y el Caribe (CEPAL): Santiago, Chile, 2004. [Google Scholar]
  93. Ge, F.; Chen, W.; Zeng, Y.; Li, J. The nexus between urbanization and traffic accessibility in the middle reaches of the Yangtze River urban agglomerations, China. Int. J. Environ. Res. Public Health 2021, 18, 3828. [Google Scholar] [CrossRef]
  94. Ng, C.P.; Law, T.H.; Jakarni, F.M.; Kulanthayan, S. Relative improvements in road mobility as compared to improvements in road accessibility and urban growth: A panel data analysis. Transp. Res. Part A Policy Pract. 2018, 117, 292–301. [Google Scholar] [CrossRef]
  95. Gómez, C.L. Infraestructura vial y niveles de accesibilidad entre los centros poblandos y los centros de actividad económica en la Provincia de Ñuble, VIII Región. In Tiempo y Espacio; Universidad del Bió-Bío: Concepción, Chile, 2005; pp. 101–112. [Google Scholar] [CrossRef]
  96. Hasan, S.; Wang, X.; Khoo, Y.B.; Foliente, G. Accessibility and socio-economic development of human settlements. PLoS ONE 2017, 12, e0179620. [Google Scholar] [CrossRef]
  97. Taylor, M.A.; Sekhar, S.V.; D’Este, G.M. Application of accessibility based methods for vulnerability analysis of strategic road networks. Netw. Spat. Econ. 2006, 6, 267–291. [Google Scholar] [CrossRef]
  98. Benardos, A.; Sourouvali, N.; Mavrikos, A. Measuring and benchmarking the benefits of Athens metro extension using an ex-post cost benefit analysis. Tunn. Undergr. Space Technol. 2021, 111, 103859. [Google Scholar] [CrossRef]
  99. Calva, S.A.V.; Flores, A.V.; Guzmán, L.R. Índice de habitabilidad urbana para el análisis de la vivienda en la ciudad de Toluca, México. Rev. Estud. Reg. 2024, 130, 339–369. [Google Scholar]
  100. Barrera-Alarcón, I.G.; Caudillo-Cos, C.A.; Medina-Fernández, S.L.; Ávila-Jiménez, F.G.; Montejano-Escamilla, J.A. La isla de calor urbano superficial y su manifestación en la estructura urbana de la Ciudad de México. Rev. Cienc. Tecnológicas 2022, 5, 312–330. [Google Scholar] [CrossRef]
  101. Ahumada-Cervantes, R.; Velázquez-Angulo, G.; Ahumada-Cervantes, B. Adaptación del sector agrícola ante el cambio climático: Propuesta de medidas a escala espacial fina en Guasave, Sinaloa, México. Acta Univ. 2018, 28, 46–56. [Google Scholar] [CrossRef]
  102. Aguayo Téllez, E.; Medellín Mendoza, S.E. Dependencia espacial de la delincuencia en Monterrey, México. Ecos De Econ. 2014, 18, 63–92. [Google Scholar] [CrossRef]
  103. Platas, D.A.F.; Calmaestra, J.A.N.; Osorno, I.D.C.G. Caminos recorridos en un diseño metodológico para el estudio de las (des) igualdades sociales y (des) equilibrios espaciales. Una aplicación a Xalapa (México). In Cuadernos Geográficos; Universidad de Granada: Granada, España, 2013; pp. 205–231. [Google Scholar]
  104. Secretaría de Comunicaciones y Transportes (SCT). Análisis de Factibilidad del Proyecto Carretero Mexicali-San Felipe (38+700 al 170+400); SCT: Mexicali, México, 2006. [Google Scholar]
  105. Secretaría de Comunicaciones y Transportes (SCT); Dirección General de Servicios Técnicos. Datos Viales 2011: Baja California. Available online: https://micrs.sct.gob.mx/images/DireccionesGrales/DGST/Datos-Viales-2011/02_BAJA_CALIFORNIA.pdf (accessed on 6 February 2026).
  106. Secretaría de Comunicaciones y Transportes (SCT); Dirección General de Servicios Técnicos. Datos Viales 2017: Baja California. Available online: https://micrs.sct.gob.mx/images/DireccionesGrales/DGST/Datos-Viales-2017/02_BAJA_CALIFORNIA.pdf (accessed on 6 February 2026).
  107. Instituto Nacional de Estadística, Geografía e Informática (INEGI) de México. Censos Económicos 2019. Available online: https://www.inegi.org.mx/programas/ce/2019/ (accessed on 6 February 2026).
  108. Instituto Nacional de Estadística, Geografía e Informática (INEGI) de México. Censos Económicos 2014. Available online: https://www.inegi.org.mx/programas/ce/2014/ (accessed on 6 February 2026).
  109. Instituto Nacional de Estadística, Geografía e Informática (INEGI) de México. Censos Económicos 2009. Available online: https://www.inegi.org.mx/programas/ce/2009/ (accessed on 6 February 2026).
  110. Instituto Nacional de Estadística, Geografía e Informática (INEGI) de México. Censos Económicos 2004. Available online: https://www.inegi.org.mx/programas/ce/2004/ (accessed on 6 February 2026).
Figure 1. Localities served by Federal Highway No. 5 along the Mexicali–San Felipe corridor. Source: author’s own elaboration using INEGI data [33].
Infrastructures 11 00082 g001
Figure 2. Sections analyzed along Federal Highway No. 5, Mexicali–San Felipe corridor. Source: author’s own elaboration using INEGI data [33].
Infrastructures 11 00082 g002
Figure 3. Cross-section of the 0–38 km section of the Mexicali–San Felipe highway corridor. Source: Google Earth [38].
Infrastructures 11 00082 g003
Figure 4. Cross-section at the El Faro Interchange (km 38). Source: Google Earth [38].
Infrastructures 11 00082 g004
Figure 5. Cross-section of the km 38–160 section of the Mexicali–San Felipe highway corridor. Source: Google Earth [38].
Infrastructures 11 00082 g005
Figure 6. Location of the El Chinero Interchange (km 141). Source: Google Earth [38].
Infrastructures 11 00082 g006
Figure 7. Cross-section of the 160–190 km section of the Mexicali–San Felipe highway corridor. Source: Google Earth [38].
Infrastructures 11 00082 g007
Figure 8. Methodological framework. Source: author’s own elaboration.
Infrastructures 11 00082 g008
Figure 9. Description of the level of urban marginalization with respect to a normal distribution. Source: author’s own elaboration.
Infrastructures 11 00082 g009
Figure 10. AGEB in localities impacted by Federal Highway No. 5, Mexicali–San Felipe. Source: author’s own elaboration using INEGI data [33].
Infrastructures 11 00082 g010
Figure 11. UMI levels in AGEB of the study area in ex-ante and ex-post situations. Source: author’s own elaboration using INEGI data [33,39,40].
Infrastructures 11 00082 g011
Table 1. Main localities affected by the Mexicali–San Felipe highway.
LocalitiesPopulation
200020102020
Mexicali549,873689,775717,047
Guadalupe Victoria15,56117,11919,081
San Felipe13,12316,70217,143
Ejido Puebla742115,16821,269
Progreso446212,55713,106
Carranza355260986205
Ciudad Coahuila647956176503
Delta486051805615
Nuevo León325536553776
Michoacán de Ocampo323730863347
Total611,823774,957813,092
Source: author’s own elaboration using INEGI data [33,39,40].
Table 2. Economic units by activity sector in localities impacted by the Mexicali–San Felipe corridor.
Activity Sector (EU)Total UnitsShare of Total (%)
(1) Agriculture, animal husbandry, forestry, fishing, and hunting500.1
(2) Mining40.0
(3) Manufacturing industries24067.1
(4) Wholesale trade11983.5
(5) Retail trade11,19733.2
(6) Professional, scientific, and technical services9342.8
(7) Temporary accommodation services and food and beverage preparation400411.9
(8) Real estate services and rental/leasing of tangible and intangible goods15604.6
(9) Other services12,41936.8
Total33,772100.0
Note: EU = economic units. Sector definitions follow INEGI. Detailed locality-level counts are provided in the Supplementary Materials (Table S1). Source: author’s own elaboration using INEGI data [48].
Table 3. Breakdown of dimensions by indicators used to estimate the UMI.
DimensionsNo.Indicators
Education1% of population without school and/or with incomplete low levels of education
Health2% of population without right to health services
Housing3% of occupied housing units with earthen floor
4% of occupied housing units without electricity
5% of occupied housing units without piped water
6% of occupied housing units without drainage
Source: author’s own elaboration using CONAPO data [25,26].
Table 4. Territorial condition of the study localities and number of AGEB in ex-ante and ex-post situation.
LocalitiesTerritorial Conditions200020102020
Total AGEBPopulationTotal AGEBPopulationTotal AGEBPopulation
MexicaliUrban
periphery
2142,8493673,7954089,976
DeltaSub-urban448606518075615
San FelipeUrban1513,1231616,7021617,143
Michoacán de OcampoSub-urban132371308613347
Ejido PueblaSub-urban47421815,1681721,269
ProgresoSub-urban744621612,5571613,106
Ciudad CoahuilaSub-urban664796561766503
Nuevo LeónSub-urban232554365543776
CarranzaSub-urban535525609866205
Guadalupe VictoriaSub-urban1015,5611317,1191619,081
Total75104,799111158,977129186,021
Source: author’s own elaboration using INEGI data [33,39,40].
Table 5. Road accessibility levels of localities.
LocalitiesLevel of AccessibilityDist. FHNAccessibility Description
MexicaliA-Locality directly connected to the federal highway corridor of the case study
DeltaC24.20Locality indirectly connected to the federal road network through a secondary or feeder road
San FelipeA-Locality directly connected to the federal highway corridor of the case study
Michoacán de OcampoC10.15Locality indirectly connected to the federal road network through a secondary or feeder road
Ejido PueblaB-Locality that accesses the road network through another federal highway
ProgresoB-Locality that accesses the road network through another federal highway
Ciudad
Coahuila
C33.50Locality indirectly connected to the federal road network through a secondary or feeder road
Nuevo LeónC16.25Locality indirectly connected to the federal road network through a secondary or feeder road
Carranza C16.00Locality indirectly connected to the federal road network through a secondary or feeder road
Guadalupe VictoriaC31.45Locality indirectly connected to the federal road network through a secondary or feeder road
Note: Dist. FHN = Distance to the federal highway network (km). Source: author’s own elaboration.
Table 6. Key UMI indicators by locality and year (2000/2010/2020).
LocalityAccess LevelAGEB (n), 2000/2010/2020Critical (%)Lower Marginalization (%)Dominant UMI Level, 2020
MexicaliA21/36/4014.3/2.8/0.047.6/63.9/72.5Middle–Low
San FelipeA15/16/1646.7/12.5/0.026.7/43.8/75.0Middle–Low
Ejido PueblaB4/8/170.0/25.0/5.925.0/37.5/70.6Middle–Low
ProgresoB7/16/1657.1/18.8/18.80.0/31.2/37.5Middle–High
DeltaC4/6/70.0/0.0/0.00.0/50.0/71.4Middle–Low
Michoacán de OcampoC1/1/10.0/0.0/0.00.0/0.0/100.0Middle–Low
Nuevo LeónC2/4/40.0/0.0/0.050.0/25.0/50.0Middle–Low
Ciudad CoahuilaC6/6/650.0/66.7/16.716.7/0.0/16.7Middle–High
Guadalupe VictoriaC10/13/1640.0/7.7/6.220.0/23.1/31.2Middle–High
CarranzaC5/5/620.0/0.0/0.00.0/40.0/0.0Middle–High
Note: Critical = High + Very High. Lower marginalization = Low + Middle–Low. n is the number of AGEB per locality and year. Road accessibility levels (A–C) follow the classification reported in Table 5. Source: author’s own elaboration using INEGI data [33,39,40].
Table 7. Economic units by sector and level, census years, growth rates and counterfactual comparison (2003–2018).
LevelSector2003200820132018
Observed
Growth 2003–2018 (%)2018
Counterfactual *
Obs–CF
NationalPrimary21,25219,44320,40724,37214.70%
Secondary347,676461,034512,346605,41374.00%
Tertiary2,241,2152,750,2053,107,4253,488,60355.60%
Total2,610,1433,230,6823,640,1784,118,38857.80%
Baja
California
Primary407280269390-4.20%
Secondary497166087888881577.40%
Tertiary46,19559,63270,37476,71066.10%
Total51,57366,52078,53185,91566.60%
Mexicali–San Felipe
corridor
Primary483135516.30%55-4
Secondary1258200222712546102.40%2189357
Tertiary12,50116,05918,91220,63665.10%19,4521184
Total13,80718,09221,21823,23368.20%21,6961537
Note: * Counterfactual values calculated by applying national sectoral growth rates (2003–2018) to the corridor’s 2003 baseline. Source: author’s own elaboration using INEGI data [107,108,109,110].
Disclaimer/Publisher’s Note: The statements, opinions and data contained in all publications are solely those of the individual author(s) and contributor(s) and not of MDPI and/or the editor(s). MDPI and/or the editor(s) disclaim responsibility for any injury to people or property resulting from any ideas, methods, instructions or products referred to in the content.