Article

Strength, Transport Properties, and Life Cycle Impacts of Mortar Containing German Natural Pozzolan


1
Laboratoire Béton, Groupe FEHR, 62 Route de Strasbourg, 67242 Bischwiller, France
2
Faculty of Engineering, Beirut Arab University, Beirut 12-5020, Lebanon
3
College of Engineering and Technology, American University of the Middle East, Egaila 54200, Kuwait
*
Authors to whom correspondence should be addressed.
Infrastructures 2026, 11(2), 67; https://doi.org/10.3390/infrastructures11020067
Submission received: 28 January 2026 / Revised: 12 February 2026 / Accepted: 14 February 2026 / Published: 16 February 2026

Abstract

Portland cement production is energy- and carbon-intensive. Substituting part of the clinker with natural pozzolans is a promising route to lower-impact mortars. This work evaluates mortar where Portland cement is partially replaced by a German natural pozzolan (12–56% by mass). Compressive and flexural strengths were measured at 7, 28, and 90 d. Water-accessible porosity (28 d) and 24 h water absorption were also determined. Strength development and water transport were interpreted using (i) a three-parameter strength–age model and (ii) a capillary–diffusive model. The results showed delayed reactivity typical of pozzolanic materials. At 90 d, 12% replacement slightly exceeded the control by 3.38% and 1.4% in compressive and flexural strengths respectively. Higher replacement levels caused a drop in strength at 90 d (18.3% at 36% and 42.5% at 56% in compression; 25.3% and 31.0% in flexure). Porosity and absorption increased with replacement, consistent with the mechanical trends. The compressive and flexural strengths were strongly correlated. Life cycle analysis showed a significant reduction in embodied carbon, reaching approximately 52% at 56% replacement. Overall, moderate replacement (12–21%) provides the best balance between performance and carbon reduction.

1. Introduction

Concrete is the most widely used construction material worldwide, mainly owing to its affordability, ease of manufacturing, tolerance to handling errors, flexibility, and the widespread availability of its raw constituents. Nevertheless, the concrete production process necessitates large quantities of Portland cement. The cement industry is the major source of global CO2 emissions mainly originating from the clinker manufacturing process. The International Energy Agency reported that cement-related emissions reached approximately 2 Gt in 2007, and global cement production is expected to increase by nearly 50% by 2050 [1]. These projections underscore the critical need to minimize the carbon footprint resulting from cement manufacturing. To address this, Portland cement is partially substituted in cementitious systems by supplementary cementitious materials (SCMs), which reduces clinker demand and, consequently, greenhouse gas emissions linked to the cement industry [2].
A wide range of solid industrial by-products (fly ash, silica fume, and blast furnace slags) and natural pozzolanic materials are commonly classified as supplementary cementitious materials (SCMs) because of their cementitious and/or pozzolanic behavior [2,3,4]. Their incorporation into cementitious systems has been shown to reduce carbon emissions associated with concrete production by approximately 5% to 30% [5]. Beyond their environmental benefits, SCMs play an important role in improving concrete performance through both physical and chemical mechanisms. Physically, SCM particles are characterized by their fineness contributing to the matrix densification through a filler effect. Chemically, the amorphous silica and alumina present in the pozzolanic material react with calcium hydroxide (CH), producing additional secondary hydration products (calcium–silicate–hydrate (C–S–H) and calcium–aluminate–silicate–hydrate (C–A–S–H)). The development of the secondary hydration products refines the pore structure, contributing to late-age strength gain and enhanced durability [6,7,8,9,10].
Natural pozzolans (NPs) are alumino-siliceous materials that are available and remain underutilized in numerous areas across the globe [11]. The impact of NPs on the physical, mechanical, and durability characteristics of cementitious materials has been extensively studied through the literature [12,13,14,15,16]. Regarding the mechanical performance, numerous studies have demonstrated that the incorporation of NPs affects strength development in concrete and mortar in an age-dependent manner: at early ages, partial replacement of Portland cement with NPs often results in reduced compressive strength. However, at later curing ages, the strength is improved as secondary C–S–H progressively densifies the matrix. For instance, Mouli and Khelafi [14] reported that lightweight aggregate concretes incorporating Algerian NPs achieved optimal mechanical performance at approximately 20% cement replacement, exhibiting increased compressive, tensile, and flexural strengths at 28 to 365 d compared to the control mix. Another investigation found that blended Portland cements with 10%, 20%, and 30% Santorin Earth achieved comparable or superior compressive strength compared to the reference Portland cement [13]. Similar findings were reported for Jordanian NPs, where high replacement levels (up to 70%) led to significant reductions in early-age strength; however, mechanical activation through grinding and thermal curing substantially enhanced early compressive strength, with increases of up to 80% at 3 d. It was also reported through the literature that the strength development in the cementitious matrix integrating NPs is highly affected by the pozzolan fineness (higher fineness accelerates pozzolanic activity), reactive silica content, and chemical composition (SiO2 + Al2O3 + Fe2O3) [17]. Additionally, many studies combined the use of NPs with nano- or micro-scale additives, such as graphene nanoplatelets, demonstrating promising findings in increasing both early- and late-age mechanical performance [18].
NP integration in concrete and mortar affects its durability. For instance, Khitas et al. [19] reported that mortars incorporating NPs exhibited diminished long-term water absorption and sorptivity, compared to the control mixture. Moreover, Hosseinzadehfard and Mobaraki [20] demonstrated that the 25% replacement of microsilica in reinforced concrete with NP maintains comparable corrosion resistance. NPs have also been shown to improve resistance to sulfate attack, alkali–silica reaction, and leaching.
This study evaluates a newly characterized NP sourced from Sievert (Germany), originating from a siliceous–aluminous geological formation, as a partial replacement of cement in mortar. An experimental program was conducted to investigate its effects on the physical, mechanical, hygric, and environmental performance of cementitious systems. Tests were carried out on five mortar mixes with several pozzolan replacement levels by mass of cement: 0, 12, 21, 36, and 56%. The tests included water-accessible porosity, bulk density, flexural strength, compressive strength, water absorption, and capillary water absorption. Experimental data resulting from compressive strength and capillary water absorption measurements were modeled using a nonlinear three-parameter model and a capillary–diffusive model, respectively. Numerical analysis showed good agreement with the measured results. The environmental impact of pozzolan incorporation was examined through a life cycle analysis (LCA) demonstrating a carbon footprint decrease in the pozzolan-modified mortar mixtures. Finally, correlations between the compressive strength and other parameters were evaluated.

2. Materials and Methods

2.1. Materials

2.1.1. Sand

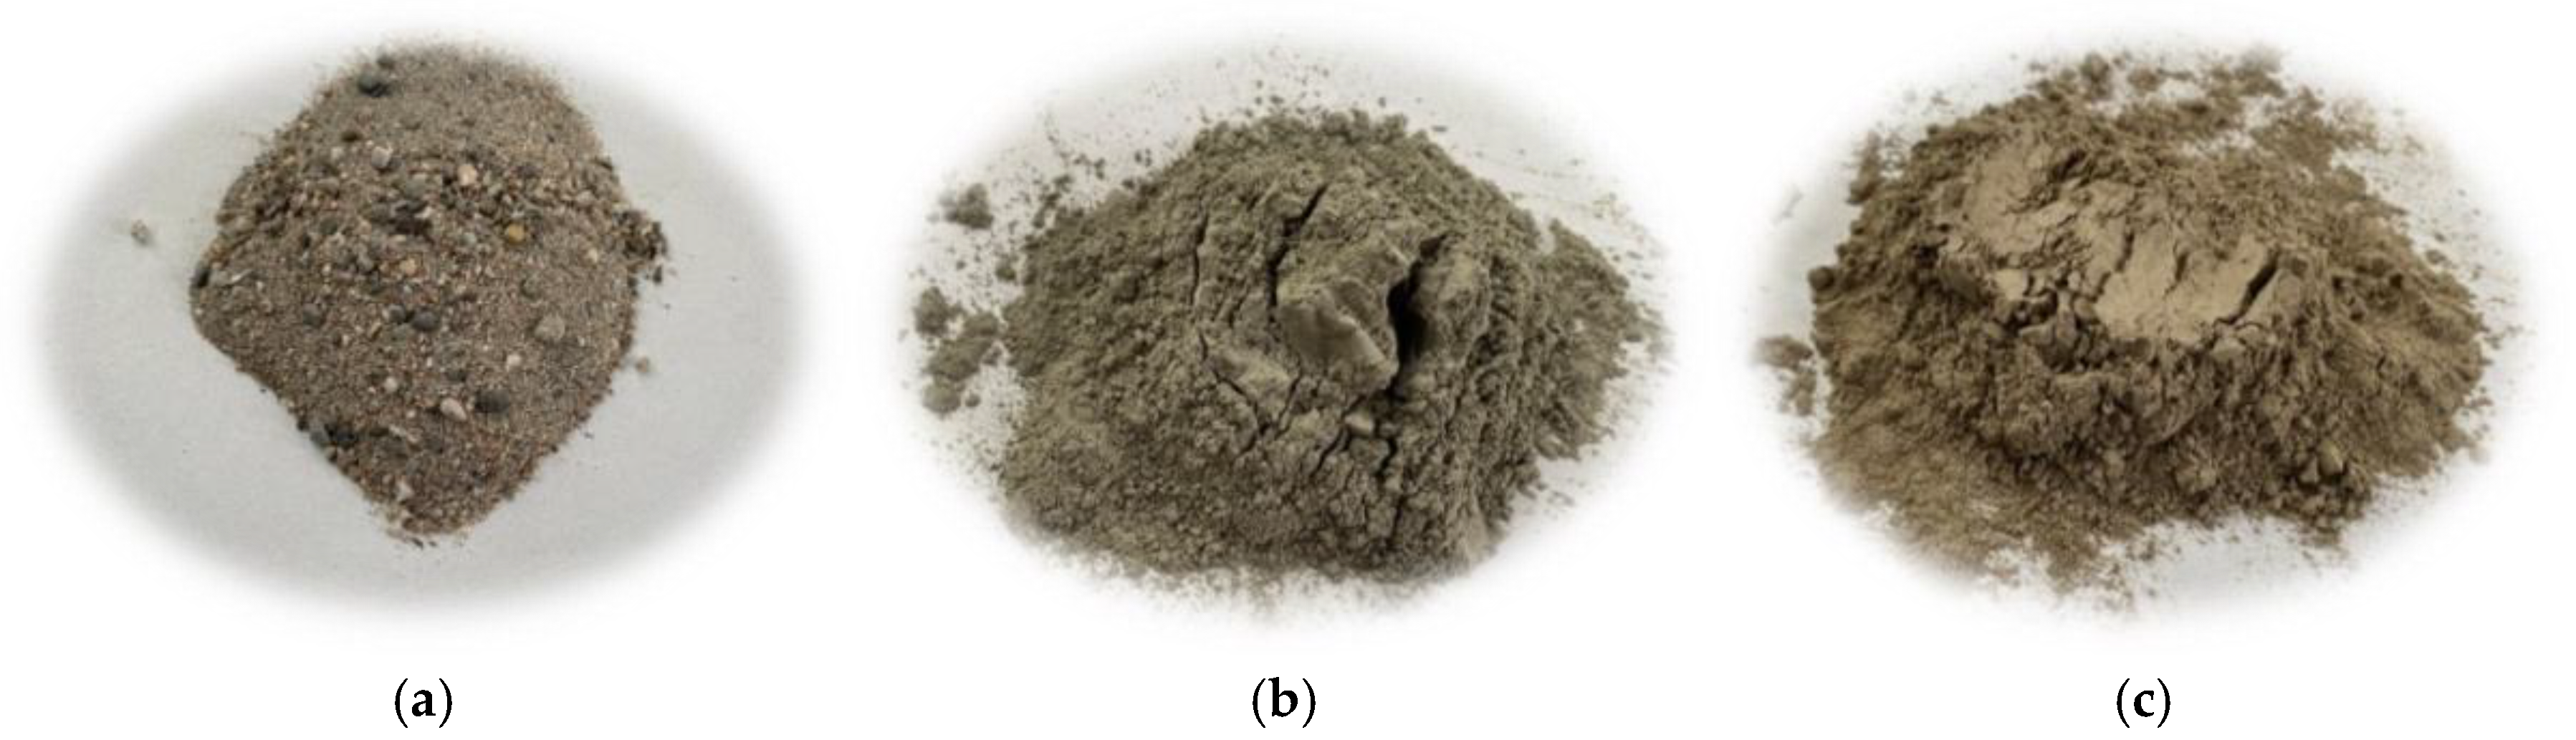
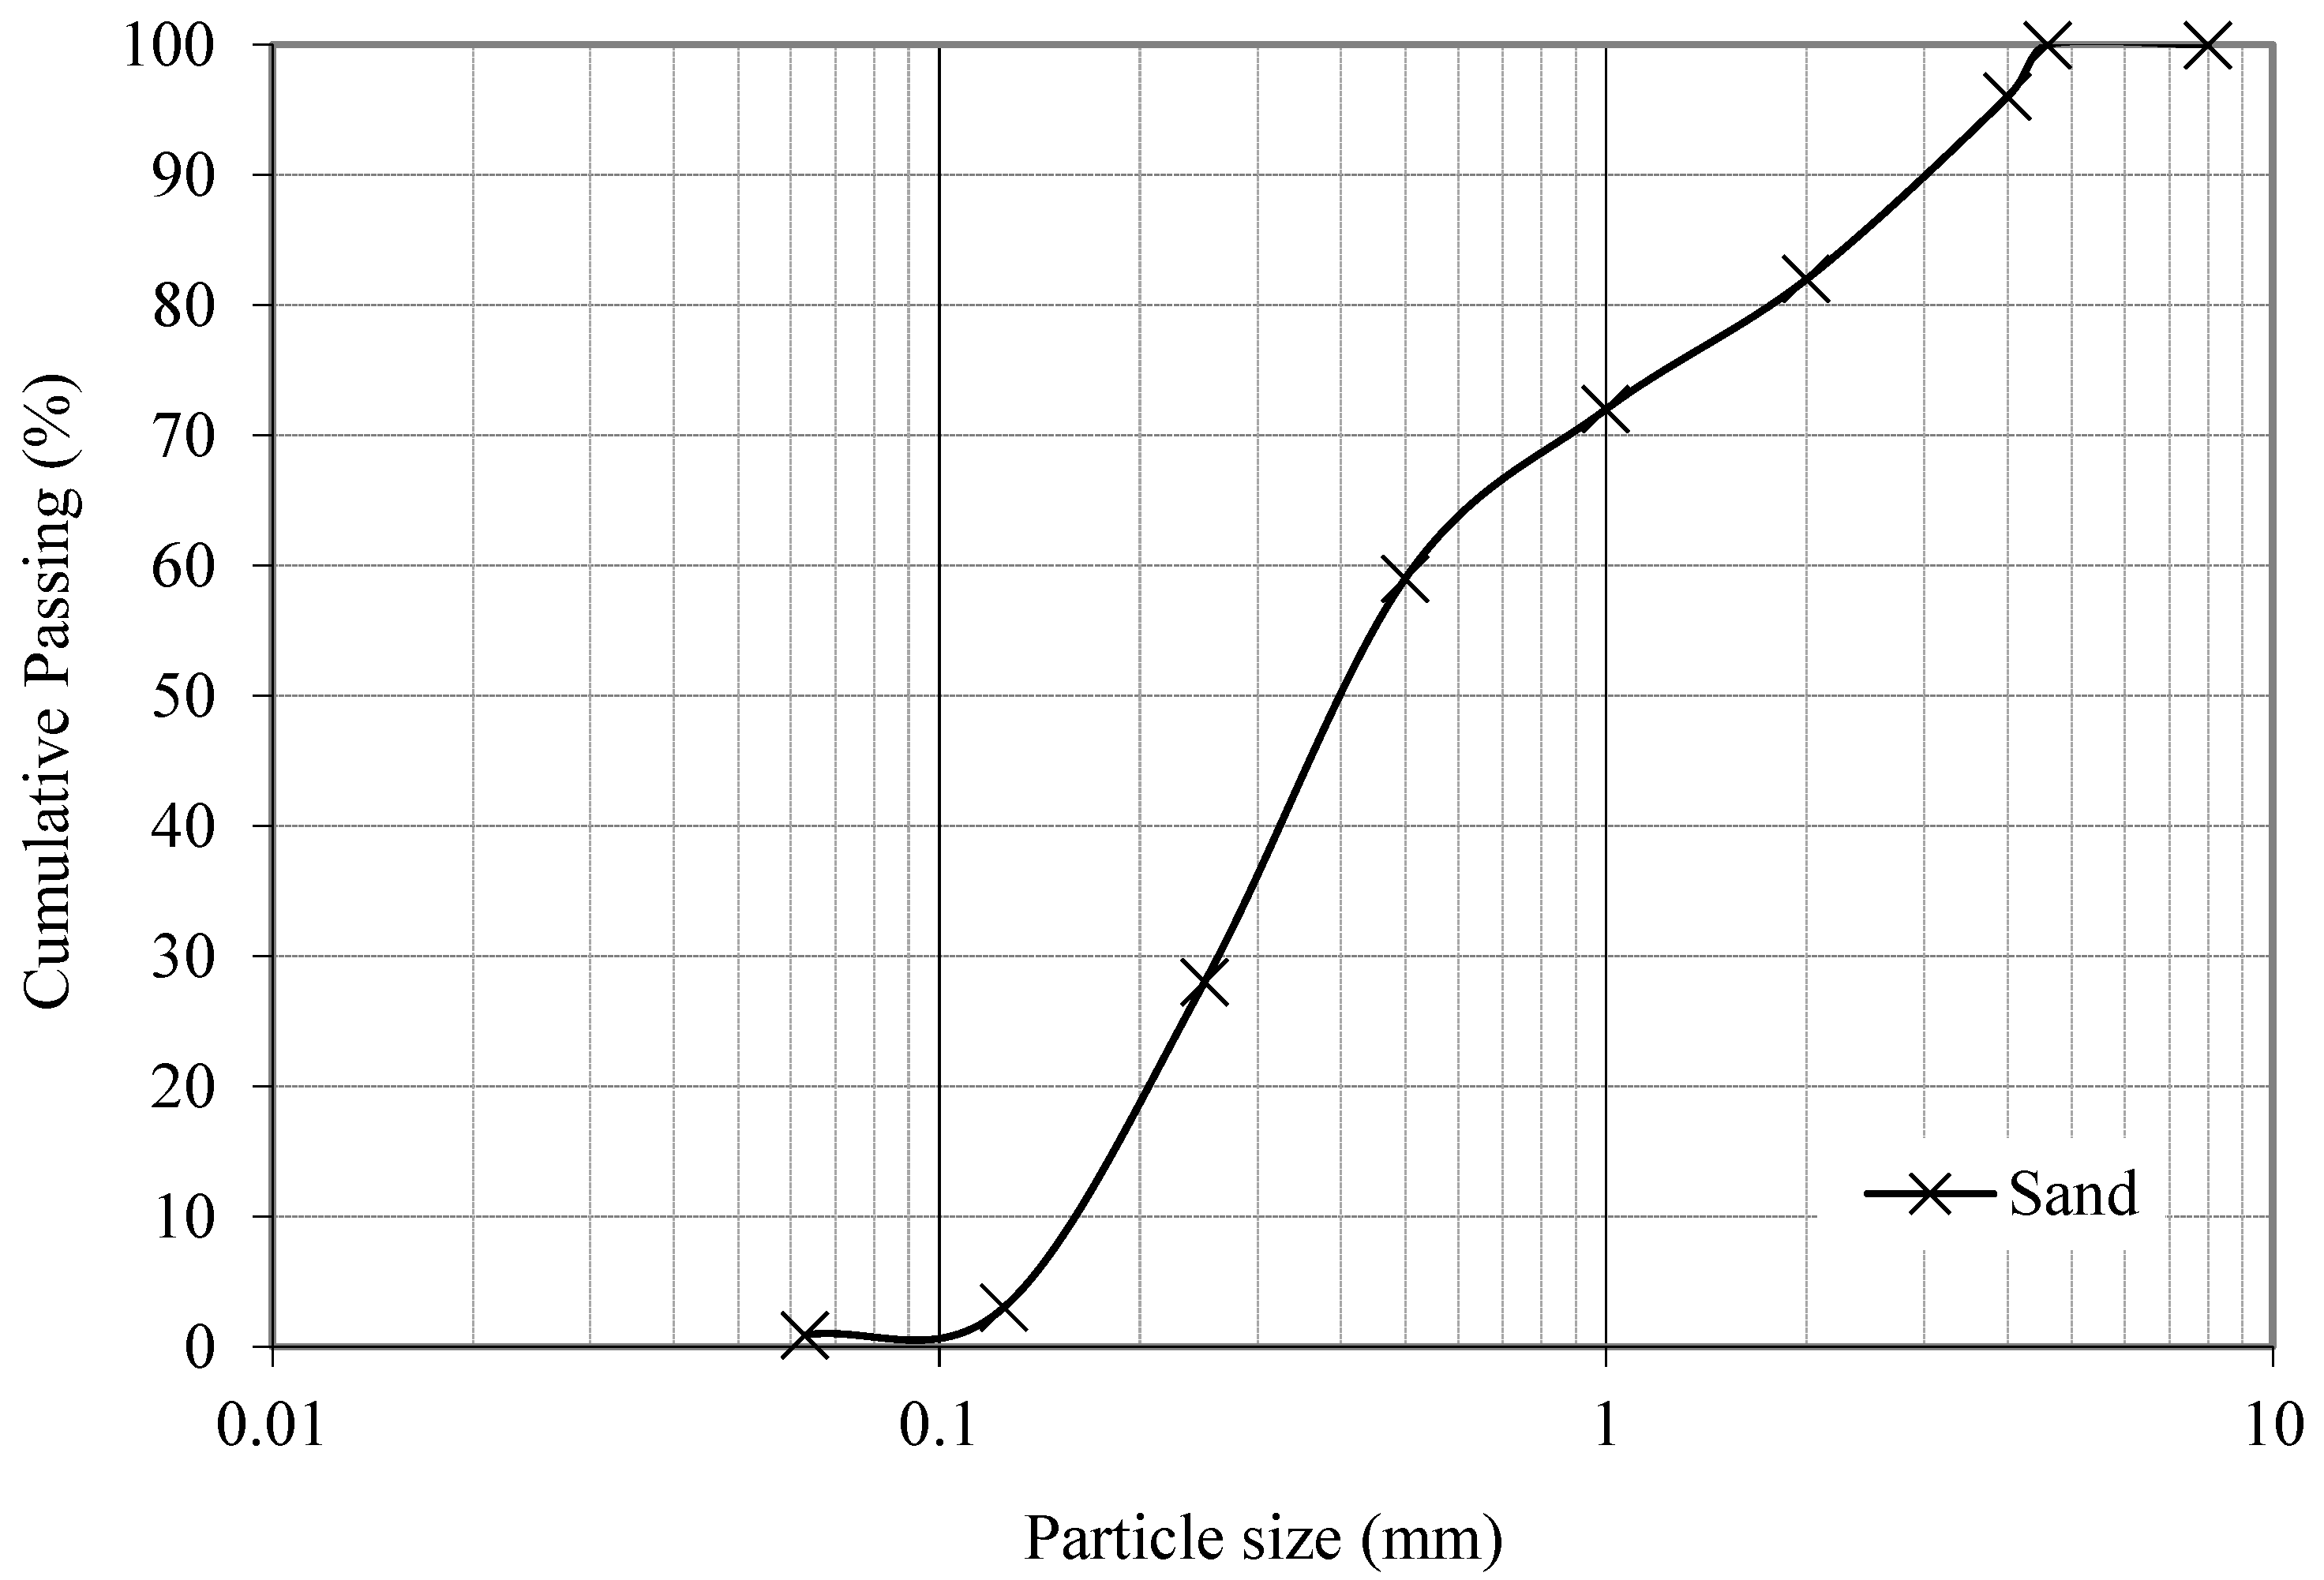
The fine aggregate used in this study is natural washed sand (Figure 1a). The particle size distribution presented in Figure 2 conforms to the specifications for aggregates of the standard NF P 18-545. The sand represents a fineness index of 2.6, corresponding to a medium sand. Table 1 displays the sand’s physical properties.

2.1.2. Cement

The cement used in this study is Portland cement classified as type CEM II/A-LL 52.5R (Figure 1b), whose composition is defined by standard NF EN 197-1 (The cement used in this study complies with the European standard NF EN 197-1:2012, which defines the composition, specifications, and conformity criteria for common cements (NF EN 197-1:2012) [21]. The chemical composition and physical properties are obtained from the manufacturer’s technical data sheet, as specified in Table 2.

2.1.3. Pozzolan

The pozzolanic material utilized in this study was provided by Sievert (Germany) and is derived from a naturally occurring siliceous–aluminous geological source. This material, classified as a natural pozzolan, originates from volcanic or sedimentary formations that are abundant in amorphous silica and alumina phases. The pozzolan is finely ground and contains high levels of silica (SiO2) and alumina (Al2O3). As illustrated in Figure 1c, the pozzolan is characterized as a light-colored fine powder. X-ray fluorescence (XRF) analysis reveals that the primary oxides present are: SiO2 (59.82%), Al2O3 (17.60%), and Fe2O3 (6.52%). The chemical composition of the pozzolan with its physical properties is summarized in Table 3. The pozzolan has an apparent density of 2760 kg/m3 and a specific surface area ranging between 5500 and 6000 cm2/g. Note that the pozzolan has a low Chromium content (0.02%). As part of this study, no leaching campaign was carried out. A standardized leaching test could be performed in the future to complement the environmental assessment.

2.2. Methods

2.2.1. Sample Preparation and Mix Proportions

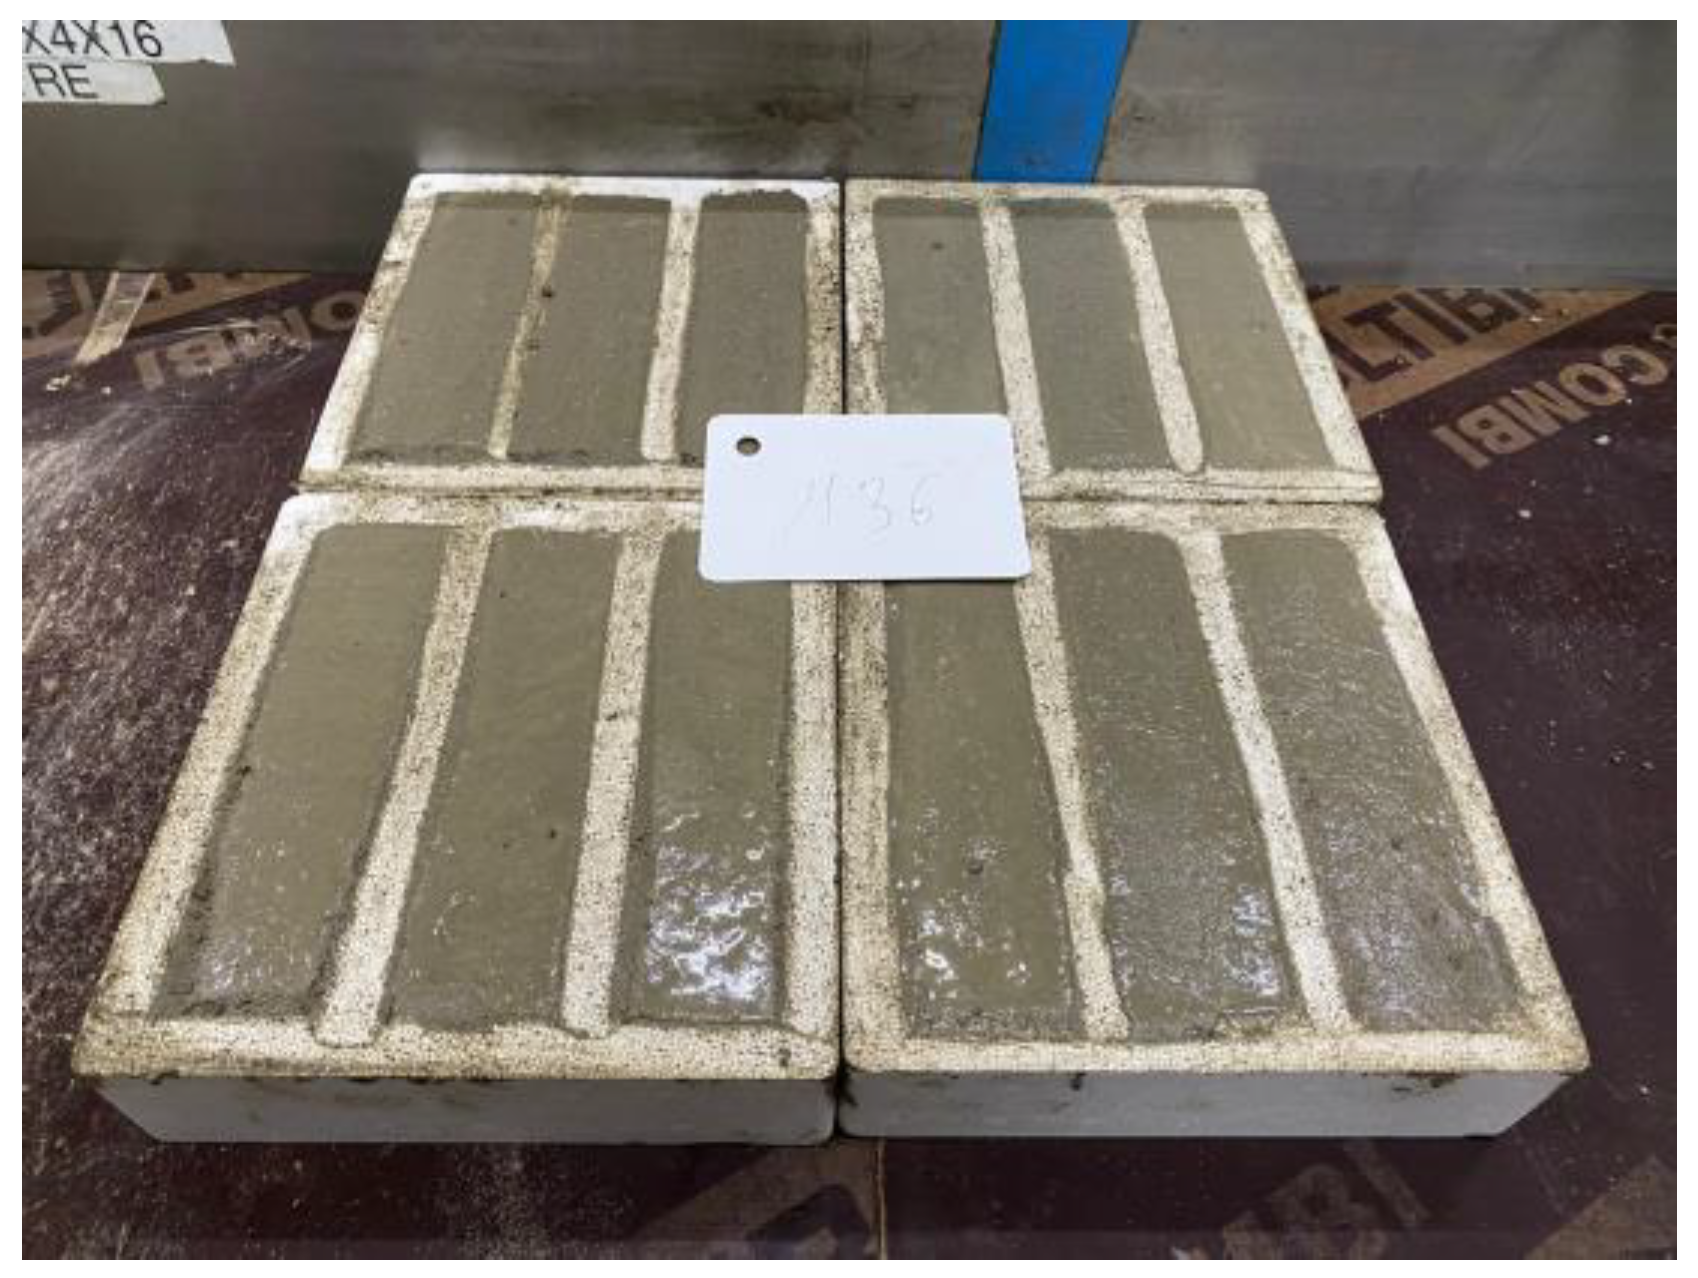
Five mortar mixes were formulated with pozzolan replacement amounts of 0%, 12%, 21%, 36%, and 56% by mass of cement. These replacement levels are chosen according to the EN 197-1 standard. This standard defines a pozzolanic cement CEM IV/A with a substitution rate between 11 and 35%, and a CEM IV/B cement with a rate between 36 and 55%. For all mixes, the water-to-binder (w/b) ratio and the binder-to-sand (b/s) ratio remained constant at 0.5 and 1/3, respectively. The detailed mix proportions of all mortar formulations are summarized in Table 4. It should be noted that no plasticizers are used in these formulations. Initially, a dry mixture of cement, pozzolan, and sand was blended in a mechanical mixer for 60 s at low speed. Water was then gradually added, and mixing continued for 120 s at medium speed. A flow test was performed for each mix to evaluate the consistency in the fresh state. The mortar flow values were assessed following ASTM C1437 (Standard Test Method for Flow of Hydraulic Cement Mortar) [22], and all mixtures demonstrated flow values that fell within the range suggested by the standard. Two types of molds were used in this investigation: beams of dimensions (40 × 40 × 160) mm were employed for physical, mechanical and water absorption tests, and (100 × 100 ×100) mm cubes were used for the capillary absorption test. Mortar mixes were cast in two successive layers in accordance with NF EN 196-1 [23]; 60 shocks were applied on each layer within 60 s to eliminate entrapped air using a tapping table. Then, the specimen’s upper surface was leveled with a steel trowel (Figure 3). Subsequently, the molds were covered with a plastic film and stored for 24 h in a controlled environment at (20 ± 2) °C and relative humidity above 95%. After 24 h, the specimens were demolded and cured in a climatic chamber at (20 ± 2) °C and 95% relative humidity. At the designated testing day, the specimens were conditioned at (20 ± 2) °C and 50% relative humidity to stabilize their moisture state prior to testing.

2.2.2. Physical Properties: Water-Accessible Porosity and Bulk Density

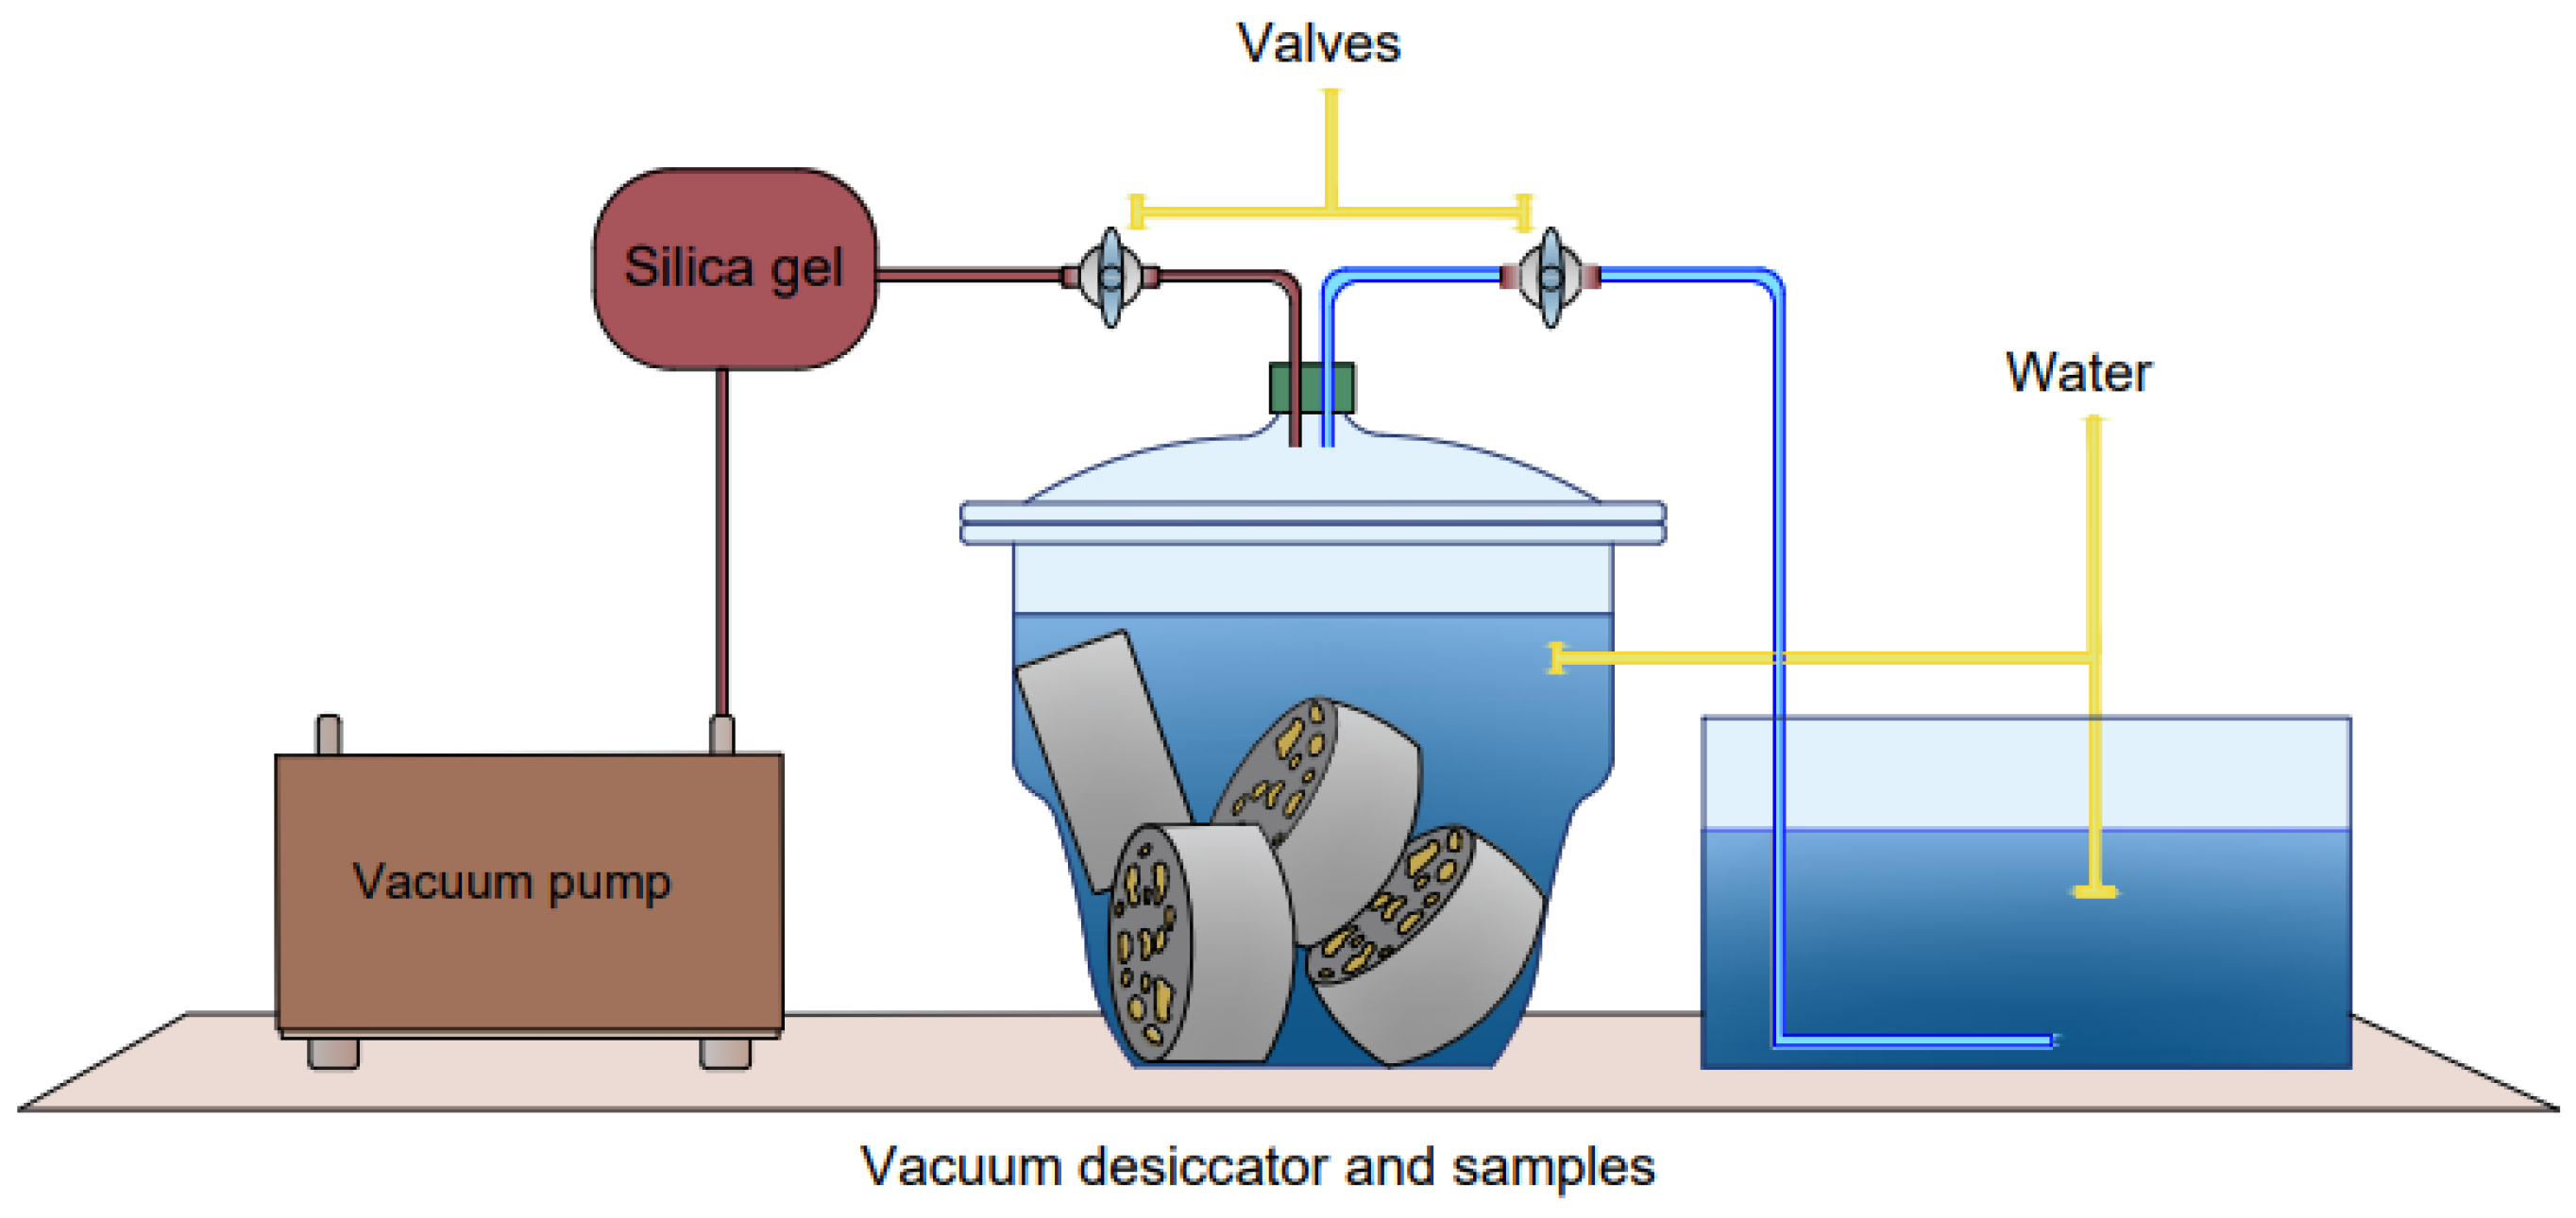
At 28 d, mortar specimens were oven-dried until a constant mass (Md) was achieved. Subsequently, each sample was water-saturated within a vacuum desiccator to extract air from the interconnected pores (Figure 4). The saturated surface dry mass (MSSD) was recorded after wiping the surface water. The apparent mass (Ma) of the sample immerged in water was also measured by hydrostatic weighing, in accordance with NF P18-459 [24]. The water-accessible porosity is expressed as follows:
μ = M S S D M d M S S D M a × 100
A bulk density test was conducted following the guidelines set by NF P18-459 [24] using hydrostatic weighing. After being oven-dried, the samples were fully saturated in water under vacuum (Figure 4). The bulk density is calculated as follows:
B u l k   D e n s i t y = M d × ρ w M S S D M a
where ρ w = water density.

2.2.3. Mechanical Properties: Flexural and Compressive Strengths

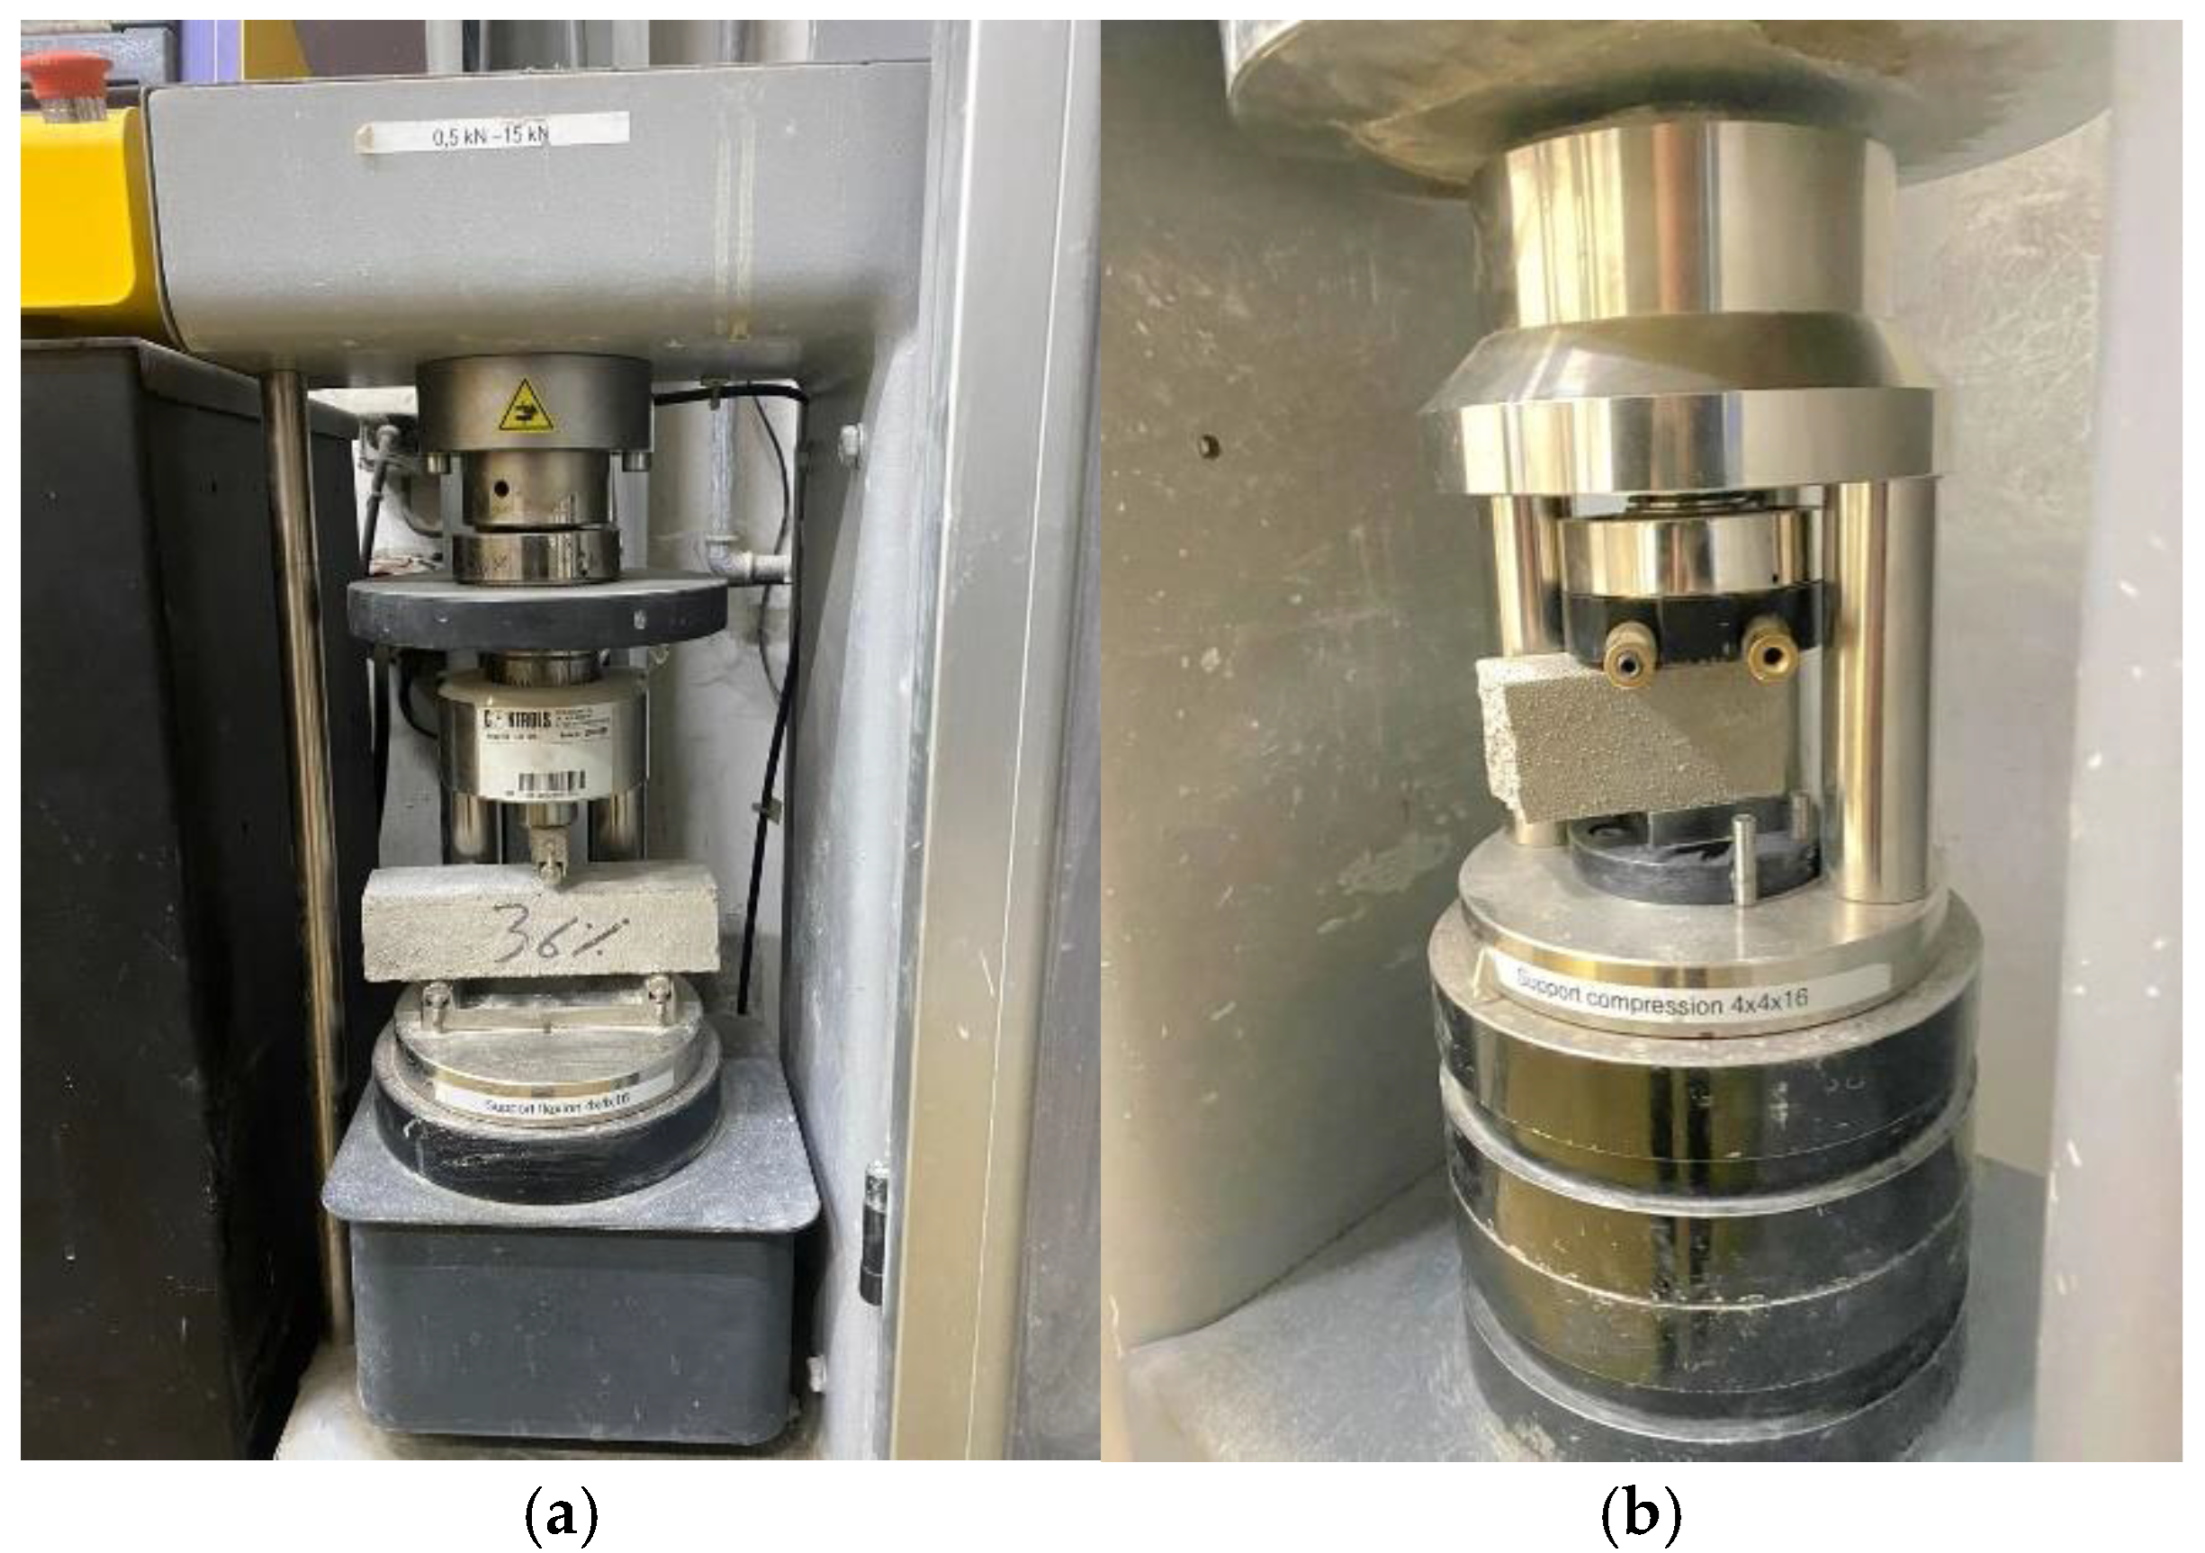
The flexural strength of the mortar samples was evaluated at 7, 28, and 90 d using a three-point bending test in accordance with NF EN 196-1 [23]. The 40 × 40 × 160 mm specimens were cured for the designated periods. The tests were performed using a 250 kN electromechanical press from IGM, equipped with a 50 kN load cell to enhance measurement accuracy (Figure 5a). The standard specifies a loading rate of 50 N/s, and three specimens were tested for each mixture. The three-point bending strength is calculated according to the standardized expression:
R f = 1.5 × F f × l b 3
where R f (MPa) is the flexural strength, F f (N) the maximum bending load, l (mm) the center distance between supports, and b (mm) the side of the prism section.
Compressive strength tests were conducted on the halves of the specimens previously used for flexural testing at the same curing ages as recommended by NF EN 196-1 [23]. The same press was used, but the 50 kN load cell was replaced by a 250 kN cell to accommodate the higher loads. The tests were carried out at a loading rate of 2.4 kN/s (Figure 5b), following the requirements of NF EN 196-1 [23]. For each test and curing age, three replicates were tested and the results presented represent the average. The compressive strength is calculated using the following equation:
R c = F c A
where R c (MPa) is the compressive, F c (N) the maximum compressive load, and A (mm2) the area of the sample equal to 1600 mm2. These expressions comply with the requirements of standard EN 196-1 [23].

2.2.4. Measurement of Hygric Properties

Water Absorption Measurement
The water absorption percentage WA was measured for each mixture after 28 d of curing. The test was performed according to NF P18-459 [24] by immersing the oven-dried specimens in water for 24 h. The WA percentage was computed based on the mass increase relative to the dry mass as follows:
W A = M 2 M 1 M 1 × 100
where
  • M1 = Specimen’s dry mass after oven-drying.
  • M2 = Specimen’s saturated mass after immersion in water.
Capillary Water Absorption
At 28 d, mortar cubes oven-dried at 80 °C until a constant mass underwent the CWA test in accordance with ASTM C1585 [25]. A non-absorbent coating was applied to all four sides of the cubes to prevent water evaporation and maintain a constant uniaxial water flow during the test. The four sides of the sample were sealed with both the top and bottom sides left unsealed, and its weight was recorded (A). The specimen was subsequently placed in a container filled with water to a depth of 5 mm from the base of the mortar cube. Water absorption measurements were conducted at intervals of 3, 5, 10, 20, 30, 60, 120, and 240 min, as well as at 1, 2, and 3 d. The CWA was calculated as follows:
C W A = B A S × d
where
  • BA = Cumulative absorbed water.
  • S = Cross-sectional area.
  • d = Water density (g/mm3).

2.2.5. Life Cycle Analysis Methodology

The embodied carbon in mortars was estimated using a simplified cradle-to-gate approach (A1–A3), supplemented by logistical and implementation items included in the ICE Cement, Mortar and Concrete Model spreadsheet (v1.1 beta, 28 November 2019), derived from the ICE—Inventory of Carbon and Energy—database [26,27,28].
This approach aims for a preliminary comparison between formulations (screening) and does not constitute a full LCA as defined by ISO 14040/14044 standards [29,30].
Formulations F0 to F4 correspond to a progressive substitution of cement with natural pozzolan, with constant water and (theoretically) sand content (see formulation). The emission factors (kgCO2e/kg) and additional items used are those implemented in the ICE tool:
  • CEM II/A-LL 52.5R cement: Factor entered based on ICE database (0.87 kgCO2e/kg).
  • Natural pozzolan: 0.00747 kgCO2e/kg, ICE tool assumption based on its production (extraction/crushing) being equivalent to that of aggregates, due to a lack of specific data [26,27].
  • Aggregates/sand: 0.00747 kgCO2e/kg (ICE v3.0) [26,27].
  • Transport of constituents: Generic “30-mile” scenario from the model (internal coefficient of the tool) and articulated road transport factor derived from the UK factors (DEFRA/BEIS) used by the spreadsheet [31,32].
  • Batching plant energy: “Processing” item as proposed by the tool, constructed from sector indicators (Mineral Products Association) integrated into the model [26,33].
  • Mixing losses: 1% flat-rate increase (mixing waste), as implemented in the ICE model [26].
The calculation is performed by adding the mass contributions of each input and the flat-rate items from the ICE model to obtain a result in kgCO2e/m3 of mortar.

2.3. Numerical Analysis Using Mathematical Models

2.3.1. Compressive Strength Modeling

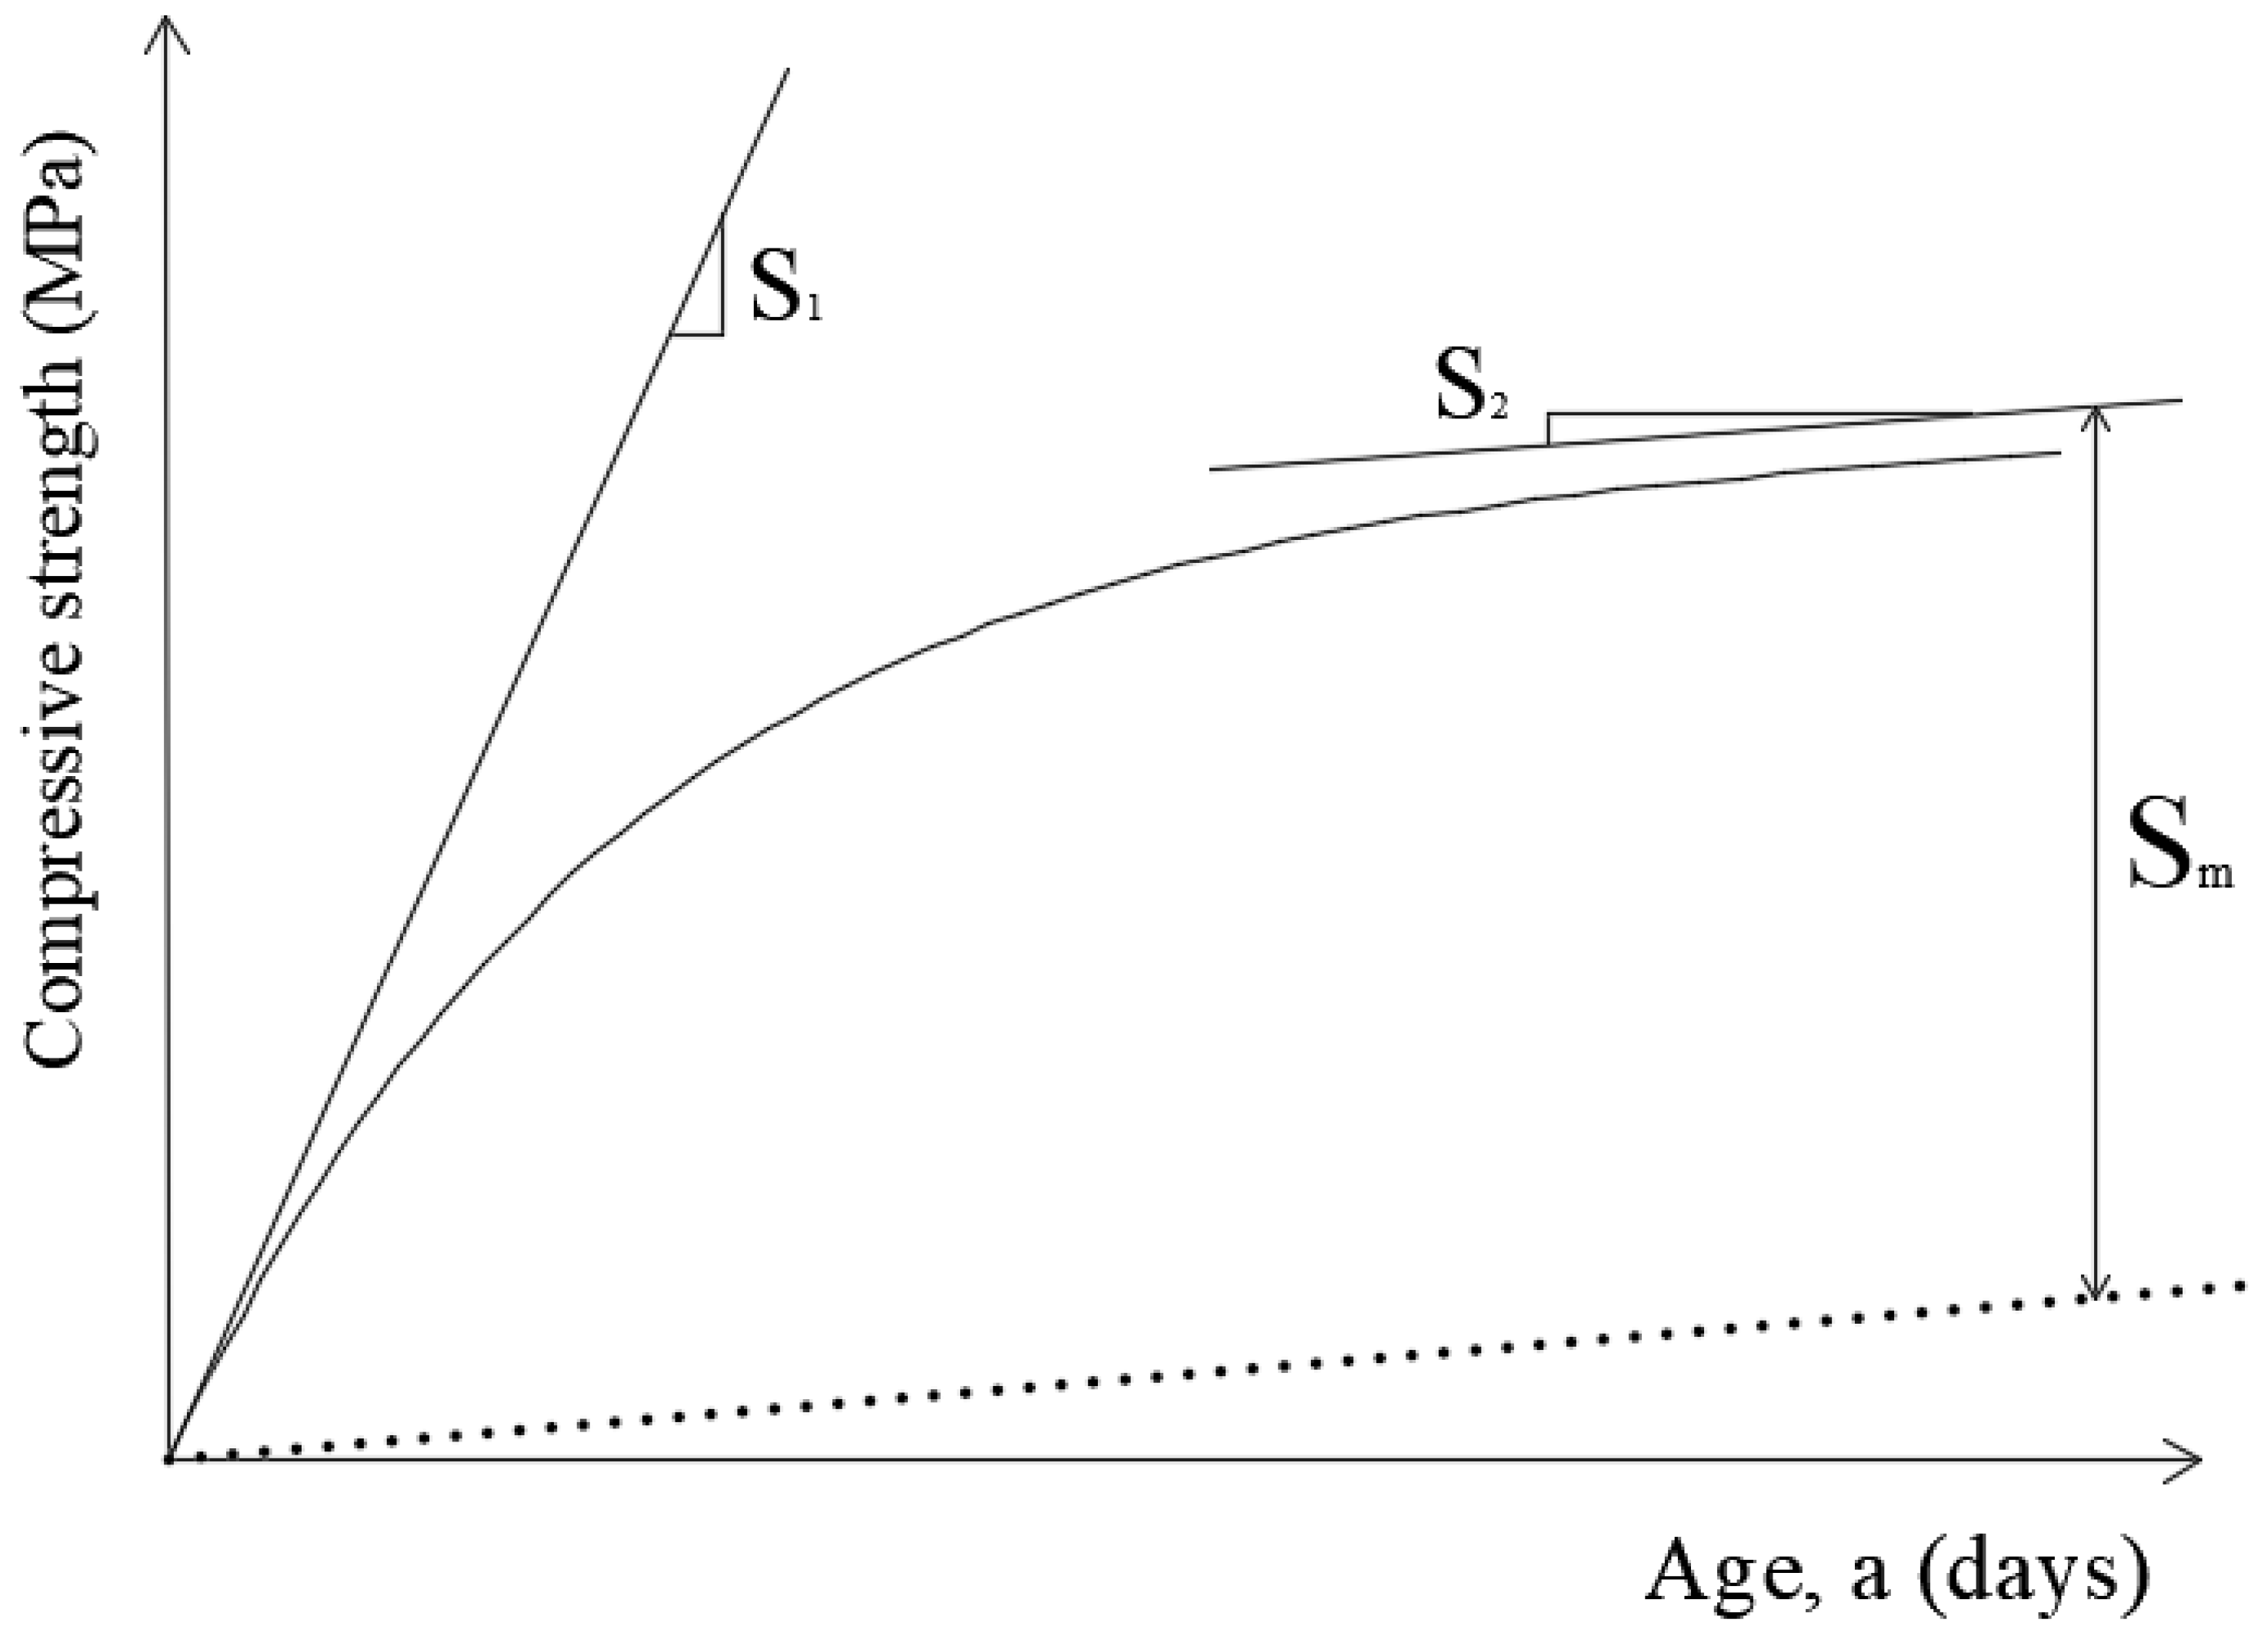
Several models are available in the literature to describe and fit the compressive strength–age response of cementitious materials. Classical hyperbolic strength–age models can represent a fast early-age gain followed by a progressive slowing of the rate reasonably well [34,35]. However, these models typically converge to a horizontal asymptote. For mortar mixtures incorporating natural pozzolan NP as a partial cement replacement, the strength–age response is often governed by two overlapping mechanisms: an early-age stage dominated by Portland cement hydration, and a later-age stage in which the pozzolanic reaction progressively contributes additional hydration products (e.g., secondary C–S–H through consumption of Ca(OH)2). As a result, the experimental strength–age curve for pozzolan-bearing mortars may not become horizontal within the usual testing window. Instead, after the main hydration-driven rise, the curve can continue to increase at a small but nearly constant rate as the pozzolanic reaction proceeds. To capture this behavior, a three-parameter model was formulated by combining two contributions to compressive strength development: a slow, persistent tail component representing sustained late-age gain associated with ongoing pozzolanic activity, and an early-age acceleration component representing the rapid initial development driven primarily by cement hydration. The model presented in Figure 6 is a modified hyperbolic-type formulation, drawing motivation from the classical strength–age models reported in the literature [34,35], and is expressed as follows:
S ( a ) = S 2 ( a ) + ( S 1 S 2 ) a 1 + S 1 S 2 S m
Although the above model is empirical, its parameters have a clear engineering meaning where
  • S1 = The reactivity at early age (cement fineness, curing, accelerators, low w/c).
  • S2 = The residual, long-term gain attributed to slower hydration or pozzolanic reactions.
  • Sm = The finite capacity of the fast mechanism, i.e., how much extra strength mortar can develop beyond what the slow process alone would provide.

2.3.2. Capillary–Diffusive Process Modeling

Two different processes control the penetration of water into the cementitious matrices: The first process, occurring through the material’s extensive macropores, is the capillary-driven phase allowing the transport of water to the near surface. At this stage, the amount of capillary-absorbed water per unit area (M/A) is connected to the sorptivity and is linearly correlated to the square root of the immersion time. The second phase is the diffusive regime, which permits water ingress through smaller pores by slower absorption to the deeper layers; after that, the near absorption saturated the macropores. The absorbed water by diffusion per unit area ratio (M/A) has been demonstrated to decrease exponentially over time [36,37,38,39].
The total amount of absorbed water per unit area by both mechanisms—capillarity and diffusion—depends on many factors: pore structure, curing conditions, and preconditioning temperature. For instance, air curing affects the pore structure and increases the permeability in contrast to water curing. It was also demonstrated that the preconditioning at elevated temperatures raises the amount of water absorbed by sorptivity to the near surface [39,40].
In order to combine the two mechanisms, Cuba offers a cohesive model merging both sorptivity and diffusion parameters, effectively illustrating the shift from rapid to slow water ingress [38,39,40,41].
The cumulative absorbed water from these two transport modes is typically represented using a capillary–diffusive model. The model is based on the assumption of a constant surface water concentration and an impermeable opposite boundary, with a specimen length of 0.1 m. The complete absorption process, considering both early-age capillary suction and long-term diffusive migration, is represented in Equation (8):
M A = C ρ [ 1 exp ( s t C ρ ) ] + C o L [ 1 8 π 2 n = 0 1 ( 2 n + 1 ) 2 exp [ ( 2 n + 1 ) 2 π 2 4 L 2 D t ]
where
  • M/A = Absorbed water mass per unit area of the specimen (kg/m2).
  • C = Constant depending on the distance from the concrete surface where capillary pores regulate the initial sorption.
  • ρ = Water density (kg/m3).
  • S = Sorptivity coefficient (kg/m2.s1/2).
  • T = Time (s).
  • C0 = Constant of water concentration (kg/m2).
  • L = Sample height = 0.1 m.

3. Results and Discussion

3.1. Physical Properties

3.1.1. Water-Accessible Porosity

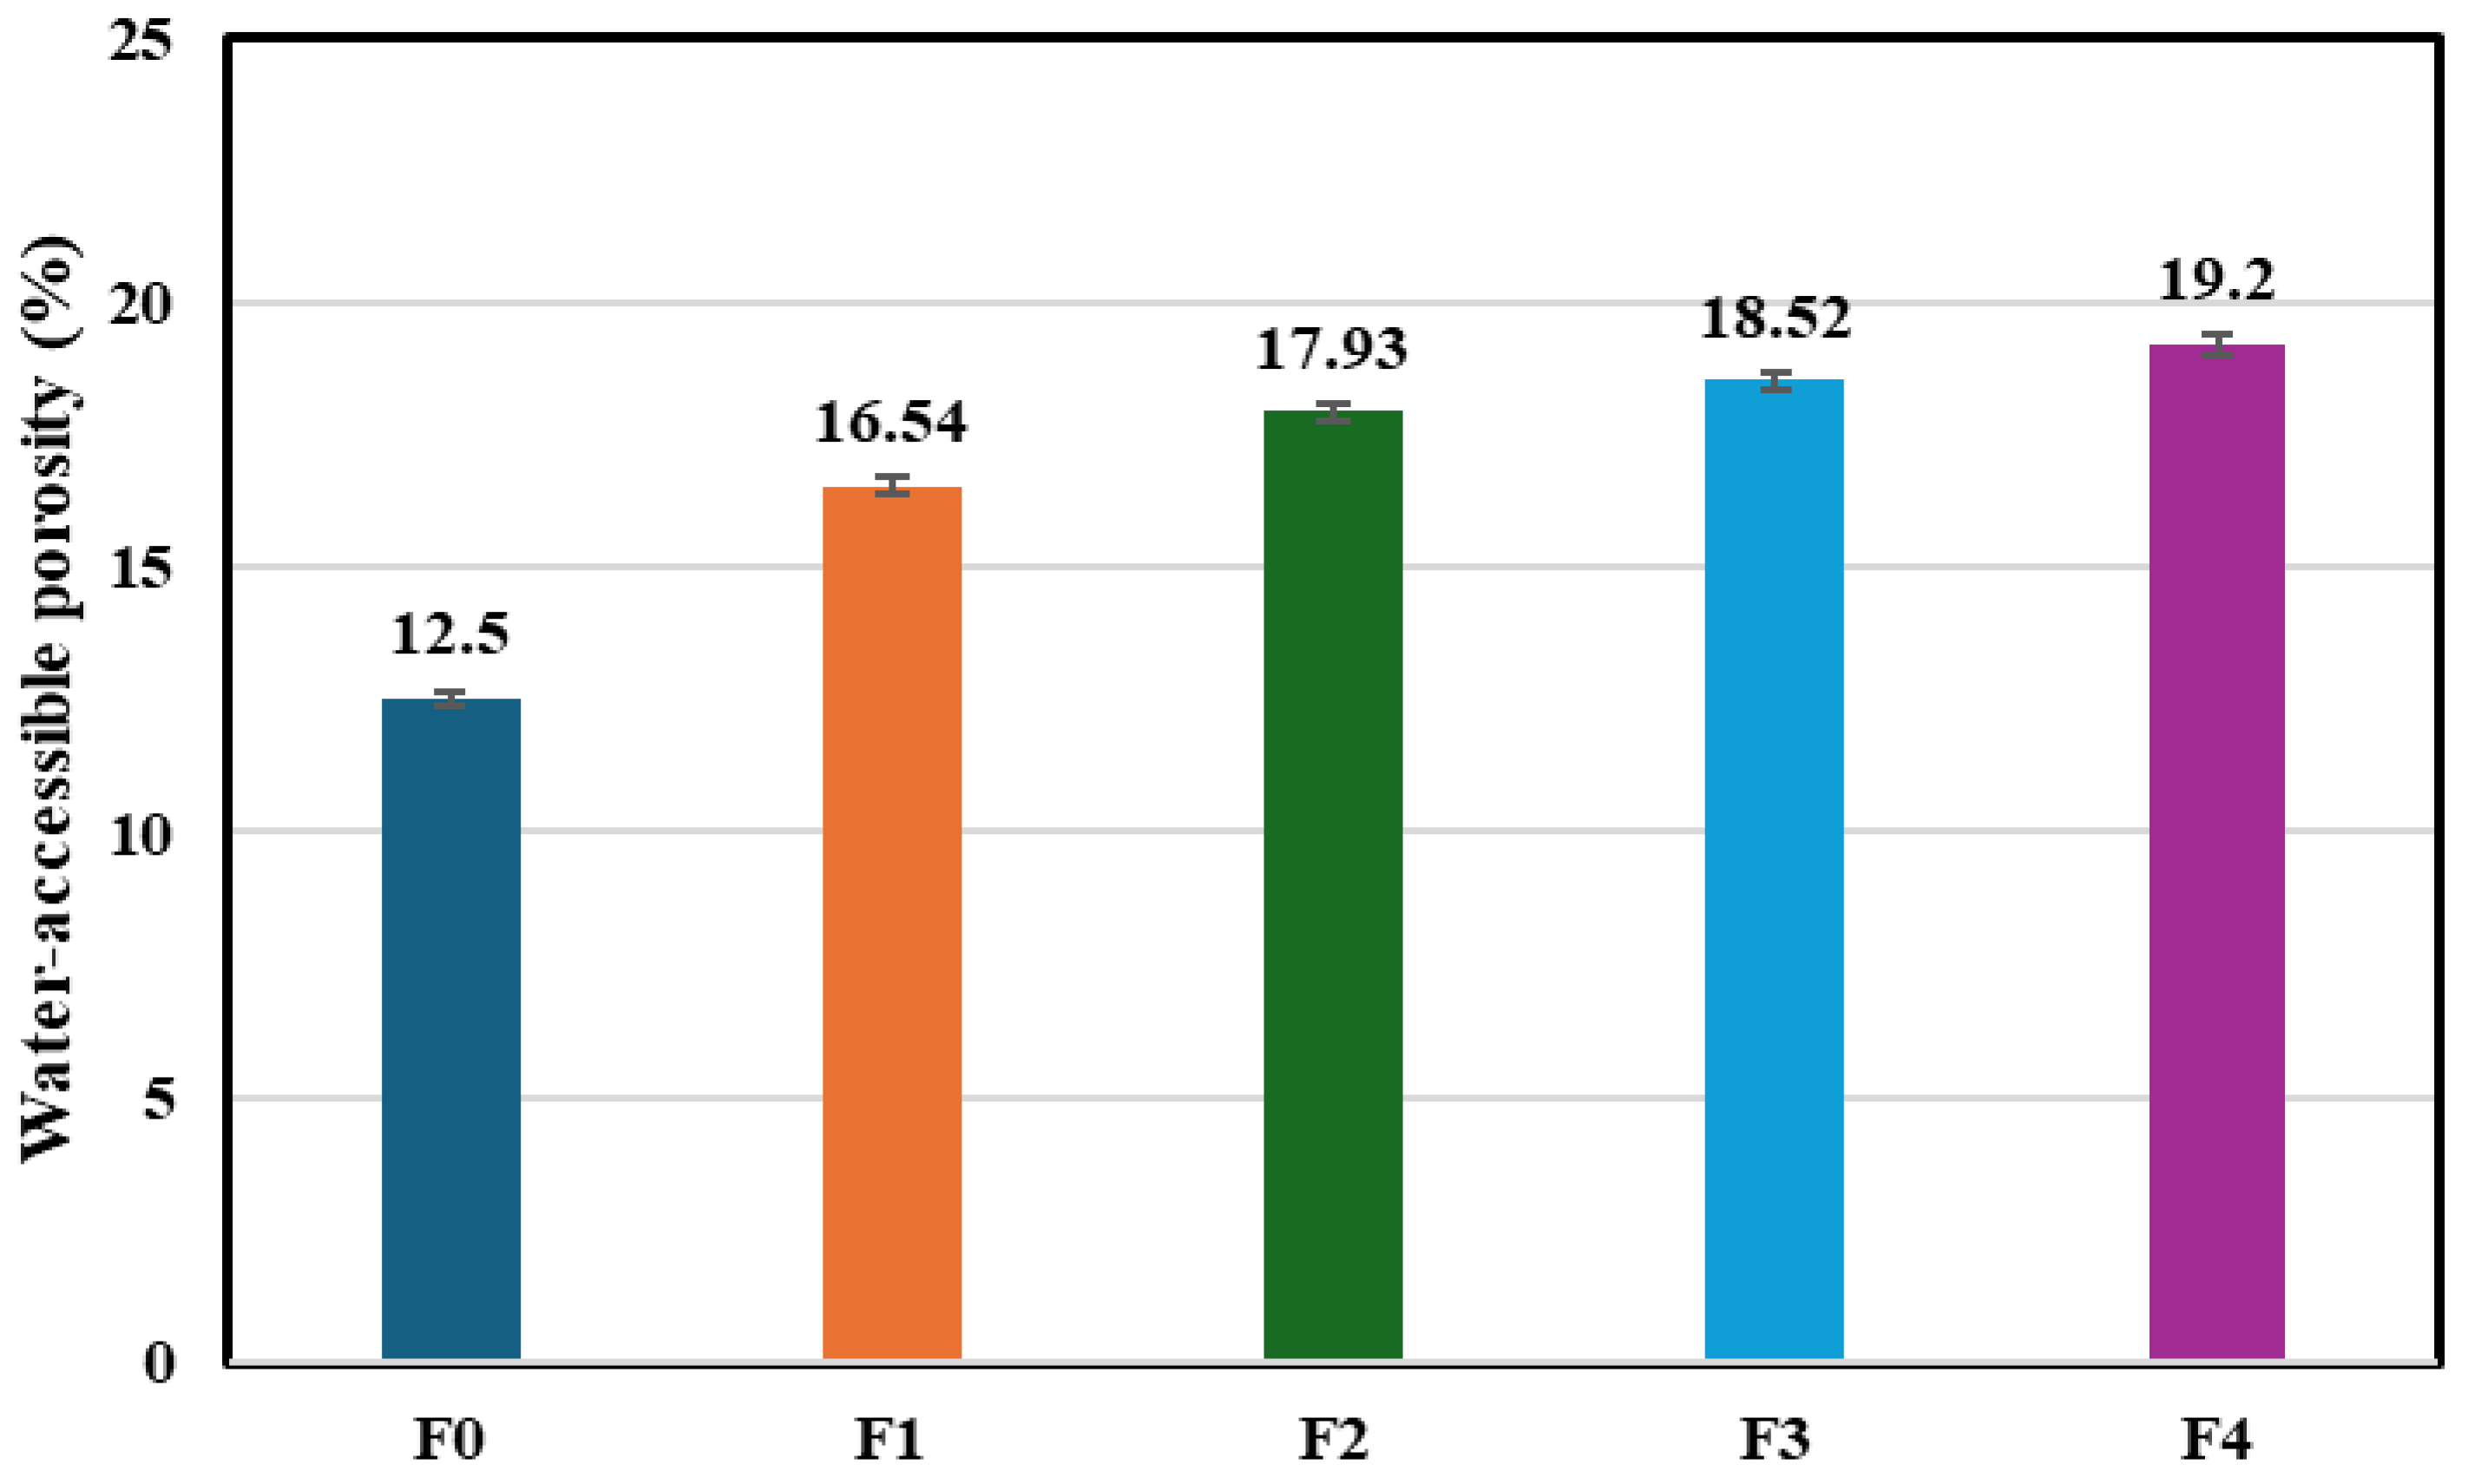
The water-accessible porosity results with increasing pozzolan replacements at 28 d are presented in Figure 7. The porosity increases from 12.50% (F0) to 16.54% (F1), 17.93% (F2), 18.52% (F3) and 19.20% (F4). Compared to the control sample, this corresponds to an increase of 32.32%, 43.44%, 48.16% and 53.6% for F1, F2, F3 and F4 respectively. These results indicate that most of the porosity jump occurs already at the first replacement step (F0 → F1). Because porosity is measured after oven drying and water/vacuum saturation, it represents the connected, water-fillable pore volume. Therefore, the progressive rise from 12.50% to 19.20% indicates that higher pozzolan contents produce a more connected capillary pore network at the tested age (28 d) [42,43]. This trend is consistent with a replacement-controlled “dilution” effect: as the pozzolan content increases, the amount of early clinker hydration products available to fill space decreases [44,45]. Thus, a larger fraction of the mortar volume remains accessible to water, with the maximum connected porosity observed at F4 (19.20%).

3.1.2. Bulk Density

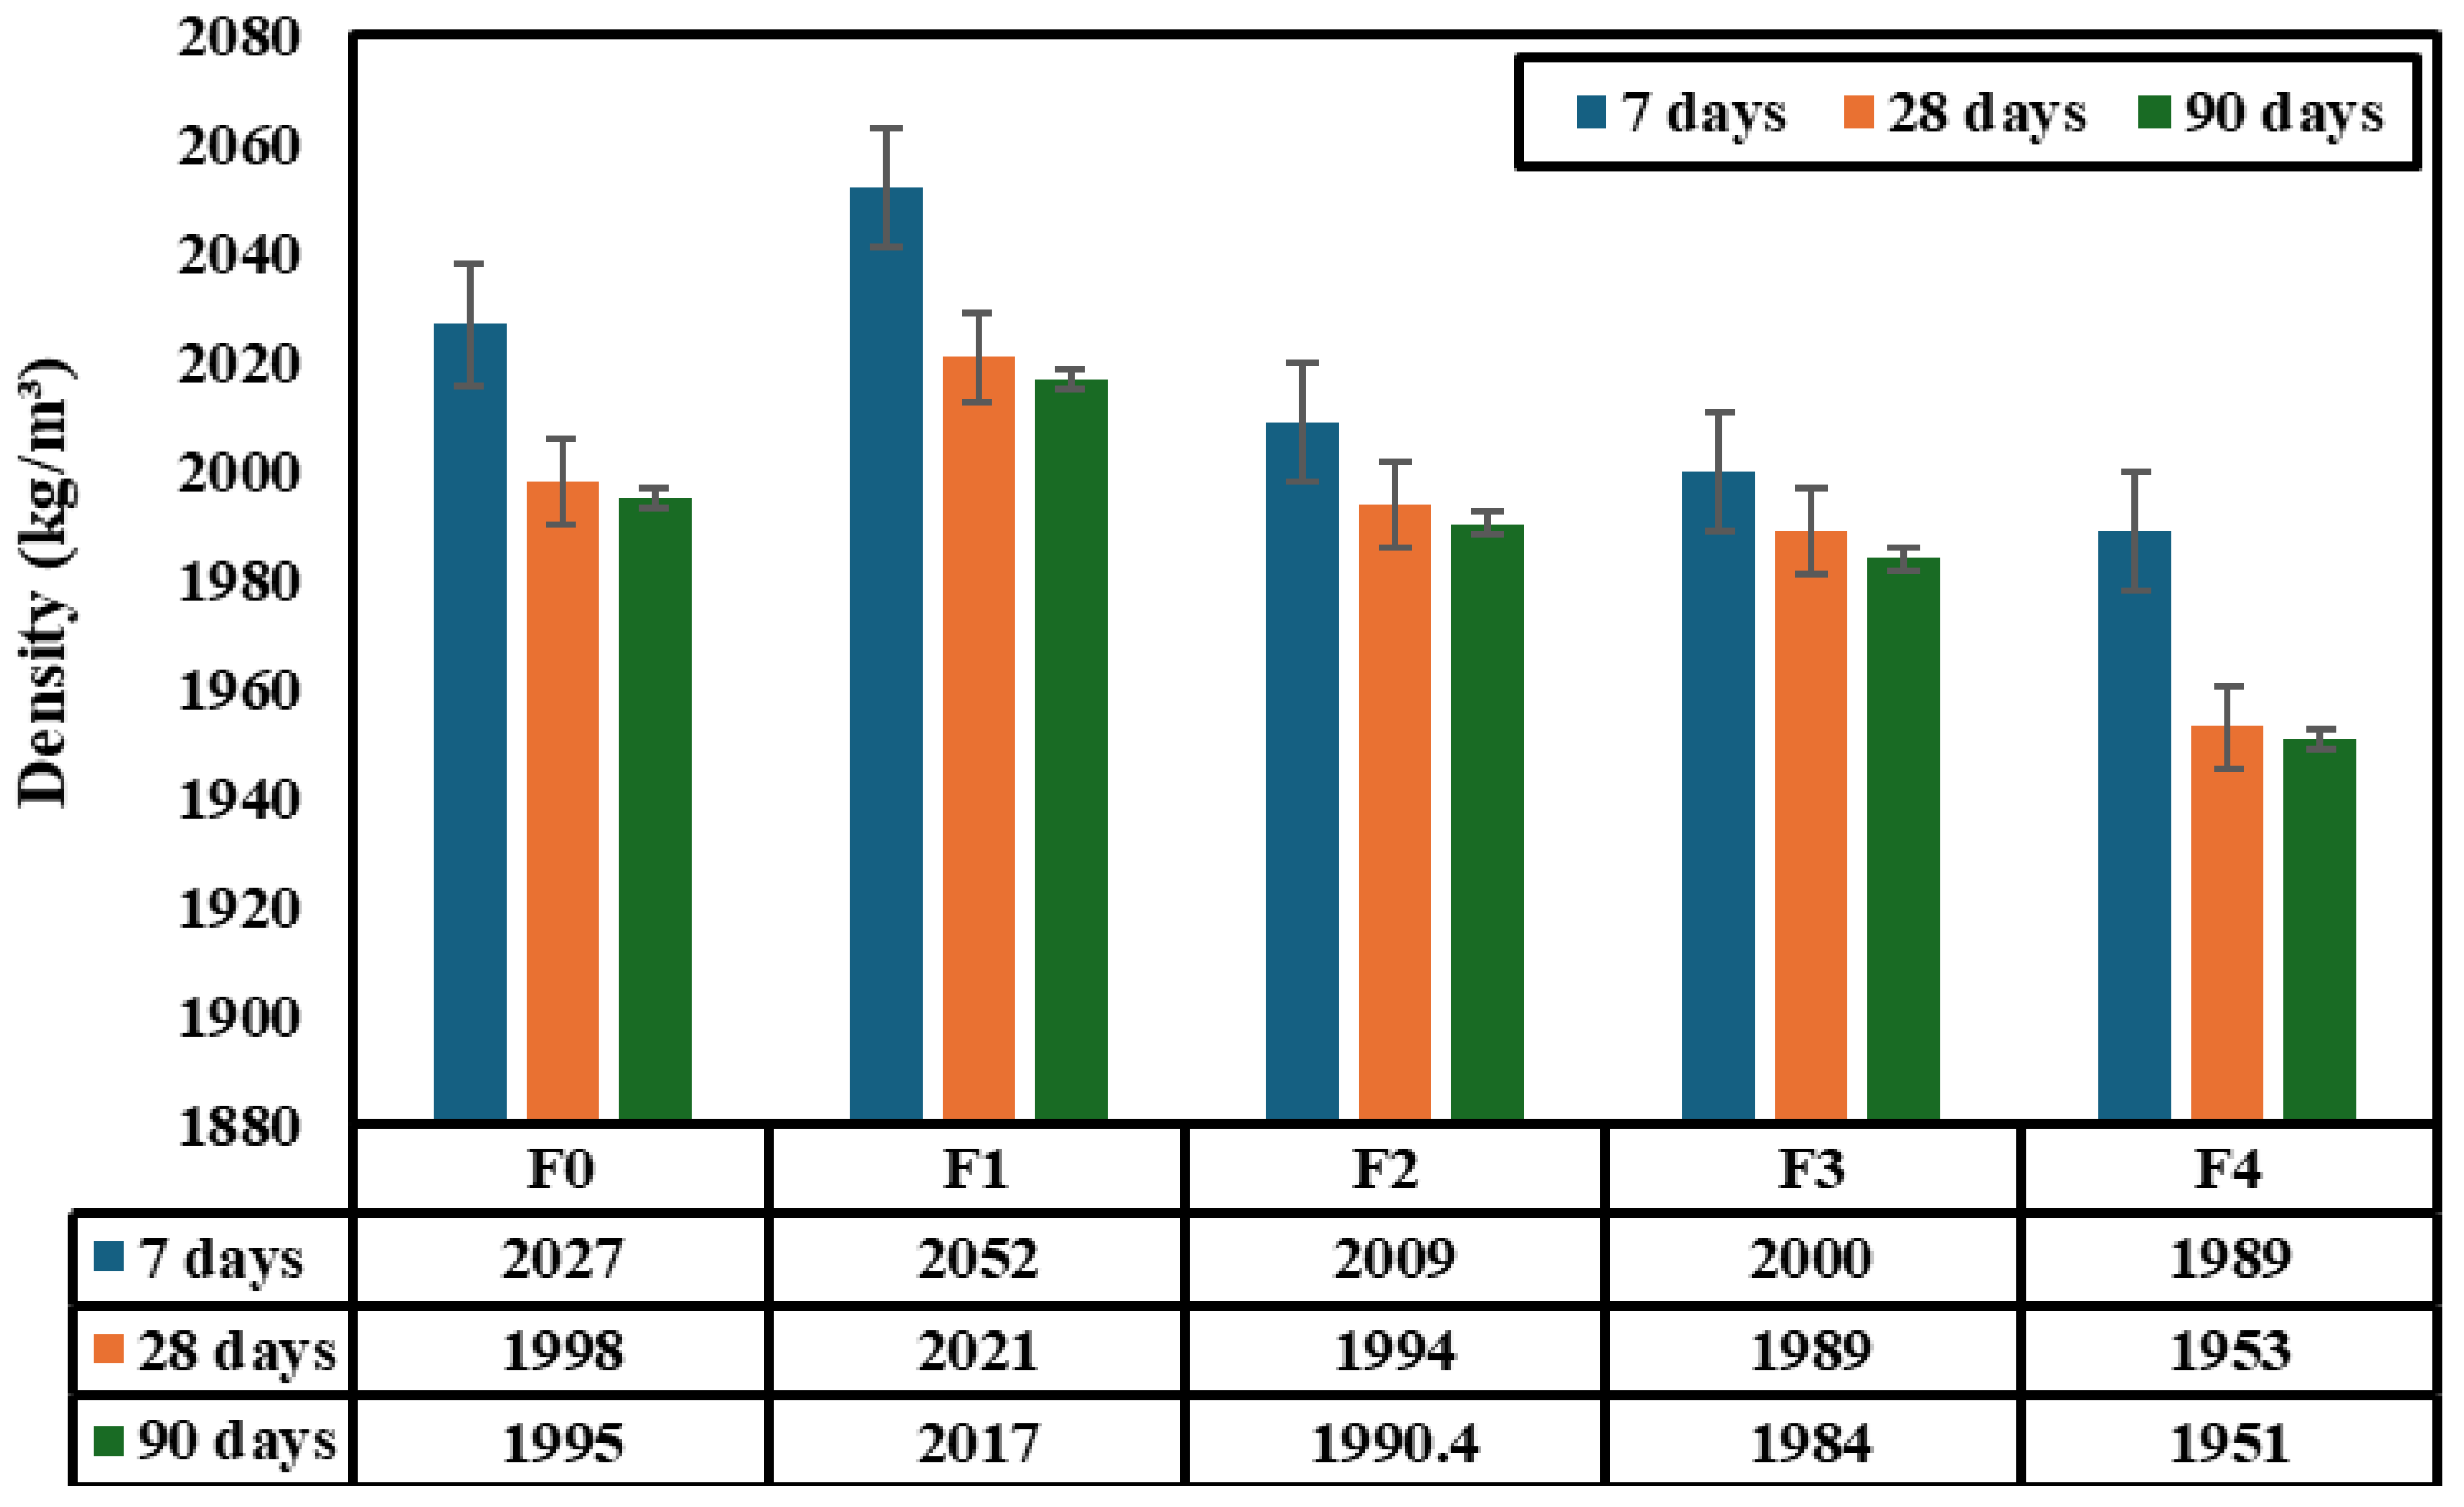
Figure 8 shows that the dry bulk density changes with the pozzolan level and curing age. For example, at 7 d, the density increased from 2027 kg/m3 (F0) to a maximum of 2052 kg/m3 (F1), then decreased with a higher replacement to 2009 kg/m3 (F2), 2000 kg/m3 (F3) and 1989 kg/m3 (F4). Compared to the control, this corresponds to +25 kg/m3 (+1.23%) for F1 and −38 kg/m3 (−1.87%) for F4. This behavior indicates that a low pozzolan level (F1) produces a denser matrix (better packing/void reduction), while a higher replacement progressively increases the “bulk” void fraction and reduces the density [17,46]. At 28 d, the same ranking was maintained (F1 > F0 ≳ F2 > F3 > F4) with densities of 2021 (F1), 1998 (F0), 1994 (F2), 1989 (F3) and 1953 kg/m3 (F4). The same ranking at 28 d confirms that the replacement level governs the stable pore/solid balance: moderate replacement keeps the density near or above the control, whereas high replacement keeps the density lower. At 90 d, the densities were 2017 (F1), 1995 (F0), 1990.4 (F2), 1984 (F3) and 1951 kg/m3 (F4). Relative to F0, this gives +22 kg/m3 (+1.10%) for F1 and −44 kg/m3 (−2.21%) for F4. The continued separation at 90 d indicates that later-age densification is insufficient to fully offset the higher “bulk” porosity associated with high pozzolan replacement.
It can also be noticed that for each mix, the density decreased with age, mainly between 7 and 28 d. For example, the range of decreases for F0, F1, F2, and F4 are 2027 → 1998 (−1.43%), 2052 → 2021 (−1.51%), 2009 → 1994 (−0.75%), 2000 → 1989 (−0.55%), and 1989 → 1953 (−1.81%), respectively. This early-age drop reflects that the measured dry bulk density is sensitive to the evolving internal volume and connected pore structure during early hydration/structure formation, with the largest reduction observed at the highest replacement (F4). On the other side, from 28 to 90 d, changes were small and nearly stabilized: F0: 1998 → 1995 (−0.15%), F1: 2021 → 2017 (−0.20%), F2: 1994 → 1990.4 (−0.18%), F3: 1989 → 1984 (−0.25%), and F4: 1953 → 1951 (−0.10%). The minimal change between 28- and 90-day changes indicates that the bulk density reaches a near-steady state after 28 d for all mixtures, meaning the dominant density differences are primarily controlled by the replacement level rather than continued curing [20,47]. Overall, F1 remains denser than F0 by ~22–25 kg/m3 (≈1.1–1.2%) at all ages, whereas F4 remains lower than F0 by ~38–45 kg/m3 (≈1.9–2.3%), supporting an optimum low replacement (F1) for maximizing the density and a progressive density reduction at high pozzolan contents.

3.2. Mechanical Properties

3.2.1. Compressive Strength

Experimental–Model Comparison of Compressive Strength
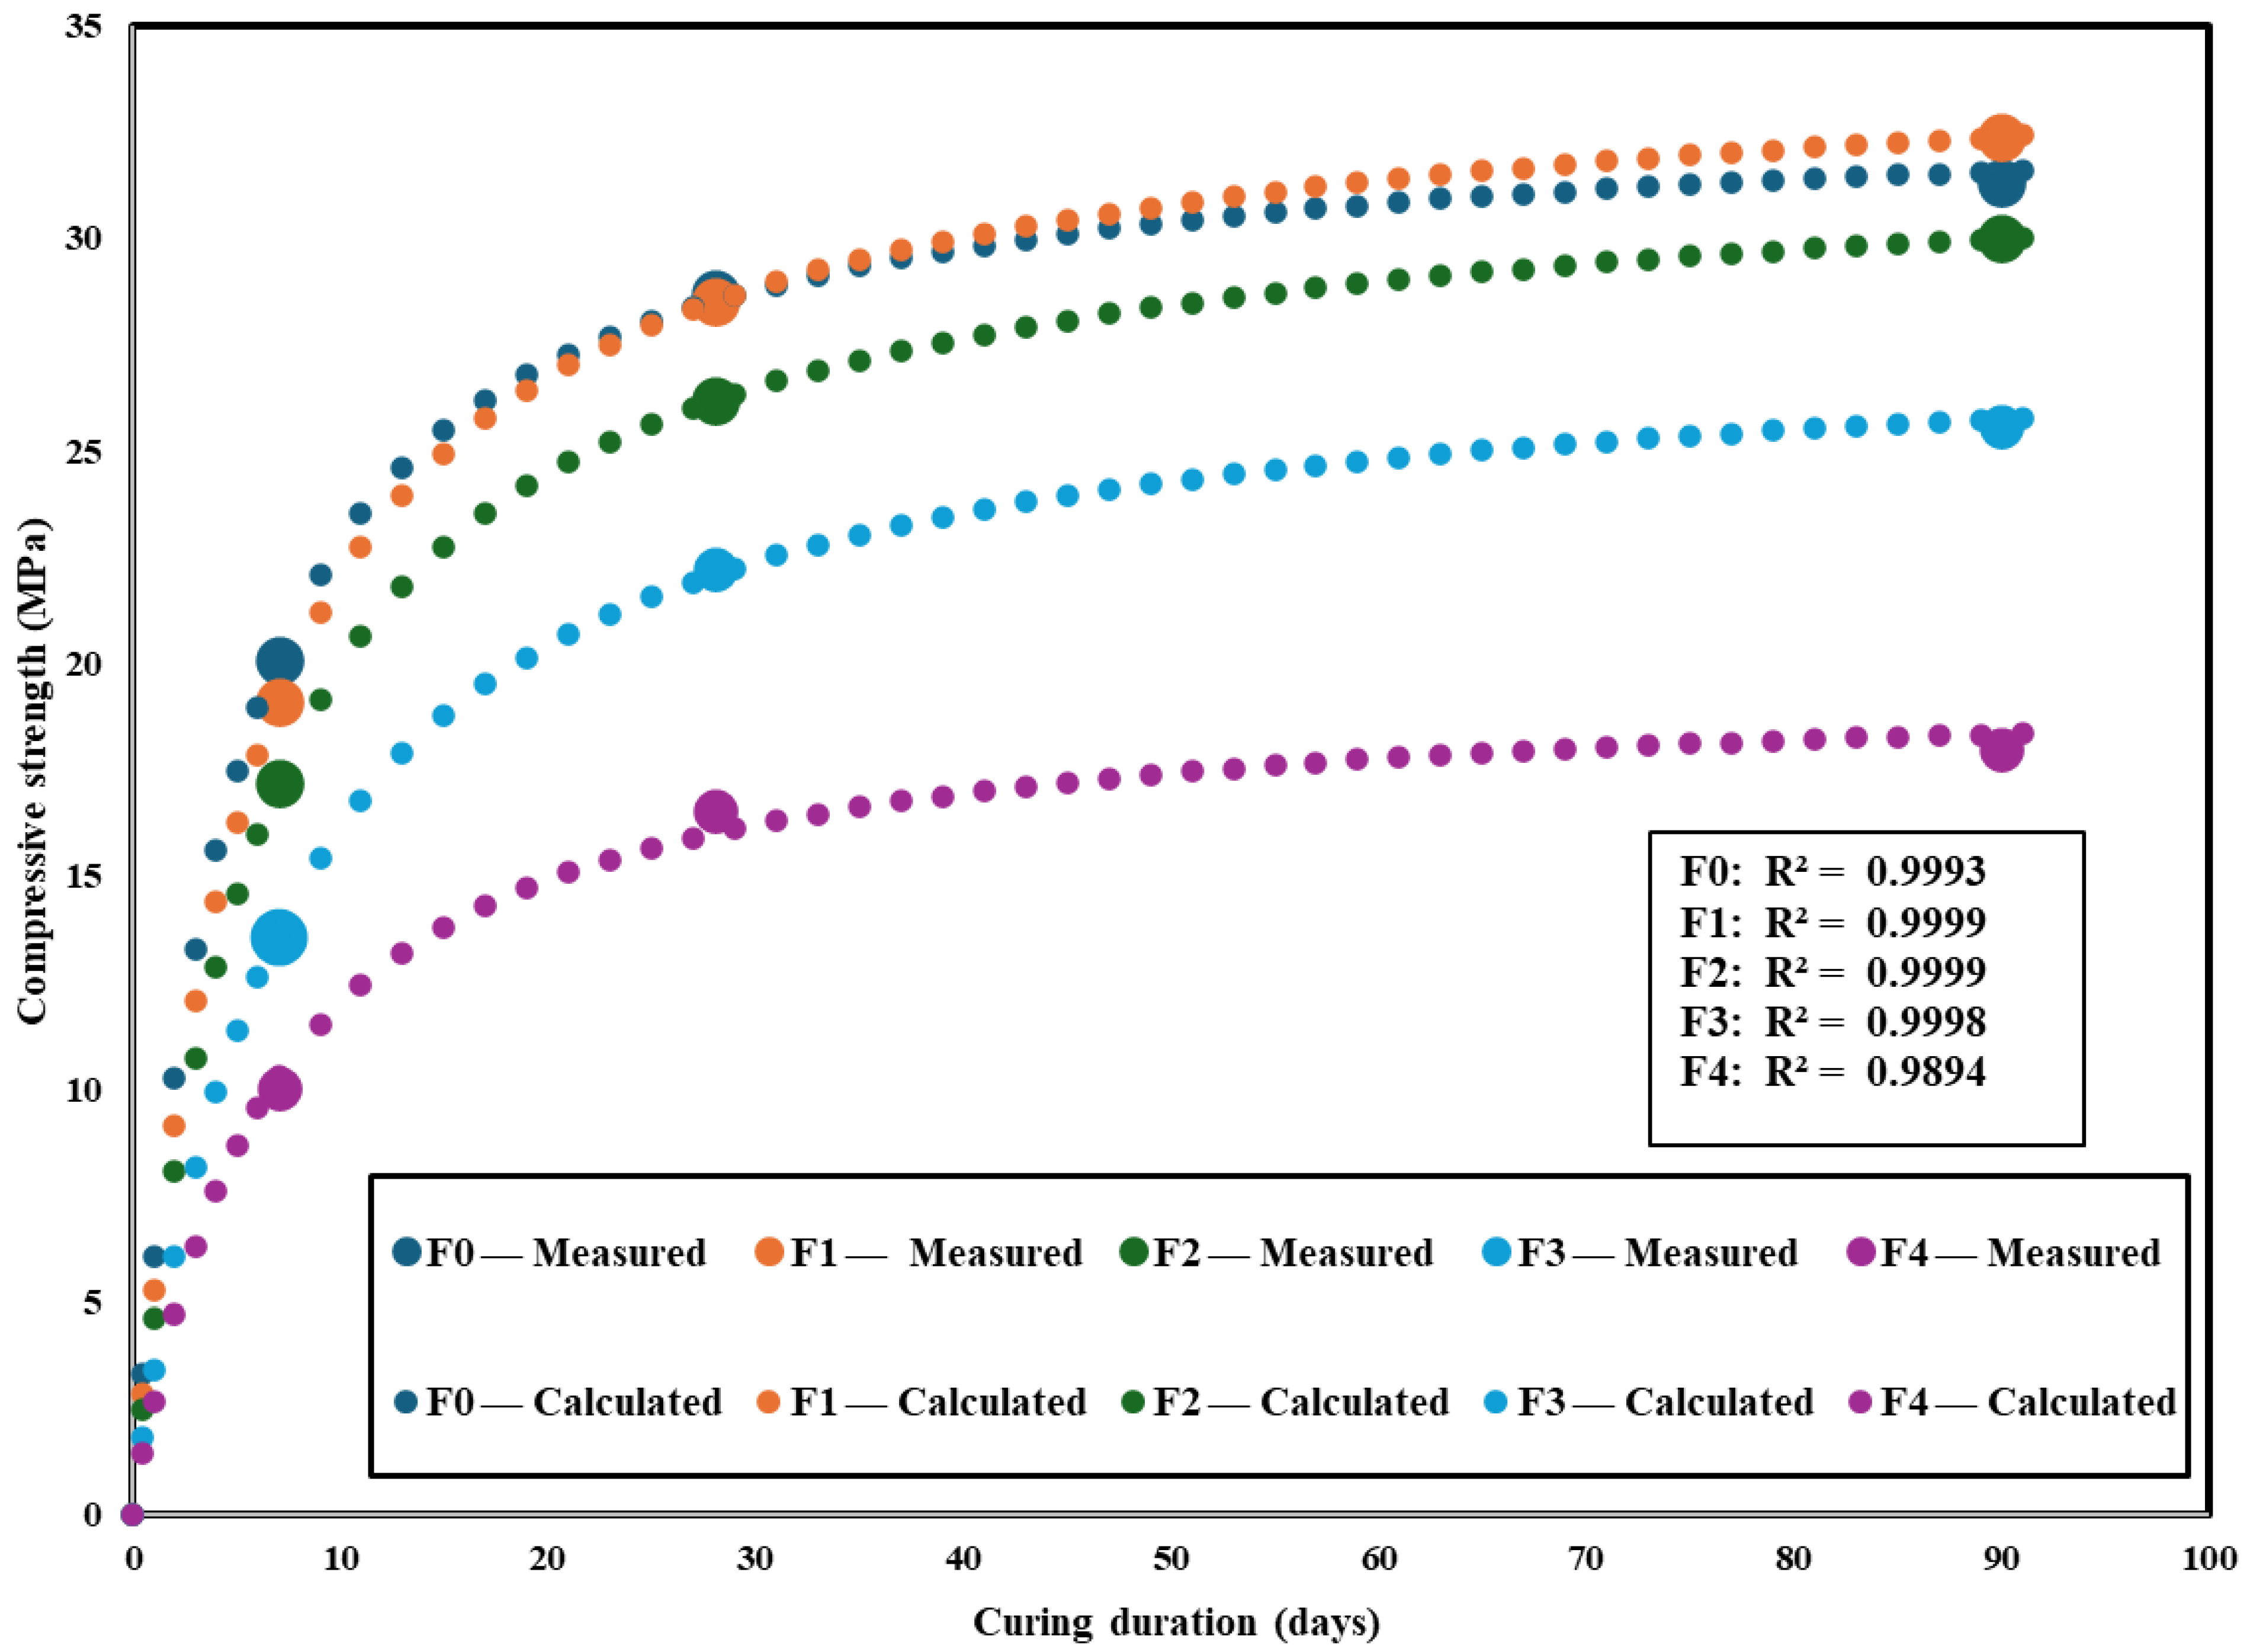
The compressive strength results of mortars containing 0%, 12%, 21%, 36%, and 56% NP (F0–F4) at 7, 28, and 90 d are shown in Figure 9. It can be seen that there is a continuous increase in strength with the curing age for all mixes, although this gain is concentrated before 28 d, then slows markedly. For example, F0 increases from 20.097 → 28.710 → 31.320 MPa (7 → 28 → 90 d), corresponding to an increase of +42.86% from 7 → 28 d and only +9.09% from 28 → 90 d. The same pattern is observed for the pozzolan mixes: F1: 19.120 → 28.500 → 32.380 MPa (+49.06% then +13.61%), F2: 17.210 → 26.170 → 30.000 MPa (+52.06% then +14.64%), F3: 13.605 → 22.240 → 25.580 MPa (+63.47% then +15.02%), and F4: 10.040 → 16.560 → 18.000 MPa (+64.94% then +8.70%). This behavior indicates that early strength is primarily driven by cement hydration, while later-age strength depends increasingly on slower secondary reactions, including the pozzolanic consumption of Ca(OH)2 and formation of additional binding phases [20,48,49,50].
The effect of the pozzolan content is evident at all ages and preserves the consistent ranking F0 ≈ F1 > F2 > F3 > F4. At 7 d, the control mixture F0 reaches 20.097 MPa, while moderate replacement levels show limited early-age penalty, F1: 19.120 MPa; −4.86%, F2: 17.210 MPa; −14.37%), whereas higher replacements lead to a pronounced reduction (F3: 13.605 MPa; −32.30%, F4: 10.040 MPa; −50.04%), consistent with the dilution of clinker and reduced early availability of hydration products. At 28 d, F1 remains essentially equivalent to the control (28.500 vs. 28.710 MPa; −0.73%), and F2 stays relatively close (26.170 MPa; −8.85%), whereas F3 and F4 show substantial losses (22.240 MPa; −22.54% and 16.560 MPa; −42.32%, respectively), confirming that high replacement levels (≥36%) cannot maintain the reference strength at standard curing ages. At 90 d, F1 becomes the best-performing mixture (32.380 MPa), exceeding F0 (31.320 MPa) by +3.38%. This advantage is supported by the larger late-age gain of F1 (+3.880 MPa from 28 → 90 d) compared with F0 (+2.610 MPa), which is consistent with a stronger contribution of the pozzolanic reaction and secondary C–S–H formation at later ages [46,48]. F2 shows near recovery (30.000 MPa; −4.21% vs. F0), while F3 and F4 remain the weakest mixes even at 90 d (25.580 MPa; −18.33% and 18.000 MPa; −42.53% vs. F0), indicating limited capacity for strength recovery at a very high replacement. Overall, the combined early-age performance and later-age development indicate that 12–21% replacement provides the best balance: at 28 d, it retains 99.27% (F1) and 91.15% (F2) of the control strength, and by 90 d, F1 surpasses the control (103.38% of F0), whereas replacements ≥36% produce persistent strength deficits despite extended curing.
Model Parameter Analysis (S1, S2, and Sm)
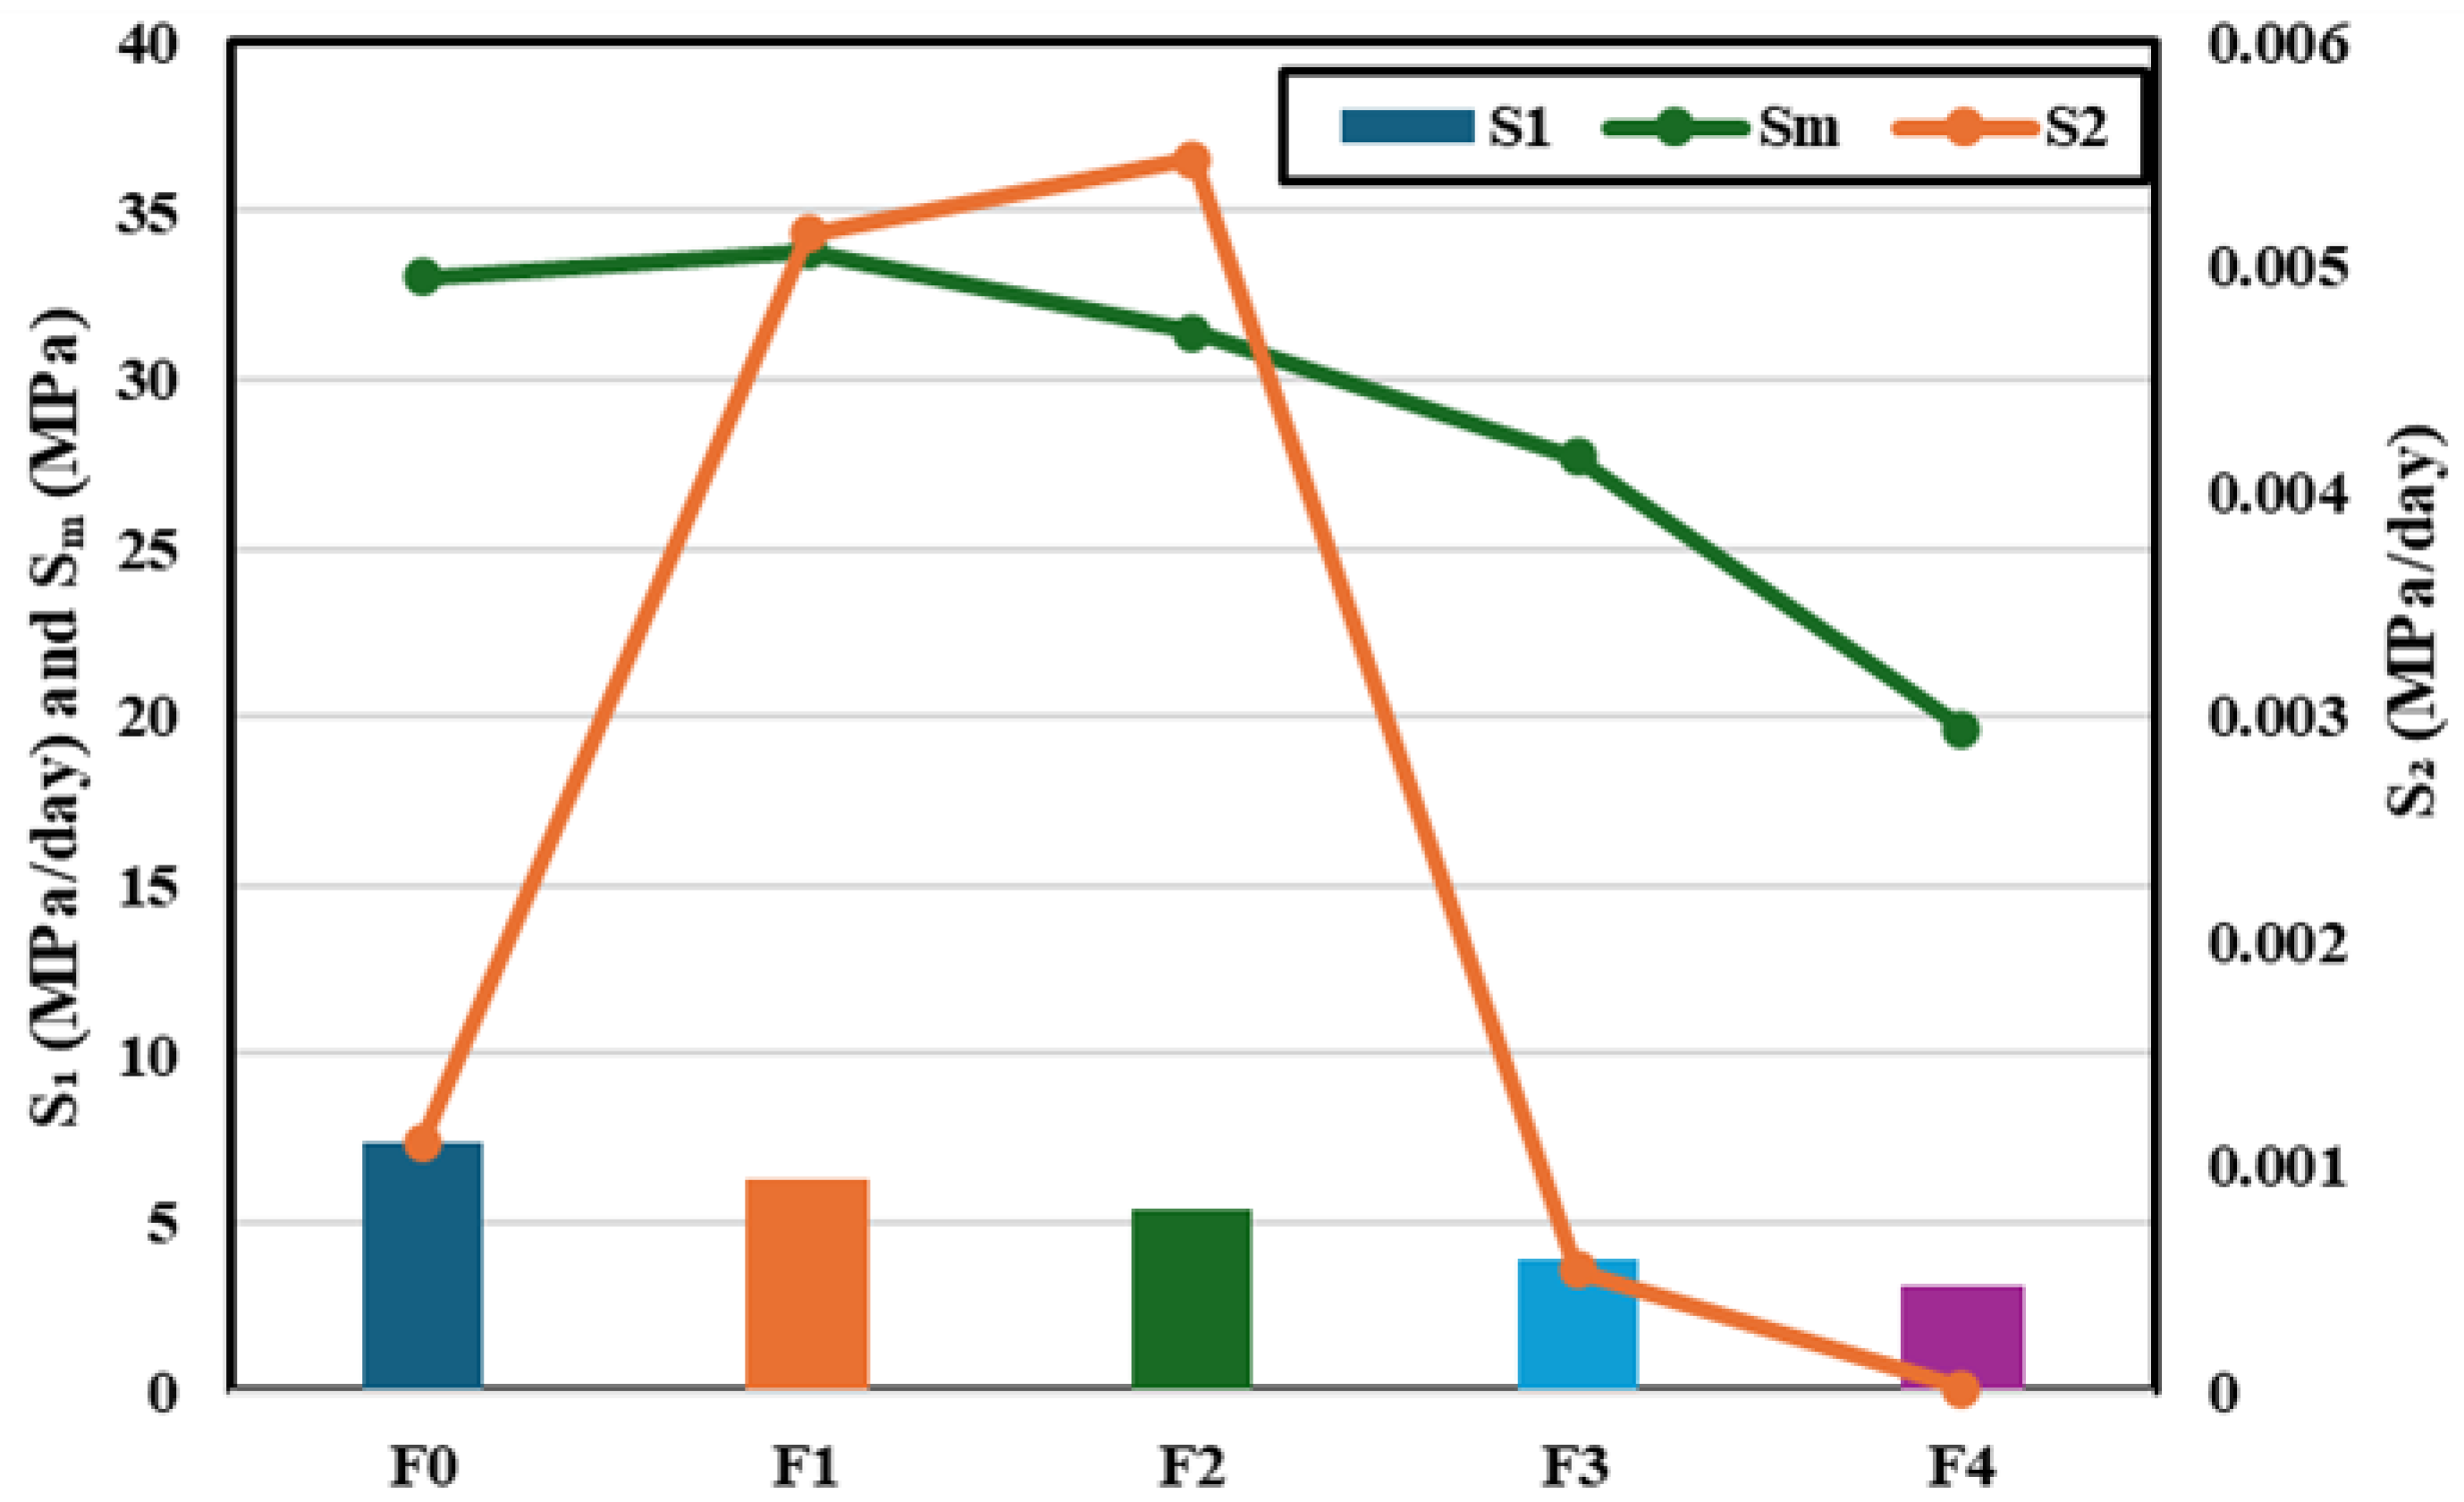
The values of S1, S2 and Sm for all mortar mixes are displayed in Figure 10. As mentioned previously, S1 (MPa) represents the early-age strength gain parameter that controls the initial pace of compressive strength development, where higher S1 indicates faster early strength evolution. As shown, the S1 value decreases from 7.41 MPa (F0) to 6.26 MPa (F1), 5.42 MPa (F2), 3.86 MPa (F3) and 3.09 MPa (F4). Compared to the control mix (F0), this corresponds to a decrease of 15.55%, 26.91%, 47.90% and 58.33% for F1, F2, F3 and F4, respectively. This progressive reduction indicates the dilution of clinker content and a corresponding decrease in early hydration kinetics at higher replacement levels. The trend is consistent with the 7-day compressive strength results, which decrease from 20.10 MPa (F0) to 19.12 MPa (F1), 17.21 MPa (F2), 13.61 MPa (F3), and 10.04 MPa (F4), confirming the ranking S1(F0) > S1(F1) > S1(F2) > S1(F3) > S1(F4). At 28 d, the near-equivalence between F0 (28.71 MPa) and F1 (28.50 MPa), together with the relatively close performance of F2 (26.17 MPa), supports that moderate replacement preserves early-to-mid-age strength, while high replacement remains limited by insufficient clinker availability [20,48]. From an engineering standpoint, the combined S1 and compressive strength data indicate that replacement up to ≈12% causes only a small early-age reduction, whereas replacement beyond 21% leads to progressively larger reductions in early- and mid-age performance.
The S2 parameter (MPa/day) represents the later-age strength gain rate, i.e., the slope of the compressive strength curve during prolonged curing. The S2 value changes from 0.001100 MPa/day (F0) to 0.005149 MPa/day (F1), 0.005484 MPa/day (F2), 0.000540 MPa/day (F3) and 0.000011 MPa/day (F4). Compared to the control mix (F0), this corresponds to an increase of 368.09% and 398.55% for F1 and F2, and a decrease of 50.91% and 99.00% for F3 and F4, respectively. Thus, only the moderate replacements of cement (12 and 21%) show clearly positive values near 0.005 MPa/day (F1–F2), indicating sustained later-age strength development, which is consistent with ongoing pozzolanic reactions. On the other side, F3 (0.000540 MPa/day) and especially F4 (0.000011 MPa/day) approach zero, indicating negligible additional strength gain at later ages due to clinker dilution and/or limited reactivity, and therefore limited potential for further mechanical enhancement beyond the early- and mid-age stages [50,51].
The Sm parameter (MPa) represents the long-age strength capacity of the fitted model, i.e., the asymptotic strength level as the curing time becomes very large. The Sm value changes from 33.02 MPa (F0) to 33.84 MPa (F1), 31.41 MPa (F2), 27.73 MPa (F3) and 19.64 MPa (F4). Compared to the control mix (F0), this corresponds to an increase of 2.46% for F1, and a decrease of 4.89%, 16.02% and 40.52% for F2, F3 and F4, respectively. Thus, the ultimate capacity is essentially maintained and slightly improved at 12% replacement, while it declines progressively beyond 21%. This is consistent with the measured 90-day strengths, where F1 = 32.38 MPa exceeds F0 = 31.32 MPa by +3.38%, confirming a beneficial late-age pozzolanic contribution at moderate replacement. In contrast, the much lower Sm for F3 (27.73 MPa) and especially F4 (19.64 MPa) indicates a clinker-limited system at high replacement, with a markedly reduced long-term strength capacity despite extended curing [50,51].
Strength Activity Index (SAI)
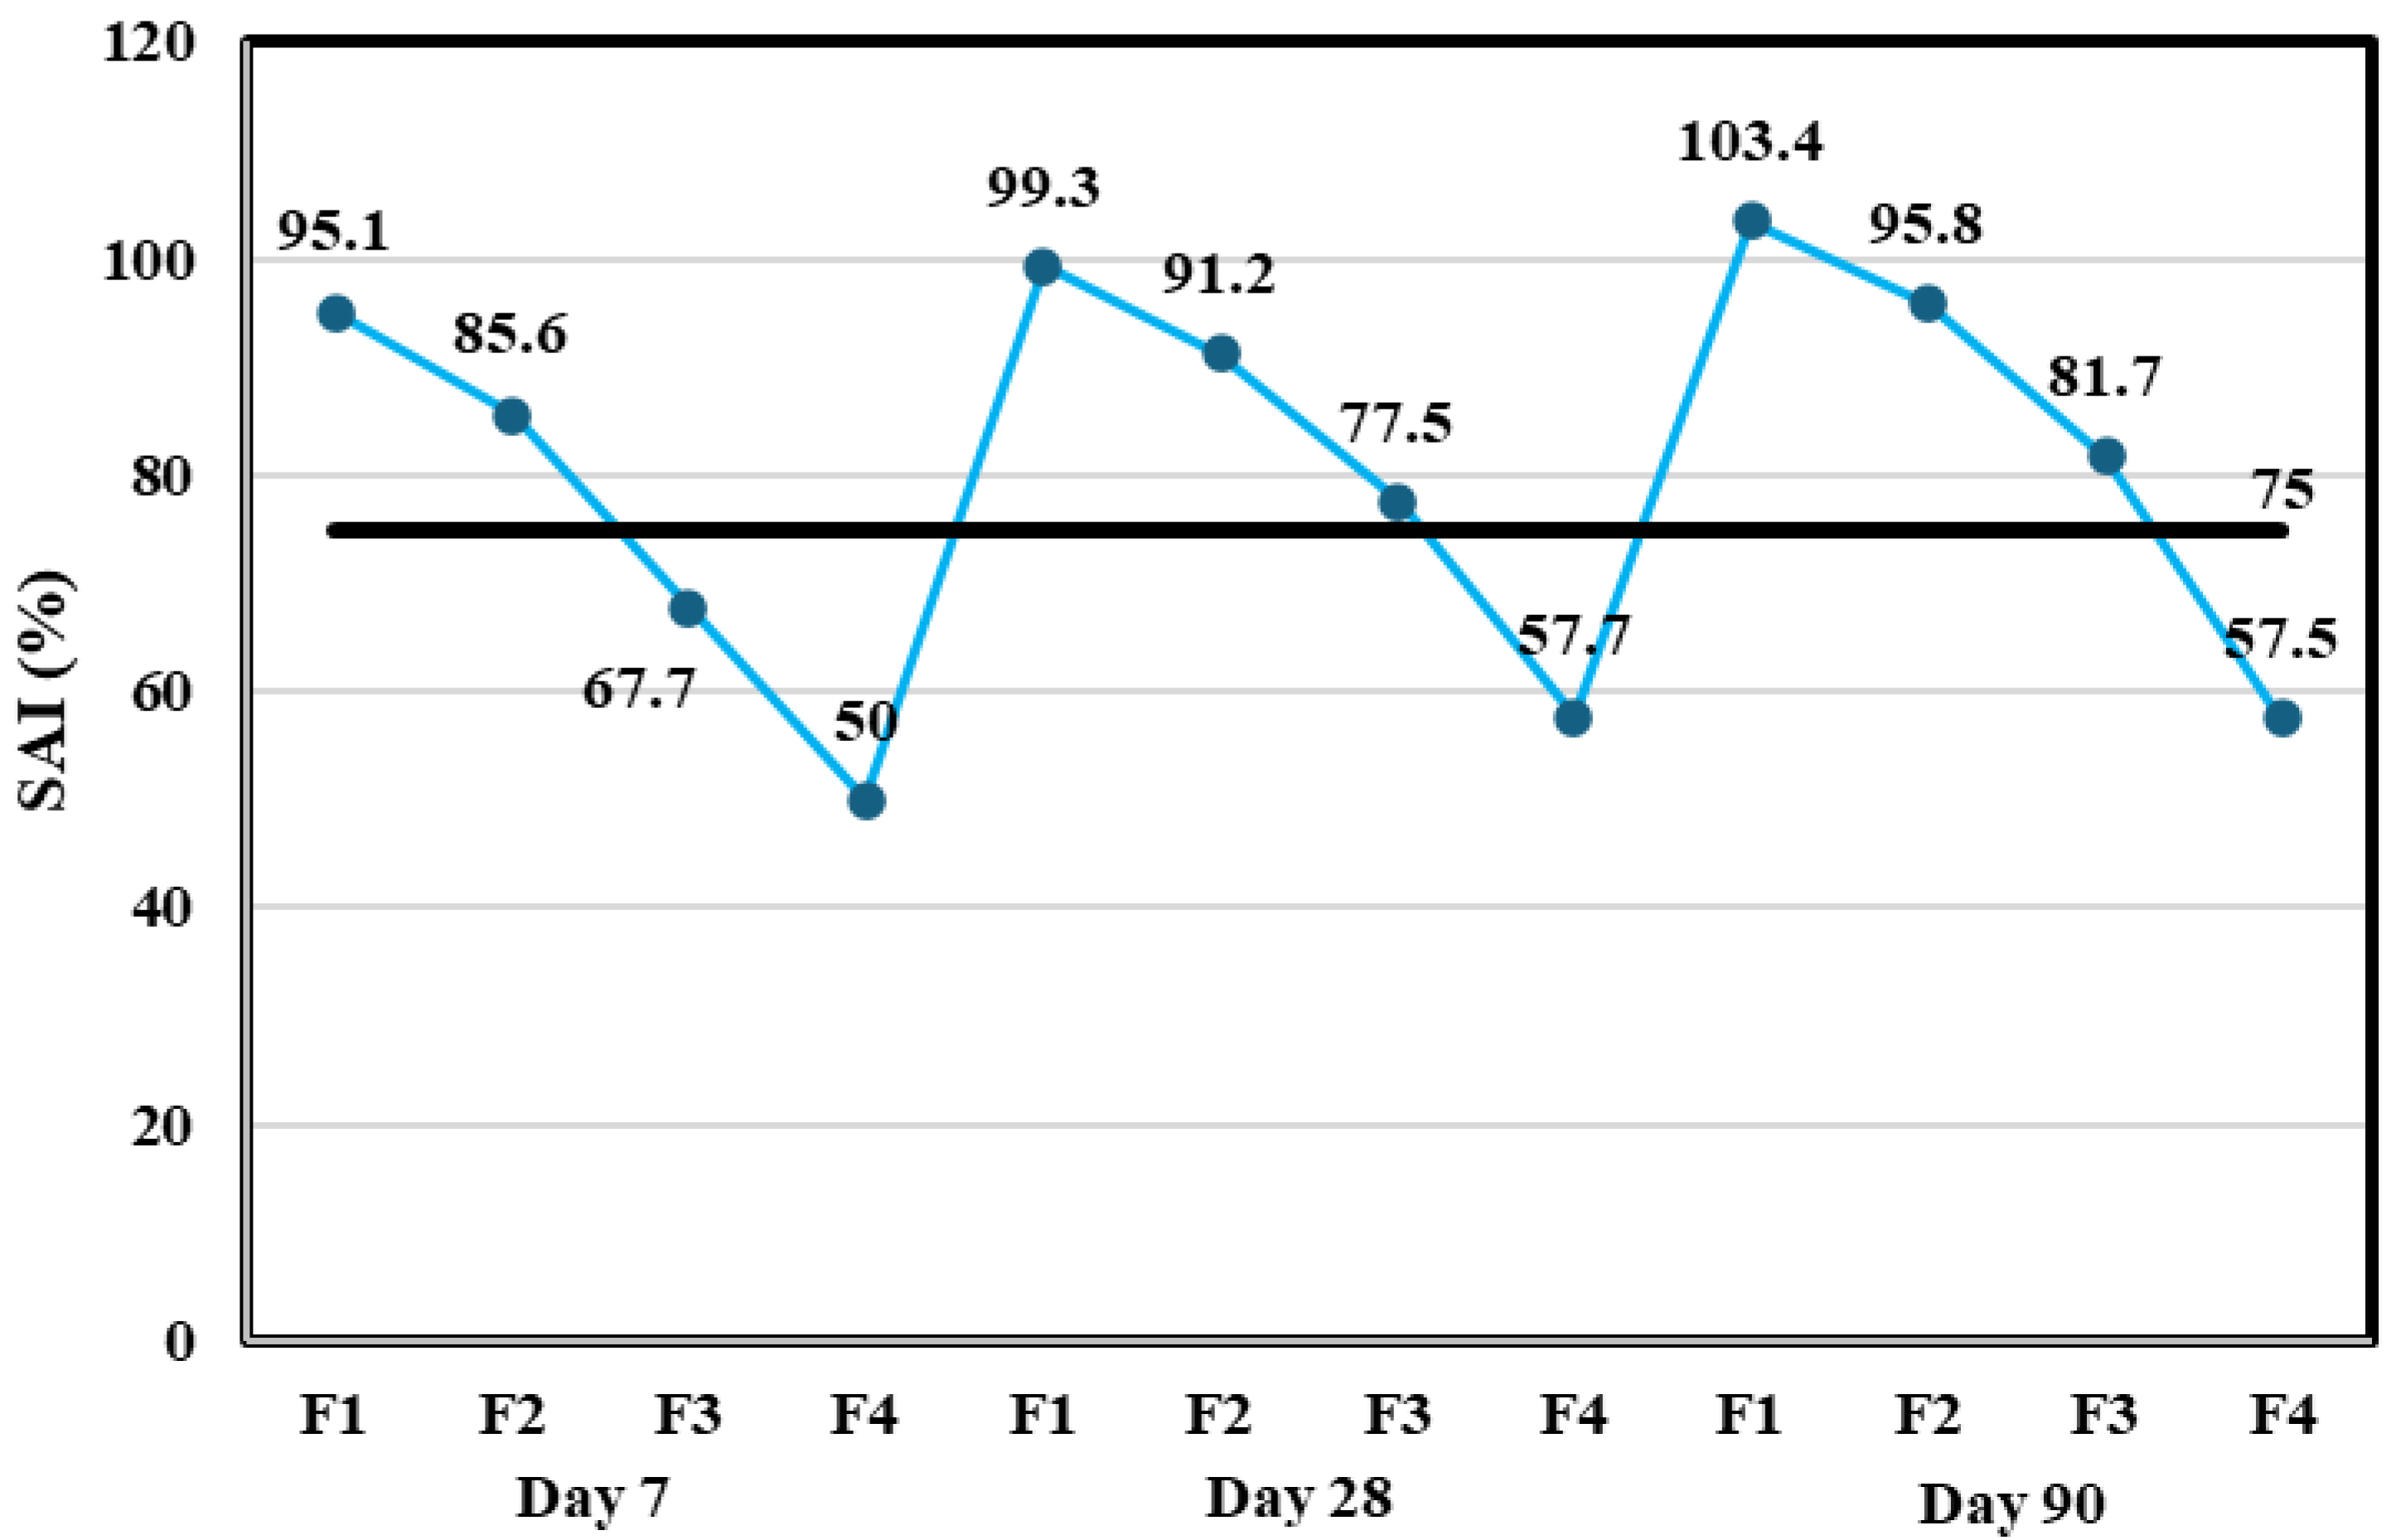
To assess the role of the NP in strength development and to distinguish pozzolanic reactivity from cement dilution, the strength activity index (SAI) was evaluated. The SAI was calculated from the compressive strength results as the ratio of the strength of the pozzolan-blended mortar to that of the control mortar at the same curing age. According to ASTM C311 [52] and ASTM C618 [53], mixtures with SAI ≥ 75% at 28 d are considered to exhibit positive pozzolanic activity. Figure 11 presents the SAI values at 7, 28, and 90 d. At 7 d, the SAI decreases with the replacement level with values of 95.1% (F1), 85.6% (F2), 67.7% (F3), and 50.0% (F4), confirming that early-age strength is mainly controlled by clinker hydration and that dilution becomes more pronounced as replacement increases [49,50]. At 28 d, low to moderate replacement shows clear improvement, as F1 reaches 99.3% and F2 reaches 91.2%, while higher replacements remain lower (77.5% for F3 and 57.7% for F4), indicating that the pozzolanic contribution at this age is sufficient to compensate dilution at 12–21%, but not at very high replacement. After 90 d, the strength activity results show a clearer pozzolanic contribution. Mix F1 reaches 103.4%, which matches the measured strengths of 32.38 MPa (F1) versus 31.32 MPa (F0). This indicates that the NP in F1 contributes effectively at later ages. This is probably due to the formation of additional hydration products forming over time (secondary C–S–H) and a denser matrix [20,50]. Over the same period, F2 rises to 95.8%, which is close to the control. F3 reaches 81.7%, while F4 remains low at 57.5%. Thus, it can be deduced that high replacement levels are still limited by reduced clinker content and slower later-age development. Based on the above results, from an ASTM acceptance point of view, mixes F1 and F2 (12% and 21% cement replacement) meet the criterion comfortably at 28 d. Mix F3 (36%) meets it only marginally at 28 d and improves further at 90 d. Mix F4 (56%) stays below the threshold and is therefore not acceptable under the ASTM criterion. Overall, the results support using the NP at 12–21% when maintaining mechanical performance is a priority, while higher replacement requires longer curing and still carries a clear strength penalty.

3.2.2. Flexural Strength

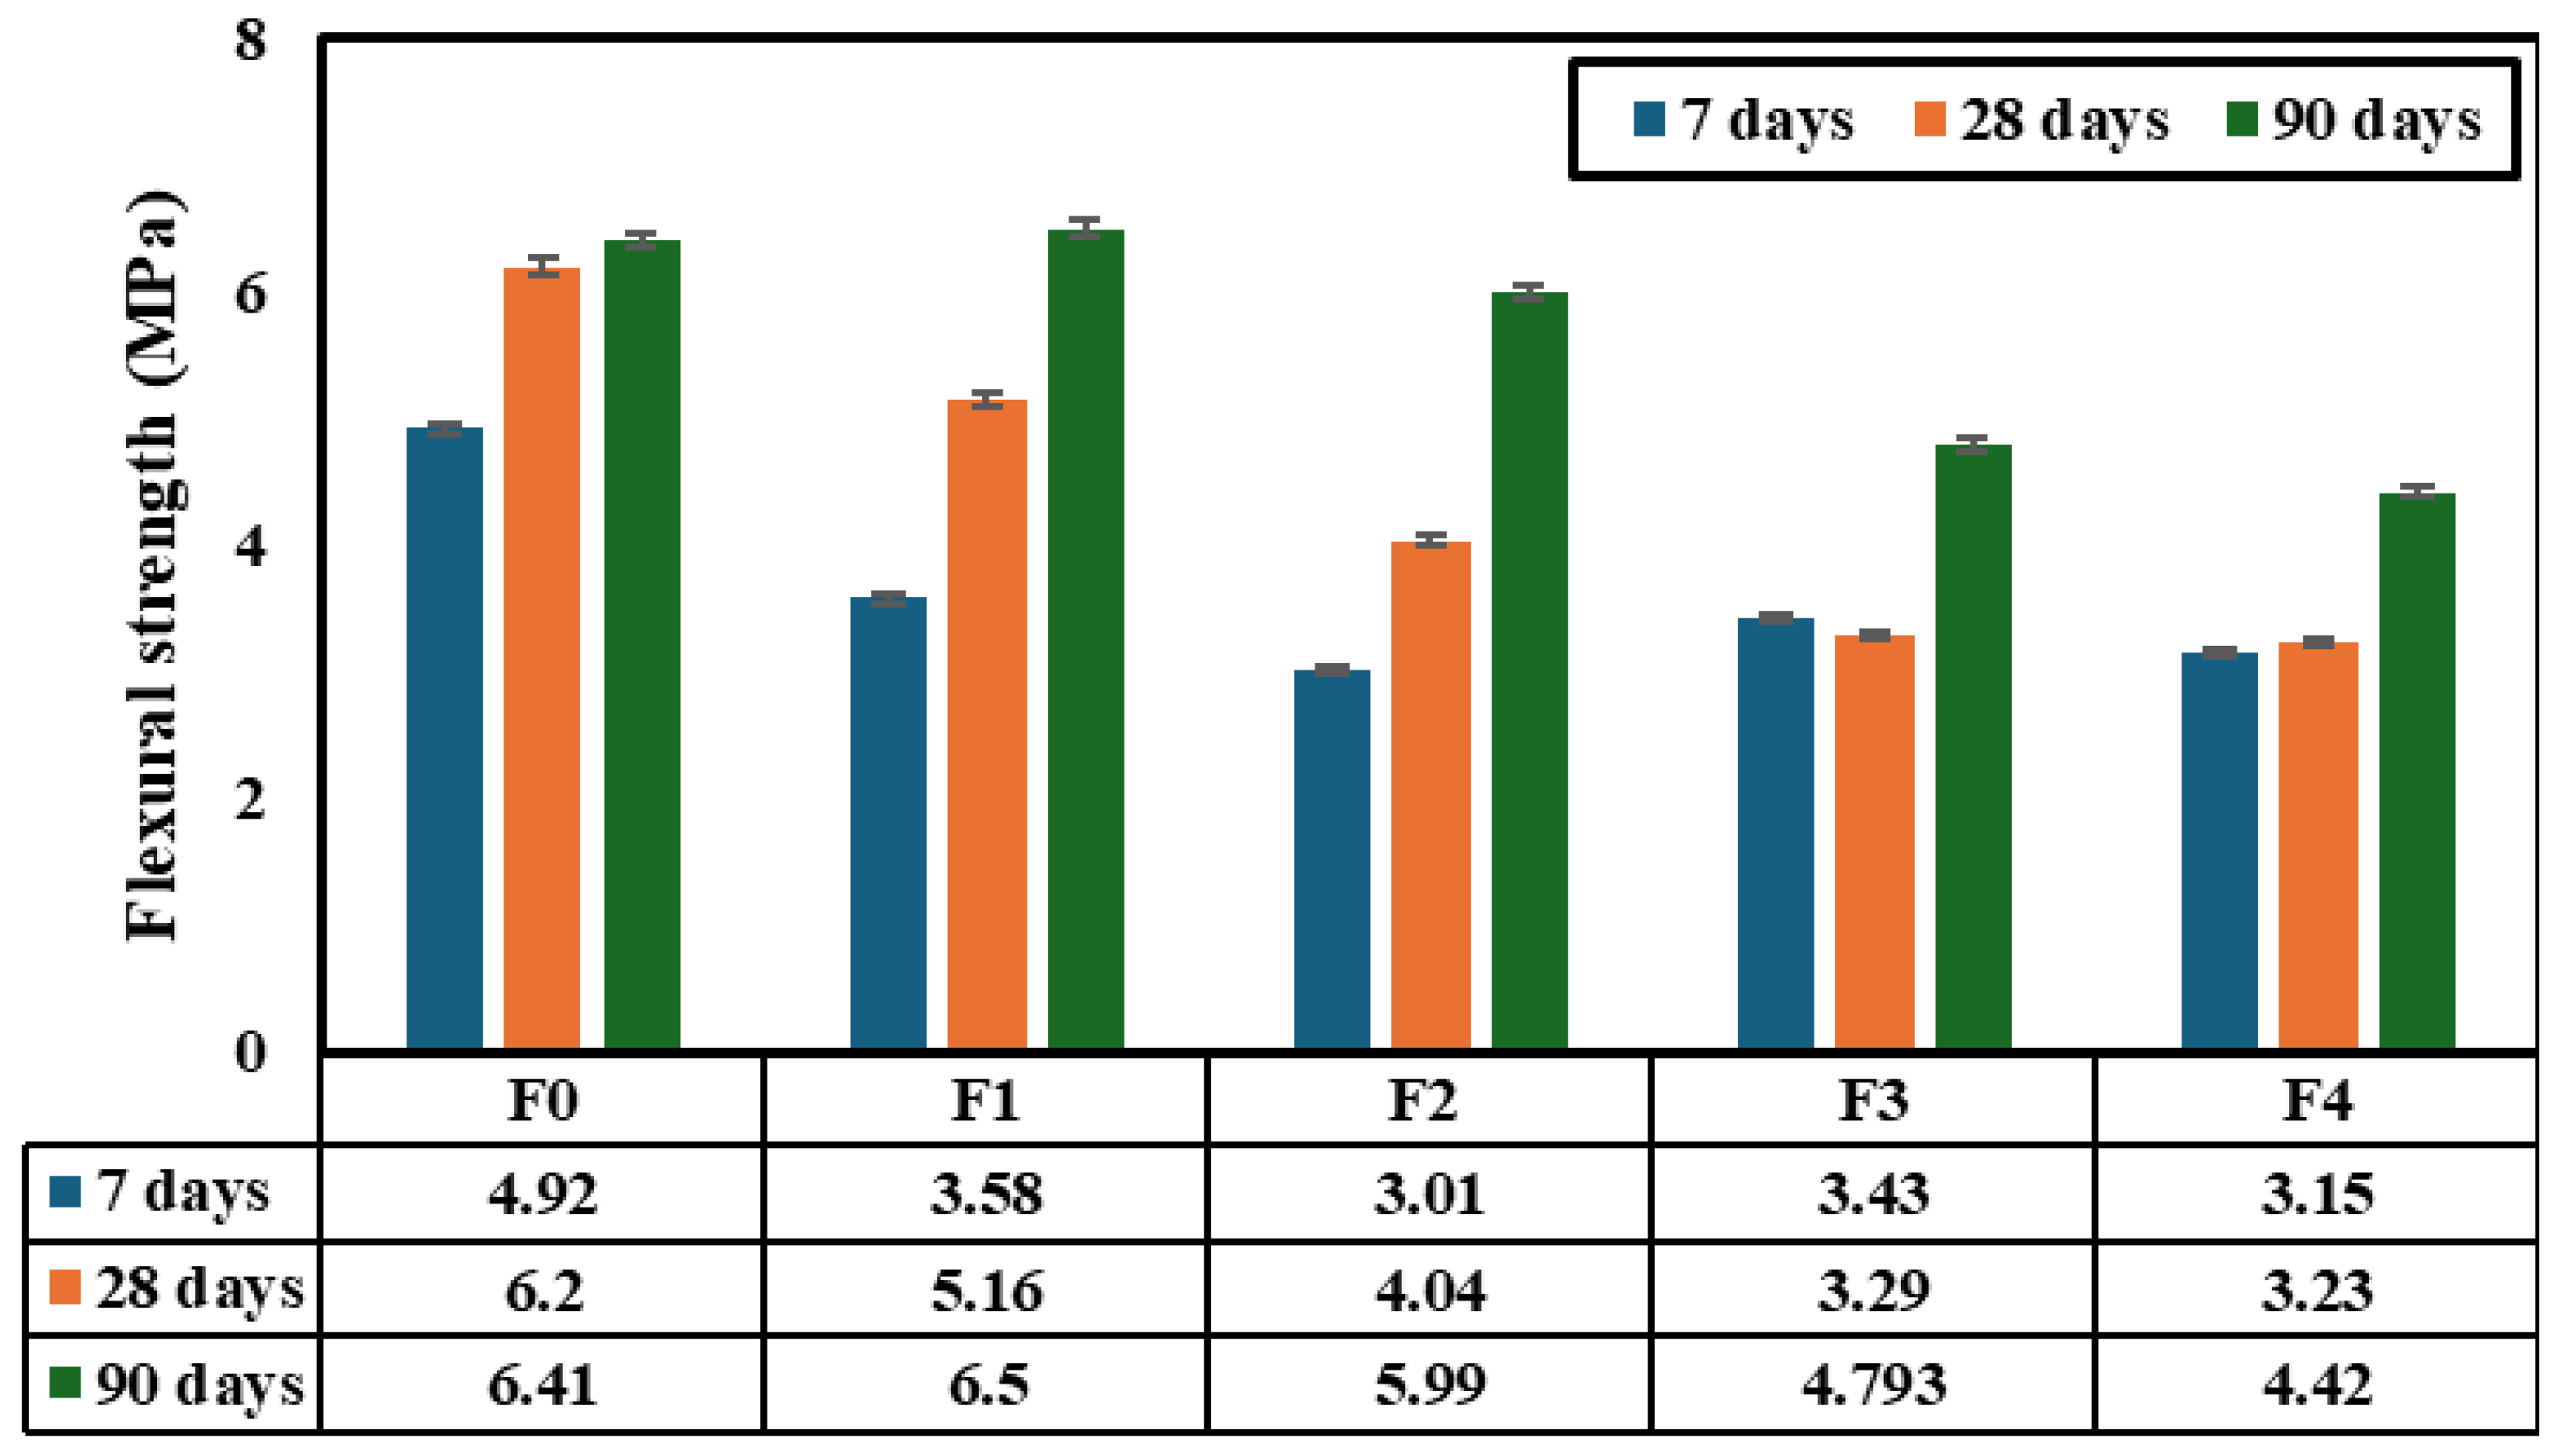
The results shown in Figure 12 indicate that the flexural strength increases with the curing age for all mixes, while increasing the pozzolan replacement reduces the strength level, especially at early ages. For example, at 7 d, the control mix F0 reaches 4.92 MPa, whereas the flexural strength decreases to 3.58 MPa, 3.01 MPa, 3.43 MPa and 3.15 MPa for F1, F2, F3 and F4 respectively. This corresponds to a decrease of 27.2%, 38.8%, 30.3%, and 36.0% relative to the control sample. At 28 d, F0 increases to 6.20 MPa and the corresponding values for the other mixes are 5.16 MPa (F1; −16.8%), 4.04 MPa (F2; −34.8%), 3.29 MPa (F3; −46.9%), and 3.23 MPa (F4; −47.9%), confirming a stronger penalty at higher replacements. At 90 d, the flexural strength further increases to 6.41 MPa (F0), and the mixes reach 6.50 MPa (F1; +1.4% vs. F0), 5.99 MPa (F2; −6.5%), 4.79 MPa (F3; −25.2%), and 4.42 MPa (F4; −31.0%). The 28- → 90-day improvement is particularly pronounced for the higher-replacement mixes, increasing from 4.04 → 5.99 MPa (+48.3%) for F2, 3.29 → 4.79 MPa (+45.7%) for F3, and 3.23 → 4.42 MPa (+36.8%) for F4, whereas the corresponding compressive strength gains over the same period are smaller (F2: 26.17 → 30.00 MPa; +14.6%, F3: 22.24 → 25.58 MPa; +15.0%, F4: 16.56 → 18.00 MPa; +8.7%). This difference is probably attributed to the crack-controlled nature of the flexural strength, which is more sensitive to late-age pore/ITZ refinement and microcrack suppression driven by ongoing pozzolanic reactions [54,55,56,57]. This behavior possibly explains why the flexural strength continues to grow significantly between 28 and 90 d for the pozzolan-rich mixes (F3 and F4), even when the compressive strength shows only limited gains over the same interval.

3.3. Hygric Properties

3.3.1. Water Absorption

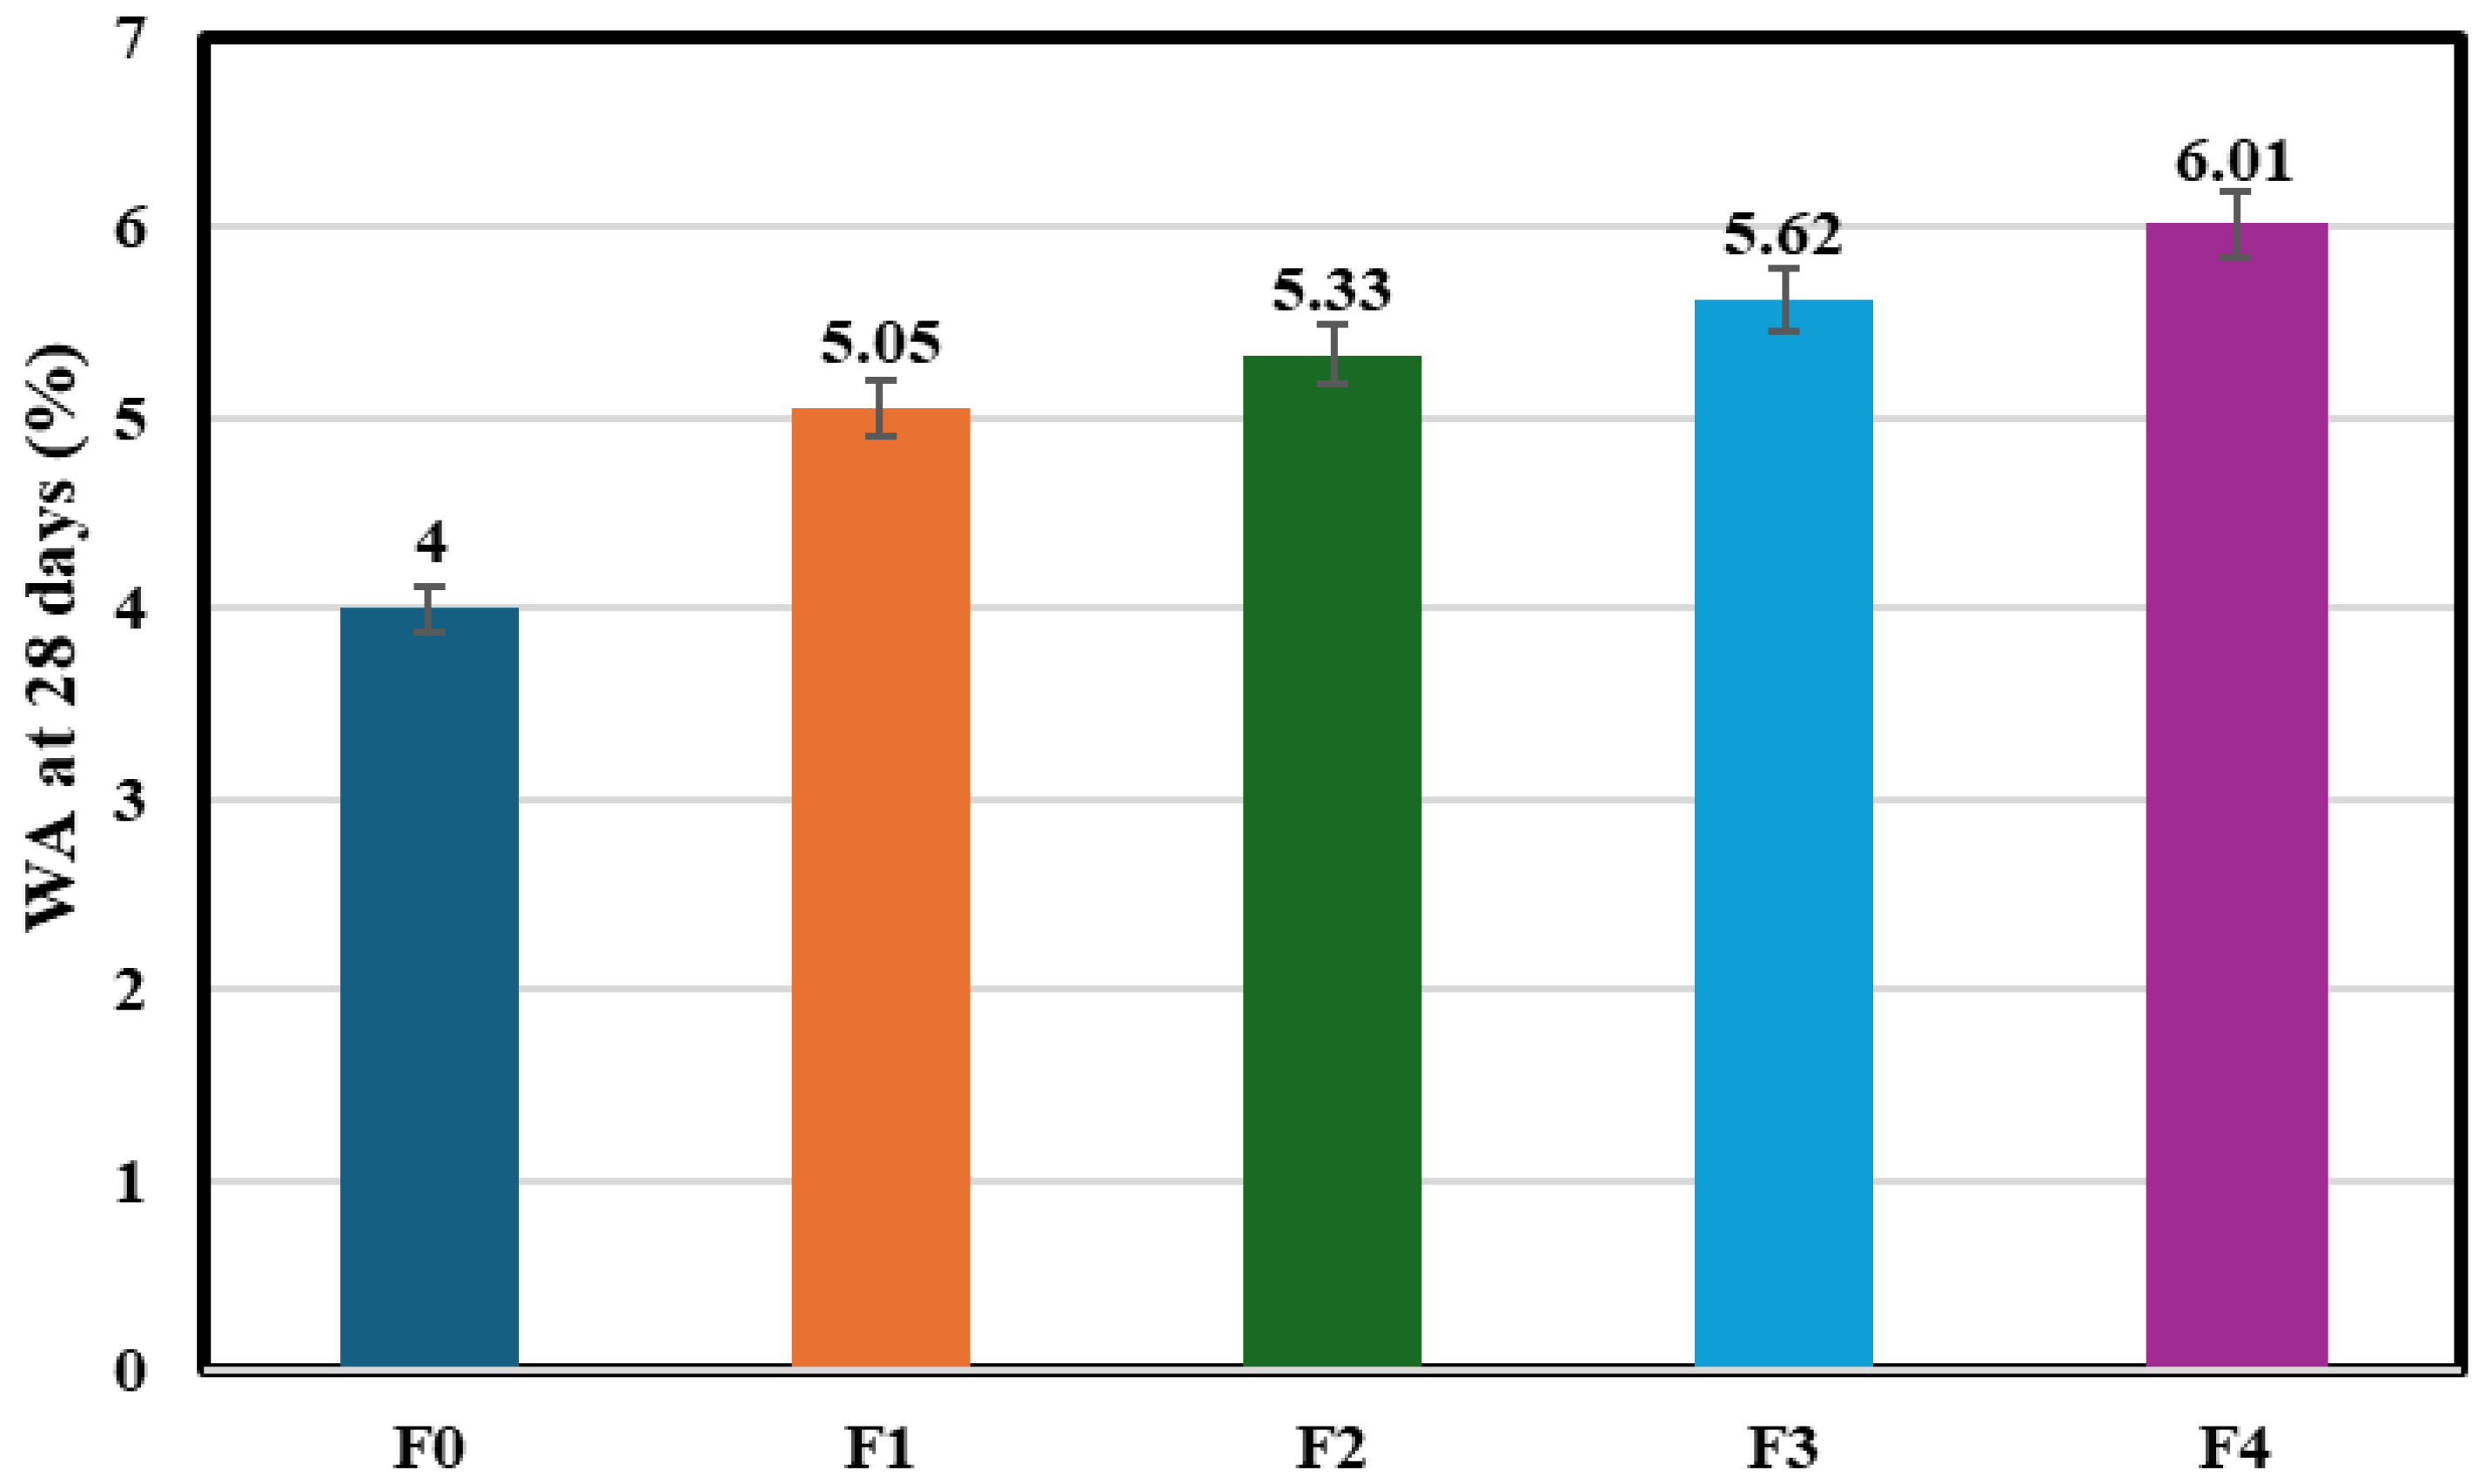
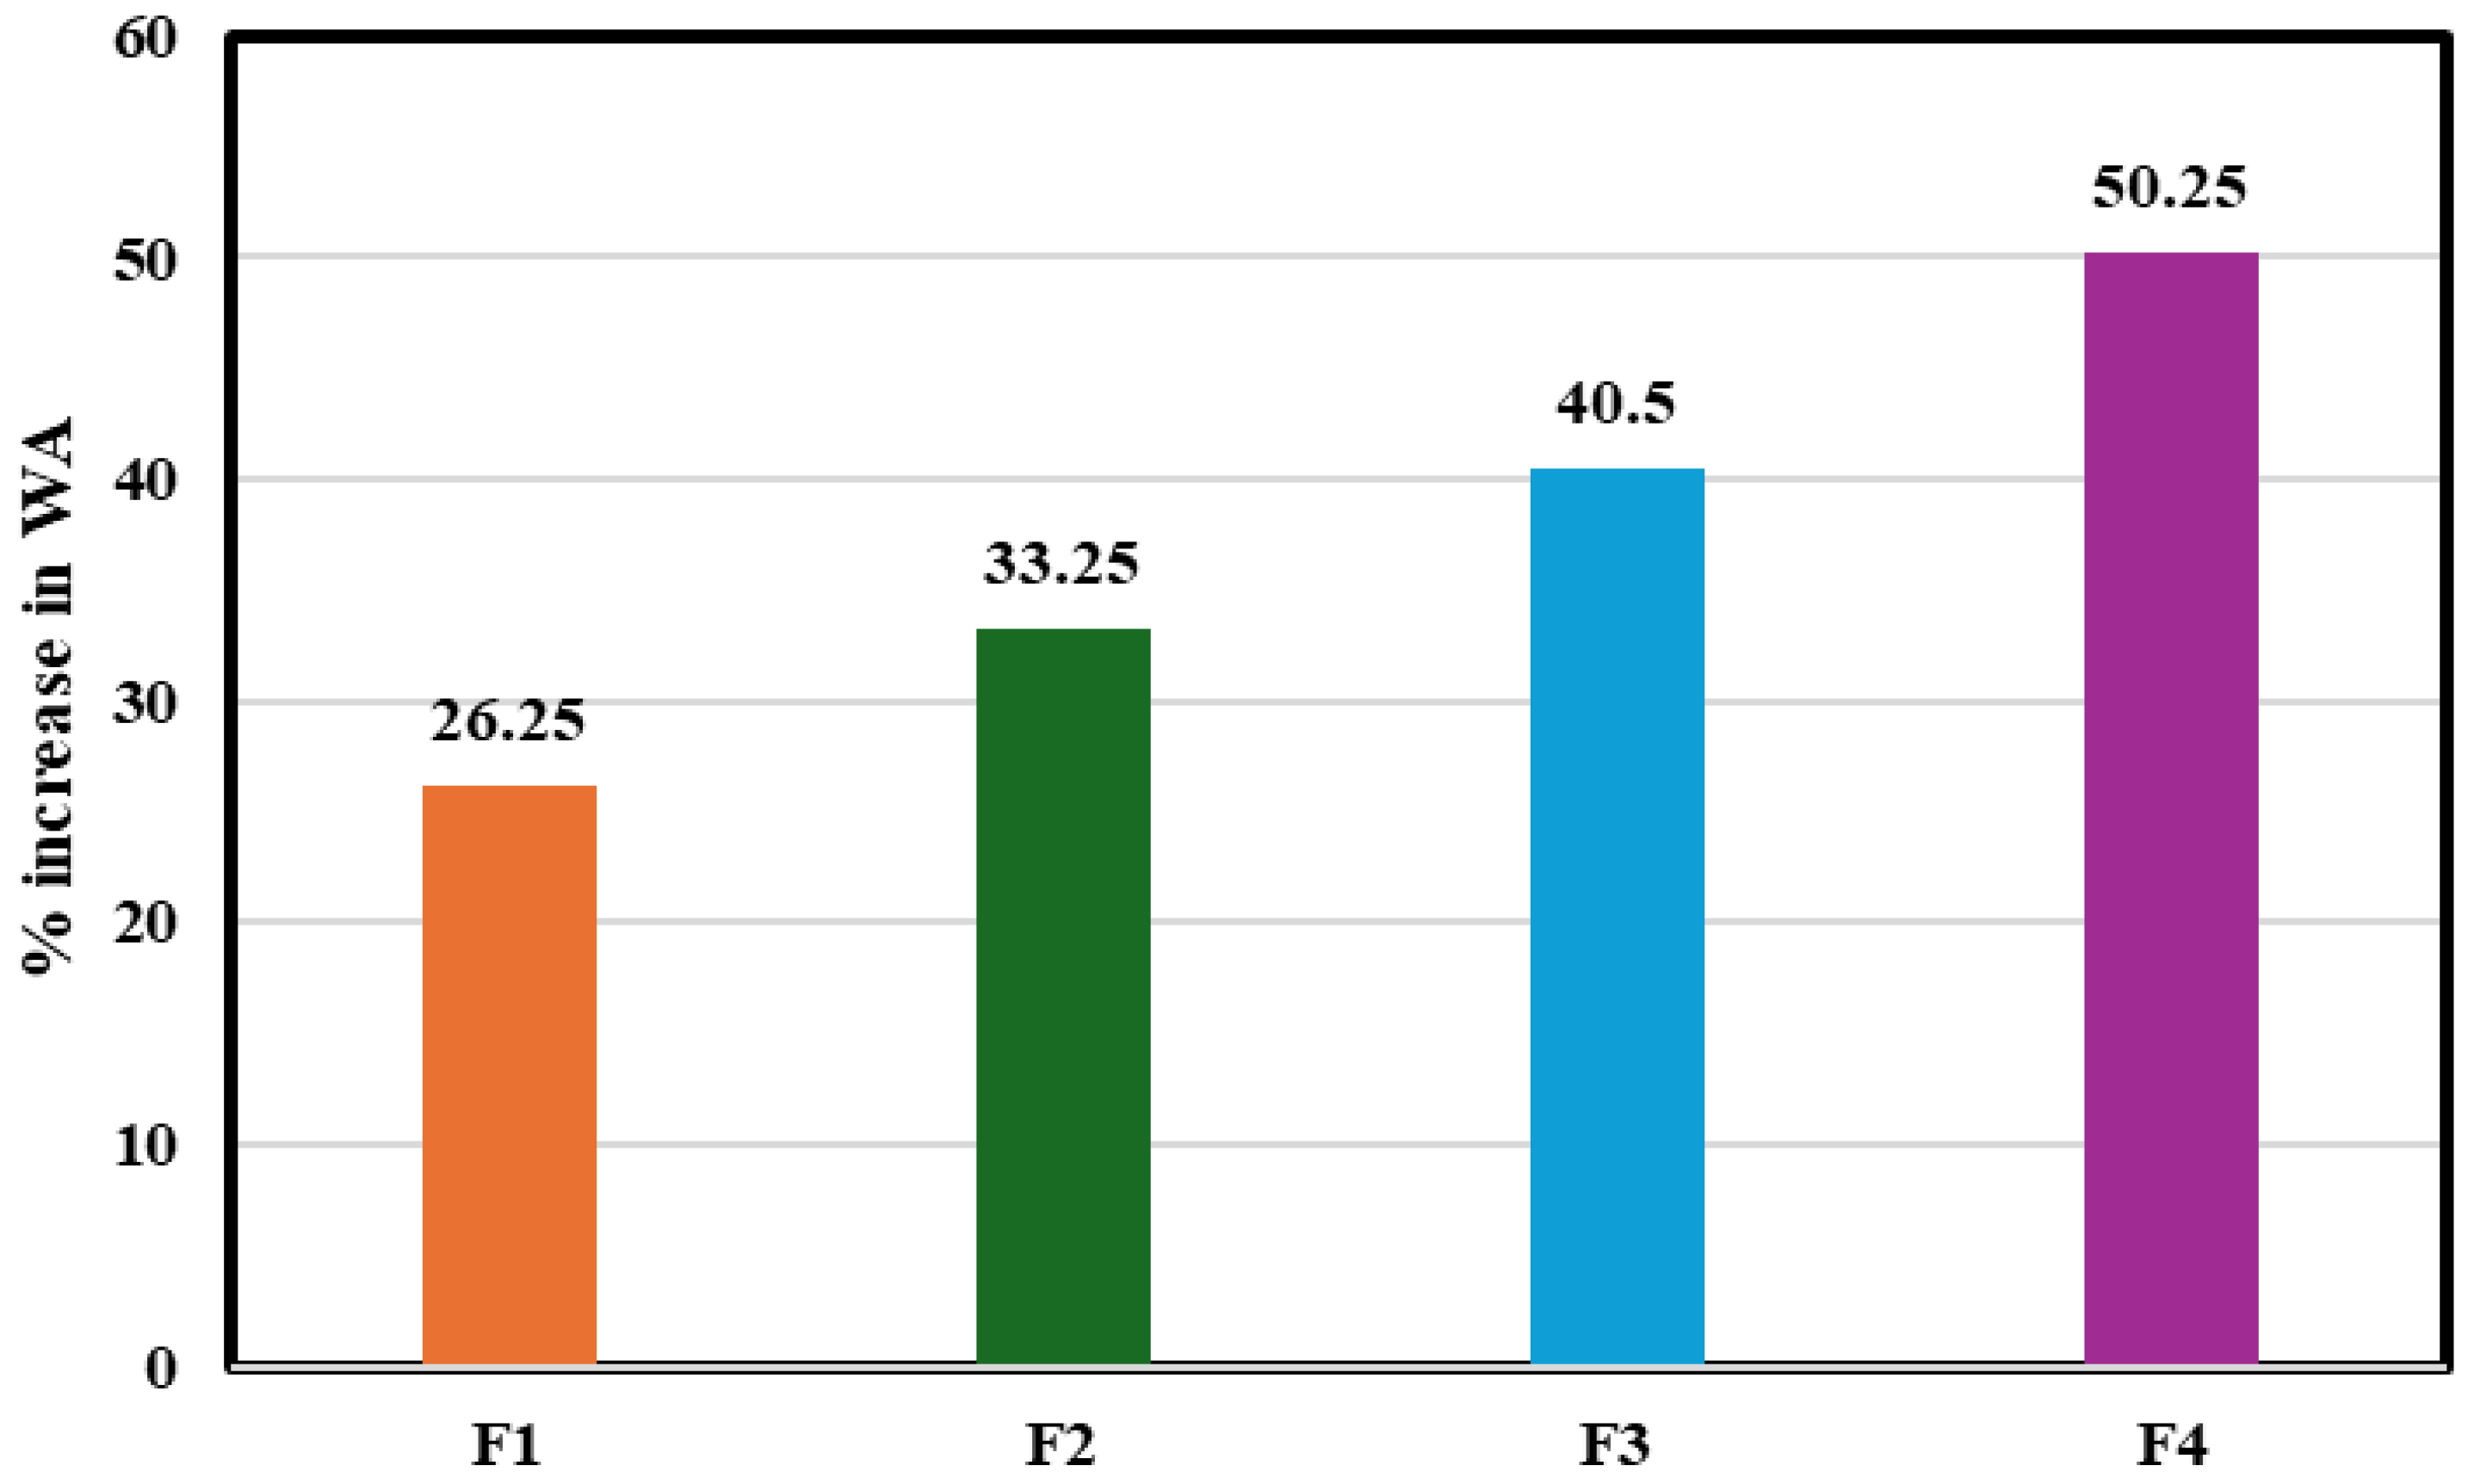
The water absorption results for mortars containing varying proportions of pozzolan (0–56%) at 28 d are displayed in Figure 13. As shown, WA increases from 4% for F0 to 6.01% for F4. The % increase in WA for different mortar mixes compared to the control mix at 28 d is shown in Figure 14. The percentages of increase in water absorption, relative to the control mixture, are 26.25, 33.25, 40.5 and to 50.25% for mixes F1, F2, F3, and F4, respectively. The results suggest that the addition of pozzolan notably raises the water-absorbing ability of the mortar. This increase may be attributed to the low specific gravity of NP (2.7) in comparison to the cement (3.1) [58,59]. Comparable patterns have been thoroughly recorded for cementitious systems incorporating natural pozzolan, volcanic ash, or fly ash, demonstrating that elevated substitution levels lead to augmented porosity and elevated susceptibility to water ingress [60,61]. For instance, an investigation on the physical, mechanical, and volumetric stability properties of mortar with Olive Waste Ash (OWA) as cement substitute demonstrated that increasing the OWA replacement level from 0% to 20% led to a significant increase in total water absorption (TWA) after 24 h immersion, at 28 d, rising from 6% to 17.5% [40].

3.3.2. Capillary Water Absorption

Experimental–Model Comparison of CWA
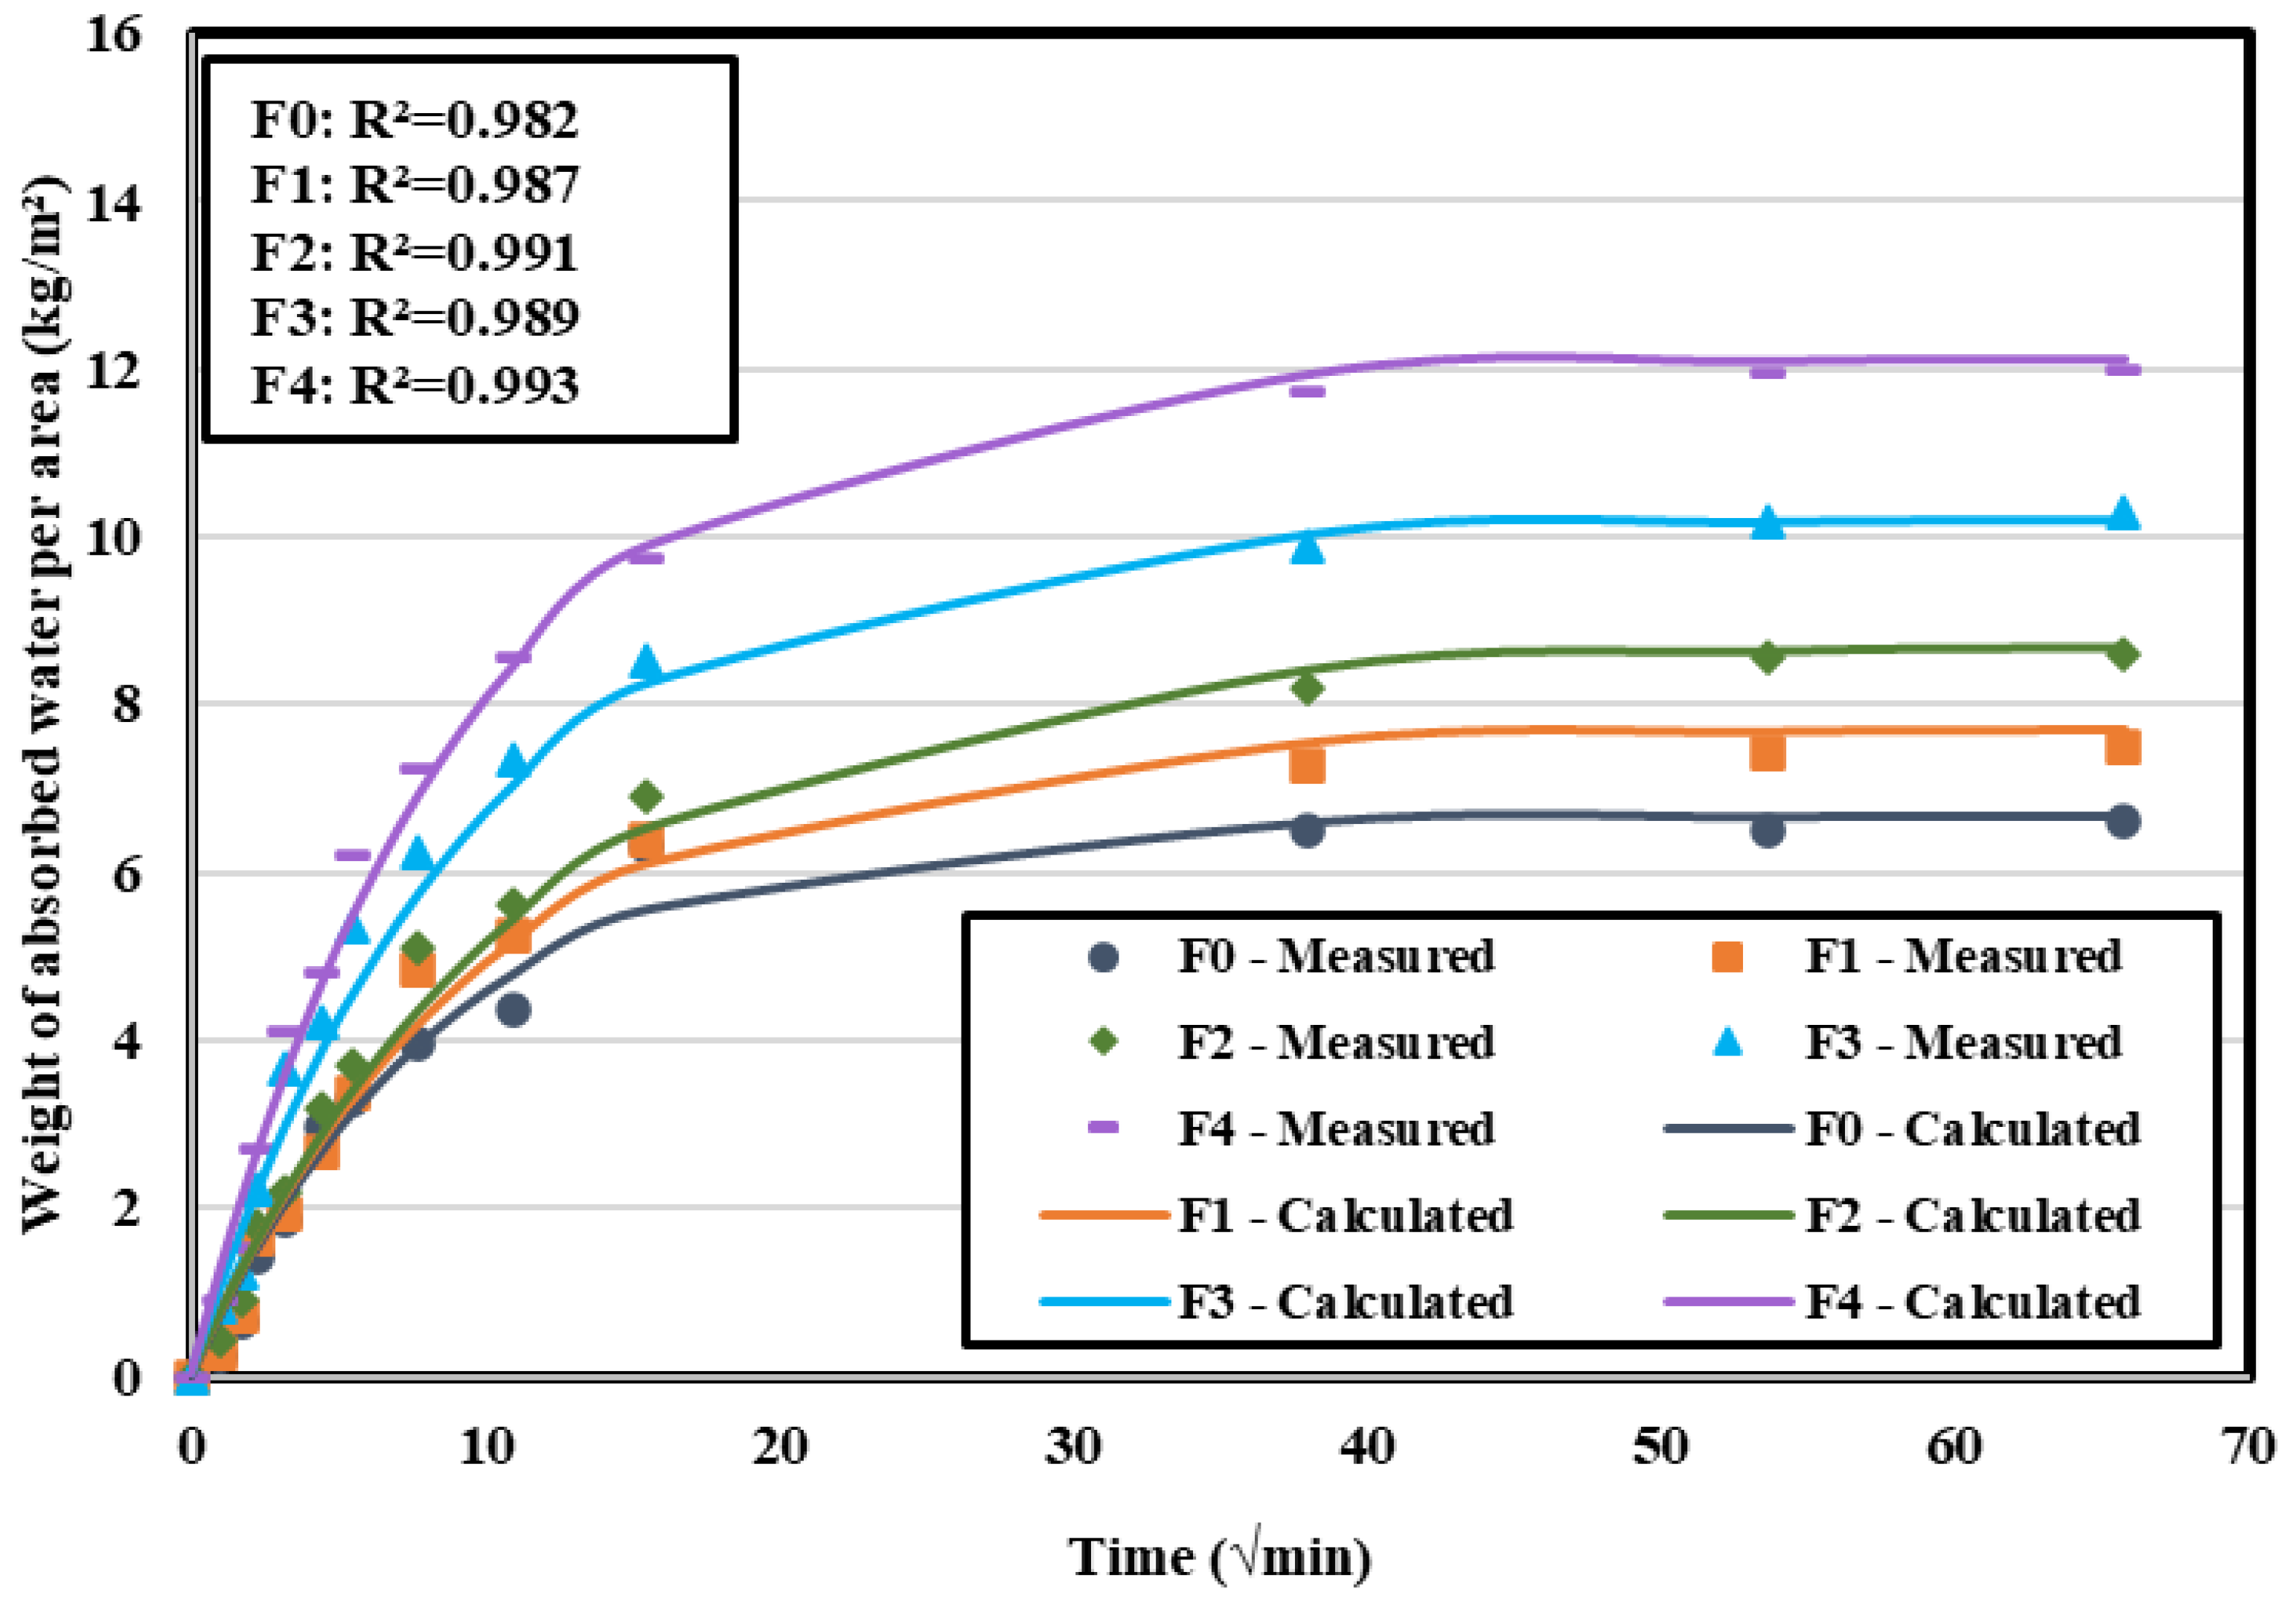
Figure 15 displays the experimental and predicted weight of absorbed water per area (M/A) in function of t1/2 for mortar mixes incorporating different levels of pozzolan replacement at day 28. It is shown that (M/A) rose over time for each mix. For example, (M/A) increased from 0 to 7.49 kg/m2, for mix F1. This increase is very pronounced at early ages. For example, during the first hour, M/A increased from 0 to 5.1 kg/m2, for a 21% level of replacement. This may be related to the dilution effect, where the lower cement content cannot produce sufficient hydration products early on to significantly reduce the porosity. Conversely, at prolonged duration, the M/A ratio exhibits marginal variation, which can be attributed to the capillary network refinement due to the production of C-S-H from pozzolanic reactions [62,63,64]. Comparing the mixes, the experimental data indicate that M/A rose from 6.6 kg/m2 for F0 to 12 kg/m2 for F4 by day 28. This indicates that the inclusion of pozzolan raises water absorption through capillary action, often due to the augmented pore quantity inside the mortar [40].
Capillary–Diffusive Model Parameters Analysis (S and D)
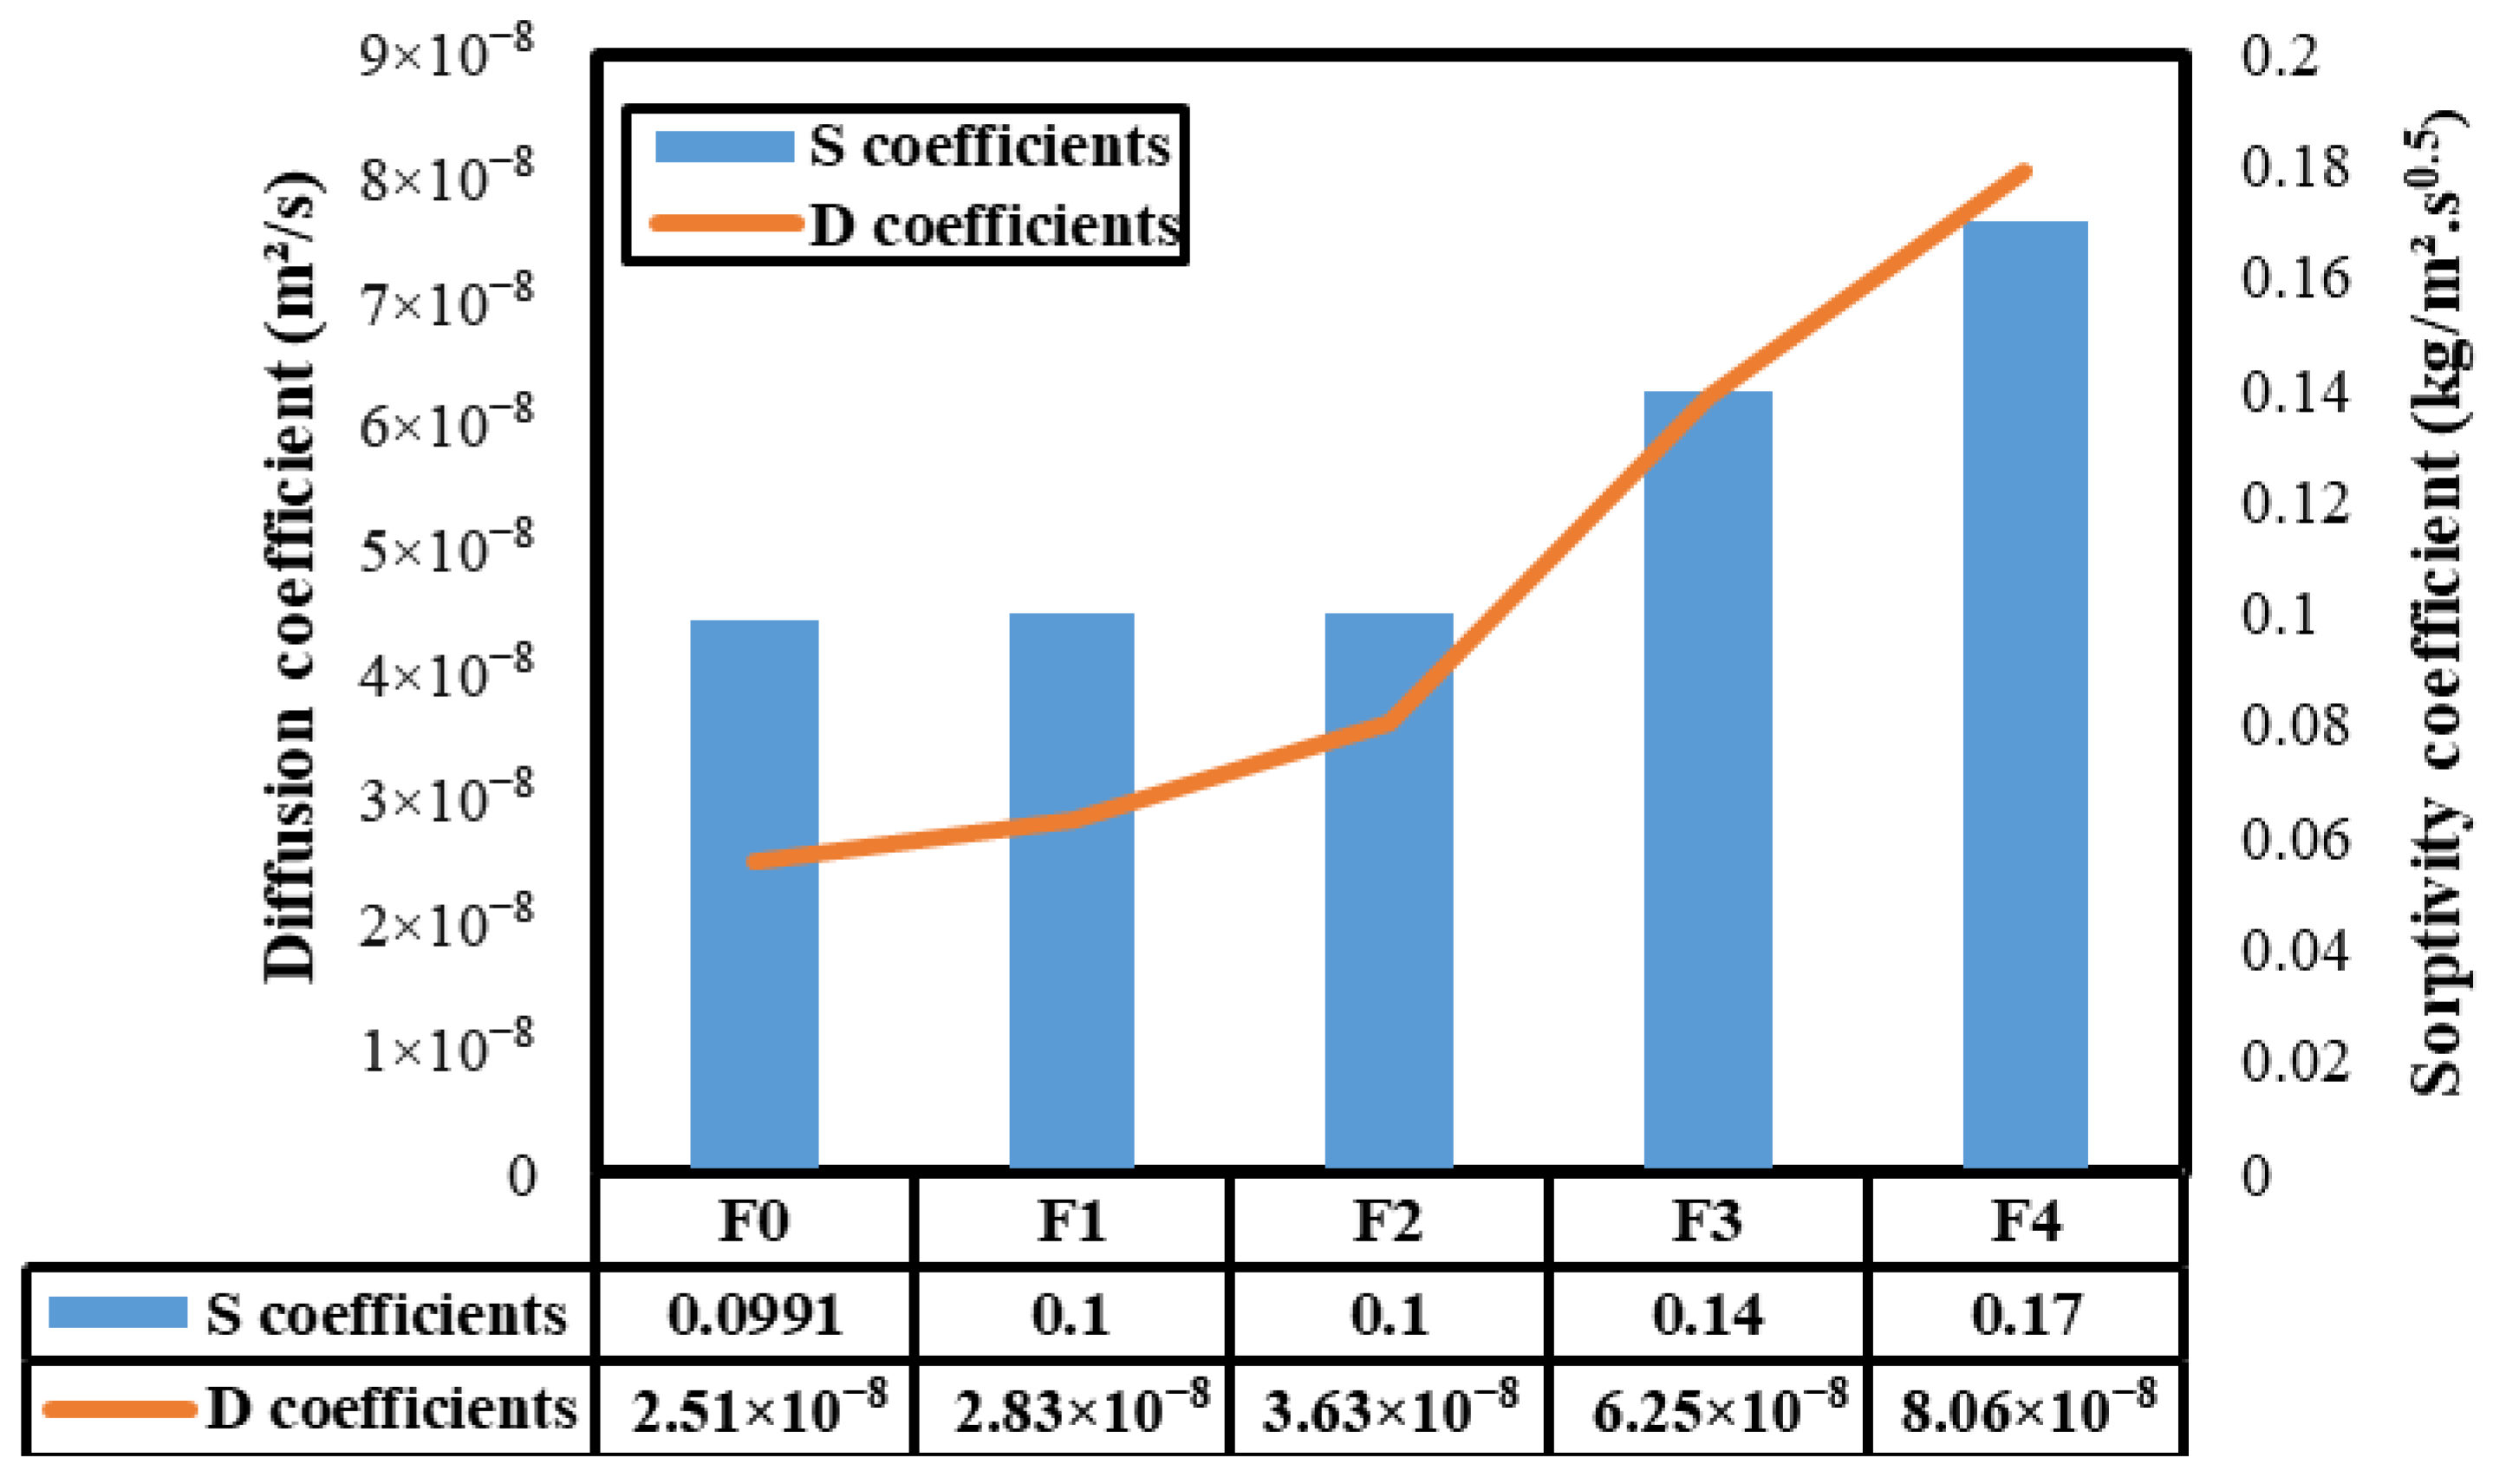
M/A was predicted using a capillary–diffusive model. The sorptivity and diffusion coefficients of the mortars were calculated and are displayed in Figure 16. The results showed a strong fitting between the experimental data and the proposed model (R2 > 0.98). Based on Figure 16, the sorptivity coefficients of the mortar mixes increase with higher pozzolan replacement. The recorded S values for mixtures containing 0, 12, 21, 36, and 56% pozzolan (F0–F4) are 0.0991, 0.1, 0.1, 0.14, and 0.17 kg/m2·s1/2, respectively. As shown, F1 and F2 show approximately the same sorptivity as F0, whereas the increase becomes markedly more pronounced for F3 and F4. This suggests that higher pozzolan replacement (36 and 56%) builds additional pathways, facilitating easier water penetration through the mortar matrix [62,63,64].
Similar findings are noted in the diffusion coefficients. The recorded D values for F0–F4 are 2.51 × 10⁻⁸, 2.83 × 10⁻⁸, 3.63 × 10⁻⁸, 6.2 × 10⁻⁸, and 8 × 10⁻⁸ m2/s, respectively. F1 and F2 exhibit a marginal increase in diffusion; however, the diffusion coefficients markedly increase for both mixes F3 and F4, underscoring the substantial impact of elevated pozzolan content on moisture transport to the deeper layers of the matrix. The increased diffusion coefficients for a higher pozzolan content indicate that the use of pozzolan promotes water movement in the mortar to deeper layers by diffusion through smaller pores [62,63,64].

3.4. Life Cycle Analysis

The carbon footprint per m3 is calculated by summation:
E C m 3 = i ( m i × E F i ) + E C transport + E C p r o c e s s + E C Looses
where m i is the mass of the constituent, i (kg/m3) and E F i its emission factor (kg CO2e/kg), supplemented by transport/process/loss contributions from the ICE model.
This approach is not a complete LCA. It does not cover use, maintenance, carbonation, or end-of-life. It primarily aims for a relative comparison between formulations, using generic factors.
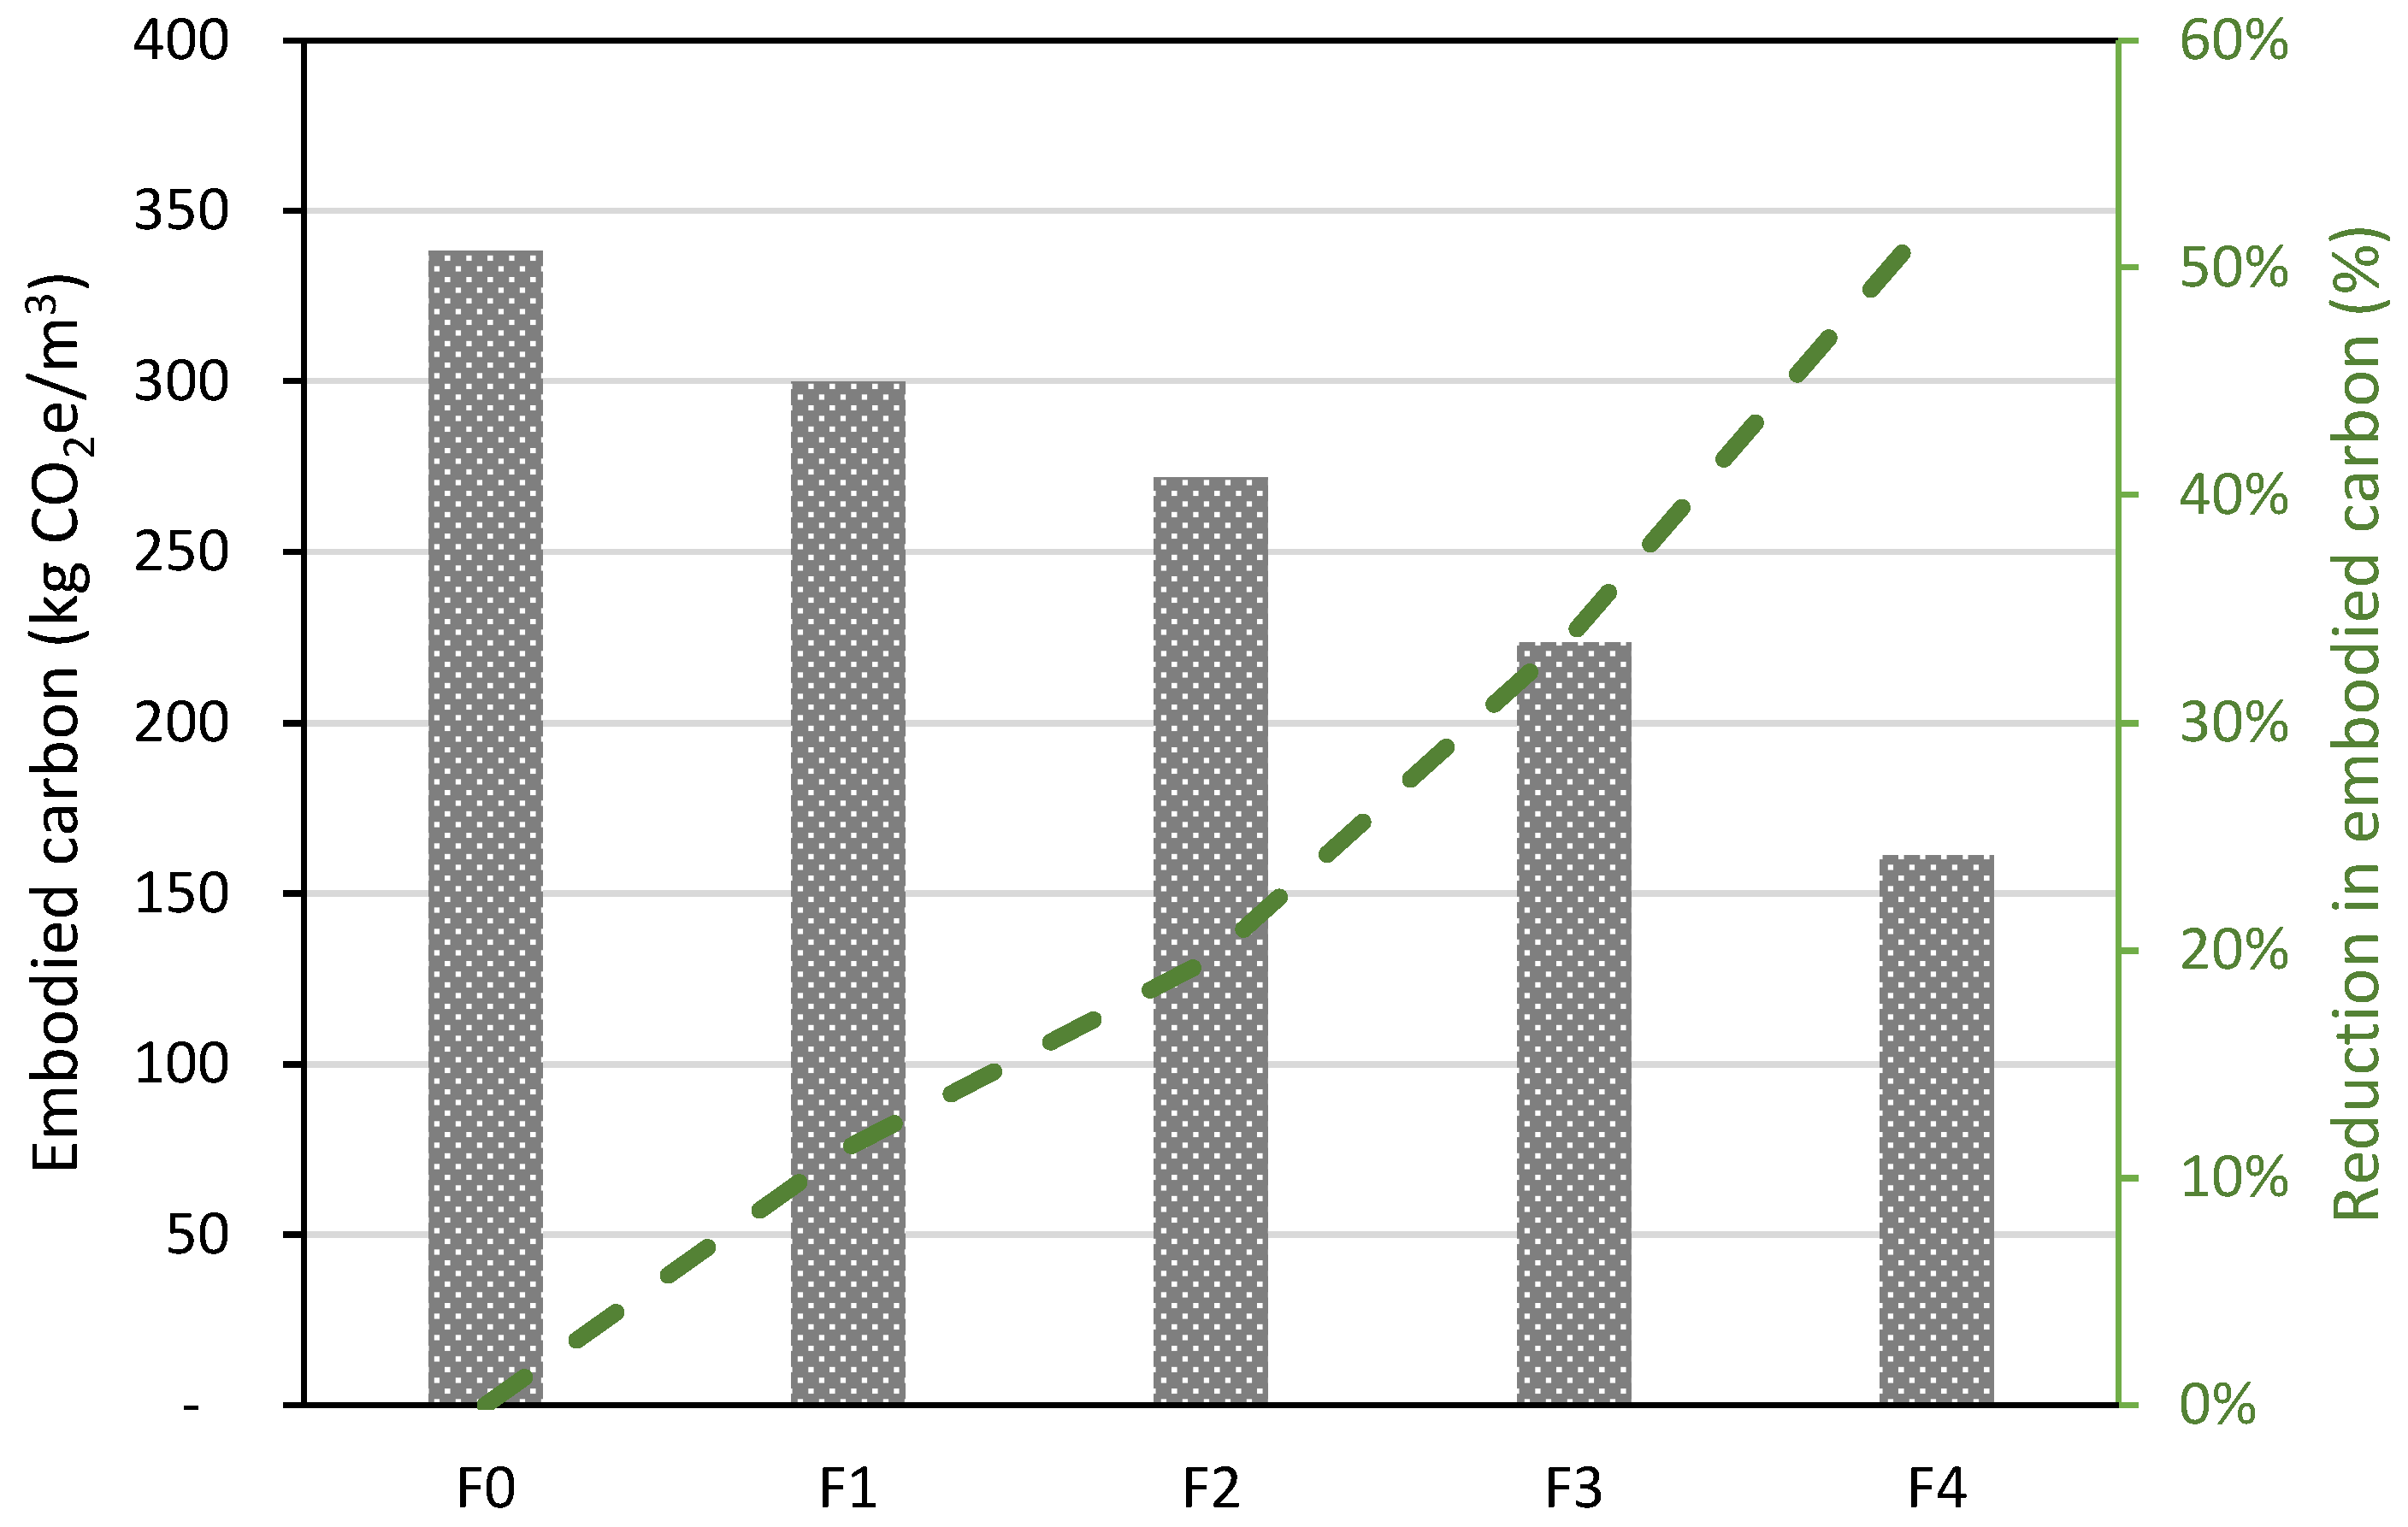
The results obtained in Figure 17 show a monotonic reduction in EC with increasing substitution of cement by pozzolan. The decrease thus reaches 177 kg CO2e·m−3 between F0 and F4, which highlights the decarbonization potential associated with the reduction in cement content.
The estimated cement contribution decreases sharply with substitution: 314.2, 275.8, 247.8, 200.7, 138.3 kg CO2e·m−3 for F0, F1, F2 and F4 respectively. Non-binder contributions, the difference between the total embodied carbon and the binder contribution, remain relatively stable, on the order of 22–24 kg CO2e·m−3, which explains the high sensitivity of embodied carbon to variations in cement and the existence of an emissions “floor” when substitution becomes significant.
This hierarchy is consistent with the LCA/EPD literature: cement is generally the primary contributor to Global Warming Potential (GWP). For example, for 1 m3 of concrete (reference case H-0), Los Santos-Ortega et al. report that cement accounts for 91.4% of the GWP (274.67 kg out of 300.41 kg CO2) [65]. Similarly, for conventional mortar, an LCA study indicates that the main contributor to impacts is cement (e.g., 88.77% of the GWP is attributed to cement in a reference mortar) [66].
Although the ICE approach used here is simpler than a full LCA, the levels obtained are within orders of magnitude comparable to those published for mortars evaluated cradle-to-gate. In the EIAR study (1 m3 of mortar, cradle-to-gate), the reported GWP values for reference mortars are 280 (CEM I) and 220 kg CO2e·m−3 (CEM II/B-M) [67]. The values estimated here (F2 = 272; F3 = 223 kg CO2e·m−3) fall precisely within this range, suggesting consistency in terms of order of magnitude, despite different assumptions and datasets.
The literature also shows that strategies focusing solely on aggregates can generate more modest gains than those targeting the binder. For concrete, an aggregate substitution may only lead to a reduction of a few kg CO2e·m−3, with cement remaining dominant (e.g., −3.42 kg CO2·m−3 reported between two variants) [64]. For mortar, replacing up to 40% of the sand with recycled rubber leads to a significant reduction in some cases (up to 37.04% of CO2 emissions in the corresponding study), while confirming that the cement production phase remains the main contributor [68]. In the present case, the reduction reaches −52% when the substitution directly targets the cement content (F4), which is consistent with the structural role of clinker in the GWP.
In conclusion, the analysis of the contributions shows that cement remains the dominant factor, so that decarbonization is mainly driven by the reduction in cement/clinker content, a result in agreement with LCAs/EPDs published on mortars and concretes.

3.5. Relationships Between Different Properties

3.5.1. Compressive Strength–Flexural Strength Relationship

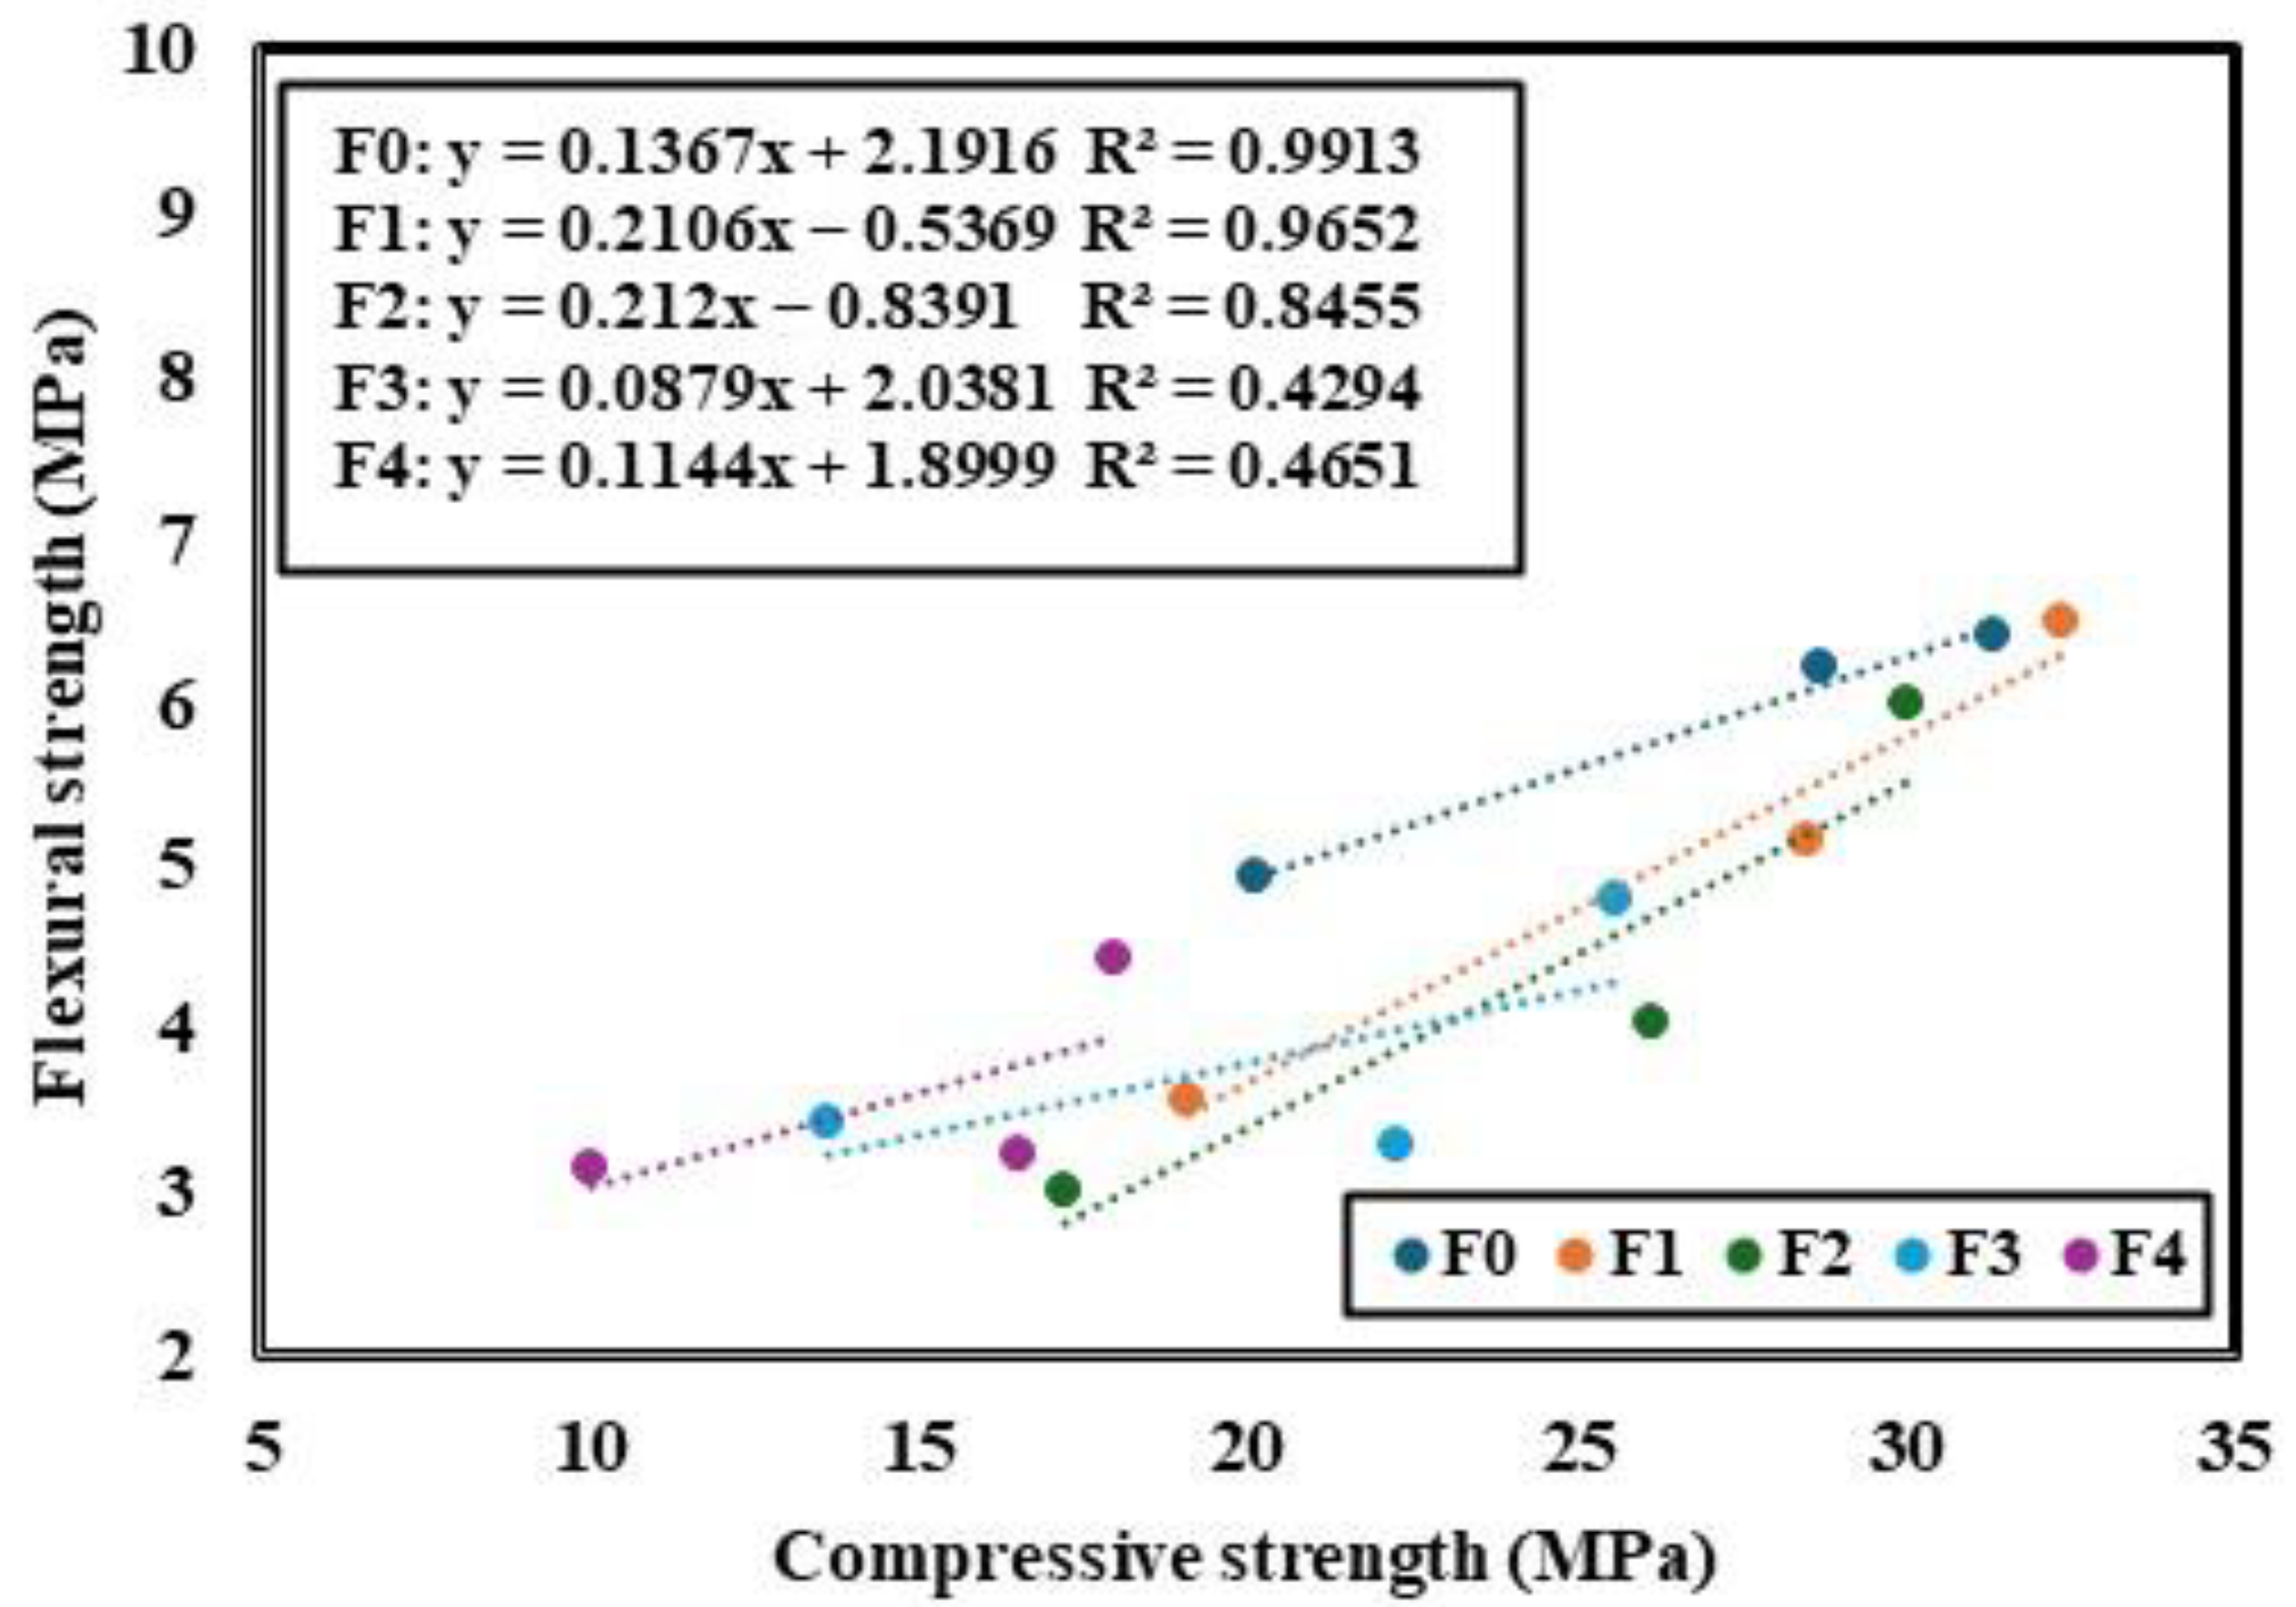
The correlation between the compressive strength and flexural strength for the mortar mixes is illustrated in Figure 18. There appears a positive correlation between both strengths across all mixtures, demonstrating that as the compressive strength rises, the flexural strength also increases. F0, F1, and F2 demonstrate robust linear correlation, indicated by a high coefficient of determination (R2 > 0.8), which implies a very consistent relationship between the compressive and flexural strength with the presence of low pozzolan replacement (≤21%). During the curing of the beams, the production of hydration products improves the compressive strength of the mortar [69]. Likewise, the flexural strength is improved due to the beams’ increased capacity to withstand stress after maximum loading [70]. Conversely, mixtures that incorporate higher levels of pozzolan replacement (F3–F4) demonstrate reduced R2 values (R2 ≈ 0.43–0.47). This may be attributed to the slower kinetics of pozzolanic reactions and increased porosity, which interferes with the linearity between the compressive and flexural strengths [71]. It should also be noted that the regression for each mix is based on only three paired measurements (7, 28, and 90 d). With such a sparse dataset, the coefficient of determination is sensitive to test scatter, particularly for the flexural strength, and this contributes to the lower R2 observed for F3–F4. Although a quadratic fit can yield an apparently perfect (R2 = 1) when only three points are available, this reflects mathematical interpolation rather than a physically justified trend and therefore was not adopted. A larger number of testing ages/replicates (e.g., 7–9 ages over the curing period) is required to reliably assess any true nonlinearity and to support the use of higher-order regression models.

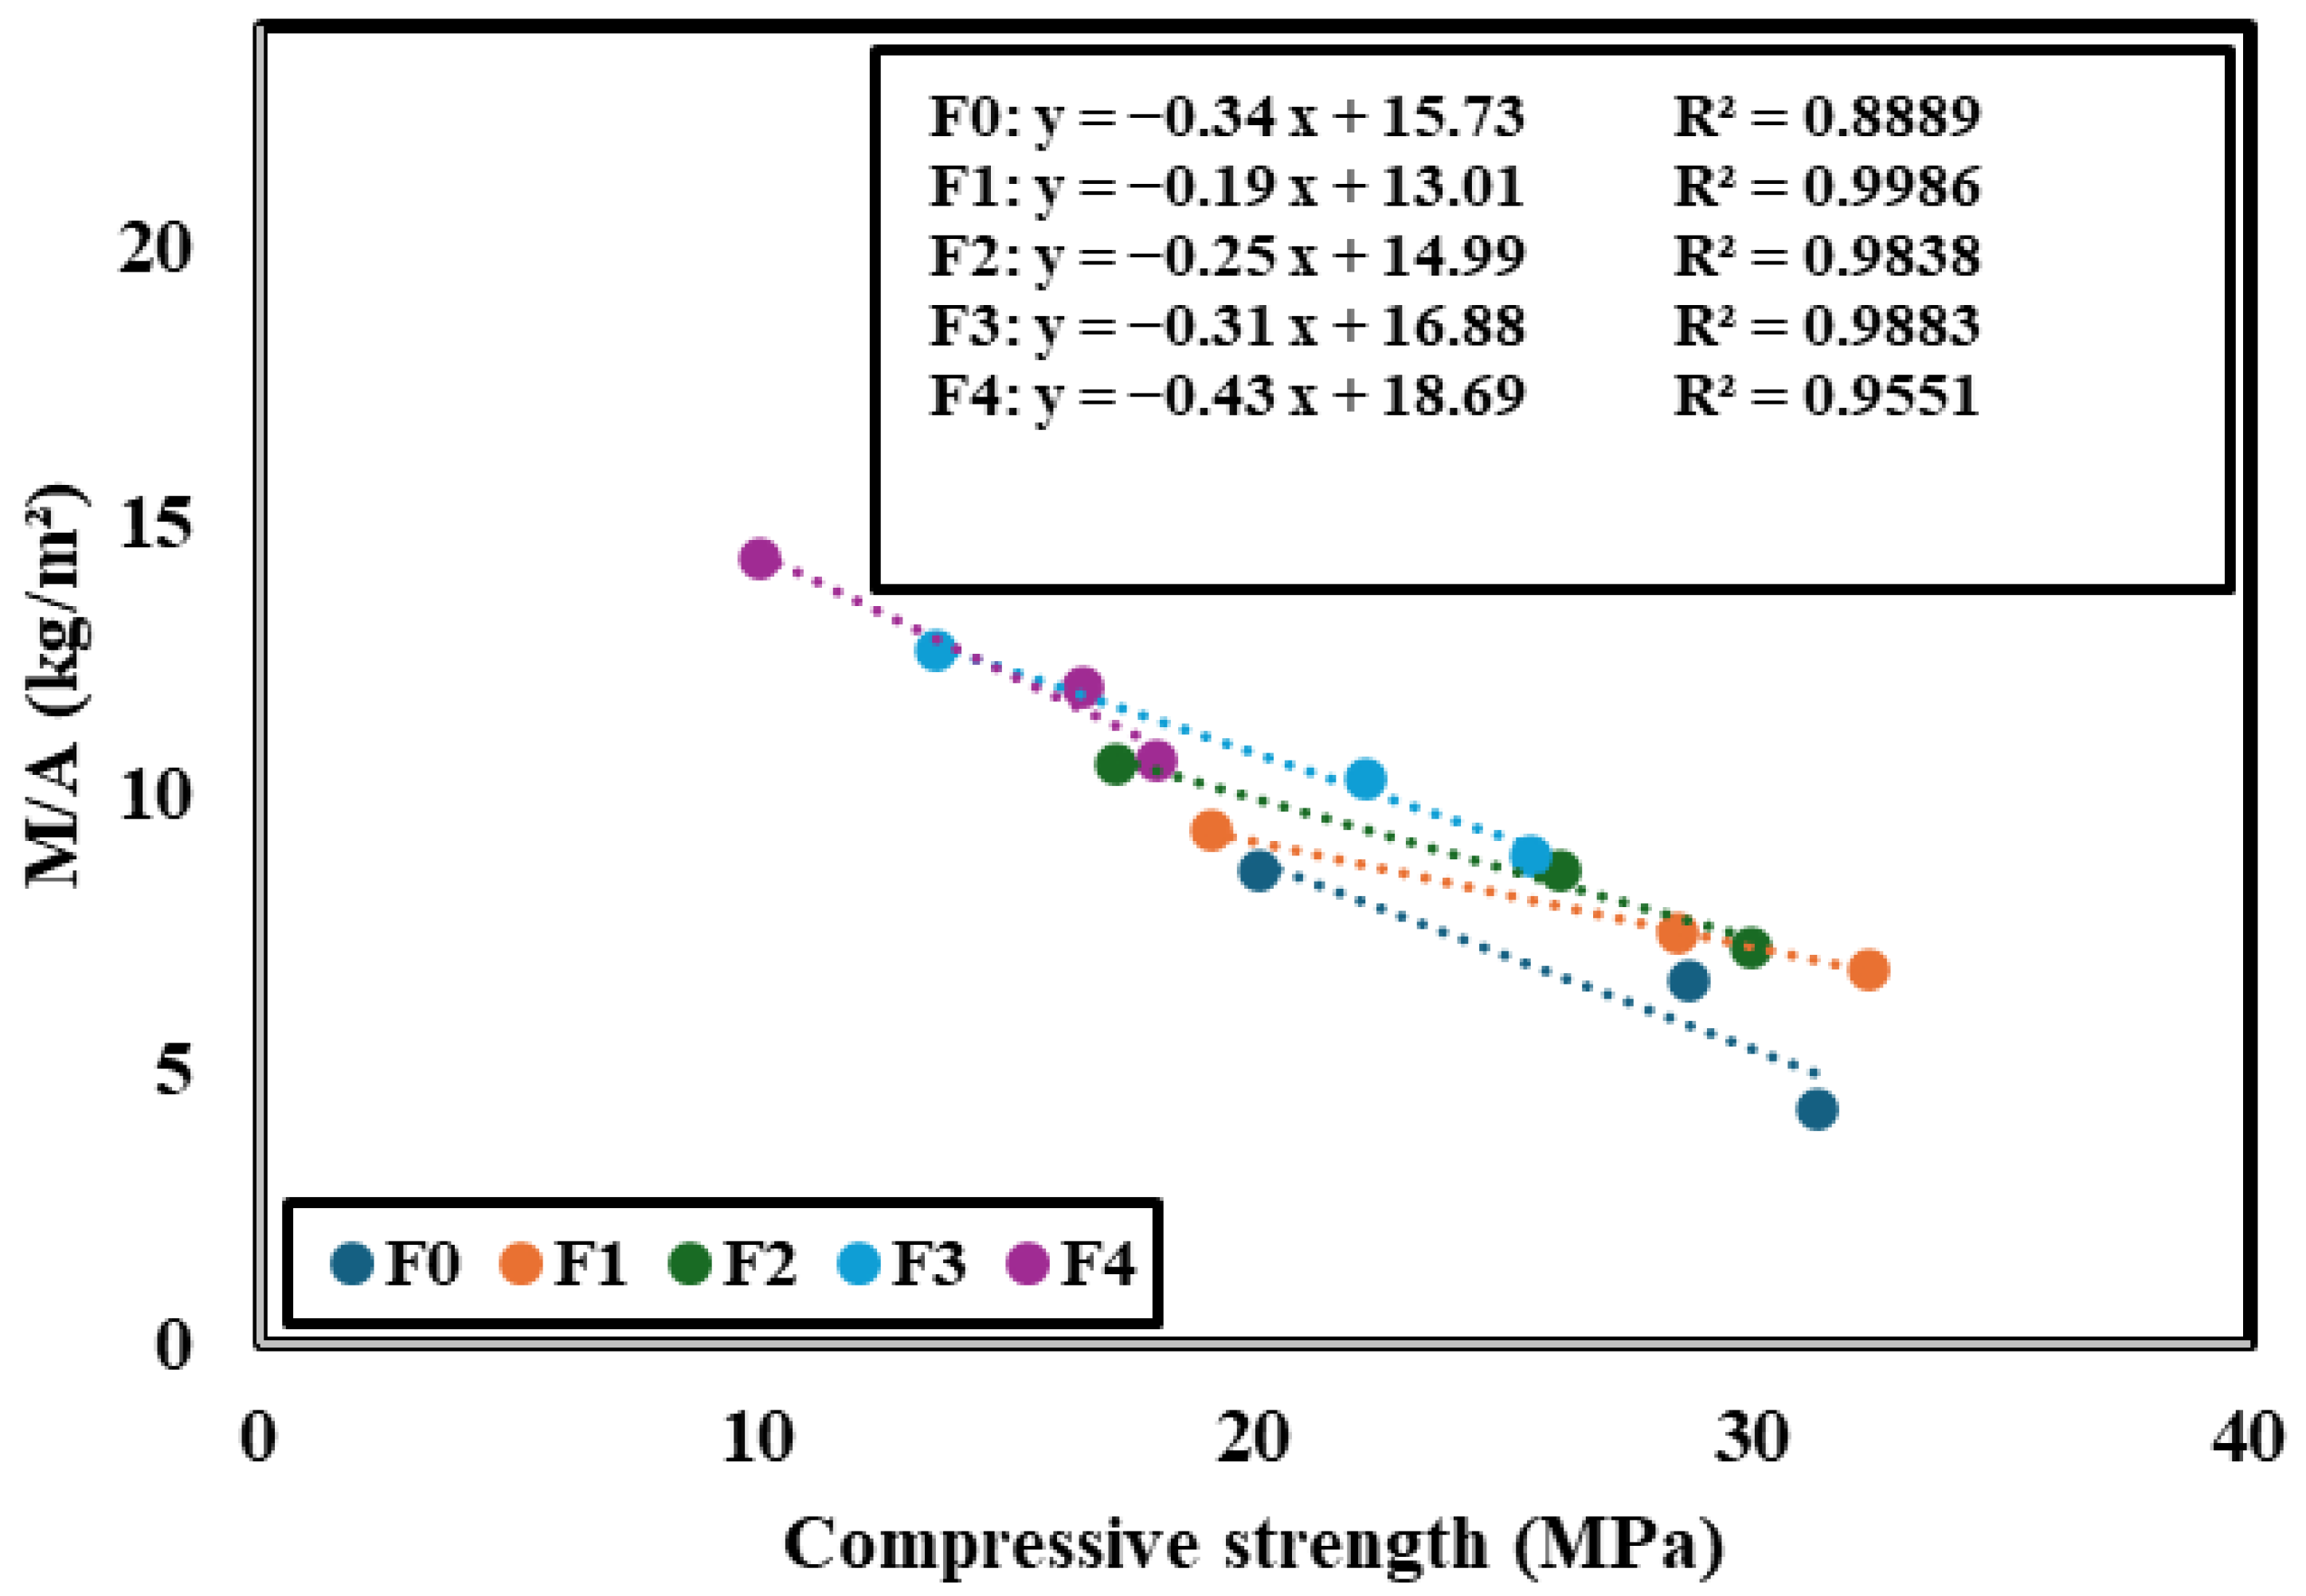
3.5.2. Compressive Strength–(M/A) Relationship

The relationship between the compressive strength and M/A is shown in Figure 19. The R2 values of 0.8889, 0.9986, 0.9838, 0.9883, and 0.9551 indicate a notable negative correlation between the compressive strength and M/A for a pozzolan replacement of 0, 12, 21, 36, and 56%. The data indicate that an increase in the compressive strength will lead to a decrease in M/A. Over time, the compressive strength increases due to the development of hydration products [69]. Contrarily, M/A decreases with the curing days due to the augmented packing and reduced permeability of the mortar [72,73].

4. Conclusions and Perspectives

Natural pozzolan-blended cementitious materials, with their lower environmental impact and capacity to partially substitute energy-intensive Portland cement, offer a promising and sustainable alternative to traditional cement-based systems. This study examined the integration of a newly identified natural pozzolan as a partial replacement (12–56% by mass) for cement in mortar formulations. Based on the experimental results, modeling, and sustainability assessment, the following conclusions can be drawn:
  • Strength development (compressive and flexural). Increasing the pozzolan replacement reduced the early-age strength because clinker dilution lowers the amount of early hydration products. At 7 d, the compressive strength decreased by 4.86%, 14.35%, 32.30%, and 50.04% at 12%, 21%, 36%, and 56% replacement, respectively (corresponding to reductions of 0.98 MPa, 2.89 MPa, 6.49 MPa, and 10.06 MPa compared to the control value of 20.10 MPa).
  • Later-age recovery confirms reactivity. Later-age gains indicate pozzolanic contribution through secondary hydrates and matrix refinement. At 90 d, the 12% mixture slightly exceeded the control by 3.38% in compressive strength and 1.40% in flexural strength (+1.06 MPa in compression: 32.38 vs. 31.32 MPa; +0.09 MPa in flexure: 6.50 vs. 6.41 MPa). Higher replacements show significant reductions at 90 d (compressive: −5.74 MPa at 36% and −13.32 MPa at 56% relative to 31.32 MPa; flexural: −1.62 MPa at 36% and −1.99 MPa at 56% relative to 6.41 MPa).
  • ASTM activity criterion (SAI). Using the ASTM criterion (≥75% at 28 d), the natural pozzolan shows acceptable activity at 12% (99.3%) and 21% (91.2%), is marginal at 36% (77.5%), and is not acceptable at 56% (57.7%). At 90 d, the 12% mix reached 103.4%, confirming effective late-age contribution.
  • Porosity and water absorption trends. Water-accessible porosity at 28 d increased steadily with replacement. Relative to the control, porosity increased by 32.3%, 43.4%, 48.16%, and 53.6% at 12%, 21%, 36%, and 56%, respectively. Total water absorption at 28 d also increased, with relative increases (vs. control) ranging from 26.2% to 50.2% as the replacement rose from 12% to 56%. These changes are consistent with the strength reductions at high substitution.
  • Modeling and correlation. The nonlinear age–strength model reproduced the experimental trends with very high fit quality (R2 ≈ 0.98–0.99 across mixtures). A strong compressive–flexural correlation was obtained for the low-to-moderate replacement range (R2 > 0.8), supporting the consistency of the mechanical dataset in that window.
  • Sustainability benefit (community impact). The embodied carbon analysis shows a monotonic reduction in EC with increasing cement substitution by pozzolan. The decrease reaches 177 kg CO2e·m−3 between F0 and F4, corresponding to a reduction of approximately 52% when substitution directly targets the cement content. The binder contribution decreases markedly (from 314.2 to 138.3 kg CO2e·m−3), while the non-binder contributions remain relatively stable (≈22–24 kg CO2e·m−3), explaining the high sensitivity of embodied carbon to variations in clinker content and the existence of an emission “floor” at high substitution levels. This confirms that decarbonization of mortar is primarily driven by cement reduction, in agreement with published LCA/EPD studies.
  • Practical recommendation. A moderate replacement (12–21%) provides the best overall balance. It keeps performance close to the control while still lowering cement demand and environmental impacts. Higher replacement can be justified mainly when strength requirements are lower and longer curing is acceptable.
  • Limitations and future work. The study is based on one mix design and one curing regime, with pore/transport assessed mainly by porosity and 24 h absorption. Future work should include microstructural confirmation (e.g., XRD/TGA/SEM) and durability indicators (chloride migration, carbonation, sulfate resistance, shrinkage) to validate long-term field performance, especially at ≥36% replacement.

Author Contributions

Conceptualization, H.A. and H.G.; methodology, H.A. and H.G.; formal analysis, H.A. and H.G.; investigation, H.A., L.F., G.A.-M., F.A., A.Y. and H.G.; writing—original draft preparation, H.A., G.A.-M. and H.G.; writing—review and editing, H.A., L.F., G.A.-M., F.A., A.Y. and H.G.; validation, H.A., L.F., G.A.-M., F.A., A.Y. and H.G.; project administration, L.F. All authors have read and agreed to the published version of the manuscript.

Funding

This research received no external funding.

Data Availability Statement

Data are included in this paper.

Acknowledgments

The authors gratefully acknowledge the support and assistance provided by the FEHR Group Laboratory.

Conflicts of Interest

Authors Houssam AFFAN and Laurent FEHR were employed by Groupe FEHR. The remaining authors declare that the research was conducted in the absence of any commercial or financial relationships that could be construed as a potential conflict of interest.

References

  1. Barcelo, L.; Kline, J.; Walenta, G.; Gartner, E. Cement and carbon emissions. Mater. Struct. 2014, 47, 1055–1065. [Google Scholar] [CrossRef] [Scilit]
  2. Alassaad, F.; Haddad, B.; Affan, H.; Mohamad, A.; Sebaibi, N. Incorporation of concrete polishing waste as a partial substitute for cement in mortar. Materials 2025, 18, 530. [Google Scholar] [CrossRef] [Scilit]
  3. Papadakis, V.G.; Tsimas, S. Supplementary cementing materials in concrete: Part I: Efficiency and design. Cem. Concr. Res. 2002, 32, 1525–1532. [Google Scholar] [CrossRef] [Scilit]
  4. Aprianti, E. A huge number of artificial waste material can be supplementary cementitious material (SCM) for concrete production–A review part II. J. Clean. Prod. 2017, 142, 4178–4194. [Google Scholar] [CrossRef] [Scilit]
  5. Lin, Z.; Lyu, G.; Fang, K. Carbon emissions assessment of concrete and quantitative calculation of CO2 reduction benefits of SCMs: A case study of C30–C80 ready-mixed concrete in China. Case Stud. Constr. Mater. 2025, 22, e04287. [Google Scholar] [CrossRef] [Scilit]
  6. Johari, M.M.; Brooks, J.J.; Kabir, S.; Rivard, P. Influence of supplementary cementitious materials on engineering properties of high strength concrete. Constr. Build. Mater. 2011, 25, 2639–2648. [Google Scholar] [CrossRef] [Scilit]
  7. Sutter, L.L. Supplementary Cementitious Materials Best Practices for Concrete Pavements; Federal Highway Administration: Washington, DC, USA, 2016.
  8. Wong, C.L.; Mo, K.H.; Yap, S.P.; Alengaram, U.J.; Ling, T.-C. Potential use of brick waste as alternate concrete-making materials: A review. J. Clean. Prod. 2018, 195, 226–239. [Google Scholar] [CrossRef] [Scilit]
  9. Damineli, B.L.; Pileggi, R.G.; Lagerblad, B.; John, V.M. Effects of filler mineralogy on the compressive strength of cementitious mortars. Constr. Build. Mater. 2021, 299, 124363. [Google Scholar] [CrossRef] [Scilit]
  10. Sharbaf, M.; Najimi, M.; Ghafoori, N. A comparative study of natural pozzolan and fly ash: Investigation on abrasion resistance and transport properties of self-consolidating concrete. Constr. Build. Mater. 2022, 346, 128330. [Google Scholar] [CrossRef] [Scilit]
  11. Liu, J.C.; Hossain, M.U.; Ng, S.T.; Ye, H. High-performance green concrete with high-volume natural pozzolan: Mechanical, carbon emission and cost analysis. J. Build. Eng. 2023, 68, 106087. [Google Scholar] [CrossRef] [Scilit]
  12. Turanli, L.; Uzal, B.; Bektas, F. Effect of large amounts of natural pozzolan addition on properties of blended cements. Cem. Concr. Res. 2004, 34, 2277–2283. [Google Scholar] [CrossRef]
  13. Mehta, P.K. Studies on blended cements containing Santorin Earth. Cem. Concr. Res. 1981, 11, 507–518. [Google Scholar] [CrossRef] [Scilit]
  14. Mouli, M.; Khelafi, H. Performance characteristics of lightweight aggregate concrete containing natural pozzolan. Build. Environ. 2008, 43, 31–36. [Google Scholar] [CrossRef] [Scilit]
  15. Derrouiche, Y.; Achoura, D.; Saliba, J.; Cassagnabère, F. Natural pozzolan as a sustainable cement replacement in high-performance concrete: Effects on mechanical properties, durability, and microstructural development. Sci. Afr. 2025, 27, e02574. [Google Scholar] [CrossRef] [Scilit]
  16. Haddad, B.; Alassaad, F.; Affan, H.; Mohamad, A.; Sebaibi, N. Characterization of mortars incorporating concrete washing fines: Impact on mechanical properties, microstructure, and carbon footprint. Appl. Sci. 2024, 14, 8381. [Google Scholar] [CrossRef] [Scilit]
  17. Ababneh, A.N.; Al-Thiab, E.H.; Al-Shorman, B.H. Early strength development in cement mortars containing high proportions of Jordanian natural pozzolan. Results Eng. 2025, 27, 105868. [Google Scholar] [CrossRef] [Scilit]
  18. Ababneh, A.N.; Matalkah, F.; Al-Akhras, M. The use of graphene nanoplatelets for enhancement of the compressive strength of mortar containing high levels of natural pozzolan. Constr. Build. Mater. 2024, 449, 138302. [Google Scholar] [CrossRef] [Scilit]
  19. Khitas, N.E.H.; Hebbache, K.; Douadi, A.; Boutlikht, M.; Belebchouche, C.; Messai, A.; Mahar, N.E.-H.; Del Serrone, G.; Moretti, L.; Czarnecki, S.; et al. Modeling and optimizing the properties of mortars based on natural pozzolan, silica sand, and recycled brick waste mixture design: A technical and environmental study. Constr. Build. Mater. 2025, 459, 139706. [Google Scholar] [CrossRef] [Scilit]
  20. Hosseinzadehfard, E.; Mobaraki, B. Corrosion performance and strain behavior of reinforced concrete: Effect of natural pozzolan as partial substitute for microsilica in concrete mixtures. Structures 2025, 79, 109397. [Google Scholar] [CrossRef] [Scilit]
  21. NF EN 197-1:2012; Cement—Part 1: Composition, specifications and conformity criteria for common cements. AFNOR: Paris, France, 2012.
  22. ASTM C1437; Standard Test Method for Flow of Hydraulic Cement Mortar. ASTM International: West Conshohocken, PA, USA, 2013.
  23. NF EN 196-1; Methods of Testing Cement—Part 1: Determination of Strength. AFNOR: Paris, France, 2016.
  24. NF P18-459; Concrete—Determination of Water Absorption by Immersion. AFNOR: Paris, France, 2010.
  25. ASTM C1585; Standard Test Method for Measurement of Rate of Absorption of Water by Hydraulic-Cement Concretes. ASTM International: West Conshohocken, PA, USA, 2013.
  26. Concrete Embodied Carbon Footprint Calculator. Circular Ecology. Available online: https://circularecology.com/concrete-embodied-carbon-footprint-calculator.html (accessed on 27 January 2026).
  27. Jones, C. Bath Inventory of Carbon and Energy (ICE)|GHG Protocol. 2010. Available online: https://ghgprotocol.org/Third-Party-Databases/Bath-ICE (accessed on 10 February 2026).
  28. Hammond, G.P.; Jones, C.I. Embodied energy and carbon in construction materials. Proc. Inst. Civ. Eng.-Energy 2008, 161, 87–98. [Google Scholar] [CrossRef] [Scilit]
  29. ISO 14040; Environmental Management—Life Cycle Assessment—Principles and Framework. International Organization for Standardization: Geneva, Switzerland, 2006.
  30. ISO 14044; Environmental Management—Life Cycle Assessment—Requirements and Guidelines. International Organization for Standardization: Geneva, Switzerland, 2006.
  31. Hill, N.; Bonifazi, E.; Bramwell, R.; Karagianni, E.; Harris, B. 2018 Government GHG Conversion Factors for Company Reporting: Methodology Paper for Emission Factors–Final Report; Department for Business, Energy & Industrial Strategy: London, UK, 2018. [Google Scholar]
  32. Department for Energy Security and Net Zero; Department for Business; Energy & Industrial Strategy. Greenhouse Gas Reporting: Conversion Factors 2018. GOV.UK. 2018. Available online: https://www.gov.uk/government/publications/greenhouse-gas-reporting-conversion-factors-2018 (accessed on 10 February 2026).
  33. Summary Sustainable Development Data 2017, MPA Cement—Publication Index | NBS. Available online: https://dev.web.pubs-search.thenbs.cloud/documents/details?Pub=MPAC&DocId=321791 (accessed on 11 February 2026).
  34. Ghazzawi, S.; Ghanem, H.; Chahal, S.; Khatib, J.; Elkordi, A. Mechanical and physical performance of cement paste containing olive waste ash: Implications for paving block applications. Appl. Sci. 2025, 15, 3959. [Google Scholar] [CrossRef] [Scilit]
  35. Al-Massri, G.; Ghanem, H.; Khatib, J.; Elkordi, A. Influence of adding banana fibers on the mechanical properties and volume stability of mortar for paving block applications. J. Nat. Fibers 2025, 22, 2464152. [Google Scholar] [CrossRef] [Scilit]
  36. Yang, L.; Gao, D.; Zhang, Y.; Tang, J.; Li, Y. Relationship between sorptivity and capillary coefficient for water absorption of cement-based materials: Theory analysis and experiment. R. Soc. Open Sci. 2019, 6, 190112. [Google Scholar] [CrossRef] [Scilit]
  37. Neithalath, N. Evaluating the short- and long-term moisture transport phenomena in lightweight aggregate concretes. Mag. Concr. Res. 2007, 59, 435–445. [Google Scholar] [CrossRef] [Scilit]
  38. Al-Massri, G.; Ghanem, H.; Khatib, J.; El-Zahab, S.; Elkordi, A. The effect of adding banana fibers on the physical and mechanical properties of mortar for paving block applications. Ceramics 2024, 7, 1533–1553. [Google Scholar] [CrossRef] [Scilit]
  39. Villar-Cocina, E.; Valencia-Morales, E.; Vega-Leyva, J.; Munoz, J.A. Kinetics of the water absorption in GGBS-concretes: A capillary–diffusive model. Comput. Concr. 2005, 2, 19–30. [Google Scholar] [CrossRef] [Scilit]
  40. Ghanem, H.; Ghazzawi, S.; Khatib, J.; Elkordi, A.; Kırgız, M.S. Physical, mechanical, and volumetric stability properties of mortar with olive waste ash as cement substitute. Eng. Rep. 2025, 7, e70501. [Google Scholar] [CrossRef] [Scilit]
  41. Martys, N.S.; Ferraris, C.F. Capillary transport in mortars and concrete. Cem. Concr. Res. 1997, 27, 747–760. [Google Scholar] [CrossRef] [Scilit]
  42. Rosa, D.; Rizzo, F.; Palma, L.D. Lime- and pozzolan-based matrices for an efficient immobilization of hazardous waste. Chem. Eng. Sci. 2025, 313, 121735. [Google Scholar] [CrossRef] [Scilit]
  43. Ahmed, W.; Ye, C.; Lu, G.; Ng, S.T.; Liu, G.; Wang, Y. Low-carbon concrete comprising high-volume pozzolan and recycled aggregate: Evaluating mechanical performance, microstructure, environmental impact, and cost efficiency. J. Clean. Prod. 2025, 518, 145796. [Google Scholar] [CrossRef] [Scilit]
  44. Mostofinejad, D.; Saljoughian, A.; Sadeghi, E.; Bahmani, H. Flexural strengthening of reinforced concrete beams using engineered cementitious composite panels with artificial pozzolan, glass mesh, and grooving method. Results Eng. 2025, 26, 105187. [Google Scholar] [CrossRef] [Scilit]
  45. López, M.; Castro, J.T. Effect of natural pozzolans on porosity and pore connectivity of concrete with time. Rev. Ing. Construcción 2010, 25, 419–431. [Google Scholar] [CrossRef] [Scilit]
  46. Affan, H.; El Haddaji, B.; Ajouguim, S.; Khadraoui, F. A review—Durability, mechanical and hygrothermal behavior of building materials incorporating biomass. Eng 2024, 5, 55. [Google Scholar] [CrossRef] [Scilit]
  47. Boukachabia, M.; Bendjeffal, H.; Bouaroudj, T.; Djebli, A.; Riant, O. Natural pozzolan as a novel heterogeneous catalyst for the synthesis of alkylaminophenols. J. Organomet. Chem. 2025, 1033, 123635. [Google Scholar] [CrossRef] [Scilit]
  48. Hamdi, O.M.; Boumaza, A.; Alioui, H.; Moretti, L.; Douadi, A.; Hebbache, K.; Ahmed-Chaouch, A. Response surface methodology to model the effects of key synthesis parameter interactions on mechanical and microstructural properties of natural pozzolan-based geopolymers. Constr. Build. Mater. 2025, 478, 141411. [Google Scholar] [CrossRef] [Scilit]
  49. Nassiri, O.; Mahboub, I.; Ibnoussina, M.; Moukmir, O.; El Amrani, A.; Mazirh, K.; Ammari, A.; El Cheickine, I. Physico-mechanical, structural, and mineralogical analysis of composite concrete incorporating hydraulic lime and pozzolan. Constr. Build. Mater. 2024, 437, 136804. [Google Scholar] [CrossRef] [Scilit]
  50. Rojas-Martínez, A.E.; González-López, J.R.; Guerra-Cossío, M.A.; Hernández-Carrillo, G. Sulphate-based activation of a binary and ternary hybrid cement with Portland cement and different pozzolans. Constr. Build. Mater. 2024, 421, 135683. [Google Scholar] [CrossRef] [Scilit]
  51. Kasaniya, M.; Thomas, M.D.; Moffatt, T.; Hossack, A. Significance of fineness of pozzolans in determining pozzolanic reactivity. Cement 2025, 19, 100137. [Google Scholar] [CrossRef] [Scilit]
  52. ASTM C311; Standard Test Methods for Sampling and Testing Fly Ash or Natural Pozzolans for Use in Portland-Cement Concrete. ASTM International: West Conshohocken, PA, USA, 2018.
  53. ASTM C618; Standard Specification for Coal Fly Ash and Raw or Calcined Natural Pozzolan for Use in Concrete. ASTM International: West Conshohocken, PA, USA, 2019.
  54. Santos, F.J.; de Brito, J.; Evangelista, L. Mechanical performance of mortars with natural pozzolan additions: Compressive and flexural strength development. Constr. Build. Mater. 2018, 189, 1030–1041. [Google Scholar]
  55. Kapeluszna, E.; Kotwica, Ł. New insights into the role of highly reactive pozzolans in the early hydration process of C3S and C3A monitored by conductometry, calorimetry, phase composition, and microstructure analyses. Constr. Build. Mater. 2024, 452, 138950. [Google Scholar] [CrossRef] [Scilit]
  56. Wahedy, M.N.; Sharbatdar, M.K.; Rezaifar, O. Mechanical, environmental, and economic assessment of sustainable cement mortar using Afghan natural pozzolan as a partial replacement for cement. Constr. Build. Mater. 2023, 386, 131574. [Google Scholar] [CrossRef] [Scilit]
  57. Laguna-Torres, C.A.; González-López, J.; Guerra-Cossío, M.; Guerrero-Baca, L.; Chávez-Guerrero, L.; Figueroa-Torres, M.; Zaldívar-Cadena, A. Effect of physical, chemical, and mineralogical properties for selection of soils stabilized by alkaline activation of a natural pozzolan for earth construction techniques such as compressed earth blocks. Constr. Build. Mater. 2024, 419, 135449. [Google Scholar] [CrossRef] [Scilit]
  58. Bediako, M.; Valentini, L. Strength performance and life cycle assessment of high-volume low-grade kaolin clay pozzolan concrete: A Ghanaian scenario. Case Stud. Constr. Mater. 2022, 17, e01679. [Google Scholar] [CrossRef] [Scilit]
  59. Agra, T.M.S.; Lima, V.M.E.; Basto, P.E.A.; Melo Neto, A.A. Characterizing and processing a kaolinite-rich water treatment sludge for use as high-reactivity pozzolan in cement manufacturing. Appl. Clay Sci. 2023, 236, 106870. [Google Scholar] [CrossRef] [Scilit]
  60. Hamada, H.M.; Abdulhaleem, K.N.; Majdi, A.; Al Jawahery, M.S.; Thomas, B.S.; Yousif, S.T. The durability of concrete produced from pozzolan materials as a partially cement replacement: A comprehensive review. Mater. Today Proc. 2023. [Google Scholar] [CrossRef] [Scilit]
  61. Firdous, R.; Stephan, D.; Djobo, J.N.Y. Natural pozzolan-based geopolymers: A review on mechanical, microstructural, and durability characteristics. Constr. Build. Mater. 2018, 190, 1251–1263. [Google Scholar] [CrossRef] [Scilit]
  62. Arairo, W.; Khatib, M.; Affan, H.; Tehrani, F.F.; Absi, J.; Sraj, O.; Saba, M. Experimental and analytical investigation for mechanical behaviour of vegetable fiber reinforced concrete. Eur. J. Environ. Civ. Eng. 2024, 29, 1345–1366. [Google Scholar] [CrossRef] [Scilit]
  63. Khatib, J.M.; Wild, S. Porosity and durability of pozzolan-modified cement systems. Cem. Concr. Res. 1996, 26, 721–733. [Google Scholar]
  64. Thomas, M.D.A. Optimizing the use of supplementary cementitious materials in concrete. Concr. Int. 2007, 29, 47–52. [Google Scholar]
  65. Los Santos-Ortega, J.; Fraile-García, E.; Ferreiro-Cabello, J. Environmental and economic viability of using concrete block wastes from a concrete production plant as recycled coarse aggregates. Materials 2024, 17, 1560. [Google Scholar] [CrossRef] [Scilit]
  66. Los Santos-Ortega, J.; Ferreiro-Cabello, J.; Fraile-García, E.; Somovilla-Gómez, F. Applying the life cycle assessment to the use of biochar from vine pruning waste as an additive in mortar. Materials 2025, 18, 5573. [Google Scholar] [CrossRef] [Scilit]
  67. Los Santos-Ortega, J.; Fraile-García, E.; Ferreiro-Cabello, J. Environmental assessment of the use of ground olive stones in mortars: Reduction of CO2 emissions and production of sustainable mortars for buildings. Environ. Impact Assess. Rev. 2025, 110, 107709. [Google Scholar] [CrossRef] [Scilit]
  68. Los Santos-Ortega, J.; Fraile-García, E.; Ferreiro-Cabello, J. Methodology for the environmental analysis of mortar doped with crumb rubber from end-of-life tires. Constr. Build. Mater. 2023, 399, 132519. [Google Scholar] [CrossRef] [Scilit]
  69. Huang, B.; Ye, G.; Gong, J. Mechanical properties of cement mortars containing natural pozzolan: Compressive and flexural strength correlations. Constr. Build. Mater. 2017, 149, 526–535. [Google Scholar]
  70. Li, G.; Zhao, Z.; Ma, Y. Influence of pozzolan content on the early and long-term mechanical properties of blended cement mortars. Cem. Concr. Compos. 2019, 104, 103393. [Google Scholar]
  71. Azimi, N.; Schollbach, K.; Oliveira, D.V.; D’Antino, T.; Lourenço, P.B. Durability of natural hydraulic lime–pozzolan mortars for TRM strengthening systems under acidic aging: Linking microstructural degradation to mechanical performance via chemo-mechanical modeling. Constr. Build. Mater. 2025, 500, 144244. [Google Scholar] [CrossRef] [Scilit]
  72. Al-Massri, G.; Ghanem, H.; Khatib, J.; Kırgız, M.S.; Elkordi, A. Chemical shrinkage, autogenous shrinkage, drying shrinkage, and expansion stability of interfacial transition zone material using alkali-treated banana fiber for concrete. J. Struct. Integr. Maint. 2024, 9, 2390650. [Google Scholar] [CrossRef] [Scilit]
  73. Pipilikaki, P.; Katsioti, M. Study of the hydration process of quaternary blended cements and durability of the produced mortars and concretes. Constr. Build. Mater. 2009, 23, 2246–2250. [Google Scholar] [CrossRef] [Scilit]
Figure 1. (a) Washed sand with particle size range 0/4 mm; (b) Portland cement (CEM II/A-52.5R); (c) natural pozzolan.
Infrastructures 11 00067 g001
Figure 2. Sand particle distribution.
Infrastructures 11 00067 g002
Figure 3. F3 test specimens.
Infrastructures 11 00067 g003
Figure 4. Illustration of water-accessible porosity process.
Infrastructures 11 00067 g004
Figure 5. (a) Flexural strength test; (b) compressive strength test.
Infrastructures 11 00067 g005
Figure 6. Three-parameter model for resistance–age evolution. (The dotted line indicates the reference baseline for strength development, highlighting the difference between early-age strength evolution and the asymptotic strength level).
Infrastructures 11 00067 g006
Figure 7. Water-accessible porosity of mortar mixes with different pozzolan replacement levels.
Infrastructures 11 00067 g007
Figure 8. Bulk density of mortar mixes with different pozzolan replacement levels (kg/m3).
Infrastructures 11 00067 g008
Figure 9. Compressive strength of mortar mixes with different pozzolan replacement levels.
Infrastructures 11 00067 g009
Figure 10. Compressive strength characteristics of mortar mixes with different pozzolan replacement levels.
Infrastructures 11 00067 g010
Figure 11. SAI of mortar mixes with different pozzolan replacement levels.
Infrastructures 11 00067 g011
Figure 12. Flexural strength of mortar mixes with different pozzolan replacement levels.
Infrastructures 11 00067 g012
Figure 13. WA of mortar mixes with different pozzolan replacement levels at 28 d.
Infrastructures 11 00067 g013
Figure 14. % increase in WA at 28 d of mortar mixes with different pozzolan replacement levels.
Infrastructures 11 00067 g014
Figure 15. Modeling of capillary–diffusive process of mortar mixes with different pozzolan replacement levels at 28 d.
Infrastructures 11 00067 g015
Figure 16. CWA parameters of mortar mixes with different pozzolan replacement levels at 28 d.
Infrastructures 11 00067 g016
Figure 17. Embodied carbon of different formulation in kg CO2e/m3.
Infrastructures 11 00067 g017
Figure 18. Correlation between compressive strength and flexural strength.
Infrastructures 11 00067 g018
Figure 19. Correlation between compressive strength and M/A.
Infrastructures 11 00067 g019
Table 1. Natural washed sand properties.
DensityWater AbsorptionSand EquivalentpH
2590 kg/m31.1%81.39.00
Table 2. Physical and chemical characteristics of CEM-II/A-LL 52.5 R cement.
PropertyValue
Clinker (%)80–94
Limestone (%)6–20
SO3 (%)<4
MgO (%)0.29
Na2O (%)<0.1
Cl (%)<0.1
Apparent density (kg/m3)3100
Specific surface area (cm2/g)5373
Initial setting time45 min
Compressive strength 2 d (MPa)≥30
Compressive strength 28 d (MPa)≥52.5
Table 3. Pozzolan physico-chemical properties.
PropertyValue
SiO2 (%)59.82
Al2O3 (%)17.60
Fe2O3 (%)6.52
CaO (%)4.41
MgO (%)2.36
Alkaline (Na2O + K2O) (%)7.28
Other oxides (%)1.79
Density (kg/m3)2760
Specific surface area (cm2/g)5500–6000
Loss on ignition (wt.%)5.25
SO3, CO2, Cl, Cr2O3, MnO, TiO2, P2O5.
Table 4. Mix proportions.
Quantities (kg/m3)
Mix CodeCementPozzolanSandWater
F039301179197
F1345481179197
F2310831179197
F32511421179197
F41732201179197
Disclaimer/Publisher’s Note: The statements, opinions and data contained in all publications are solely those of the individual author(s) and contributor(s) and not of MDPI and/or the editor(s). MDPI and/or the editor(s) disclaim responsibility for any injury to people or property resulting from any ideas, methods, instructions or products referred to in the content.