Article

The Prerequisites for Development of LNG/CNG Filling Stations Network: The Crucial Role of Lithuania and the Baltic States in the North Sea–Baltic Sea Corridor


by
Laurencas Raslavičius
Department of Transport Engineering, Faculty of Mechanical Engineering and Design, Kaunas University of Technology, LT-51424 Kaunas, Lithuania
Infrastructures 2026, 11(2), 45; https://doi.org/10.3390/infrastructures11020045
Submission received: 11 December 2025 / Revised: 23 January 2026 / Accepted: 26 January 2026 / Published: 28 January 2026
(This article belongs to the Section Infrastructures and Structural Engineering)

Abstract

The multimodal North Sea–Baltic corridor, consisting of 6934 km of road, is an integral part of the EU’s trans-European transport network. However, an unsatisfied level of development of alternative fuels infrastructure for road transport is considered one of the obstacles to connecting northern Member States and North-East countries. A “what-if” scenario was employed to obtain useful insights into how a given situation might be handled, and a comparison of several paths forward to make better decisions was analysed. Environmental insights for transportation sector scenarios in 2030–2035 were explored and analysed using the COPERT v5.5.1 software program. In this study, the installation of natural gas infrastructures of various station sizes and with varying capacities and types of natural gas (LNG, CNG, bio-methane) dispensed was evaluated in detail. Replacement of the existing HDV fleet (heavy-duty vehicles) with LNG-powered trucks would result in the following investment to upgrade the existing network and build new stations to meet rising LNG demand: from €21.47 to €32.3 million (the scenario of 10% market share for HDVs running on LNG), €42.94 to €64.6 (20%), and €64.4 to €96.9 (30%). The dual-fuel 10–diesel fuel 90% scenario seems to be the safest option for a large-scale investment until 2035 which may lead to moderate emission savings of 84.6 kton CO2 eq. compared to 2022 levels.

1. Introduction

Among all the core network corridors, the 3.200 km long North Sea–Baltic corridor has the potential of becoming one of the most economically diverse corridors in the European Union. It has 16 core network airports, 13 core network seaports, 18 inland core network ports, and 17 core network railway terminals. The corridor connects the capitals of all eight countries, namely Helsinki, Tallinn, Riga, Vilnius, Warsaw, Berlin, Brussels, and Amsterdam [1]. As documented in [2], in 2017, only 10% of the total freight flows between the Rail Freight Corridor North Sea–Baltic (NRFC NS-B) Member States were moved by rail. Rail freight transport was particularly significant for origin-destination relations involving the Czech Republic. Road transport played an important role for most of the routes between the RFC NSB Member States, accounting for 47% of total throughput [2].
Ref. [3] presents three future scenarios for NS-B, which were built exceptionally on infrastructure developments and socio-economic considerations. Based on policy developments such as internationalization of road pricing, incentives of combined transport operations, and market sensitivity to energy transitions, the study discusses Reference (or Background), Projects, and Sensitivity situations. The first scenario correlates well with the prognoses of the EU 2020–2050 References Scenario [4] and indicates the highest volume of 33 million tonnes for road cargo compared to the base year of 2022 (29 million tonnes) [3]. The Projects scenario considers the largest ongoing projects, including Rail Baltica and Fehmarnbelt, which are assumed to be completed before or in 2030. This scenario suggests that the planned improvement of the railway infrastructure will allow us to maintain very similar tonnages (32 million tonnes) carried out by road transport, compared to the assumptions of the Background scenario [3]. The least promising scenario (Sensitivity) for road freight (31 million tonnes) assumes the expected maximum growth for rail transport [3], which is expected to increase rail cargo from 29 million tonnes for the base year scenario to 40 million tonnes. In the prognostic assessment of NS-B, the rail has a growth of 12%, and the road carriage has a growth of 13% [4]. This is in line with the GDP growth for the EU27, which is 17% [3,4]. Despite the so-called disproportion between rail and road cargo in the dynamics of freight movement through Priority Axis No. 2 of the TEN-T [5,6,7] and the railway lines of Norway (an observer country of the Baltic Energy Market Interconnection Plan) [8,9], the aspects of road transportation remain less documented in the scholarly literature compared to railways [10,11].
An in-depth comparative analysis performed for EU counties, including these belonging to the NS-B corridor [12], investigates the operational efficiency and sustainability performance of transportation investments. Investments in road transport, employment, and total energy consumption, among others, were set as input, while freight kilometres and passenger kilometres were set as on output. From the list of NS-B corridor countries, Belgium consistently outperformed other countries in energy efficiency between 2016 and 2021. This superior performance can be attributed to an optimized balance between investment and employment, as well as the ability to generate large volumes of freight and passenger transport with relatively lower energy consumption [12]. In contrast, Finland, despite having advanced transport infrastructures and strong environmental policies, registered fluctuating or below-average efficiency scores, pointing to possible diminishing marginal returns or underutilised capacity [12]. Germany, although it handles large volumes of transport, was ranked lower due to its relatively higher total emissions, which reduces its overall sustainability scores [12]. The study has found that Latvia and Lithuania may face additional challenges such as ageing transport fleets, limited investment capacity, and weaker institutional frameworks for sustainability governance [12].
Natural gas is already widely used as a transportation fuel for passenger cars and medium duty trucks, including classes 4 to 6 urban last mile delivery trucks and classes 7 to 8 short-haul drayage trucks [13]. LNG is being developed for long-haul freight applications [13]. Road freight represents 75% of the volume of freight in the European Union (EU) and accounts for 30% of total EU on-road greenhouse gas emissions [14,15]. By 2030, its contribution to EU on-road emissions is projected to increase to 40% without any additional policy [14,15]. However, local regulations and economic incentives have helped to spur the adoption of natural gas vehicles in certain heavy-duty vocations [16]. One of the most in-depth studies describing the validated probabilistic approach to determine the total cost of ownership of LNG-powered freight transport operating in the UK in a variety of scenarios is presented in [17]. This study considers the capital costs for two modular storage tank versions proposed in [18] that restrict refuelling stations to specific configurations: €575,000 for a station that serves 20 heavy-duty vehicles (HDVs) and €863,000 for a station serving up to 40 HDVs.
The Total Cost of Ownership Model for low-carbon heavy-duty vehicles in Finland that run on liquid biomethane was assessed in-depth as guiding analysis in [19]. A specific example of Finland, as one of the northernmost corridor countries of the European TEN-T network, indicates that liquid biomethane can be cost competitive in specific scenarios without policy support incentives, characteristic to alternative fuel vehicles. This information is valuable for transport companies considering sustainable fleet investments in the current regulatory landscape. The limited or locally non-existent market development for CNG in the Italian region is analysed to promote the development of refuelling stations [20]. According to the conclusions made, subsidies should be more specifically targeted to critical areas to be efficient. This means that areas with higher demand are more attractive to investors compared to areas without stations.
Based on industry reports and trends, the size of the light- and heavy-duty natural gas vehicle market in 2025 is approximately €12.9 billion [21]. Considering a conservative annual rate of return (CAGR) of 8%, which reflects the gradual but steady adoption of NGV in various sectors of transportation, the market is projected to reach approximately €24.1 billion by 2033 [21]. This growth is forced by several factors. Firstly, governments worldwide are implementing stricter emission standards, making NG HDVs a more attractive alternative to diesel-powered vehicles, particularly in public transportation and logistics [21]. Secondly, the unstable and often high price of diesel fuel presents a persuasive economic case for switching to comparatively cheaper natural gas. Segment-wise, the NG HDV segment is predicted to dominate the market share, fuelled by the significant gains in fuel efficiency achievable in long-haul trucking and public transportation fleets [21]. Furthermore, the initial investment costs associated with NGV technology might deter some potential buyers [21,22,23], although these costs are gradually becoming more competitive [21]. Innovation within the sector centres on improving fuel efficiency, extending vehicle range, and enhancing refuelling infrastructure. Advances in engine technology (for example, dual-fuel engines), the development of lighter weight composite materials for vehicles, and the deployment of telematics for optimised fleet management were among the key innovations’ spectra [21,22].
It is worth noting that this study is not based on results of the Flow-Refuelling Location Model, which usually uses a two-stage approach: it generates combinations of locations capable of serving the round trip on each route and then locates facilities to maximise flow refuelled given feasible combinations [24]. NG station viability depends strongly on utilisation rates, gas price, capital cost, fleet procurement policies, and other factors. In this case, FRLM does not predict capacity or operational constraints, cases when refuelling is local, or cases when multi-energy ecosystems must be compared. Notwithstanding these facts, FRLM remains a powerful tool to complement summative assessments of road freight transport [24,25], while in this study, the evaluation was considered mainly by norm references.
To sum up what has been said, the joint refuelling infrastructure in Estonia, Latvia, and Lithuania is expected to enable cross-border gas flows and support the wider Baltic Energy Market Interconnection Plan (BEMIP) [9], which aims to eliminate isolated gas markets and improve regional energy security. Infrastructure such as CNG and LNG refuelling points could support the creation of a more integrated regional natural gas market, enhancing competition, interoperability, and cost efficiency. CNG refuelling stations are highlighted in many reports as part of climate policy efforts in Latvia [26,27,28] and other Baltic states [29,30] to support adoption of natural gas vehicles, which are seen as transitional technologies toward lower emission transport. The Baltic region, being a part of the TEN-T Core Network’s eastern axis, currently includes major freight and passenger routes between Scandinavia, the Baltics, and Central Europe [9]. Refuelling stations for CNG and LNG along this axis is expected to reduce “refuelling gaps” and enable long-distance travel of heavy-duty vehicles and ships along these corridors. Without stations in Estonia, Latvia, and Lithuania, network continuity and compliance with EU infrastructure targets will be evidently weakened. Moreover, the study accomplished by the U.S. Department of Energy on Analysis of Small-Scale LNG Market Potential in the Baltic States [31] concludes that the Baltic countries needa study to characterize the viability of LNG as a transportation fuel, the cost of building out the required supply network, and its competitive position compared to alternative fuels such as CNG and Bio-LNG, with an estimated impact of harmonised pricing on the market [31]. Hence, the purpose of this paper is twofold: first, to analyse the prospects of boosting the alternative fuel—natural gas (LNG, CNG, bio-methane)—infrastructure for road passenger and freight transport in Lithuania and, and second, to identify expected capital costs for three different expansion scenarios. This article aims to help lay the foundation for the design of strategies and solutions to overcome the challenges involved in securing the mobility of people and goods and reducing the unsustainable impacts of freight transport [32]. The rest of the paper is organised as follows. Section 1 introduces the importance of freight transport within the North Sea–Baltic corridor of the Trans-European Transport Network (TEN-T). In Section 2, we describe our research methodology. Section 3 presents the results, and Section 4 discusses the implications of the research leading to the assessment of internal factors that might affect the expansion of infrastructure (strengths and weaknesses) and external factors (opportunities and threats). Finally, the conclusions are presented in Section 5.

2. Materials and Methods

2.1. Spatial Analysis

The assessment of the CNG and LNG infrastructure in the North Sea–Baltic corridor follows a structured, multi-criteria methodological framework. The method integrates spatial analysis (Section 3.1), technical evaluation, demand analysis, and policy alignment to determine infrastructure adequacy and development needs. It identifies existing CNG and LNG infrastructure in the European Countries by putting special emphasis on the existing situation within the NSB corridor. Further on, it maps refuelling stations and intermodal nodes using geospatial data and examines network coverage and continuity to ensure uninterrupted operation along the corridor.

2.2. The Inputs for “What-If” Scenario

The scientific literature-grounded description of key input parameters for “what-if scenario” analysis [33,34,35] is presented below. The study relies on scientific modelling practice, focusing on parameters explicitly used in scenario-based planning, optimisation, or demand forecasting in the context of NG refuelling infrastructure [36,37,38]. The selected influencing factors, those directly or indirectly affecting the development of alternative fuels infrastructure, are examined in each Section 2.2, Section 2.3, Section 2.4, Section 2.5 and Section 2.6, Section 3.2 and Section 3.3 of the later chapters to derive precise and technically grounded insights:
1. Demand and adoption parameters
1.1. Technical regulations (see Section 2.3, Section 2.4 and Section 2.5)
  • Maximum vehicle range and refuelling intervals affect how frequently vehicles need to refuel and hence the spacing/density of stations in proposed scenario.
  • Daily NG consumption per vehicle class—a key input to determine fuelling demand under selected scenario (passenger cars vs. trucks).
  • Properties of CNG and LNG and features of their use.
1.2. NG vehicle penetration and demand forecasts (see Section 2.5, Section 3.1, and Section 3.4).
  • Time horizon is often scenario dependent and tied to policy, economic growth, and fleet renewal assumptions.
  • Fuel demand projections (e.g., NG consumption per vehicle class) define different future penetration rates of NG-fuelled trucks, or vehicles by year or period, which directly drive station demand and are often expressed as scenario-specific demand vectors.
2. Operational and regulatory parameters
2.1 Candidate station capacities (see Section 2.6)
  • Station capacity parameters—storage capacity, number of dispensers, peak throughput; these capacities influence the number of vehicles served and are scenario inputs when testing expansion options.
  • Node capacity constraints—maximum service capacity at a given location, often parameterised as demand served per time period.
2.2 Station construction costs (see Section 2.6)
  • Cost per station type—investment vary across station technologies and are integral scenario parameters.
3. Vehicle and fleet characteristics (see Section 2.5, Section 3.1, Section 3.2 and Section 3.3)
  • Scenario definitions for fleet growth over time are based on historic trends and policy roadmaps.
  • Regulatory adoption drivers (e.g., emission standards) influence the trajectory of NG usage, which in turn alters demand input parameters across scenarios.
Country-specific data was obtained from both primary and secondary sources. A comprehensive review of R&D projects [39], reports [40], scientific literature [41], Lithuania’s energy policy documents [29,42], annual statistical reports [43,44], and relevant books [45], journals [46,47], and case studies from Lithuania [48] and the Baltic countries [26,28,31] provided the theoretical and methodological foundation for designing the data collection instruments and conducting the subsequent analysis.

2.3. The Projected Demand for Conventional Filling Stations (CFSs)

Table 1 shows that the highest density of the CFS network is in Kaunas, Šiauliai, and Marijampole. The smallest density is distinctive to Klaipėda, and Panevėžys. On average, there are two filling stations per 10,000 population [40].
Challenges facing petrol stations today:
(1) The number of petrol stations is directly influenced by the state’s tax policy. There are no official statistics on the total number of petrol stations in Lithuania. Measures are now being sought to increase the number of conventional filling stations (≥15% compared to 2010 levels) in three major cities of Lithuania out of seven and to improve driver service to avoid the shrinking of traditional fuel purchases and dwindling profits.
(2) The growing tax-to-GDP ratio, together with the increased taxation of credit institutions’ profits in Lithuania, is expected to prevent further expansion of the CFS network [26].
(3) With regard to passenger cars, the real transport balance is achieved, and expansion is not expected in the near future [40].
(4) It is planned that the LDV and HDV fleet will grow significantly in the coming years.
There is a projected need for expansion of the CFS network to unlock the potential of natural gas. Based on the requirements described in the Technical Regulation on Building (STR), the number of CFSs in Lithuanian cities is planned in such a way that one filling station would have to serve an average of not more than 1500 vehicles per day. The same document reveals that a more accurate number of CFSs is determined after preparing a special plan, which would assess and generalise the location of city and country roads, the existing CFS network, and the direction of the city, which tends to grow outward [40]. Concerning regulations on road freight, one large filling station on average can serve up to 500 heavy-duty vehicles powered by natural gas and 1000 light-duty vehicles.

2.4. Properties of Gaseous Fuels and Features of Their Use

CNG is usually stored in high-pressure containers at a pressure of 20–32 MPa (Table 2) [41].
All appliances designed to store or transport CNG must withstand 1.5–4.0 times higher pressure compared to the nominal gas pressure [49]; in addition, specific criteria for natural fuel gas must be established, mandatory for fittings, valves, hoses, controllers, and filters. Accordingly, metal alloys, plastics, galvanized aluminium, and copper alloys with more than 70 percent of copper are not suitable for use in the service of natural fuel gas because of insufficient hardness and resistance to corrosion, which are essential in using CNG. The main material for CNG pipelines and components is stainless steel, such as water and sulphatic admixtures, which can be present in CNG and are of a corrosive nature. Large stationary CNG storage tanks for fuel filling are usually made of steel and classified according to the standards and requirements established by technical supervision services [50]. Fire protection is the main criterion in the planning of any new CNG fuel filling station. LNG is produced by cooling natural gas and purifying it to the required amount of methane achieved. Liquefied natural gas is stored compressed in moderately isolated tanks at a temperature of −165 °C [53,54]. High pressure is not required to store LNG in a liquefied form at a low temperature, contrary to CNG. In case of a leakage, depending on temperature, LNG vapor can be heavier or lighter than air; therefore, vapor leaked from LNG tanks can accumulate in the upper and lower parts of the premises [54].

2.5. Assessment of COPERT-Based Emissions Calculation

The COPERT software was used to quantify emissions from on-road vehicle fleet in Lithuania (see Table 3).
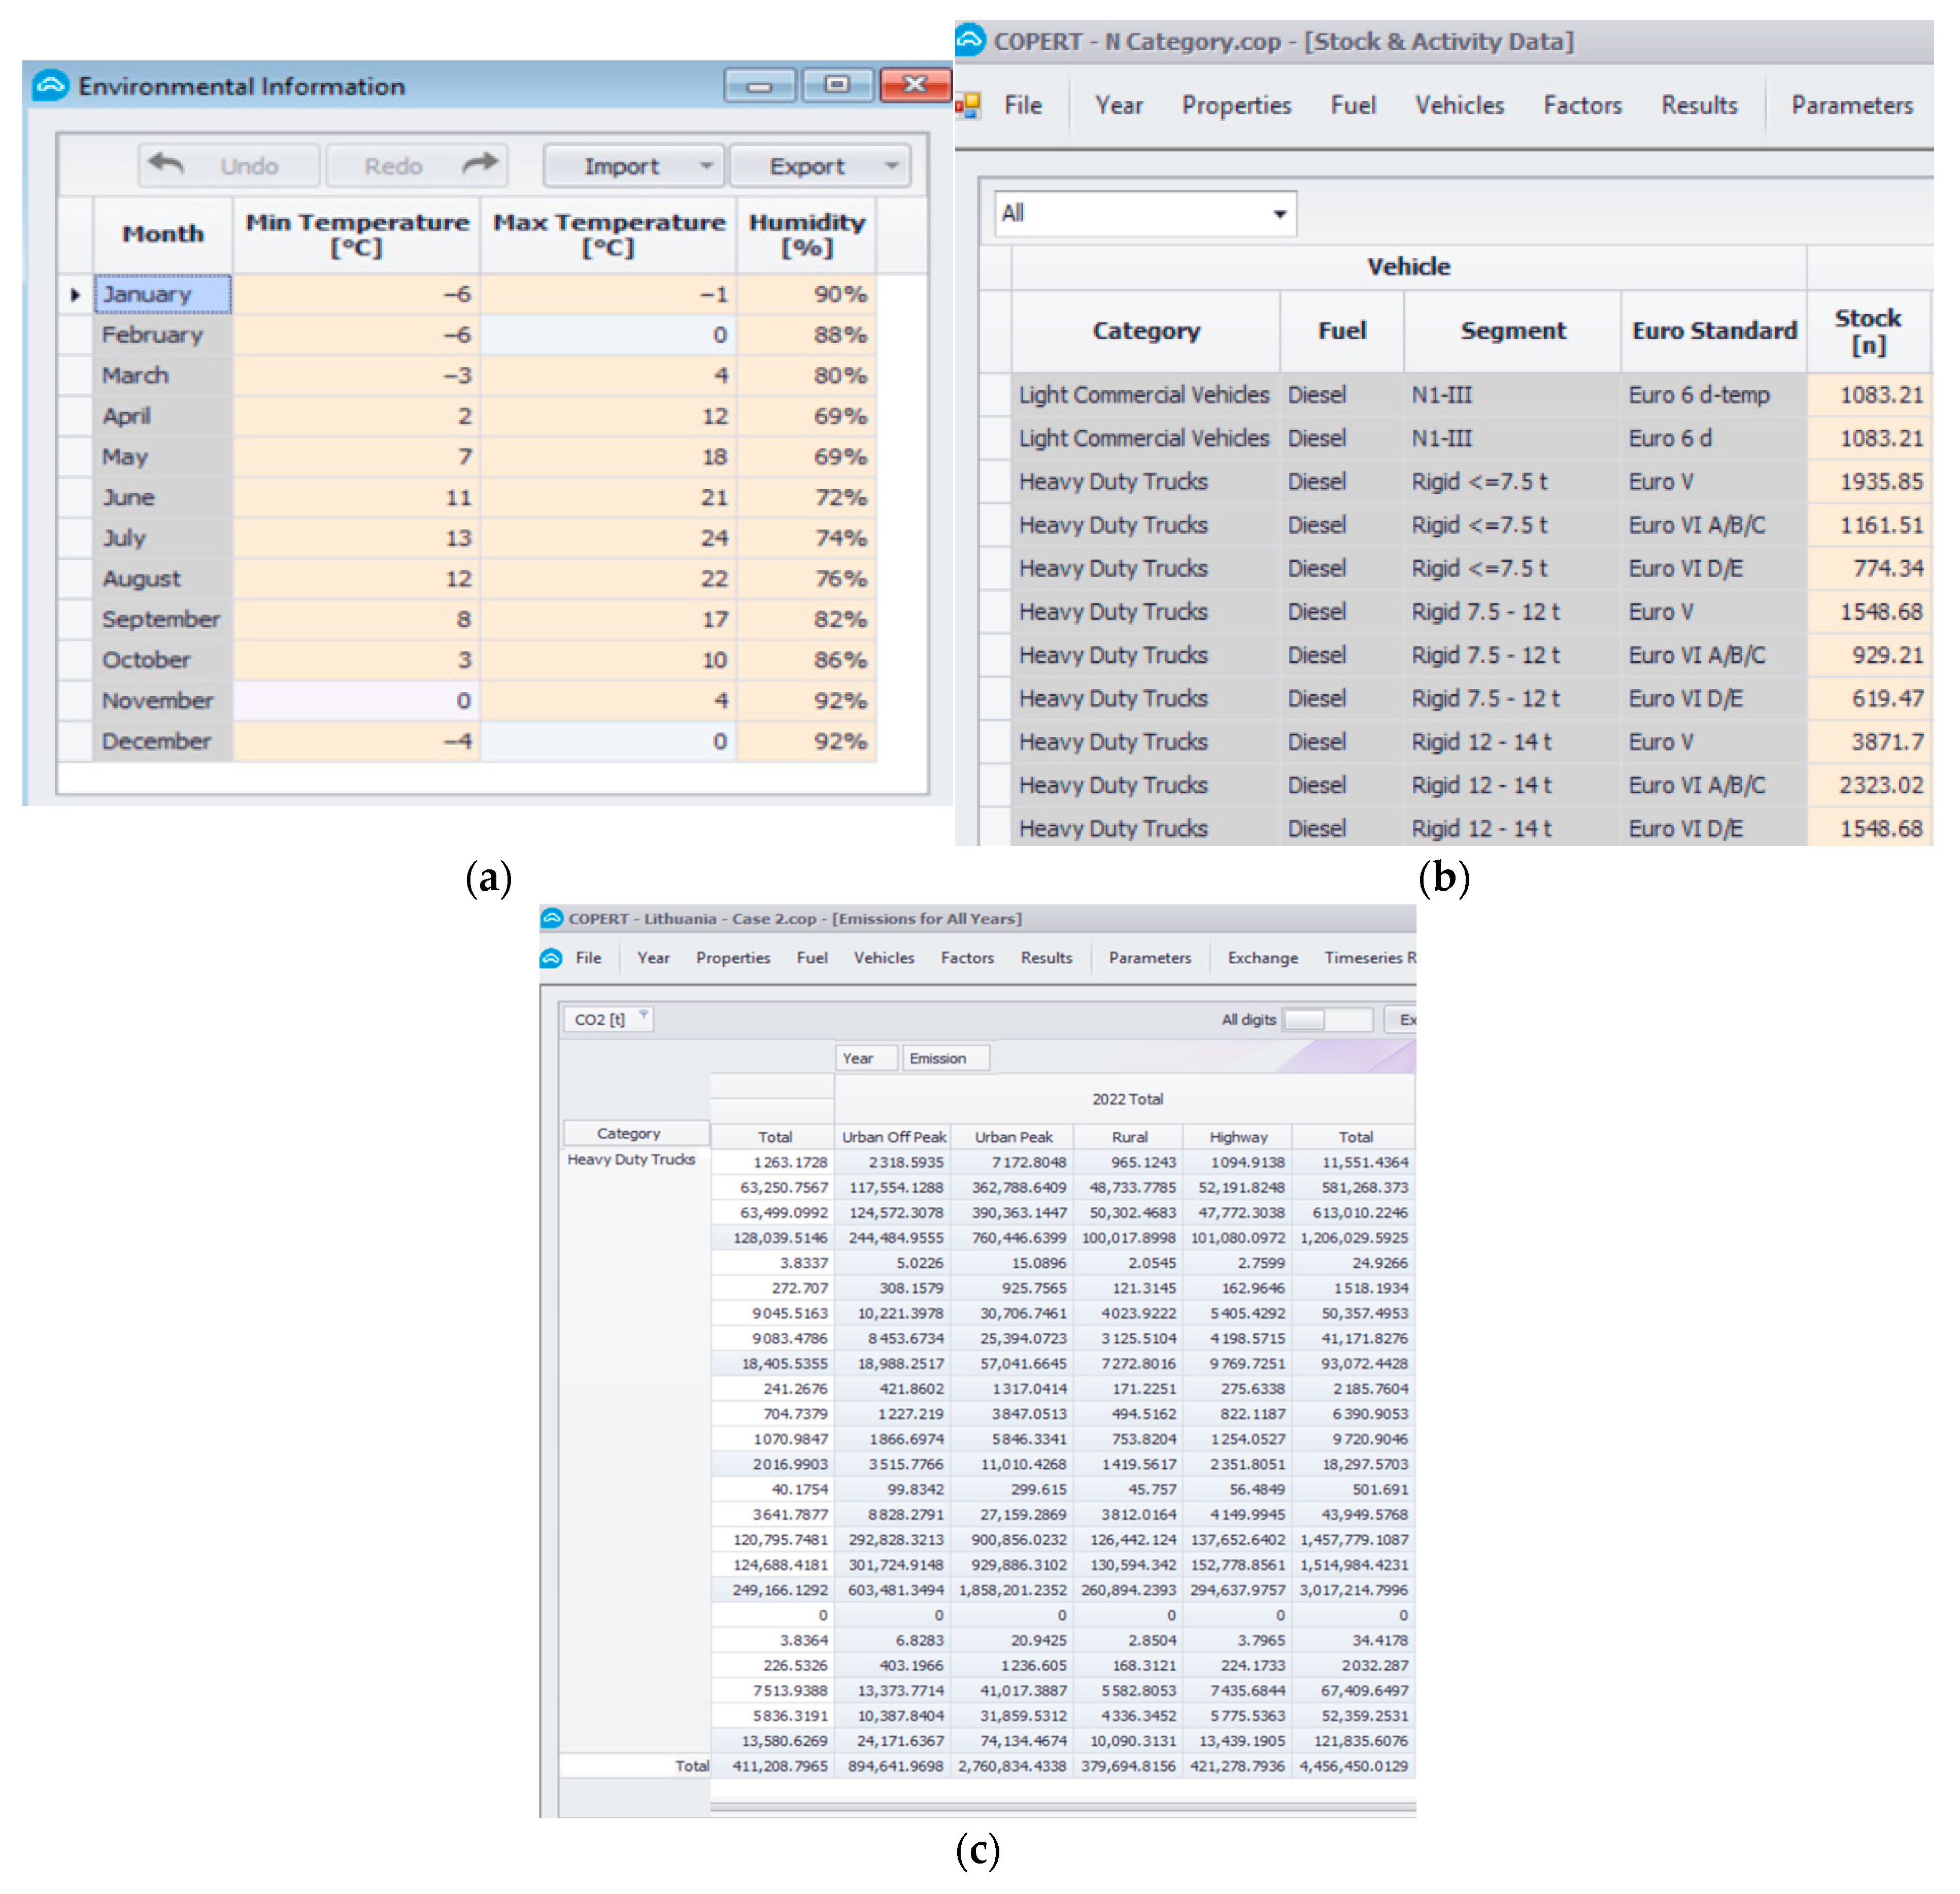
This software was developed under the supervision of the European Environment Agency (EEA) and is integrated with the CORINAIR emission inventory framework used by the member states of EEA [46]. The publicly available data from the State Enterprise Regitra [44] for 2022 shows that category N1 (light-duty trucks) with diesel engines accounts for 65,836 units, while the total stock of HDV categories N2 (35,451) and N3 (41,984) totals at 77,435 units (see Table 3) [55]. Conceptually, this allows us to calculate the transport sector emissions across various vehicle categories: passenger cars (PC), light-duty vehicles (LDVs), and heavy-duty vehicles (HDVs). These classifications served as the foundational structure for parameterising emission factors and activity data (Figure 1).
The number of commercial vehicles that took part in daily traffic (75%, see Table 3) was obtained from the official webpage of JC Via Lietuva, https://vialietuva.lt/en/traffic-volumes (accessed on 13 January 2024), presented in two broad categories: annual average daily traffic (AADT) on the national roads in 2022 (vehicle/day and heavy vehicle/day) and annual average daily traffic (AADT) on the main roads in 2022 (vehicle/day and heavy vehicle/day) [56]. The forecast for changes in freight transport volumes is based on findings presented in Lithuania’s Transport and Communications Development Strategy until 2050 [42]. The COPERT file was initially calibrated twice (for the years 2019 [57] and 2021 [58]) using the data of emissions from road transportation by types of vehicles as guidance. This helped to establish the correct distribution of the driving modes as a percentage expression that proportionally reflects the mobility habits within the cities and countryside areas. There is a need to emphasise that the Lithuania’s National Inventory Reports on GHG emissions for the period 1990–2023 were prepared using the analogous versions of COPERT software to assess the existing fleet.
For the assessment of scenarios, the tailpipe CO2 emissions from the entire LDV and HDV fleets were evaluated using a precondition, that exceptionally all commercial vehicles registered in Lithuania hit the roads each day. The total quantity of CO2 emissions was then multiplied by a factor of 0.75, corresponding to a ratio of vehicles participating in daily traffic to the total number of vehicles of certain category.
Specific contributions to different driving conditions for HDVs are as follows: urban peak—3% (3% for LDVs), urban off-peak—15–20% (50% for LDVs), rural—20–47% (47% for LDVs), and highway—30–67% (0% for LDVs) [55].
Therefore, as far as driving conditions are concerned, total emissions were calculated by means of the following equation [45]:
ETOTAL = EURBAN + ERURAL + EHIGHWAY
where EURBAN, ERURAL, and EHIGHWAY are the total emissions of any pollutant for the respective driving situations.
Emissions of CO2 were calculated on the basis of the amount and type of fuel sold and its carbon content:
E m i s s i o n = [ F u e l a · E F a ]
in which Emission denotes the emission of CO2 (kg), Fuela is fuel sold (TJ), EFa is the emission factor (kg/TJ), and a is the type of fuel (natural gas, petrol, diesel, etc.)
The emission equation for CH4 and N2O for Tier 3 is as follows (emission factor assumes full oxidation of the fuel):
E m i s s i o n = a , b , c , d [ D i s t a n c e a , b , c , d · E F a , b , c , d ] + a , b , c , d C a , b , c , d
in which Emission denotes the emission of CH4 or N2O, EFa,b,c,d is the emission factor (kg/km), Distancea,b,c,d is the distance travelled during the thermally stabilised engine operation mode (km), Ca,b,c,d are the cold-start emissions (kg), and a, b, c, d are the vehicle types. For interpretation of calculation outcomes, it was assumed that releasing 1 kg of CH4 into the atmosphere is about equivalent to releasing 84 kg of CO2. Methane’s 100-time horizon global warming potential (GWP) is about 28 × CO2—but it only persists in the atmosphere for a little more than a decade. The 100-year GWP is used to derive CO2 eq.

2.6. Estimated CNG and LNG Station Costs

Table 4 presents the estimated cost ranges for the infrastructure of CNG and LNG fuelling stations, including engineering design, equipment specification, and system installation under standardised technical assumptions. These cost projections exclude expenditures associated with non-standard site conditions, complex permitting processes, compressor-system redundancy, and other engineering-related contingencies that could increase overall capital costs [59].
Actual station costs may deviate considerably from the indicative values due to system-specific performance requirements and site-dependent engineering constraints. The configuration of a fuelling station is determined primarily by its operational load parameters, specifically the number of vehicles served, their fuel throughput rates, and their drive cycle characteristics, which collectively define fuelling-demand profiles and temporal load distributions. Stations that must accommodate high vehicle densities or narrow and unpredictable fuelling windows typically require higher-capacity compressors, increased high-pressure storage capacity, and/or a larger number of dispensing units to maintain specified flow rates and system availability [59].
Technical and operational differences between public, private, and hybrid access station models may also influence system configuration and cost, although ancillary requirements such as liability insurance for public access facilities fall outside the scope of engineering cost analysis. Furthermore, this assessment does not include geotechnical evaluation, site development activities, or civil works requirements associated with the installation of a CNG or LNG station [35,36].

3. Results

3.1. Contrasting Inequalities in Infrastructure Access Across Regions and Infrastructure Types

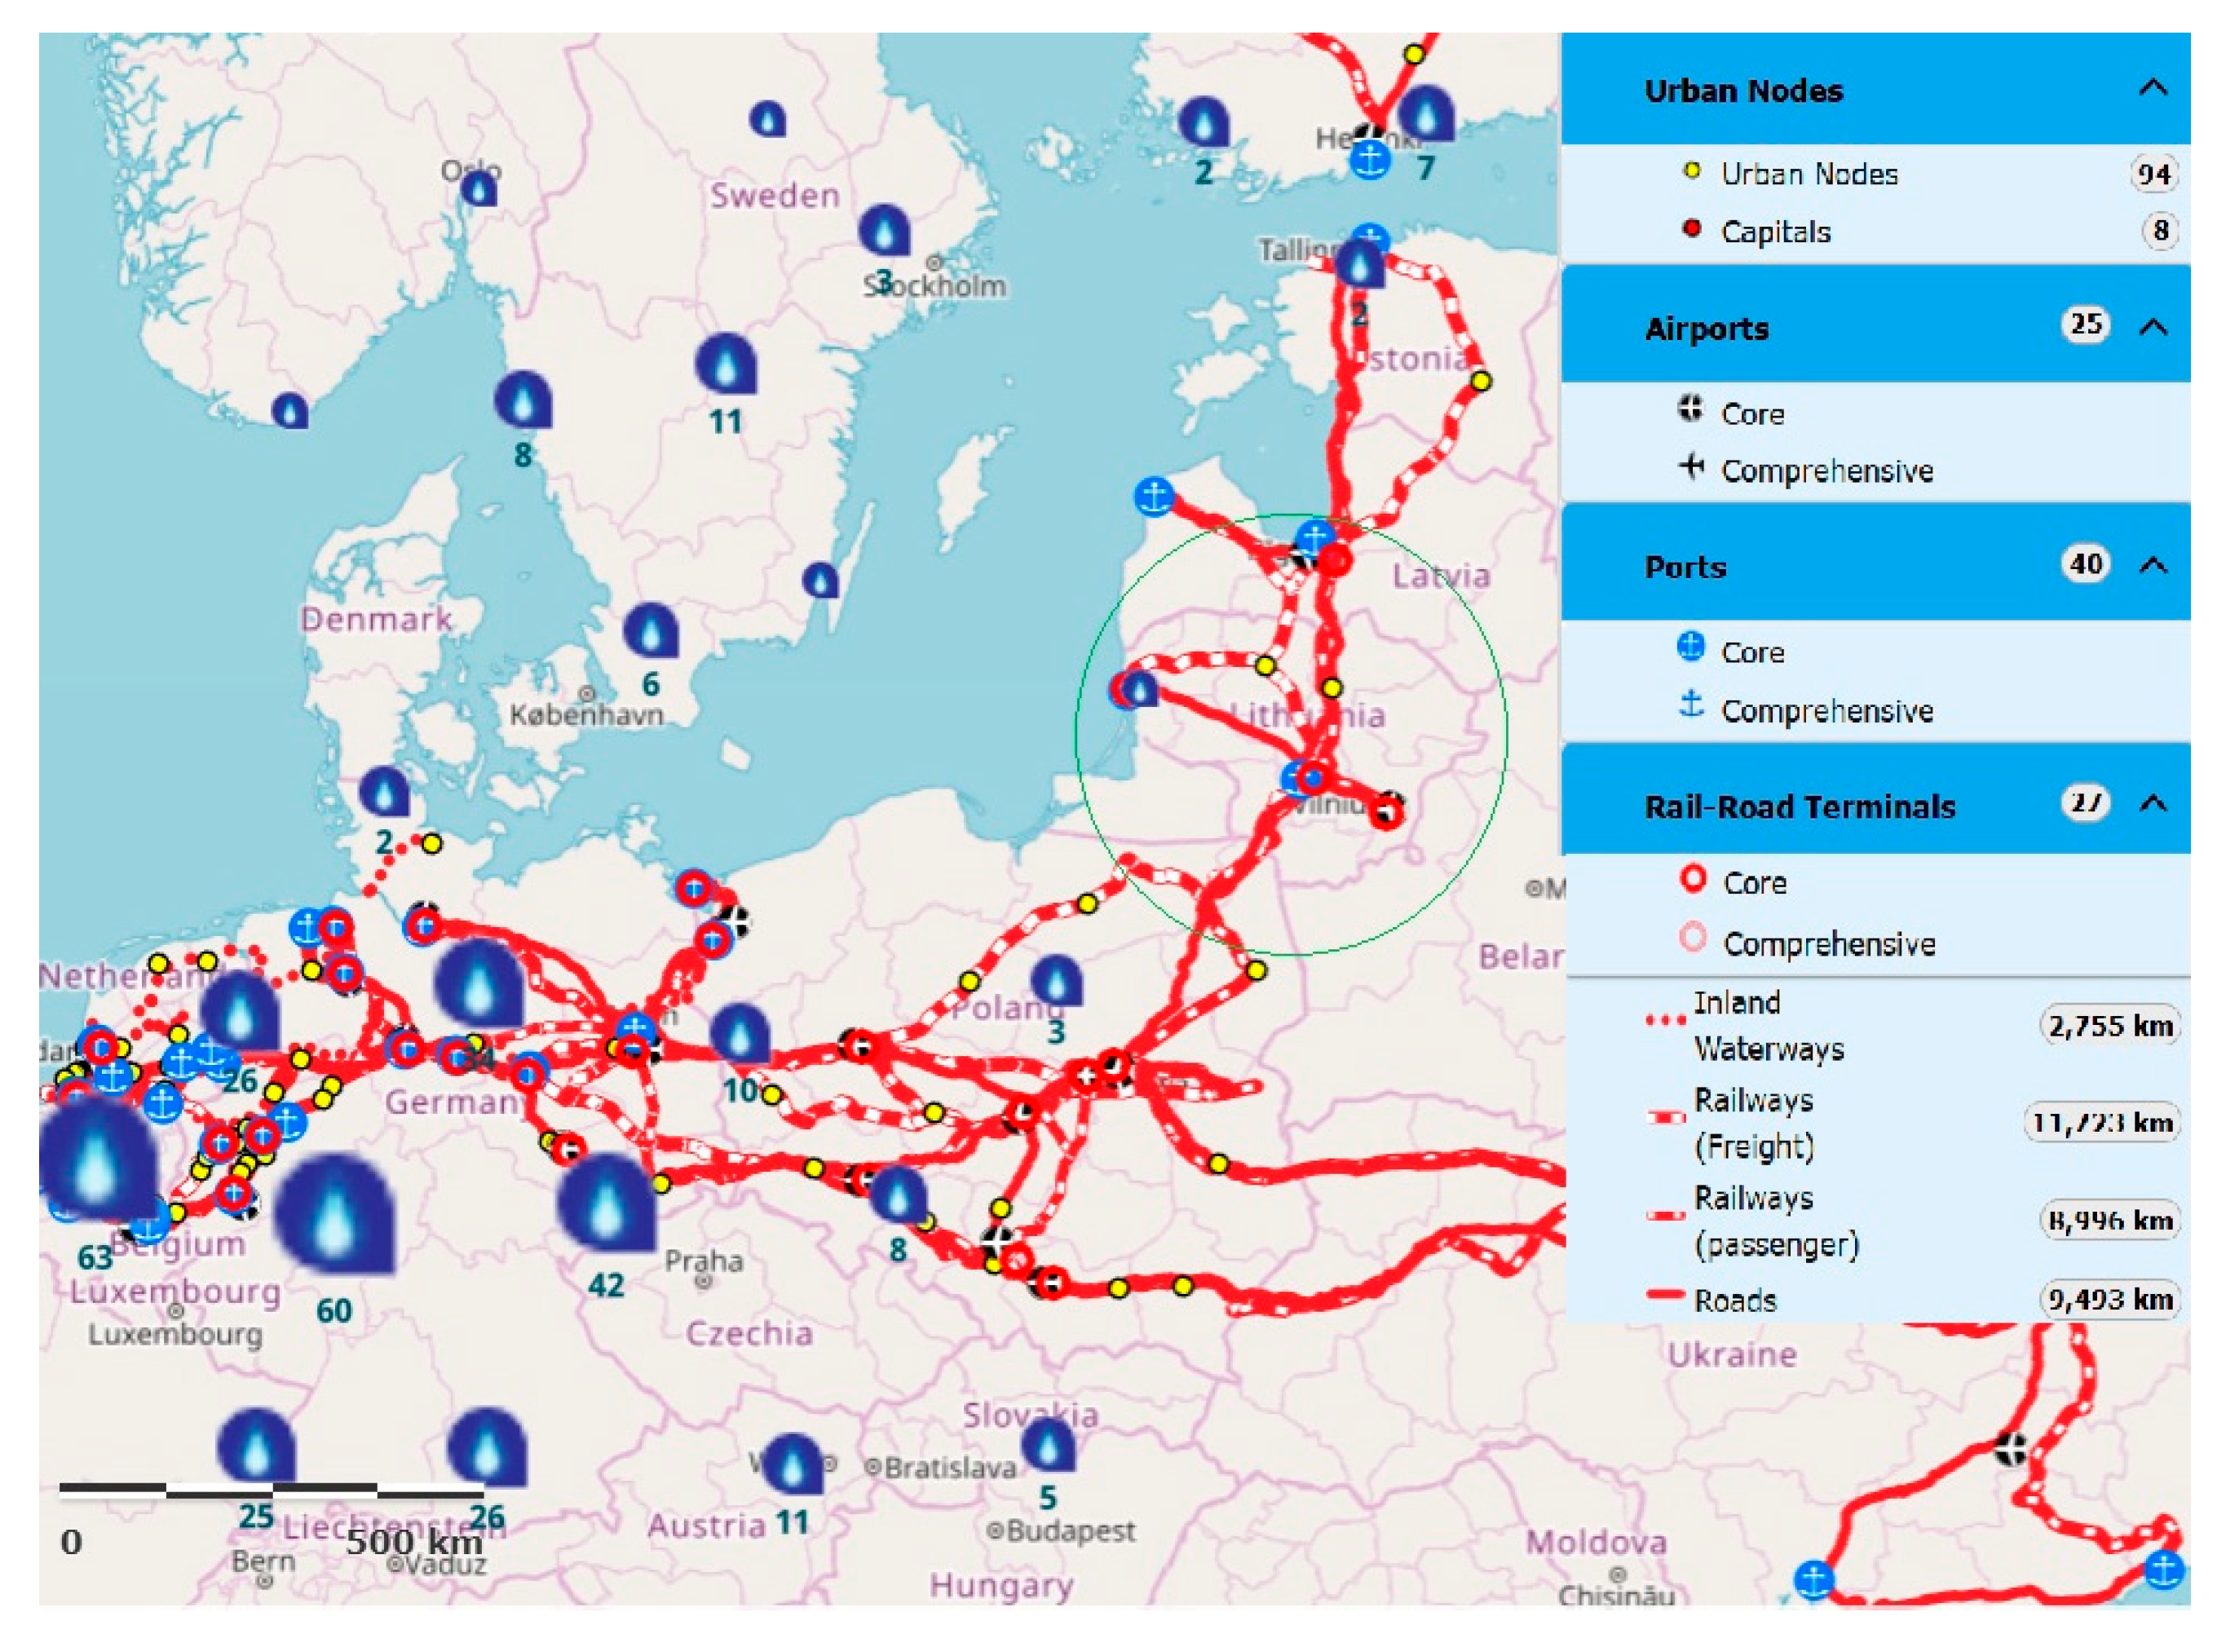
The development of CNG and LNG infrastructure in the country should be evaluated from a long-term perspective, while also considering the experience of neighbouring states. The North Sea–Baltic Sea Trans-European Transport corridor passes through the territory of Lithuania. The most significant links within this corridor include Rail Baltica, Via Baltica, and Via Carpathia, which connect the Baltic region with western and southern Europe through Poland. The North Sea–Baltic Sea corridor of the Trans-European Transport Network (TEN-T) is presented in Figure 2. This corridor is multimodal and connects the Baltic Sea region with the North Sea countries, thus enhancing the accessibility of northern EU Member States and strengthening transport connectivity between the North West and North East of the European Union. The corridor traverses Belgium, the Netherlands, northern Germany, and Poland and subsequently extends northward through the Baltic States. Following its extension in 2021, the entire territory of Finland, the northern part of Sweden, and an additional section in Poland up to the Ukrainian border were incorporated into the corridor. As a result of this expansion, the North Sea–Baltic Corridor now comprises 8828 km of rail infrastructure, 6934 km of road infrastructure, and 2839 km of inland waterways.
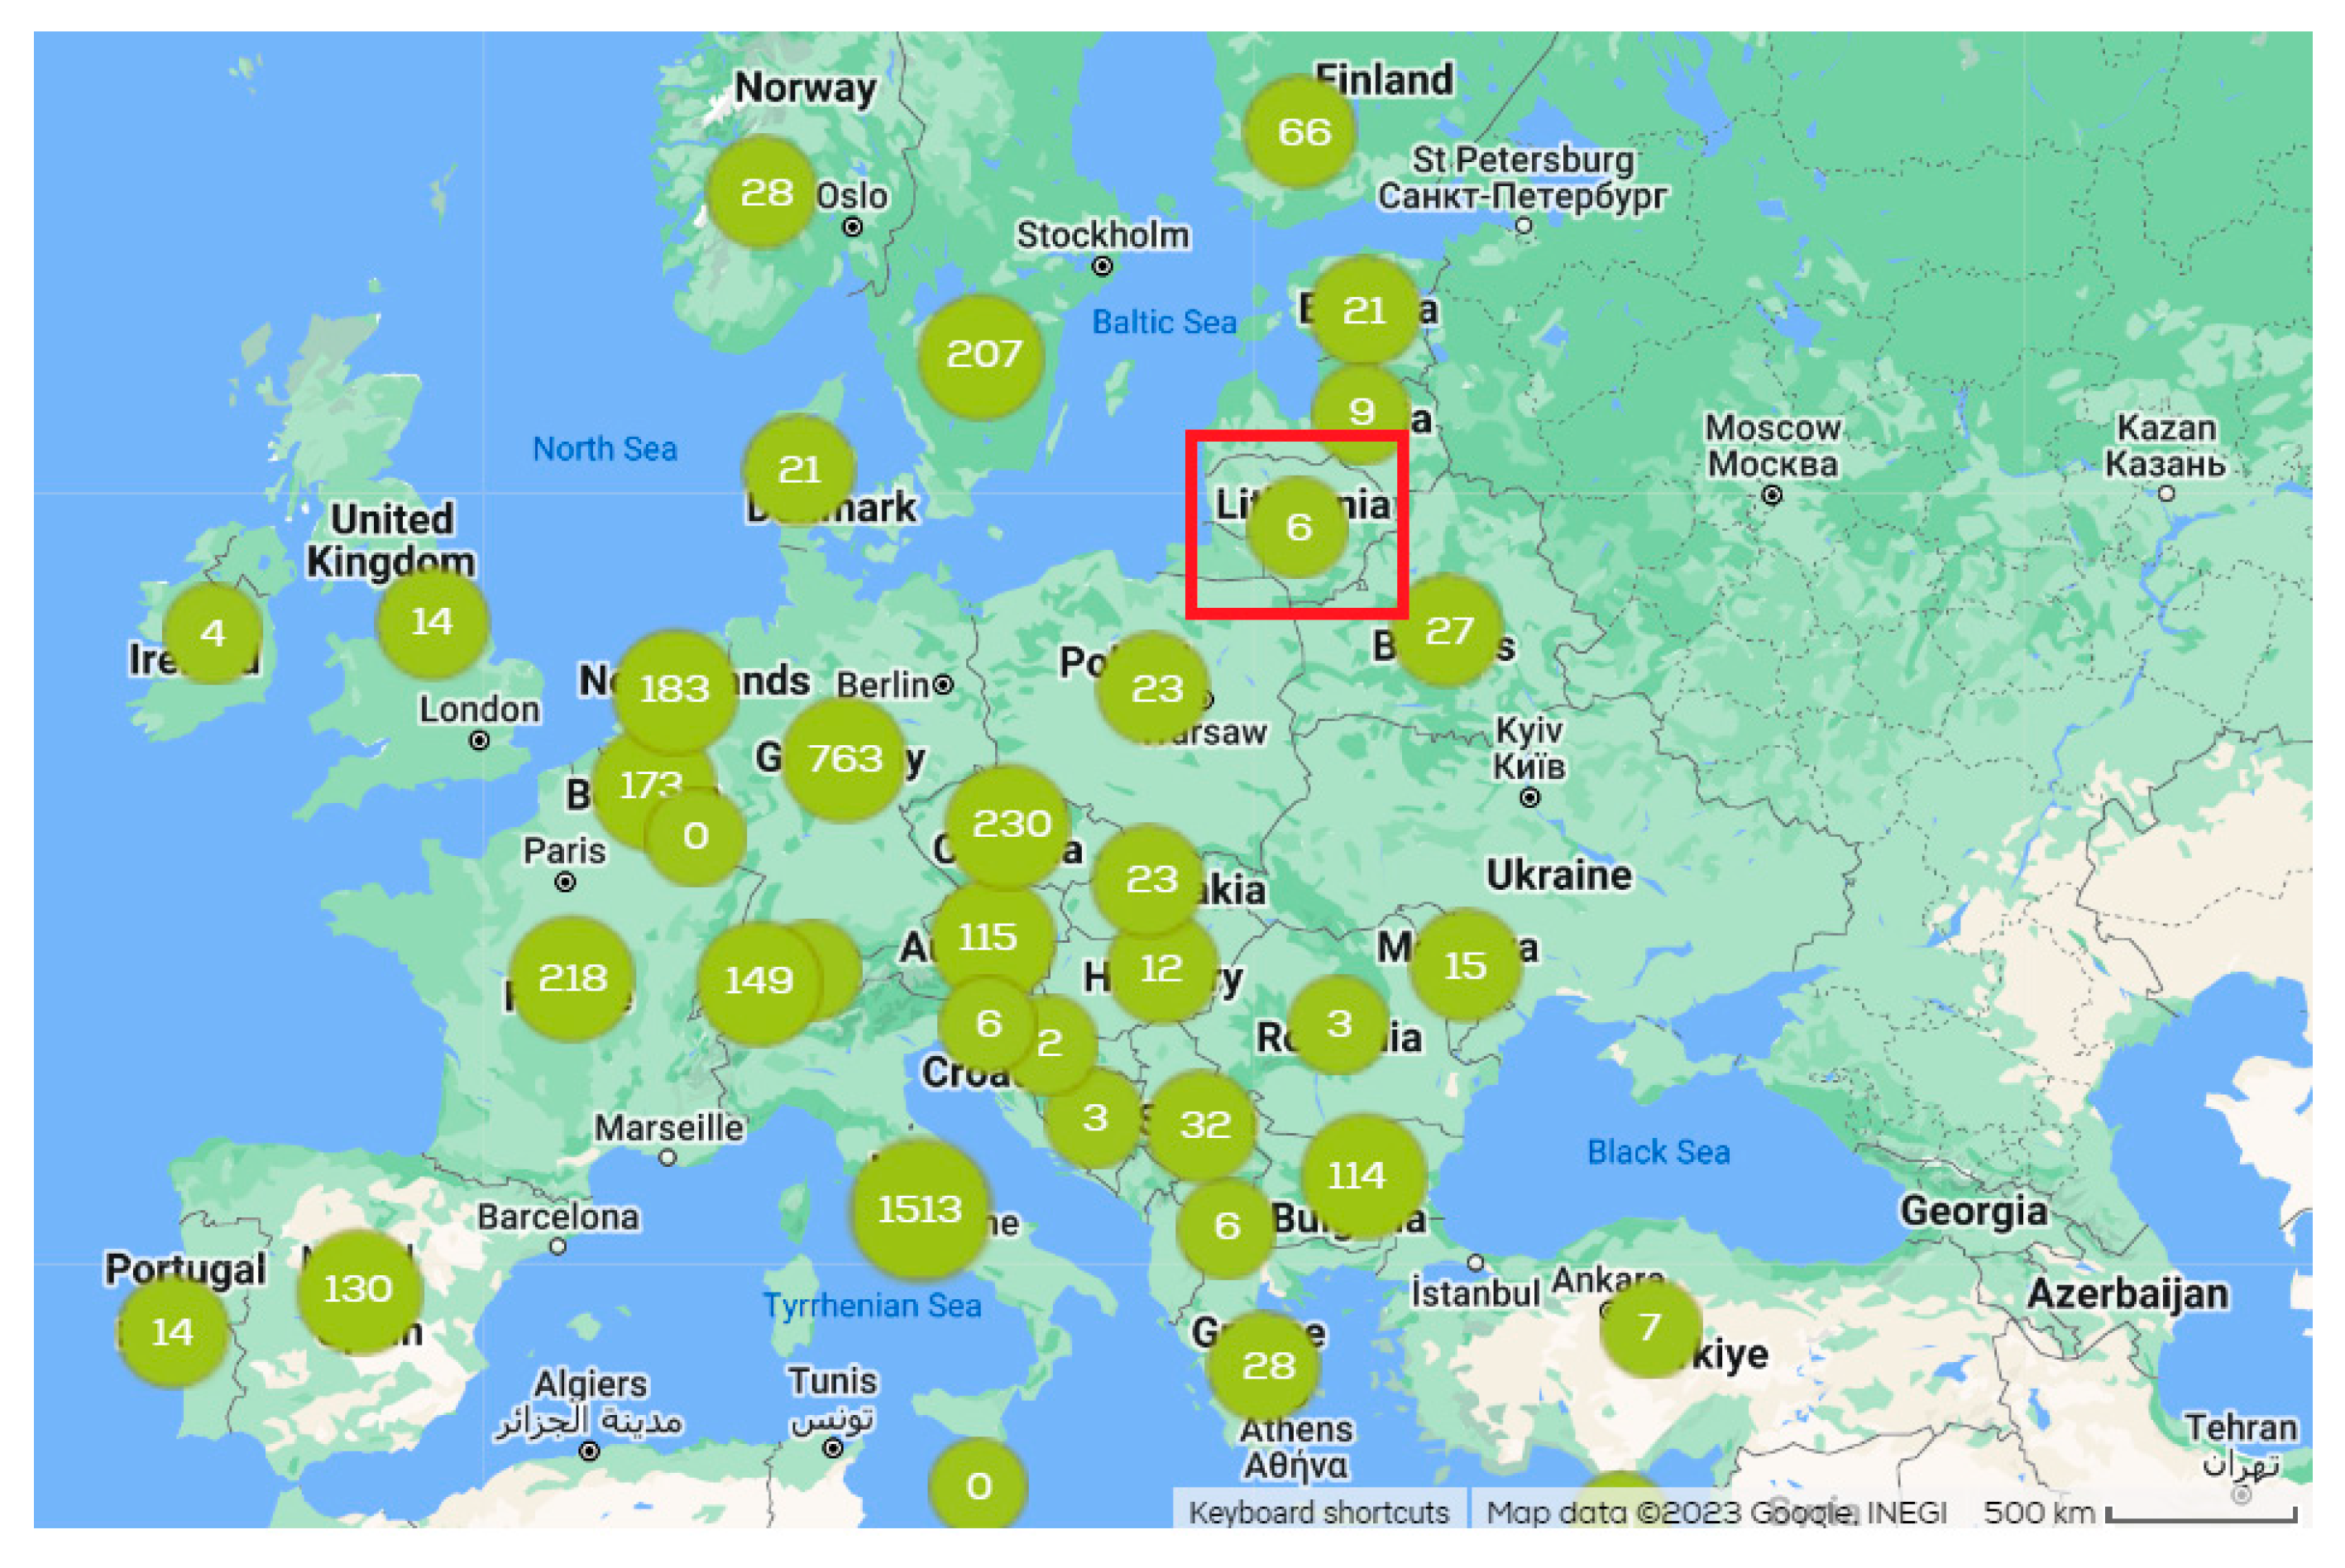
Following the commitment of the European Union to reduce greenhouse gas emissions by 55% by 2030 and according to the strategy for sustainable and intelligent mobility, this corridor is intended to become a “Green Corridor.” The deployment of alternative fuel sources and charging infrastructure is a key component of this initiative, particularly considering the need to ensure the availability of alternative fuels not only for passenger cars but also for light-duty vehicles (LDVs), heavy-duty vehicles (HDVs), and rail transport. In this context, the level of development of the CNG refuelling station network was analysed, considering the role of Lithuania as a key transit country (Figure 3). Italy is leading in the development of the CNG network, with approximately 2000 refuelling stations, according to various sources. Germany, which is traversed by the North Sea–Baltic Sea corridor, ranks second with around 800 stations.
It should be noted that the number of vehicles produced in countries of the European Union that are factory-equipped to run on CNG is substantial. In 2023 alone, five new models were introduced, and since 2018, approximately 80 different vehicle models have become available.
The ability to choose a vehicle of the desired class powered by compressed natural gas (CNG) makes these vehicles highly attractive. However, due to the limited CNG refuelling infrastructure along the North Sea–Baltic Sea transport corridor, CNG powered vehicles are operated primarily in countries with more developed networks, including the Netherlands (183 refuelling stations), Belgium (173 stations), Germany (800 stations), parts of Sweden (207 stations), and Finland (66 stations). Poland, the closest major country and gateway to other European markets, has only 23 CNG refuelling stations, with a higher concentration located around Warsaw, approximately 480–500 km from Vilnius. Lithuania currently has six CNG stations (Figure 3). Among its closest neighbours, Latvia has nine stations, and Estonia has 21. Countries with a small number of CNG stations include Ireland (4), the United Kingdom (14), Norway (28), Denmark (21), Slovakia (23), Romania (3), Hungary (12), Slovenia (3), Portugal (14), Croatia (6), Bosnia and Herzegovina (2), Montenegro (3), Albania (6), and others. Although these countries are not crossed by the North Sea–Baltic Sea corridor, they illustrate the uneven development of alternative fuel infrastructure across the remaining seven European transport corridors. By 2022, Europe had a total of 4159 CNG refuelling stations for cars and trucks [59]. In 2020, the number of newly registered natural gas-powered vehicles increased to 55,028 passenger cars and 3189 buses. According to the European Automobile Manufacturers’ Association (ACEA), 11.4% of all new buses sold in the EU were powered by alternative fuels, almost all of which were natural gas-powered. France, Spain, and Sweden saw multiple-fold increases in the number of such vehicles. The highest growth in registrations was observed in trucks: 6802 new CNG and LNG trucks were added in Europe. Of all trucks powered by alternative fuels, 99% were designed for natural gas operation, with most of these vehicles sold in Germany [59].
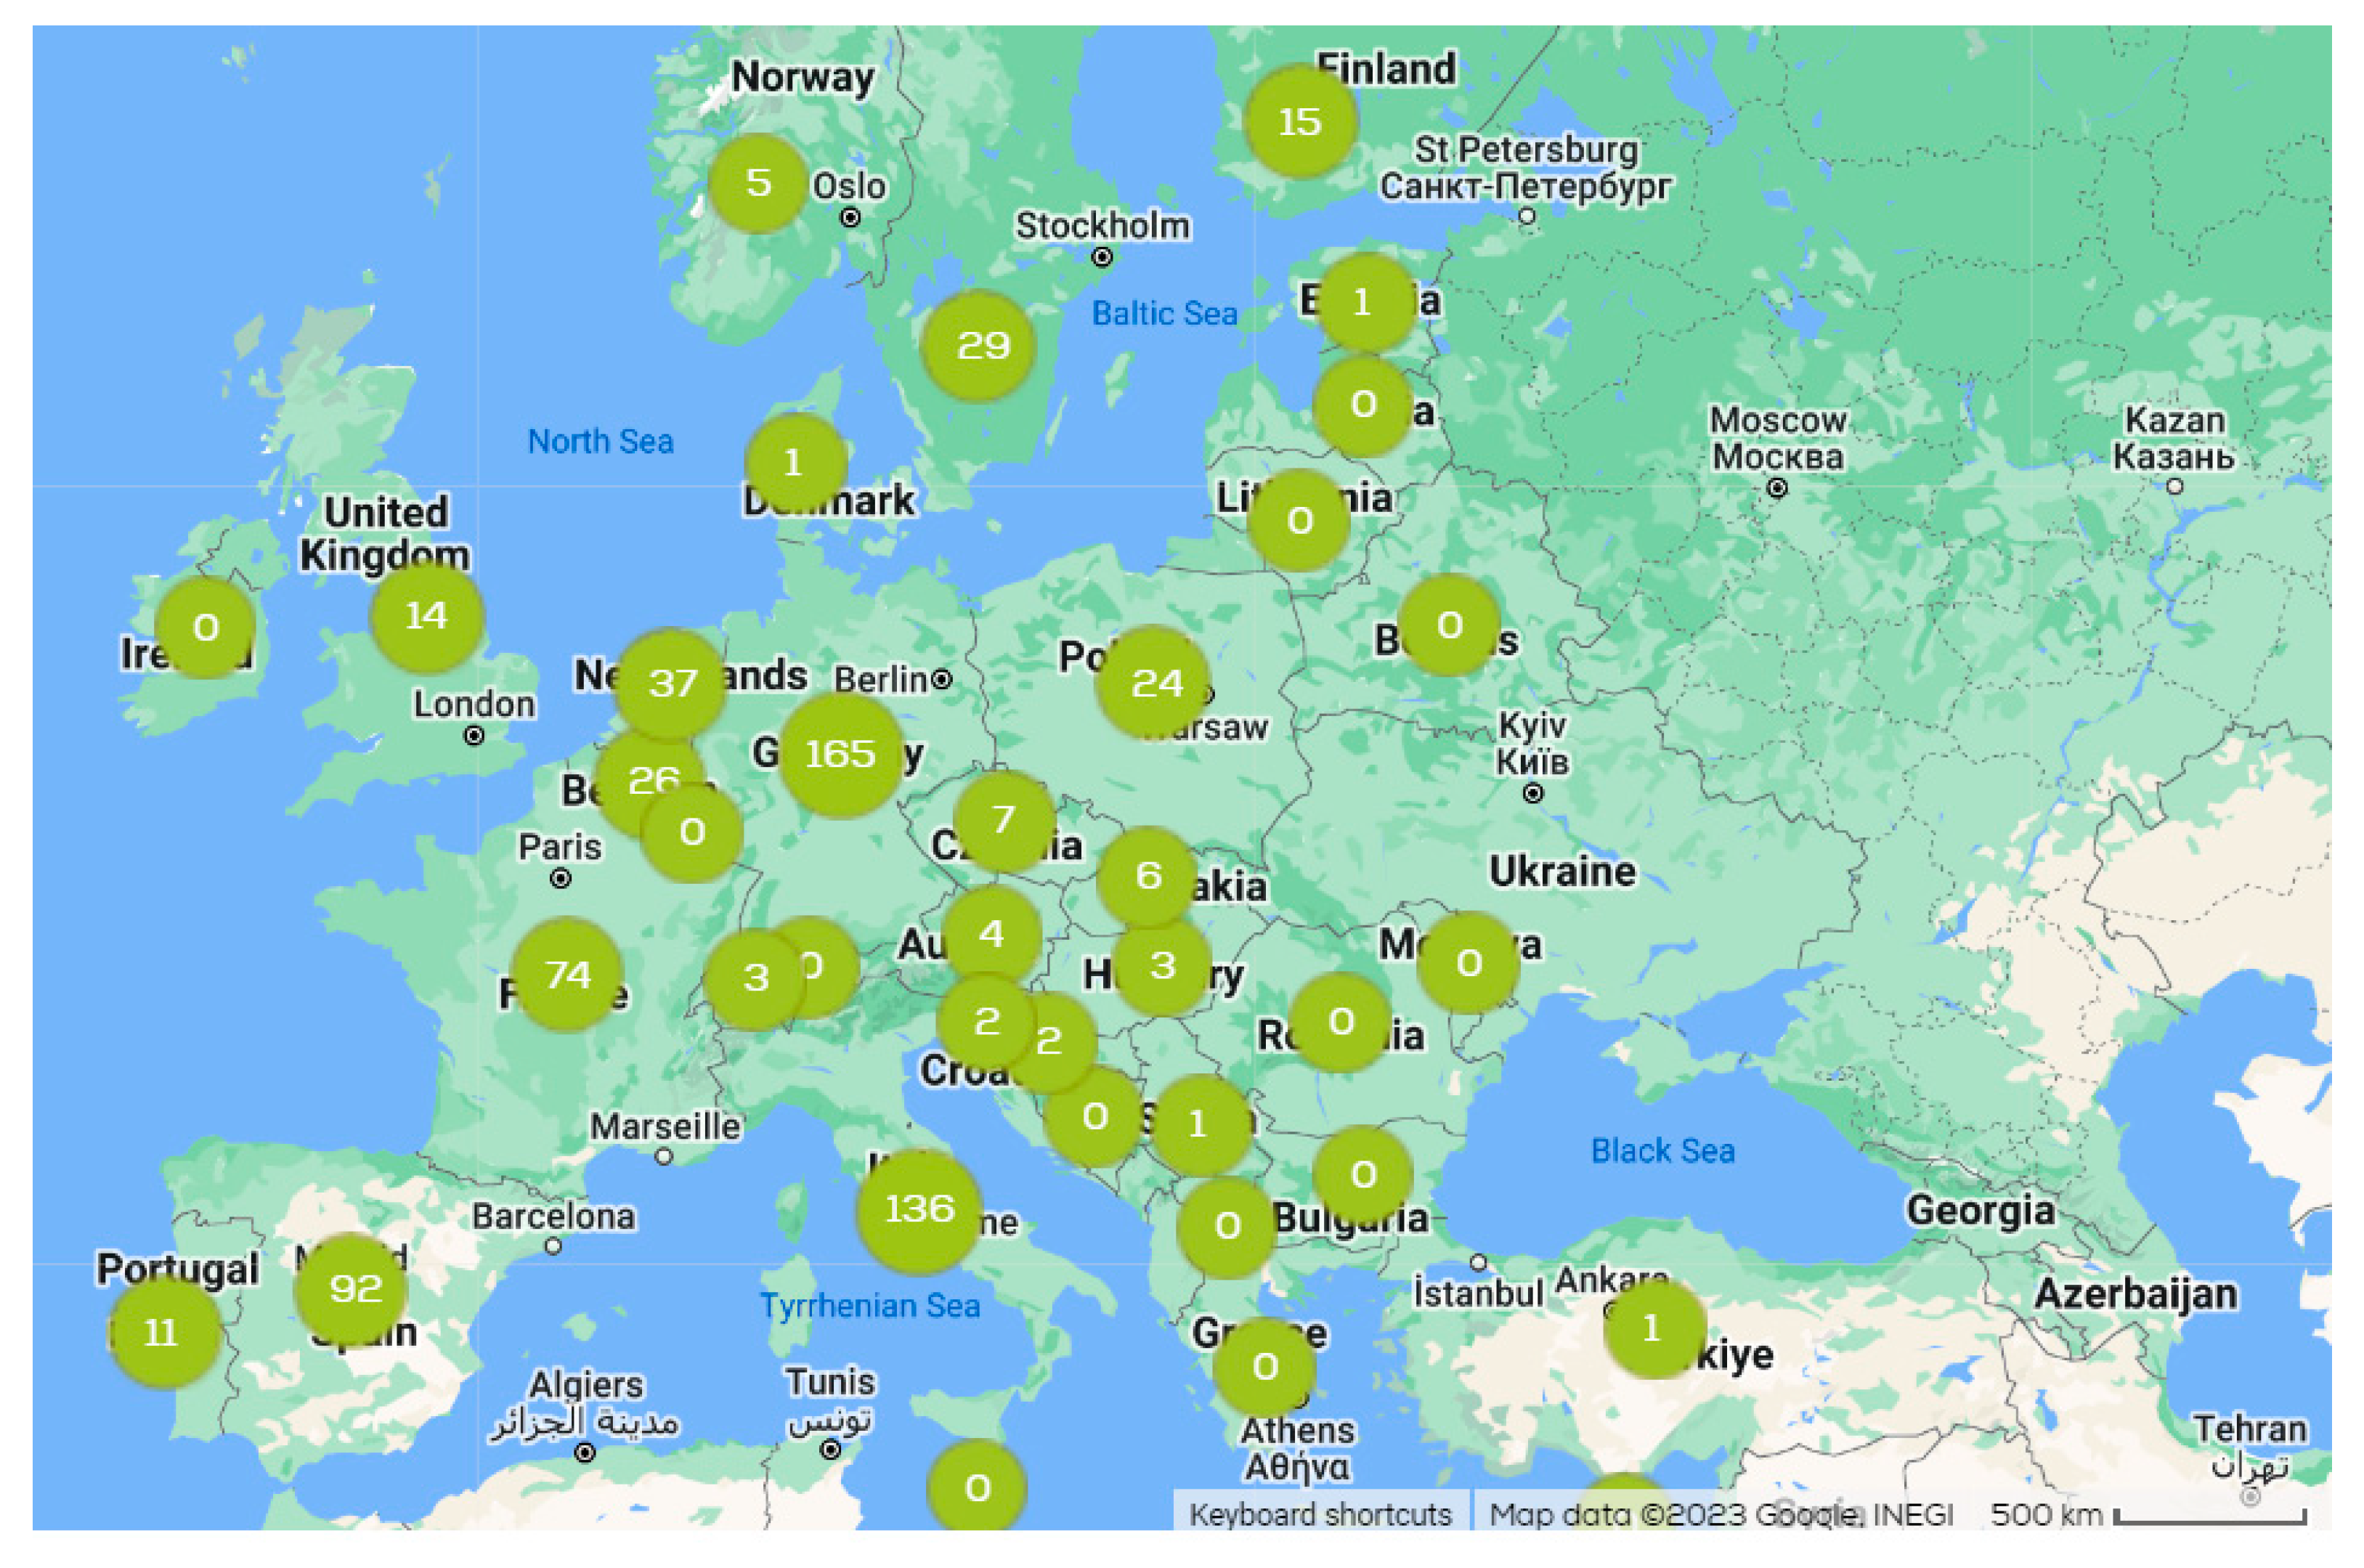
When evaluating the development of LNG infrastructure development along the North Sea–Baltic Sea transport corridor (Figure 4), similar to the CNG network, this network is well developed only in Germany (165 refuelling stations) and the Netherlands (37 stations). Sweden, the largest manufacturer of vehicles powered by LNG in Europe, has only 29 LNG refuelling stations (Figure 4).
In 2019, the first three Scania R 410 trucks powered by liquefied natural gas (LNG) were delivered to Lithuania. Gas engines have the lowest environmental impact among internal combustion engines, emitting significantly fewer harmful particles than diesel engines. According to Scania, trucks powered by natural gas can reduce CO2 emissions by approximately 15% or by up to 90% when biogas is used. In the European Union, there were 635 LNG stations in 2022. Logistics executives frequently note that LNG-powered trucks are still more expensive than diesel trucks, and the particularly low price of diesel discourages the adoption of less-polluting vehicles. The original LNG Blue Corridors project, initiated in 2013, envisioned that by 2020, all long-distance freight trucks would have access to LNG refuelling stations located not more than 400 km apart, as facilitated by natural gas suppliers [60,62]. This infrastructure was intended to create favourable conditions for the deployment of environmentally friendly vehicles that do not require costly exhaust-gas treatment systems. The project was planned primarily in collaboration with the truck manufacturers IVECO, Renault, and Volvo. Unfortunately, the project focused on expanding the network from the Netherlands, Belgium, and Germany toward southern European countries (Spain, Italy) and China. Lithuania currently has one LNG refuelling station in the city of Klaipeda; the nearest station in the Baltic States is located in Estonia (Figure 4). Several LNG powered trucks are registered in Lithuania, but due to the lack of domestic refuelling infrastructure, they operate exclusively in foreign markets.
The main investors in European bio-LNG production targeting the heavy-duty vehicle (HDV) sector include Shell, Scandinavian Biogas, Gasum, and several smaller companies located in the Netherlands, Germany, Italy, and other countries. The expansion of biomethane or bio-LNG production is expected to deliver the most significant reductions in emissions from heavy-duty road transport. In 2022, the Ministry of Energy of the Republic of Lithuania announced a call for applications for state support for biomethane production and purification facilities. At that time, 22.2 million euros were planned to be allocated from the Economic Recovery and Resilience Measure for biomethane production. By 2030 to 2035, Lithuania is projected to produce at least 950 GWh of biomethane. Biogas typically contains 45–75% methane, the rest composed mainly of CO2 and minor impurities. After purification of natural gas quality (<95% methane), it becomes biomethane, which can be used as a substitute for natural gas and injected into gas transmission networks. The REPowerEU plan, announced by the European Commission, highlights a key role for biomethane in reducing the dependence of the EU on Russian fossil fuels and mitigating the volatility of energy prices. The plan targets EU production of 35 billion m3 of biomethane annually by 2030 to 2035. Interest in biomethane investment is growing rapidly in Lithuania. Large industrial companies and new market participants are actively exploring the installation of biomethane production facilities, connecting them to the gas transmission system, and providing biomethane to domestic and international markets. Many are also participating in the trade of guarantees of origin for green gas. Integration of biomethane into the common energy system is now a primary energy goal for European countries, representing a major future opportunity for customers of the Amber Grid. The development potential of Lithuania’s biomethane sector is further reinforced by the Law on Alternative Fuels, approved in 2021. The law stipulates that by 2030, the transport sector should utilise 15% renewable energy sources, promoting the electrification of transport and the use of gaseous fuels and hydrogen produced from biomass and increasing the mixing requirements for biofuels. These measures are expected to encourage investment in biomethane production facilities, their connection to the gas transmission network, and the generation of green energy. Connecting a biomethane plant to the gas transmission system may require the construction of an additional gas pipeline section between the network and the production facility. It is also essential to secure the necessary land and obtain the consent of residents for the construction of new energy facilities and infrastructure along the route between the biogas plant and the transmission system. Lithuania is committed to the development of biogas, which can be supplied or transported by the natural gas system.

3.2. Prognostic Assessment of the Transport Fleet Until 2030 and 2050

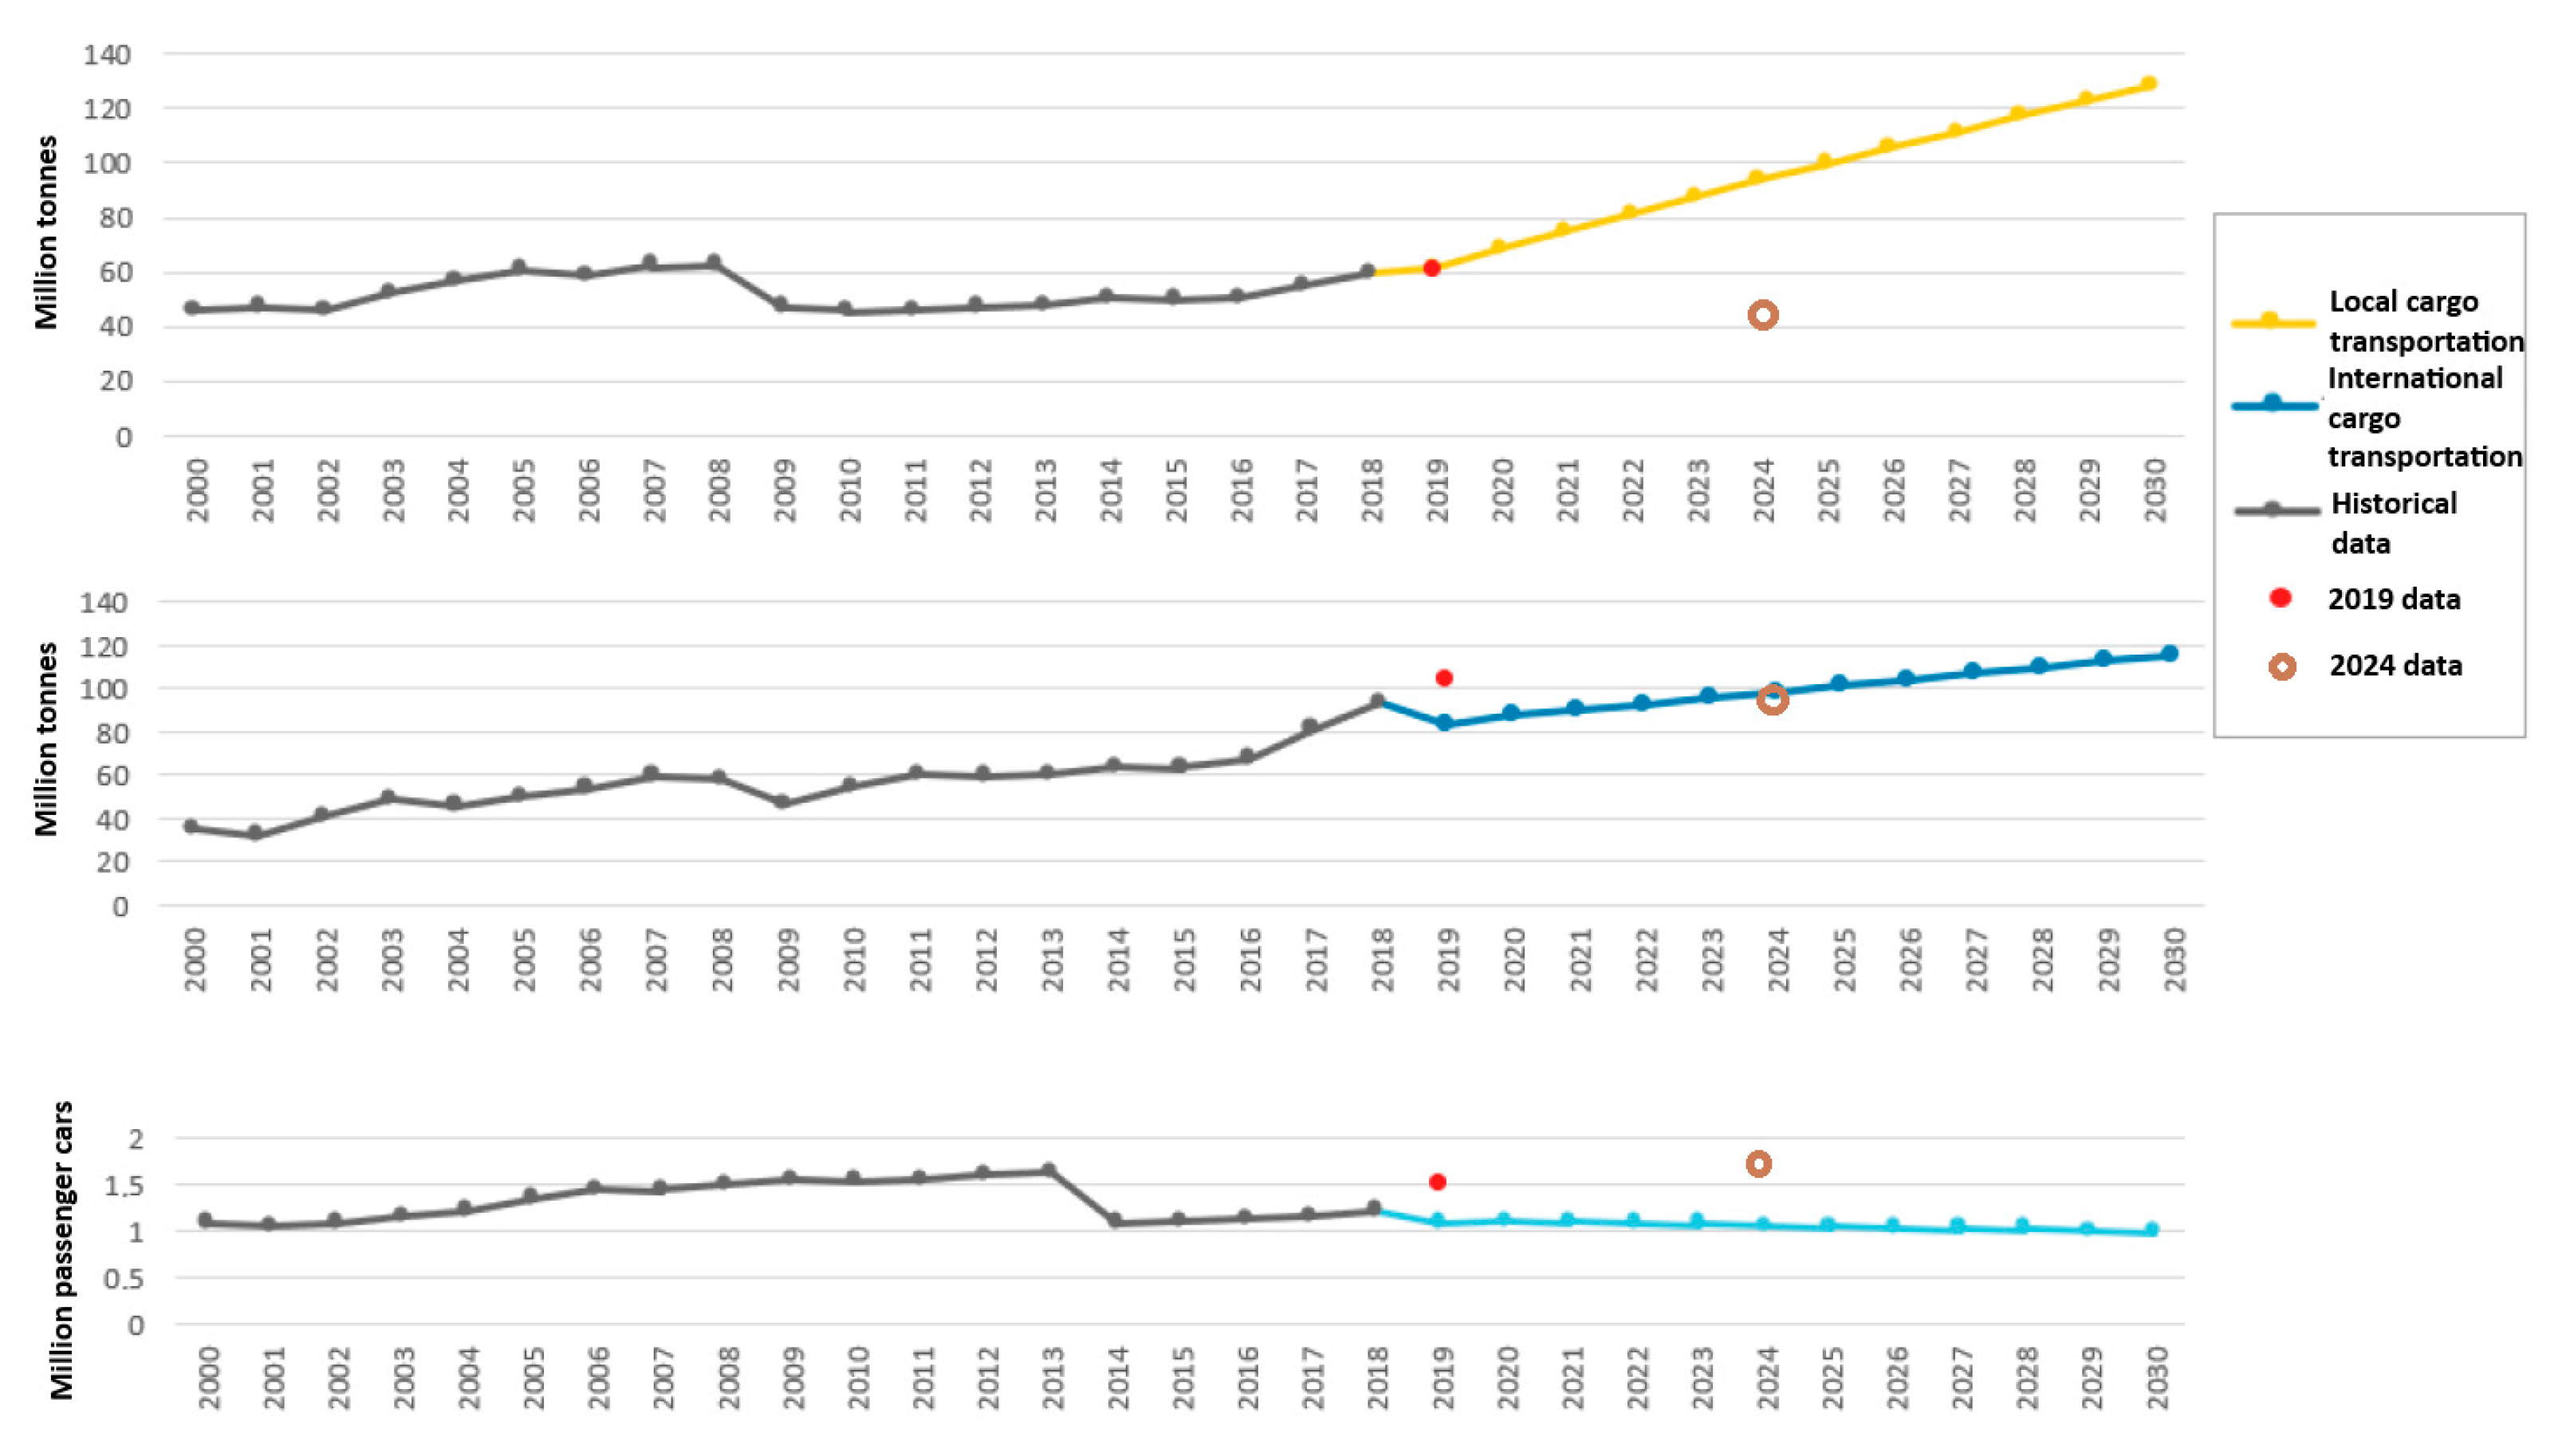
The scenario presented in Figure 5 predicts that, given moderate national economic growth and an increasing regional population, the volume of domestic freight transport will increase substantially, approximately by 116 percent. This growth will be significantly influenced by improved regional accessibility and the growing demand for goods and services generated by population growth; consequently, local freight transport is expected to expand markedly [43]. International freight volumes are projected to grow at a rate similar to previous periods, by approximately 24 percent (Figure 5). This moderate increase will be driven by the steady growth of Lithuania’s imports and exports, as well as the maintenance of stable trade relations between the EU and its main external partners [42].
According to the results of the prognostic evaluation, the main trends in the country’s freight transport sector until 2050 are the following [43]: Domestic freight transport is projected to increase by approximately 161 percent, driven by Lithuania’s improving economic conditions. The fastest growth is expected to occur by 2030, largely due to population increases. After 2030, growth will be driven mainly by the increasing consumer demand resulting from economic expansion, as well as the increased transport needs associated with improving regional accessibility and reducing regional disparities by ensuring equal access to goods throughout the country. International freight transport is expected to increase by approximately 88%. This growth will be influenced by moderate increases in Lithuania’s imports and exports and the continued stable trade relations of the EU with its main trading partners.

3.3. Projected Air Pollution from Vehicle Tailpipe Emissions Between 2030 and 2035

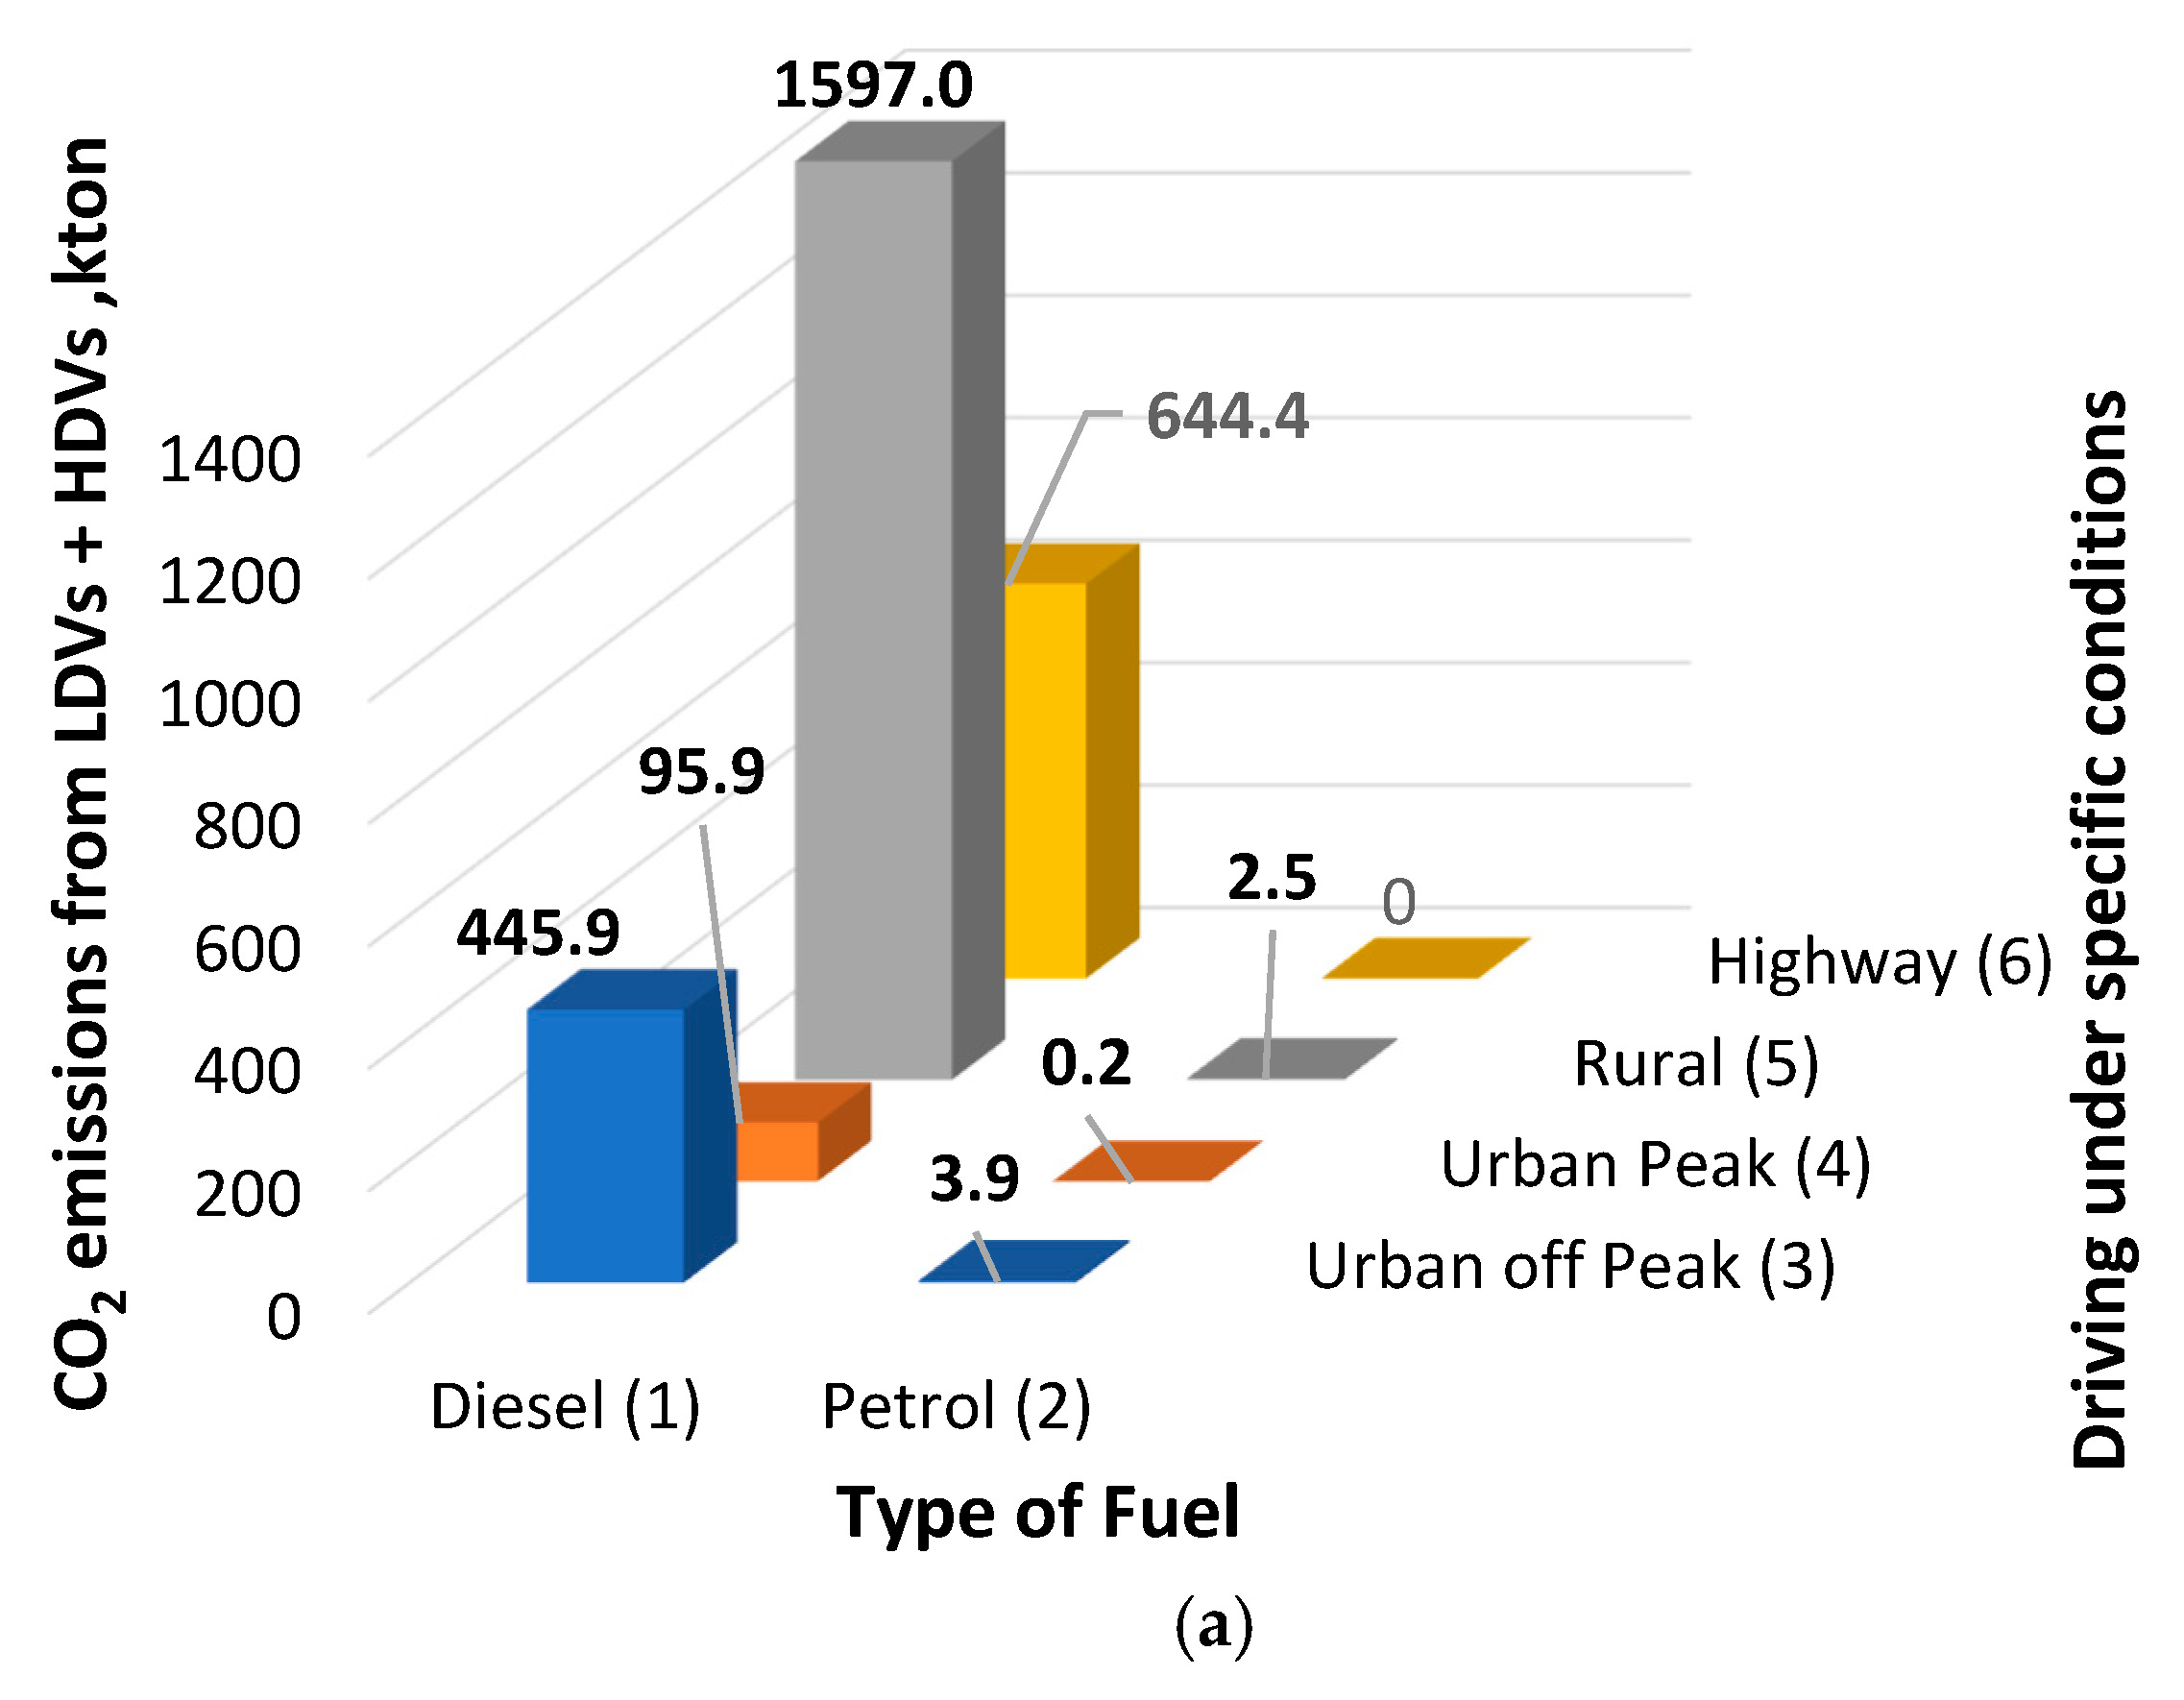
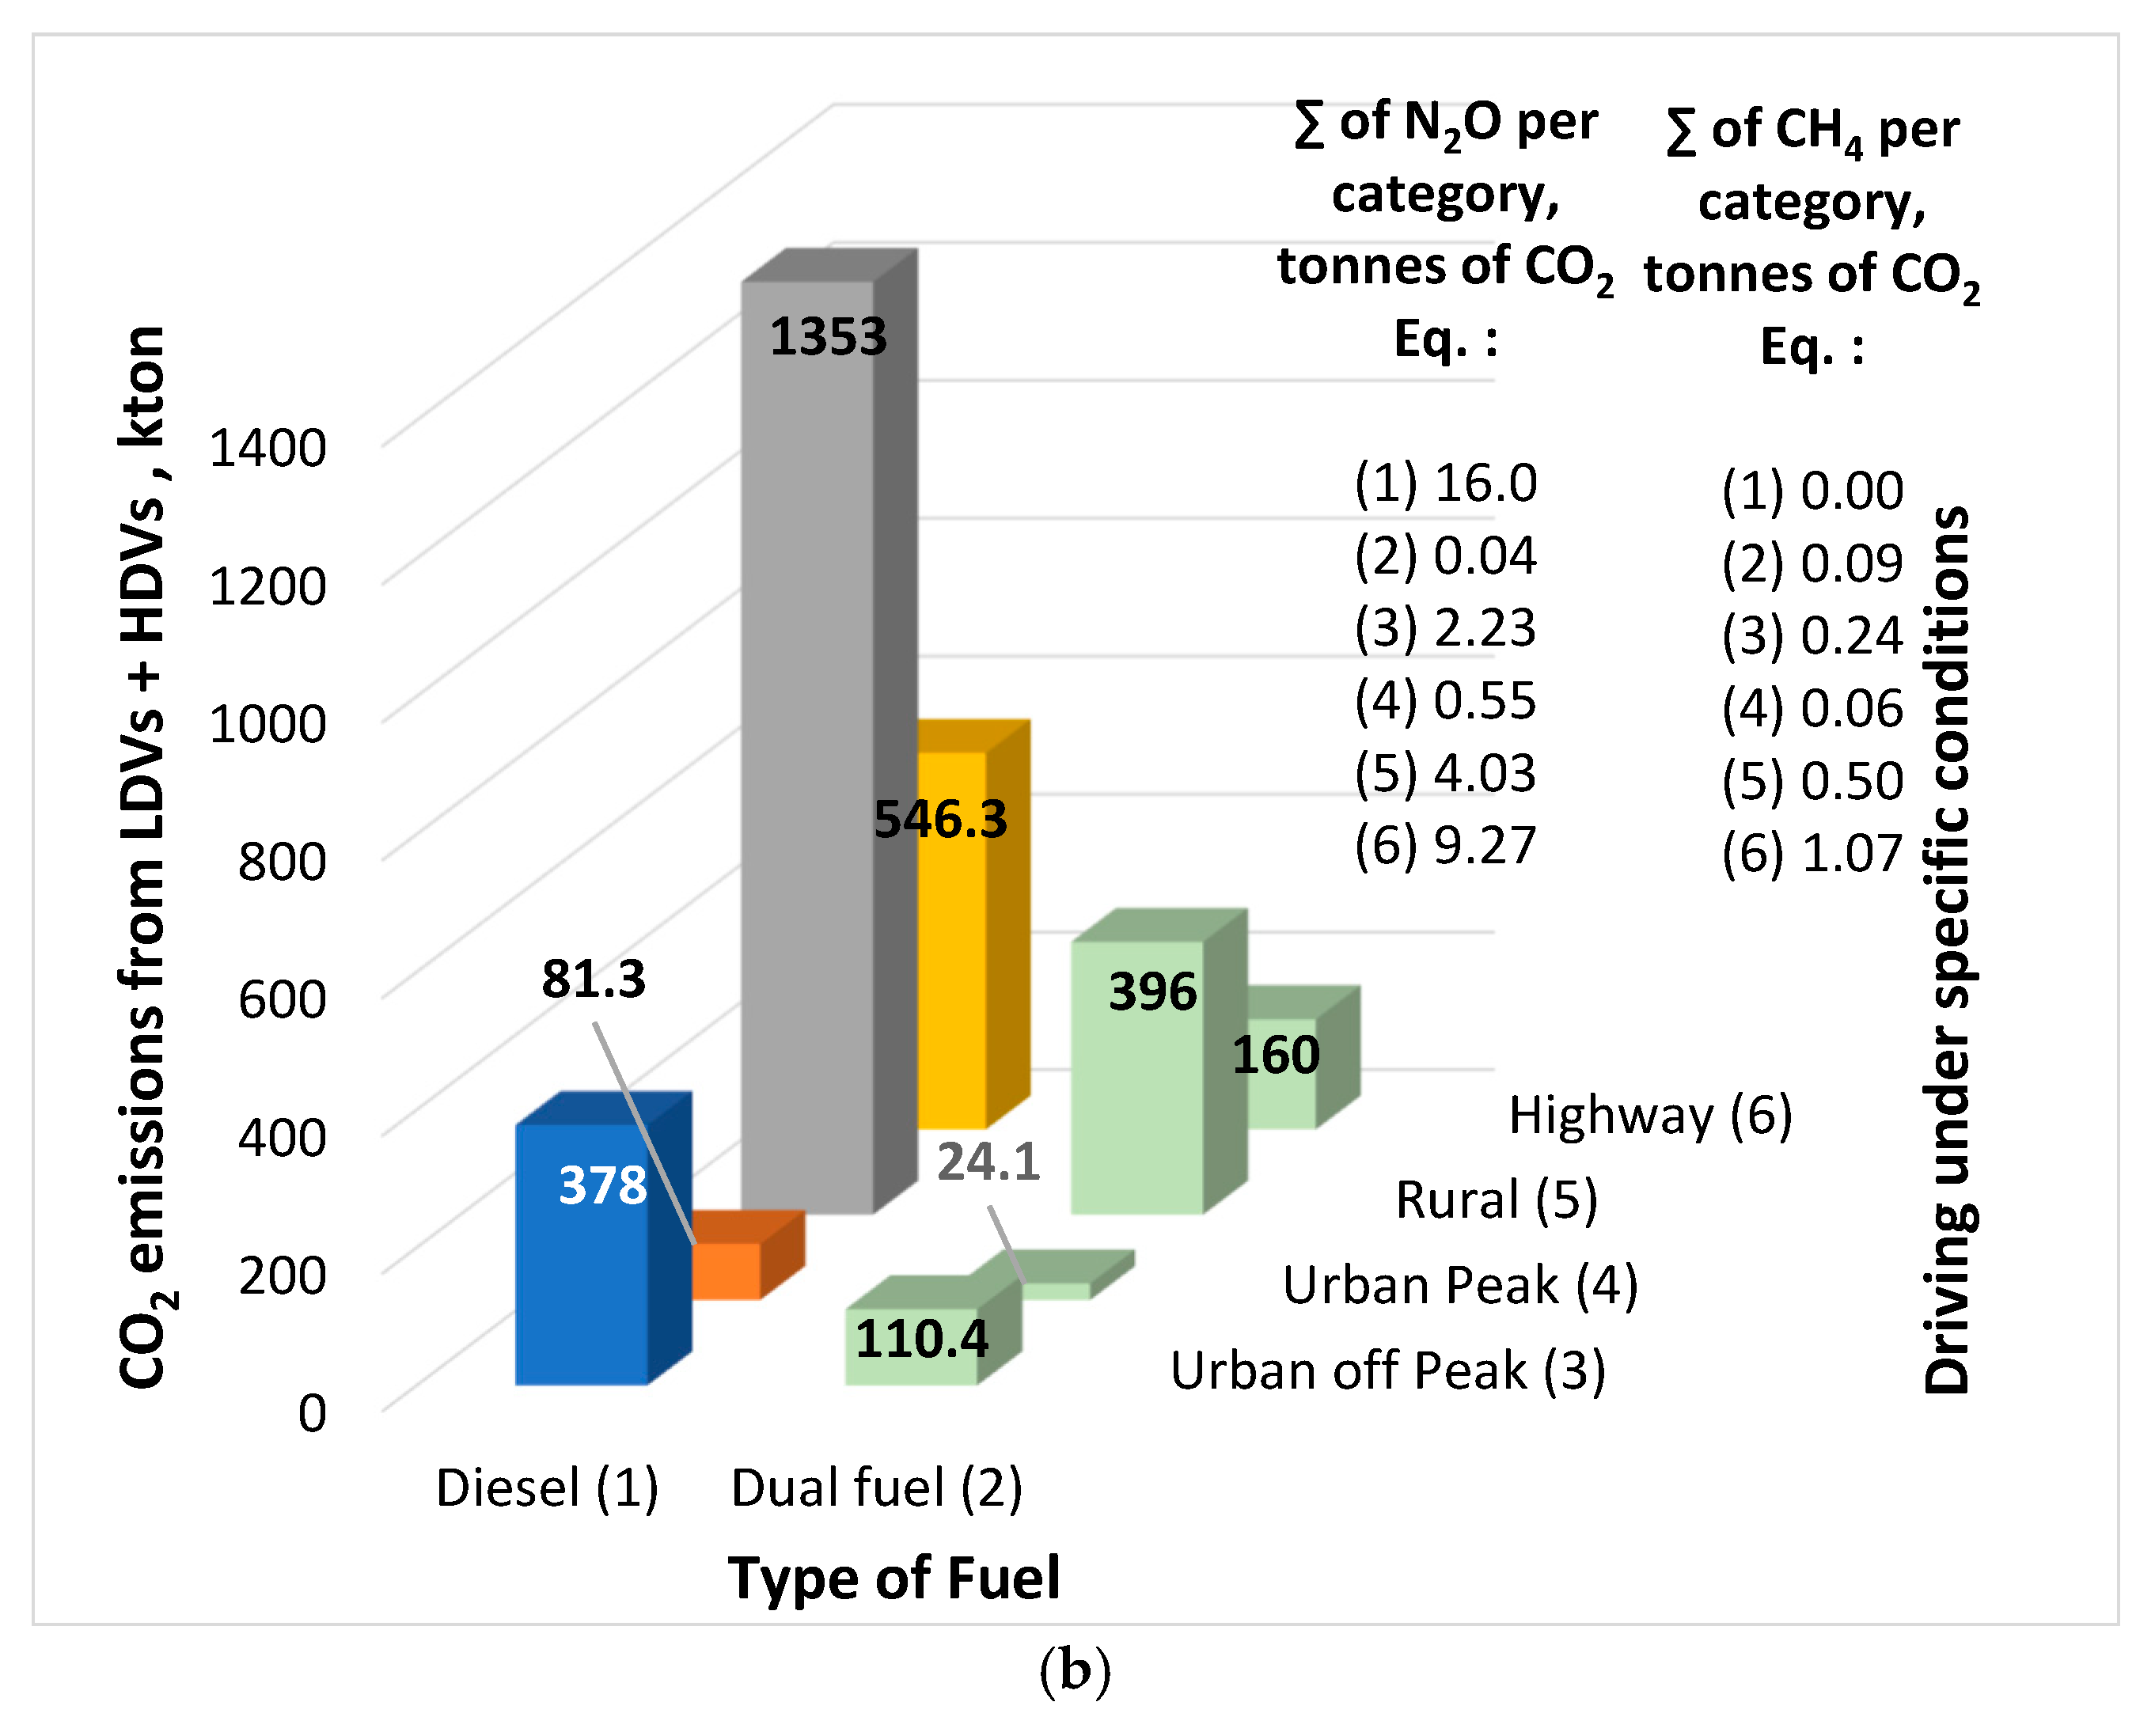
The emissions of LDVs and HDVs were evaluated in six categories: by fuel type (categories 1 to 2) and by road type and driving mode (categories 3 to 6) (see Figure 6). The following assumptions were applied in modelling the environmental pollution scenario for light commercial vehicles and heavy commercial vehicles in 2030–2035:
  • It was assumed that the entire LDV and HDV fleet in the country will consist of 70% diesel vehicles and 30% dual-fuel vehicles (that is, gasoline/CNG), see Figure 6b. Total CO2 emissions from LDVs and HDVs between 2030 and 2035 are estimated at 3045 kt.
  • The number of light commercial vehicles (N1 category) is assumed to increase by 10% compared to 2022; the number of HDVs in the N2 category is also assumed to increase by 10%, while the N3 category is assumed to increase by 30%. In total, the HDV fleet is projected to comprise 93,575 units.
  • The dominant Euro emission standard categories in the 2030–2035 scenario are Euro 6 d-TEMP (60% of all LDVs and HDVs), Euro 6 a/b/c (30% of all LDVs, 25% of all HDVs), and Euro 6 d (15% of all HDVs) and Euro 6 d-TEMP (40% of all LDVs and HDVs). Other potential Euro standard modifications were not evaluated, as these technologies have not yet been developed.
In 2022, diesel fuel was responsible for the total N2O emissions, which corresponds to approximately 23 t of CO2 eq., while NH4 emissions (0.93 t of CO2 eq.) were mainly distinctive for gasoline-powered vehicles. These were the two dominant types of fuel that contributed the most to GHG emissions after CO2. The largest proportion of N2O gases was mainly emitted on highways (8.77 t CO2 eq.) and on rural/urban roads (7.6 t of CO2 eq.).
The expected phase-out of diesel trucks in EU has been strategically aligned with two imaginaries of air quality: global pollution, related to CO2 emissions, and local pollution [63]. It was assumed that diesel engines will not be a target of technological developments after 2030, which means that the expected barriers to innovation will create a temporary situation with the road cargo sector when (i) dual-fuel or alternative-fuel vehicles will become more efficient in terms of advancements in their powertrain design compared to conventional trucks, (ii) the fleet will suffer from constant ageing, which, in turn, will lead to approximately 10% higher exhaust emissions. These preconditions were assumed for the assessment of 2030–2035 scenario. Calculations performed with the COPERT software package indicate that dual-fuel HDVs produce approximately 25% lower CO2 emissions. CNG, despite its positive environmental effects and lower cost, represents a transitional fuel type. It reduces pollutant emissions only partially and does not ensure CO2 neutrality. Therefore, the reduction in conventionally fuelled vehicles by 30% by 2030 to 2035 will continue to increase CO2 emissions from heavy-duty transport by 11%. However, the change in HDV fleet composition would lead to approximately 263 kton CO2 emission reduction. Moderate economic growth, an 116% increase in domestic freight volume, and a 24% increase in international freight volume determine this result. These developments lead to an increase in the number of LDV and HDV vehicles, as indicated at the beginning of this section. A comprehensive approach to reducing air pollution requires the simultaneous promotion of alternative fuels and intramodality in freight transport. Increased functional compatibility between transport modes is necessary, as the current system lacks sufficient interoperability, and the potential of inland waterway and rail transport remains underexploited. There is a need to denote that modelling does not include possible leakage emissions of NG use. Real-world methane slips in low-pressure, dual-fuel engines (heavy duty transport applications) averages ~6.4% of fuel methane slips measured in exhaust plumes, substantially higher than regulatory defaults (~3.1–3.5%). Methane slips can vary with engine type and operation: e.g., some studies report slips from ~2% up to ~8% for different engine configurations under varying loads. The baseline and scenario emission factors are presented in Table 5.
Under a scenario where 10% of conventional HDVs are replaced by LNG-driven vehicles, improvements in emission factors reduce CO2 emissions by approximately 84.6 kton CO2 eq. compared to the “no-change scenario.” Notwithstanding the fact that emission savings are not sufficient enough to ensure a higher degree of decarbonisation, a dual-fuel 10–diesel fuel 90% scenario seems to be the safest option for a large-scale investment for 2035.

3.4. Projections of Possible Expansion of the NG-FS Network

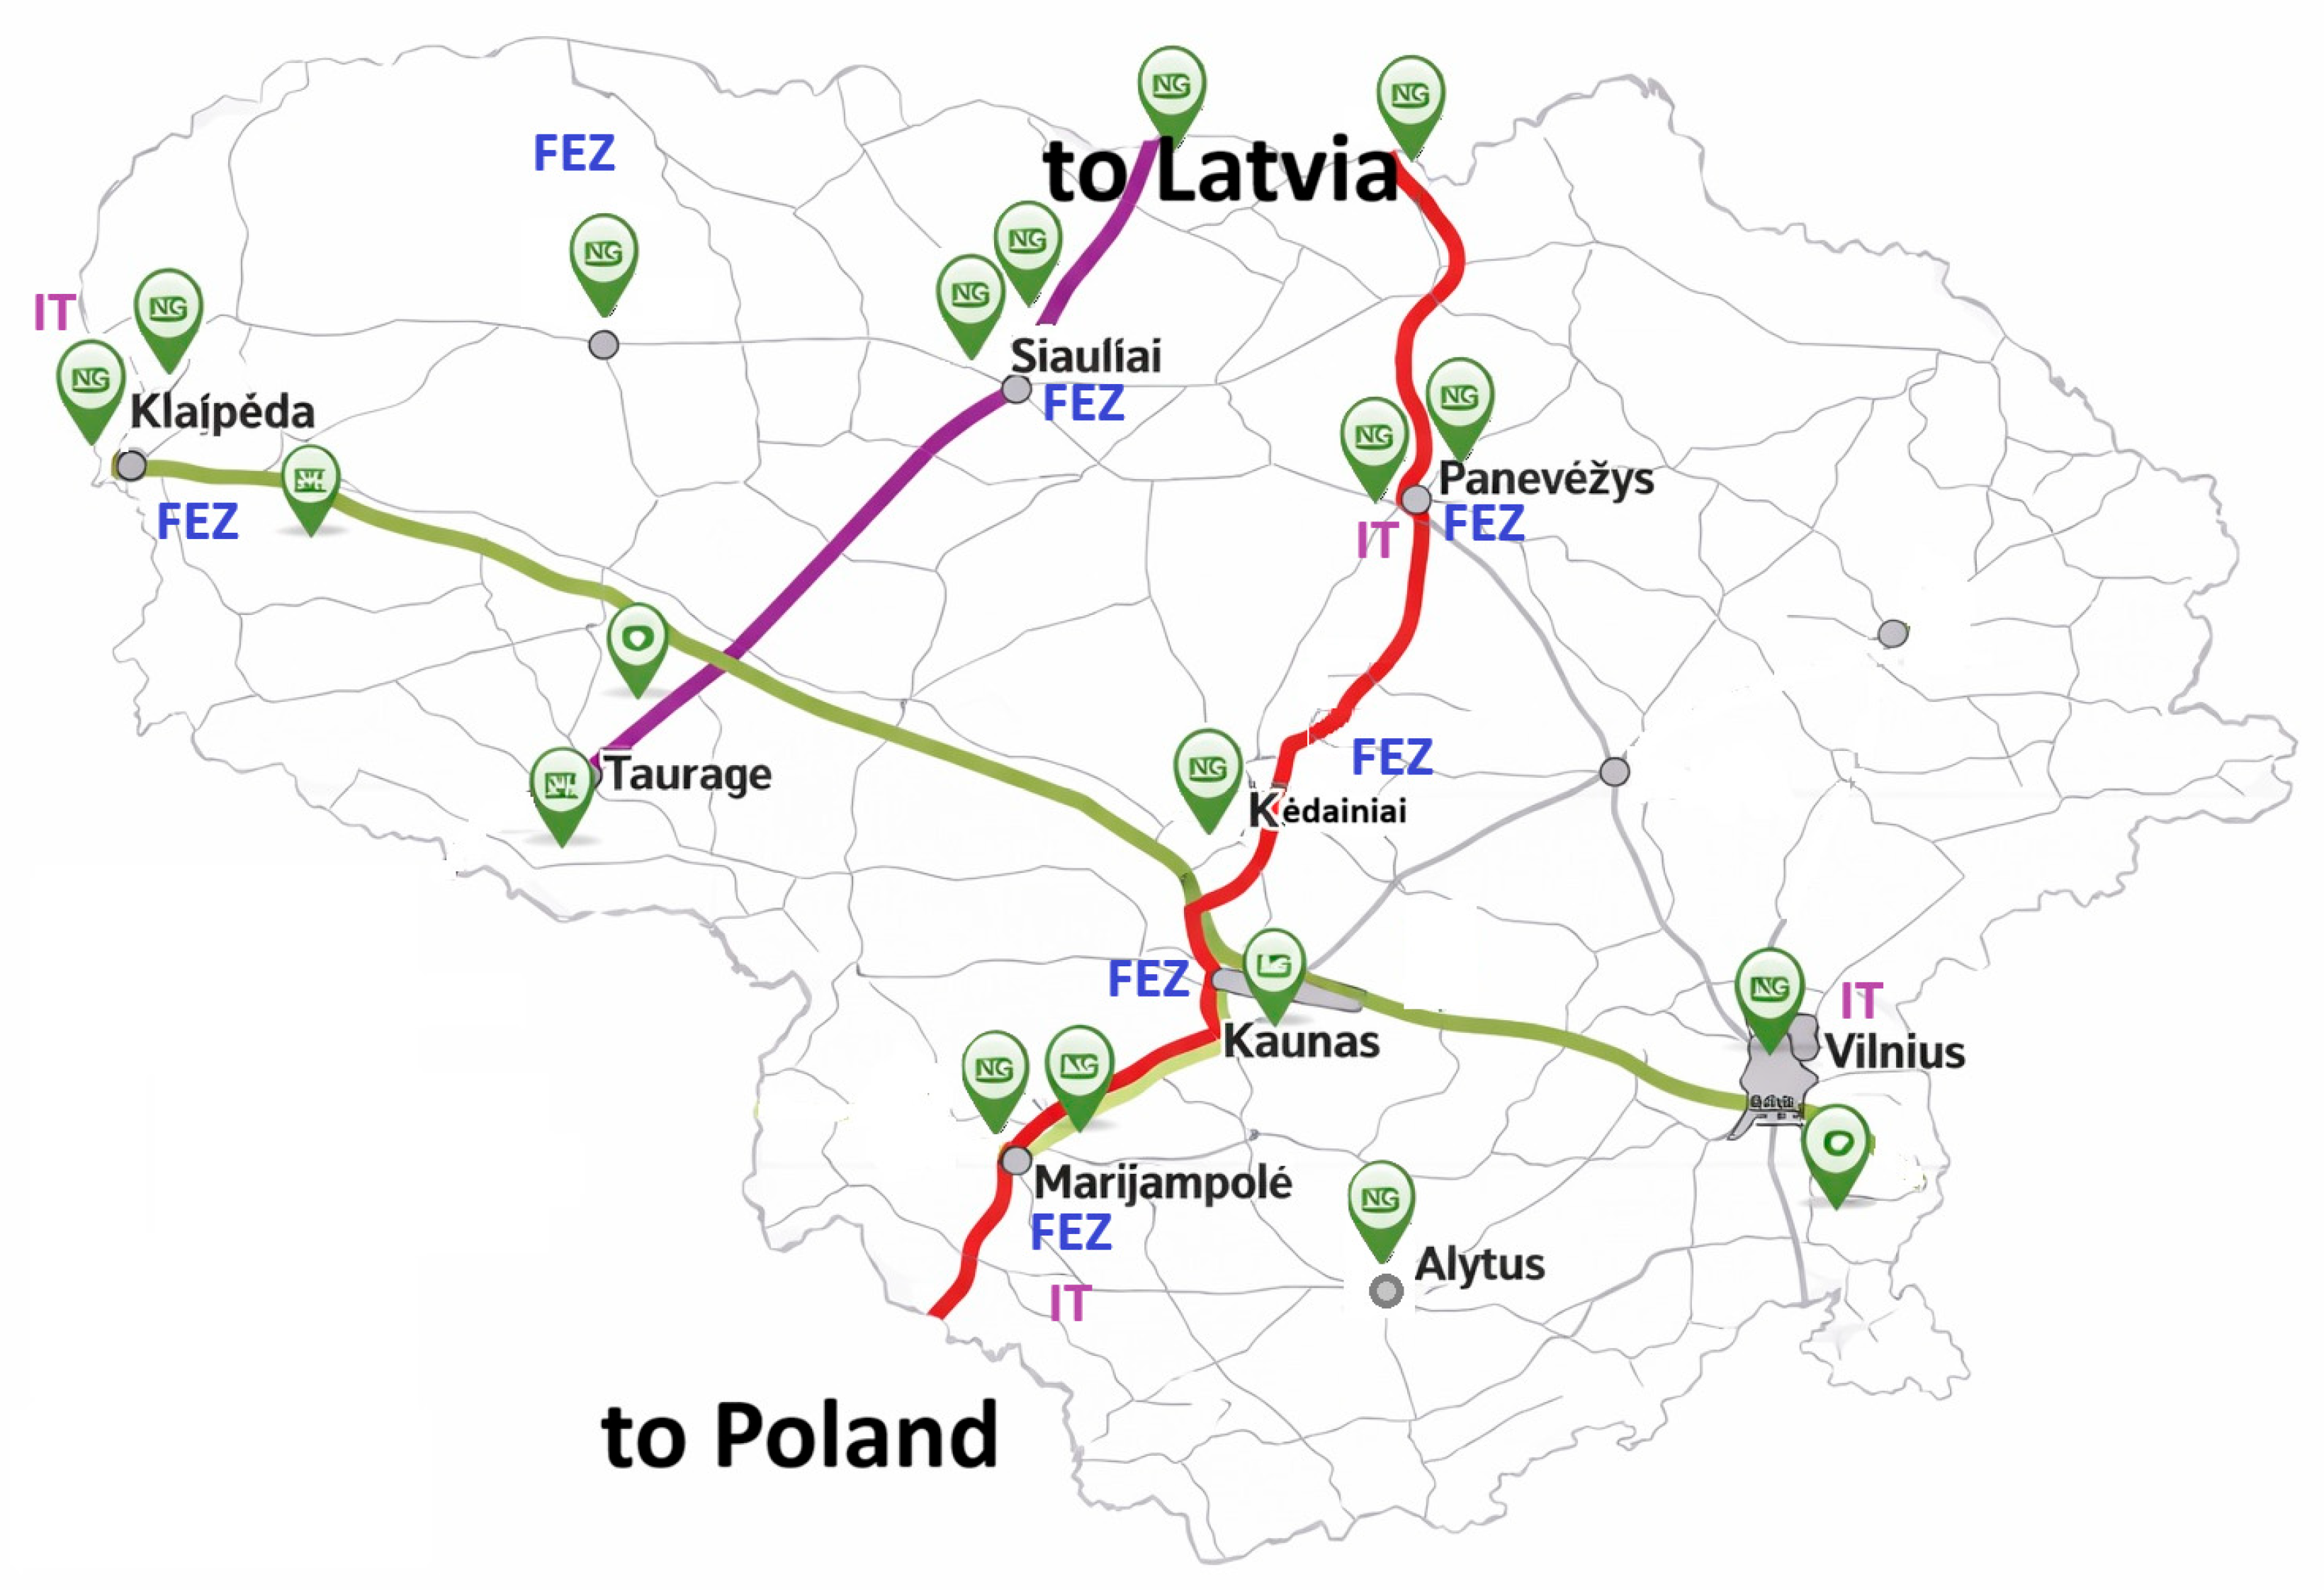
During the period 2020–2025, the number of Lithuanian road freight transport entities changed unevenly, but general growth trends emerged. Comparing the statistical indicators for 2021 with the indicators for 2020 (see Table 6), a slight decrease in the number of companies is observed from 5497 to 5471 (−0.5%). This is associated with the impact of the pandemic on business and economic uncertainty [64]. Already in 2022, compared to 2021, an increase in the number of companies to 5732 (+4.8%) was recorded, indicating a recovery from the challenges caused by the pandemic. Also, the growth in the number of transport companies continued to 5954 (+3.9%) and is also visible in 2023 compared to 2022. The largest jump is observed in 2024 compared to 2023—the number of economic entities increased to 6721 (+12.9%) [64]. Based on statistical data presented in Table 6, the GIS-based distribution of LNG stations, Figure 7 depicts a map with 19 labelled locations for a scenario when 10% of the HDV fleet is replaced by LNG/CNG-fuelled trucks. This scenario is seen as the most realistic choice due to the lowest risk of investment and can offer a good opportunity to monitor how different segments might approach an activity using the new product and service in a long-term perspective. The GIS-based siting logic was based on existing candidate nodes and demand-flows for road cargo, continued growth of road freight entities, and locations of Free Economic Zones (FEZ) and intermodal terminals (IT) (see Figure 7).
There is a need to denote that Lithuania has a well-developed network of free economic zones; five of them are located around the largest cities, while the other two are in the industrial suburbs. In 2024, 113 companies carried out economic and commercial activities in the territories of the Lithuanian FEZ, and the average annual number of employees in these companies reached 10,898. The total turnover of these companies in 2024 amounted to more than 3 billion €. To produce the final product, FEZ companies purchase a significant quantity of raw materials, services, and fixed assets (equipment, buildings). Forty-three percent of this demand is met by local suppliers—this indicator has not changed compared to 2023.
The presence of FEZ and intermodal terminals along the NS-BSC roads crossing the territory of Lithuania and the A1 highway connecting three major cities (Klaipėda, Kaunas, and Vilnius) were selected as prerequisites for the deployment of the NG refueling stations network (see Figure 7).
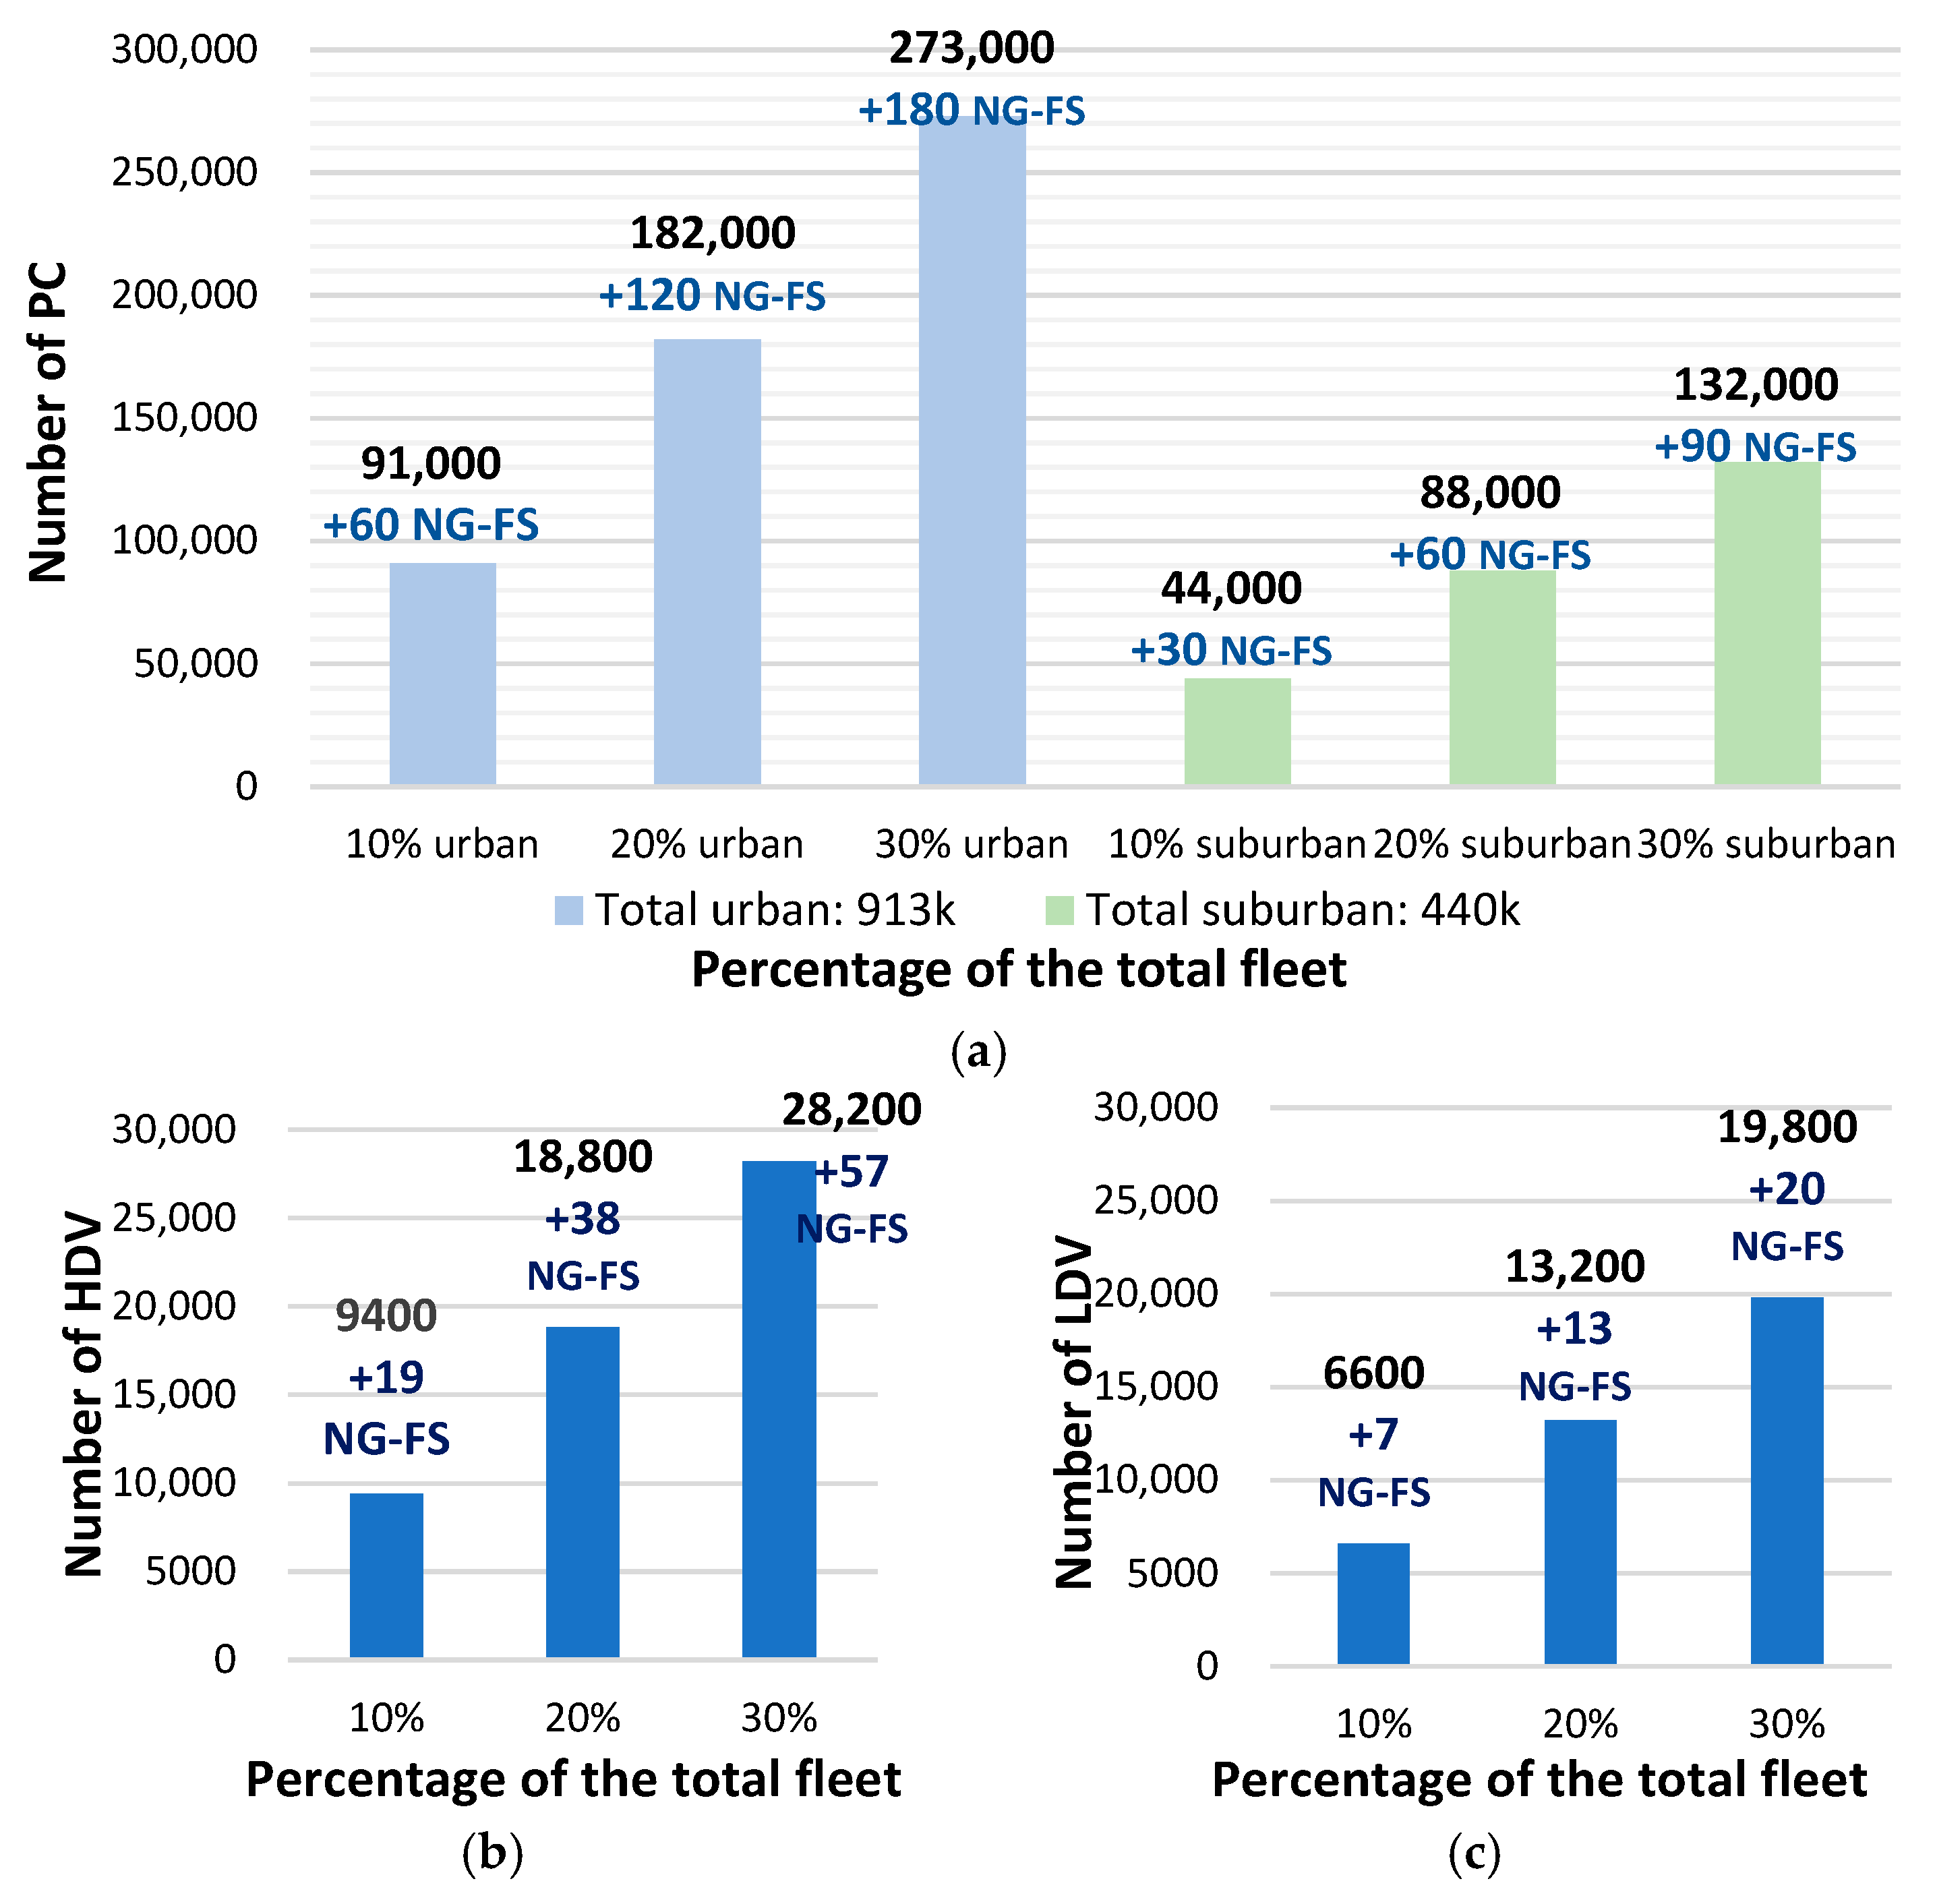
Three different scenarios for expansion of the NG-FS network were examined according to the recommendations on a maximum number of road vehicles per one filling station indicated in STR and equipment price estimates when 10%, 20%, and 30% of PCs, LDVs, and HDVs, respectively, are replaced by LNG/CNG-fuelled ones. Passenger cars registered in Lithuania are divided into two main categories: vehicles registered in urban areas (approximately 913 thousand units) and those registered in peripheral and rural areas (approximately 440 thousand units) (see Figure 8a).
The demand for CNG filing stations was modelled for these two categories, assuming that one large filling station can serve an average of 1500 vehicles. Based on the regulatory recommendations mentioned above for the number of filling stations for a given number of vehicles and the cost estimates presented in Table 7, the paper assessed the development scenarios of the filling stations selling natural gas for three categories of road vehicles (PCs, LDVs, HDVs). The calculations assumed that passenger cars and LDVs will be switched to CNG and HDV transport will be switched to LNG fuel (see Figure 8b).
Depending on the selected scenario, the number of new CNG filling stations required in urban areas ranges from 60 to 180, while in peripheral areas, it can vary from 30 to 90 (see Figure 8a). The LDV fleet in the period between 2030 and 2035 is projected to comprise slightly more than 66 thousand vehicles. By assuming that one large filling station can serve an average of 1000 LDVs, the required number of such filling stations is estimated to range from 7 to 20 (see Figure 8c). Despite the relatively significant decline in the number of PCs from 2022 to 2030, the largest integrated investment strategies across a wide range of supply chains should focus on the development of a refuelling network to meet the demand from the car fleet segment (Table 7). In a practical realisation of the network expansion scenario, which could fluently allow to service up to 406 thousand of vehicles (30% of all PC) running on CNG, the divergence in investment to infrastructure may vary between €305 M and €459 M. As a result, private equity could be rolling out a network of 270 new filling stations throughout the territory of a country. The emergence and increasing number of natural gas-powered LDVs is expected to decouple from €8 M to €12 M to service up to 6.6 thousand vehicles (10% of all LDVs), from €15 to €22 M to service 20% of all LDVs (13,200 vehicles), and from €23 €34 M to service approximately 30% of all LDVs, respectively.
The HDV scenario assumes that trucks and lorries will operate on LNG in 2030 and that a liquefied gas filling station can serve 500 trucks. Under these assumptions, the required number of LNG filling stations in the country may range from 19 to 57 (see Figure 8b).
Meanwhile, a surge in LNG refuelling stations for HDVs, depending on the scenario assessed, may require investment ranging from €21.5 to €97 million. Implementing the maximum (30%) scenario, when both CNG and LNG stations co-exist in the market, it could cost about €589 million.

4. Discussion

The fuel market for the transport sector is preparing for a transition. Although there are now more sustainable alternative energy sources on the market, it is uncertain what the future will hold for gas stations in terms of the changing type of fuel that will be offered and where the income will come from. The strategy that NG stations can adopt in the coming years is based on policy lever—infrastructure change—emissions change assessment.
In Lithuania, the national policies and targets for the environment and climate policy are defined in two major strategic documents: 1) the National Energy Independence Strategy of the Republic of Lithuania and 2) the National Energy and Climate Action Plan of the Republic of Lithuania for 2021–2030, approved in 2018 and 2019, respectively.
The Lithuania National Energy Independence Strategy establishes the vision for natural gas in Lithuania to “promote a technically reliable and diversified supply of natural gas to consumers based on efficiency and cost-effectiveness principles and competitive prices.” To achieve this, the National Energy Independence Strategy focuses on the following [31]:
  • Efficiency—active participation in the search of new natural gas transit routes and infrastructure users.
  • Competitiveness—improved access to infrastructure and increased efficiency of infrastructure operators.
  • Innovation—to lead in LNG technologies and distribution in the Baltic region of related smart energy and to develop innovative technologies for the use of LNG in the energy, transport, shipping, and industry sectors in Lithuania.
  • Integration—create favourable conditions for natural gas trade within the region
  • Energy Security—have the ability to independently supply Lithuania with natural gas from international LNG and EU natural gas markets.
The study concludes that the lack of infrastructure creates an investment dilemma where fuel suppliers do not want to invest in the fuelling infrastructure if there are no LNG-fuelled trucks in service, and fleet operators do not want to invest in LNG-fuelled trucks if there is no fuelling infrastructure in place [31]. A particular feature of the cryogenic nature of LNG is that it requires higher capital costs to store the LNG compared to conventional liquid fuels and thereby rewards projects that employ economies of scale to make them economical. The relatively small and fragmented market for land-transport LNG fuels exacerbates the barriers to the near-term replacement of conventional fuels with LNG in the trucking sector [31].
The road freight sector accounts for 9 percent of global CO2 emissions—60 percent of which are generated by approximately 63 million medium- and heavy-duty trucks in operation globally [41]. However, recent developments at the EU and country level could increase the market opportunity for LNG trucking. In 2019, the EU passed rules requiring new trucks to emit 15 percent less CO2 on average compared to 2019 levels by 2025 and 30 percent less from 2030 [31,41,55]. These rules increase the competitiveness of LNG as a lower-emissions transportation fuel. LNG fuel can reduce greenhouse gas emissions from trucks by up to 30 percent compared to diesel and gasoline [31,41,55].

4.1. The Role of the Baltic States in NG-FS Network Expansion Within the NS-BSC: SWOT Analysis on Current Situation

The following specific strategies are proposed to enhance interconnectivity in the Baltic States, making their transport networks more efficient, integrated, and sustainable, strengthening the region’s position as a key logistics hub connecting Eastern and Western Europe [65]:
  • Develop contingency plans to diversify trade routes and ensure network resilience against geopolitical risks.
  • Develop infrastructure that seamlessly connects rail with sea and road networks, especially at key ports. This will enhance connectivity and reduce dependency on any single mode of transport.
  • Encourage the use of intermodal transport to streamline cargo transfers and reduce costs.
Finally, the SWOT analysis of road freight transport in the Baltic States was conducted based on four main aspects: (1) infrastructure condition, (2) freight transport, (3) economy/competitiveness, and (4) road safety and environmental protection:
Strengths
  • Baltic countries have dense and well-developed road networks, and the national highway network ensures connectivity within each country and with foreign countries in all directions.
  • Significant European freight corridors run through the Baltic countries in the east-west and north-south directions.
  • The freight transport sector is modern, competitive in Europe, and constantly growing, and it significantly contributes to the GDP of each of three countries.
  • Approval of the Integrated National Energy and Climate Action Plans and implementation of the commitments provided therein.
Weaknesses
  • There is no long-term investment program and long-term investment planning in road development.
  • The Baltic region possesses only rather flexible infrastructure and LNG equipment.
  • The TEN-T road network still does not meet EU requirements in some of its parts.
  • There is a lack of bypasses, and there are poor road surface indicators in some of its parts.
  • The average age of passenger cars is among the oldest among EU countries.
  • The taxation of transit (heavy transport) traffic is insufficient and disproportionate to the impact on road surface and air pollution.
Opportunities
  • The state support, and thus the government-level involvement, plays a crucial role, as this has been the case in, e.g., Lithuania, where the government has supported the development of LNG infrastructure [43].
  • Development of intermodal containers and semi-trailer transport to Western and Northern Europe.
  • Macro-regional integration, development and innovation require comprehensive understanding of economic, environmental, social, cultural, and policy (governance) systems [43].
Threats
  • The governments in terms of NG macro-regional development are still not interconnected from the individual region’s perspective [43].
  • Pollution caused by the road transport sector may result in financial sanctions for failure to meet international obligations to reduce climate change and ambient air pollution.
  • The reason behind a lower level of economic operations with LNG might be referred to higher investment costs, missing funding and support schemes [43].
  • Rather limited utilisation of potential synergy effects from the unequally distributed NG infrastructure on the macro-regional scale, which, once utilized, could lead towards greater economic interactions among different actors, which, in turn, would increase demand for this type of fuel, strengthen competitiveness, open new growth perspectives, and contribute to the macro-regional integration [43].

4.2. Comparison to the Results by Other Researchers

In the first part of the paper, the what-if analysis is used to analyse data under hypothetical scenarios by changing input variables to determine their impact on outcomes. The obtained results are in good agreement with those obtained by Arman (2022) [66], Cordova-Pozo and Rouwette (2023) [67], and Lee et al. (2024) [68]. The second part focuses on economical criterions specific to the Republic of Lithuania and its implementation following the up-to-date practice in other countries by Kolkman (2022) [69], DaSilva and Trkman (2014) [70], Azimont and Araujo (2010) [71], Northern Gas Networks (2012) [72], and Mitrică (2023) [73] best suited to be adapted in Lithuania.

5. Conclusions

  • Lithuania, Latvia, and Estonia, which are crossed by the North Sea-Baltic Sea transport corridor, are the countries with the least developed infrastructure for natural gas as an alternative fuel for PCs, LDVs, and HDVs.
  • The simulated scenario where 30% of the HDV fleet consists of natural gas-powered dual-fuel trucks exhibited a 323.6 kton CO2 eq. reduction in carbon dioxide emissions from road freight.
  • The regional market demand for CNG gas stations to provide a gas fuelling service for passenger cars may vary from 90 to 270. Replacement of the existing conventional gasoline and diesel vehicles that currently dominate the vehicle market with those powered by CNG would result in the following investment to upgrade the existing network and build new stations to meet the increasing demand for CNG: from €101.7 to €153.0 million (scenario of 10% market share for PC running on CNG), from €203.4 to €306.0 (20%), and from €305.1 to €459.0 (30%).
  • The regional market demand for CNG gas stations to provide a gas fuelling service for the light-duty road transport sector can vary from 7 to 20. Replacement of the existing LDV fleet with CNG-powered vehicles would result in the following investment to upgrade the existing network and build new stations to meet rising CNG demand: from €7.91 to €11.9 million (scenario of 10% market share for LDVs running on CNG), from €14.69 to €22.1 (20%), and from €22.6 to €34.0 (30%).
  • The regional market demand for LNG (and/or biomethane) gas stations to provide a gas fuelling service for the heavy-duty road transport sector may vary from 19 to 57. Replacement of the existing HDV fleet with LNG-powered trucks would result in the following investment to upgrade the existing network and build new stations to meet rising LNG demand: from €21.47 to €32.3 million (scenario of 10% market share for HDVs running on LNG), from €42.94 to €64.6 (20%), and from €64.4 to €96.9 (30%).
  • The 30% market share scenario, when both CNG and LNG gas stations coexist in the region, could cost around €589 million.
  • The sustainable scale-up of liquefied biomethane gas (LBG) consumption could be the first step to debunk emission stereotypes associated with road freight. The offering of several alternative fuels for heavy duty transport would be less beneficial than the best scenario targeted financing, as some potential buyers of CNG trucks would hesitate and possibly give priority to a CNG-powered truck. To reach these targets, the alignment of all sources of finance—public and private, national, and multilateral—is required.
  • The dual-fuel 10–diesel fuel 90% scenario seems to be the safest option for a large-scale investment until 2035.
Based on the results of this study, follow-up studies are already conceivable. A distinction can be made here between manned NG stations on highways or rural roads, in a city, town or village, or on an industrial estate.

Funding

This research was partially funded by the Research Council of Lithuania through the initiative “Need-driven Research Projects.” (Project No. S-REP-22-7).

Institutional Review Board Statement

Not applicable.

Data Availability Statement

An internet link to the project’s website: https://en.ktu.edu/projects (accessed on 6 January 2025)/needs and opportunities for zero emissions renewable energy and the use of transitional alternative fuels in the transport sector.

Acknowledgments

Several impacting factors on a regional level were initially collected during the implementation of the project—S-REP-22-7 needs and opportunities for zero emissions, renewable energy, and the use of transitional alternative fuels in the transport sector—and later rearranged to fit this study. Many people have been involved in the various stages of this study, and I thank them all.

Conflicts of Interest

The author declares no conflicts of interest.

References

  1. North Sea—Baltic Core Network Corridor Study. Final Report. December 2014. Available online: https://transport.ec.europa.eu/system/files/2017-06/north_sea-baltic_study_0.pdf (accessed on 26 January 2024).
  2. Tplan Consulting. Transport Market Study of the Rail Freight Corridor North Sea-Baltic. Final Report Executive Summary. Prepared for EEIG “North Sea—Baltic Rail Freight Corridor EZIG. February 2020. Available online: https://rfc8.eu/files/public/Downloads_STUDIES/RFC_NSB_TMS_Report_Executive_Summary.pdf?utm_source=chatgpt.com (accessed on 12 March 2025).
  3. Transport Market Study of the North Sea-Baltic Rail Freight Corridor, 2024 Update. RailNetEurope. 2024. Available online: https://rfc8.eu/files/public/STUDIES/Transport_Market_Study_update_2024.pdf (accessed on 12 March 2025).
  4. EC—European Commission, DG Energy, DG Climate Action & DG Mobility and Transport. EU Reference Scenario 2016. Energy, Transport and GHG Emissions Trends to 2050. Available online: https://pure.iiasa.ac.at/id/eprint/13656/3/20160712_Summary_Ref_scenario_MAIN_RESULTS%20%282%29-web.pdf (accessed on 3 March 2025).
  5. Pomykała, A.; Engelhardt, J. Concepts of construction of high-speed rail in Poland in context to the European high-speed rail networks. Socio-Econ. Plan. Sci. 2023, 85, 101421. [Google Scholar] [CrossRef] [Scilit]
  6. Bartosiewicz, A.; Szterlik, P. Poland on the New Silk Road. Current State and Perspectives, 1st ed.; Łódź University Press: Łódź, Poland, 2020; 139p. [Google Scholar]
  7. Djordjević, B.; Ståhlberg, A.; Krmac, E.; Mane, A.S.; Kordnejad, B. Efficient use of European rail freight corridors: Current status and potential enablers. Transp. Plan. Technol. 2024, 47, 62–88. [Google Scholar] [CrossRef] [Scilit]
  8. Solheim, A.; Gjestad, G.C.; Østmoen, C.; Lydersen, Ø.; Nilsen, S.A.E.’; Barbieri, D.M.; Lou, B. Railway infrastructure upgrade for freight transport: Case study of the Røros Line, Norway. Infrastructures 2025, 10, 180. [Google Scholar] [CrossRef] [Scilit]
  9. The Memorandum of Understanding (MoU) on the Baltic Energy Market Interconnection Plan ‘BEMIP’ Signed by the Sides on 8 June 2015. Available online: https://cdn.table.media/assets/wp-content/uploads/2025/05/13194330/BEMIP-Memorandum-of-Understanding_final.pdf (accessed on 29 December 2025).
  10. Tawfik, C.; Limbourg, S. Scenario-based analysis for intermodal transport in the context of service network design models. Transp. Res. Interdiscip. Perspect. 2019, 2, 100036. [Google Scholar] [CrossRef] [Scilit]
  11. Montrimas, A.; Bruneckienė, J.; Gaidelys, V. Beyond the socio-economic impact of transport megaprojects. Sustainability 2021, 13, 8547. [Google Scholar] [CrossRef] [Scilit]
  12. Budzyński, A.; Cieśla, M. Highway rest area truck parking occupancy prediction using machine learning: A case study from Poland. Infrastructures 2025, 10, 151. [Google Scholar] [CrossRef] [Scilit]
  13. Gokgoz, F.; Macit, G. Assessing the effect of transportation investments on efficiency and sustainability of EU roads. Transp. Policy 2026, 175, 103873. [Google Scholar] [CrossRef] [Scilit]
  14. Ogden, J.; Jaffe, A.M.; Scheitrum, D.; McDonald, Z.; Miller, M. Natural gas as a bridge to hydrogen transportation fuel: Insights from the literature. Energ. Policy 2018, 115, 317–329. [Google Scholar] [CrossRef] [Scilit]
  15. Lajevardi, S.M.; Axsen, J.; Crawford, C. Examining the role of natural gas and advanced vehicle technologies in mitigating CO2 emissions of heavy-duty trucks: Modeling prototypical British Columbia routes with road grades. Transp. Res. D Transp. Environ. 2018, 62, 186–211. [Google Scholar] [CrossRef] [Scilit]
  16. Muncrief, R.; Sharpe, B. Overview of the Heavy-Duty Vehicle Market and CO2 Emissions in the European Union. International Council on Clean Transportation. 2015. Available online: www.theicct.org/overview-heavy-duty-vehicle-market-and-co2-emissions-european-union (accessed on 30 July 2025).
  17. Thiruvengadam, A.; Besch, M.; Padmanaban, V.; Pradhan, S.; Demirgok, B. Natural gas vehicles in heavy-duty transportation-A review. Energ. Policy 2018, 122, 253–259. [Google Scholar] [CrossRef] [Scilit]
  18. Langshaw, L.; Ainalis, D.; Acha, S.; Shah, N.; Stettler, M.E.J. Environmental and economic analysis of liquefied natural gas (LNG) for heavy goods vehicles in the UK: A Well-to-Wheel and total cost of ownership evaluation. Energ. Policy 2020, 137, 111161. [Google Scholar] [CrossRef] [Scilit]
  19. Mariani, F. Cost Analysis of LNG Refueling Stations. LNG Blue Corridors Project, European Commission. October 2016. Available online: https://www.scribd.com/document/406625700/Cost-analysis-of-LNG-refueling-stations (accessed on 12 June 2025).
  20. Rajalehto, C.; Helo, P. Comparing feasibility of low-carbon heavy-duty road freight vehicles. J. Clean. Prod. 2025, 509, 145524. [Google Scholar] [CrossRef] [Scilit]
  21. Chinese, D.; Patrizio, P.; Bonotto, M. A Service Station Location Model to Explore Prospects and Policies for Alternative Transport Fuels: A Case of CNG Distribution in Italy. In Computer-Based Modelling and Optimization in Transportation; de Sousa, J.F., Rossi, R., Eds.; Springer International Publishing: Cham, Switzerland, 2014; pp. 71–84. [Google Scholar]
  22. Light and Heavy-Duty Natural Gas Vehicle 2025–2033 Overview: Trends, Competitor Dynamics, and Opportunities. 6 December 2025. Available online: https://www.archivemarketresearch.com/reports/light-and-heavy-duty-natural-gas-vehicle-130967# (accessed on 19 December 2025).
  23. Lindholm, M.; Behrends, S. Challenges in urban freight transport planning—a review in the Baltic Sea Region. J. Transp. Geogr. 2012, 22, 129–136.23. [Google Scholar] [CrossRef] [Scilit]
  24. Hagos, D.A.; Ahlgren, E.O. Well-to-wheel assessment of natural gas vehicles and their fuel supply infrastructures—Perspectives on gas in transport in Denmark. Transp. Res. D Trans. Environ. 2018, 65, 14–35. [Google Scholar] [CrossRef] [Scilit]
  25. Capar, I.; Kuby, M. An efficient formulation of the flow refueling location model for alternative-fuel stations. IIE Trans. 2012, 44, 622–636. [Google Scholar] [CrossRef] [Scilit]
  26. Ihrig, J.; Jochem, P. How to apply the four-step model for 150,000 travel zones: The HIPAT model. In Proceedings of the World Conference on Transport Research (WCTR), Montréal, QC, Canada, 17–21 July 2023. [Google Scholar]
  27. Savickis, J.; Zemite, L.; Zeltins, N.; Bode, I.; Jansons, L. The natural gas and biomethane in the European road transport: The Latvian perspective. Latv. J. Phys. Tech. Sci. 2020, 57, 57–72. [Google Scholar] [CrossRef] [Scilit]
  28. Savickis, J.; Zemite, L.; Zeltins, N.; Bode, I.; Jansons, L.; Dzelzitis, E.; Ansone, A. The Biomethane injection into the natural gas networks: The EU’s gas synergy path. Latv. J. Phys. Tech. Sci. 2020, 57, 34–50. [Google Scholar] [CrossRef] [Scilit]
  29. Cabinet of Ministers Government of the State of Latvia. Cabinet Regulation No. 312: Procedures for the Supply of Energy Users and Sale of Heating Fuel During Declared Energy Crisis and in Case of Endangerment to the State. Available online: https://likumi.lv/ (accessed on 1 November 2025).
  30. National Energy and Climate Action Plan of The Republic of Lithuania for 2021–2030. Available online: https://commission.europa.eu/document/download/e4569d35-7ab0-4445-8fa6-017357d04546_en?filename=LT_FINAL%20UPDATED%20NECP%202021-2030%20%28English%29.pdf (accessed on 3 July 2025).
  31. Estonian Competition Authority–Konkurentsiamet. Electricity and Gas Markets in Estonia Report 2022. 2023. Available online: https://www.ceer.eu/wp-content/uploads/2024/04/C23_Estiona_EN.pdf (accessed on 26 July 2025).
  32. Estonian Competition Authority–Konkurentsiamet. Analysis of SSLNG Market Potential in the Baltic States; United States Department of Energy: Washington, DC, USA, 2021. Available online: https://kliimaministeerium.ee/media/10270/download (accessed on 22 July 2025).
  33. Spetha, D.; Sauter, V.; Plötz, P.; Signer, T. Synthetic European road freight transport flow data. Data Brief 2022, 40, 107786. [Google Scholar] [CrossRef] [Scilit] [PubMed]
  34. Li, Y.; Li, W.; Yu, Y.; Bao, L. Planning of LNG filling stations for road freight: A case study of Shenzhen. Transp. Res. Procedia 2017, 25, 4580–4588. [Google Scholar] [CrossRef] [Scilit]
  35. Chen, S.P.; Ren, J.P.; Li, Y.N.; Ma, Z.P. Development status and prospects of skid-mounted LNG vehicle filling station. Gas Technol. 2013, 4, 10–14. [Google Scholar]
  36. Frick, M.; Axhausen, K.W.; Carle, G.; Wokaun, A. Optimization of the distribution of compressed natural gas (CNG) refueling stations: Swiss case studies. Transp. Res. Part D Transp. Environ. 2007, 12, 10–22. [Google Scholar] [CrossRef] [Scilit]
  37. Rose, P.K.; Nugroho, R.; Gnann, T.; Plötz, P.; Wietschel, M.; Reuter-Oppermann, M. Optimal development of alternative fuel station networks considering node capacity restrictions. Transp. Res. Part D Transp. Environ. 2020, 78, 102189. [Google Scholar] [CrossRef] [Scilit]
  38. Ko, J.; Gim, T.-H.T.; Guensler, R. Locating refuelling stations for alternative fuel vehicles: A review on models and applications. Transp. Rev. 2017, 37, 551–570. [Google Scholar] [CrossRef] [Scilit]
  39. Wang, Y.-W.; Wang, C.-R. Locating passenger vehicle refueling stations. Transp. Res. Part E Logist. Transp. Rev. 2010, 46, 791–801. [Google Scholar] [CrossRef] [Scilit]
  40. Need-Driven Research Projects, Research Council of Lithuania. Needs and Opportunities for Zero Emissions, Renewable Energy and the Use of Transitional Alternative Fuels in the Transport Sector. 2023. Available online: https://fmed.ktu.edu/projects/needs-and-opportunities-for-zero-emissions-renewable-energy-and-the-use-of-transitional-alternative-fuels-in-the-transport-sector/ (accessed on 6 January 2025).
  41. Protocol of the Discussions Between Experts from the City Planning and Architecture Division at Kaunas City Municipality (KAUET). 9 March 2010. Available online: https://kamane.lt/Kamanes-tekstai/2010-metai/Kovas/KAUET-DISKUSIJU-ERDVE-TARP-KAUNO-PILIES-IR-7-NAUJU-DEGALINIU (accessed on 8 September 2024).
  42. Raslavičius, L.; Keršys, A.; Mockus, S.; Keršienė, N.; Starevičius, M. Liquefied petroleum gas (LPG) as a medium-term option in the transition to sustainable fuels and transport. Renew. Sustain. Energy Rev. 2014, 32, 513–525. [Google Scholar] [CrossRef] [Scilit]
  43. Lithuania’s Transport and Communications Development Strategy Until 2050. Approved by Order No. 3-746 (7 December 2020) of the Minister of Transport and Communications of the Republic of Lithuania. 2020. Available online: https://sumin.lrv.lt/uploads/sumin/documents/files/Strategija%202050%20m_%202020-12-07_Nr_%203-746(1).pdf (accessed on 12 December 2024). (In Lithuanian)
  44. State Data Agency, Statistics Lithuania: Road Transport. Available online: https://osp.stat.gov.lt/keliu-transportas (accessed on 6 August 2024).
  45. State Enterprise Regitra (Public Services of Registration of Motor Vehicles), Official Website. Available online: https://www.regitra.lt/en (accessed on 23 October 2024).
  46. COPERT Guidebook Updates, New Elements in 2021. European Environment Agency. 2021. Available online: https://copert.emisia.com/wp-content/uploads/files/docs/COPERT_v5.5_Report.pdf (accessed on 3 February 2024).
  47. Baltrėnas, P.; Vaitiekūnas, P.; Vasarevičius, S.; Jordaneh, S. Modeling the dispersion of automobile exhaust gases (In Lithuanian: Automobilių išmetamų dujų sklaidos modeliavimas). J. Environ. Eng. Landsc. Manag. 2008, 16, 65–75. [Google Scholar] [CrossRef] [Scilit]
  48. Ntziachristos, L.; Gkatzoflias, D.; Kouridis, C.; Samaras, Z. COPERT: A European Road Transport Emission Inventory Model. In Information Technologies in Environmental Engineering; Environmental Science and Engineering; Athanasiadis, I.N., Rizzoli, A.E., Mitkas, P.A., Gómez, J.M., Eds.; Springer: Berlin/Heidelberg, Germany, 2009. [Google Scholar]
  49. LNG Prime, Official Website. Vlantana Launches First Lithuanian LNG Station. 5 June 2024. Available online: https://lngprime.com/europe/vlantana-launches-first-lithuanian-lng-station/114067/ (accessed on 16 October 2025).
  50. Liss, W.E.; Thrasher, W.H. Natural Gas as a Stationary and Vehicular Fuel; SAE Paper No. 912364; SAE: Warrendale, PA, USA, 1991. [Google Scholar]
  51. Compressed Natural Gas Fuel use Training Manual; Report Number: UMTA-VA-06-0056-92.1; Dapartment of Transportation/The Federal Transit Administration (FTA): Springfield, VA, USA, 1992.
  52. National Fire Protection Association (NFPA). NFPA-58 Standard for the Storage and Handling of Liquefied Petroleum Gases. 2004 Edition. Available online: https://dsps.wi.gov/Documents/Programs/Gas/CodeArchives/1984ILHR11NFPA58LPG.pdf (accessed on 12 June 2025).
  53. Norris, J.; Stones, P.; Reverault, P. Light Goods Vehicle—CO2 Emissions Study: Final Report (AEAT/ENV/R/2849). Framework Ref. PPRO 04/045/004 Lot 2. AEA Technology, Didcot, Oxfordshire. 22 March 2010. Available online: https://www.zemo.org.uk/assets/reports/van%20co2%20final%20report.pdf (accessed on 6 June 2025).
  54. Announcements: Transport and storage of LPG and LNG. Int. J. Press. Vessels Pip. 1983, 12, 191–192. [CrossRef] [Scilit]
  55. Mockus, S. The Influence of Gaseous Fuel on the Characteristics of Car Engines. Ph.D. Thesis, Kaunas University of Technology, Kaunas, Lithuania, 2007. [Google Scholar]
  56. Venkatesh, N.H.; Raslavičius, L. A National Innovation System concept-based analysis of autonomous vehicles’ potential in reaching zero-emission fleets. Technologies 2024, 12, 26. [Google Scholar] [CrossRef] [Scilit]
  57. ViaLietuva, Official Website. Traffic Volumes. Available online: https://vialietuva.lt/en/traffic-volumes (accessed on 13 January 2024).
  58. Ministry of Environment of the Republic of Lithuania, official webpage. Lithuania’s National Inventory Report 2020. Greenhouse Gas Emissions 1990–2018. Vilnius, 2020. Available online: https://unfccc.int/sites/default/files/resource/NID_2025.pdf (accessed on 22 March 2024).
  59. Ministry of Environment of the Republic of Lithuania, official webpage. Lithuania’s National Inventory Report 2025. Greenhouse Gas Emissions 1990–2023. Vilnius, 2025. Available online: https://unfccc.int/sites/default/files/resource/NID_2025.pdf (accessed on 7 April 2024).
  60. Smith, M.; Gonzales, J. Costs Associated with Compressed Natural Gas Vehicle Fueling Infrastructure. DOE/GO-102014-4471. September 2014. Available online: https://docs.nrel.gov/docs/fy14osti/62421.pdf (accessed on 22 June 2025).
  61. TEN-T Maps of the European Transport Corridors. Available online: https://transport.ec.europa.eu/transport-themes/infrastructure-and-investment/trans-european-transport-network-ten-t/tentec-information-system-and-ten-t-map-library/ten-t-maps-european-transport-corridors_en (accessed on 30 August 2025).
  62. Kim, H.-S.; Cho, C.-H. An economical boil-off gas management system for LNG refueling stations: Evaluation using scenario analysis. Energies 2022, 15, 8526. [Google Scholar] [CrossRef] [Scilit]
  63. Sardo, S.; Pfotenhauer, S.M. Technology discontinuation as a continuous process: Diesel, sustainability, and the politics of delay. Res. Policy 2025, 54, 105198. [Google Scholar] [CrossRef] [Scilit]
  64. Turbienė, J.; Briuchoveckaja, I.; Puodžiukienė, D. Comparative analysis of road freight transport indicators of Lithuanian counties. Sust. Environ. Dev. 2025, 1, 8–22. [Google Scholar] [CrossRef] [Scilit]
  65. The European Rail Freight Market Competitive Analysis and Recommendations. Study on Behalf of European Rail Freight Association (ERFA). Final Report. April 2022. Available online: https://erfarail.eu/uploads/The%20European%20Rail%20Freight%20Market%20-%20Competitive%20Analysis%20and%20Recommendations-1649762289.pdf (accessed on 6 December 2025).
  66. Arman, A.; Badii, C.; Bellini, P.; Bilotta, S.; Nesi, P.; Paolucci, M. Analyzing Demand with Respect to Offer of Mobility. Appl. Sci. 2022, 12, 8982. [Google Scholar] [CrossRef] [Scilit]
  67. Cordova-Pozo, K.; Rouwette, E.A.J.A. Types of scenario planning and their effectiveness: A review of reviews. Futures 2023, 149, 103153. [Google Scholar] [CrossRef] [Scilit]
  68. Lee, J.; Kim, S.; Ahn, S.; Kim, J. What-if Scenario Analysis of Regional Air Mobility Operations in South Korea. In Proceedings of the International Council of the Aeronautical Sciences (ICAS), Florence, Italy, 9–13 September 2024. [Google Scholar]
  69. Kolkman, T.F.C. The Business Model of Gas Stations in the Future. Master’s Thesis, University of Twente, Enschede, The Netherlands, 2022. [Google Scholar]
  70. DaSilva, C.M.; Trkman, P. Business Model: What It Is and What It Is Not. Long-Term Plans 2014, 47, 379–389. [Google Scholar] [CrossRef] [Scilit]
  71. Azimont, F.; Araujo, L. The making of a petrol station and the “on-the-move consumer”: Classification devices and the shaping of markets. Ind. Mark. Manag. 2010, 39, 1010–1018. [Google Scholar] [CrossRef] [Scilit]
  72. Northern Gas Networks, Official Website. RIIO-GD1 Business Plan (2012–2021). Available online: https://www.northerngasnetworks.co.uk/document-library/ (accessed on 8 January 2026).
  73. Mitrică, E. Economic analysis of the initial investment for intermediary introduction of compressed natural gas in Romania. Energy Sustain. Dev. 2023, 76, 101270. [Google Scholar] [CrossRef] [Scilit]
Figure 1. Fragments of input and output parameters used for COPERT model: (a) environment-related information distinctive to Lithuania (temperature, humidity), (b) cumulate fragment of LDV-HDV stock (vehicle types, fuel, segment, Euro standard, population, stock), and (c) overall HDV emission output (CO2, t).
Infrastructures 11 00045 g001
Figure 2. The North Sea–Baltic corridor (the territory of Lithuania falls within the green circle area) and existing LNG refuelling stations. This content has been reprinted with permission from Ref. [61].
Infrastructures 11 00045 g002
Figure 3. CNG filling station network in EU countries. This content has been reprinted with permission from Ref. [61].
Infrastructures 11 00045 g003
Figure 4. LNG filling station network in EU countries. This content has been reprinted with permission from Ref. [61].
Infrastructures 11 00045 g004
Figure 5. Forecast of changes in freight transport volumes and passenger car numbers until 2030. The light blue shows the projection of freight transport volumes from 2018 to 2030, since the study was published in 2020 and the last statistical data was for 2018.
Infrastructures 11 00045 g005
Figure 6. Total emissions of CO2 from road freight transport: (a) 2022, (b) 2030–2035.
Infrastructures 11 00045 g006aInfrastructures 11 00045 g006b
Figure 7. Projections of LNG-FS locations in Lithuania.
Infrastructures 11 00045 g007
Figure 8. Projections of possible expansion of the NG-FS network: (a) for PC fleet (CNG only), (b) for HDV fleet (LNG only), (c) for LDV fleet (CNG only).
Infrastructures 11 00045 g008
Table 1. The number of CFSs in the largest cities of Lithuania [40].
CityPopulation StatisticsNumber of CFSs (2010 Data)Number of CFSs per 1000 Inhabitants
Vilnius546,733 (602,430 *)110 (121 *)0.2012 (0.2008 *)
Kaunas352,279 (304,210 *)100 (~100 *)0.2840 (0.3287 *)
Klaipeda183,433 (159,403 *)30 (~42 *)0.1635 (0.2635 *)
Siauliai126,215 (110,463 *)31 (~35 *)0.2456 (0.3168 *)
Panevėžys112,619 (86,606 *)21 (~34 *)0.1865 (0.3926 *)
Alytus67,505 (51,353 *)14 (14 *)0.2074 (0.2726 *)
Marijampole46,692 (36,704 *)11 (21 *)0.2356 (0.5721 *)
* 2024 data.
Table 2. Properties of CNG and LNG and features of their use [41,49,50].
CharacteristicsCNGLNG
Energy content37–40 MJ/m325 MJ/L
Octane number 120120
Higher heating value46–49 MJ/kg45.5 MJ/kg
Storage High pressure vessels
(up to 34.5 MPa)
Cooled (−165 °C) [51] moderate pressure tanks (up to 1.1 MPa)
Filling a fuel tankSpecial connector for high pressure fuelSpecial cooled fuel connector
Vapor recoveryNot applicableNecessary
Danger of being nearby
  • Physically dangerous due to high pressure
  • Can cause injuries or embolism
  • Vapour lighter than air
  • Ignites much easier than diesel
Risk of fire
  • Released gas is lighter than air
  • Ignites much easier than diesel.
  • Vapour lighter than air
  • Ignites much easier than diesel
Facilitation of fire preventionVentilation and/or explosion-proof equipment at ceiling level or in a pit
  • Ventilation and/or explosion-proof equipment at ceiling level or in a pit.
  • Ethane detectors are desirable as gas has no odour.
Automatic fire extinguishingDesirableDesirable
Output costs compared with dieselHigher compared to dieselHigher compared to diesel
Operation costs compared with dieselSimilar to those of dieselSimilar to those of diesel
Retrofit cost (Euro/Otto engine) for small/medium/large cars [41,52]1640–2190/N/A/N/A1640–2190/N/A/N/A
Operation and maintenance costs (Euro/km) for small/medium/large cars [41,52]0.03/0.04/0.050.03/0.04/0.05
Base energy consumption (KJ/km) for small/medium/large cars [41,52]2.2/2.6/4.12.2/2.6/4.1
GHG emissions (g/km) for small/medium/large cars [41,52]93.3/108.3/165.793.3/108.3/165.7
Table 3. COPERT input parameters used for assessment of emission scenario for the year 2022 and time horizon of 2030–2035.
Input ParametersLDV (N1)
2022
HDV (N2)
2022
HDV (N3)
2022
LDV (N1)
2030–2035
HDV (N2)
2030–2035
HDV (N3)
2030–2035
Total Stock65,83635,45141,98472,41938,99649,541
Change in stock composition, %---+10%+10%+18%
Participate in traffic, %.75%75%75%75%75%75%
Participate in traffic, pcs.49,37726,588.2531,48854,31429,24737,156
Fuel type:
Petrol2.500000
Diesel97.5100100707070
Petrol/Gas000303030
Petrol/Electric000000
Electricity000000
Mean Activity250022506500250022506500
Euro Assumptions:
Euro 50.4500000
Euro 6 a/b/a0.250.50.50.30.250.25
Euro 6 d0.150.30.30.10.150.15
Euro 6 d temp0.150.20.20.60.60.6
Table 4. A breakdown of equipment costs for the CNG and LNG refuelling stations [59,60].
Equipment/ParameterCNGLNG
Compressor and pump
3.5–29 m3/h
36–70 m3/h
85–130 m3/h
170–260 m3/h
430–1100 m3/h
€3760–20,000
€47,000–85,000
€75,000–140,000
€94,000–235,000
€190,000–517,000
N/A
N/A
N/A
€73,000–284,000
N/A
Dispenser€23,000–56,000€56,500
Storage tank€66,000–122,000€175,200
Gas dryer €9400–282,000N/A
Vaporiser and other equipmentN/A€76,600
Card reader€9400–28,000€9400–28,000
Table 5. Variation in overall number of road freight transport operators by district in the period between 2020 and 2025.
ParameterBaselineGrowth Factor RemarkResulting Effect on CO2 eq.
No-change scenario for 2035
Diesel fleet 2022 (emissions total)1.001.00-2784 kton CO2 eq.
Growth change factor (%)1.001.1010% growth driven by freight demand+278.4 CO2 eq.
Emission change factor (%)1.001.1010% pollution increase due to fleet ageing+306.2 CO2 eq.
Subtotal diesel 3368.6 kton CO2 eq.
Dual fuel 30–diesel fuel 70% scenario for 2035
Diesel fleet growth change factor (%)1.000.7710% growth driven by freight demand2143.6 kton CO2 eq.
Diesel fleet emission change factor (%)1.001.10 +214.4 CO2 eq.
Total diesel 2358 CO2 eq.
Dual fuel change factor (%)1.000.33/1.110% growth driven by freight demand, 25% emission reduction689 kton CO2 eq.
Total dual-fuel 30–diesel fuel 70% 3045 kton CO2 eq.
Dual fuel 10–diesel fuel 90% scenario for 2035
Diesel fleet growth change factor (%)1.000.9/1.110% growth driven by freight demand, 10% pollution increase due to fleet ageing3032 kton CO2 eq.
Dual-fuel change factor (%)1.000.1/1.110% growth driven by freight demand, 25% emission reduction+252.6 kton CO2 eq.
Total dual-fuel 10–diesel fuel 90% 3284 kton CO2 eq.
Table 6. Variation in overall number of road freight transport operators by district in the period between 2020 and 2025.
Lithuania’s Districts200020212022202320242025Trend 2010–2025
Vilnius district148814971576166620012097+41.0%
Kaunas district 10169851044111012121251+23.5%
Klaipėda district 727731752760850860+17.3%
Šiauliai district 599585624631672684+14.2%
Panevėžys district 449448461481533532+18.5%
Marijampolė district359371394399447442+23,1%
Alytus district286286289296344351+22.7%
Tauragė district224223230233253253+12.9%
Table 7. Forecasting of the total fixed investment in expanding the NG-FS network.
Vehicle Category10% Market Share of
NG Vehicles
20% Market Share of
NG Vehicles
30% Market Share of
NG Vehicles
Investment Option
Min.Max.Min.Max.Min.Max.
PC€101.7 M€153 M€203.4 M€306 M€305.1 M€459 M
LDV€7.91 M€11.9 M€14.7 M€22.1 M€22.6 M€34 M
HDV€21.47 M€32.3 M€42.9 M€64.6 M€64.4 M€96.9 M
Total€131.1 M€197.2 M€261 M€392.7 M€392.1 M€589.9 M
Disclaimer/Publisher’s Note: The statements, opinions and data contained in all publications are solely those of the individual author(s) and contributor(s) and not of MDPI and/or the editor(s). MDPI and/or the editor(s) disclaim responsibility for any injury to people or property resulting from any ideas, methods, instructions or products referred to in the content.