1. Introduction
As the primary load-bearing component of transportation infrastructure, the highway subgrade directly governs network serviceability and traffic safety. China’s total highway mileage has surpassed 5.4368 million km as of 2024. The proportion of heavy-load traffic continues to rise. As a result, concealed subgrade distresses under coupled dynamic loading and complex environmental actions have become critical bottlenecks to in-service performance. These distresses include insufficient base strength, uneven settlement, and base cracks. These distresses evolve progressively. Routine visual inspections often fail to capture their early development. Mechanical degradation is therefore frequently recognized only after sudden structural failure, posing serious threats to traffic safety.
Currently, subgrade disease identification and detection commonly employ the Falling Weight Deflectometer (FWD) and Ground-Penetrating Radar (GPR). For FWD applications, Bishal et al. [
1] calibrated FWD test data with basic pavement characteristics such as layer thickness, air-void content, asphalt binder proportion, traffic loading (e.g., ESAL), and mean annual temperature. Liu et al. [
2] integrated Accelerated Pavement Testing (APT) with FWD surveys to design a method for monitoring mechanical responses at and below the pavement surface and used it to assess pavement strength. Paweł et al. [
3] investigated deflections obtained from computational models under different loading frequencies to examine sensitivity. Sylwester M. et al. [
4] used FWD to measure bearing capacity and compaction and validated accuracy across road sections under varying scenarios. Mohammed et al. [
5] combined FWD data with laboratory dynamic modulus measurements on field cores to more accurately estimate pavement response and performance. Nicola et al. [
6] developed an integrated approach to predict the stiffness modulus of asphalt concrete layers on airport runways from FWD data, demonstrating reliable performance evaluation for airport pavements and other paved areas. AMASCE et al. [
7] noted that FWD is the most widely accepted non-destructive technique for highways, used to analyze or back-calculate pavement responses to impact loads to evaluate in-situ layer moduli. Van Phuc et al. [
8] conducted FWD testing and field coring at 26 sites, comparing back-calculated moduli with laboratory values [
9]; based on the frequency–temperature superposition principle, they proposed and validated a frequency–temperature correction model against existing temperature corrections.
For GPR, Shen et al. [
10] developed attribute-analysis techniques and established a technical framework for evaluating the quality of ground improvement, verifying effectiveness and accuracy. Berthold et al. [
11] systematically studied how GPR system parameters affect image quality, discussed evaluation methods for radar signatures of buried targets, and analyzed how different system configurations influence final image quality. Li et al. [
12] proposed a new algorithm that fuses serialized radar data via wavelet transforms with time-domain image features to improve subsurface target classification accuracy. Qiao et al. [
13] introduced a method that enhances GPR disease-recognition accuracy by addressing the inversion of travel-time data; field tests showed better accuracy than commonly used approximate forward models. Xu et al. [
14] applied deep neural networks to process GPR signals, using radar images as inputs and producing structural information related to strata and lithology as outputs. Cui et al. [
15] realized an end-to-end “image-in” scheme with GPR, and validations at multiple dataset scales paved the way for estimating additional root-related attributes. Cao et al. [
16] proposed a generative-adversarial data augmentation strategy that synthesizes representative damage samples under limited data, significantly improving FWD-based pavement-disease classification; gains in both classification accuracy and FID verified its reliability in strengthening FWD detection performance. Chi et al. [
17] developed a high-order finite-difference time-domain 3D code for airborne GPR simulation and verified accuracy against traditional methods. Qiu et al. [
18] presented a deep-learning-based real-time GPR detection technique that preprocesses image signals to improve SNR and image quality. Li et al. [
19] proposed an effective GPR-based method for locating concealed cracks; validation showed markedly higher localization accuracy than earlier approaches, providing a solid basis for engineering practice.
Each detection instrument for subgrade diseases has distinct strengths and limitations. Therefore, relying on a single technique often provides incomplete diagnostic information. Accordingly, this study integrates FWD and GPR for combined detection to offset individual weaknesses. Core drilling is then used to obtain samples from each structural layer, from which layerwise constitutive data are measured to validate detection effectiveness. A common limitation of current instruments, however, is that they primarily identify existing problems and lack explanatory power for the development mechanisms and initiation of subgrade diseases. In contrast, the Abaqus platform can simulate stress distributions during disease evolution. Constitutive parameters derived from cores provide material inputs for a finite-element (FE) model of the subgrade, enabling mechanistic analysis and origin tracing of subgrade diseases based on simulated stress fields.
Regarding FE modeling with Abaqus, Yang et al. [
20] simulated subgrade compaction by varying roller and fill parameters (elastic modulus, rolling speed, excitation force, vibration frequency, and lift thickness) to study their combined effects on compaction quality. Saima et al. [
21] developed a 3D FE model that considered elastic modulus and base thickness and validated the model through experiments. Bai et al. [
22] established a coupled 3D FE model of high-speed trains, ballastless track, and subgrade to investigate vibration responses and summarized dynamic characteristics of subgrades in karst regions. Xu et al. [
23] built a 3D FE model for railway subgrades, using vertical nodal coordinates of the mesh to simulate different spectra and obtain dynamic response data for base layers. Xiong et al. [
24] used a Python-based batch FE analysis workflow in Abaqus 2022 to compute deflection responses of theoretical pavement structures, further reducing errors in structural modulus estimation. Fang et al. [
25] constructed a 3D FE model of high-speed railway subgrades in Abaqus to analyze the mechanical behavior of polymer grouting repair under different material types, heights, and densities. Wang et al. [
26] performed FE analyses of subgrade responses to provide theoretical support for construction design.
Most existing studies focus on single detection technologies or empirical evaluations; systematic investigations into the mechanical evolution of diseases and the coupling of multi-scale detection technologies remain limited [
27,
28]. Addressing this gap, the present work uses expressways as the engineering context and innovatively constructs a progressive diagnostic framework comprising macro-screening, precise localization, and constitutive interpretation [
29]. FWD is first used to measure deflection and identify weak-capacity zones based on deflection-bowl characteristics; GPR then scans the anomalous areas, using electromagnetic reflection features for visual localization of diseases. Finally, core drilling verifies the specific disease types and provides key constitutive parameters for different subgrade structures. An FE model incorporating material nonlinearity is established from these data and subjected to loading, after which the structural stress response is analyzed. The underlying causes of subgrade diseases are thus interpreted and explained.
The main contributions of this study are threefold. First, a multi-scale coupled diagnostic framework integrating FWD screening, GPR imaging, and core-based constitutive characterization is established. Second, field-derived mechanical parameters are directly incorporated into a three-dimensional FE model to interpret distress evolution mechanisms. Third, typical subgrade distress scenarios are systematically simulated to reveal stress concentration and deformation patterns, providing engineering insights for pavement maintenance.
2. Field Investigation and Constitutive Data Acquisition
2.1. Research Area and Investigation Purpose
The Linqu section of the Changshen Expressway in China serves as the core study area. As a key corridor within Shandong’s highway network, this segment endures coupled influences from heavy traffic and complex environments. These include temperature-moisture cycles and rainfall erosion. As a result, typical subgrade distresses emerge. These include insufficient base strength, uneven settlement, and base cracks. Their development patterns and mechanical responses are representative of Shandong’s highway subgrades. Focusing on this segment anchors the study in a concrete engineering context. It also provides a representative case for exploring common subgrade distress evolution mechanisms.
Both handheld and vehicle-mounted FWD instruments measured pavement stiffness. Comparing stiffness across locations efficiently located segments with insufficient capacity, after which high-risk zones underwent deeper investigation. Upon confirming stiffness-deficient stretches, GPR scanning characterized disease types within the active subgrade zone. Next, coring at sites reflecting distinct disease categories yielded systematic samples from each structural layer. During drilling, depth and thickness for every layer were logged in detail, enabling precise layer discrimination during analysis. Subsequent testing on the samples covered physical and mechanical properties, including compressive strength, shear strength, elastic modulus, and deformation characteristics, thereby supplying structural and mechanical datasets for various disease types and underpinning a deeper understanding of distress behavior. Subsequent testing on the samples covered physical and mechanical properties such as compressive strength, shear strength, elastic modulus, and deformation characteristics, thereby supplying structural and mechanical datasets for various disease types and underpinning a deeper understanding of distress behavior.
Quantitative assessment relied on vehicle-mounted FWD field testing. Measurement points used 25 m spacing for spatial representativeness; each point followed a “three impacts, use the third reading” protocol, effectively suppressing random error. Deflection bowls—relationships between center-load deflection and radial distance—enabled comparison across disease types such as base cracks and subgrade stiffness decay, delivering severity grading and precise delineation of affected extents.
For disease recognition, GPR provided non-destructive detection and visual stratification. Processing adhered to a standardized pipeline consisting of raw-trace transfer, distance normalization, filtering denoising, and geological interpretation, thereby reducing distortion from sensor–target spacing changes and limiting noise. Radar-image interpretation resolved interlayer settlement, structural voids, material loosening, and extended reflective cracking. In critical zones such as bridge approaches, the actual distribution of base-bottom voids became clear, furnishing intuitive imagery for classification and grading.
Base-layer strength testing then supported back-analysis of subgrade support-stiffness evolution and extraction of key constitutive parameters. The coring plan specified layout principles, site selection, and core dimensions; equipment requirements included sufficient stiffness, operational stability, and water-cooling capability. Sampling followed the sequence of waterway check, constant-rate drilling, core extraction, classification and sealing, and hole repair. Qualified cores then underwent cutting, end-facing, and moist curing before mechanical testing. This workflow revealed spatial variability in support stiffness via mixture gradation variations and delivered direct measurements of constitutive parameters—resilient modulus, soil shear strength—establishing a reliable experimental basis for numerical simulation and theoretical analysis of disease-formation mechanisms.
2.2. Subgrade Stiffness Detection Based on FWD
FWD is a key nondestructive device in highway engineering for evaluating subgrade bearing capacity and recoverable resilient response. Its principle is that a controlled free-fall hammer generates a short impulse load that emulates vehicle dynamics, producing an instantaneous surface deflection. Multi-offset displacement sensors record deflections at various radii in real time, from which layerwise resilient moduli and overall stiffness are back-calculated.
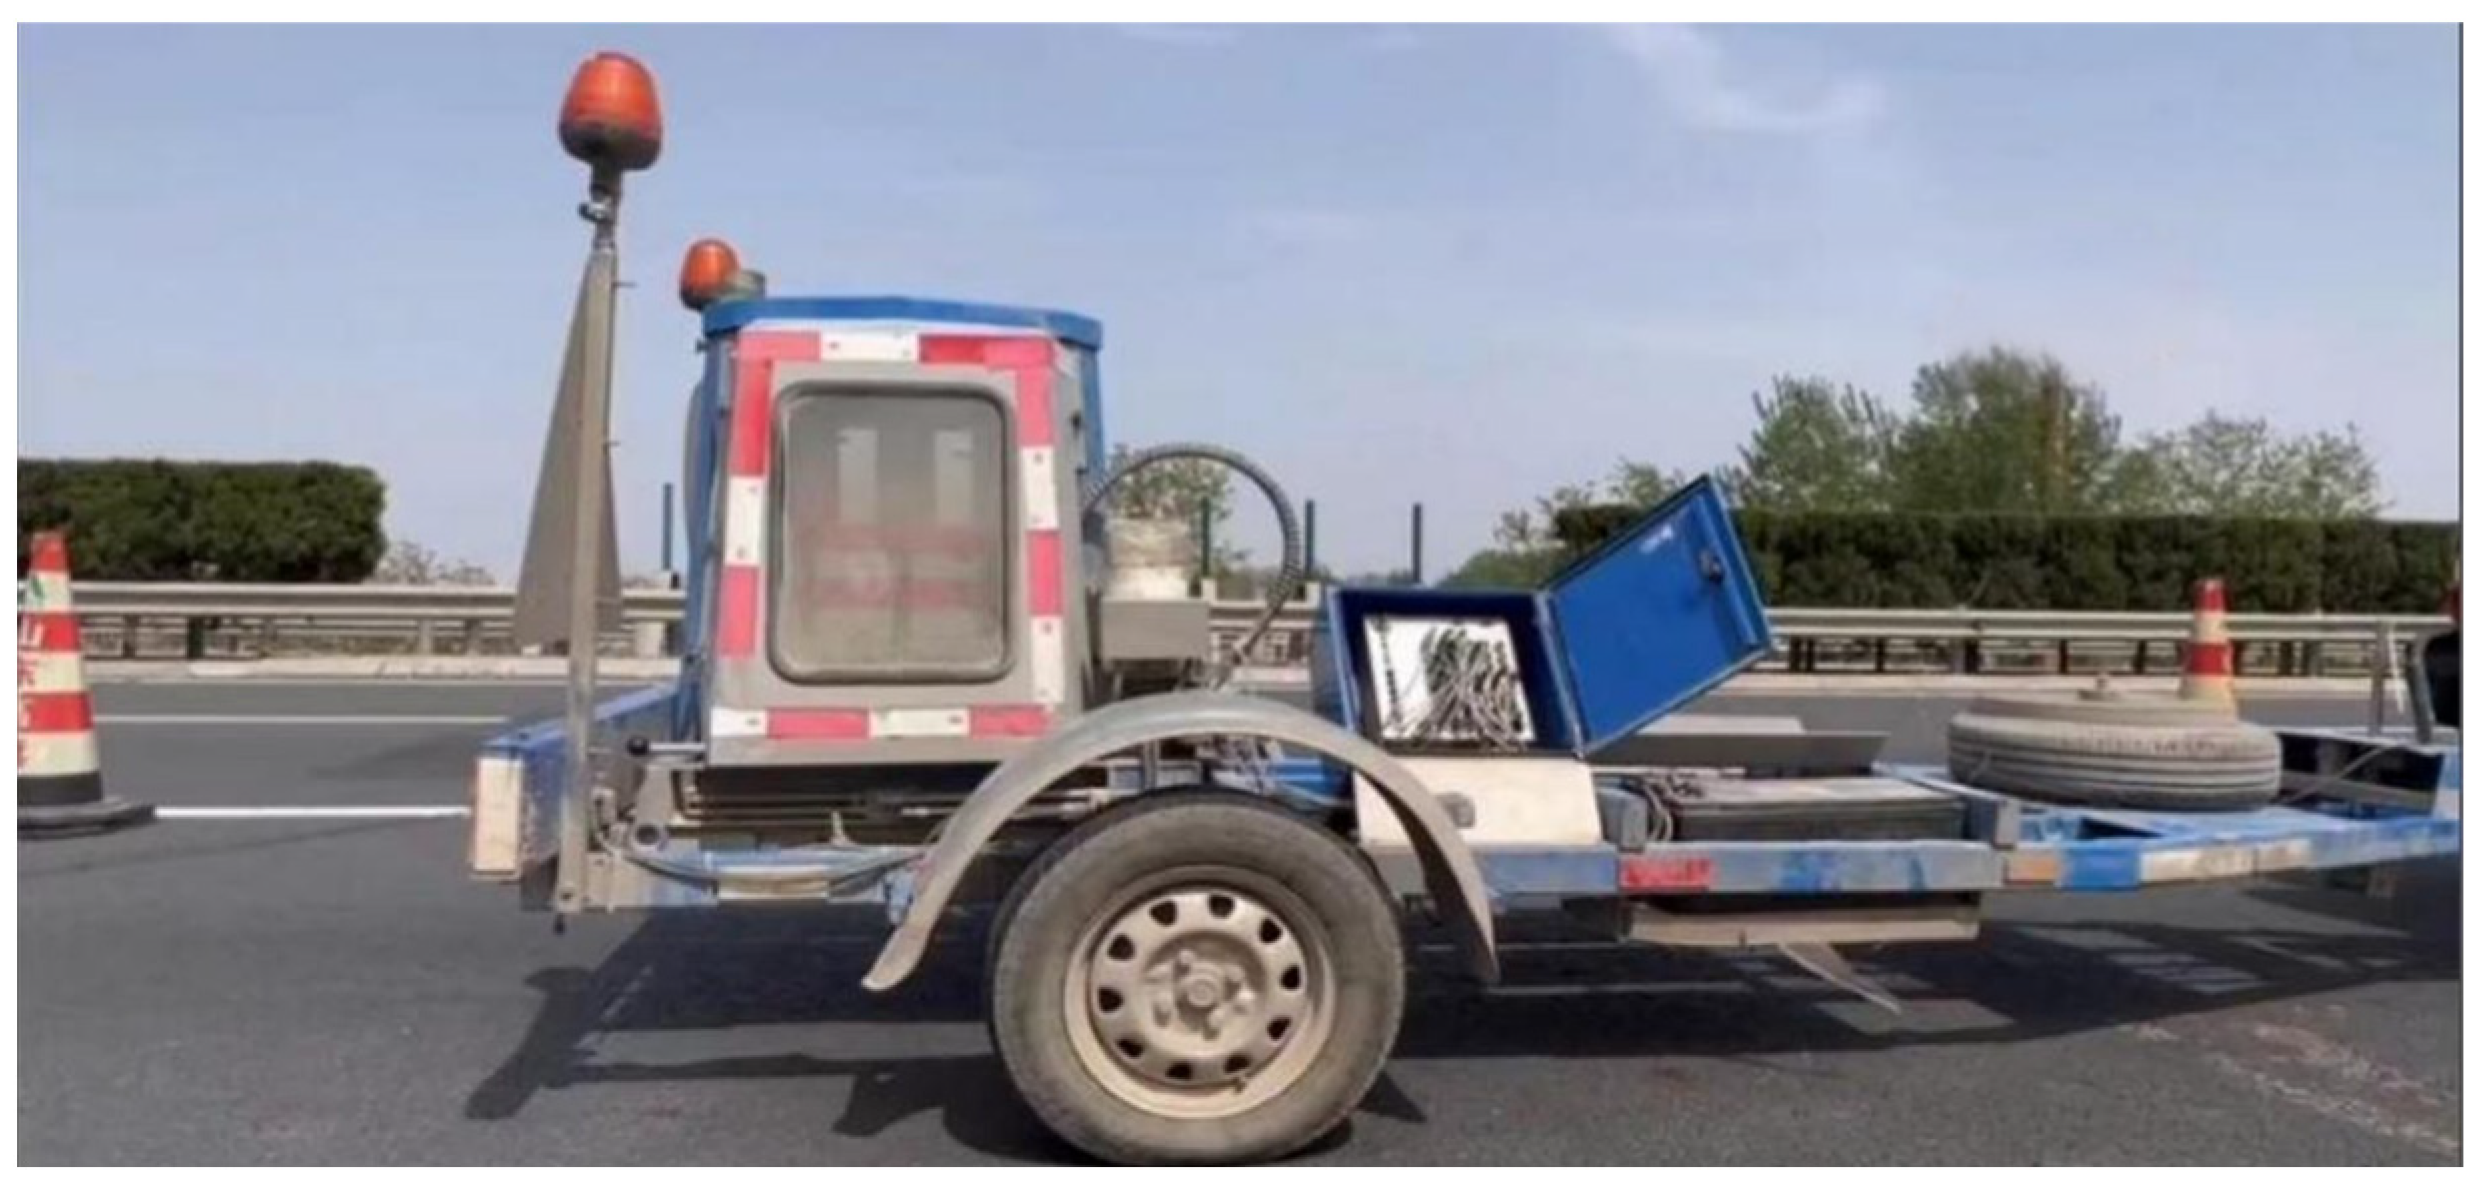
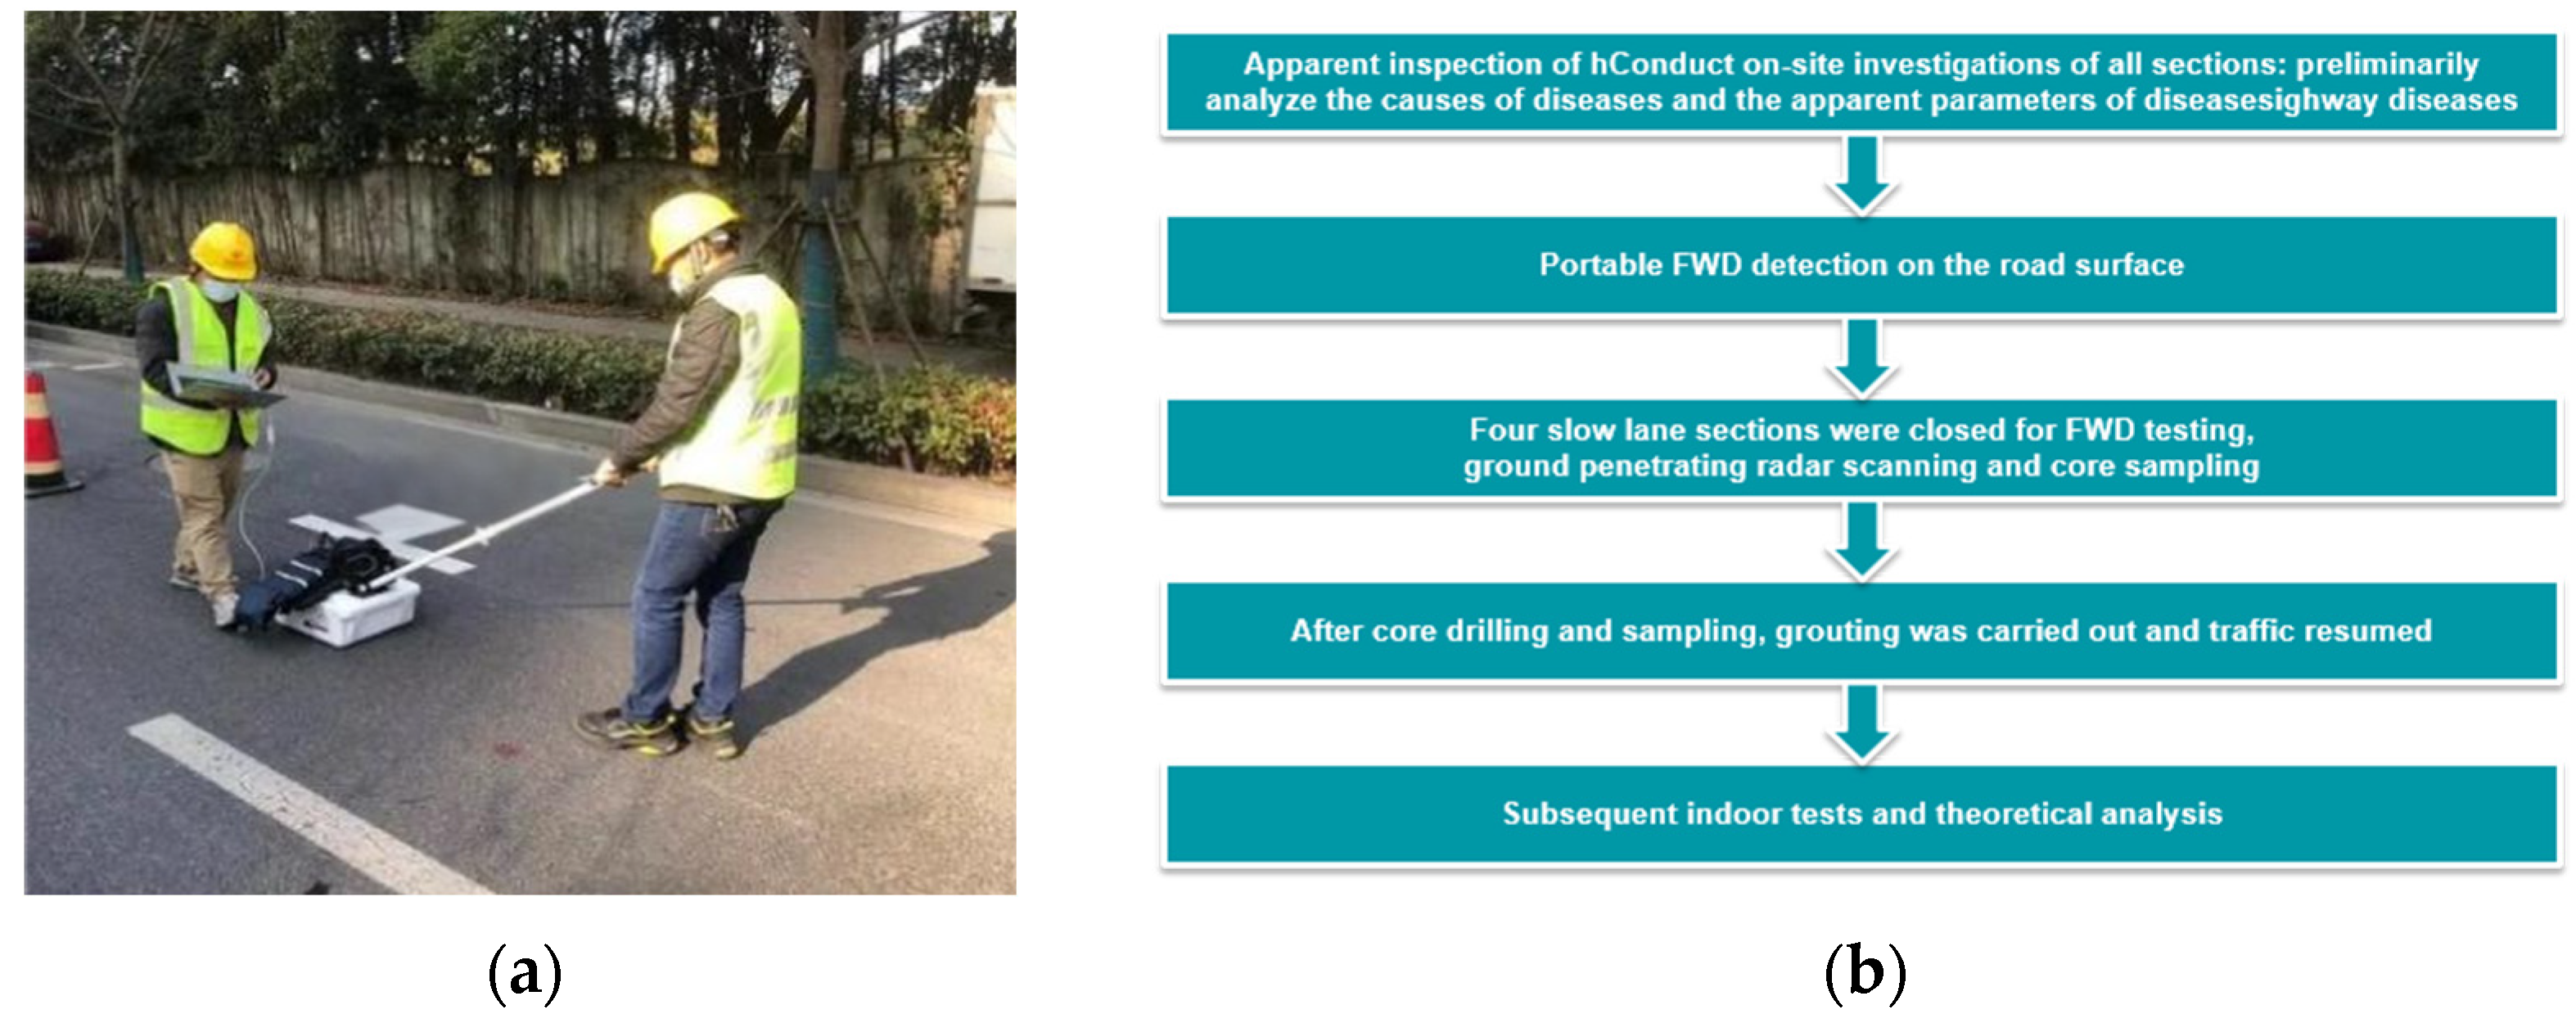
This study employed both handheld and vehicle-mounted FWD systems, as shown in
Figure 1. The handheld unit was used for rapid spot checks over localized distresses, while the vehicle-mounted system integrated hydraulic control and computerized acquisition for efficient multi-point measurements during continuous driving. Before each test, the load plate surface was cleaned and the guide rod kept vertical. Each test point was impacted three times, and the average value was used to enhance stability and repeatability.
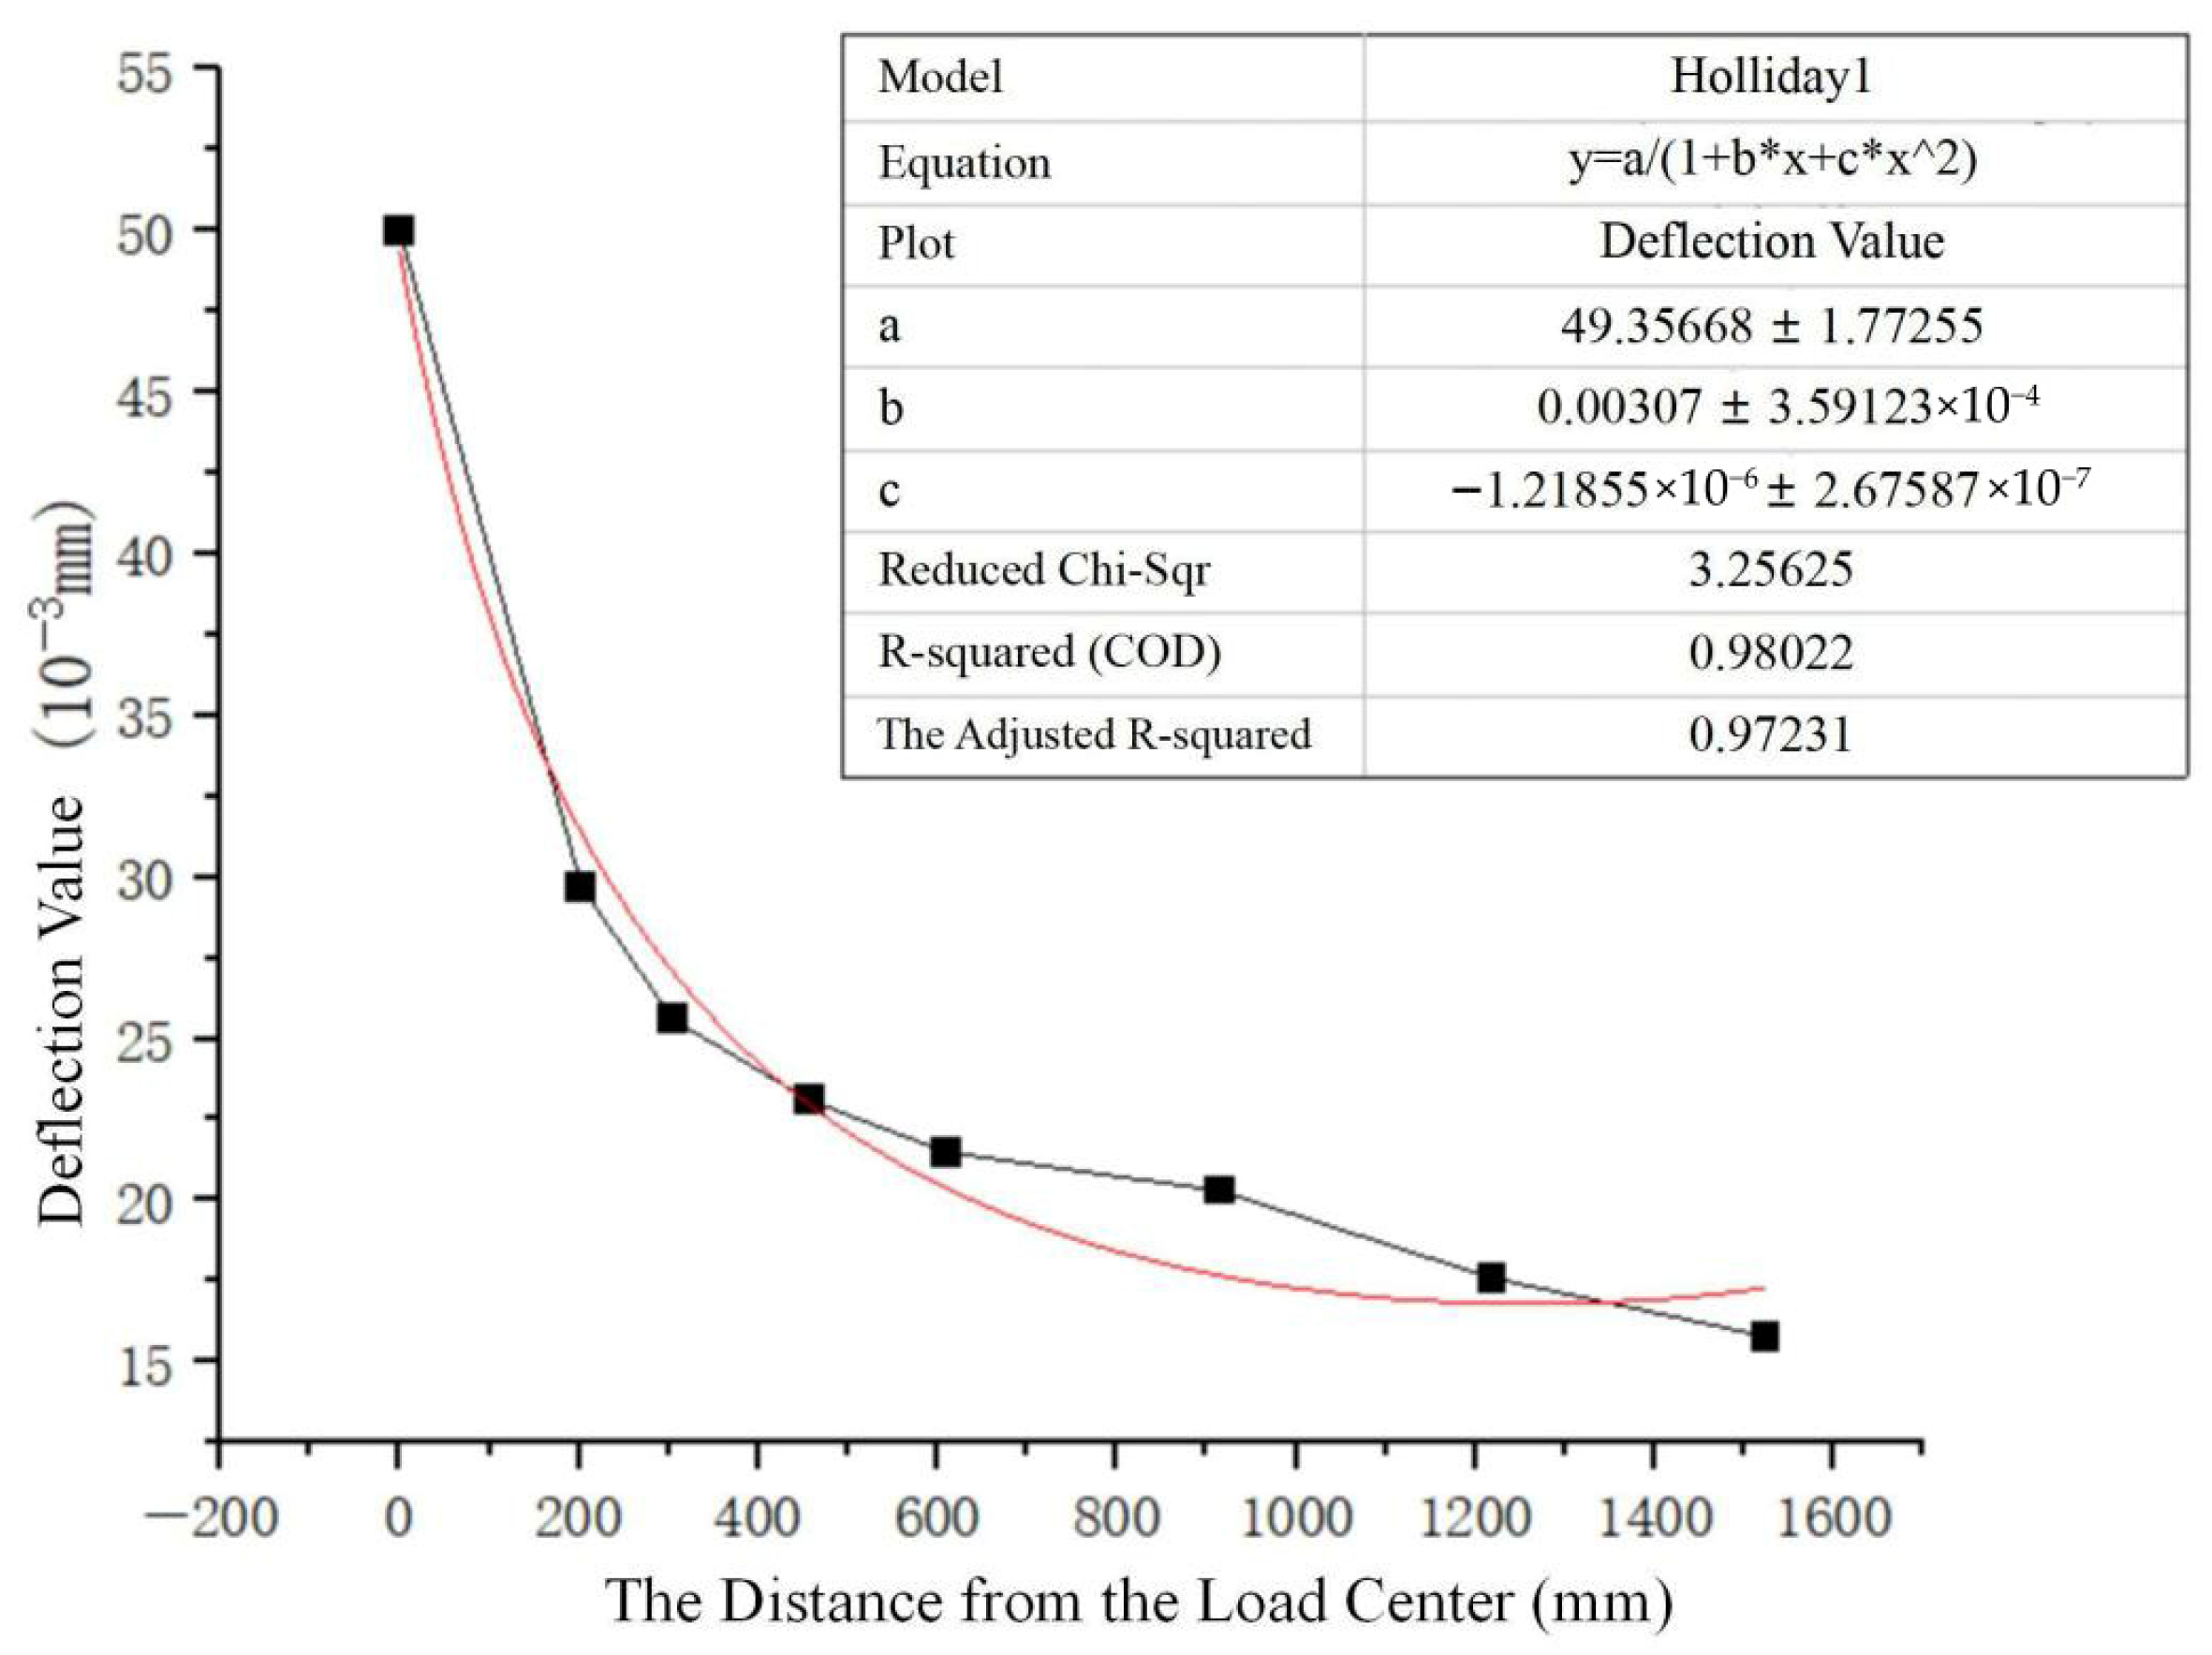
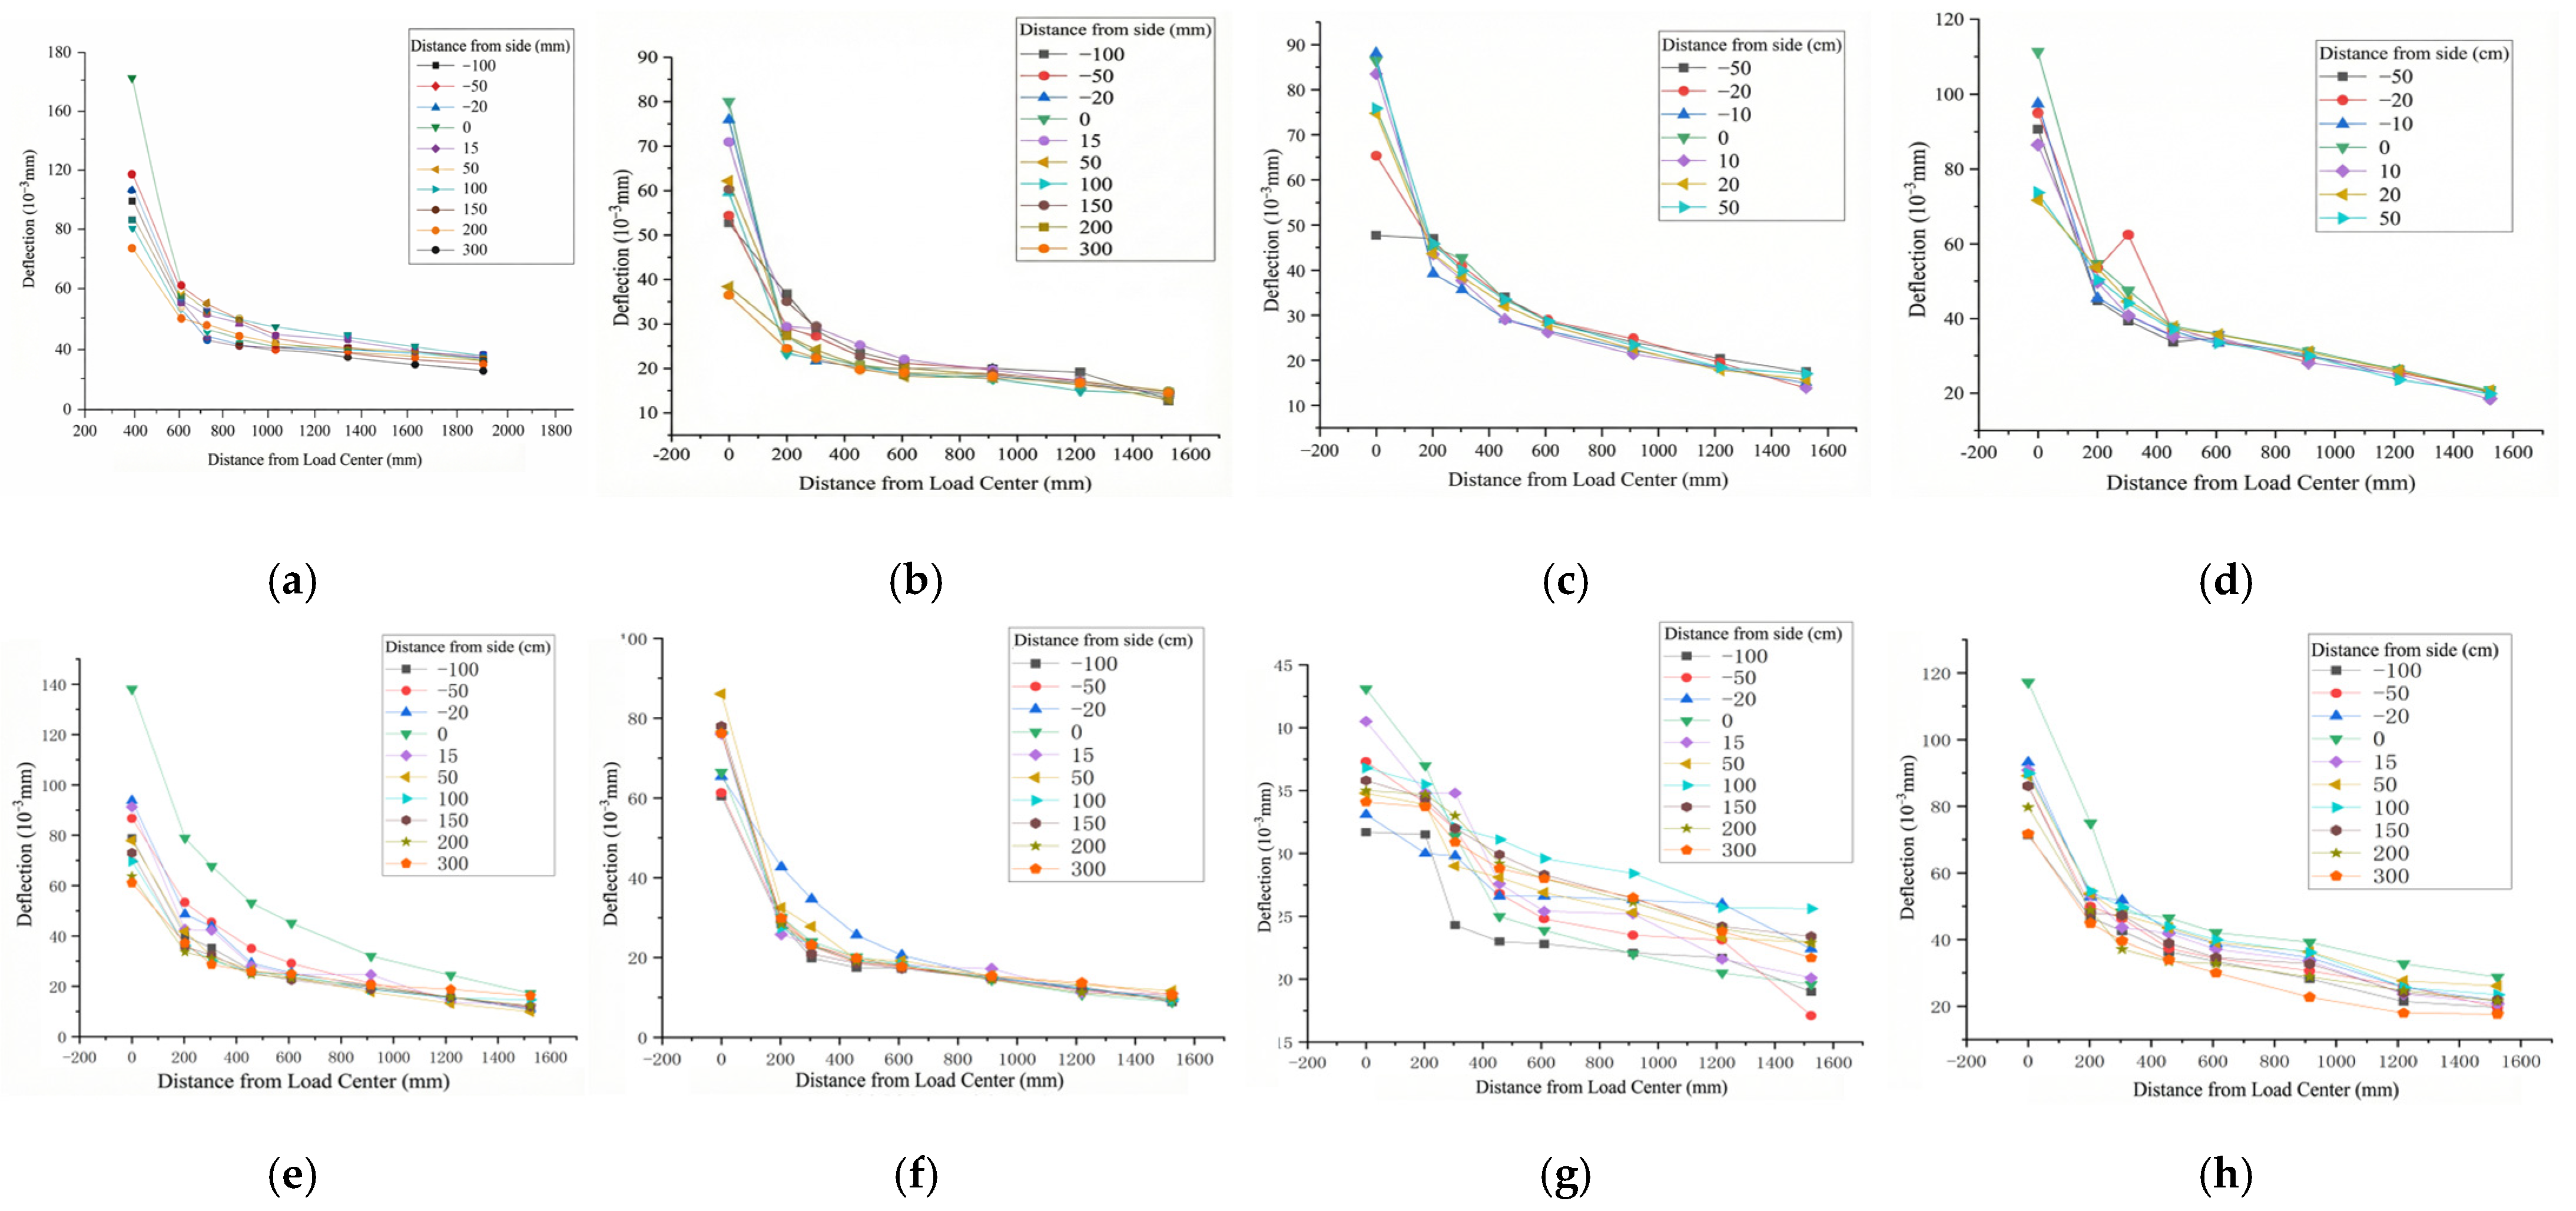
The measured deflection bowls, shown in
Figure 2, exhibit typical exponential decay with increasing distance from the load center. Field results showed healthy segments at approximately 47 × 10
−3 mm, satisfying the specification limit of 0.3 mm. Bridge approaches and pothole areas, however, displayed steeper and slowly decaying deflection bowls with peaks exceeding 0.12 mm, indicating markedly reduced local stiffness.
Comparison of deflection-bowl signatures revealed distinct stiffness-degradation patterns by distress type. Transverse-longitudinal crack segments showed a mild mid-span convex profile, while pothole and bump sections exhibited sharp peaks. This pattern enables effective localization and quantitative grading of stiffness deterioration, supplying precise inputs for maintenance design and numerical model calibration.
2.3. Subgrade Disease Identification Using GPR
GPR is a core nondestructive technology used to detect subgrade distresses. The method relies on electromagnetic wave propagation. The radar system emits periodic electromagnetic pulses and records their travel time. When the waves encounter interfaces between materials with different dielectric constants, reflections occur. The receiving antenna captures these reflections, which are then shaped and amplified. The signals are processed by a microcomputer. Dedicated software reconstructs the signals into three-dimensional images. The GPR data processing workflow included band-pass filtering to remove low-frequency drift and high-frequency noise, followed by deconvolution to enhance the continuity of reflected signals. Time–depth conversion was performed based on calibrated dielectric constants obtained from core samples. Subsequently, image reconstruction was carried out to generate interpretable radargrams for structural interpretation.
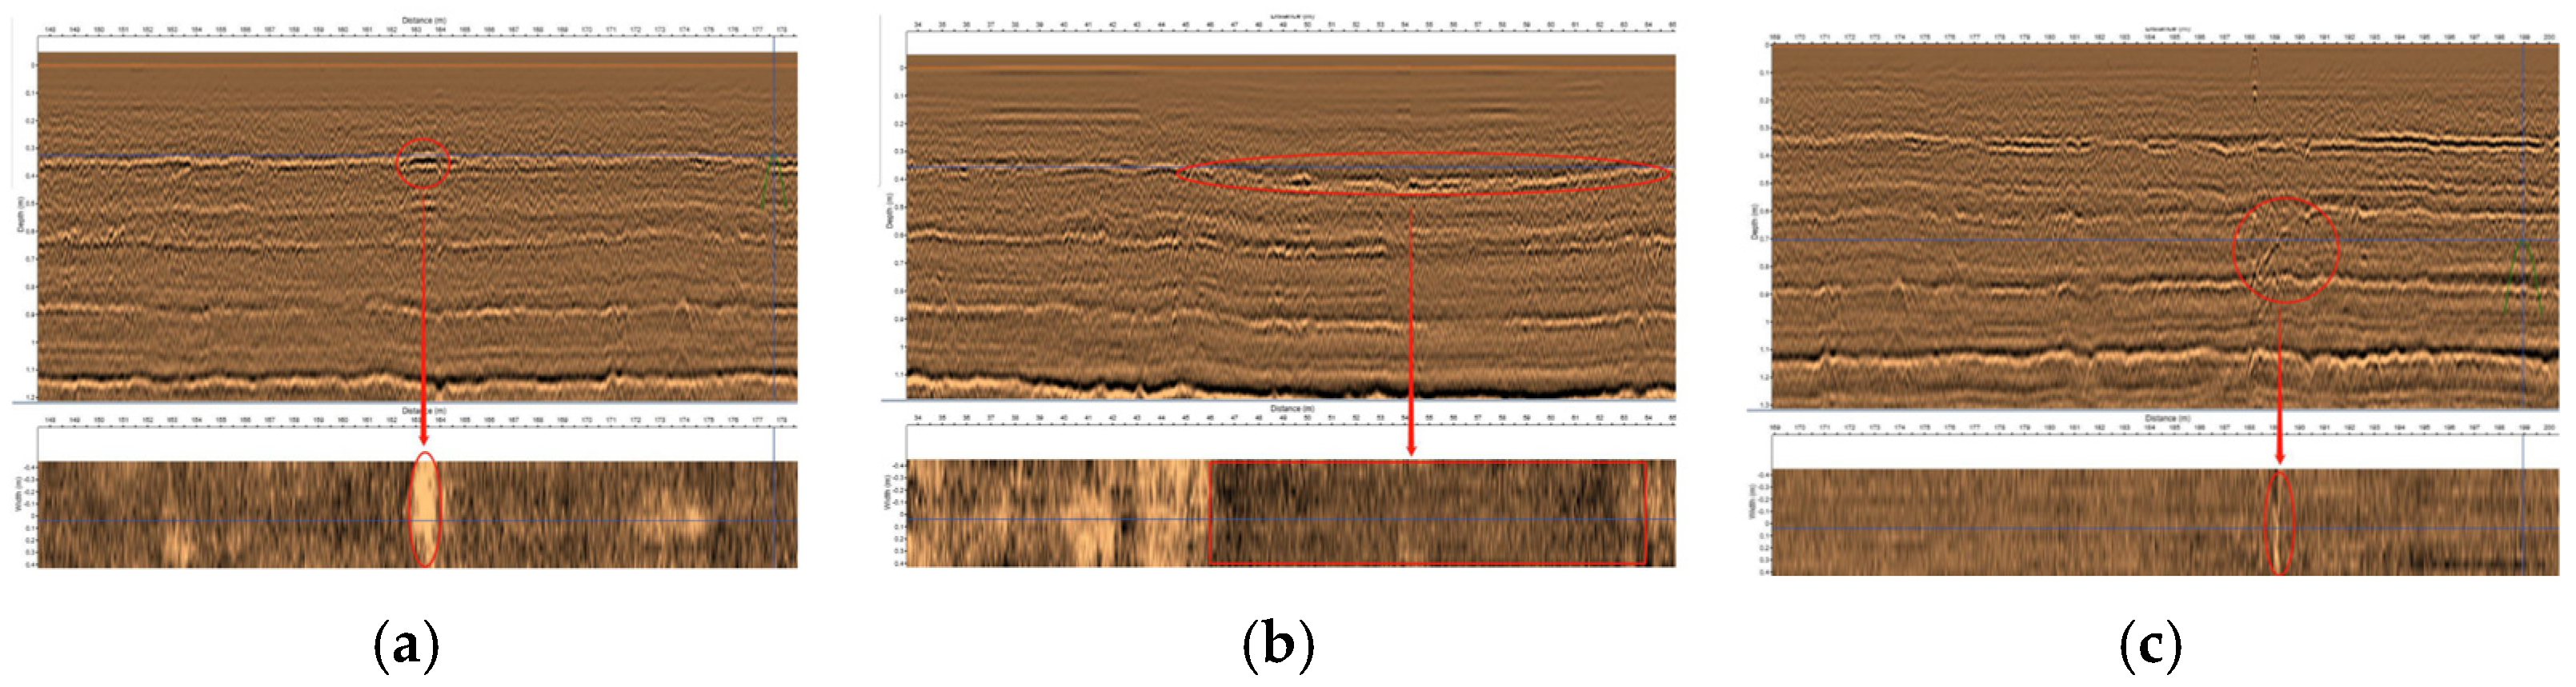
Geometric parameters of subgrade distresses, such as crack length and void area, were extracted by identifying high-amplitude reflection zones in the reconstructed radar images. Threshold-based segmentation was applied to delineate anomalous regions, followed by morphological filtering and manual verification to ensure accuracy. These images reveal the internal structure of the subgrade and help identify concealed distresses. GPR is highly efficient and provides high resolution. It is especially effective for detecting hidden hazards, such as voids, cracks, and their propagation, as illustrated in
Figure 3.
For consistency and comparability, the GPR survey segments coincided exactly with the FWD deflection test segments. Using preliminarily identified disease spots as anchors, each test window extended 10 m upstream and 10 m downstream to fully cover the potential influence zone. Likely distress types—insufficient compaction, voids, cracking, water enrichment, and settlement—were prelisted and recorded to provide priors for subsequent interpretation. Data processing employed Geogiga Seismic Pro to enhance analytical accuracy and reliability and to guide the positioning of subsequent drilling and coring.
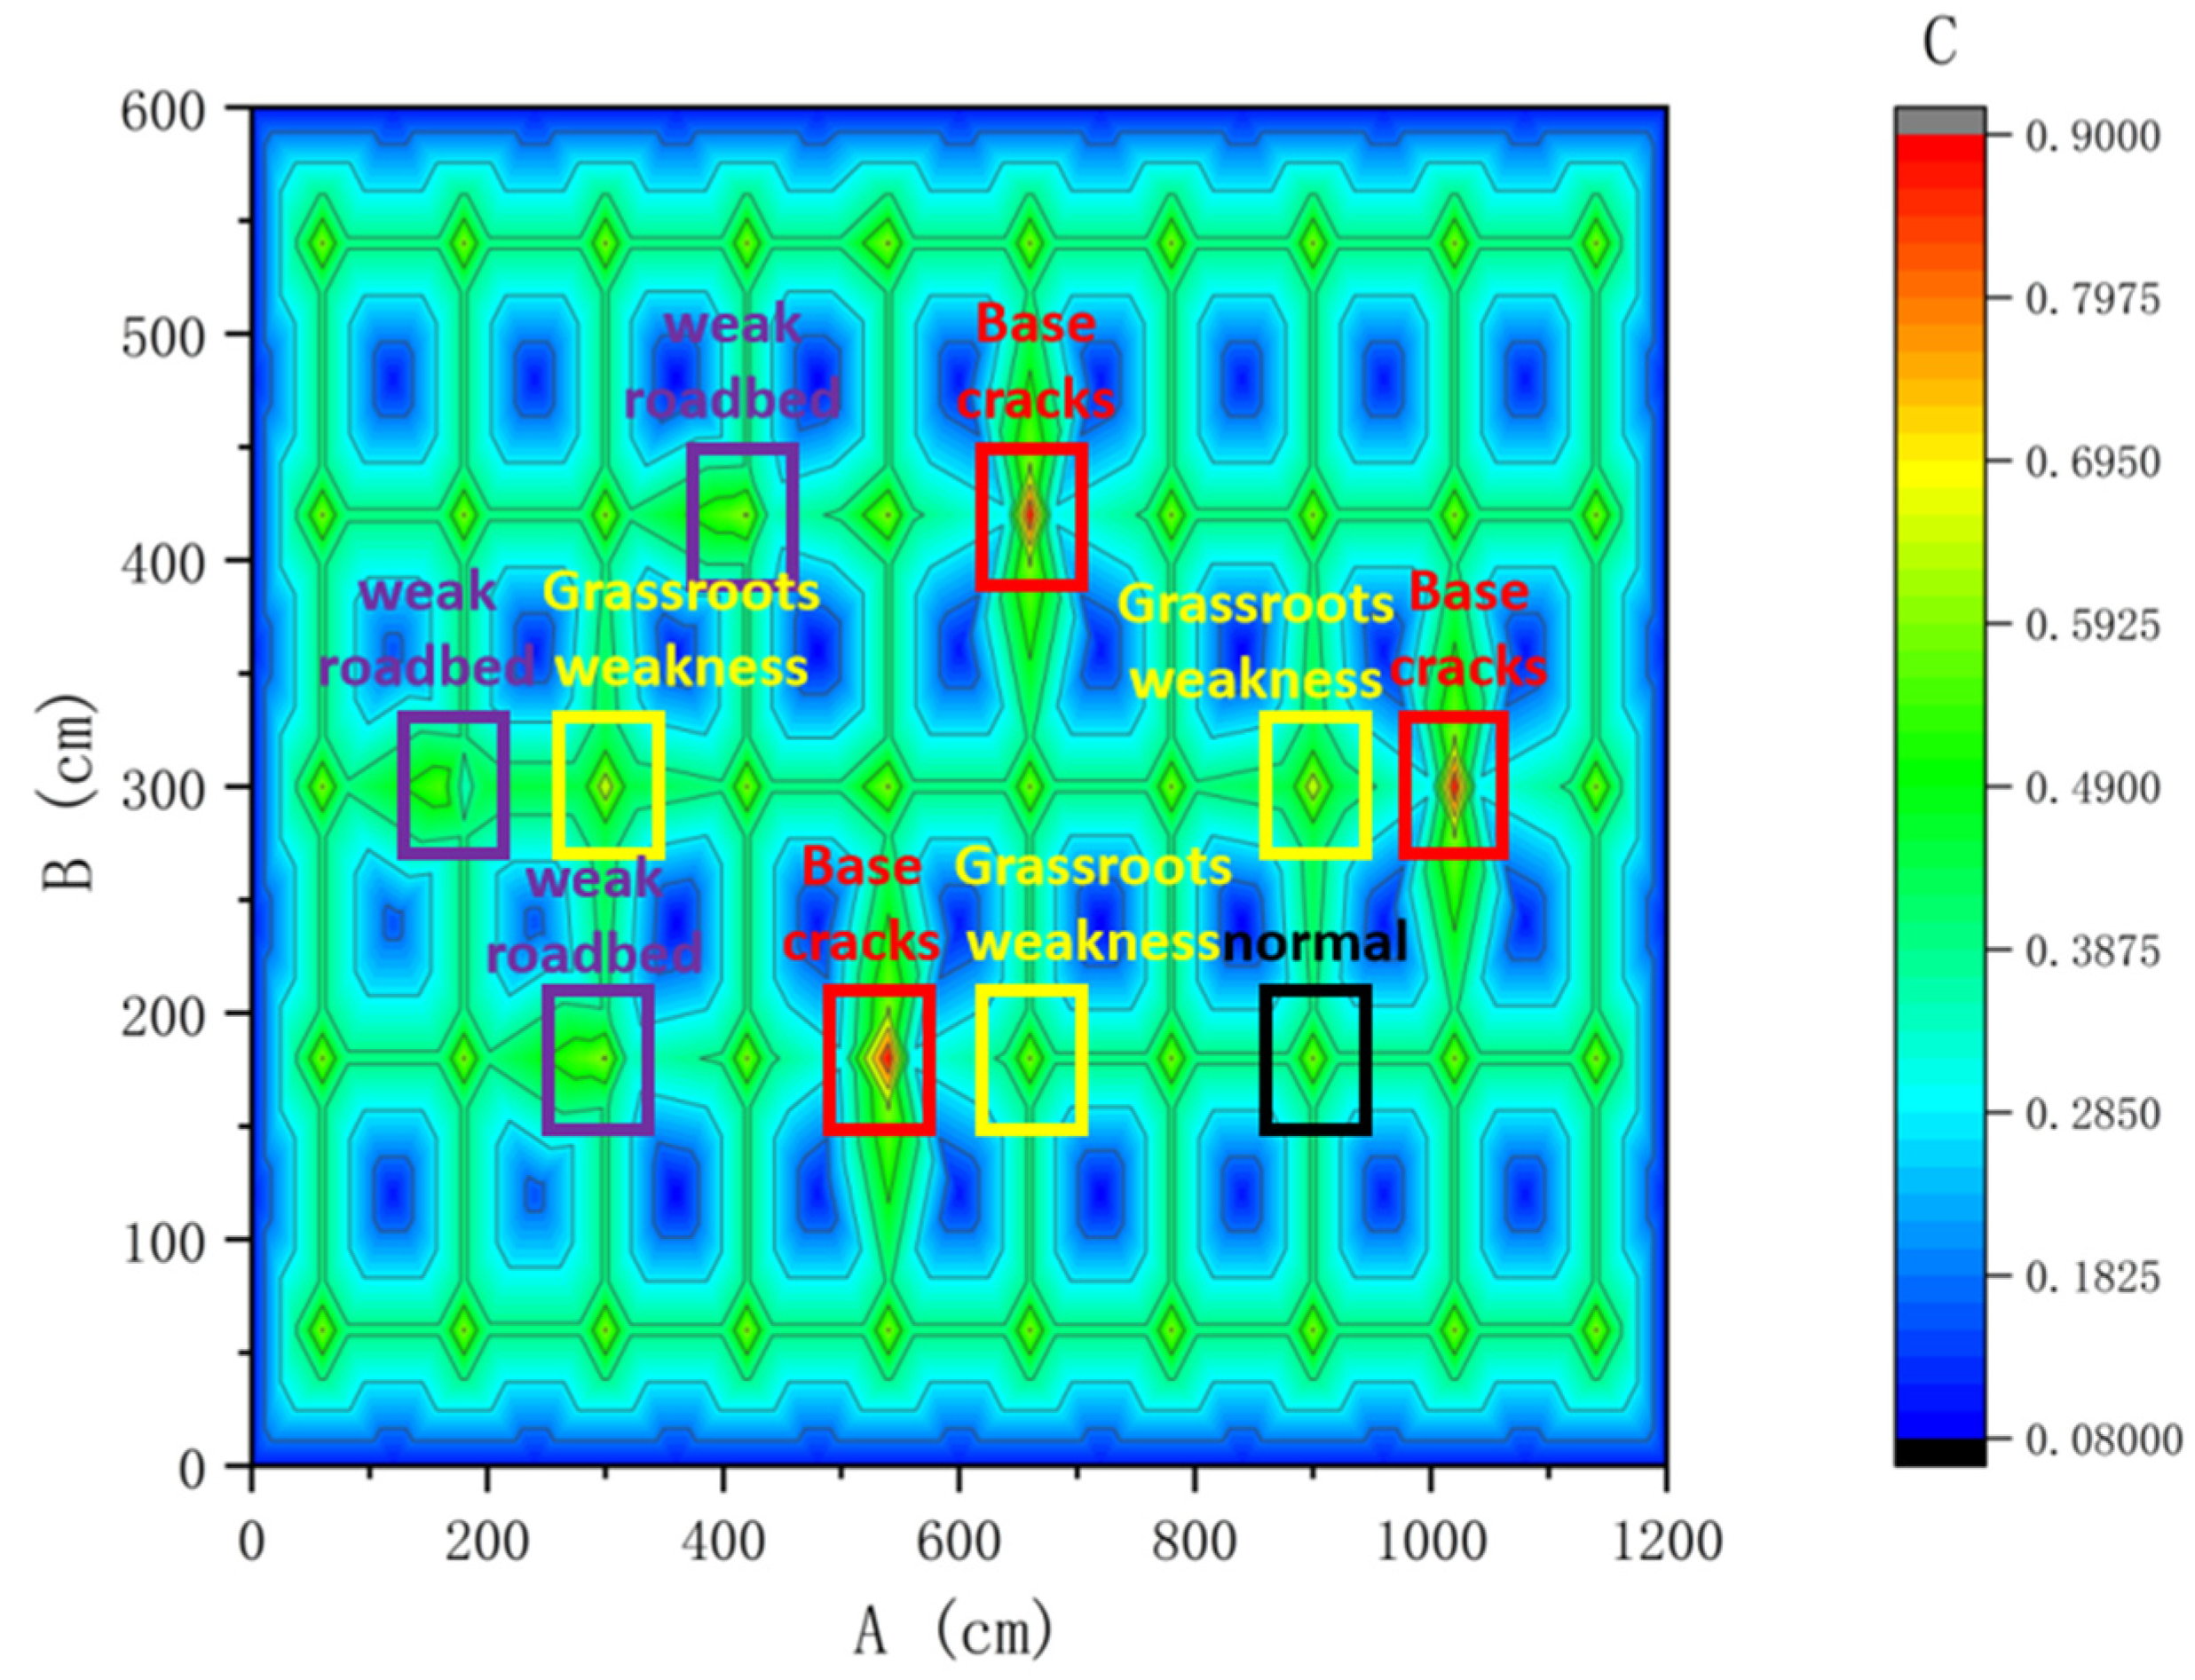
Based on easily interpretable GPR image features, subgrade distresses were classified into two categories. One category includes distresses that are directly identifiable. These can be judged from raw radargrams and mainly involve three typical cases. Interlayer settlement appears as discontinuous depressions at layer interfaces or abnormal thinning of a layer. Combined with the site context, these features suggest insufficient support stiffness. Voids appear as blank zones with no reflections at structural interfaces. For example, slab-bottom voids at bridge approaches can be identified using this signature. Surface cracking and insufficient compaction show as linear downward anomalies extending from the surface. They also appear as noisy reflections due to high air-void content, contrasting with dense, intact zones. In contrast, base-layer cracking and loosening are often hidden by clutter. These require clutter suppression and signal enhancement before they can be identified, as shown in
Figure 4.
A reflective crack in the base appears as a linear reflector within the base. This reflector extends upward into the surface layer, indicating structural failure in the base with cracks visible on the surface. An oblique base crack shows an inclined interface at about 0.7 m depth within the base. Mechanical considerations attribute this to oblique internal stresses. The image clearly identifies the crack position and direction of propagation. Base settlement appears as a pronounced sag in the target region, contrasting sharply with the adjacent normal structure. Combined with traffic loading history, this suggests insufficient base support stiffness. Insufficient base strength shows as irregular changes in reflection amplitude within the base zone. These variations are likely due to nonuniform material strength or local degradation, and thus need verification through coring tests. For example, three-dimensional GPR detection along the G25 Changshen Expressway (K1427+800–K1428+000) revealed crack-dominated distress, accompanied by localized settlement and loosening. This clarified the prevailing distress types and their spatial distribution.
2.4. Mechanical Property Tests of Core Samples
Core samples were obtained by drilling along Changshen Expressway segments K1422–K1423 and K1427–K1428. This study quantified how different distresses, such as transverse and longitudinal cracks, affect material mechanical properties. A systematic testing program was used to determine the constitutive parameters of key structural layers, including the surface, base, and subbase. These parameters include compressive strength, resilient modulus, and dynamic modulus. The measured data support FE modeling, mechanism analysis, and subgrade health assessment. They also validate the findings from GPR and FWD and clarify the extent of load-bearing degradation.
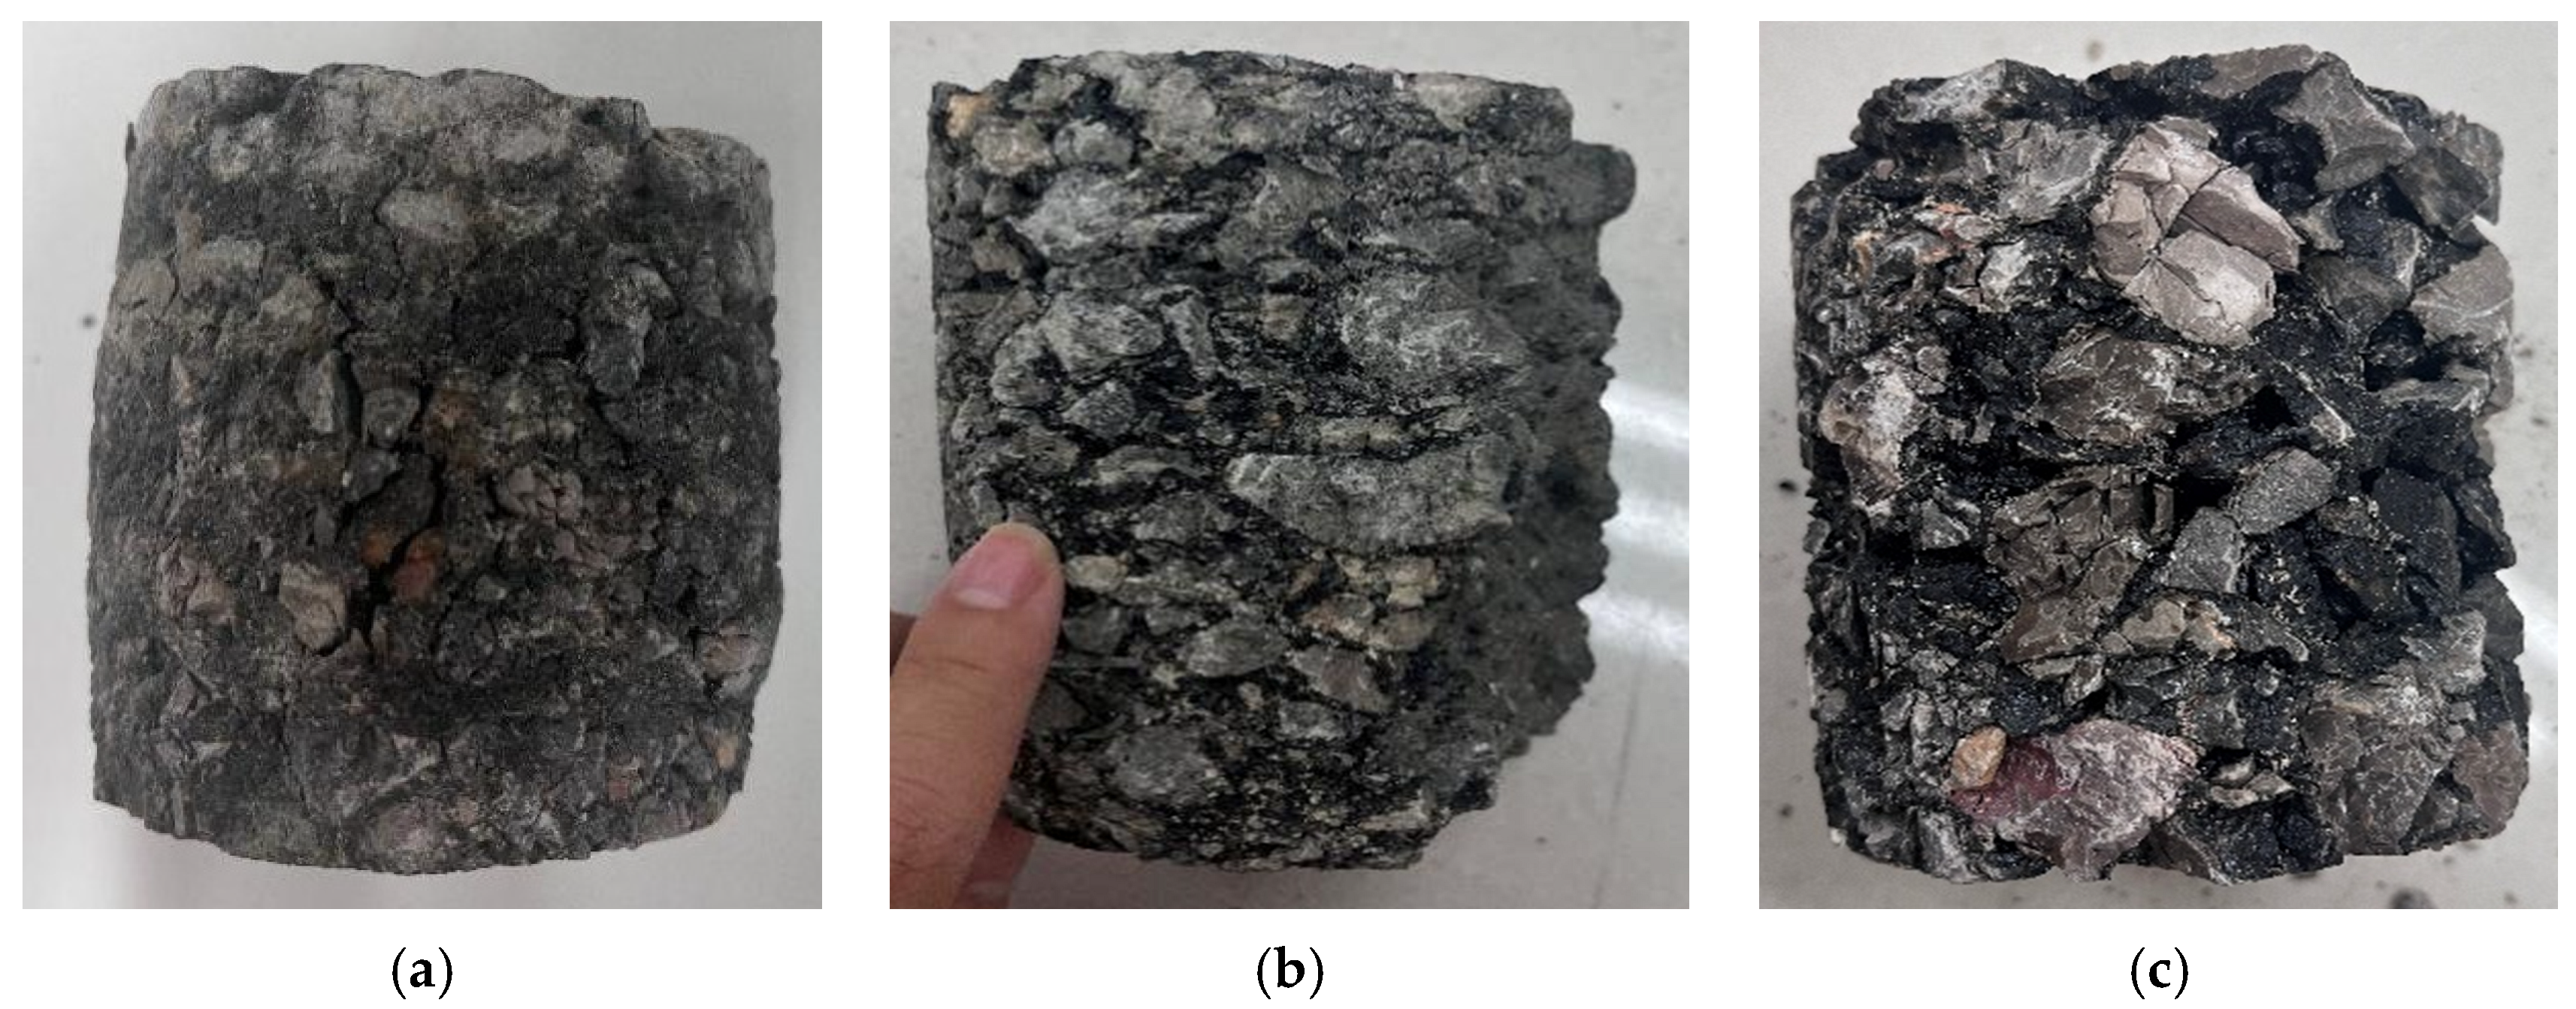
The experimental workflow was as follows: inspect core dimensions and select specimens suitable for mechanical tests; cut cores, prepare end faces, and apply moist conditioning; conduct mechanical tests and obtain parameters required for numerical simulation. The morphology of the surface-layer specimens is shown in
Figure 5. Asphalt mixture surface-layer tests were carried out, and the results are listed in
Table 1.
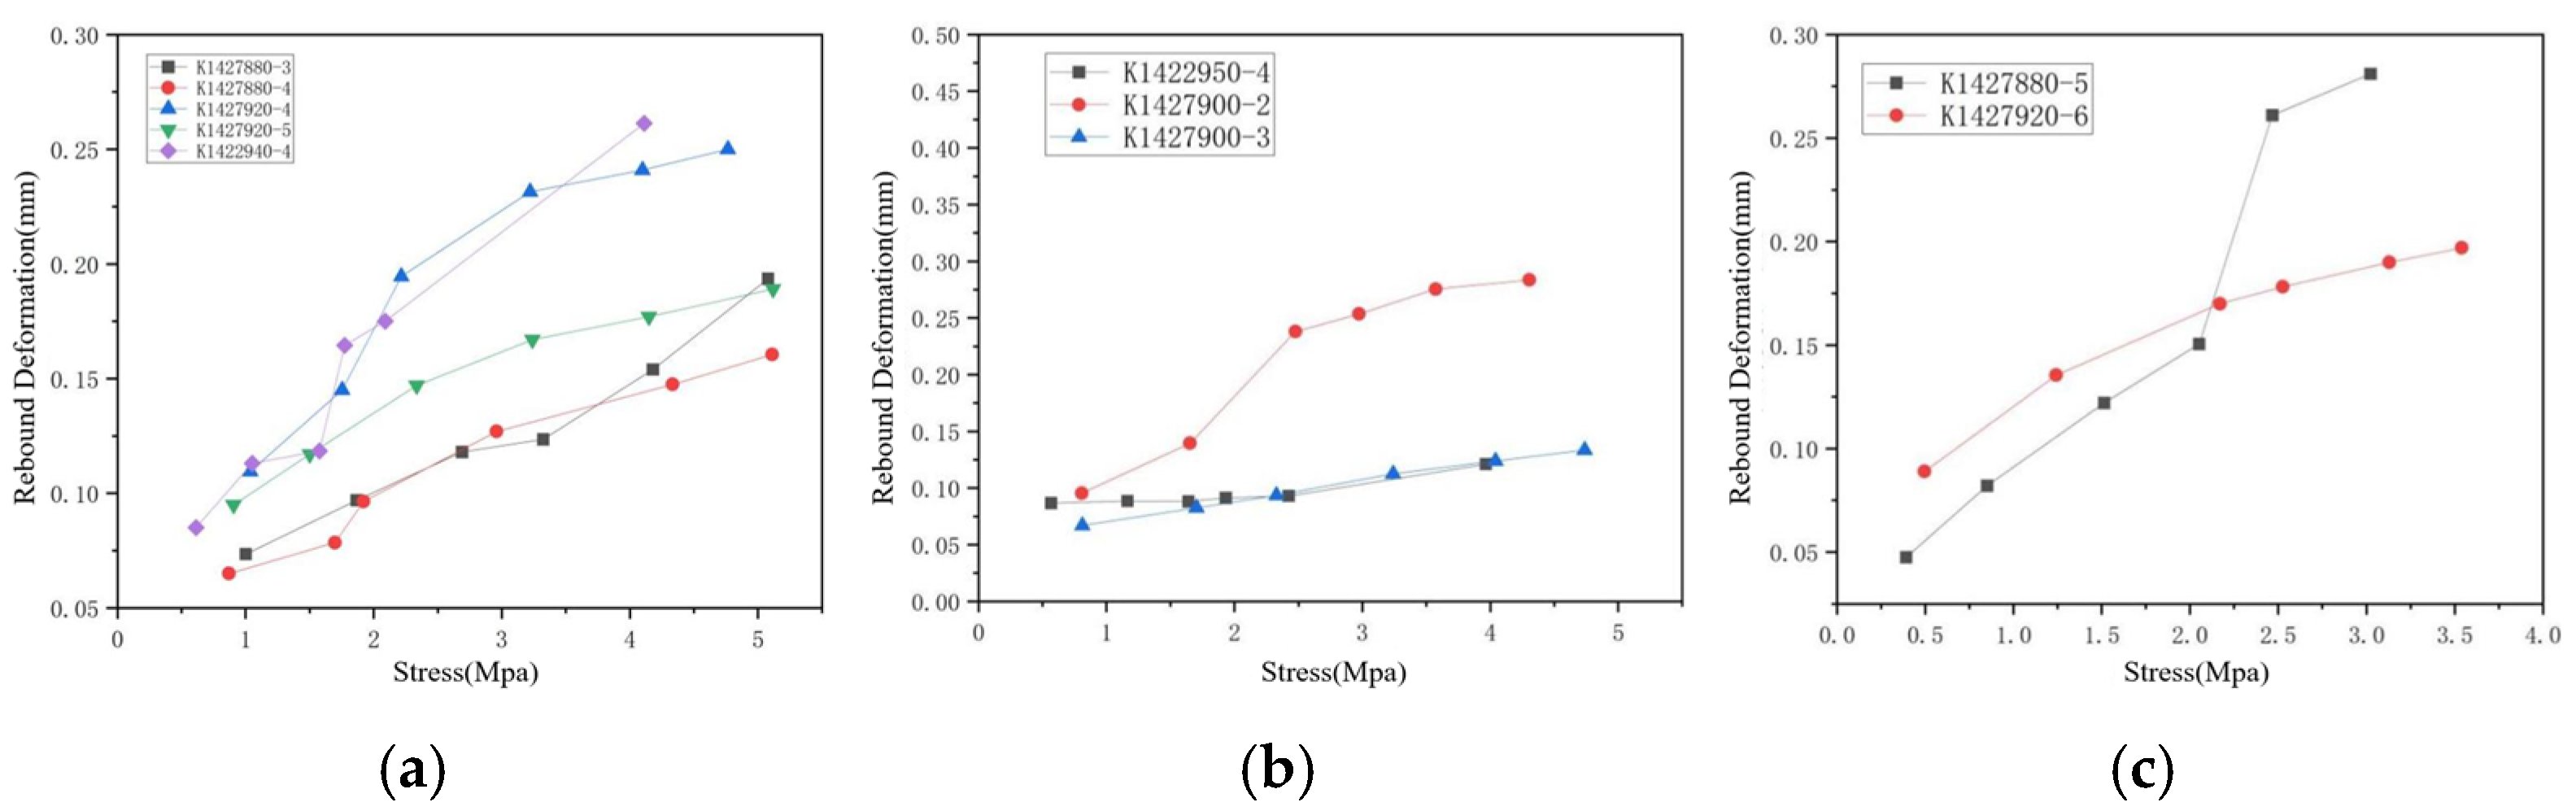
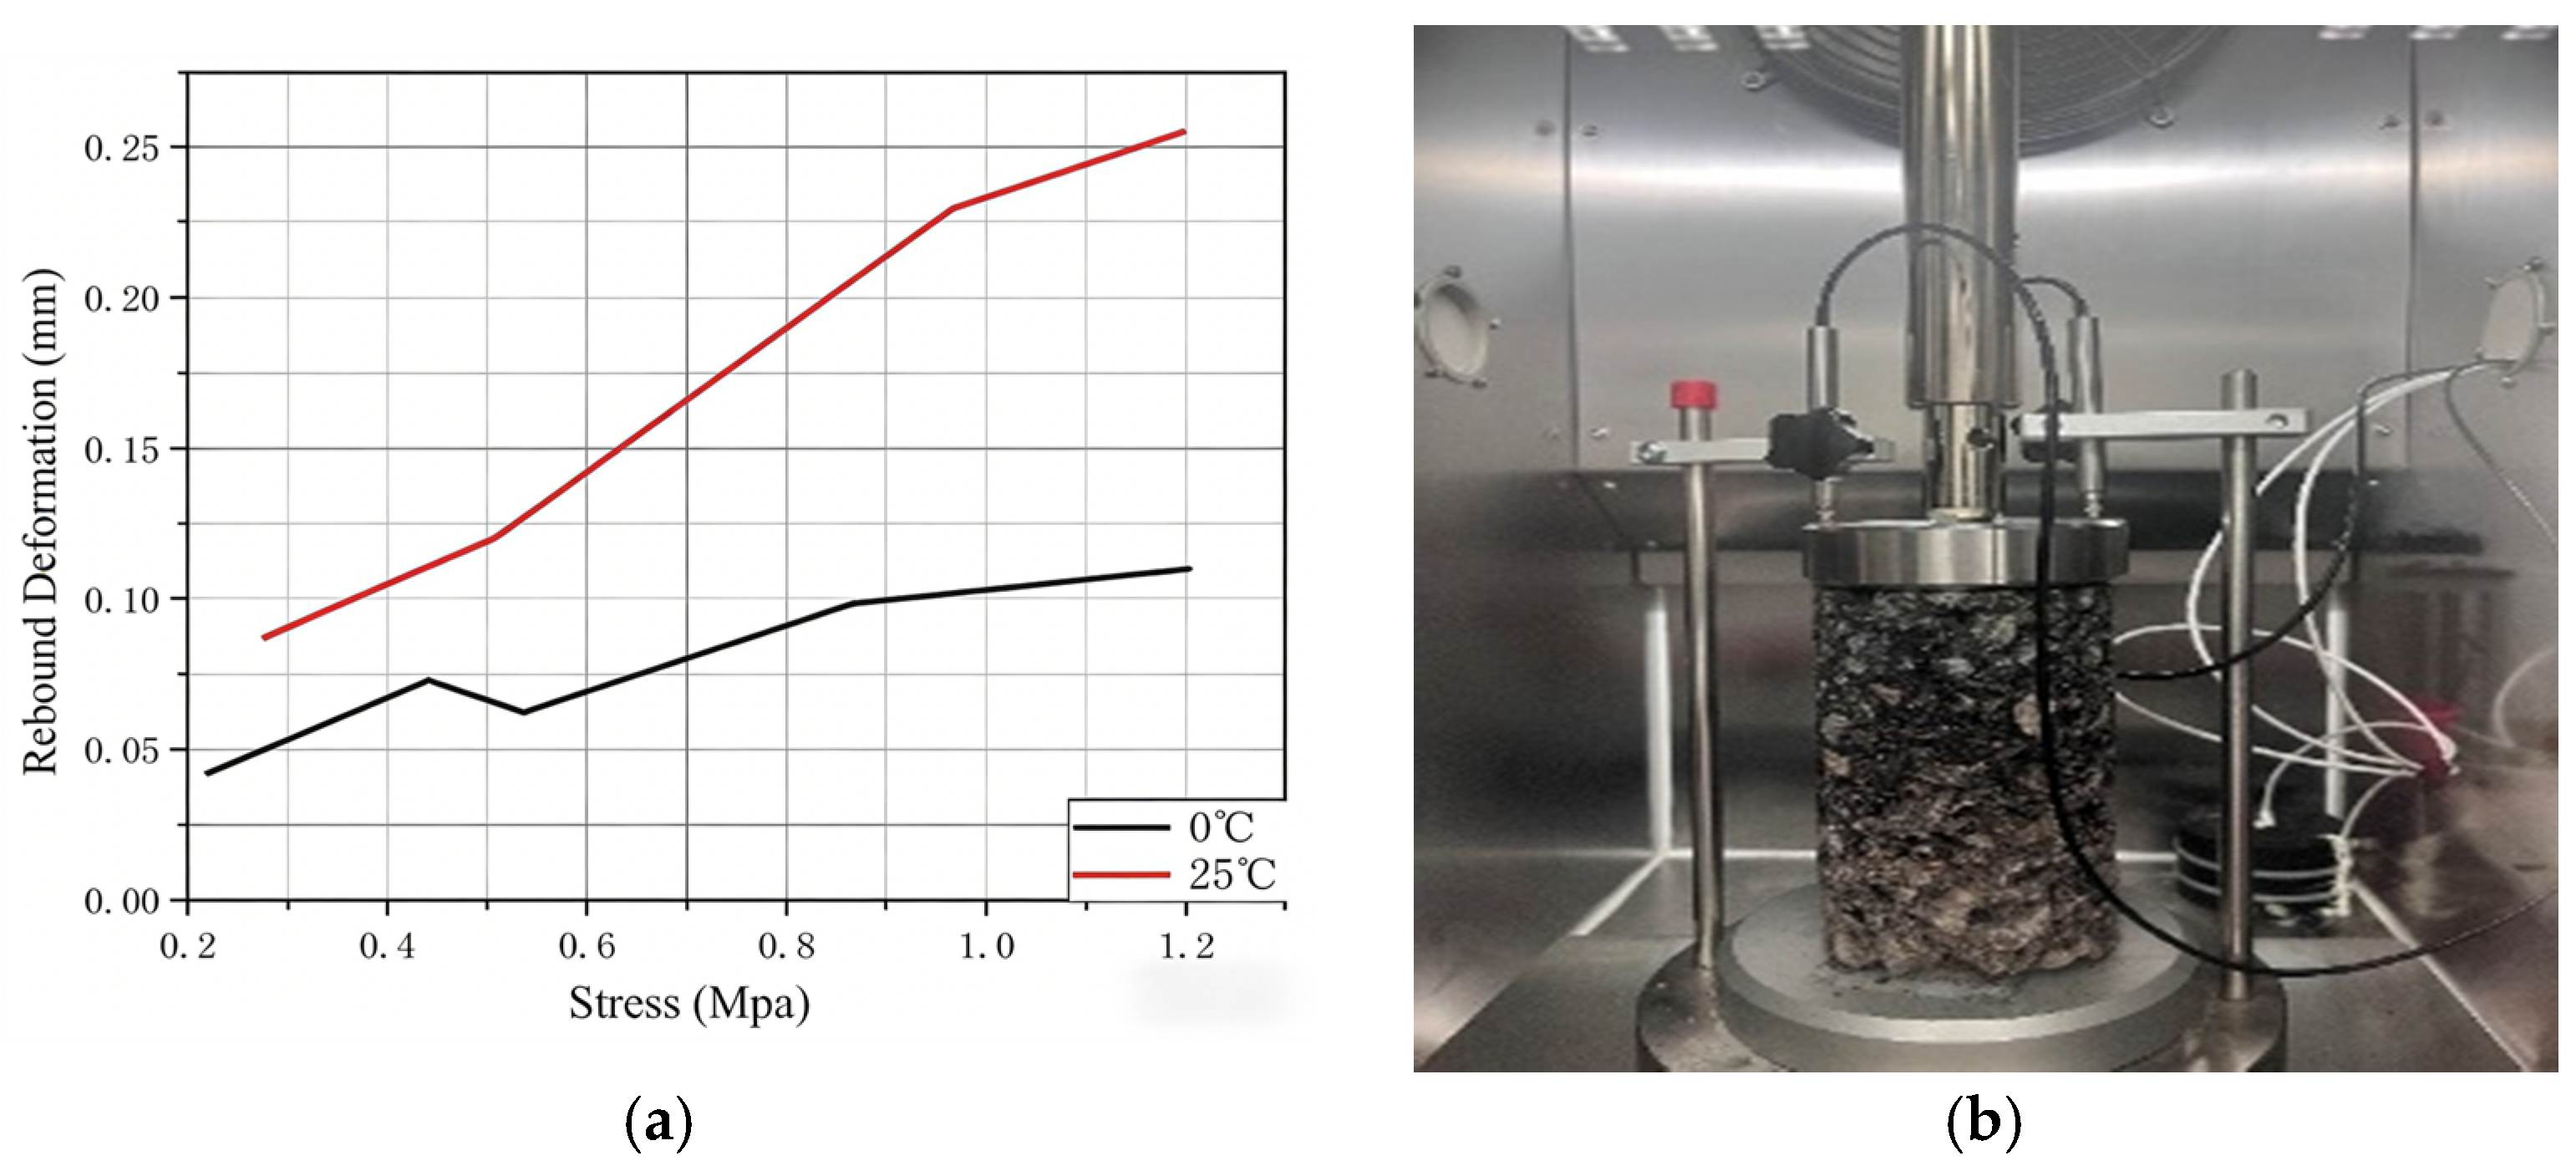
Two sets of resilient-modulus tests were performed on the upper–middle and middle–lower surface-layer materials; the results are shown below. Prior to testing, the cored specimens were cut and end-ground to ensure flatness and parallelism. A rigid loading platen (with a thin leveling layer if needed) was used to ensure uniform contact. Specimens were carefully aligned to avoid eccentric loading. The resilient modulus test procedure followed AASHTO TP62, and repeated loading was applied under controlled conditions to ensure repeatability.The typical stress–strain response obtained from these tests is illustrated in
Figure 6.
According to the specification, the intersections with the axes, (3.0305, 0) and (3.0327, 0), were selected as corrected origins. After correcting the fifth load level, the compressive resilient modulus was computed by
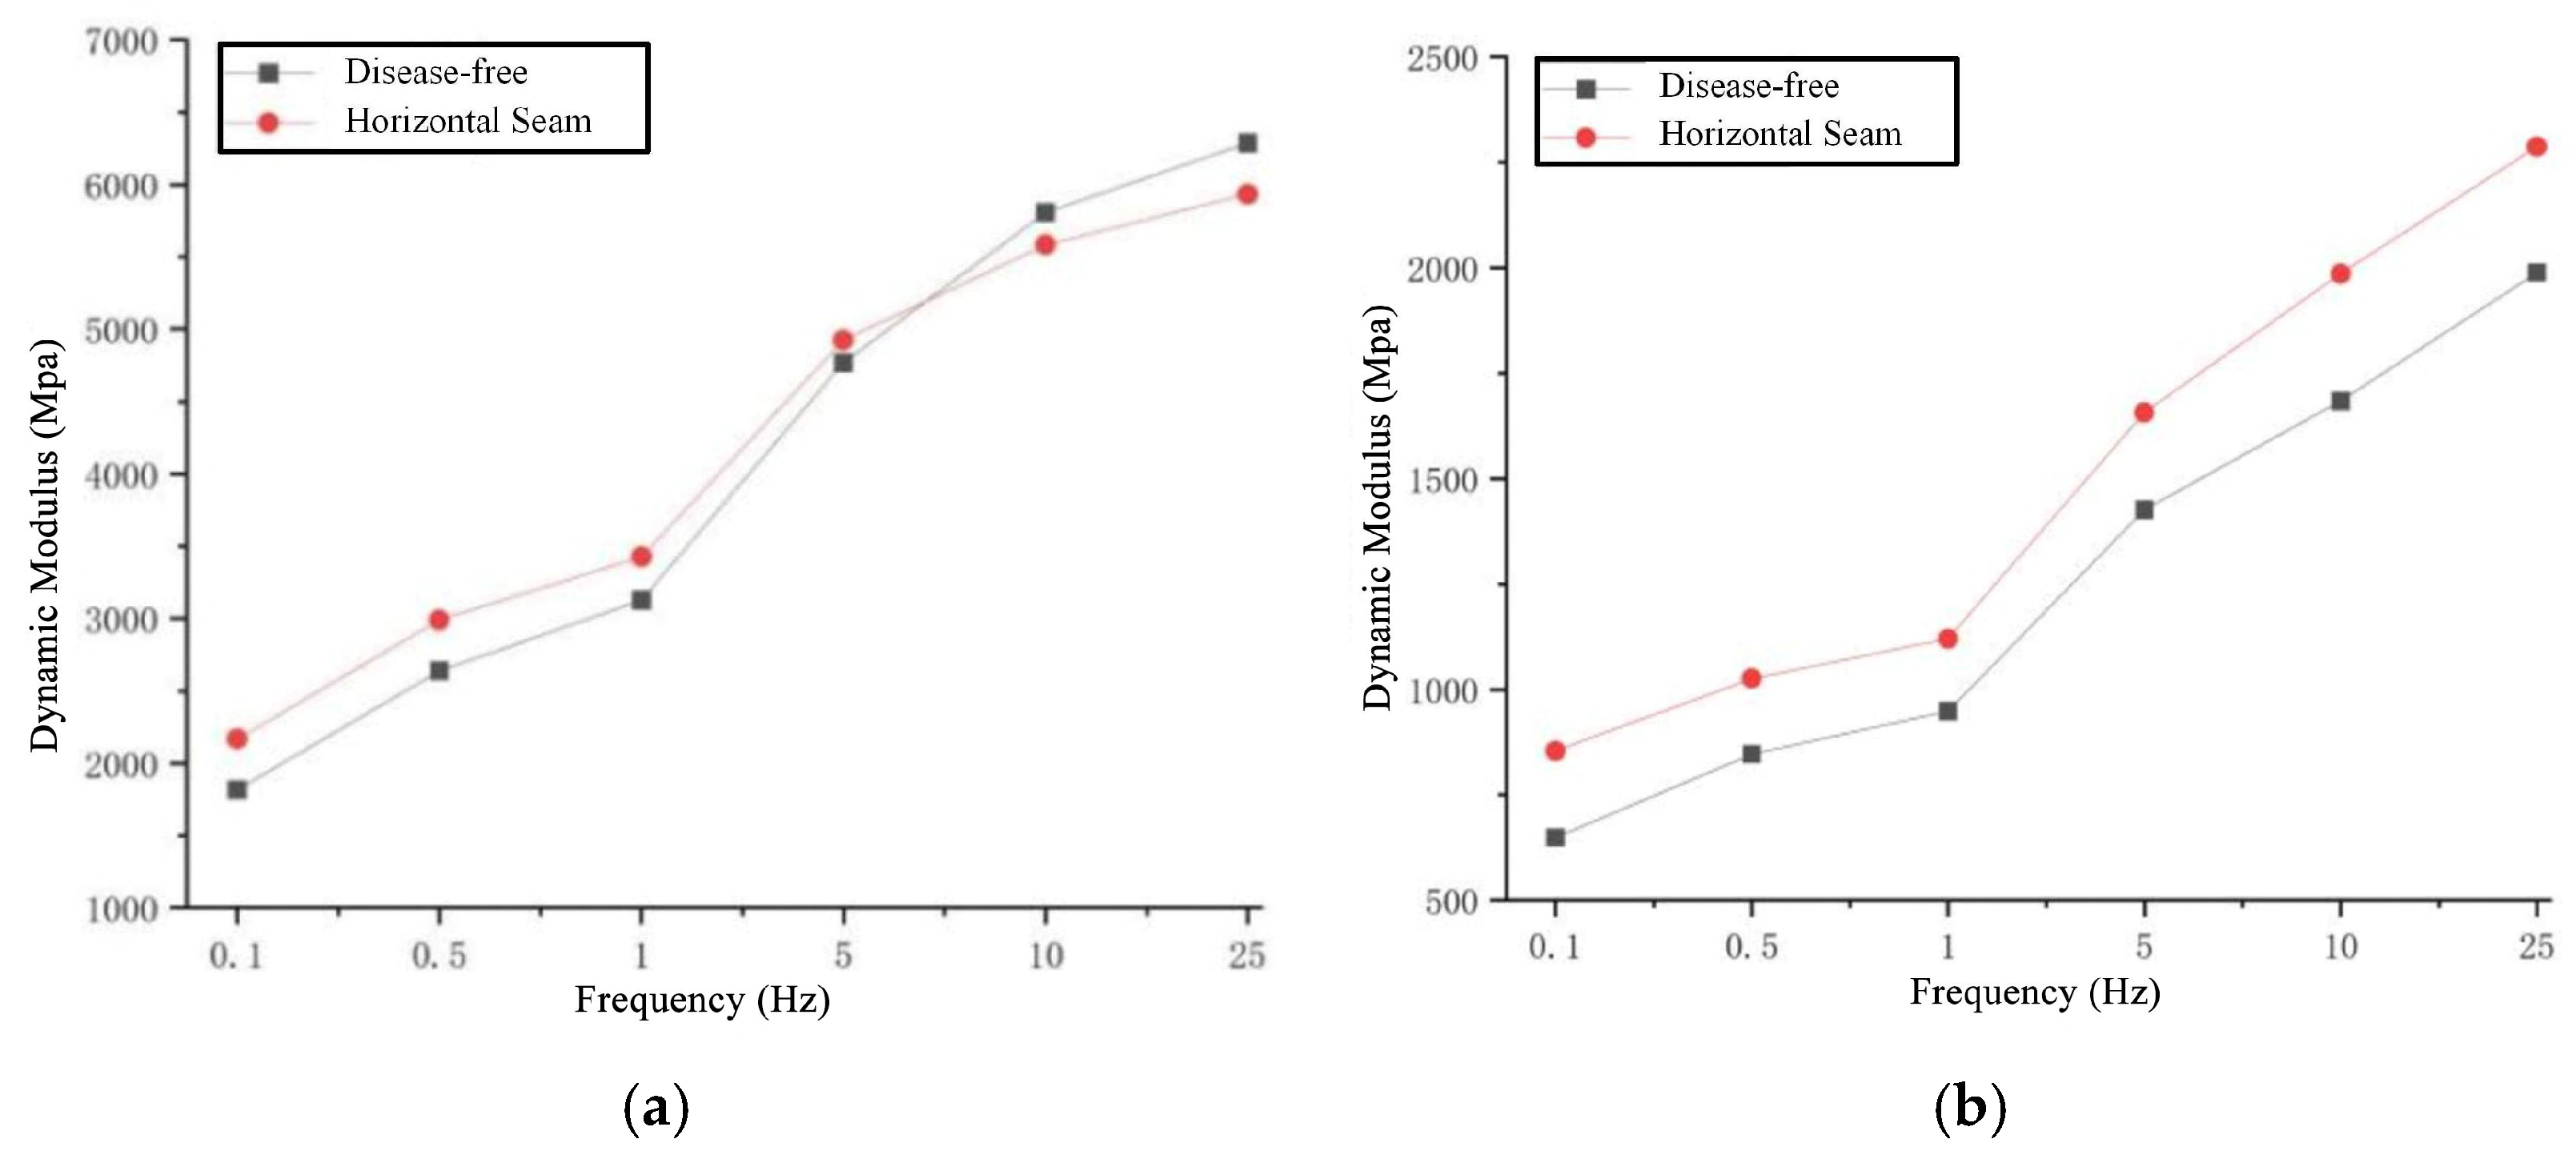
Per AASHTO TP62, dynamic-modulus tests were conducted on transverse-crack and healthy cores that met the height requirement, thereby determining the dynamic modulus of the upper asphalt surface layer. Dynamic modulus tests were conducted under controlled laboratory conditions following standard testing procedures for asphalt materials. Sinusoidal cyclic loading was applied to the specimens, and the dynamic modulus |E*| was determined as the ratio of stress amplitude to strain amplitude under steady-state conditions. These tests were performed to complement the resilient modulus results by characterizing the frequency-dependent stiffness of asphalt materials under traffic-related cyclic loading (the testing scenarios for different groups are shown in
Figure 7). In this study, the dynamic modulus results were used for comparative interpretation rather than direct conversion to resilient modulus values.
Test results for the cement-stabilized base are listed in
Table 2. The unconfined compressive strength shows that diseased locations, such as transverse and longitudinal cracks, have lower peak failure loads and compressive strength compared to healthy areas. This indicates reduced material strength in the cement-stabilized macadam. This reduction is identified as a primary cause of pavement cracking.
The resilient modulus results show severe stiffness loss in the cement-stabilized macadam layer. The healthy average was 10,366 MPa. However, in areas with transverse and longitudinal cracks, the modulus dropped to 3328 MPa and 2803 MPa, respectively. These marked reductions highlight the need for maintenance and rehabilitation of this layer. In contrast, changes in the cement-stabilized soil subbase were minimal. The transverse-crack modulus was 1414 MPa, as illustrated in
Figure 8. slightly below the healthy area’s modulus of 1512 MPa. This indicates that the impact on the soil layer is relatively limited.
In summary, the corridor is dominated by cracking—manifesting as transverse cracks, longitudinal cracks, and potholes. Integrated evidence from FWD, GPR, and core drilling indicates base-layer voiding and diminished support stiffness. Constitutive data for each structural layer under different distress types were obtained from in-service pavement cores, and the cement-stabilized macadam base was confirmed as the principal diseased layer requiring priority treatment.
3. Construction of Roadbed Disease Model Based on Finite Element
3.1. Purpose and Modeling Strategy
This chapter uses finite-element (FE) simulation to analyze the mechanical response and evolution of highway subgrades under concealed distresses. It reveals the links between microstructural features and macroscopic mechanical performance. We developed an FE model that includes measured constitutive parameters, field test data, and distress morphologies. This allows visual and quantitative characterization of load effects, deformation, and damage evolution. The model supports the analysis of stress concentration mechanisms and deformation patterns across different distress types. It also provides the theoretical foundation for future detection and prediction.
The design follows a multiscale approach. At the macro scale, the pavement-base-subgrade composite is modeled as a multilayer elastic system. The global model examines load-transfer paths and deformation distributions. At the meso scale, refined local models are used to capture force differences, local damage, and crack propagation. These coordinated analyses describe global responses while resolving the physical mechanisms of distress initiation locally. This forms a multiscale framework for analyzing subgrade distresses.
The strategy balances structural realism, computational efficiency, and engineering interpretability. The macro model ensures geometric and boundary consistency with an in-service highway. The meso model introduces material variation and interfacial property contrasts, ensuring an accurate reproduction of real distress processes.
3.2. Finite Element Model Establishment and Reliability Validation
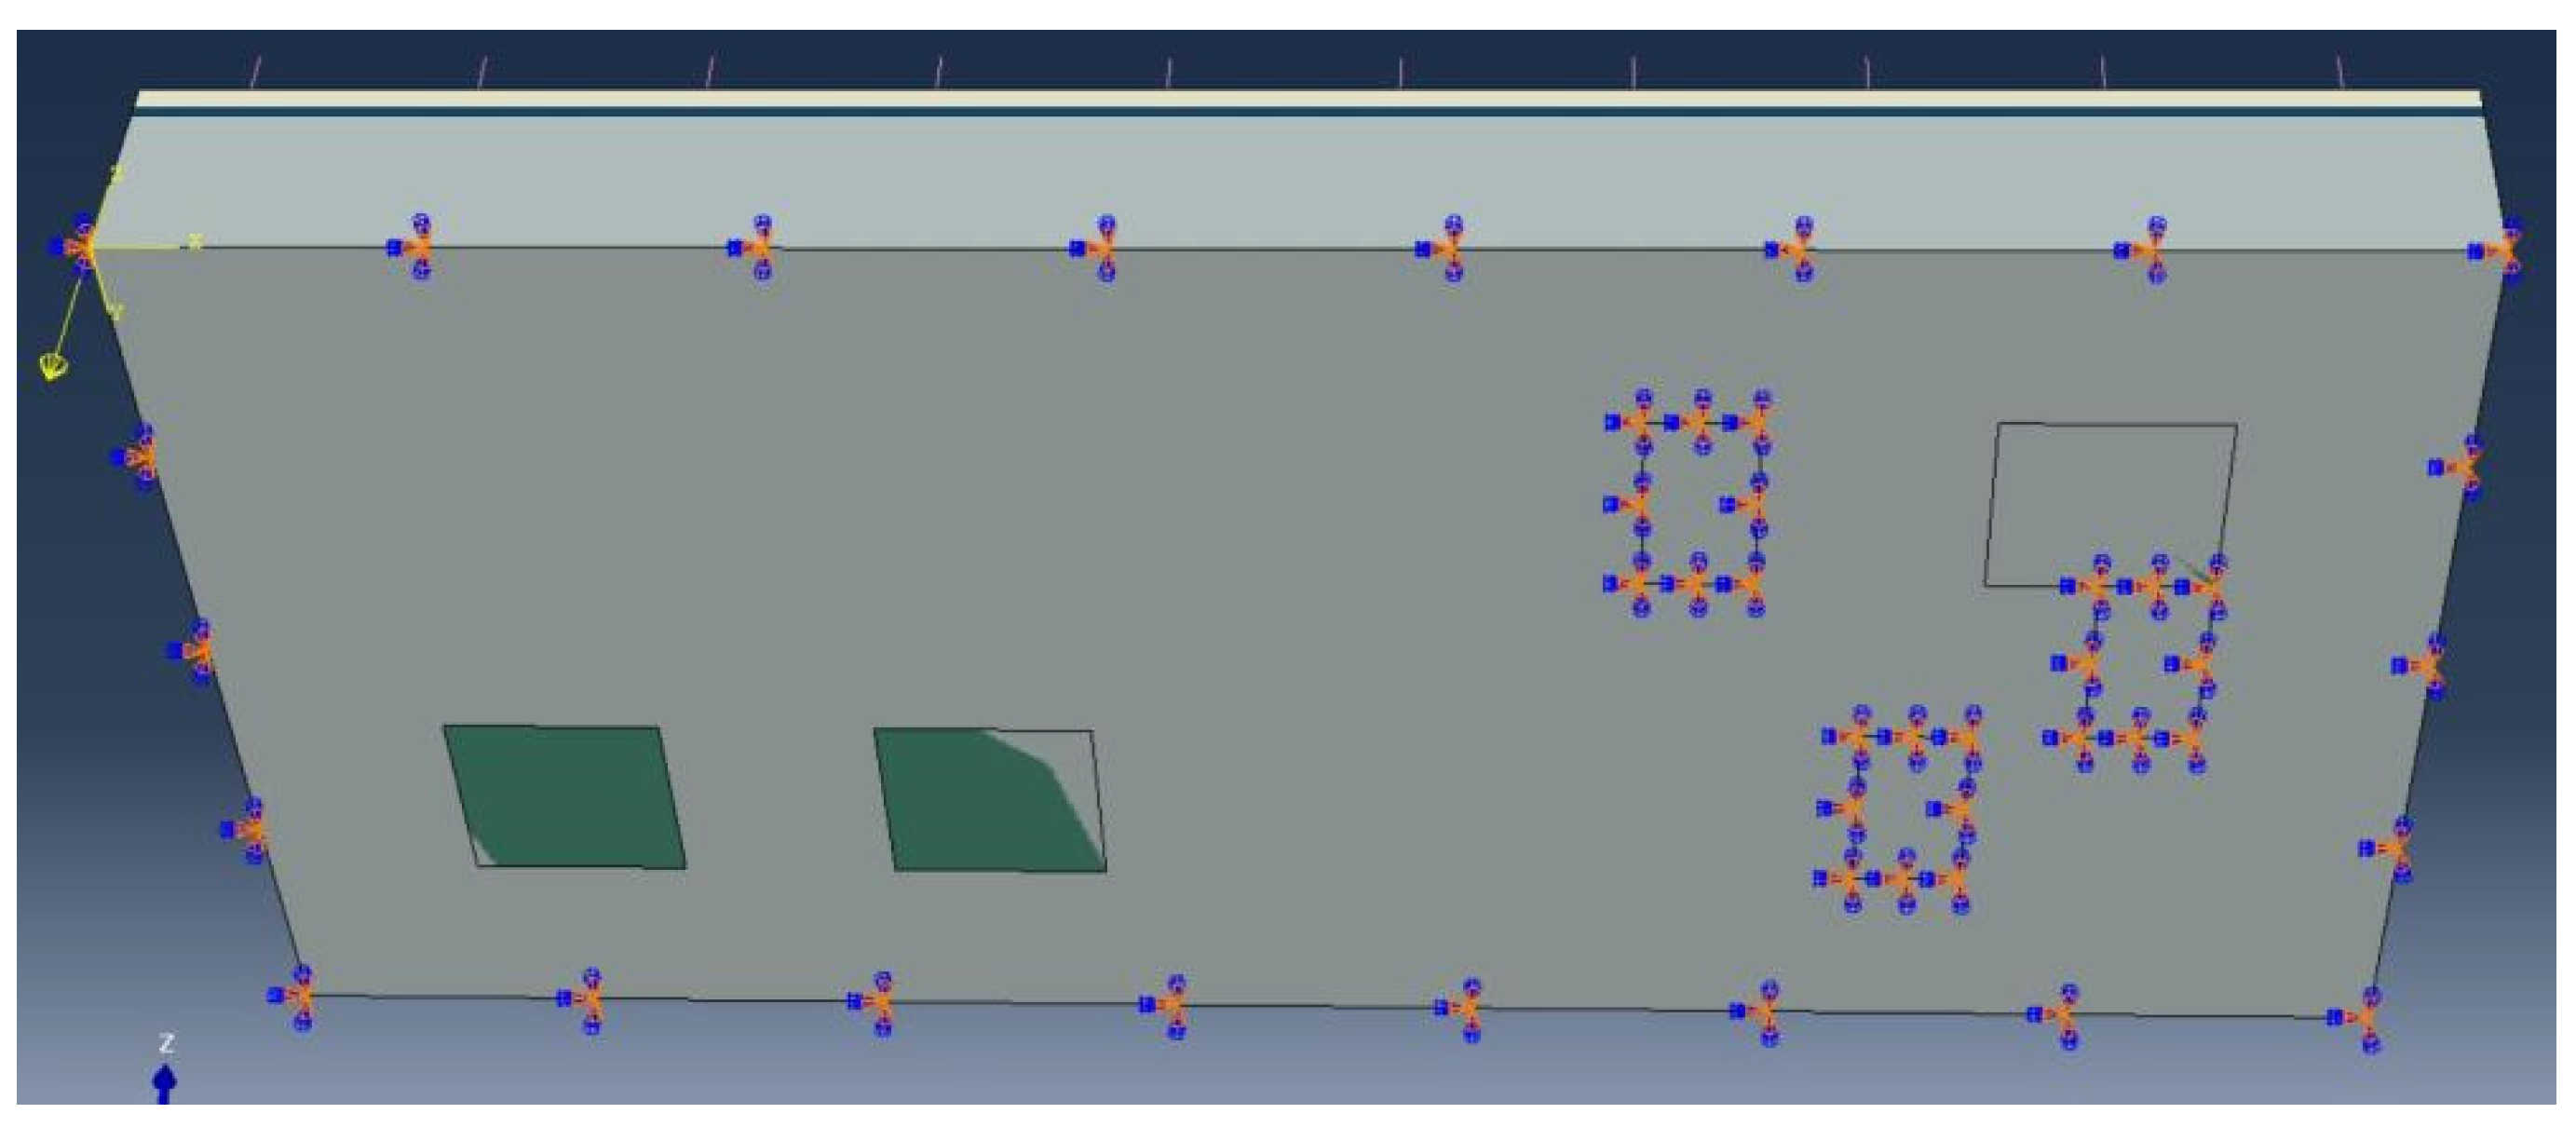
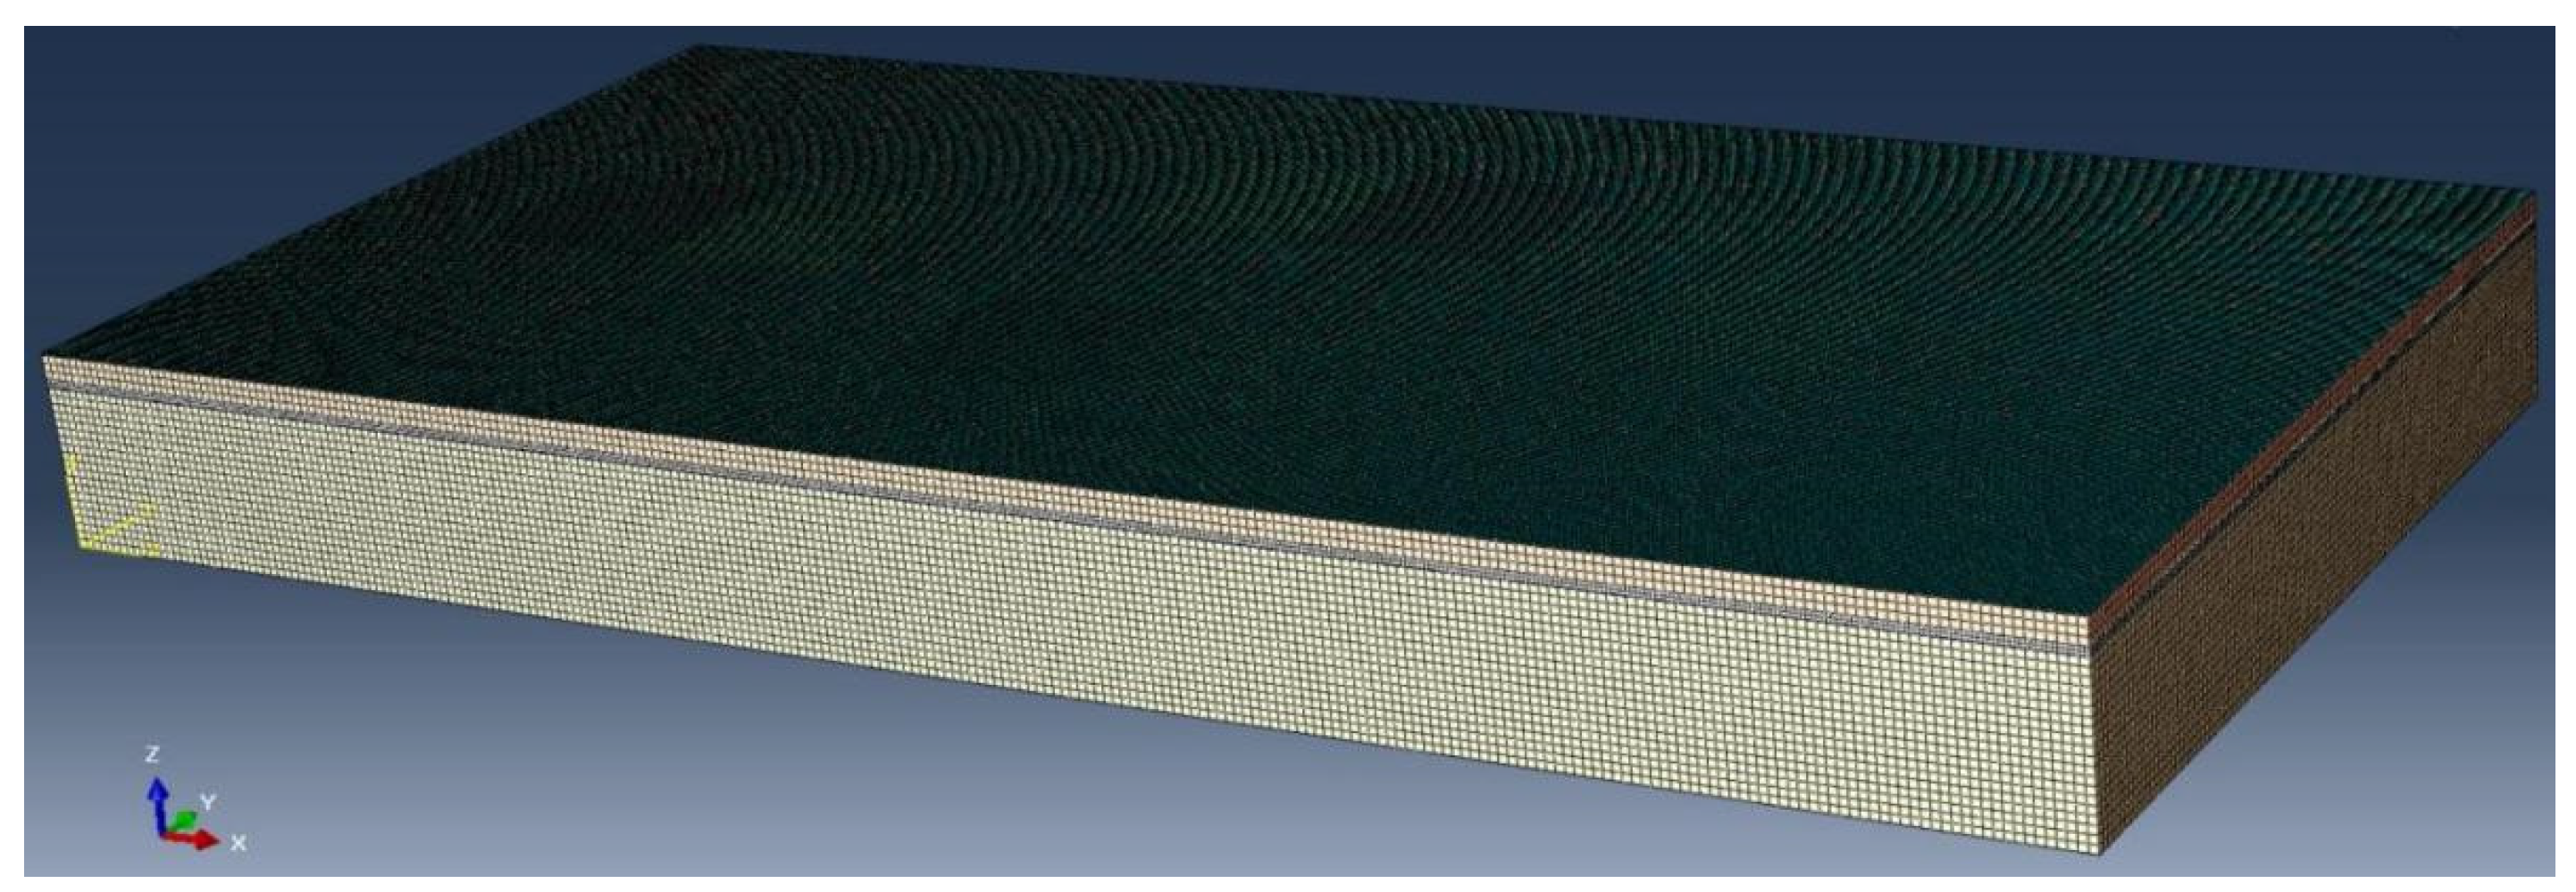
The FE model is built in Abaqus using field structural data from a typical expressway in Shandong Province, section K1422+930, as shown in
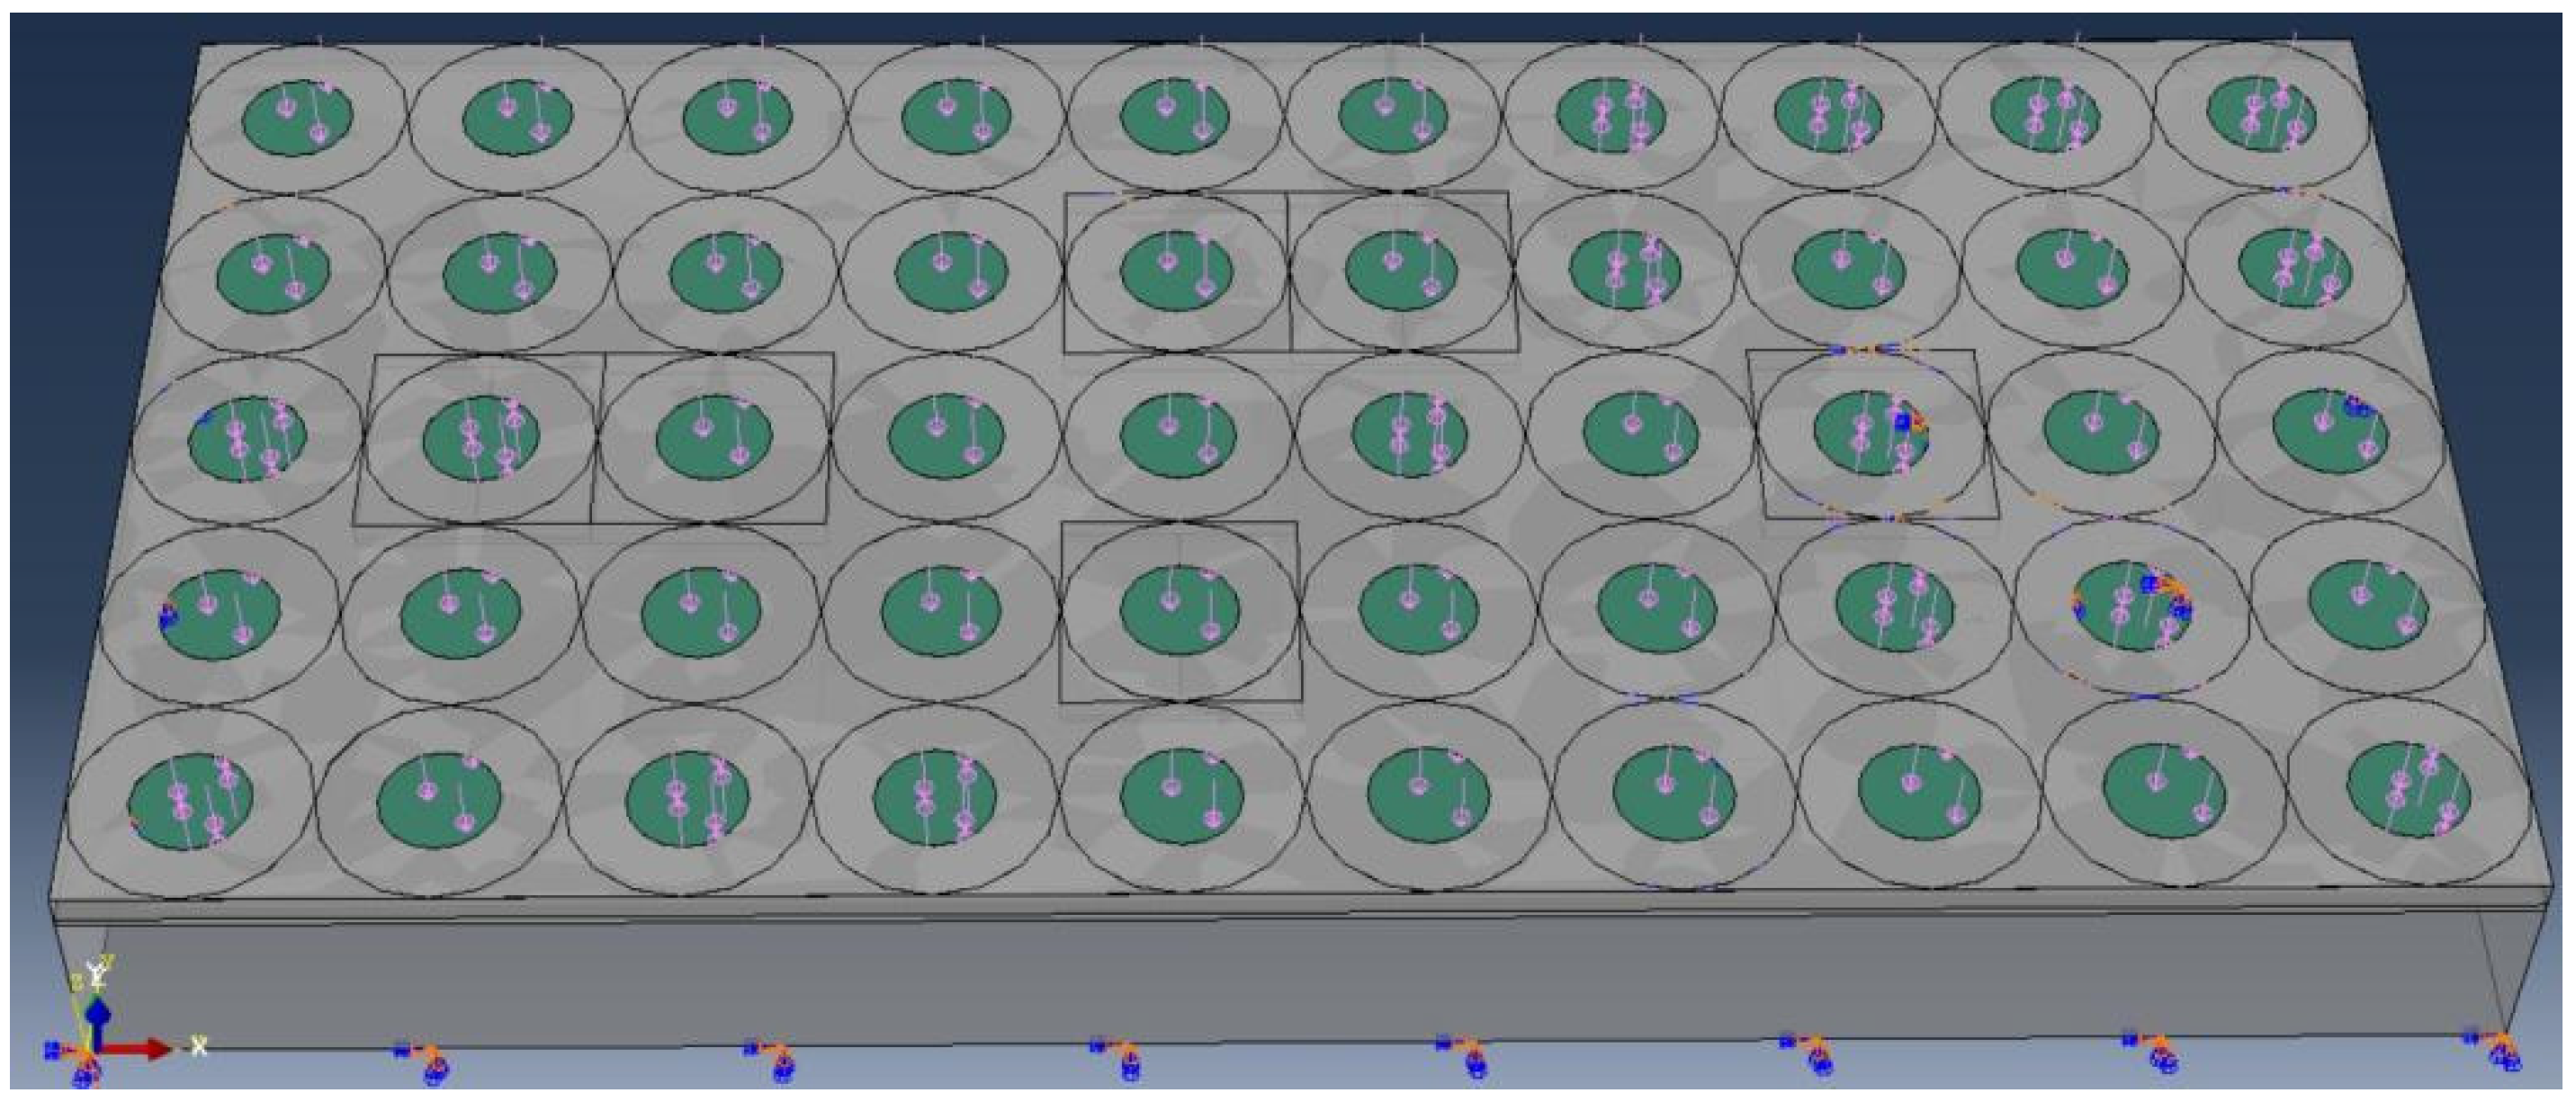
Figure 9. The model has a length of 12 m and a width of 6 m to capture continuous structural response. Three-dimensional solid elements (C3D8R) are used, with local mesh refinement at the interfaces between the surface, base, and subgrade to improve accuracy in high-gradient zones. The load application layout adopted in the subgrade model is presented in
Figure 10.
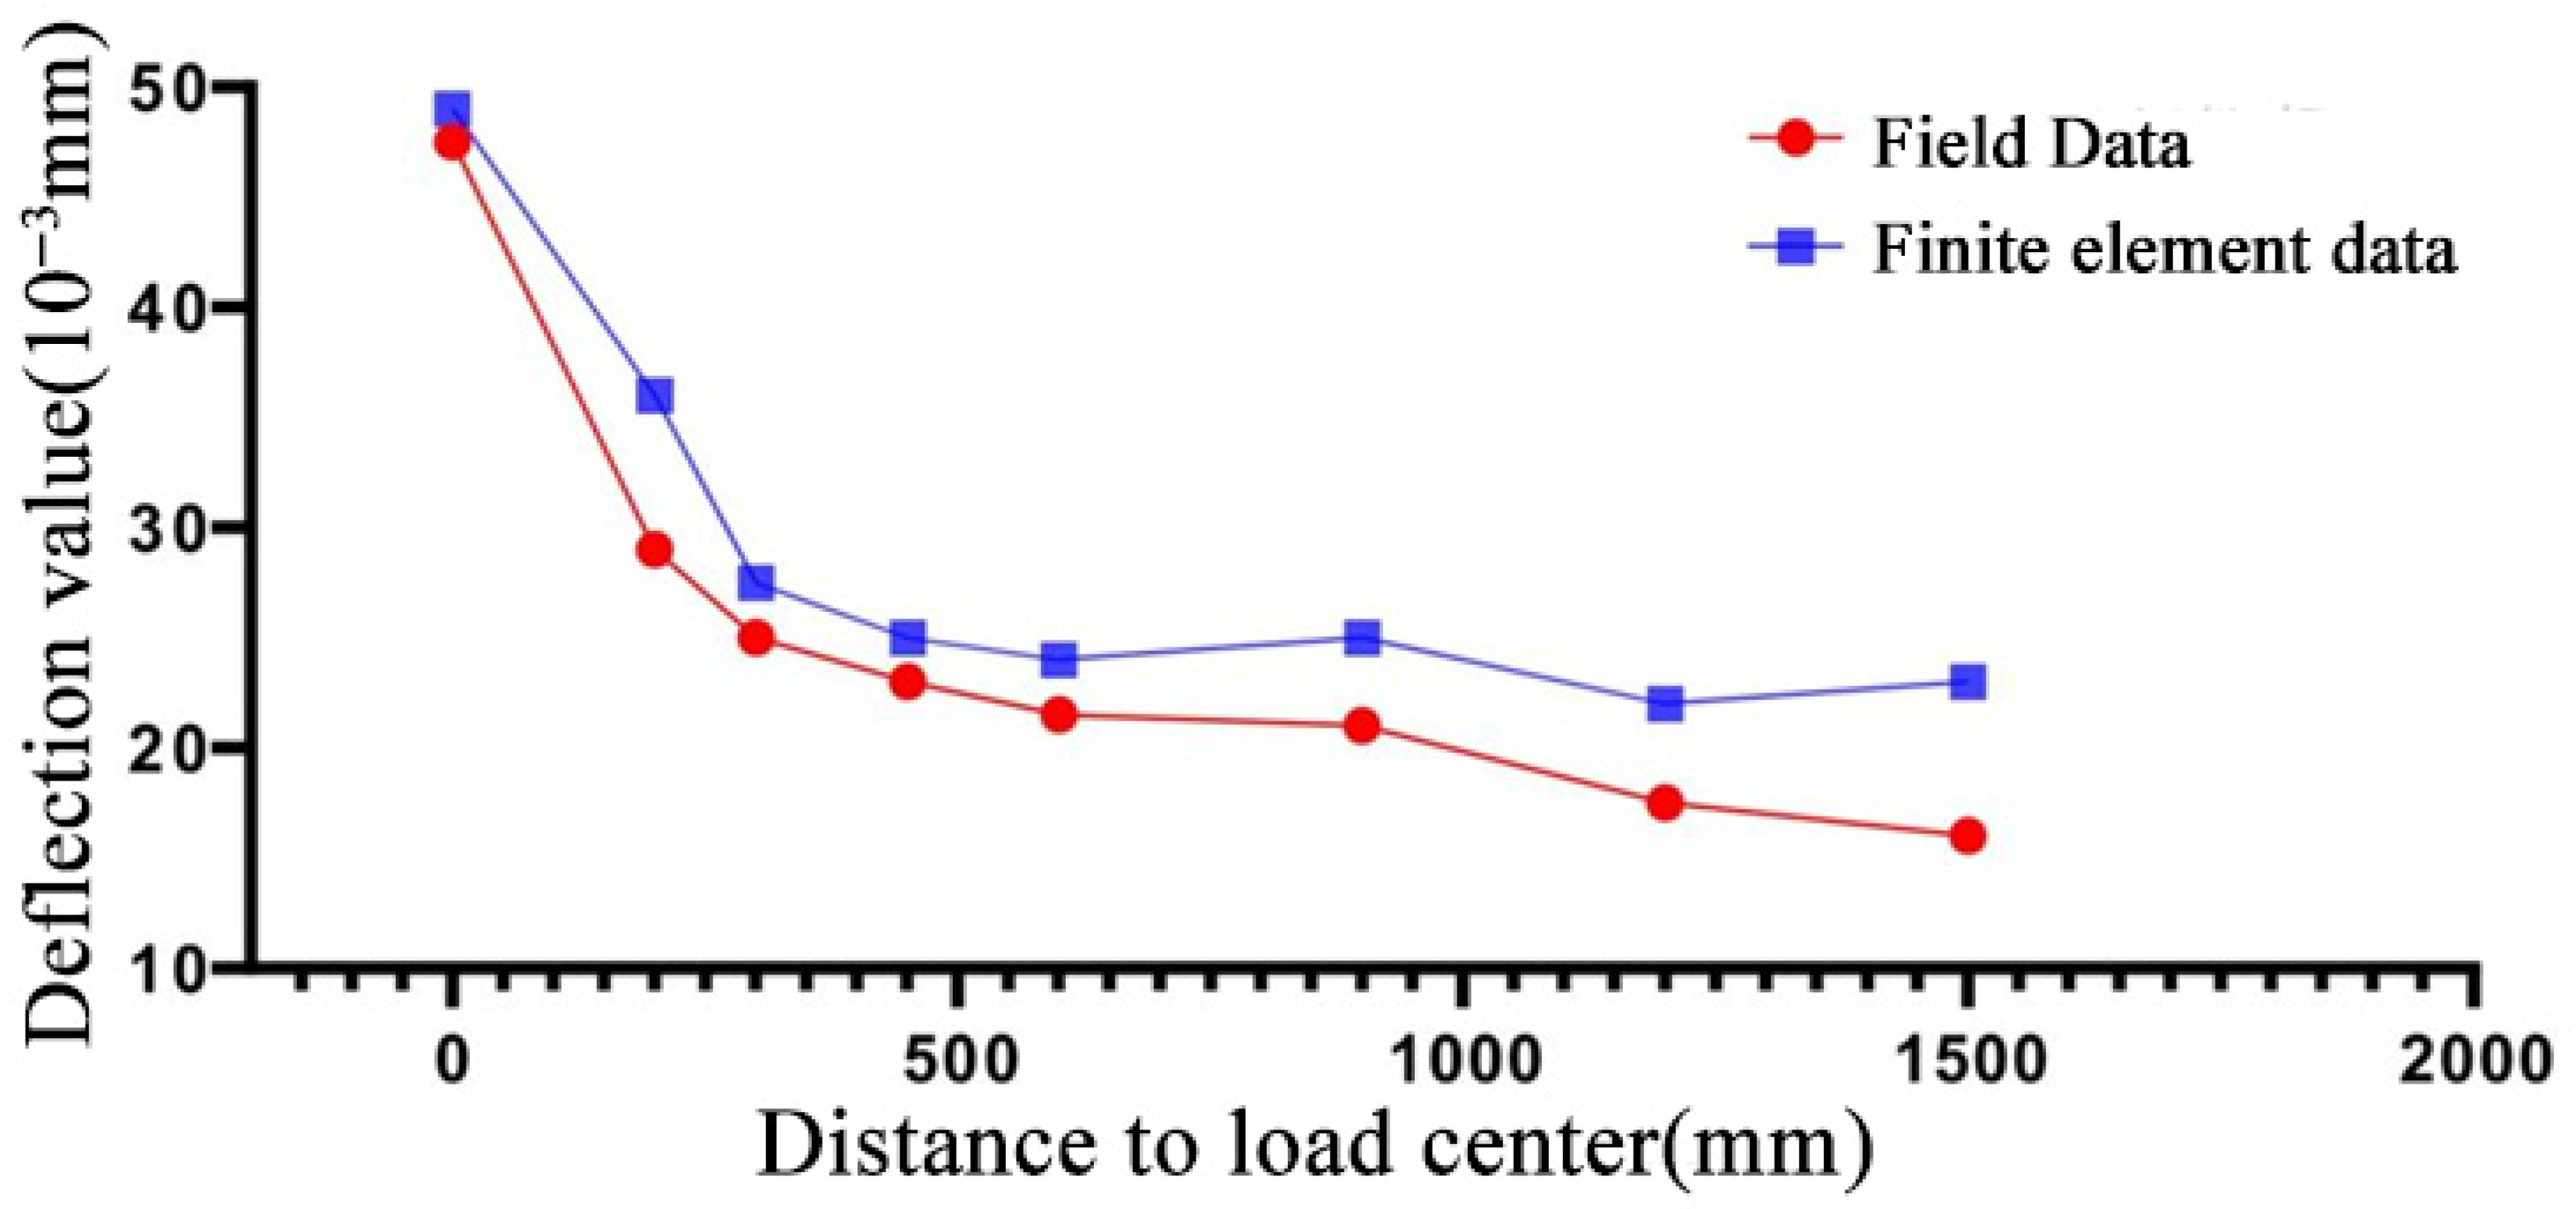
To quantitatively evaluate the accuracy of the FE model, measured surface deflections were directly compared with numerical predictions at representative radial offsets from the load center. The measured and simulated deflection values are plotted together in
Figure 11, providing a point-wise comparison of magnitude and decay trend between field data and finite element results.
In addition to the point-wise comparison, deflection bowl responses obtained from multiple sensor offsets and test sections were analyzed to examine the spatial characteristics of pavement deformation. The measured deflection bowls, together with the corresponding numerical responses, are shown in
Figure 12, illustrating the consistency of spatial decay trends under different conditions.
Quantitative comparison shows strong agreement between simulated and measured deflections, with an R2 of 0.94 and an RMSE of 0.006 mm. The finite element model accurately reproduces both the magnitude and decay trend of the measured deflection response. Beyond numerical proximity, the correspondence in response characteristics indicates that the model faithfully reproduces subgrade behavior under load, validating its reliability. This evidence base underpins subsequent simulations of distress scenarios and the associated data outputs. To verify the numerical stability of the FE model, a mesh sensitivity analysis was conducted.
Three different mesh densities were tested by progressively refining the element size in the critical regions near the surface–base and base–subgrade interfaces. The maximum surface deflection and peak stress responses were compared under identical loading conditions. The results indicate that further mesh refinement leads to negligible variation in the computed responses, demonstrating that the adopted mesh density is sufficient and mesh-independent.
3.3. Selection of Constitutive Parameters and Boundary Conditions
Constitutive inputs include mass density, Young’s modulus, and Poisson’s ratio for each layer. Strain
is defined as the relative deformation under stress,
where
is the length change and
the original length. Young’s modulus
characterizes elastic stiffness,
with a larger E indicating greater elastic rigidity. Poisson’s ratio, nu, describes lateral contraction versus axial extension,
where
and
are transverse and axial strains, respectively. The thickness of each structural layer adopted in the FE model was determined based on field structural information and core sampling records. The constitutive parameters of the subgrade based on field data are listed in
Table 3.
The boundary conditions reflect in-service conditions. The four lateral faces remain free to allow natural deformation and prevent artificial confinement. The bottom of the model is fully fixed to represent ground reaction and anchorage, as illustrated in
Figure 13. This setup better captures the supporting effect of the underlying soil.
Based on specifications, a typical wheel produces an equivalent uniform pressure of approximately 0.7 MPa during operation. A circular static load of 0.7 MPa with a 20 cm diameter is applied at the center of each slab to emulate a single wheel and distribute contact pressure appropriately. The baseline parameters for a representative healthy section are as follows: surface density of 2263 kg/m3, Young’s modulus (E) of 28,501 MPa, and Poisson’s ratio (ν) of 0.25; base density of 2169 kg/m3, E of 25,313 MPa, and ν of 0.21; and subgrade density of 1552 kg/m3, E of 15,242 MPa, and ν of 0.32. These values capture the interlayer stiffness gradients and load transfer characteristics.
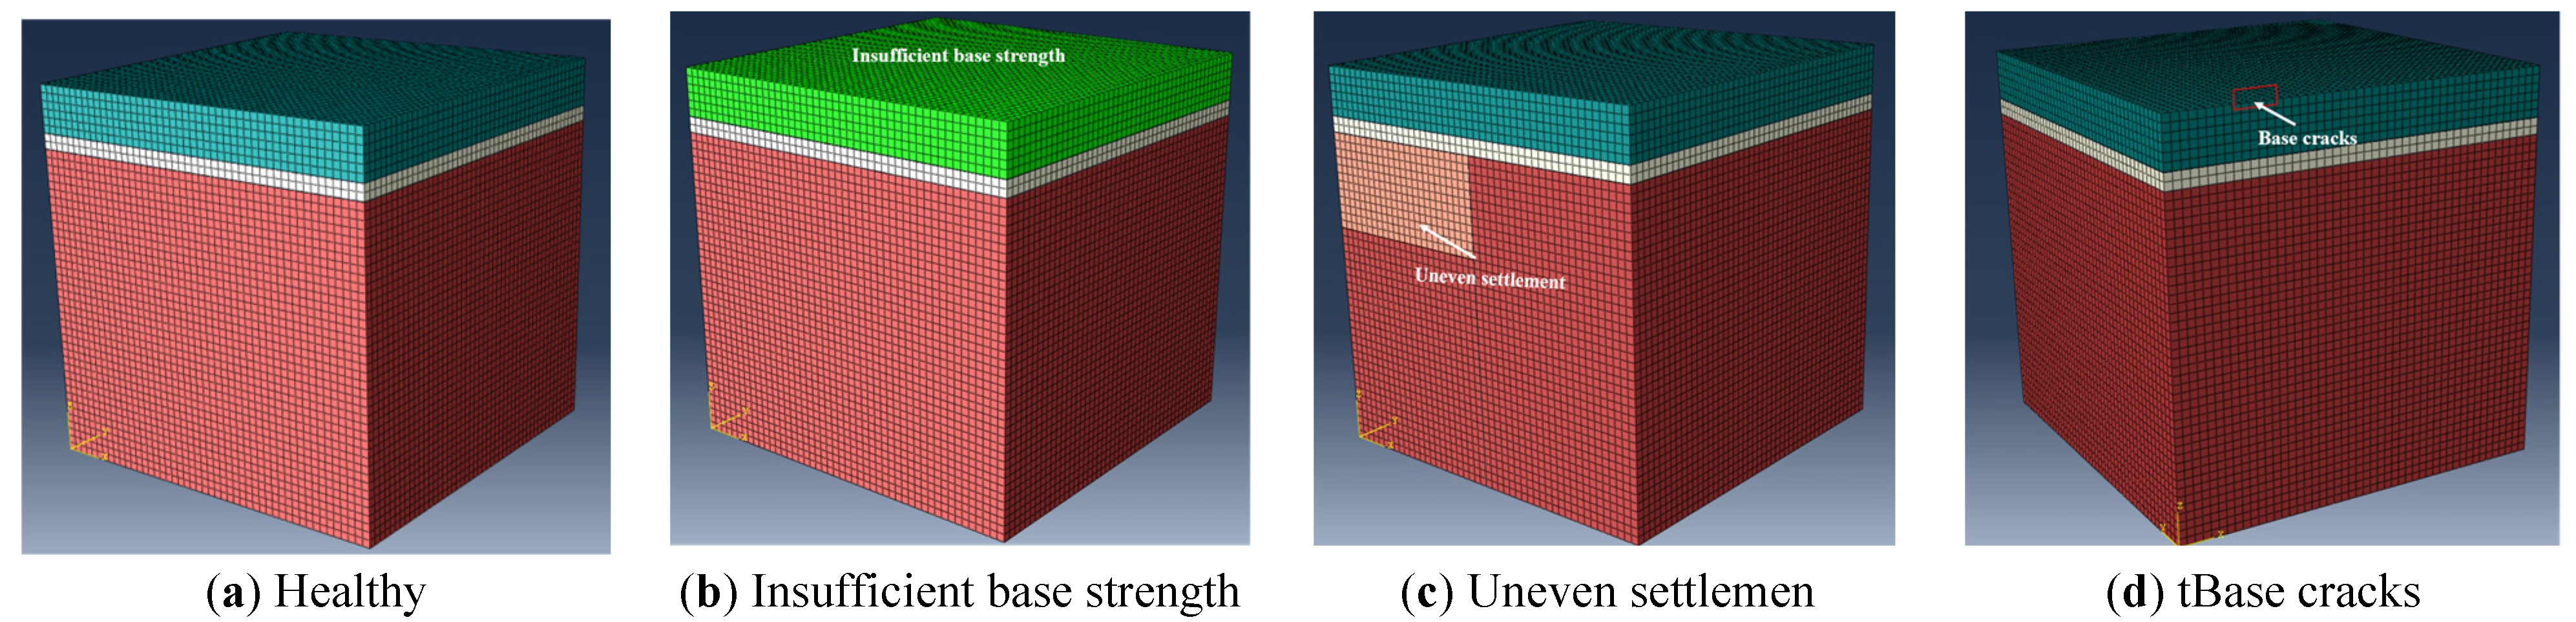
For the modeling scenarios, the following adjustments were made. In the insufficient base strength model, a crack with a length of 15 cm, width of 0.5 cm, and depth of 2 cm was introduced beneath the base. The elastic modulus (E) was reduced to 23,575 MPa to represent discontinuity from fatigue or shrinkage. In the uneven settlement scenario, the base E was reduced by approximately 8%, and the density was decreased to 2025 kg/m3 to reflect moisture-induced weakening and aggregate loosening. For base cracks, the E of the left-side subgrade was lowered to 13,175 MPa. Poisson’s ratio was moderately increased to reflect localized softening effects. The healthy control retained the measured parameters without modification.
Geometry, loading, and boundary conditions are identical across models, so differences in response isolate material degradation and defects. The solver uses a static implicit scheme with a convergence tolerance of 1 × 10⁻⁴ and a per-step iteration cap of 500 to ensure stability and reliability.
The three-dimensional reduced-integration solid element (C3D8R) was adopted due to its computational efficiency and robustness in modeling layered pavement structures with moderate material nonlinearity. Hourglass control was activated to suppress spurious zero-energy deformation modes.
The bottom boundary of the model was fully fixed to represent the constraint provided by the underlying semi-infinite foundation, while the lateral boundaries were left free to avoid artificial confinement and to better reflect in-situ deformation behavior, as shown in
Figure 14.
3.4. Simulation Scenarios and Computational Setup
Based on the field investigation, four representative subgrade distresses scenarios were identified, including transverse cracking, longitudinal cracking, potholes, and general cracking. According to FWD measurements, peak surface deflections reached approximately 0.125 mm at transverse-cracking locations and about 100 mm at longitudinal-cracking sections, while pothole areas exhibited the largest influence ranges exceeding 3.0 m. These observations were used to define the typical damage patterns and severity levels considered in the numerical simulations.
Mechanical testing of core samples provided the material parameters for each structural layer under different distress conditions. For the asphalt surface layer, the compressive strength in healthy sections ranged from 2.61 to 2.94 MPa, with dynamic modulus values markedly higher than those in distressed sections. In transverse- and longitudinal-cracking zones, compressive strength decreased to 2.31–2.41 MPa, accompanied by a 10–15% reduction in dynamic modulus. These values were adopted as input parameters to characterize surface-layer degradation in the FE model.
In the cement-stabilized macadam base, dominant distresses included voids, settlement, and reflective cracking. Core sampling and laboratory tests indicated that the healthy base exhibited a mean resilient modulus of 10,366 MPa and an unconfined compressive strength of 9.65 MPa. In sections affected by transverse and longitudinal cracking, the resilient modulus dropped sharply to 2803–3328 MPa, corresponding to reductions of approximately 68% and 73%, respectively, while compressive strength declined to 7.87–8.88 MPa. These degraded parameters were used to represent base-layer distress scenarios in the simulations.
For the subgrade layer, the mean resilient modulus of healthy sections was approximately 1512 MPa. In distressed zones, the modulus decreased slightly to about 1414 MPa, representing a reduction of roughly 6.5%. This relatively modest change suggests limited intrinsic strength loss in the subgrade material. Accordingly, only minor parameter adjustments were applied in the numerical model, except in cases involving base settlement, where reduced support stiffness was explicitly considered.
Using the above field-derived parameters, four simulation scenarios were analyzed under identical loading conditions:
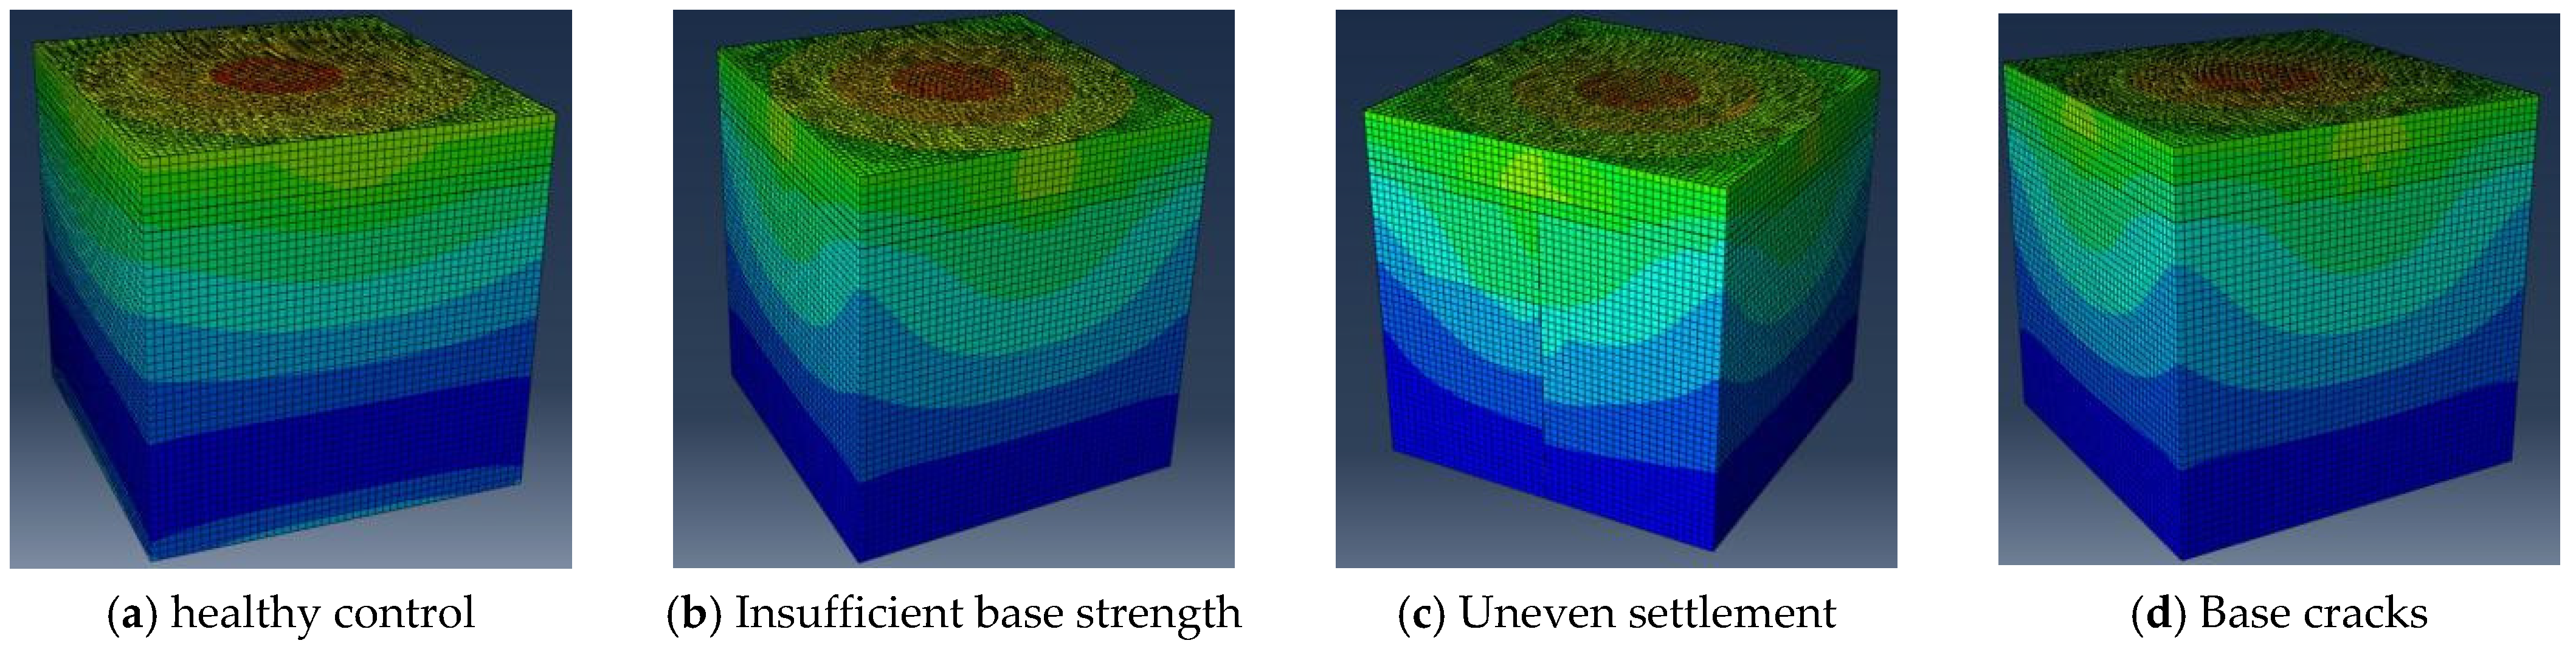
Figure 15 was generated by post-processing the finite element results, in which stress and displacement fields were extracted from the numerical model under different distress scenarios.
In the healthy control scenario, stress decays continuously with depth, and interlayer transfer remains uniform, indicating well-matched stiffness and stable bearing capacity. In the insufficient base strength scenario, stress concentrates beneath the load, with peak vertical compressive stress increasing by approximately 30% compared to the healthy condition, suggesting uneven transfer and a potential for fatigue cracking. In the base cracks scenario, stress concentration forms at the crack tip, with shear redistribution along both sides, and local tensile peaks exceed material limits, indicating potential for crack growth. Finally, in the nonuniform settlement scenario, reduced stiffness on the left subgrade causes asymmetric deformation, with the maximum settlement approximately 1.8 times greater than on the right, highlighting the detrimental effects of soft zones on overall stability.
Post-processing stress and displacement maps in
Figure 15 visualize the load-bearing features for each distress. The spatial overlap of high-stress and high-deformation zones helps identify likely initiation sites. The corresponding mechanical field distributions are further illustrated in
Figure 16. For quantitative analysis, 21 monitoring points are placed along the centerline of each model. This results in 1050 data nodes for statistical analysis and risk assessment.
The simulation results indicate that micro-scale heterogeneity within the base and subgrade layers is a primary driver of macro-scale distress development. Local reductions in stiffness alter load transfer paths and intensify stress concentrations. These effects interact with deformation processes and ultimately lead to crack growth, differential settlement, and bearing capacity loss. From a fracture mechanics perspective, stress concentration at crack tips induces tensile stress amplification, accelerating crack propagation under repeated loading. From an elastoplastic viewpoint, stiffness degradation in the base layer promotes localized plastic deformation and uneven settlement. These mechanisms collectively explain the observed coupling between material damage, interface failure, and macroscopic deformation patterns.
3.5. Discussion
The numerical simulations provide a mechanistic interpretation of typical subgrade distresses observed in the field. The results show that stiffness degradation in the cement-stabilized macadam base plays a dominant role in stress redistribution and deformation amplification. When base stiffness decreases locally, load transfer paths are altered. This leads to stress concentration beneath the wheel load and increases the risk of crack initiation and differential settlement. As a result, severe structural responses may occur even when surface-layer distress appears limited.
Compared with previous studies that mainly rely on assumed material properties or single detection techniques, this study integrates field-derived constitutive parameters into the FE model. This integration strengthens the link between observed distresses and simulated mechanical responses. Stress concentration at crack tips and asymmetric deformation under uneven settlement conditions are consistent with conclusions reported in fracture mechanics and elastoplastic analyses of pavement structures. These results support the physical rationality of the proposed modeling approach.
From an engineering perspective, model validation against field measurements is essential. A practical validation procedure is therefore suggested. Simulated and measured FWD surface deflections should be compared at corresponding sensor offsets. Quantitative metrics such as the coefficient of determination (R2) and root mean square error (RMSE) can be used to assess point-wise agreement. In addition, the overall shape of the deflection bowl should be examined. This helps ensure that spatial response trends are reasonably captured by the FE model.
Several limitations of this study should be noted. The finite element analysis was conducted under quasi-static loading conditions. Time-dependent effects, such as fatigue damage accumulation and material aging, were not explicitly considered. Pavement materials were represented using equivalent elastic parameters. This simplification may not fully capture nonlinear or viscoelastic behavior under repeated traffic loading. Environmental effects, including moisture and temperature variations, were also not included. Future research will focus on time-dependent material models, traffic–environment coupling, and extension of the proposed framework to network-level pavement management applications.
4. Conclusions
This study addresses the challenge of interpreting subgrade distress mechanisms under in-service highway conditions, where data acquisition is difficult and damage processes are often concealed. By integrating field testing and FE modeling, a mechanism-oriented analytical framework was established to investigate stress distribution and deformation behavior in distressed subgrade systems.
Field investigations using FWD, GPR, and core sampling provided representative mechanical parameters for different structural layers. These parameters captured stiffness degradation and material variability under various distress conditions and served as reliable inputs for numerical simulation. When incorporated into the Abaqus FE model, the simulated deflection responses showed good agreement with FWD measurements, indicating that the model can reasonably reproduce the mechanical behavior of the subgrade under realistic loading.
Stress and deformation analyses revealed that cracking and stiffness decay in the base layer induce localized stress concentration and differential settlement, while reduced subgrade bearing capacity further amplifies these effects. These findings clarify the mechanical linkage between distress initiation, evolution, and structural response across layers.
Overall, the proposed framework combines empirical testing with numerical modeling to support mechanism-based evaluation and condition assessment of highway subgrades. It provides a practical foundation for intelligent maintenance and data-driven pavement management. Future research will focus on incorporating time-dependent material degradation, coupling traffic loading with environmental effects, and extending the framework to network-level pavement management applications.