Article

Mitigating Urban Heat Island Effects Through Thermally Efficient Concrete Paver Blocks for Sustainable Infrastructure


1
Civil Engineering Department, Institute of Technology, Nirma University, Ahmedabad 382481, Gujarat, India
2
Department of Civil Engineering, Faculty of Civil Engineering, Transilvania University of Brașov, 500036 Brașov, Romania
*
Author to whom correspondence should be addressed.
Infrastructures 2026, 11(1), 5; https://doi.org/10.3390/infrastructures11010005
Submission received: 7 November 2025 / Revised: 5 December 2025 / Accepted: 18 December 2025 / Published: 21 December 2025
(This article belongs to the Section Infrastructures Materials and Constructions)

Abstract

Rapid urbanization and the widespread use of impervious materials have intensified the urban heat island (UHI) effect, raising surface temperatures and energy demands. Conventional concrete pavements contribute significantly due to their high thermal conductivity and low reflectivity. This study systematically investigates the development of thermally efficient concrete paver blocks using sustainable alternative fine aggregates to mitigate heat accumulation while retaining a minimum compressive strength of 35–45 MPa (recommended for medium traffic). Unlike prior isolated studies, this research offers a comprehensive comparative analysis of three sand replacements—Vermiculite powder (12.5–50%), Perlite powder (20–80%), and Crushed Glass (7.5–30%)—in M30-grade concrete. Fresh and hardened properties were evaluated through slump, density, and compressive strength tests at 7, 14, and 28 days, while infrared thermography quantified surface temperature variations under controlled heat exposure. Results showed significant thermal improvements, with optimal mixes Vermiculite 25% (VC-25), Perlite 40% (PR-40), and Crushed Glass 15% (CG-15) reducing surface temperatures by 25.1 °C, 22.2 °C, and 18.2 °C, respectively, while maintaining compressive strengths of 47.8 MPa, 38.8 MPa, and ~58 MPa. VC-25 proved superior, achieving the lowest surface temperature (26.3 °C) and 48.8% lower heat absorption than conventional concrete. The study establishes optimal replacement thresholds balancing insulation and strength, supporting SDGs 11, 12, and 13 through climate-responsive, resource-efficient construction materials.

1. Introduction

Urbanization is reshaping the thermal behaviour of cities in ways that extend beyond rising population density and infrastructure growth. As natural land is increasingly converted into impervious surfaces, such as roads, pavements, rooftops, and parking areas, cities absorb and store larger amounts of solar energy. This leads to the UHI effect, where urban regions exhibit significantly higher air and surface temperatures than nearby rural areas, with notable implications for human health, energy consumption, air quality, and long-term urban sustainability. In India, the intensity of warming is becoming more evident. For instance, the annual mean temperature has increased from approximately 25.05 °C in 2001 to 25.74 °C in 2024, showing a rise of ~0.7 °C in two decades. A remote sensing study for Ahmedabad (2003–2018) reported that land surface temperature (LST) and surface UHI intensify with increasing built-up area, decreasing vegetation, and reduced evapotranspiration [1]. Further projections indicate that by 2030, as urban expansion continues, nearly 70% of Ahmedabad’s land surface could reach summertime temperatures of about 45 °C during peak periods [2]. These observations highlight that UHI is not limited to episodic heatwaves but reflects a sustained upward shift in urban thermal conditions.
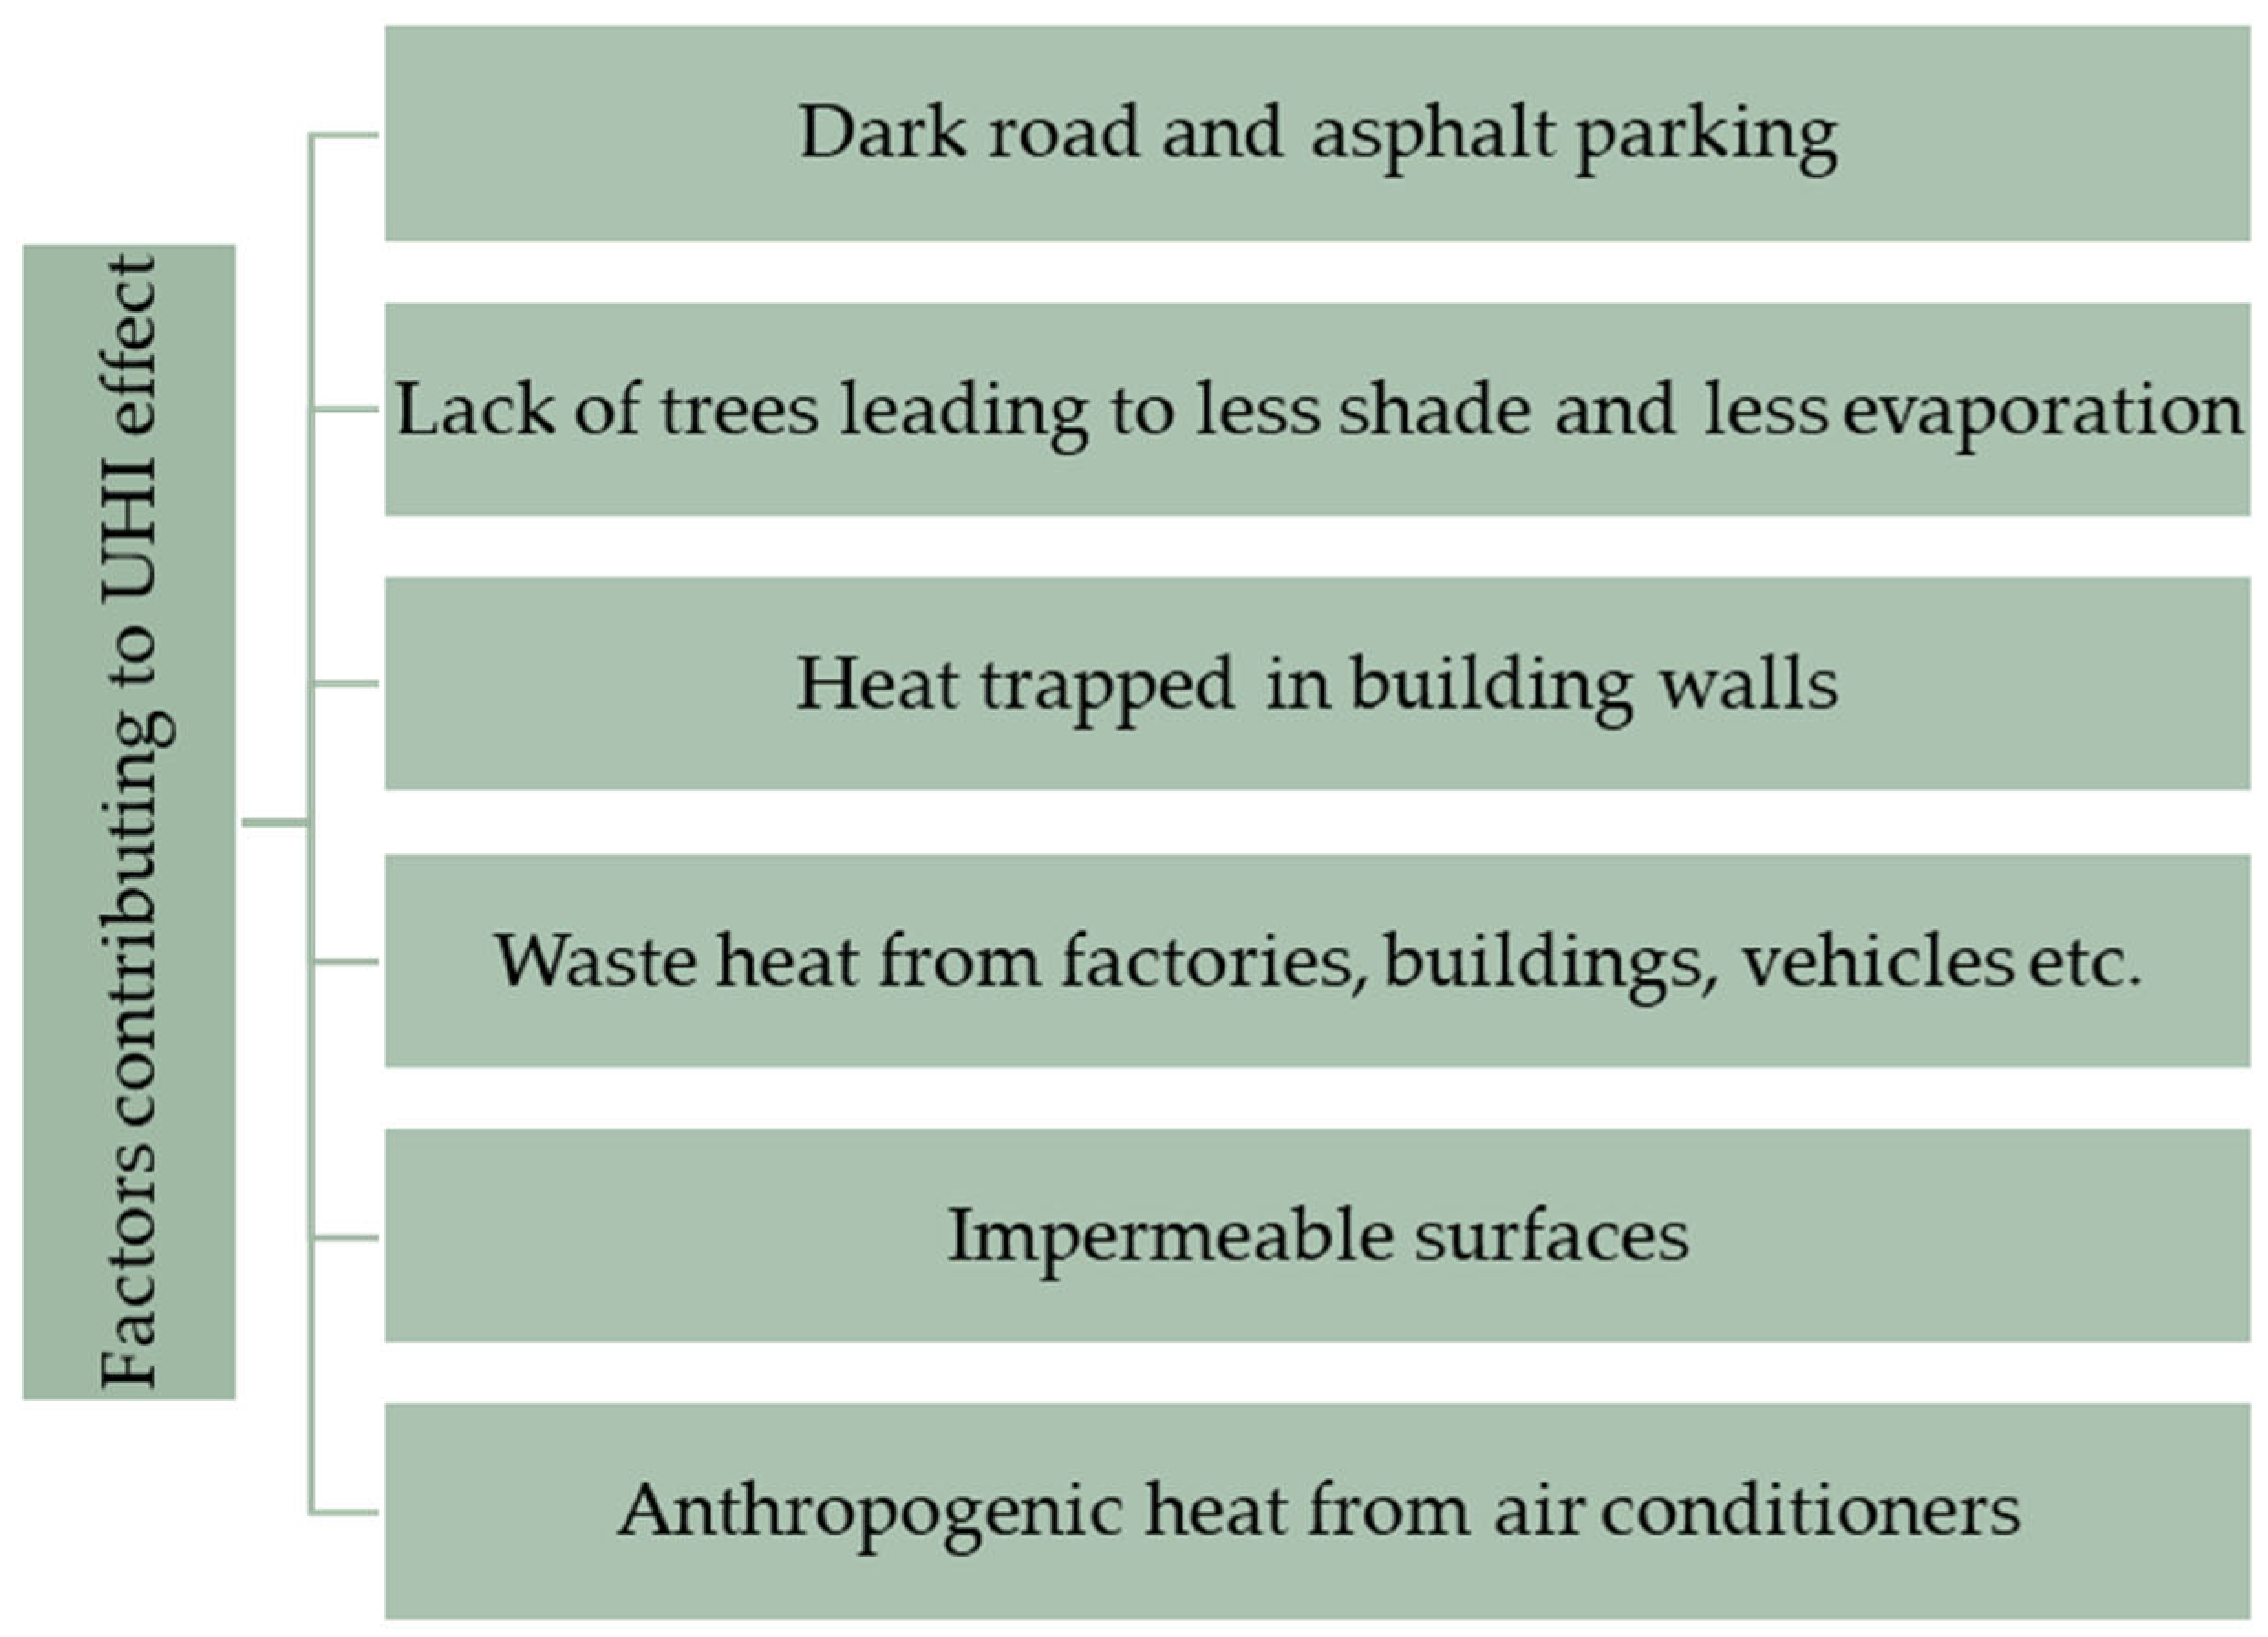
The material and physical characteristics of urban infrastructure significantly contribute to these elevated temperatures. One important factor is how much sunlight a surface reflects versus absorbs. Dark materials such as asphalt reflect very little sunlight and instead absorb most of it, storing heat during the day and releasing it slowly at night. Studies in tropical and semi-arid climates show that conventional asphalt and concrete pavements typically reflect less than 10–30% of incoming sunlight, depending on ageing and environmental exposure [3,4]. Newly laid asphalt may reflect only 5–10%, while lighter concrete surfaces may reflect 20–40% under favourable conditions. Over time, this reflectivity decreases due to weathering and soiling. In regions with strong sunlight, pavement temperatures can reach ~60 °C or more during midday [5], further increasing nighttime heat release and reducing natural cooling. Other important factors contributing to such an effect are summarized in Figure 1 below.
Multiple strategies exist to mitigate UHI, with varying suitability in dense urban settings. Nature-based solutions such as urban trees, parks, green roofs, vertical greening, and water-body conservation help reduce temperatures through shading and evapotranspiration. Even a modest 5–15% increase in tree canopy can lower ambient or surface temperatures by several degrees. High-reflectance surface treatments or “cool coatings” applied to roofs and pavements have also demonstrated effectiveness; increasing pavement albedo from ~24% to ~70% can reduce surface temperatures from ~60 °C to ~47 °C (a drop of ~13 °C). Permeable pavements provide evaporative cooling while improving stormwater infiltration, but their higher porosity can reduce albedo, limiting thermal benefits. Material-level innovations, such as modifying pavement composition using alternative aggregates or additives to reduce heat absorption, represent another promising approach, though challenges remain regarding strength, durability, and cost.
Addressing these gaps, the present study examines the use of alternative fine aggregates, vermiculite, perlite, and crushed glass, as partial replacements for natural sand in M30-grade concrete paver blocks. The goal is to develop a structurally reliable yet thermally efficient paving material capable of reducing surface heat accumulation in urban environments. Mechanical properties (compressive strength at 7, 14, and 28 days, density, and water absorption) and thermal characteristics (surface temperature, infrared thermography, and heat-retention behaviour) were systematically assessed. This research contributes to sustainable and climate-responsive urban infrastructure development and aligns with the United Nations Sustainable Development Goals (SDG 11, SDG 12, and SDG 13) by promoting resource-efficient materials that enhance thermal comfort while reducing dependence on natural sand.

2. Literature Review

UHI effects are a major environmental challenge in modern cities, driven by rapid urbanization, land-use changes, and replacement of natural surfaces with impervious materials such as concrete and asphalt. Numerous studies across diverse climatic zones have shown that urban morphology, land cover, and surface material properties strongly influence local temperature distributions, leading to elevated surface and air temperatures, altered microclimates, and increased energy demand [6,7,8]. In hot–arid cities such as Doha, the density and configuration of built-up areas significantly affect nighttime near-surface temperatures, intensifying heat stress and impacting urban livability [6]. Similar trends are observed in Indian cities like Siliguri, where rapid infrastructure growth, population increase, and vegetation loss have substantially raised land surface temperature (LST) over the past two decades [8]. These findings highlight that UHI is shaped by both macro-scale urban expansion and micro-scale surface characteristics.
UHI manifests as higher nighttime temperatures and altered local climate patterns, particularly in hot–arid cities [9]. Compact urban zones tend to retain heat at night, while industrial areas experience extreme daytime heating. Long-term exposure to urban heat is associated with adverse health impacts, including increased mortality, cardiovascular complications, mental health disorders, and preterm birth. Physiologically, heat stress disrupts thermoregulation, induces systemic inflammation, and affects neurological responses, with vulnerability influenced by demographic and health factors [10]. Therefore, effective UHI mitigation is critical not only for thermal comfort but also for public health.
Environmental processes are also affected by UHI. For instance, studies in Moscow show that urban snowpacks melt earlier, become denser, and experience more frequent melt–freeze cycles compared to rural areas, illustrating UHI’s broader ecological impact [11].
Recent research has shifted toward mitigation strategies. Urban greening and blue infrastructure improve shading, evapotranspiration, and microclimate cooling [12,13,14]. Tree canopies, water bodies, and vertical greening systems (living walls, green roofs) significantly reduce LST in Mediterranean and tropical cities [15]. Passive approaches such as reflective materials, cool roofs, and high-albedo surfaces reduce heat absorption, though their performance can decline over time due to dust deposition and aging [16]. Simulation tools, including Urban Digital Twins and coupled urban canopy–building energy models, enable city-scale assessment of UHI and identification of heat-vulnerable zones [17,18]. However, these methods are primarily diagnostic and do not address material-level interventions.
Concrete surfaces dominate urban infrastructure, and their thermal properties, thermal conductivity, reflectivity, and heat storage, directly influence UHI intensity [19,20]. Material-based strategies, therefore, provide a scalable complement to urban-scale interventions. Incorporating supplementary cementitious materials (SCMs) such as fly ash, slag, and metakaolin, or lightweight aggregates like expanded clay and recycled rubber, can reduce density and heat retention [21]. Reflective or evaporative pavements have been shown to lower surface temperatures under controlled conditions [22]. These strategies, however, may compromise mechanical strength, highlighting the need for optimized mix designs.
Among lightweight fine aggregates, vermiculite and perlite have been widely studied for UHI mitigation due to their low thermal conductivity, light weight, and compatibility with cementitious matrices [23]. Vermiculite’s lamellar structure enhances insulation and water retention, perlite’s porous nature provides thermal resistance, and crushed glass improves reflectivity while enabling waste valorization. Incorporating these materials in concrete pavements reduces thermal conductivity and surface temperature up to 3.5 °C without major loss in strength when used within optimal replacement levels [21,24]. Recent advancements in cool pavement strategies include reflective, permeable, and high thermal inertia systems, with some incorporating Phase Change Materials (PCMs). Reflective pavements with higher solar reflectance (SR~0.12–0.20) can reduce surface temperatures by 3.5–10 °C, whereas permeable designs leverage evaporative cooling to lower surface temperatures by 15–35 °C after rainfall. Incremental increases in albedo (Δ0.1) have been shown to reduce air temperatures by up to 0.95 °C. However, performance may be influenced by weathering, maintenance requirements, and pedestrian glare [25]. Other research highlights the role of urban infrastructure, such as elevated metro corridors, in affecting UHI. Shaded areas beneath metro structures exhibit lower SUHII (2.1 °C) compared to unshaded roads (5.4 °C), demonstrating the combined effect of structural shading and surface materials [26].
Concrete-based paver blocks have been widely studied for UHI mitigation. Cement blocks with high-albedo aggregates or white cement maintain surface reflectance of 0.35–0.40, significantly higher than asphalt (0.05–0.15), and white cement overlays can achieve up to 0.70–0.80 albedo, effectively reducing surface temperatures while maintaining structural integrity [27]. Water-retaining paver blocks (WRPBs) provide dual benefits: they mitigate UHI and manage stormwater by retaining water within their porous matrix, lowering internal block temperatures by 2–10 °C [28]. Recent studies also show that integrating thermally responsive lightweight aggregates such as perlite, vermiculite, and crushed glass further enhances cooling performance and sustainability [29,30,31].
Vermiculite, a lightweight, porous silicate, has been extensively explored for its thermal insulation properties in concrete. Other studies indicate that replacing 10–50% of sand with vermiculite reduces density from 2420 to 1650 kg/m3 and compressive strength from 32.4 to 12.7 MPa, while thermal conductivity decreases by nearly 65% [30,32]. Mixes with up to 20% replacement retain sufficient strength (>25 MPa) for structural paver applications [32]. Microstructural analysis reveals that expanded vermiculite increases micro-voids and water absorption, highlighting the importance of mix design and particle size distribution [32].
Recent eco-friendly concrete paver studies show that ternary mixes with perlite, fly ash, and slag achieve 24.6 MPa compressive strength, 4.1 MPa flexural strength, and 0.21 W/m·K thermal conductivity, along with 9–11% lower CO2 emissions [33]. Other research demonstrates that pervious paver blocks with 20% vermiculite and 10% recycled GP provide high infiltration (2950 cm/hr), low thermal conductivity (0.19 W/m·K), and sufficient strength (22.8 MPa), enabling simultaneous surface cooling and permeability [30]. High-temperature performance of concrete with 25% vermiculite retained up to 60% of compressive strength after exposure to 800 °C for 2 h, with thermal conductivity reduced by 40–50% relative to control mixes, confirming suitability for thermal resilience and fire resistance applications [31]. Parametric studies combining vermiculite and expanded perlite (15% + 10%) have identified an optimal balance between reduced thermal conductivity (0.18 W/m·K), compressive strength (25.2 MPa), and unit weight (1780 kg/m3) [34].
Further investigations into exfoliated vermiculite (EVM) demonstrate its suitability as a lightweight aggregate and PCM support. Mixes with 55–65% EVM achieve thermal conductivity of 0.34–0.50 W/m·K, densities of 1.13–1.29 g/cm3, and compressive strengths of 6.31–14.8 MPa [30]. Waste glass powder (WGP) has also been investigated as a sand and binder replacement. Partial replacement (10–50%) enhances thermal conductivity, flowability, and acid resistance, while semi-flexible pavements with 40% glass blocks reduce surface temperatures by 12.5 °C and slow heat transfer by 3.9 °C, demonstrating dual benefits of mechanical performance and thermal insulation [31,35,36].
Overall, these studies indicate that lightweight aggregates such as vermiculite, perlite, and WGP offer significant potential for UHI mitigation in concrete paver blocks. However, research gaps remain in systematically optimizing replacement levels, balancing thermal insulation with mechanical performance, and evaluating performance under realistic environmental conditions. This study addresses these gaps by investigating mixed replacements of vermiculite, perlite, and crushed glass in M30 paver blocks, focusing on thermal performance, compressive strength, and density to develop climate-adaptive, sustainable pavement materials.

3. Materials and Methods

3.1. Materials

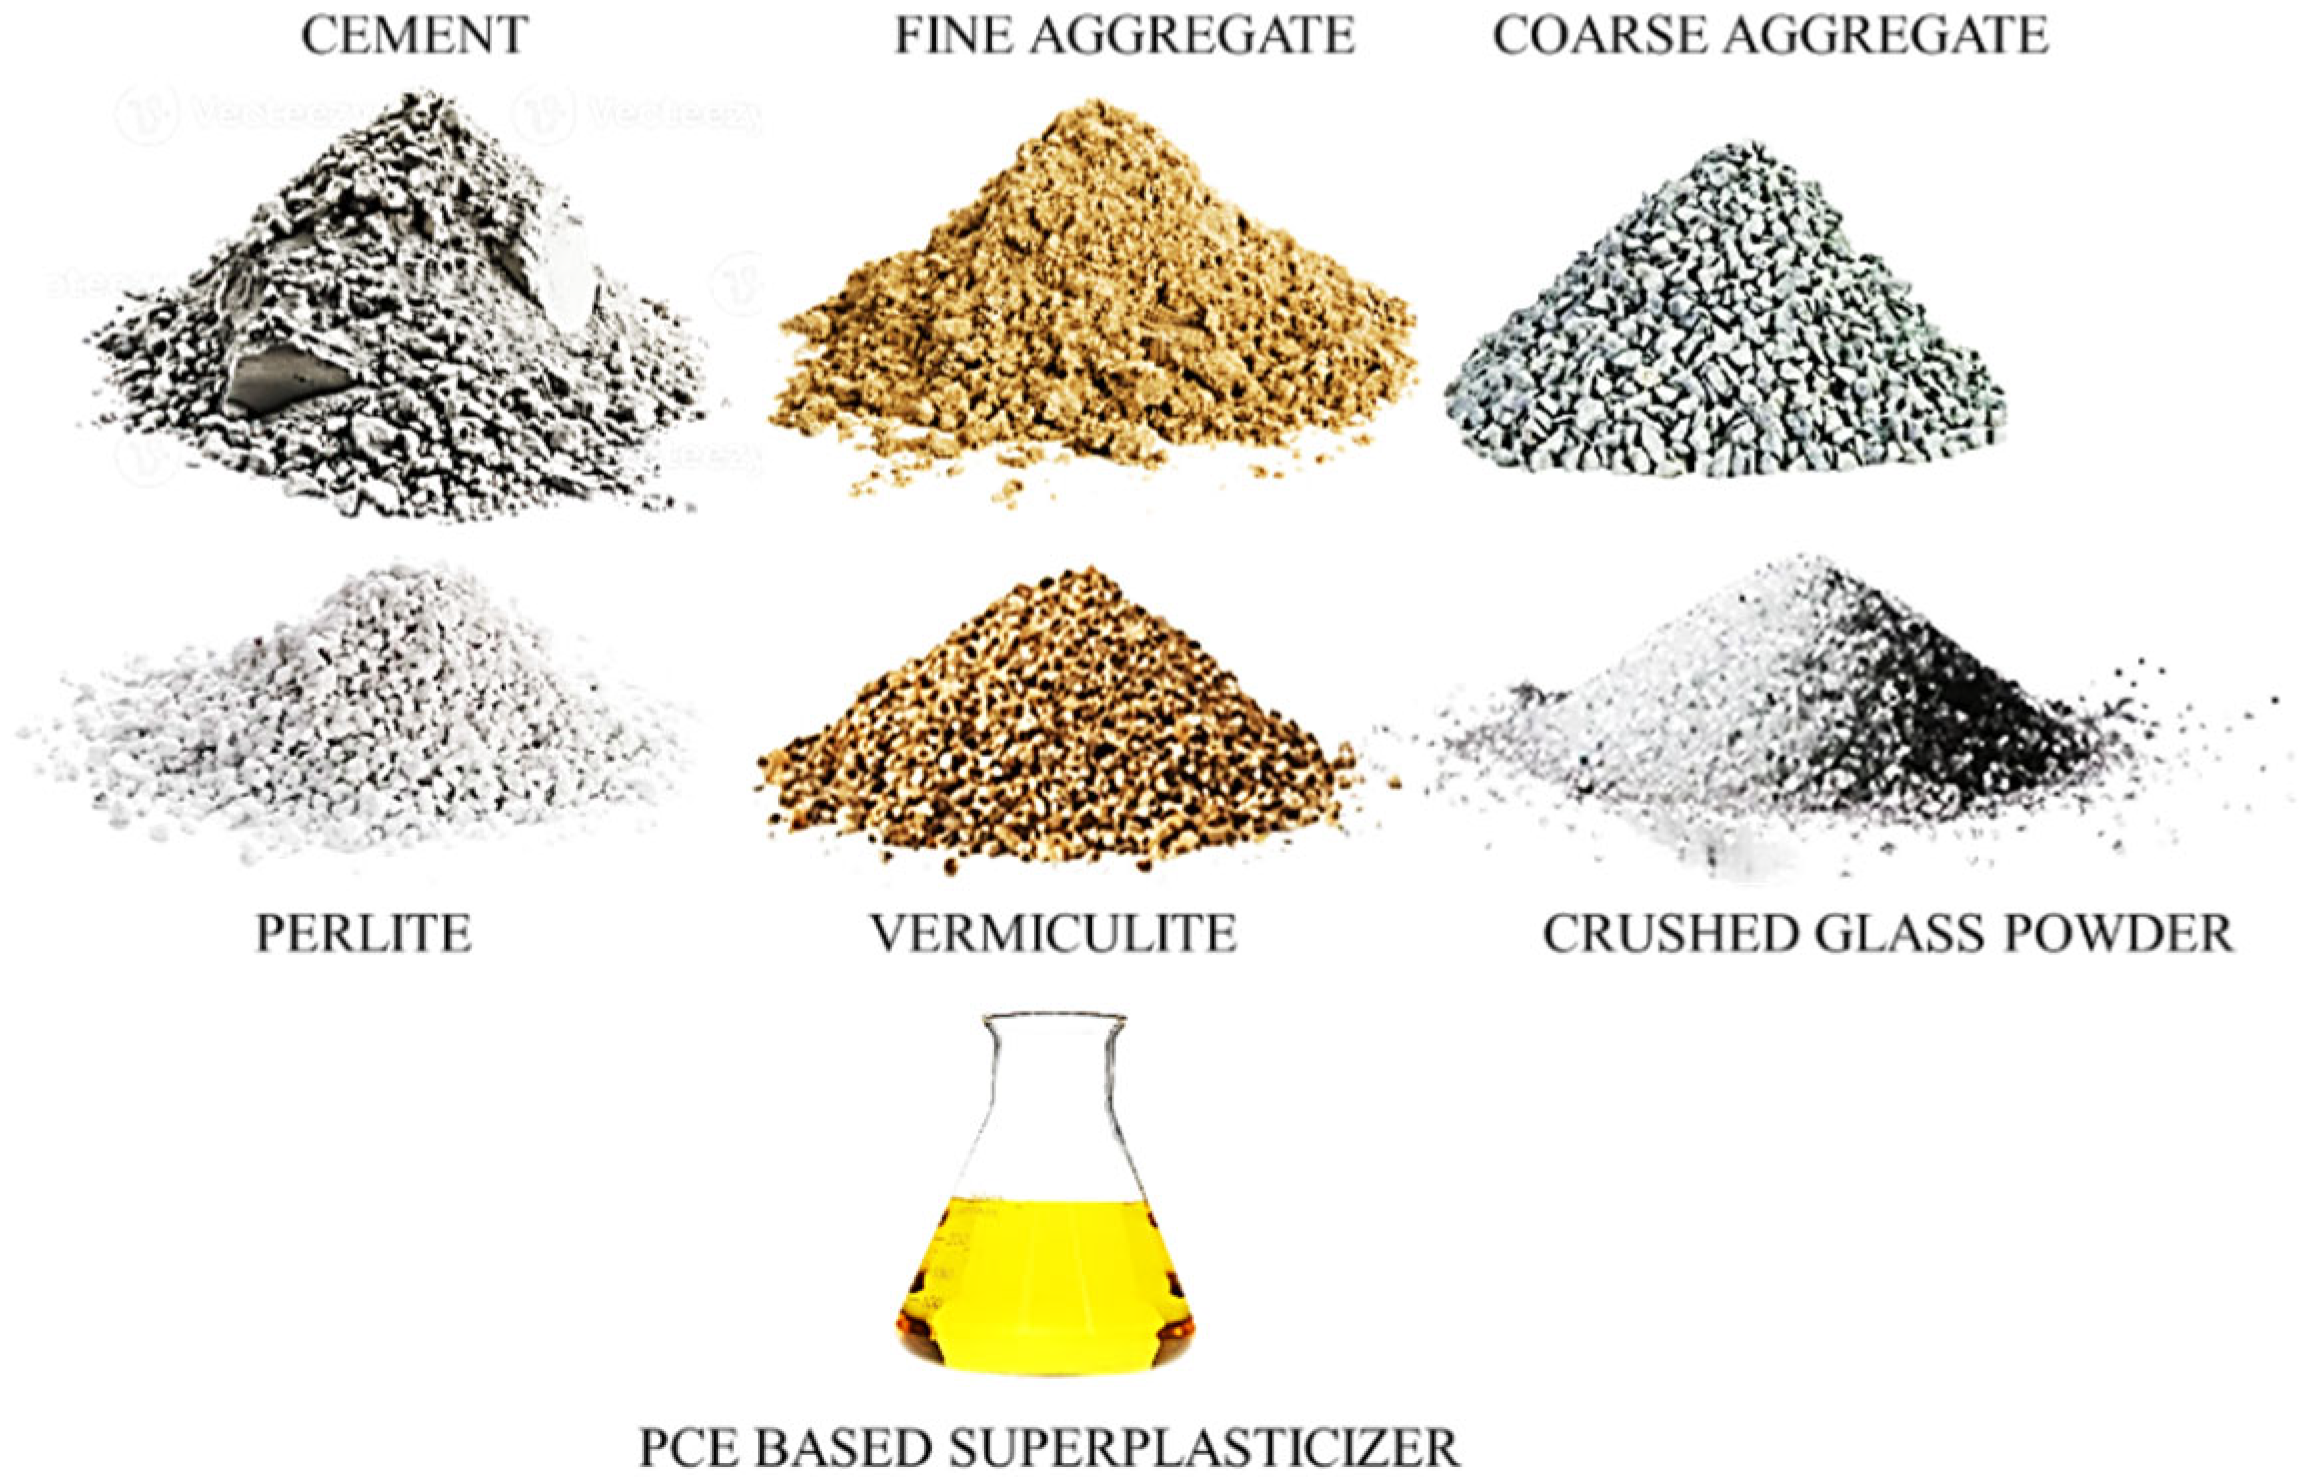
For the present study, materials were carefully selected based on availability, standard conformity, and their suitability for producing thermally efficient concrete paver blocks. Ordinary Portland Cement (OPC 53 grade) conforming to IS 12269:2013 [37] was used as the primary binder due to its high early strength and consistent quality, stored properly to prevent moisture ingress. Natural river sand, complying with IS 383:2016 [38], was used as the fine aggregate, while angular crushed stone of size less than 10 mm served as the coarse aggregate, both tested for specific gravity and water absorption to ensure compliance with standard specifications. To enhance the thermal performance of paver blocks, alternative materials were incorporated as partial replacements for fine aggregates.
Expanded perlite, a lightweight volcanic glass with a foamy, porous structure, was procured and used for its low density and excellent insulating properties. Vermiculite, a hydrated silicate mineral with a layered, flaky structure, was selected for its high porosity, thermal resistance, and capacity to retain strength under elevated temperatures. Crushed waste glass, ground and sieved to fine particle size, was incorporated owing to its reflective properties, high silica content, and environmental benefits through reduced dependence on natural sand. To ensure adequate workability at reduced water-to-cement ratios, a polycarboxylate ether (PCE) based superplasticizer supplied by Yahska Polymers was utilized, in accordance with IS 9103:2018 [39].
All materials were procured from certified local suppliers, and their physical properties, including specific gravity, water absorption, and visual characteristics, were verified in the laboratory through standard test procedures to ensure reliability in mix design and subsequent performance evaluation. The materials used are shown in Figure 2 below. The properties of all materials used in this study are summarized in Table 1 below.

3.2. Mix Design Preparation, Casting and Curing Method

After the procurement of all raw materials, the mixing and casting processes were carried out in accordance with the designed mix proportions to ensure consistency and reproducibility across all samples. Thirteen different mixes were prepared in total, one control mix containing 100% natural fine aggregate and twelve modified mixes incorporating Perlite powder, Vermiculite powder, and Crushed Glass as partial replacements at specified volumetric levels. To maintain uniformity and comparability, all mixes were designed for M30 grade concrete using IS 10262:2019 [40] and IS 456:2021 [41] guidelines, with a constant water–cement ratio and identical binder content across batches. Since the replacement materials had very low bulk densities compared to natural sand, volumetric replacement was first calculated and then converted into corresponding weight values using their measured bulk densities. This approach ensured accurate batching and proper proportioning during mix preparation. The replacement levels were Perlite powder: 20%, 40%, 60%, and 80% by volume; Vermiculite powder: 12.5%, 25%, 37.5%, and 50% by volume; Crushed glass: 7.5%, 15%, 22.5%, and 30% by volume. The same is summarized in Table 2 below.
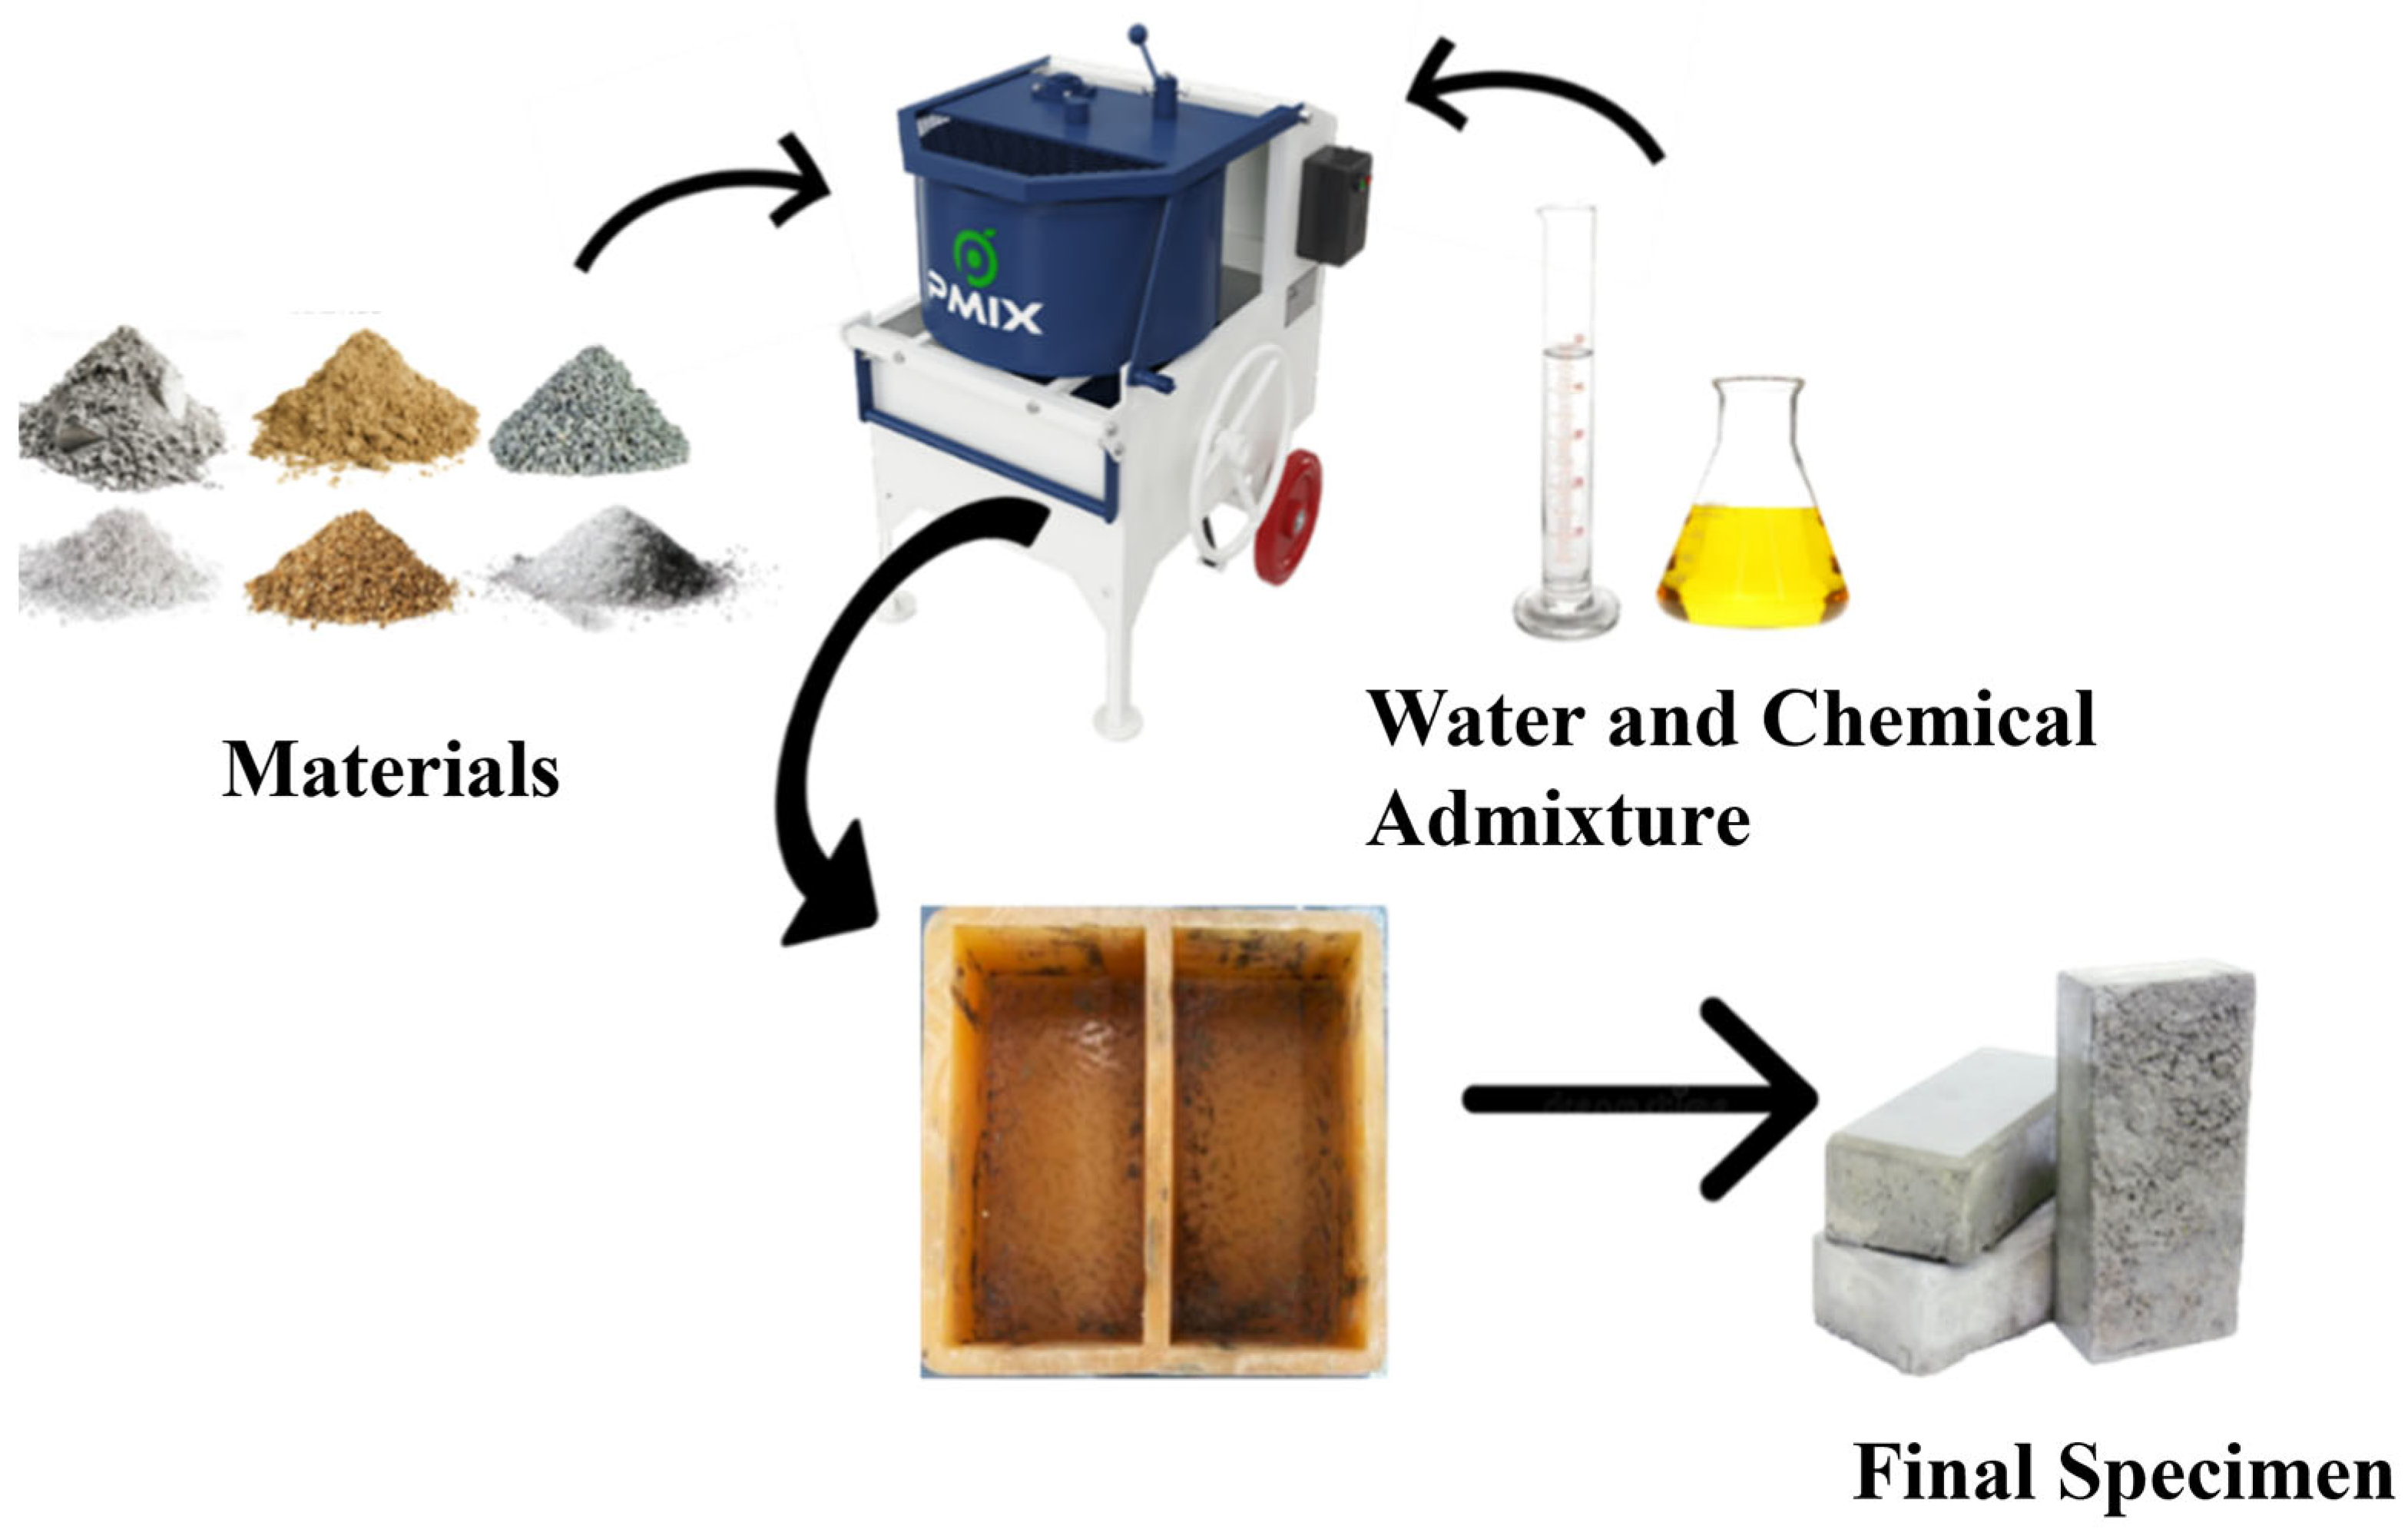
The mixing process was executed in a systematic sequence to achieve homogeneity and prevent segregation, particularly important for lightweight materials such as perlite and vermiculite. Batching was performed by weight using calibrated digital weighing balances to ensure precision. The dry constituents, cement, natural sand, coarse aggregate, and replacement material, were first blended in a pan mixer to achieve a uniform distribution of particles. This step was critical to avoid clustering of vermiculite flakes or perlite granules, which could otherwise lead to localized weaknesses in the hardened matrix. Once dry homogeneity was attained, water mixed with the predetermined dosage of PCE-based superplasticizer was added gradually while continuing the mixing process. The addition of water was carefully controlled to prevent overdosing and to ensure proper dispersion of admixture, which facilitated workability at a low water–cement ratio. Wet mixing was continued until a cohesive, workable, and uniform concrete mass was obtained.
Casting was performed using rectangular moulds of 200 mm × 100 mm × 60 mm dimensions, selected as per IS 15658:2021 [42] for medium-duty paver blocks suitable for pedestrian and low-traffic applications. The moulds were cleaned thoroughly before casting, and their inner surfaces were lightly coated with mineral oil to facilitate demoulding. Fresh concrete was placed into the moulds in two successive layers. Each layer was compacted manually using tamping rods to eliminate entrapped air and achieve dense packing. Excessive vibration was avoided since it could cause segregation of lightweight aggregates, particularly perlite and vermiculite. The final surface was struck off and leveled to ensure uniform thickness and geometry across specimens. The filled moulds were then left undisturbed in laboratory ambient conditions for an initial setting period of 24 h. Demoulding was carried out carefully after 24 h to avoid edge chipping or cracking of paver blocks. The mixing process is summarized in the figure below. The demoulded paver blocks were immediately transferred into a curing tank filled with clean, fresh water. Curing was performed at room temperature under controlled laboratory conditions in line with IS 516:2022 [43] recommendations. The curing process was maintained for designated durations of 7, 14, and 28 days, depending on the planned test schedule for compressive strength, density, water absorption, and thermal performance. The water in curing tanks was regularly monitored and replenished to maintain proper immersion and to prevent contamination. This systematic approach to mixing, casting, and curing ensured that all specimens were produced under identical conditions, thereby enabling a reliable comparison of the effects of Perlite, Vermiculite, and Crushed Glass on the mechanical and thermal performance of the concrete paver blocks. The casting procedure is explained in Figure 3 below.

3.3. Testing Method

A comprehensive experimental program was conducted to evaluate the fresh, hardened, and thermal properties of the developed concrete paver blocks. All tests were performed in strict accordance with the relevant codal provisions to ensure accuracy, reliability, and reproducibility of results.

3.3.1. Fresh Concrete Tests

The workability and consistency of the concrete mixes were assessed using the slump test in accordance with IS 1199:2013 [44]. The slump cone test was performed by first greasing the inner surface of the cone and placing it on a rigid, non-absorbent base plate. The slump cone (300 mm height, 200 mm bottom diameter, and 100 mm top diameter) was then filled with fresh concrete in three equal layers. Each layer was tamped 25 times using a standard tamping rod to ensure uniform compaction. After the cone was completely filled and levelled off, it was carefully lifted vertically in a steady motion without any lateral disturbance. The concrete was allowed to subside freely, and the vertical difference between the height of the mould and the highest point of the slumped concrete was measured. This slump value provided an initial indication of the mix’s flow characteristics, ensuring suitability for proper placement and compaction of the concrete.

3.3.2. Hardened Concrete Tests

The hardened properties of the concrete blocks were evaluated through density and compressive strength testing in accordance with IS 516:2022 [43]. To determine the hardened density, each specimen was first brought to a surface-dry condition to eliminate the influence of free surface moisture. The mass of the specimen was then measured using a calibrated digital balance, after which the physical dimensions of the block were recorded to calculate its volume. Density was computed as the ratio of mass to volume, providing a reliable indication of the compactness of the material and the effect of incorporating lightweight alternative fine aggregates on the unit weight of the concrete.
Compressive strength testing was carried out on 9 of the cast blocks at 7, 14, and 28 days to evaluate the strength development over time. Before testing, each block was removed from curing and wiped to a surface-dry state. The specimen was then positioned centrally between the platens of a calibrated compression testing machine to ensure uniform load application and prevent eccentric loading. The load was applied gradually and continuously as per the guidelines of IS 516:2022 [43] until the specimen failed. The maximum load sustained by each block was recorded, and the compressive strength was calculated based on the loaded area. This procedure ensured accurate and consistent assessment of the mechanical performance of the concrete incorporating vermiculite, perlite, and crushed glass.

3.3.3. Thermal Analysis

To evaluate the surface heating behaviour of the concrete blocks, a controlled thermal imaging assessment was carried out after the 28-day curing period. Three blocks—one representing each material category—were designated exclusively for thermal analysis to avoid any prior mechanical loading that could influence heat-transfer characteristics. Testing was conducted after 28 days to ensure that the blocks had achieved stable hydration, moisture equilibrium, pore refinement, and density development, all of which strongly influence thermal conductivity and surface temperature response. Each block was placed on a flat, dry outdoor surface under uniform sunlight exposure for 24–48 h so that the specimens could attain near-steady thermal conditions. Thermal measurements were taken between 12:00 PM and 2:00 PM (IST), the period corresponding to peak and relatively stable solar irradiance, to minimize fluctuations in incident heat. Before imaging, all surfaces were gently cleaned and thoroughly dried to eliminate dust, moisture, or reflective particles that could interfere with infrared absorbance and emissivity readings.
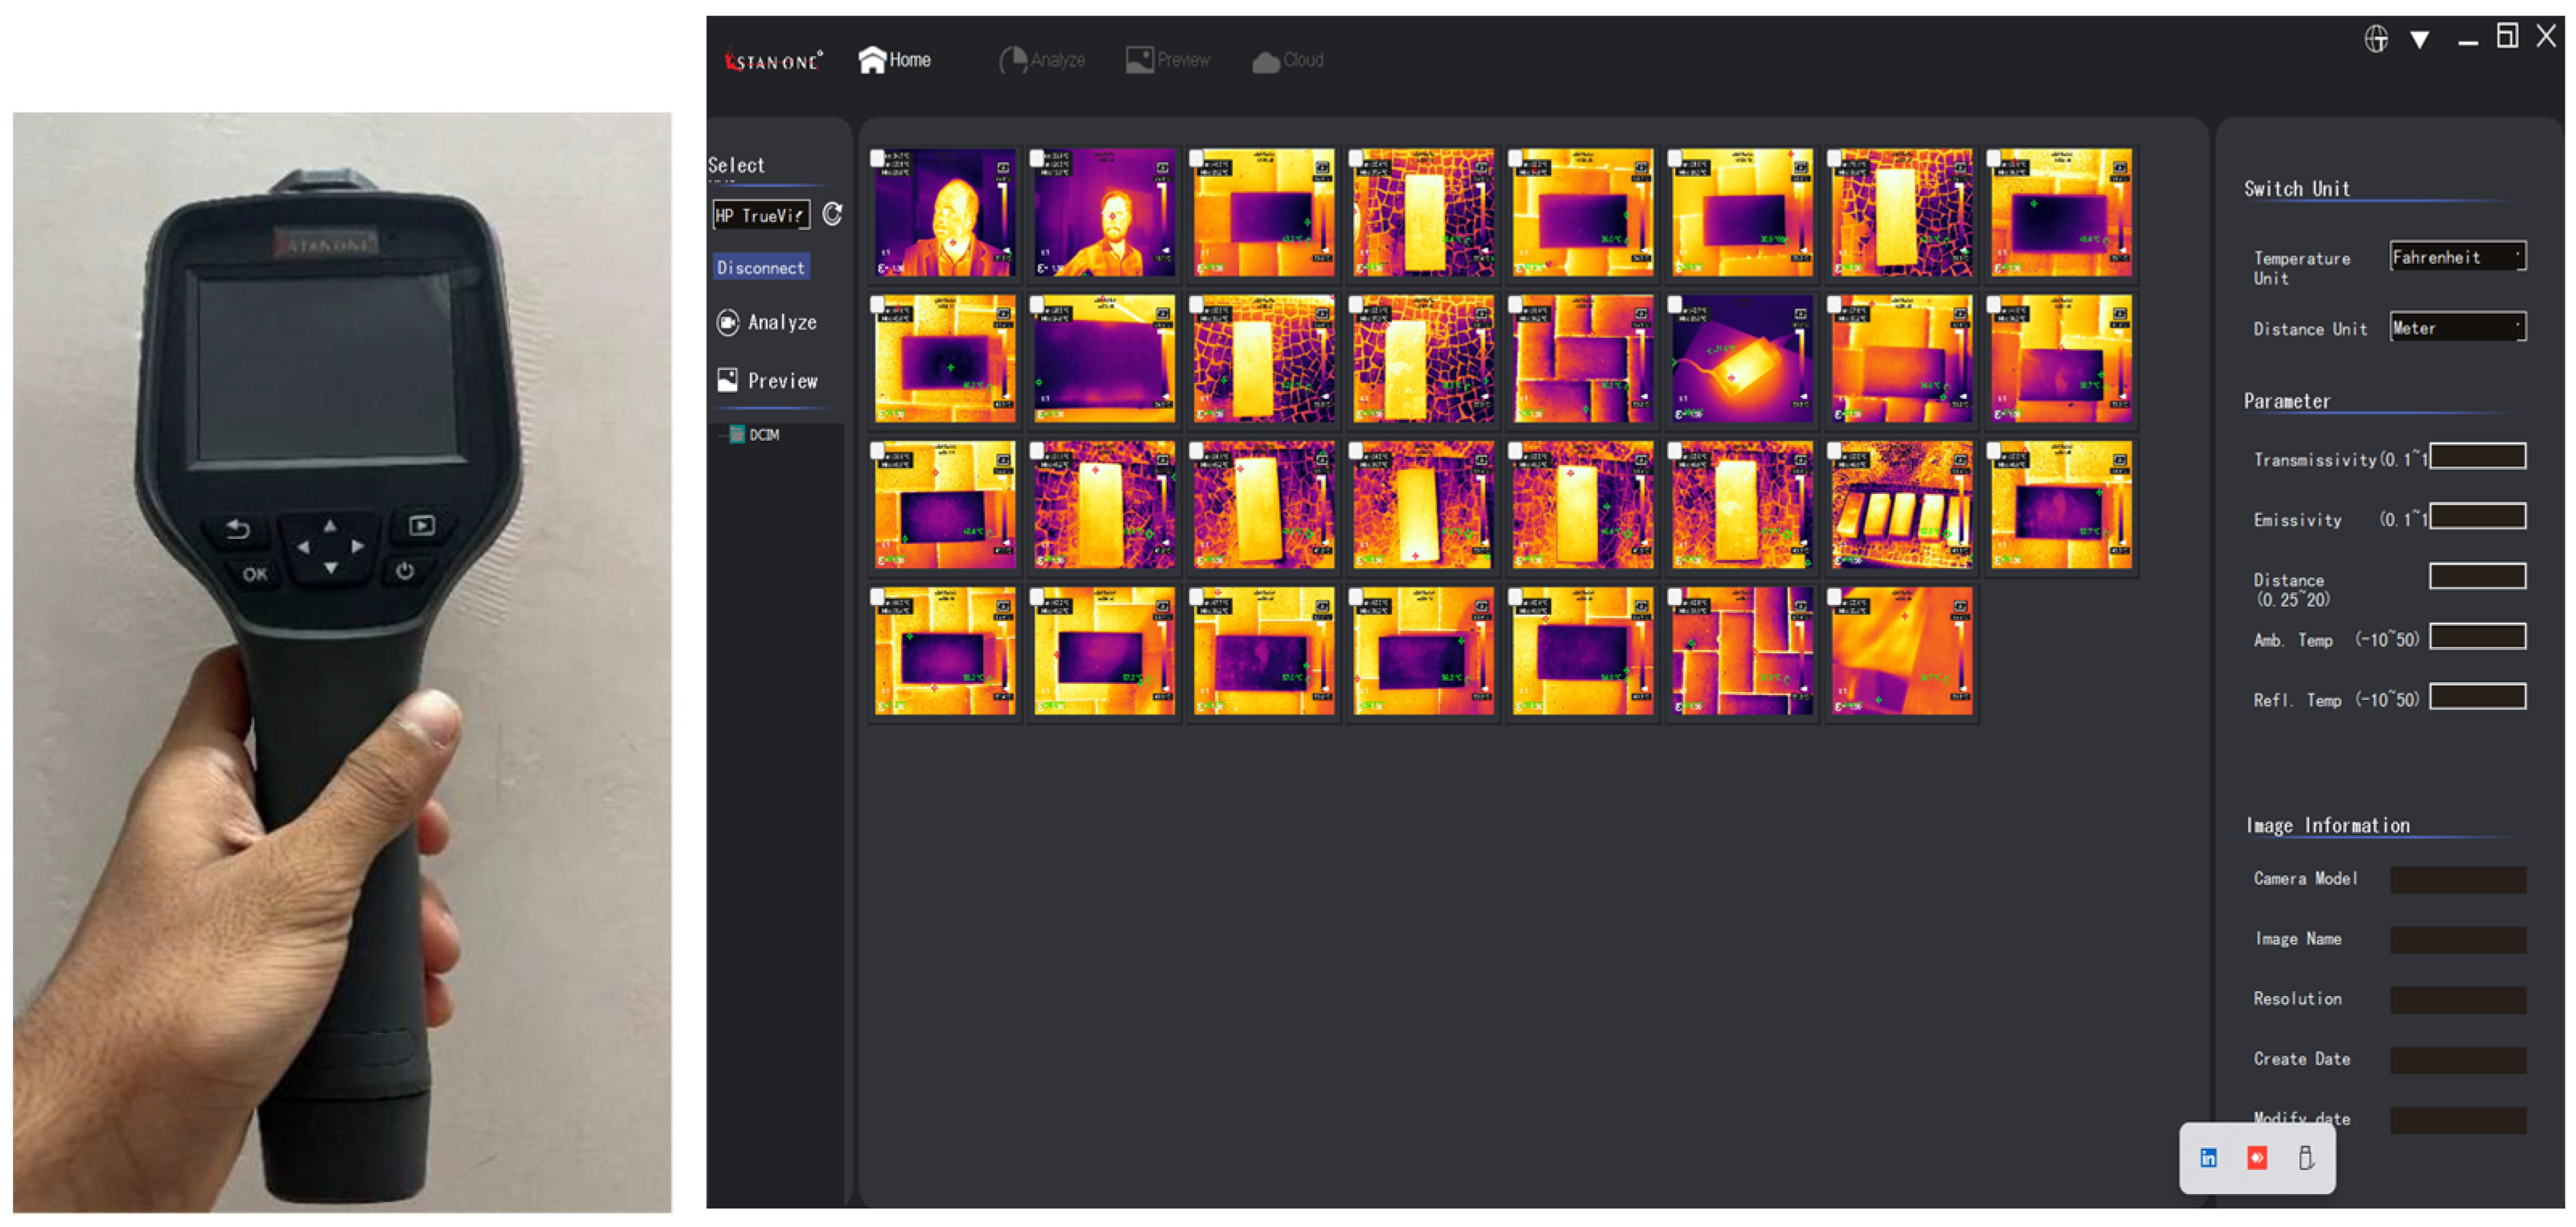
Thermal images were captured using a Stanone S300N-M handheld infrared thermal camera (Stanlay, Ahmedabad, India), equipped with an uncooled VOx detector operating within the 8–14 μm spectral band and a native detector resolution of 256 × 192 pixels. The device features a 12 μm pixel pitch, thermal sensitivity (NETD) of <40 mK, an instantaneous field of view (IFOV) of 1.71 mrad, and an overall field of view of 24.8° × 18.7°. The camera operates at a 25 Hz frame rate and incorporates a 7 mm focal length lens with manual focusing, allowing precise control over image sharpness. For this study, the emissivity was standardized at 0.95 for concrete. Temperature measurements were obtained using the built-in central spot mode, with additional verification through automated hot- and cold-spot tracking. Measurement ranges of −20 °C to 150 °C (Range 1) and 100 °C to 550 °C (Range 2) were available, with an accuracy of ±2 °C or ±2% and a resolution of 0.1 °C. To ensure consistent imaging conditions, the camera was mounted at a fixed height of 1.0 m above each block, maintaining identical field geometry and eliminating parallax variations. The images recorded were subsequently processed using the Stanone Thermographic Analysis Software (Version 2.1), which enabled extraction of maximum surface temperatures, temperature gradients, distribution profiles, and hotspot concentrations using point, line, and area-based thermal mapping tools.
The results of these thermal imaging tests are analyzed in the subsequent sections to compare the thermal behaviour of the control and modified mixes, thereby elucidating the influence of alternative fine aggregates on heat absorption, retention, and dissipation in concrete paver blocks.

4. Results & Discussion

This section deals with the results of fresh concrete, hardened concrete and thermal analysis using thermal imaging camera.

4.1. Fresh Concrete Properties

Slump Test

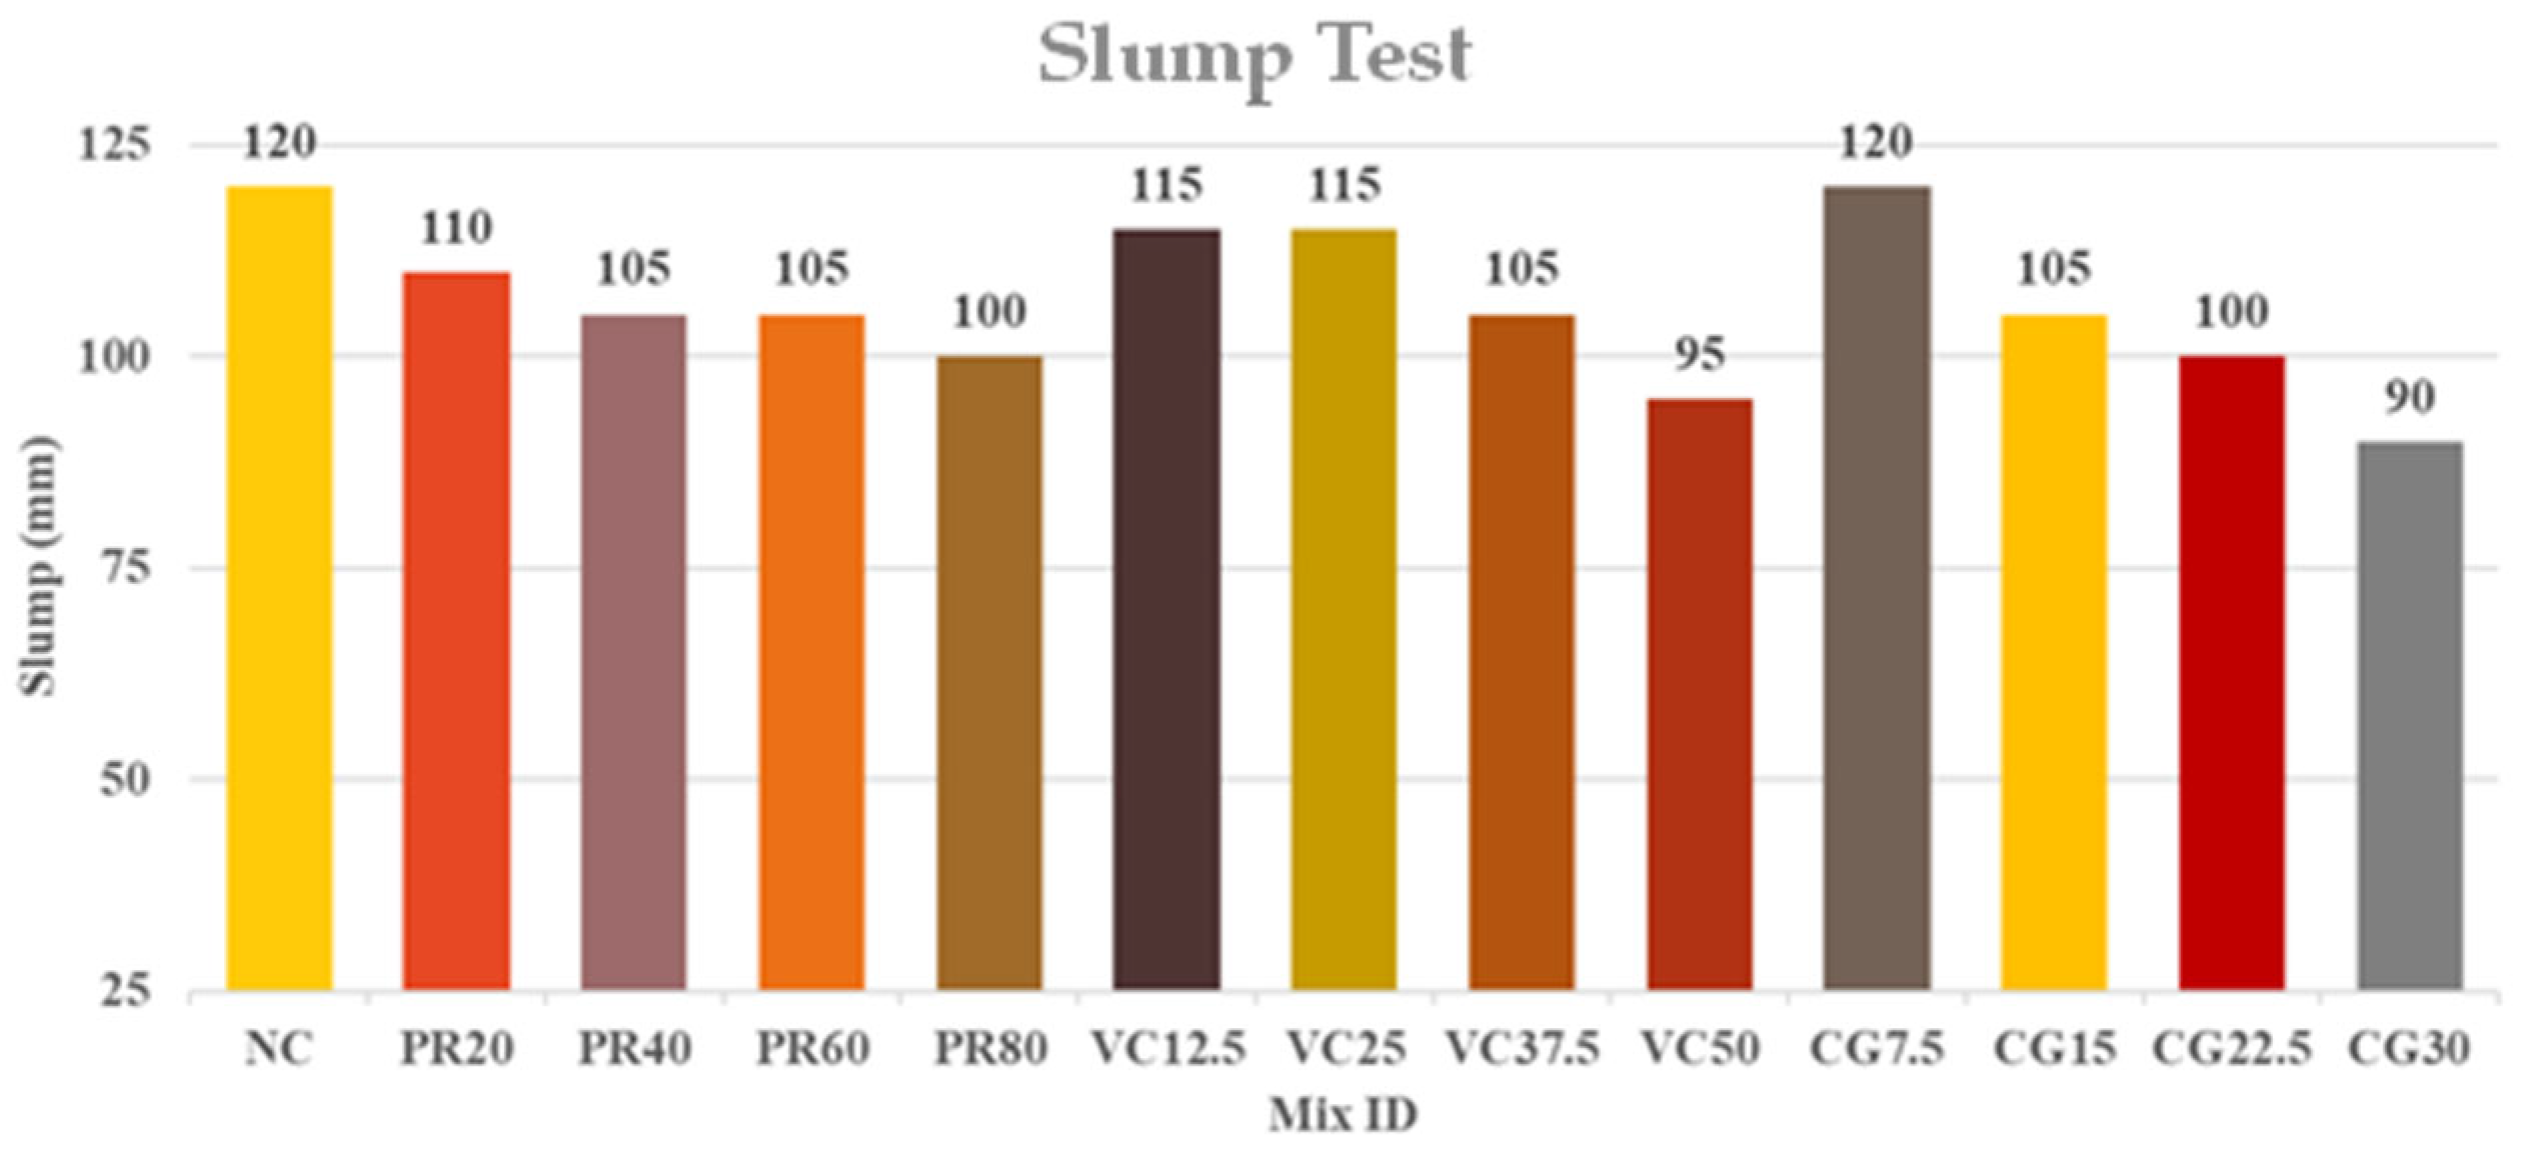
The results of the slump cone test, which measures the workability of fresh concrete, indicate distinct trends influenced by the type and dosage of the replacement materials. The Normal Concrete (NC) mix established a baseline slump of 110 mm. The concrete mixes incorporating crushed glass powder (CG) exhibited a notable sensitivity to replacement levels. The CG7.5 mix showed enhanced workability with a slump of 120 mm, likely due to the glassy, smooth surface of the powder particles reducing internal friction and acting as a lubricant. However, as the CG content increased to 15%, 22.5%, and 30%, the slump values decreased to 105 mm, 100 mm, and 90 mm, respectively. This decline suggests that at higher volumes, the finer CG particles increase the specific surface area of the solids, demanding more water for coating and thereby reducing the mixture’s fluidity. The comparative graph for the slump cone test result is shown in Figure 4 below.
Conversely, the mixes with vermiculite and perlite displayed a more consistent workability profile. Most mixes, including VC12.5, VC25, PR20, PR40, and PR60, maintained slump values very close to the NC baseline, ranging from 105 mm to 115 mm. This indicates that the water demand and overall workability were not significantly compromised at low to medium replacement levels. However, a slight reduction in slump was observed at the highest replacement dosages for these materials, with VC50 and PR80 recording values of 95 mm and 100 mm, respectively. This can be attributed to the high absorption potential and irregular shape of the expanded aggregates, which can absorb a portion of the mix water and hinder the free flow of the paste. In summary, while CG significantly alters workability in a dosage-dependent manner, both vermiculite and perlite can be incorporated up to 25–40% without substantially affecting the fresh properties of the concrete, which is a practical advantage for placement and compaction.

4.2. Hardened Concrete Properties

The hardened properties of concrete paver blocks were evaluated to determine their mechanical strength and density under service conditions.

4.2.1. Hardened Density Test

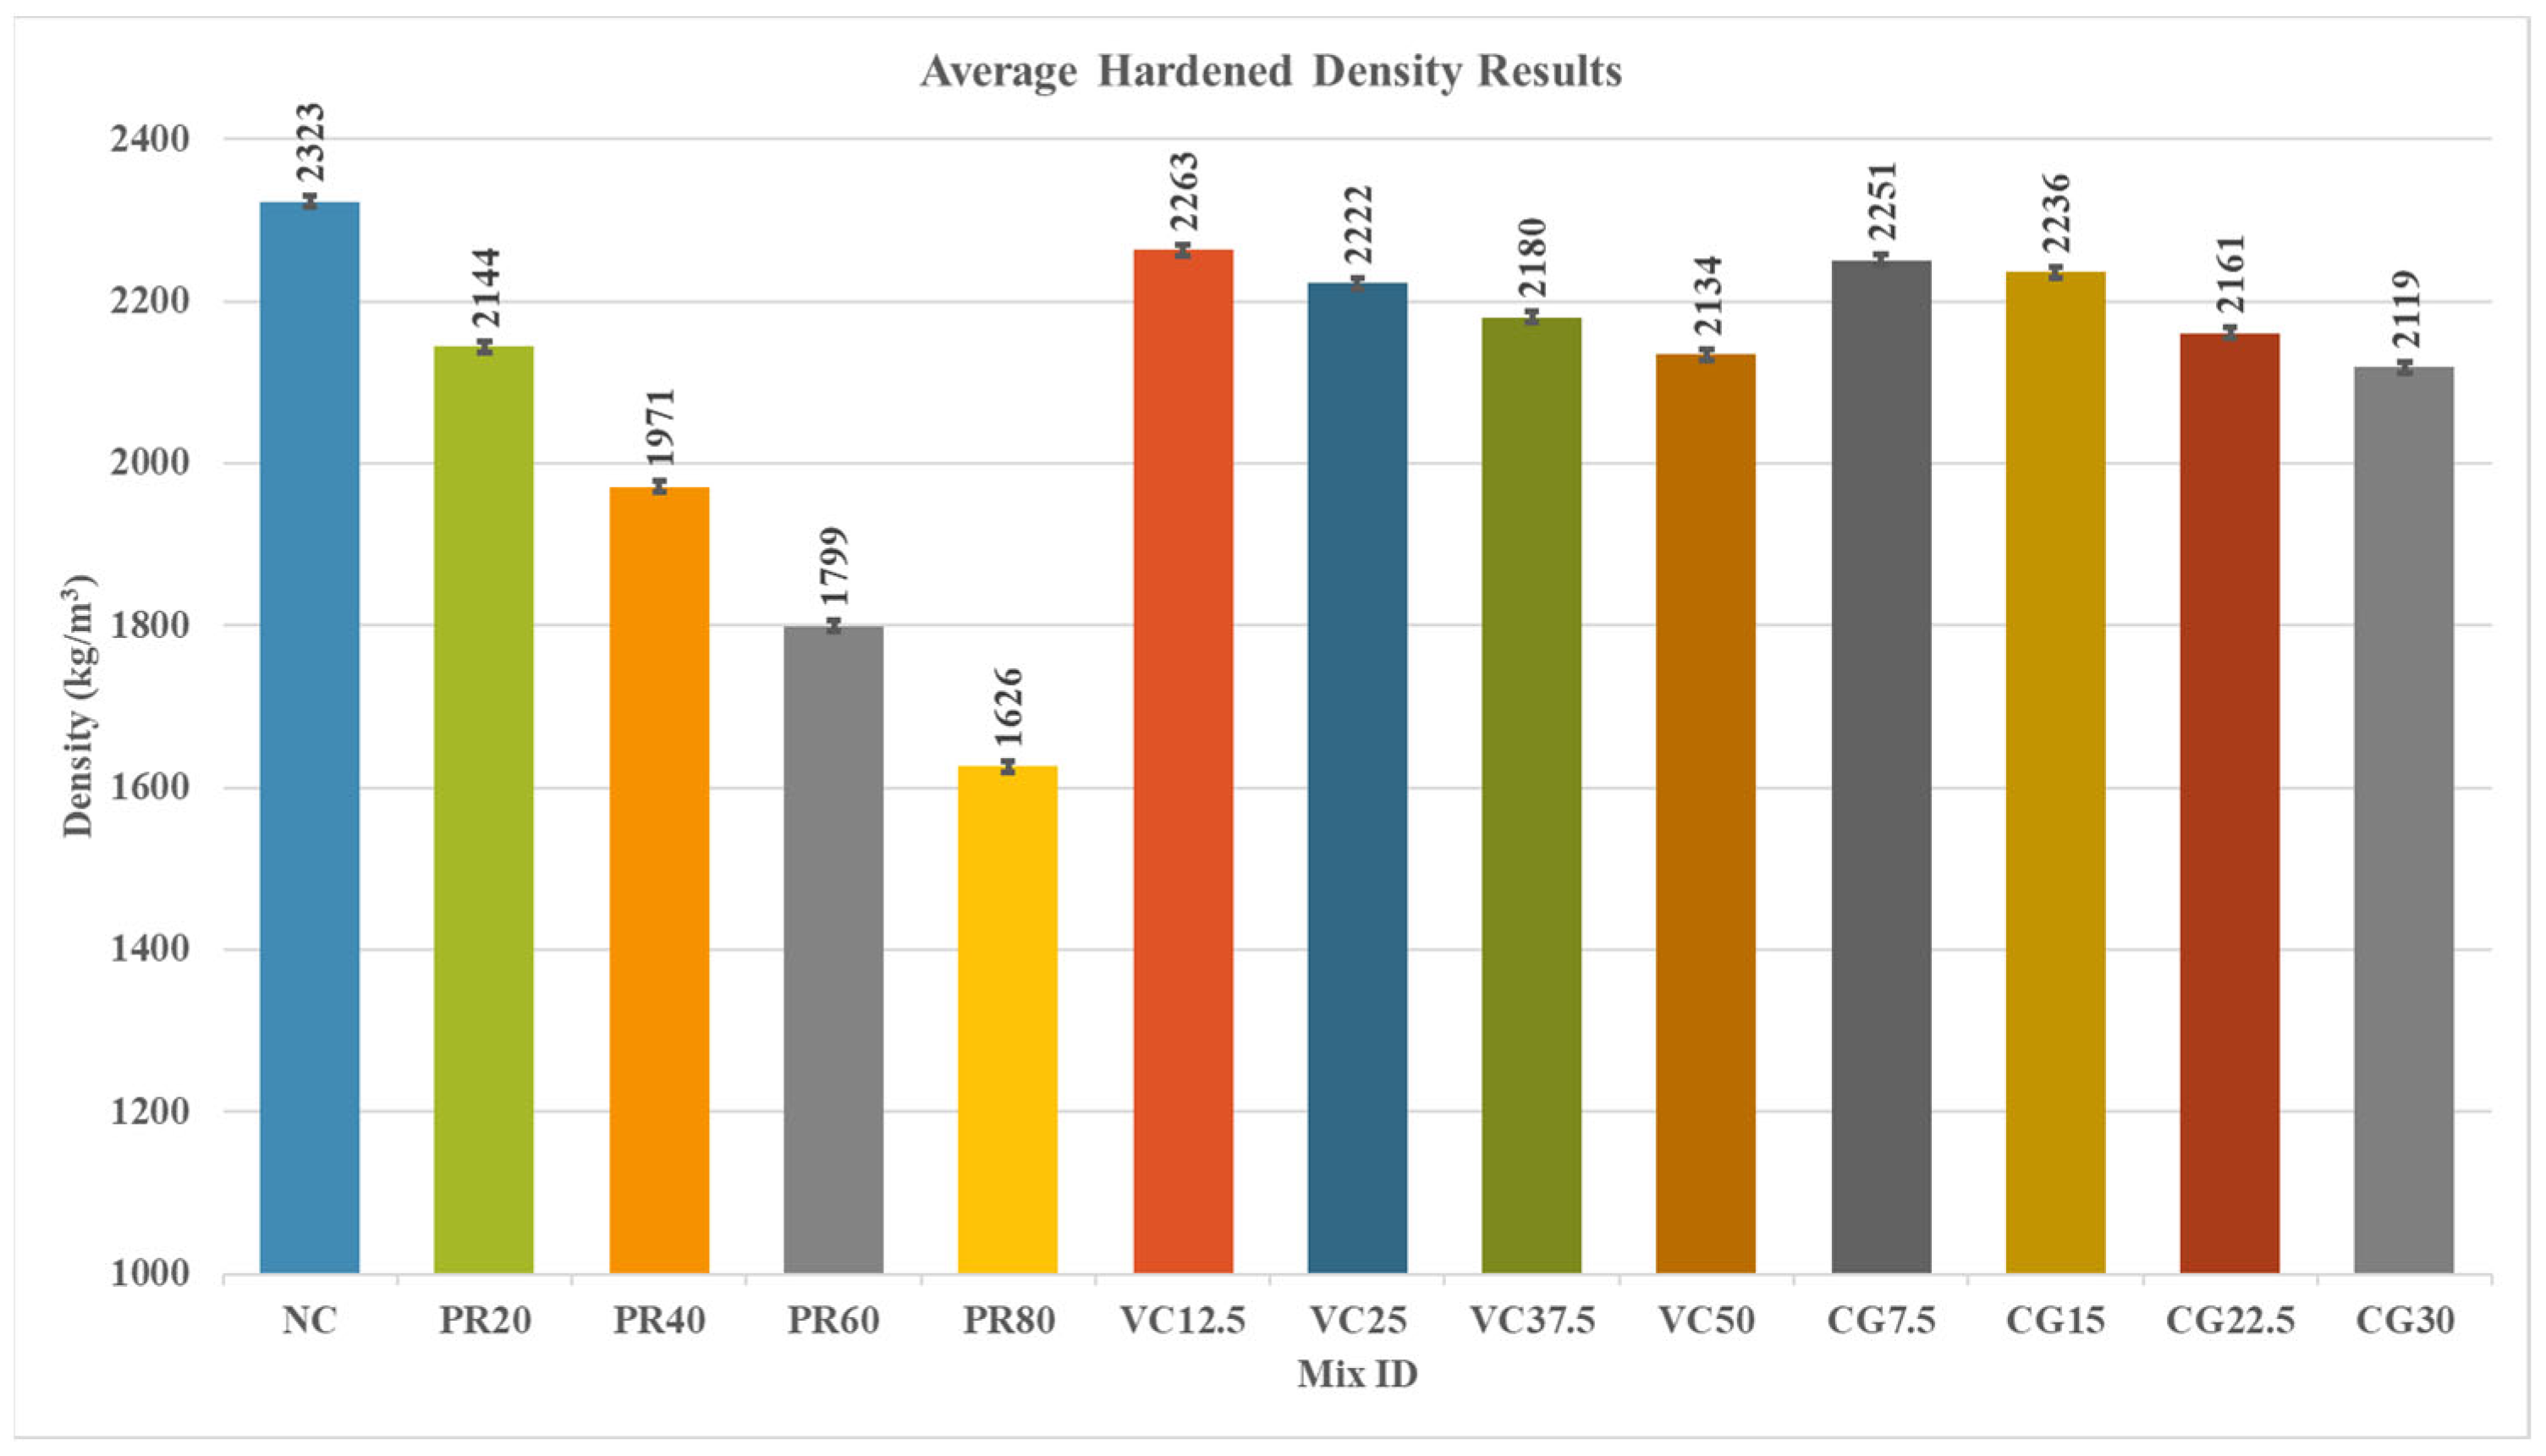
The comparative graph of hardened density results is shown in Figure 5 below.
The hardened density results provide a clear and quantitative demonstration of the unit weight variation, which is directly governed by the specific gravity of the constituent materials. The control normal concrete (NC) mix established a baseline density of 2323 kg/m3. The introduction of perlite (Specific Gravity: 0.302) resulted in the most significant and systematic reduction in density, with values decreasing progressively from 2144 kg/m3 for PR20 to 1626 kg/m3 for PR80. This substantial reduction of nearly 700 kg/m3 is a direct consequence of perlite’s exceptionally low specific gravity, which is an order of magnitude lower than that of natural sand.
In contrast, the vermiculite series demonstrated a more modest reduction, with density decreasing from 2263 kg/m3 for VC12.5 to 2134 kg/m3 for VC50. This limited reduction of about 190 kg/m3 is attributed to vermiculite’s specific gravity (2.45) being very close to that of the natural fine aggregate it replaces, thereby resulting in a less dramatic decrease in overall unit weight. Similarly, the crushed glass powder (CG) mixes, with a specific gravity of 2.32, exhibited a comparable moderate reduction, with density decreasing from 2251 kg/m3 for CG7.5 to 2119 kg/m3 for CG30. Therefore, the data conclusively validates that the reduction in hardened density is inversely proportional to the specific gravity of the replacement material, with perlite being the most effective lightweighting agent.

4.2.2. 7 Days Compressive Strength Test

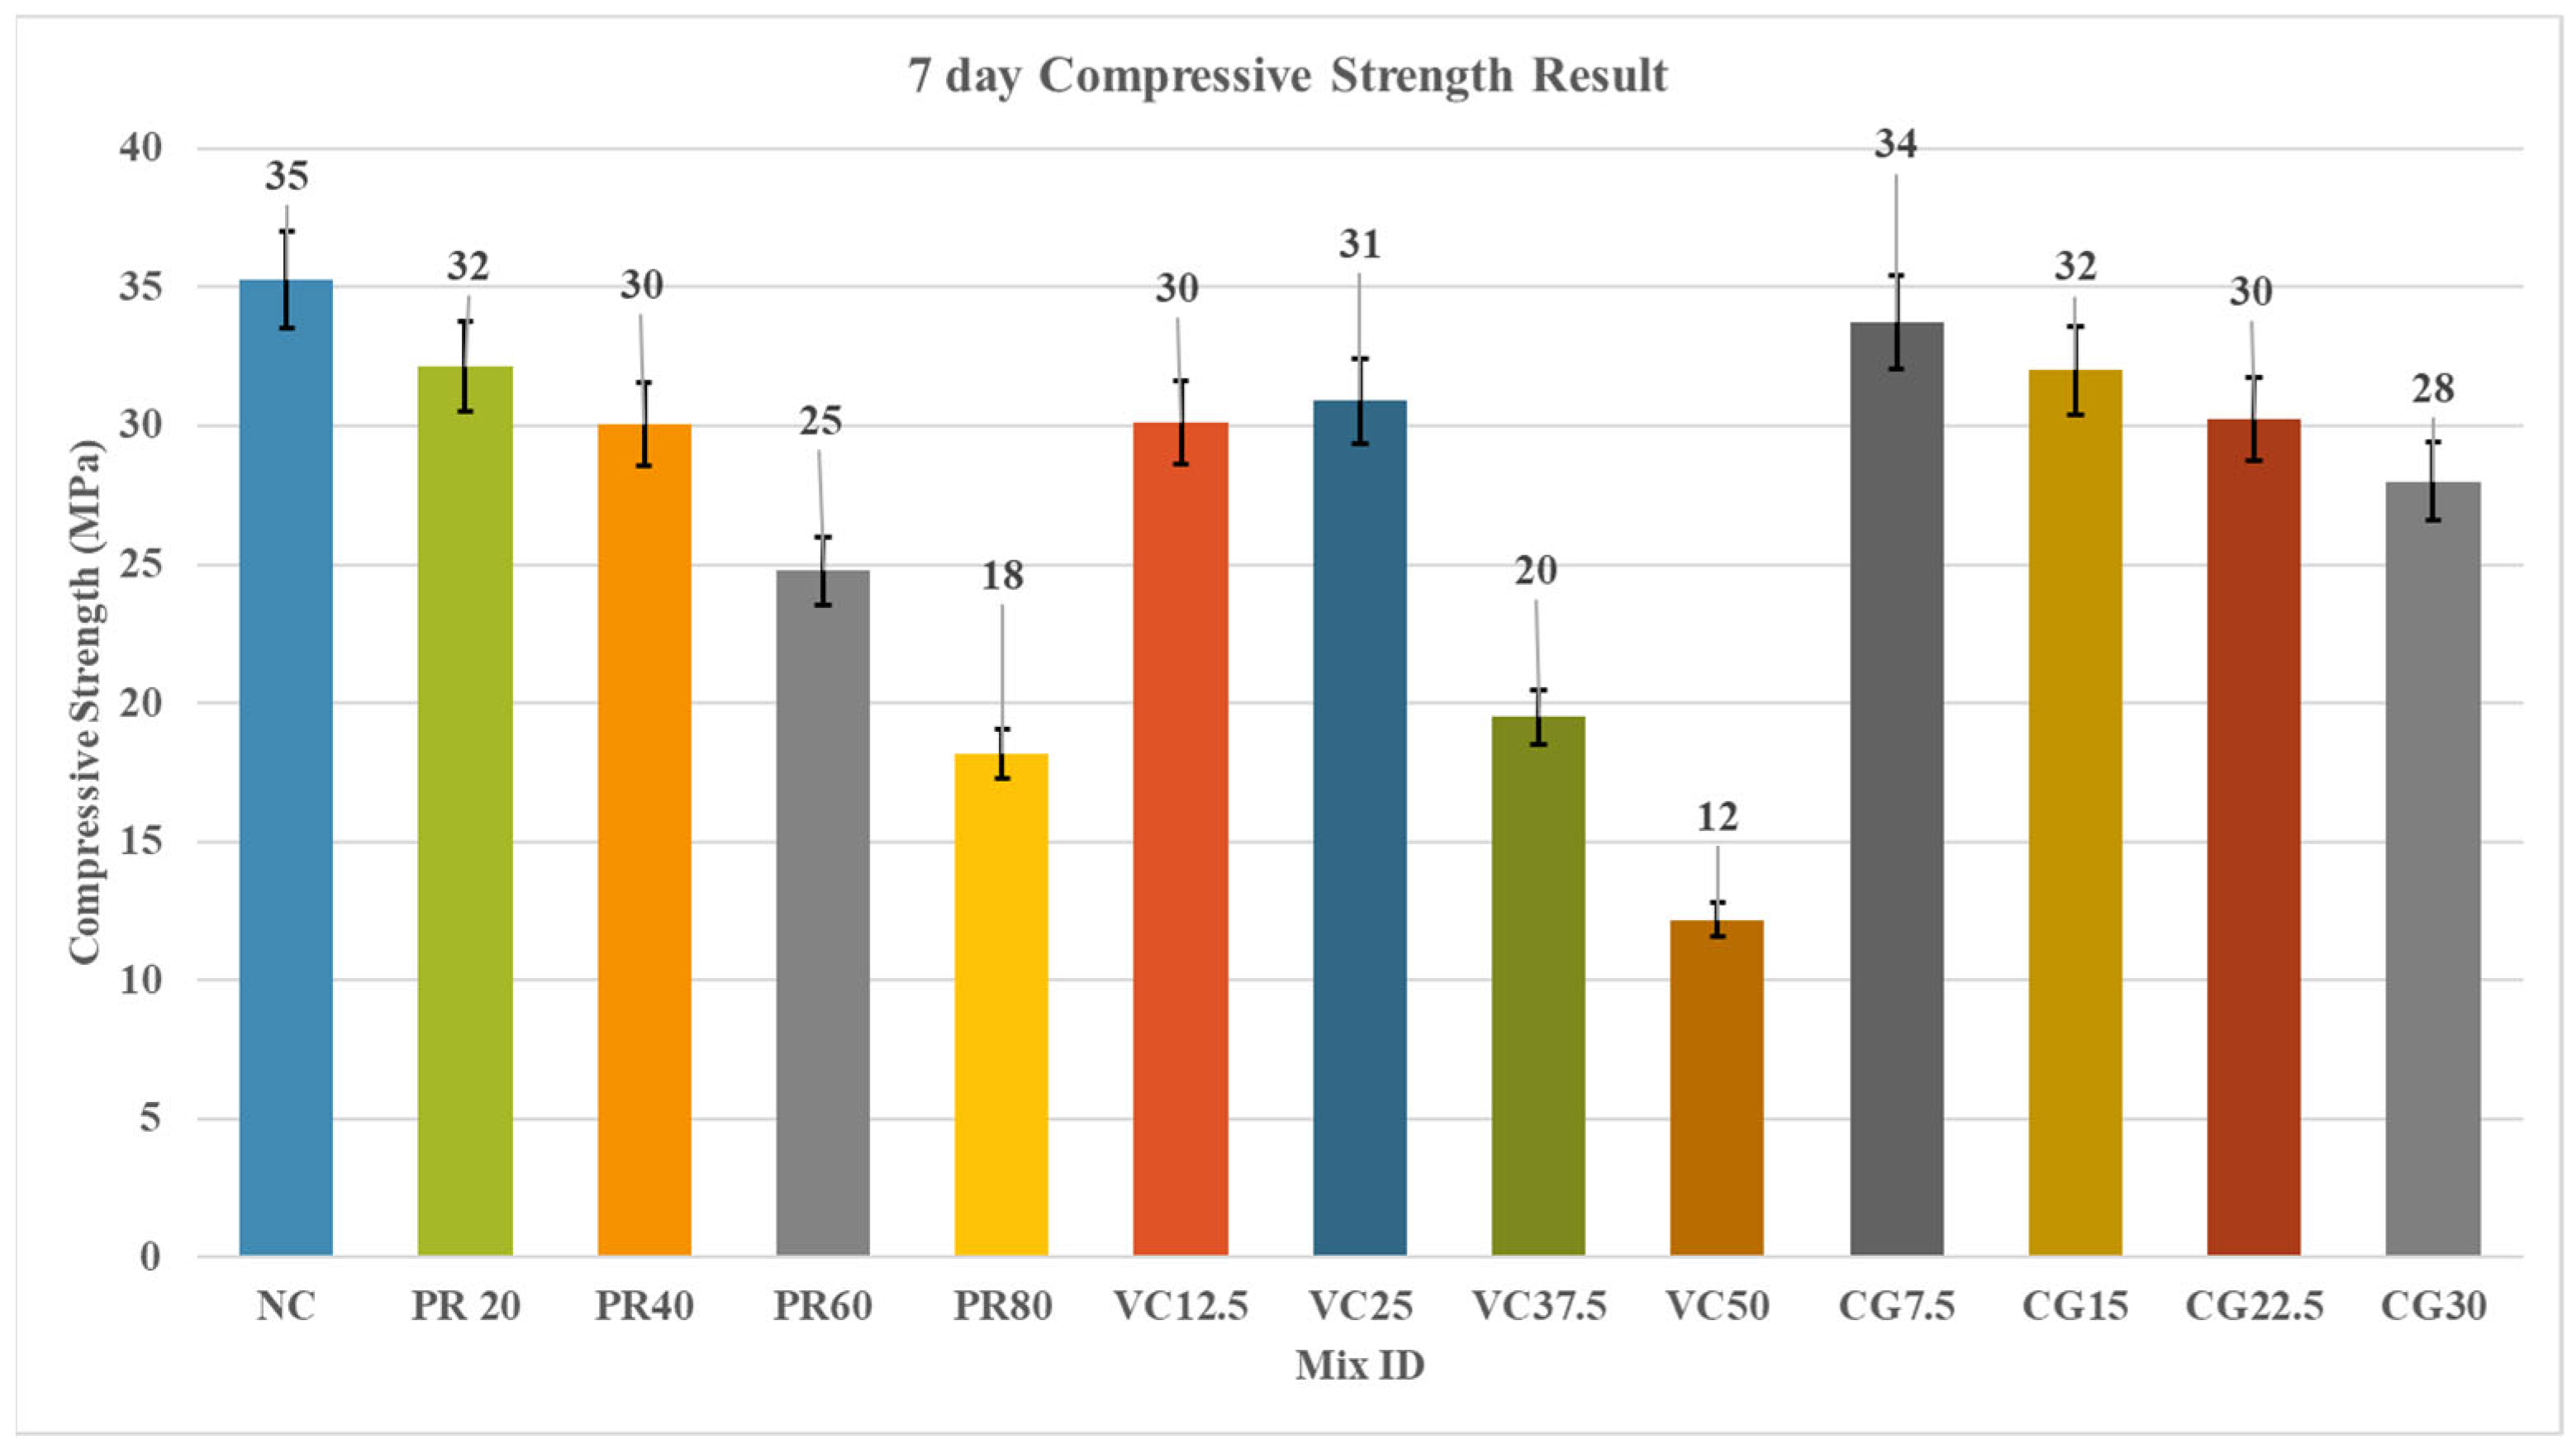
At 7 days, the control mix (NC) exhibited the highest early-age compressive strength of 35 MPa, reflecting typical performance of an M30 grade concrete. For the Perlite (PR) series, early strength decreased progressively with increasing replacement, ranging from 32 MPa for PR20 to 18 MPa for PR80. This reduction can be attributed to the highly porous and lightweight nature of Perlite, which reduces the solid aggregate fraction and slows the early hydration process. In the Vermiculite (VC) series, 7-day strengths similarly declined with higher replacements, with VC12.5 achieving 30 MPa while VC50 reached only 12 MPa.
The flaky and low-density characteristics of Vermiculite result in weaker particle packing and interfacial transition zones (ITZ), limiting early-age strength. In contrast, the Crushed Glass (CG) series demonstrated comparatively higher early strengths, ranging from 34 MPa (CG7.5) to 28 MPa (CG30). The angularity and relatively high density of crushed glass promote better particle interlock, thereby maintaining satisfactory early-age strength even at higher replacements. Overall, low to moderate replacements of lightweight aggregates may be suitable for early-age applications, whereas higher replacement levels significantly compromise structural integrity at 7 days. The comparative graph of the 7-day compressive strength result is shown in Figure 6 below.

4.2.3. 14 Days Compressive Strength Test

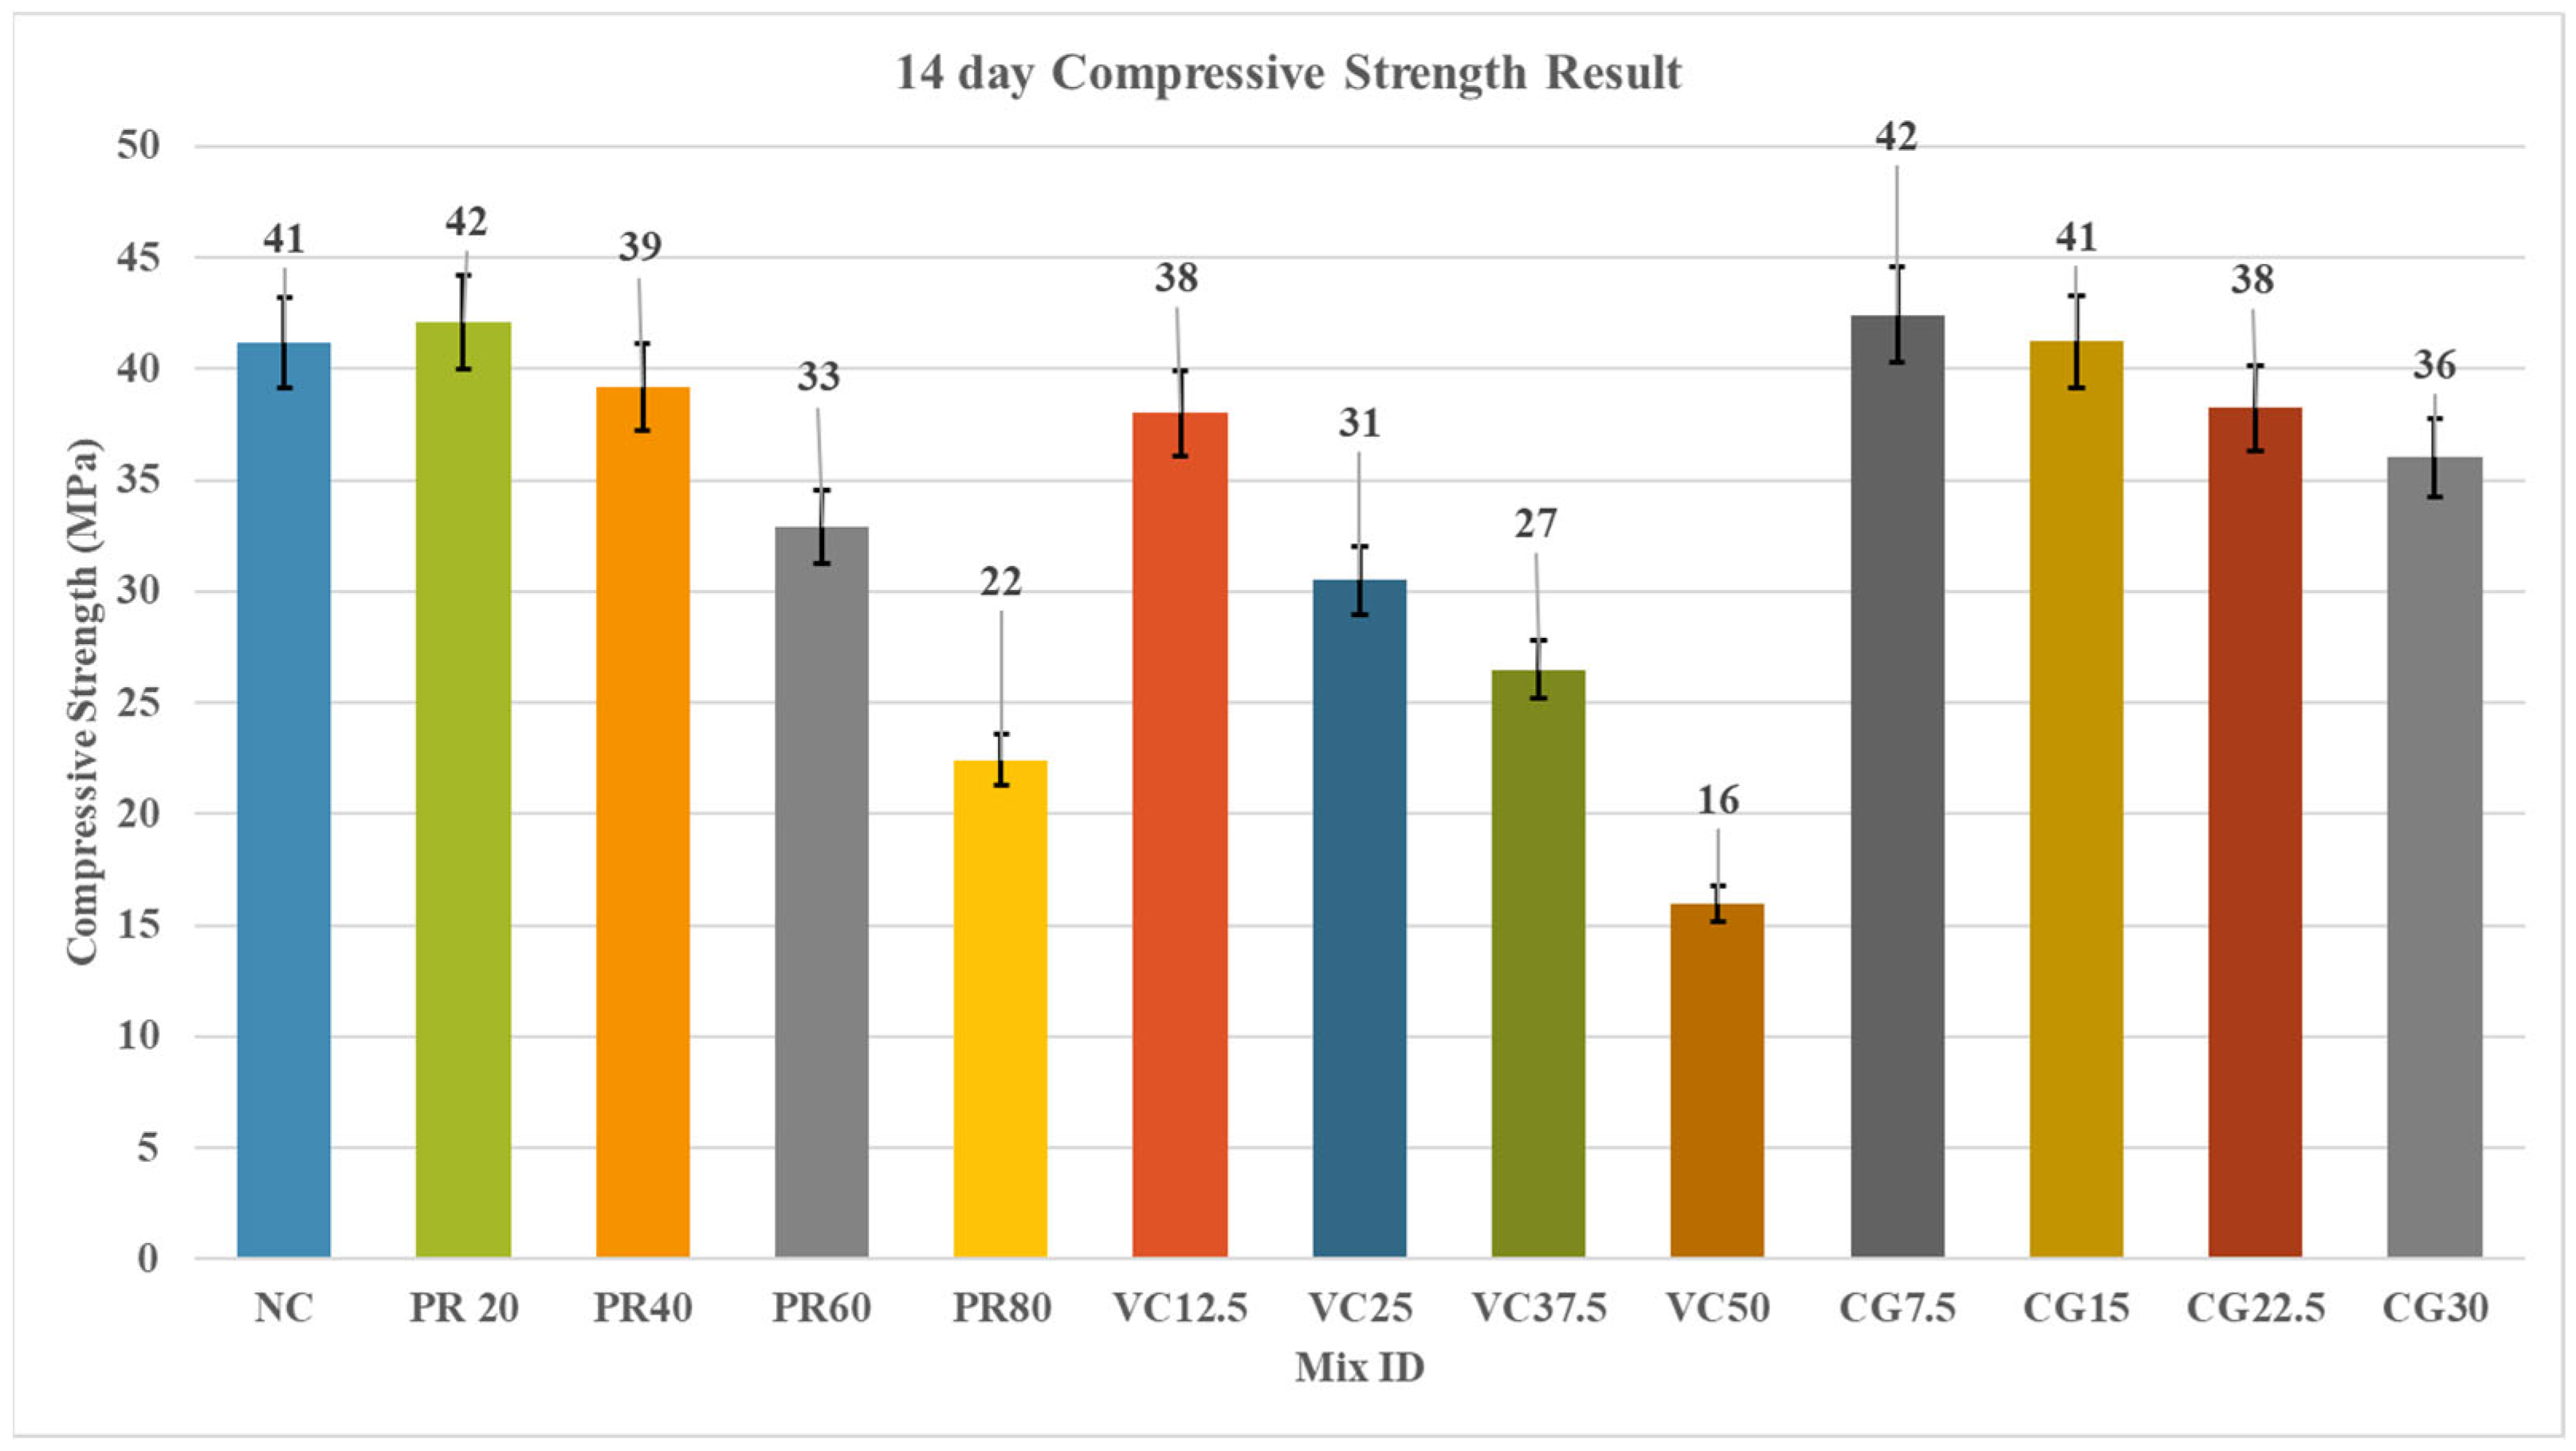
By 14 days, all mixes exhibited strength gain due to continued cement hydration. The NC mix approached its target strength, indicating normal hydration progression. For the Perlite series, PR20 and PR40 achieved strengths of 39 MPa and 42 MPa, whereas PR60 and PR80 showed minimal improvement due to the slow densification of the porous matrix. Vermiculite-containing mixes also demonstrated strength development, with VC12.5 and VC25 reaching acceptable 14-day strengths (31 and 38 MPa), while VC37.5 and VC50 remained below 27 MPa, highlighting the limiting effect of low-density, highly porous aggregates.
The CG series showed a nearly linear increase in strength, with all mixes surpassing 35 MPa, confirming that crushed glass can support intermediate-age structural demands. These trends indicate that low to moderate replacements of Perlite and Vermiculite can be considered for non-critical structural elements, whereas Crushed Glass retains structural suitability even at higher replacement levels. The comparative graph of the 14-day compressive strength result is shown in Figure 7 below.

4.2.4. 28 Days Compressive Strength Test

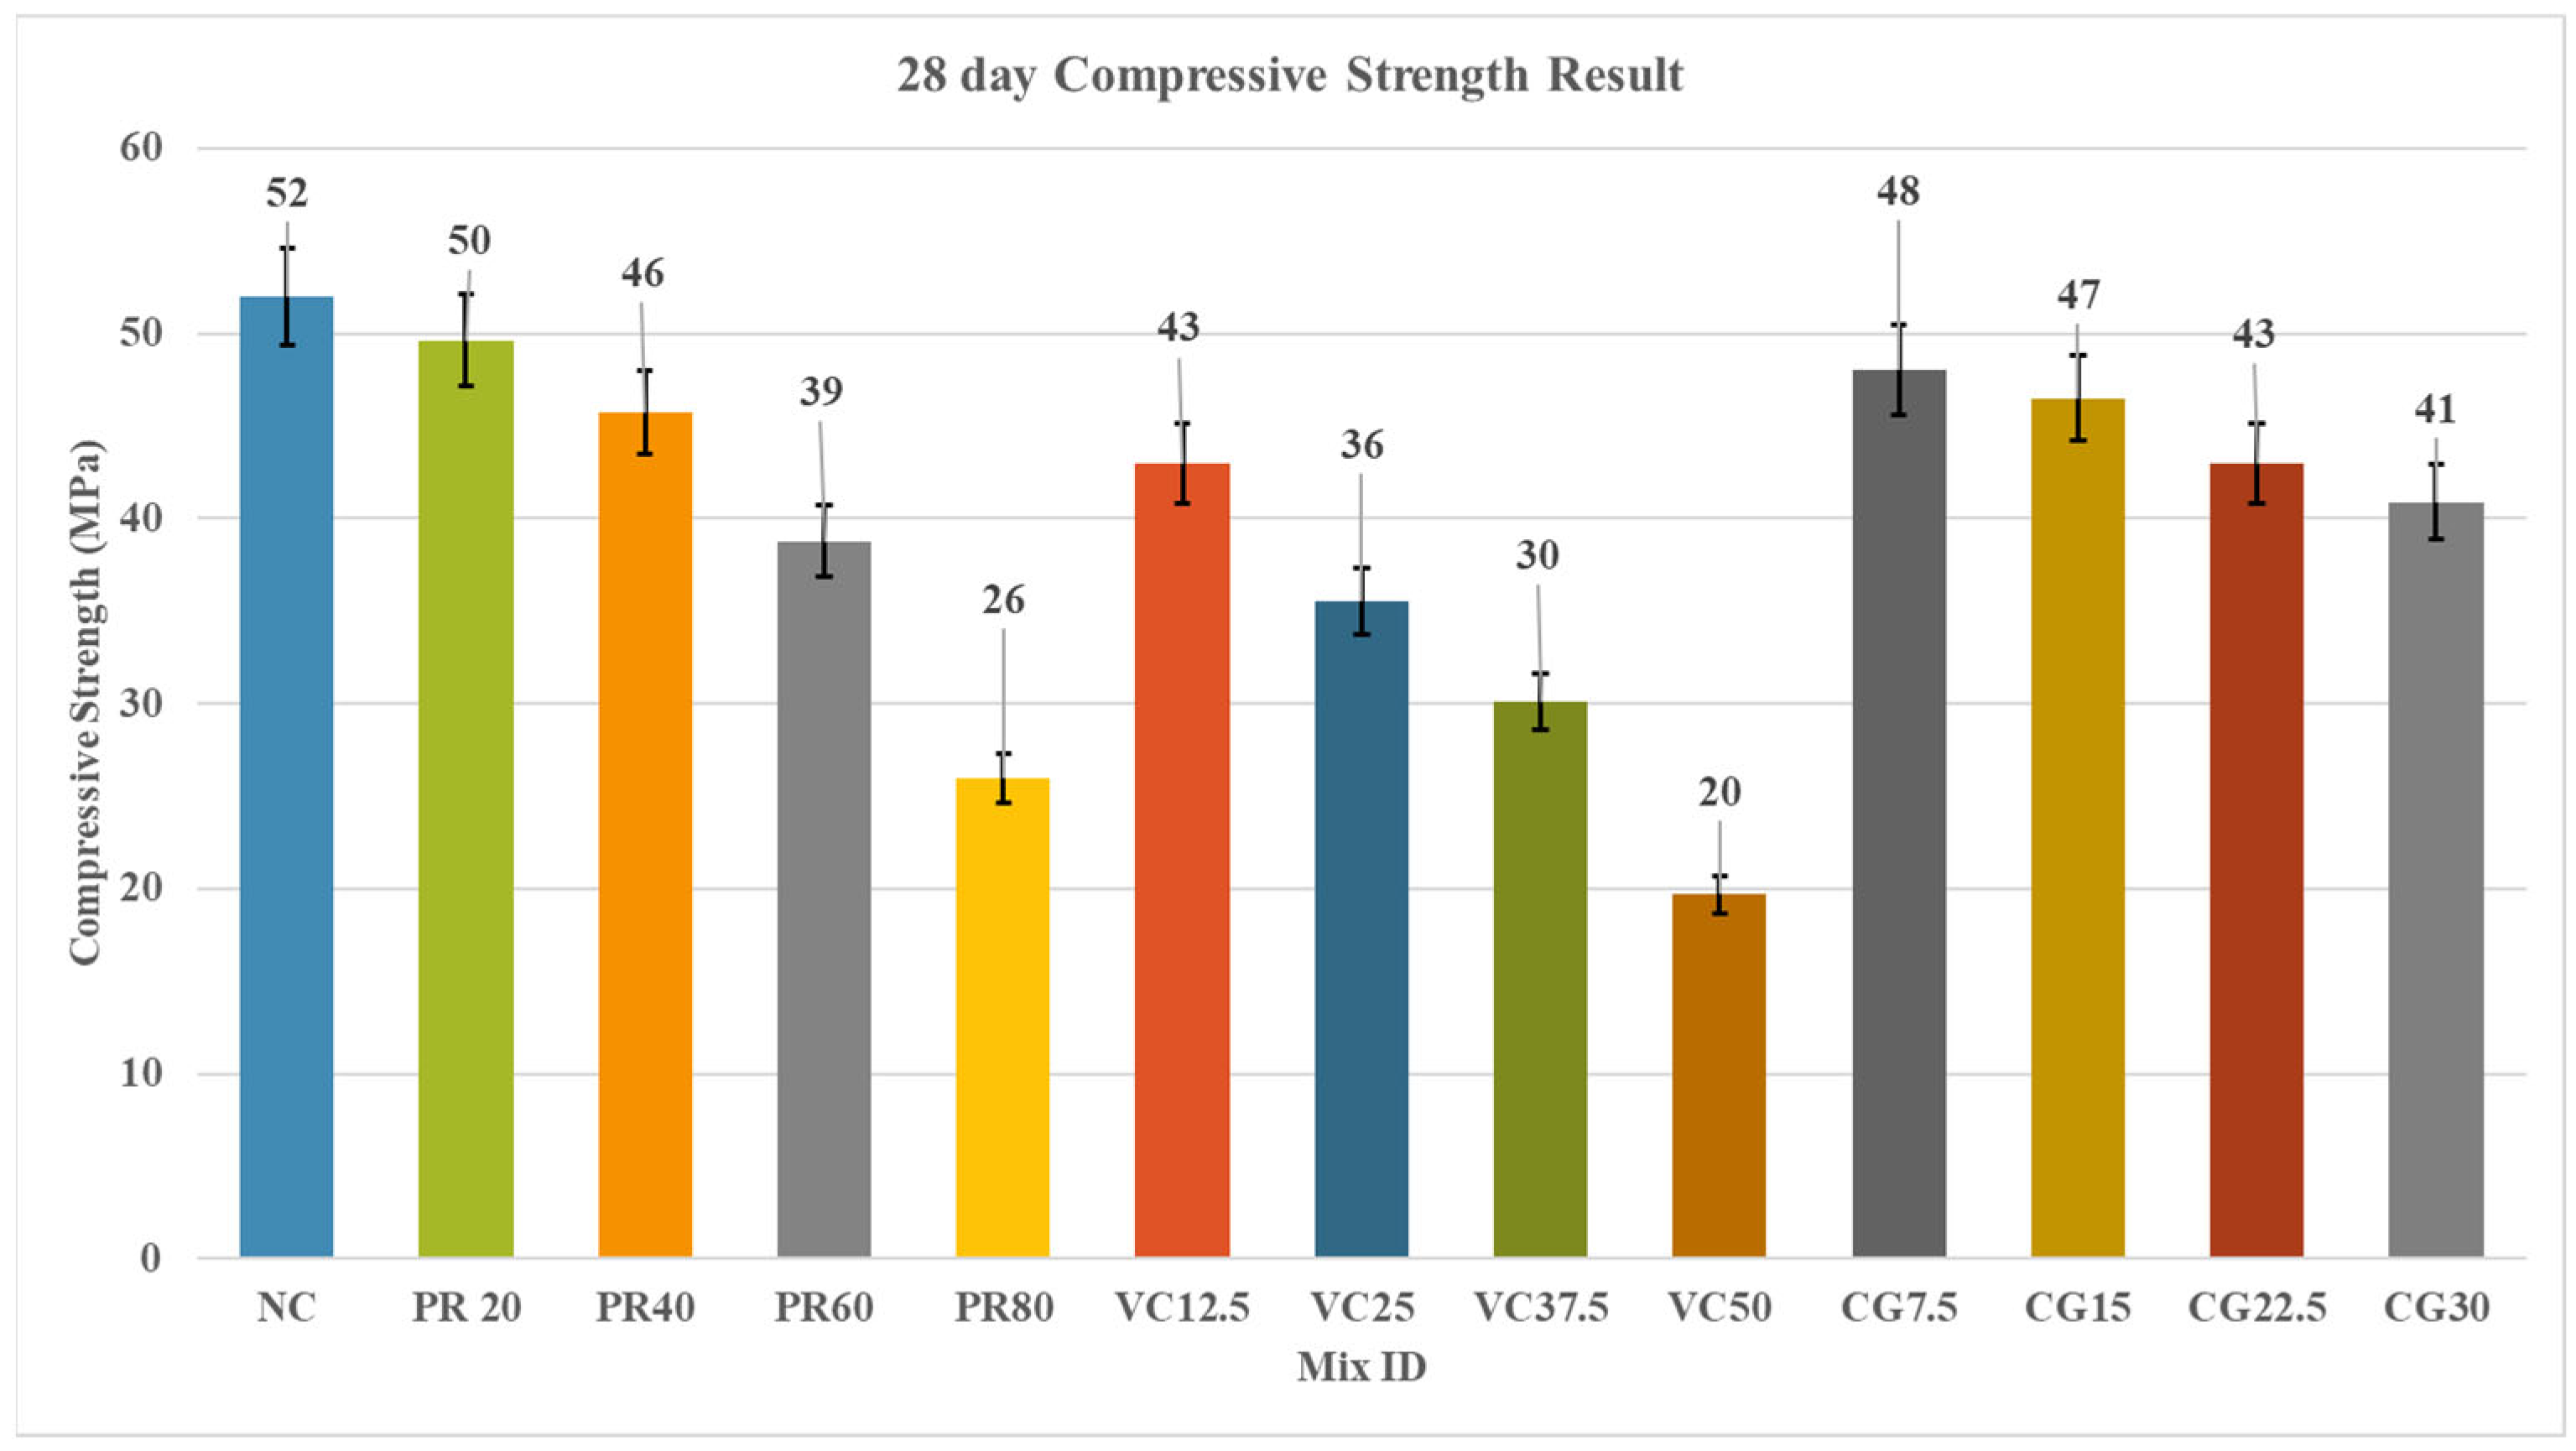
At 28 days, the NC control achieved 52 MPa, representing full hydration and matrix consolidation. In the Perlite series, 28-day compressive strengths followed a clear decreasing trend with increasing replacement: PR20 reached approximately 50 MPa, PR40 around 46 MPa, while PR60 and PR80 were limited to 39 MPa and 26 MPa, respectively. The reduction is primarily due to the porous nature of Perlite, which restricts solid load-bearing fraction and final matrix density.
Vermiculite mixes showed similar trends, with VC12.5 achieving 43 MPa, VC25 36 MPa, and VC37.5 30 MPa, whereas VC50 remained too low (20 MPa) for structural use. In contrast, Crushed Glass mixes retained higher strength, with CG7.5 at 48 MPa and CG30 at 41 MPa, demonstrating the efficacy of dense, angular particles in maintaining matrix cohesion. Overall, these results suggest that Perlite replacement should be limited to ≤40% and Vermiculite to ≤25% for structural applications, while Crushed Glass can be safely utilized up to 30% replacement without compromising 28-day strength. Higher replacement levels of lightweight aggregates are more appropriate for non-structural applications such as paving or façade elements.
According to IS 15658: 2021 [42] Precast Concrete Blocks for Paving, paver blocks must satisfy minimum compressive strength requirements based on their application category that is 35 MPa for Category A (Light-traffic), 45 MPa for Category B (Medium-traffic), 50 MPa for Category C (Heavy-traffic). Overall, the comparison indicates that optimized replacement ranges of 20–40% for Perlite, 12.5–25% for Vermiculite, and up to 30% for Crushed Glass offer a balanced trade-off between mechanical strength (for Category B Medium Traffic) and sustainability objectives, making them suitable for eco-efficient concrete paver block applications. The comparative graph of the 28-day compressive strength result is shown in Figure 8.

4.3. Thermal Analysis

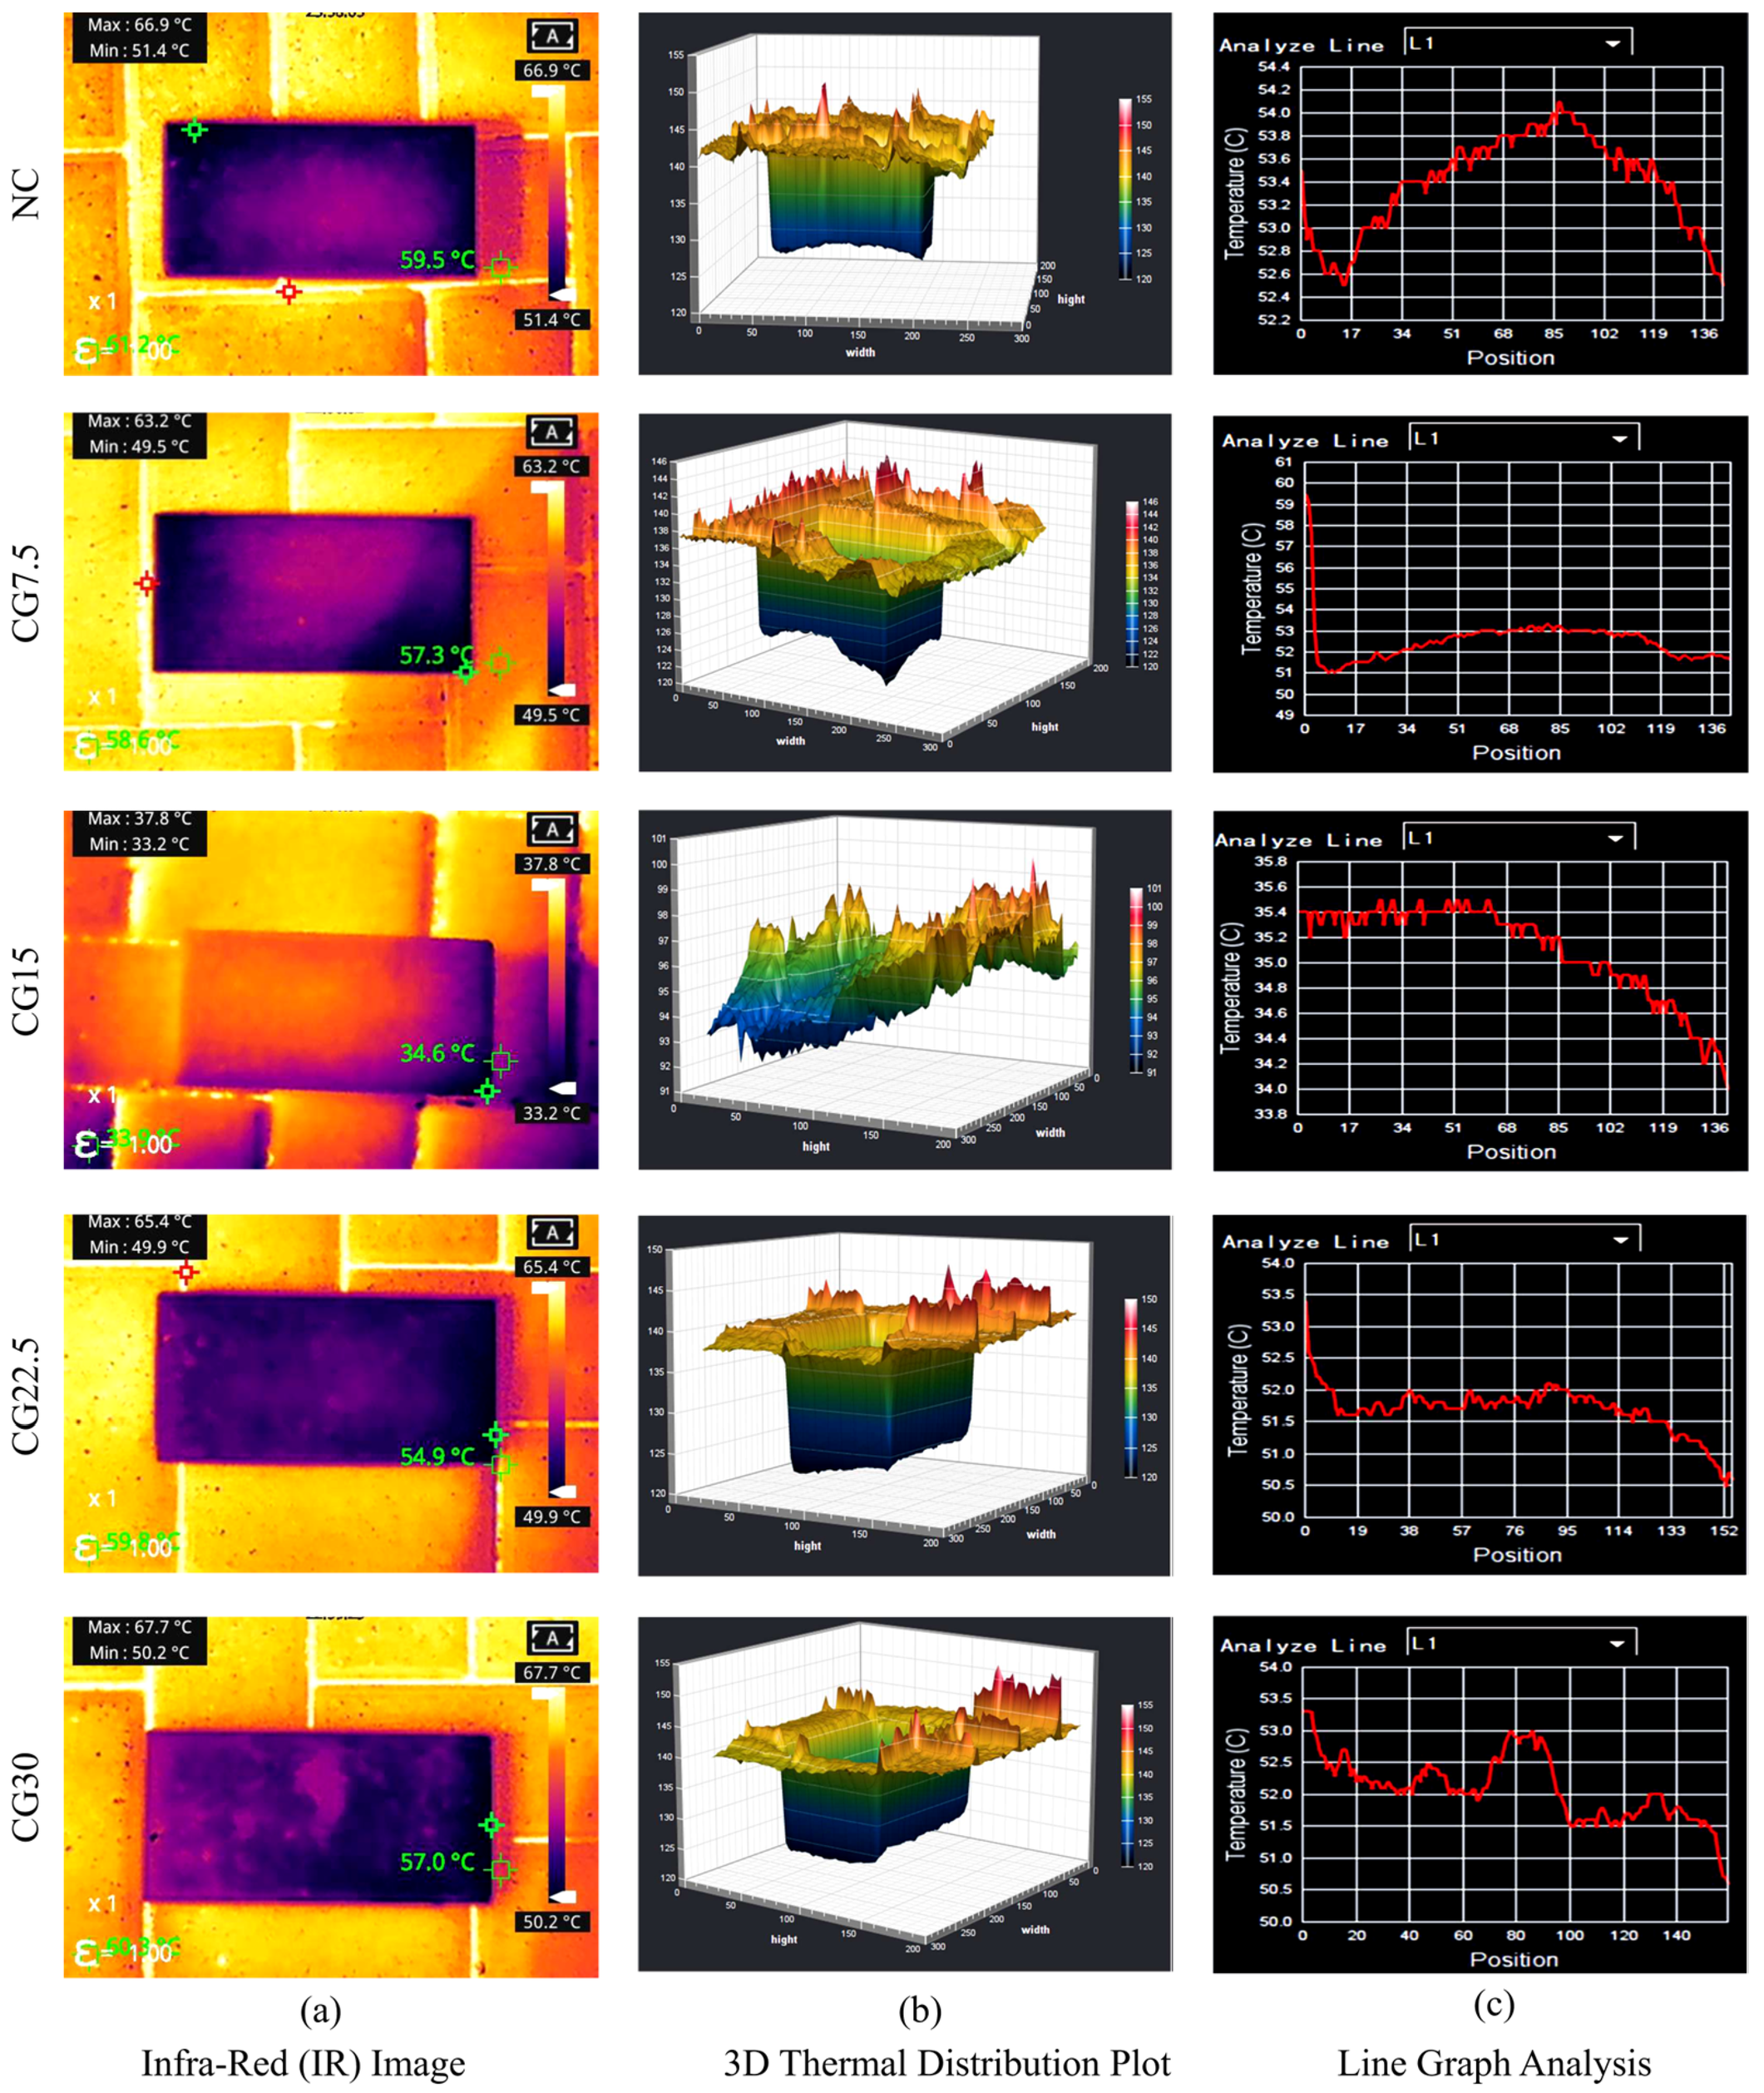
Thermal behaviour analysis was performed to assess the surface temperature characteristics of the developed concrete paver blocks, targeting their potential to mitigate the UHI effect through enhanced heat resistance. The analysis utilized a thermal imaging camera to capture non-contact, high-resolution infrared (IR) images of the paver block surfaces under uniform laboratory heat exposure. The procedure involved exposing each specimen to a controlled heat source for a fixed duration to achieve consistent thermal conditions. The image of the equipment used and the software interface are shown in Figure 9 below.
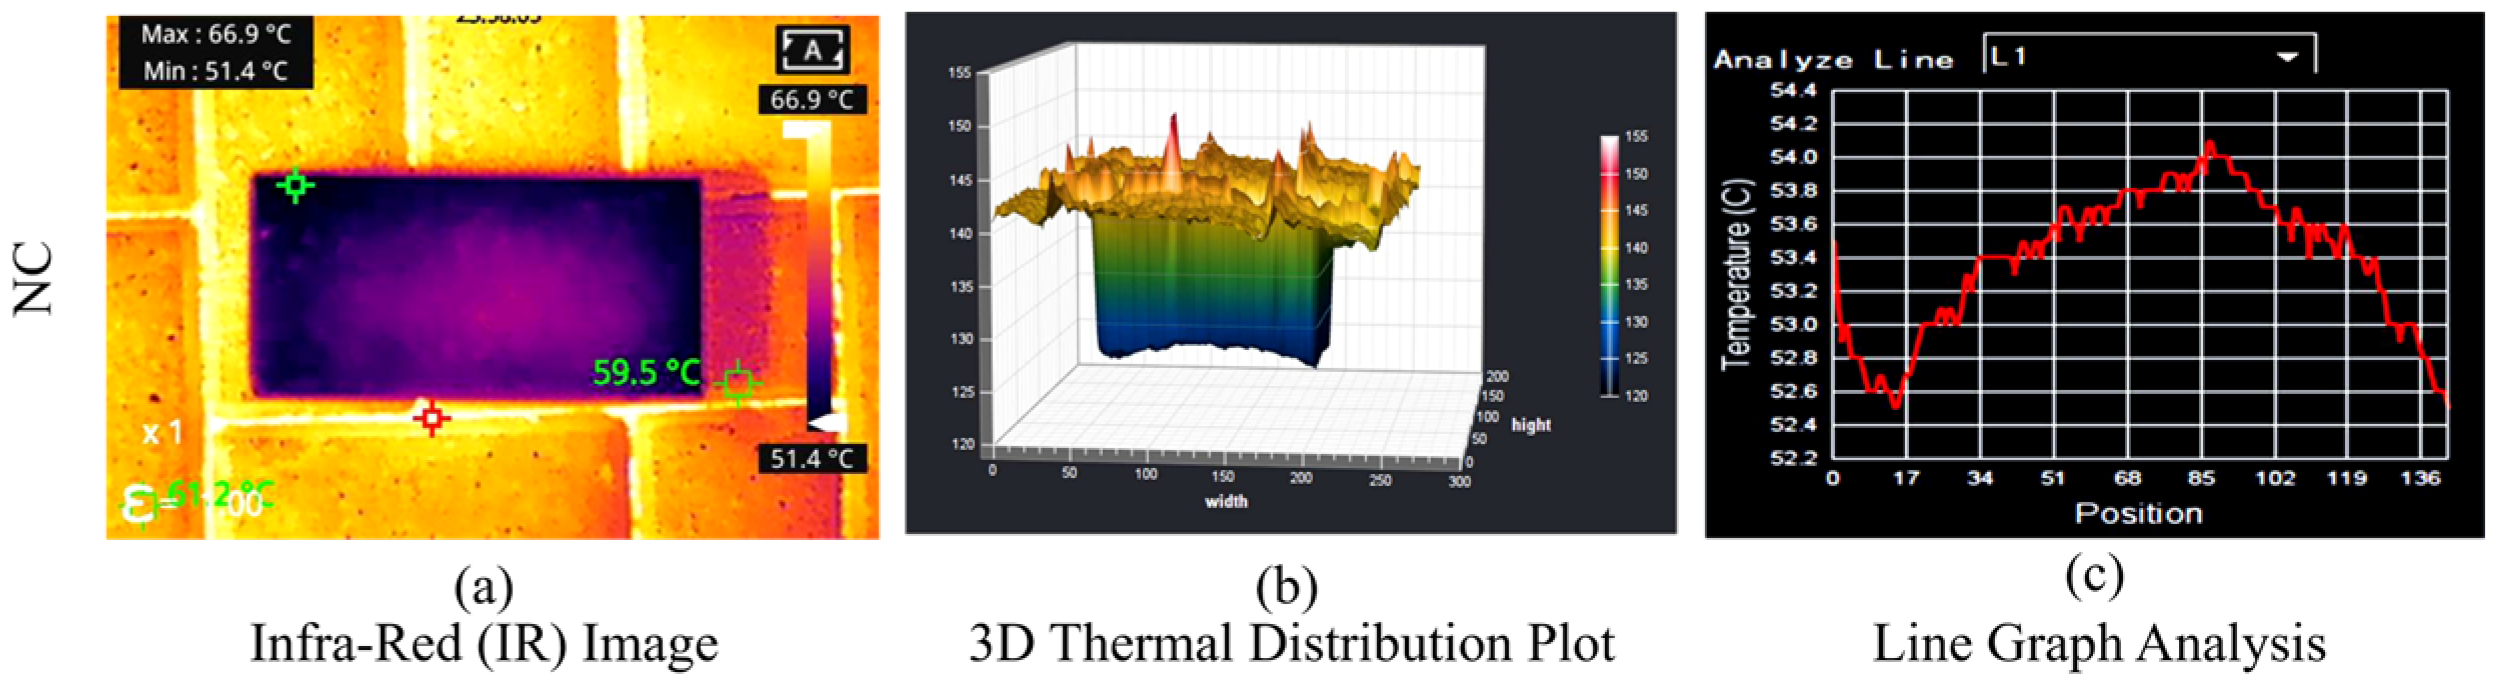
Immediately after exposure, the thermal camera captured the IR images to visualize the surface temperature distribution. These images were then processed using specialized thermal analysis software to extract quantitative and visual data for in-depth evaluation. For each tested mix, three distinct outputs were generated: (1) a thermal image showing maximum and minimum surface temperatures, (2) a 3D thermal surface plot illustrating the spatial temperature distribution, and (3) a line graph representing temperature variations along a specific linear path on the block surface. The thermal image provides a direct visualization of temperature extremes, enabling identification of hot and cool zones on the block surface. This image is critical for recognizing localized heat retention or dissipation characteristics. The 3D thermal surface plot offers a comprehensive spatial overview of temperature variations across the block, with peak temperature regions typically manifesting as elevated areas on the plot. Such plots reveal thermal gradients and patterns, such as a central hot region surrounded by cooler edges, indicating differential heat absorption and dissipation behaviour throughout the specimen. The line graph complements these insights by quantifying temperature changes along a selected analysis line, highlighting gradients and thermal transitions across the surface. This graph is valuable for verifying the thermal uniformity or pinpointing hotspots, lending quantitative support to the visual data. Together, these analyses enable a thorough understanding of how alternative fine aggregates incorporated in the concrete mixes influence thermal performance. Materials that demonstrate lower maximum surface temperatures and more favorable thermal distribution patterns indicate better heat resistance, a critical factor for addressing UHI effects through urban pavement design.

4.3.1. Thermal Analysis of Normal Concrete Mix

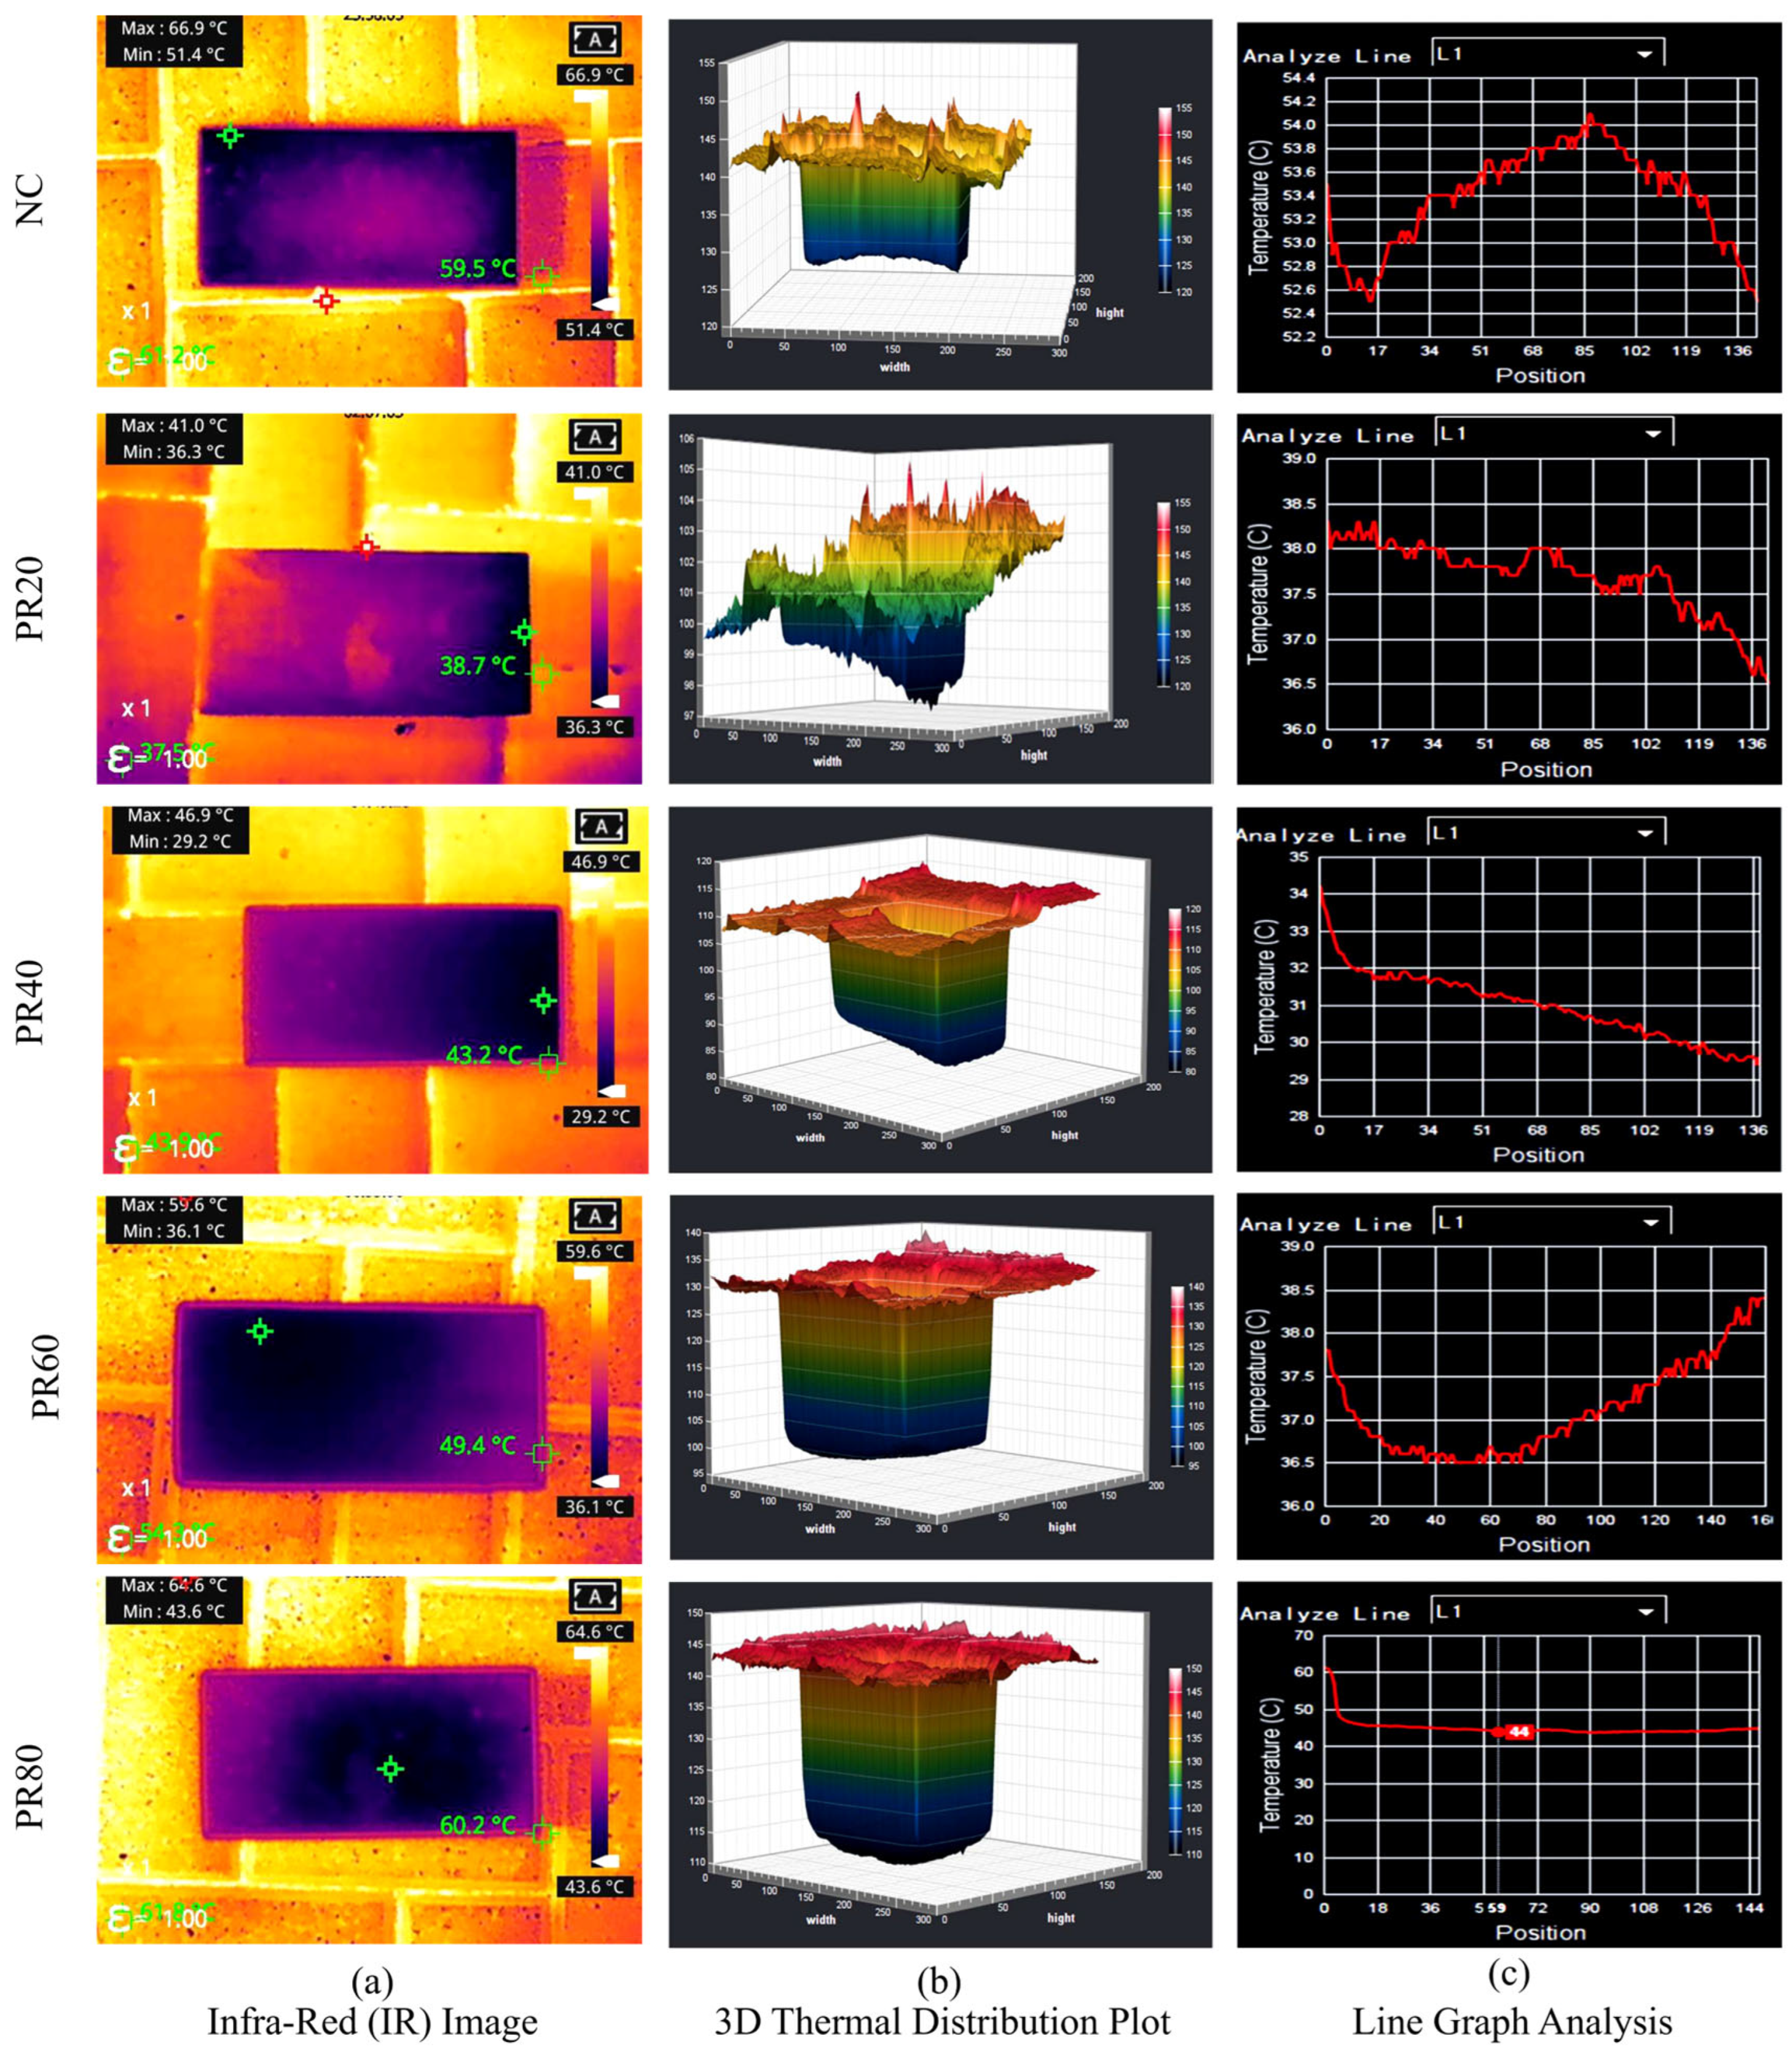
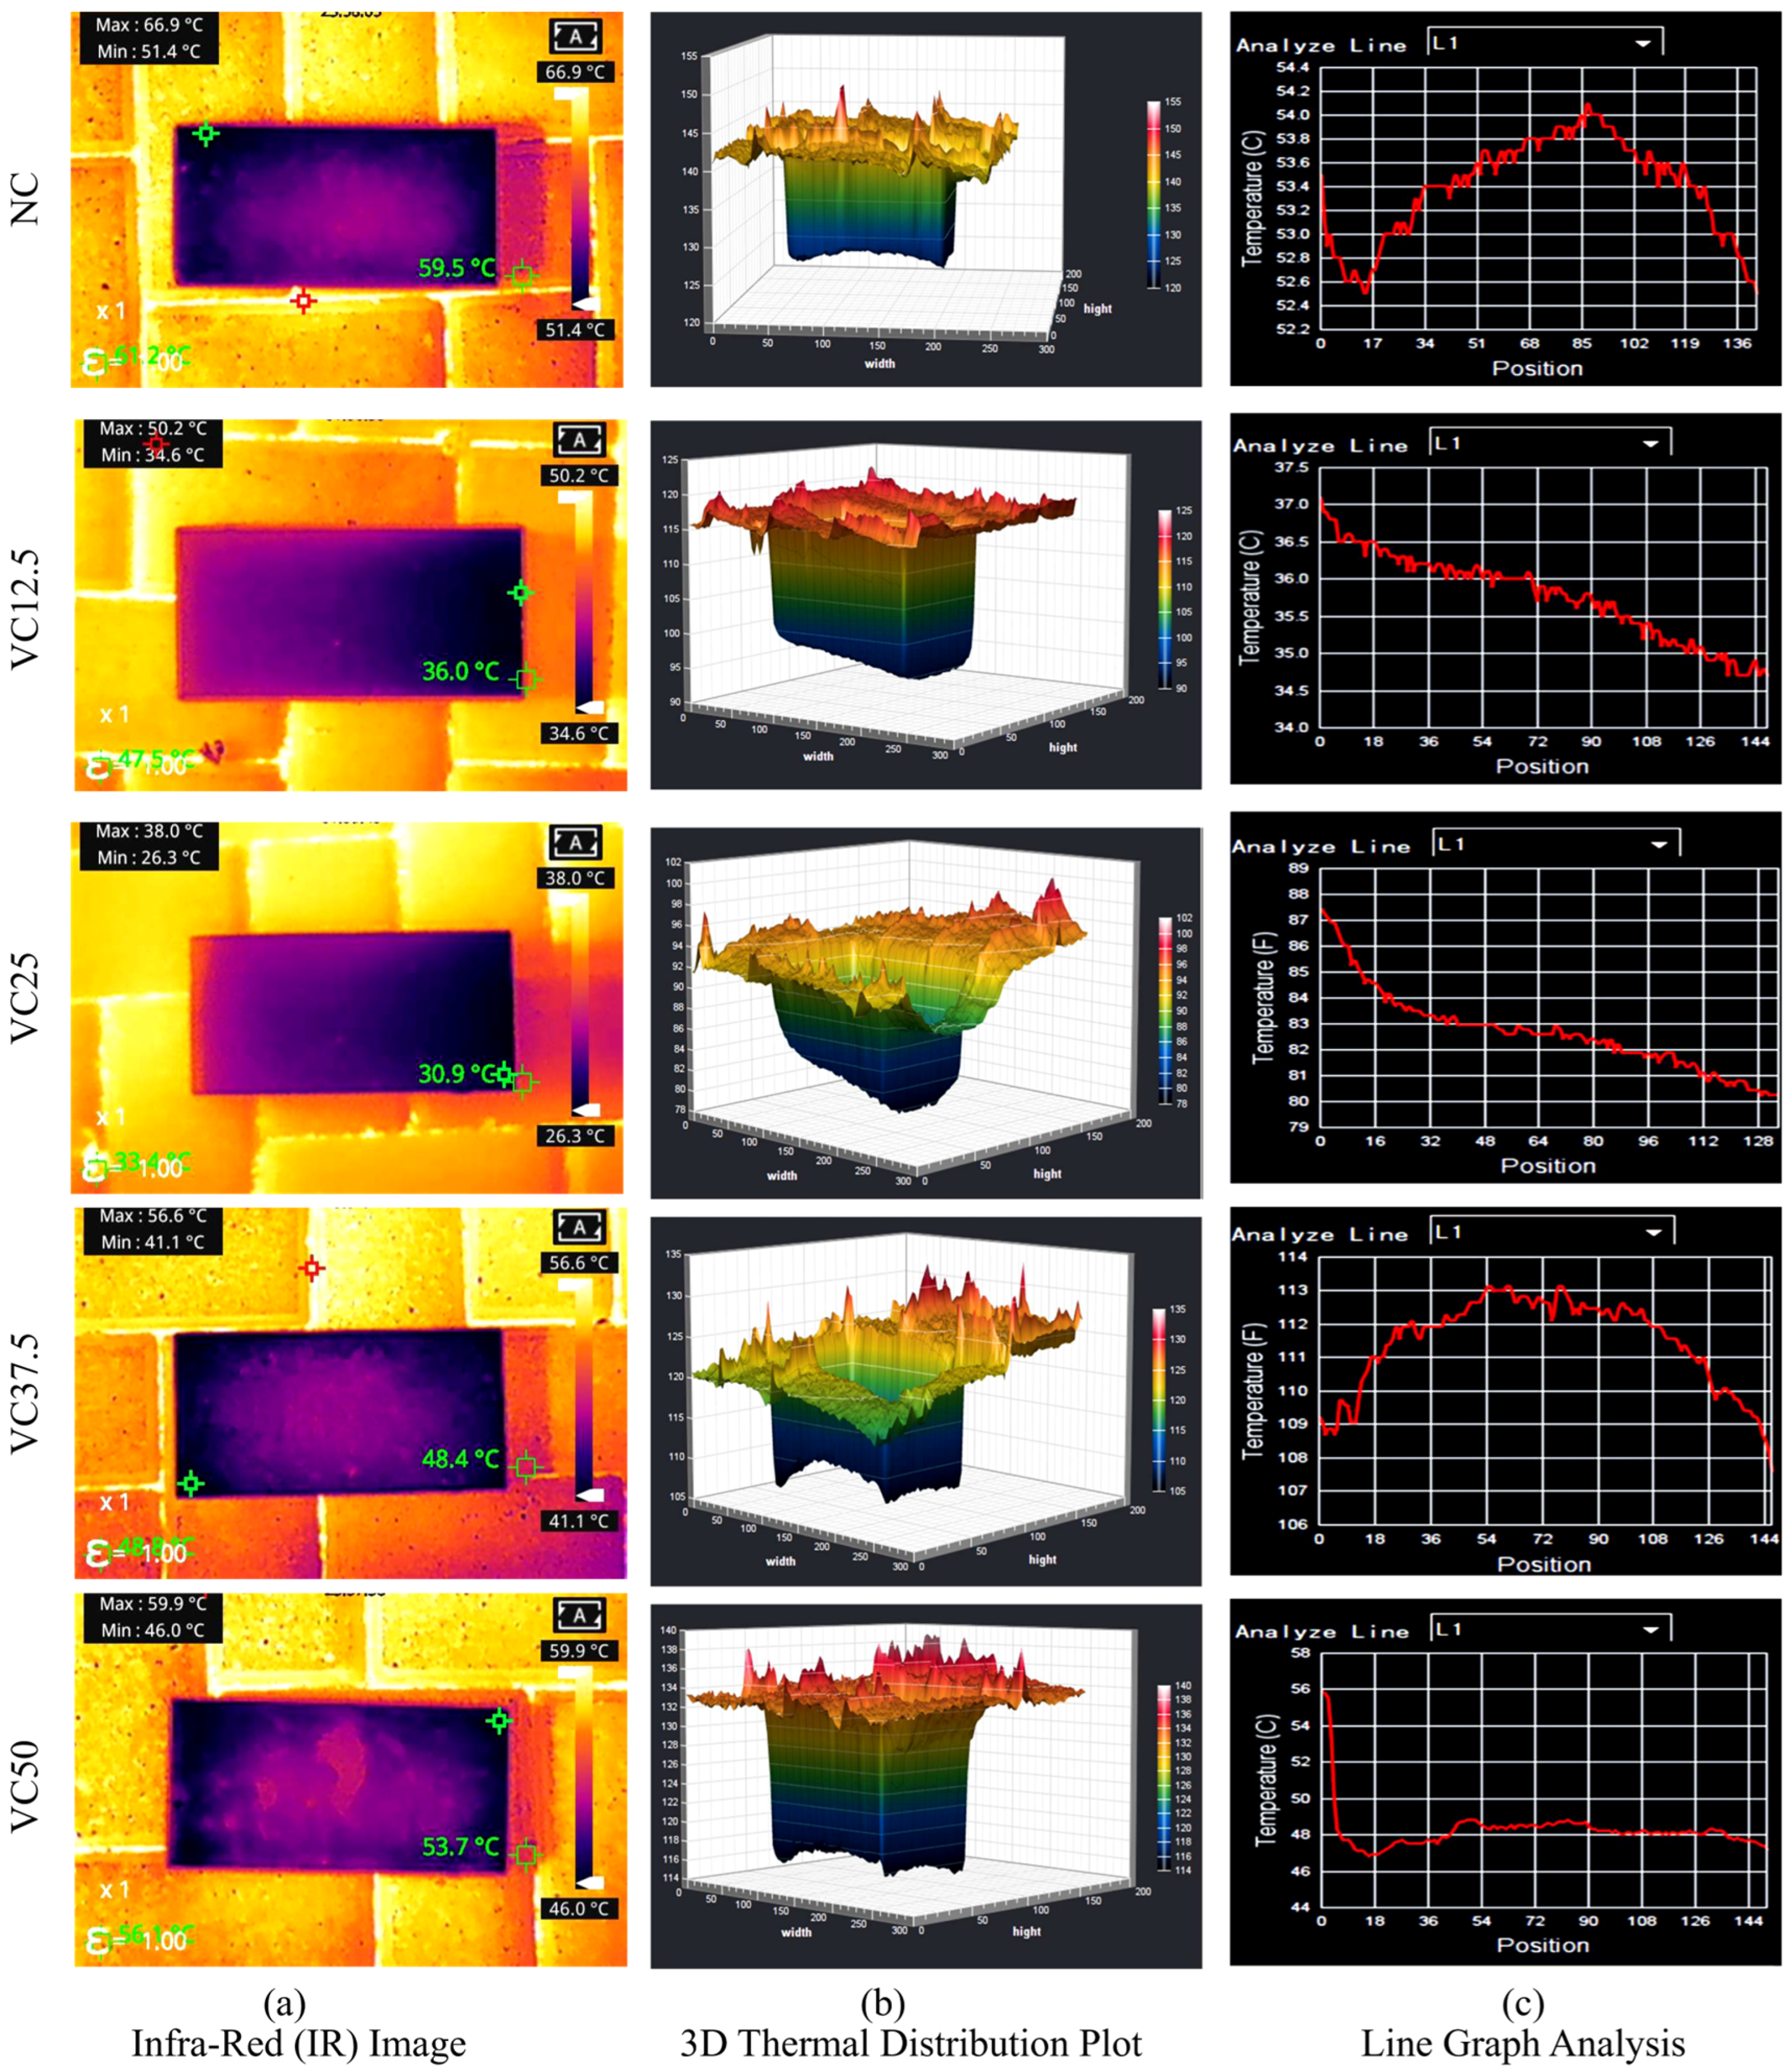
The thermal image of the normal concrete surface showed a maximum surface temperature of approximately 66.9 °C and a minimum of 51.4 °C, indicating a broad temperature range across the surface. This demonstrated considerable heat absorption and retention, as the paver reached high surface temperatures under uniform heat exposure. The central portions appeared in darker (hotter) shades, suggesting that the material absorbed and stored significant heat rather than reflecting it effectively. This behaviour aligned with the known thermal characteristics of conventional concrete, which has high thermal mass and low reflectivity (albedo), resulting in elevated surface temperatures under solar radiation. Consequently, the normal mix exhibited limited capability for heat dissipation.
The 3D thermal distribution plot illustrated a non-uniform temperature field across the surface, showing a bowl-like depression where the central region displayed higher temperature peaks compared to the cooler edges. This pattern indicated that the centre of the block accumulated more heat, likely due to the combined effects of internal conduction and reduced convective cooling, while the edges, being more exposed to ambient air, cooled more rapidly. Such a representation highlighted the thermal gradient and low emissivity behaviour of normal concrete, reflecting its tendency to trap heat in the interior layers.
The line analysis across a defined section of the block showed temperature fluctuations between 52.2 °C and 53.8 °C, with a distinct peak near the centre. This confirmed localized non-uniformities in heat distribution, with heat gradually dissipating toward the edges. From a UHI perspective, these observations indicated that normal concrete exhibited high heat storage and slow dissipation, contributing to prolonged surface heating and nighttime re-radiation of stored heat, which can intensify UHI in built environments.
The thermal analysis result for normal concrete is shown in Figure 10 below. Figure 10a shows a thermal image showing maximum and minimum surface temperatures for normal concrete. Figure 10b shows a 3D thermal surface plot illustrating the spatial temperature distribution for normal concrete. Figure 10c a line graph representing temperature variations along a specific linear path on the block surface for normal concrete.
Overall, the thermal analysis of the normal concrete mix confirms that it behaves as a heat-absorbing material with low reflectivity and high thermal retention. The high surface temperatures, pronounced central heat concentration, and steep temperature gradients collectively demonstrate that conventional concrete pavements significantly contribute to the rise in surface temperature and thus intensify the UHI effect. These observations establish a baseline for comparing alternative concrete mixes designed with heat-reflective or low-absorption additives aimed at surface cooling and thermal comfort improvement in urban areas.

4.3.2. Thermal Analysis of Concrete Mix with Perlite Replacement

The thermal performance of concrete mixes partially replacing natural sand with perlite was studied comprehensively to determine optimal dosage for mitigating UHI effects while preserving material integrity. Infrared thermography revealed distinct thermal trends among the mixes with 20% (PR20), 40% (PR40), 60% (PR60), and 80% (PR80) perlite content. The thermal analysis result for the concrete mix with perlite replacement is shown in Figure 11 below. Figure 11a shows a thermal image showing maximum and minimum surface temperatures for concrete incorporatin perlite. Figure 11b shows a 3D thermal surface plot illustrating the spatial temperature distribution for concrete incorporating perlite. Figure 11c a line graph representing temperature variations along a specific linear path on the block surface for concrete incorporating perlite (replacement 20,40,60,80) as compared to normal concrete.
The PR20 mix significantly reduced the maximum surface temperature from 66.9 °C observed in normal concrete to 41.0 °C, with a minimum temperature of 36.3 °C, indicating enhanced reflectivity and heat insulation at this replacement level. This performance improvement corresponded to perlite’s low thermal conductivity and microcellular structure, which introduced air voids and restrained heat absorption and conduction within the matrix.
The PR40 mix continued this trend, achieving a broader temperature range from 29.2 °C to 46.9 °C. The flatter 3D thermal surface and more uniform line graph profile indicated improved disruption of heat conduction pathways and superior heat reflectance. Literature suggested that intermediate perlite dosages optimized pore distribution and reduced thermal bridges, maximizing energy dissipation.
Conversely, increasing perlite content to 60% (PR60) unexpectedly raised the maximum temperature to 59.6 °C, approaching the thermal peak of unmodified concrete, though the minimum temperature remained relatively low at 36.1 °C. Localized hot spots and steeper temperature gradients in 3D plots and line graphs indicated reduced thermal homogeneity. This likely resulted from compromised microstructure at high perlite volumes, where excessive aggregate replacement weakened matrix cohesion and created thermally conductive void clusters, reducing insulation efficiency.
The PR80 mix showed a further rise in peak surface temperature to 64.6 °C, with a minimum of 43.6 °C, closely resembling the poor heat mitigation of standard concrete. Thermal imaging and 3D surfaces revealed marked non-uniformity and central heat retention. Elevated thermal conductivity at this level, caused by particle agglomeration and poor interfacial bonding, facilitated heat absorption rather than reflection.
These results aligned with broader studies on expanded perlite concrete, which emphasized an optimal replacement range (typically 20–40%) where thermal insulation was maximized without adversely affecting strength or thermal uniformity [32]. Replacement levels beyond 40% induced microstructural inconsistencies, elevated surface temperatures, and thermal non-uniformities, undermining pavement cooling performance. These findings provided guidance for designing perlite-modified concretes tailored for sustainable urban infrastructure with improved thermal comfort and energy efficiency.

4.3.3. Thermal Analysis of Concrete Mix with Vermiculite Replacement

The thermal performance of concrete mixes incorporating vermiculite as a partial replacement for natural sand was systematically evaluated and compared with control Normal Concrete (NC), which exhibited a high heat absorption profile with a maximum surface temperature (MAT) of 66.9 °C. The analysis across the four mixes—VC12.5, VC25, VC37.5, and VC50—revealed a clear optimal dosage for UHI mitigation.
The VC12.5 mix, with a MAT of 50.2 °C, demonstrated a substantial 16.7 °C reduction from NC, indicating significant improvement. Its surface temperature image showed a more uniform thermal contour than NC, though warmer zones remained. The corresponding 3D thermal plot displayed notable flattening compared to the pronounced “peak” of NC, yet retained a shallow, bowl-like shape, suggesting residual heat concentration. The line profile reflected this, showing a dampened but still undulating curve, confirming improved thermal homogeneity. The VC25 mix represented the peak performance within the series. Its surface temperature image exhibited the lowest MAT, in the range of 44–46 °C, representing a reduction of over 20 °C from NC, alongside the most homogeneous temperature distribution. The 3D thermal plot showed the flattest, most planar surface, demonstrating superior heat distribution. The line profile corroborated this, presenting as a smooth, near-horizontal line at the low temperature baseline, indicating excellent thermal uniformity.
Beyond this optimum, the thermal performance deteriorated. The surface temperature images for VC37.5 and VC50 showed a rebound in MAT, rising to 52 °C and 58 °C, respectively, with the reappearance of heterogeneous thermal patterns. Their 3D thermal plots transitioned away from the flat plane of VC25 back toward deeper, more concentrated “bowl” shapes, resembling the problematic profile of NC. The line profiles for these higher-replacement mixes showed steeper, more erratic curves, confirming the return of significant thermal gradients. This degradation was attributed to microstructural oversaturation, where excessive vermiculite content weakened the matrix and created an overly porous network that facilitated, rather than inhibited, heat transfer.
Overall, the data identified VC25 as the optimal formulation. Moderate vermiculite content (12.5–25%) provided a cooling effect of up to 22 °C compared to NC, whereas excessive replacement (37.5–50%) induced counterproductive structural changes, causing temperatures to rebound toward the less desirable performance of conventional concrete. This highlighted the importance of precise vermiculite dosage for effective UHI mitigation solutions. The thermal analysis result for normal concrete is shown in Figure 12. Figure 12a shows a thermal image showing maximum and minimum surface temperatures for concrete incorporatin vermiculite. Figure 12b shows a 3D thermal surface plot illustrating the spatial temperature distribution for concrete incorporating vermiculite. Figure 12c a line graph representing temperature variations along a specific linear path on the block surface for concrete incorporating vermiculite (replacement 12.5,25,37.5,50) compared to normal concrete.
The thermal performance of concrete incorporating crushed glass powder (CG) as a partial cement replacement was evaluated across four mixes—CG7.5, CG15, CG22.5, and CG30. When benchmarked against Normal Concrete (NC), which exhibited a peak surface temperature of 66.9 °C, all CG mixes demonstrated a substantial improvement in UHI mitigation.
The incorporation of 7.5% CG resulted in a major temperature reduction, with the CG7.5 mix showing a maximum temperature of 29.3 °C, a decrease of 37.6 °C from NC. Its surface temperature image displayed a highly uniform thermal contour, indicating minimal heat absorption. This was reinforced by its 3D thermal plot, which presented as an exceptionally flat plane in contrast to the steep profile of NC. The line profile appeared as a smooth, near-horizontal line, confirming excellent thermal homogeneity and low heat retention.
The positive trend continued with the CG15 mix, which showed a further marginal decrease in maximum temperature, likely in the range of 28.5–29.0 °C. Its surface temperature image appeared even more homogeneous than CG7.5. The 3D plot remained extremely flat, and the line profile reflected an equally subdued thermal gradient. This improvement was attributed to enhanced pozzolanic reaction and pore refinement, as fine glass particles filled microvoids and reacted with calcium hydroxide to form additional C–S–H gel, creating a denser matrix that restricted heat conduction.
Beyond the 15% replacement level, a performance plateau was observed. The CG22.5 and CG30 mixes showed maximum temperatures similar to, or slightly higher than, those of CG15. CG22.5 exhibited a maximum temperature of about 29.1 °C, and CG30 about 29.4 °C. Their surface temperature images, while still superior to NC, displayed minor inconsistencies compared to CG15. The 3D plots, though largely planar, developed gentle undulations, and the line profiles showed slight, low-amplitude fluctuations. The thermal analysis result for normal concrete is shown in Figure 13. Figure 13a shows a thermal image showing maximum and minimum surface temperatures for concrete incorporatin crushed glass. Figure 13b shows a 3D thermal surface plot illustrating the spatial temperature distribution for concrete incorporating crushed glass. Figure 13c a line graph representing temperature variations along a specific linear path on the block surface for concrete incorporating crushed glass (replacement 7.5,15,22.5,30) as compared to normal concrete.
This plateau was attributed to microstructural changes. While moderate CG content (7.5–15%) refined the matrix effectively, higher CG levels (22.5–30%) diluted cementitious compounds essential for forming a continuous binding phase. This increased overall porosity and produced a more complex pore network. Beyond a certain threshold, reduced solid-phase conductivity was counterbalanced by increased heat transfer through air-filled pores via convection and radiation. As a result, the thermal performance no longer improved significantly beyond 15% replacement.
In summary, CG proved to be highly effective for UHI mitigation, with an optimal dosage at 15%, achieving a surface temperature reduction of approximately 38 °C compared to NC and providing exceptional thermal uniformity.
The comparative analysis of lightweight aggregates and supplementary cementitious materials for UHI mitigation reveals a clear hierarchy of performance and distinct optimal dosages. Among all tested mixes, vermiculite demonstrated the most superior cooling potential, with the VC-25 mix (25% vermiculite replacement) emerging as the overall optimal formulation. This mix achieved the lowest maximum surface temperature of 26.3 °C, which corresponds to a substantial 48.83% reduction, a drop of over 25 °C, compared to Normal Concrete (NC). Perlite also proved highly effective, with its peak performance at the PR-40 mix (40% replacement), achieving a 43.20% reduction (29.2 °C). Crushed Glass Powder (CG), while beneficial, offered more modest improvements, with its best performance at the CG-15 mix (15% replacement), yielding a 35.41% reduction (33.2 °C). The data further underscores the criticality of dosage optimization, as a clear rebound in surface temperature was observed for all materials when the replacement level exceeded their respective optimums. Consequently, the VC-25 mix is unequivocally recommended as the most effective material for UHI mitigation, offering an unparalleled combination of significantly reduced heat absorption and high thermal resistance. Its implementation in pavements and building envelopes holds the greatest promise for reducing ambient temperatures and mitigating the adverse effects of the UHI phenomenon. The temperature reduction across various mixes, along with a highlight on the best mix, is summarized in Table 3 below.

5. Conclusions and Future Scope

The comprehensive experimental investigation into the performance of concrete paver blocks incorporating perlite, vermiculite, and crushed glass powder (CG) as sustainable constituent replacements yields the following technically substantiated conclusions:
  • The workability, as quantified by the slump test, was significantly influenced by the particle morphology and absorption characteristics of the replacement materials. CG mixes exhibited a non-linear response; a 7.5% dosage increased the slump to 120 mm due to the lubricating effect of the glassy particles, while higher replacements (up to 30%) progressively reduced workability (to 90 mm) due to increased specific surface area. In contrast, vermiculite and perlite-maintained workability close to the normal concrete (NC) baseline (110 mm) up to 25% and 40% replacement, respectively, beyond which a slight reduction was observed, attributable to their irregular shape and higher water absorption. The variations in workability across the mixes were primarily governed by the distinct particle morphologies of the replacement materials: the flaky structure of vermiculite increased internal friction, the angular shape of crushed glass elevated water demand, and the highly porous nature of perlite absorbed mix water; collectively, these characteristics significantly influenced slump reduction.
  • A pronounced reduction in hardened density was recorded for both perlite and vermiculite mixes, with maximum decreases of approximately 23% (PR80: ~1933 kg/m3) and 19% (VC50: ~1767 kg/m3) relative to NC (~2350 kg/m3). This confirms the successful production of lightweight concrete, directly resulting from the low particle density and highly flaky structure of these aggregates, which introduce significant entrapped air into the cementitious matrix. Conversely, CG mixes showed a marginal density increase (up to ~8% for CG7.5), attributable to the material’s higher specific gravity and pore-filling pozzolanic action.
  • The 28-day compressive strength results delineated clear optimal dosages. The NC mix achieved the highest strength (~62 MPa). Among the modified mixes, PR20 (49.6 MPa), VC25 (47.8 MPa), and CG15 (~58 MPa) demonstrated an optimal balance, maintaining structural adequacy for M30 grade applications as per IS 15658:2021. Strength degradation beyond these thresholds—exceeding 60% for perlite and 37.5% for vermiculite—was severe, driven by the formation of a highly porous and weakened matrix. For CG, the strength gain at lower dosages (attributed to micro-filler and pozzolanic effects) diminished at 30% replacement, likely due to dilution of cementitious compounds and poor particle interlocking.
  • Infrared thermography established a definitive hierarchy in cooling performance. The VC25 mix emerged as the superior UHI mitigation strategy, exhibiting the lowest maximum surface temperature of 26.3 °C—a reduction of 25.1 °C (48.8%) compared to NC. This was followed by the PR40 mix (29.2 °C, a 22.2 °C reduction). The CG15 mix offered a moderate improvement (33.2 °C, an 18.2 °C reduction). Thermal imaging and 3D surface plots quantitatively confirmed that these optimal mixes promoted exceptional thermal homogeneity, effectively eliminating localized hotspots. Conversely, excessive replacement levels (e.g., VC50, PR80) led to a rebound in surface temperatures and uneven thermal distribution, correlated with increased surface roughness and microstructural deficiencies.
  • It was observed that the paver blocks containing perlite and vermiculite exhibited slightly lighter shades compared to the control mix, while blocks with crushed glass appeared marginally darker. These variations in color may influence surface albedo and, consequently, the thermal performance of the blocks.
The observed reduction in surface temperature of concrete paver blocks incorporating insulating aggregates can be explained by multiple contributing factors: Firstly, the low thermal conductivity of perlite and vermiculite slows heat transfer into the block interior, thereby reducing the rate at which the surface heats under solar irradiation. Secondly, the albedo effect associated with lighter-colored aggregates, such as perlite and vermiculite, increases the reflection of incident solar radiation, limiting heat absorption at the surface. In contrast, crushed glass, being relatively darker, absorbs more heat, which explains its comparatively higher surface temperatures. Thirdly, the specific heat capacity of the constituent materials influences their ability to store and release heat, which, in combination with thermal conductivity, affects the surface temperature dynamics. Care was taken to ensure that all specimens were surface-dry prior to testing, minimizing the role of evaporative cooling and ensuring that the observed temperature reductions are primarily attributable to the thermal properties and reflectivity of the materials. Collectively, these effects demonstrate that careful selection and incorporation of insulating aggregates can meaningfully reduce surface temperatures, supporting the potential of material-level interventions in mitigating the Urban Heat Island effect.
For the development of sustainable, structurally sound, and thermally efficient paver blocks for urban infrastructure, a 25% replacement of natural sand with vermiculite (VC25) is identified as the optimal formulation. This mix delivers the most significant reduction in heat absorption and surface temperature while maintaining acceptable workability and compressive strength, alongside a substantial 25% reduction in density. This research conclusively demonstrates that a carefully calibrated incorporation of lightweight aggregates can simultaneously address the intertwined challenges of UHI mitigation and sustainable construction material development.
Future studies can capture sequential thermal images during controlled heating and cooling intervals to better understand the real-time thermal response of the developed composite. Also, research should pivot towards the long-term durability and microstructural characterization of the optimal mixes, particularly VC-25, under accelerated environmental ageing to assess carbonation, freeze-thaw resistance, and abrasion for real-world deployment. A critical scope involves employing advanced techniques like SEM and Mercury Intrusion Porosimetry to quantitatively link the pore-size distribution and interfacial transition zone morphology with the observed thermo-mechanical properties. Furthermore, field validation through in situ pilot studies is essential to monitor the microclimatic impact, including diurnal surface temperature profiles and albedo, for quantifying actual UHI mitigation. Subsequently, a comprehensive Life Cycle Assessment integrated with a cost–benefit analysis will be indispensable to evaluate the environmental and economic viability of scaling up these sustainable material solutions for urban infrastructure.

Author Contributions

Conceptualization, J.M. and T.J.; Data curation, V.S. and J.M.; Formal analysis, J.M., V.S. and T.J.; Investigation, J.M., V.S. and T.J.; Methodology, J.M., V.S. and T.J.; Project administration, T.J., U.D. and P.C.; Resources, T.J., U.D. and P.C.; Supervision, T.J., U.D. and P.C.; Validation, T.J., U.D. and P.C.; Writing—original draft preparation, J.M., V.S. and T.J.; Writing—review & editing, J.M., V.S., T.J. and P.C. All authors have read and agreed to the published version of the manuscript.

Funding

This research received no external funding.

Data Availability Statement

Data will be made available upon request.

Acknowledgments

The authors would like to express their gratitude to the Director, Institute of Technology, Nirma University, for the unwavering support and guidance throughout the work, as well as for providing all the necessary facilities.

Conflicts of Interest

The authors declare no conflicts of interest.

Abbreviations

The following abbreviations are used in this manuscript:
UHIUrban Heat Island
VCVermiculite
PRPerlite
CGCrushed Glass
SDGSustainable Development Goals
LSTLand Surface Temperature
LULCLand Use/Land Cover
CUHICanopy Urban Heat Island
SUHISurface Urban Heat Island
UDTUrban Digital Twin
WRFWeather Research and Forecasting
GFGreen Facades
LWLiving Walls
EGRExtensive Green Roofs
LAILeaf Area Index
BEMBuilding Energy Models
UCMUrban Canopy Models
GIFGreen Infrastructure
SUHIISurface Urban Heat Island Intensity
NDVINormalized Difference Vegetation Index
UTHSUrban Thermal Heterogeneous Subunits
UGIUrban Green Infrastructure
PLSRPartial Least Squares Regression
RFRRandom Forest Regression
PIPBPervious Interlocking Paver Blocks
IRCIndian Road Congress
PCMPhase Change Materials
SRSolar Reflectance
SRISolar Reflectance Index
WRPBWater Retaining Paver Blocks
EVMExfoliated Vermiculite
RVMRaw Vermiculite
AAFCAlkali-Activated Foam Concrete
GPGlass Powder
SFPSemi-Flexible Pavement
OPCOrdinary Portland Cement
ISIndian Standard
PCEPoly Carboxylic Ether
NcNormal Concrete
IRInfra Red
MATMaximum Surface Temperature

References

  1. Mohan, V. India’s Annual Mean Temperature Rise up from 25.05 °C in 2001 to 25.74 °C in 2024, Electricity Generation from Renewable Sources Increased More than Three Times in 10 Years. The Times of India, 6 June 2025.
  2. Paul, J. 70% Ahmedabad Set to Burn at 45 °C by 2030. The Times of India, 21 March 2022.
  3. Benrazavi, R.S.; Dola, K.B.; Ujang, N.; Benrazavi, N.S. Effect of Pavement Materials on Surface Temperatures in Tropical Environment. Sustain. Cities Soc. 2016, 22, 94–103. [Google Scholar] [CrossRef] [Scilit]
  4. Abedrabboh, O.; Alfarra, M.R.; Al-Ansari, T.; Fountoukis, C. Enhancing Human Thermal Comfort in Hot Arid Cities: A Systematic Review of Urban Heat Island Observations and Mitigation Strategies. Build. Environ. 2025, 283, 113398. [Google Scholar] [CrossRef] [Scilit]
  5. Cheela, V.R.S.; John, M.; Biswas, W.; Sarker, P. Combating Urban Heat Island Effect—A Review of Reflective Pavements and Tree Shading Strategies. Buildings 2021, 11, 93. [Google Scholar] [CrossRef] [Scilit]
  6. Rajeswari, J.R.; Fountoukis, C.; Siddique, A.; Moosakutty, S.; Mohieldeen, Y.; Ayoub, M.A.; Alfarra, M.R. Urban heat island phenomenon in a desert, coastal city: The impact of urbanization. Urban Clim. 2024, 56, 102016. [Google Scholar] [CrossRef] [Scilit]
  7. Acosta, M.P.; Vahdatikhaki, F.; Santos, J.; Jarro, S.P.; Dorée, A.G. Data-driven analysis of Urban Heat Island phenomenon based on street typology. Sustain. Cities Soc. 2023, 101, 105170. [Google Scholar] [CrossRef] [Scilit]
  8. Chettry, V.; Sabarinath, D.; Manonmani, I.K. Urban heat island effect and urban thermal field variance index phenomenon at the heart of ‘chicken’s neck corridor’ of India. Urban Clim. 2024, 54, 101848. [Google Scholar] [CrossRef] [Scilit]
  9. Lee, Y.; Mohanadoss, P.; Noor, Z.Z.; Chelliapan, S. Overview of urban heat island (uhi) phenomenon towards human thermal comfort. Environ. Eng. Manag. J. (EEMJ) 2017, 16, 2097–2111. [Google Scholar] [CrossRef] [Scilit]
  10. Bao, Y.; Li, Y.; Gu, J.; Shen, C.; Zhang, Y.; Deng, X.; Han, L.; Ran, J. Urban heat island impacts on mental health in middle-aged and older adults. Environ. Int. 2025, 199, 109470. [Google Scholar] [CrossRef] [Scilit]
  11. Komarov, A.; Turchaninova, A.; Seliverstov, Y.; Sokratov, S.; Stroeve, J. The impact of urban heat island on snow properties and stratigraphy in the Moscow region. Urban Clim. 2025, 62, 102545. [Google Scholar] [CrossRef] [Scilit]
  12. Tun, K.Z.; Pramanik, M.; Mallick, S.K.; Chakrabortty, R.; Halder, B.; Moharir, K.N.; Pande, C.B.; Zhran, M. Cooling the Cities: A Comprehensive Review of Urban Heat Island Mitigation Strategies in Southeast Asia. Hum. Settlements Sustain. 2025, 1, 91–102. [Google Scholar] [CrossRef] [Scilit]
  13. Bai, Y.; Xing, Y. Harnessing Green Infrastructure for Urban Heat Island Mitigation: Evidence-Based Strategies for Sustainable and Climate-Resilient Cities. Sustain. Cities Soc. 2025, 133, 106843. [Google Scholar] [CrossRef] [Scilit]
  14. Zhang, H.; Kang, M.-Y.; Guan, Z.-R.; Zhou, R.; Zhao, A.-L.; Wu, W.-J.; Yang, H.-R. Assessing the role of urban green infrastructure in mitigating summertime Urban Heat Island (UHI) effect in metropolitan Shanghai, China. Sustain. Cities Soc. 2024, 112, 105605. [Google Scholar] [CrossRef] [Scilit]
  15. Iaria, J.; Susca, T. Analytic Hierarchy Processes (AHP) evaluation of green roof-and green wall-based UHI mitigation strategies via ENVI-met simulations. Urban Clim. 2022, 46, 101293. [Google Scholar] [CrossRef] [Scilit]
  16. Elnabawi, M.H.; Hamza, N.; Raveendran, R. ‘Super cool roofs’: Mitigating the UHI effect and enhancing urban thermal comfort with high albedo-coated roofs. Results Eng. 2023, 19, 101269. [Google Scholar] [CrossRef] [Scilit]
  17. Vitanova, L.; Petrova-Antonova, D.; Shirinyan, E. Urban digital twin for assessing and understanding urban Heat Island impacts. Urban Clim. 2025, 62, 102530. [Google Scholar] [CrossRef] [Scilit]
  18. Bahadori, E.; Rezaei, F.; He, B.-J.; Heiranipour, M.; Attia, S. Evaluating urban heat island mitigation strategies through coupled UHI and building energy modeling. Build. Environ. 2025, 280, 113111. [Google Scholar] [CrossRef] [Scilit]
  19. Al-Hadithi, A.I.; Hilal, N.N. The possibility of enhancing some properties of self-compacting concrete by adding waste plastic fibers. J. Build. Eng. 2016, 8, 20–28. [Google Scholar] [CrossRef] [Scilit]
  20. Liu, C.; Zhu, C.; Bai, G.; Quan, Z.; Wu, J. Experimental investigation on compressive properties and carbon emission assessment of concrete hollow block masonry incorporating recycled concrete aggregates. Appl. Sci. 2019, 9, 4870. [Google Scholar] [CrossRef] [Scilit]
  21. Wang, Z.; Xie, Y.; Mu, M.; Feng, L.; Xie, N.; Cui, N. Materials to mitigate the urban heat island effect for cool pavement: A brief review. Buildings 2022, 12, 1221. [Google Scholar] [CrossRef] [Scilit]
  22. Priyadarsini, R. Urban heat island and its impact on building energy consumption. Adv. Build. Energy Res. 2009, 3, 261–270. [Google Scholar] [CrossRef] [Scilit]
  23. Pancar, E.B.; Akpınar, M.V. Temperature reduction of concrete pavement using glass bead materials. Int. J. Concr. Struct. Mater. 2016, 10, 39–46. [Google Scholar] [CrossRef] [Scilit]
  24. Tie, T.S.; Mo, K.H.; Alengaram, U.J.; Kaliyavaradhan, S.K.; Ling, T.-C. Study on the use of lightweight expanded perlite and vermiculite aggregates in blended cement mortars. Eur. J. Environ. Civ. Eng. 2020, 26, 3612–3631. [Google Scholar] [CrossRef] [Scilit]
  25. Xu, B.; Ma, H.; Lu, Z.; Li, Z. Paraffin/expanded vermiculite composite phase change material as aggregate for developing lightweight thermal energy storage cement-based composites. Appl. Energy 2015, 160, 358–367. [Google Scholar] [CrossRef] [Scilit]
  26. Zhang, X.; Shen, L.; Tam, V.W.; Lee, W.W.Y. Barriers to implement extensive green roof systems: A Hong Kong study. Renew. Sustain. Energy Rev. 2012, 16, 314–319. [Google Scholar] [CrossRef] [Scilit]
  27. Qin, Y. A review on the development of cool pavements to mitigate urban heat island effect. Renew. Sustain. Energy Rev. 2015, 52, 445–459. [Google Scholar] [CrossRef] [Scilit]
  28. Qin, Y.; He, Y.; Hiller, J.E.; Mei, G. A new water-retaining paver block for reducing runoff and cooling pavement. J. Clean. Prod. 2018, 199, 948–956. [Google Scholar] [CrossRef] [Scilit]
  29. Ibrahim, M.; Ahmad, A.; Barry, M.S.; Alhems, L.M.; Suhoothi, A.C.M. Durability of structural lightweight concrete containing expanded perlite aggregate. Int. J. Concr. Struct. Mater. 2020, 14, 50. [Google Scholar] [CrossRef] [Scilit]
  30. Sreegovind, M.; Mini, K.M. Thermal Performance of Cement Mortar Incorporating Expanded Vermiculite as Partial Fine Aggregate Substitute. Procedia Struct. Integr. 2025, 70, 556–563. [Google Scholar] [CrossRef] [Scilit]
  31. Naik, B.G.; Nakkeeran, G.; Roy, D.; Alaneme, G.U. Investigating the potential of waste glass in paver block production using RSM. Sci. Rep. 2024, 14, 21508. [Google Scholar] [CrossRef] [Scilit]
  32. Viana, Q.S.; Eugênio, T.M.C.; Sabino, T.P.F.; Scolforo, J.R.S.; Mendes, R.F. Physical, mechanical, and thermal properties of concrete roof tiles produced with vermiculite. Environ. Sci. Pollut. Res. 2022, 29, 48964–48974. [Google Scholar] [CrossRef] [Scilit]
  33. Demirboğa, R.; Gül, R. The effects of expanded perlite aggregate, silica fume and fly ash on the thermal conductivity of lightweight concrete. Cem. Concr. Res. 2003, 33, 723–727. [Google Scholar] [CrossRef] [Scilit]
  34. Topçu, İ.B.; Işıkdağ, B. Effect of expanded perlite aggregate on the properties of lightweight concrete. J. Mater. Process. Technol. 2008, 204, 34–38. [Google Scholar] [CrossRef] [Scilit]
  35. Nishikant, K.; Nachiket, A.; Avadhut, I.; Sangar, A. Manufacturing of concrete paving block by using waste glass material. Int. J. Sci. Res. Publ. 2016, 6, 61–77. [Google Scholar]
  36. Nodehi, M.; Taghvaee, V.M. Sustainable concrete for circular economy: A review on use of waste glass. Glas. Struct. Eng. 2022, 7, 3–22. [Google Scholar] [CrossRef] [Scilit]
  37. IS 12269: 2013; Ordinary Portland Cement, 53 Grade—Specification. Bureau of Indian Standards: New Delhi, India, 2013.
  38. IS 383: 2016; Coarse and Fine Aggregate for Concrete—Specification. Bureau of Indian Standards: New Delhi, India, 2016.
  39. IS 9103: 1999; Concrete Admixtures—Specification. Bureau of Indian Standards: New Delhi, India, 1999.
  40. IS 10262: 2019; Concrete Mix Proportioning—Guidelines. Bureau of Indian Standards: New Delhi, India, 2019.
  41. IS 456: 2000; Plain and Reinforced Concrete—Code of Practice. Bureau of Indian Standards: New Delhi, India, 2000.
  42. IS 15658: 2021; Precast Concrete Blocks for Paving—Specification. Bureau of Indian Standards: New Delhi, India, 2021.
  43. IS 516: 2021; Method of Tests for Strength of Concrete. Bureau of Indian Standards: New Delhi, India, 2021.
  44. IS 1199 (Part 2): 2018; Fresh Concrete: Methods of Sampling, Testing and Analysis—Part 2: Determination of Consistency of Fresh Concrete (First Revision). BIS: New Delhi, India, 2018.
Figure 1. Factors contributing to urban heat island effect.
Infrastructures 11 00005 g001
Figure 2. Materials used.
Infrastructures 11 00005 g002
Figure 3. Mixing procedure.
Infrastructures 11 00005 g003
Figure 4. Slump cone test results.
Infrastructures 11 00005 g004
Figure 5. Density test results.
Infrastructures 11 00005 g005
Figure 6. 7-day compressive strength test.
Infrastructures 11 00005 g006
Figure 7. 14-day compressive strength test.
Infrastructures 11 00005 g007
Figure 8. 28-day compressive strength test.
Infrastructures 11 00005 g008
Figure 9. Thermal imaging gun and software interface.
Infrastructures 11 00005 g009
Figure 10. (a) Infra-Red Image (b) 3D Thermal Distribution Plot and (c) Line Graph Analysis for normal concrete.
Infrastructures 11 00005 g010
Figure 11. (a) Infra-Red Image (b) 3D Thermal Distribution Plot and (c) Line Graph Analysis for concrete with perlite replacement.
Infrastructures 11 00005 g011
Figure 12. (a) Infra-Red Image (b) 3D Thermal Distribution Plot and (c) Line Graph Analysis for concrete with vermiculite replacement4.3.4. Thermal Analysis of Concrete Mix with Crushed Glass Replacement.
Infrastructures 11 00005 g012
Figure 13. (a) Infra-Red Image (b) 3D Thermal Distribution Plot and (c) Line Graph Analysis for concrete with crushed glass replacement.
Infrastructures 11 00005 g013
Table 1. Physical properties of materials used.
Cement
Size10 to 20 μm
Specific Gravity3.15
Blaine Fineness340 m2/kg
Natural fine aggregates
Size0.15 to 4.75 mm
Specific Gravity2.65
Water Absorption2%
Natural coarse aggregates
Size<10 mm
Specific Gravity2.67
Water Absorption0.90%
Perlite
Specific Gravity0.302
Water Absorption37%
AppearanceWhite, granular
Vermiculite
Specific Gravity2.45
Water Absorption65%
AppearanceGolden-brown, flaky
Crushed glass powder
Specific Gravity2.32
Water Absorption0.20%
AppearanceLight green, angular
PCE–superplasticizer
Appearance/ColourLight Yellow to Brownish
Specific Gravity1.2
Chemical Name of Active IngredientPolycarboxylic Ether
pH7.3
Chloride Content0.002%
Density1050 kg/m3
FormLiquid
Optimum Dosage (Marsh Cone Results)0.7% by weight of cement
Table 2. Mix proportions (kg/m3).
Mix IDCementNatural Fine AggregatePerliteVermiculiteCrushed Glass PowderCoarse AggregateWaterChemical Admixture
NC340850---10061692.88
PR2034068015--9801712.88
PR4034051028--9501852.88
PR6034034044--9201972.88
PR8034017059--8902092.88
VC12.5340744-67-9701842.88
VC25340638-133-9352182.88
VC37.5340531-199-9002522.88
VC50340425-265-8652812.88
CG7.5340786--579261842.88
CG15340723--1149101912.88
CG22.5340659--1708282062.88
CG30340595--2267852152.88
Table 3. Overall comparison of temperature reduction across various mixes.
Sr. No.Mix idMaterial Replacement LevelMaximum Surface TemperatureMinimum Surface TemperatureTemperature Reduction Compared to Normal Concrete% Temperature Reduction as Compared to Normal Concrete
1NC-66.9051.400.000.00
2PR2041.0036.3015.1029.38
4046.9029.2022.2043.19
6059.6036.1015.3029.77
8064.6043.607.8015.18
3VC12.550.2034.6016.8032.68
2538.0026.3025.1048.83
37.556.6041.1010.3020.04
5059.9046.005.4010.51
4CG7.563.2049.501.903.70
1537.8033.2018.2035.41
22.565.4049.901.502.92
3067.7050.201.202.33
Footnote: The highlighted text shows the best replacement for each material.
Disclaimer/Publisher’s Note: The statements, opinions and data contained in all publications are solely those of the individual author(s) and contributor(s) and not of MDPI and/or the editor(s). MDPI and/or the editor(s) disclaim responsibility for any injury to people or property resulting from any ideas, methods, instructions or products referred to in the content.