1. Introduction
Electrified railways on steep gradients face significant challenges in maintaining a reliable power supply and minimizing voltage losses in the traction grid. In such conditions, the bidirectional power supply system offers notable advantages over the traditional unidirectional system. By eliminating the need for electrical split-phase insulators, the bidirectional system reduces power losses, voltage drops, and speed reductions at insulator sections. While countries like Germany and Russia have implemented alternating current (AC) bidirectional systems, the adoption of such systems is expected to grow as electrified railways with high performance standards, steep gradients, and heavy load demands continue to expand. However, the electrical configuration of the bidirectional system differs from that of conventional systems, leading to unique characteristics in electrical quantities during relay protection operations. Understanding these differences is critical for accurate fault location and detection [
1,
2,
3]. Therefore, it is essential to study the method for deriving key electrical quantities, such as traction grid currents, voltages, and impedances, during catenary-rail short-circuit faults at various locations in the bidirectional traction grid system.
Numerous studies have analyzed electrical quantities during short-circuit events in various traction grid configurations, employing mathematical models or simulation tools. For instance, several studies have modeled and simulated fully parallel AC traction power supply systems [
4,
5]. In refs. [
6,
7,
8], the impedance and current characteristics of unidirectional systems during short-circuit faults were examined, while refs. [
9,
10] proposed protection schemes based on the coordinated tripping of power supply arms, utilizing traction grid impedance and current behavior to identify fault types and minimize power outage duration.
The models used in the aforementioned studies are predominantly simulation-based, with some, such as refs. [
4,
5], neglecting the electrical couplings between different traction grid conductors. Some studies have also evaluated traction grid impedance and current distribution without considering short-circuit faults. The parallel multi-transmission line (MTL) theory is commonly used to model traction grids [
11,
12]. For instance, the integrated earth wire is modeled using the buried bare conductor method, with results validated by measured data [
11]. Ref. [
12] focused on the current-carrying capacity of the contact wire, while ref. [
13] analyzed the equivalent impedances of the rail and earth wire, examining their current distributions and the impact of grounding configurations on earth return current. Refs. [
14,
15] highlighted the reduction in rail-to-earth current return with the inclusion of return wires, finding that traction grid impedance plays a key role in earth return current. Ref. [
16] explored the influence of the integrated earth wire on rail potential and traction grid impedance in both direct and auto-transformer systems.
The traction grid system is a complex MTL system that includes transmission conductors including the contact wire and carrier cable, as well as return conductors such as the return cable, rails, and the earth. Previous models using the earth as the reference conductor may create a misconception that the earth serves as the return path for all conductors. Simplified models, like those based on Carson’s theory, often struggle to accurately determine current distribution, making it difficult to calculate earth current distribution [
12]. The multi-conductor loop (MLC) method [
17] addresses these limitations, overcoming Carson’s constraints. This approach has been further extended in refs. [
18,
19]. Specifically, ref. [
18] investigates the application of the MLC method to the impedance calculation of tunnel traction grids, while ref. [
19] applies the MLC method to the derivation of the comprehensive current-carrying capacity of traction grids. Capacitance, a critical parameter in power transmission, characterizes the system’s electric field and plays a key role in managing transient overvoltages and resonance issues [
20,
21].
Research on modeling bidirectional power supply systems is still limited. Some studies have derived formulas for current distribution, grid impedance, and voltage drop, with simulation models validating these theoretical results [
1,
2]. Notably, ref. [
2] incorporates inductive and capacitive coupling between grid conductors, offering a more comprehensive system analysis. In ref. [
3], the impedance of the traction grid for various parallel configurations in a double-track system was derived, along with a comparative simulation of existing and tree-like bidirectional power supply schemes. The results show that the bidirectional system not only improves power supply capacity but also enhances the utilization of regenerative braking energy.
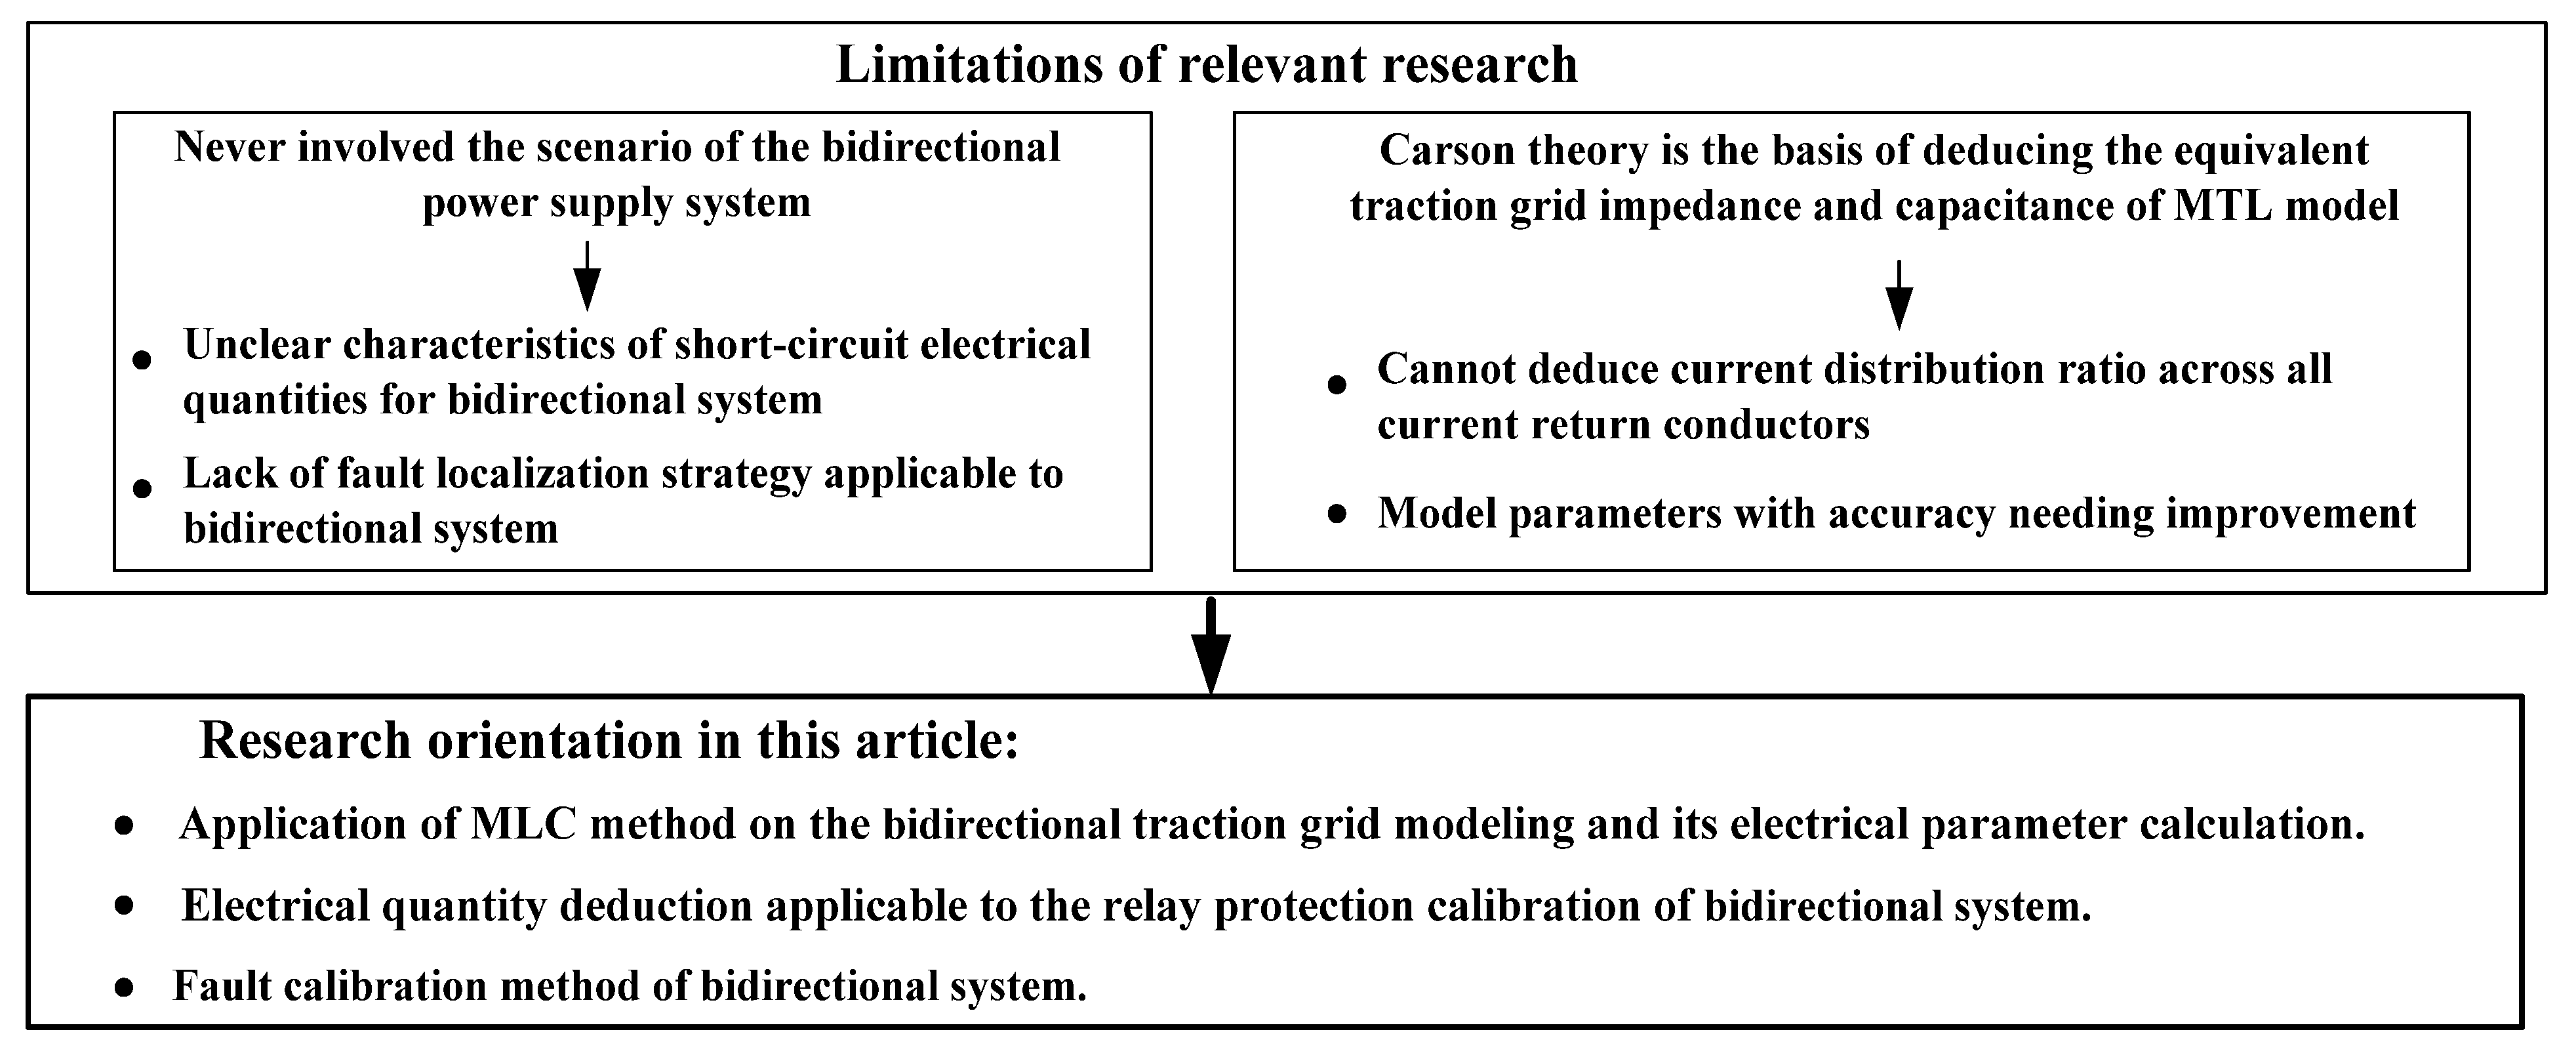
Figure 1 highlights the limitations of existing research on electrical quantity derivation and relay protection calibration for short-circuit faults in railway traction grids, positioning the present study. Building on prior works, this paper introduces a novel approach for accurately deriving electrical quantities and calibrating faults in bidirectional traction grid systems. The main contributions are as follows.
(1) This study is the first to focus specifically on relay protection for bidirectional traction grid systems, addressing the added complexity of their electrical structure compared to unidirectional systems.
(2) A multi-loop circuit (MLC) method is employed to model the bidirectional traction grid and calculate its electrical parameters. This approach offers two key advantages:
It accounts for the inherent characteristics of the traction grid, which consists of multiple loops, based on spatial electromagnetic theory.
It overcomes the limitations of traditional models by enabling the accurate determination of current distribution across all of return conductors, including the earth return path.
As a result, the calculated equivalent impedance parameters represent the actual operating conditions of the traction power supply system more accurately than conventional methods based on Carson’s theory.
(3) A four-step fault calibration process for relay protection in bidirectional power supply systems is presented.
The remainder of this paper is organized as follows:
Section 2 develops the traction grid model based on MLC theory, focusing on a direct bidirectional power supply system with the return cable. The self and mutual electrical parameters of each loop circuit are derived, and the system’s overall equivalent resistance and inductance are determined by analyzing the current distribution across all return conductors.
Section 3 details the calculation method for electrical quantities, with validation through comparison to measured data.
Section 4 introduces a fault calibration strategy for relay protection, and
Section 5 concludes the study.
2. Traction Grid Modeling and Parameter Deduction
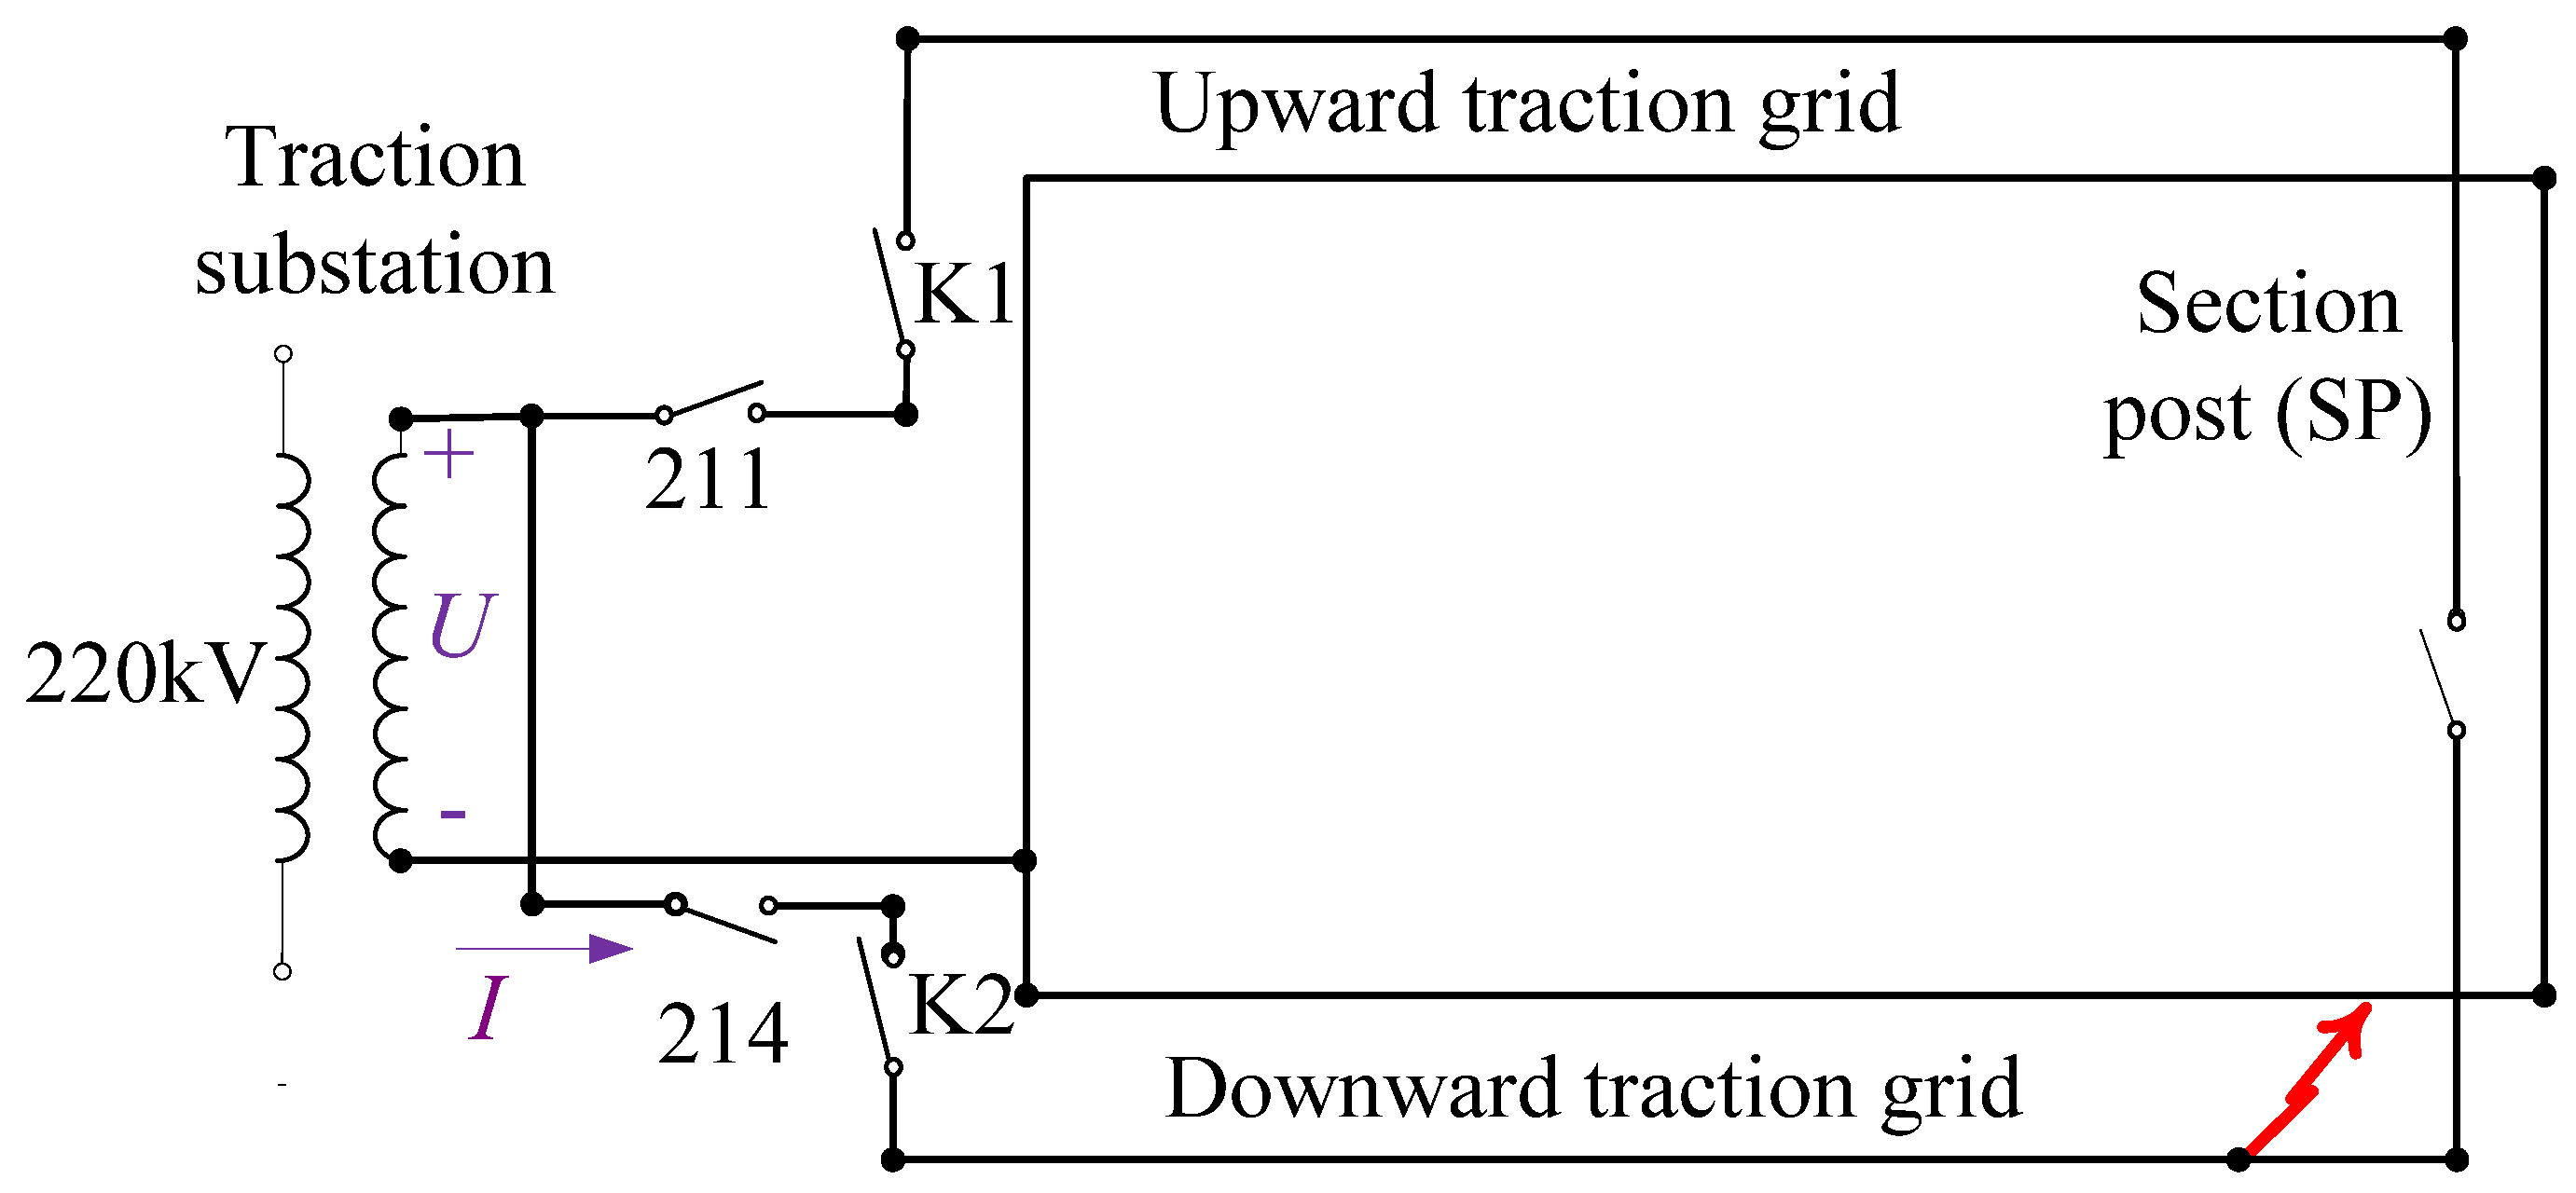
In this section, the traction grid modeling is conducted, and the equivalent impedance is determined using the MLC theory. The bidirectional traction power supply system analyzed in this paper adopts a direct traction power supply system with the return cable, and it operates between two adjacent substations. As shown in
Figure 2, the system is divided into two protection zones by a section post (SP) located at the midpoint. Each substation supplies power to its respective zone through upward and downward feeders, while return currents flow through dedicated return cables, rails, and the earth path. Under normal operation, both substations feed the system simultaneously, and the SP remains closed, allowing bidirectional feeding to balance load sharing and improve voltage profiles. In fault conditions, the protection devices in the corresponding zone detect and isolate the faulted section according to the relay calibration strategy described in this study.
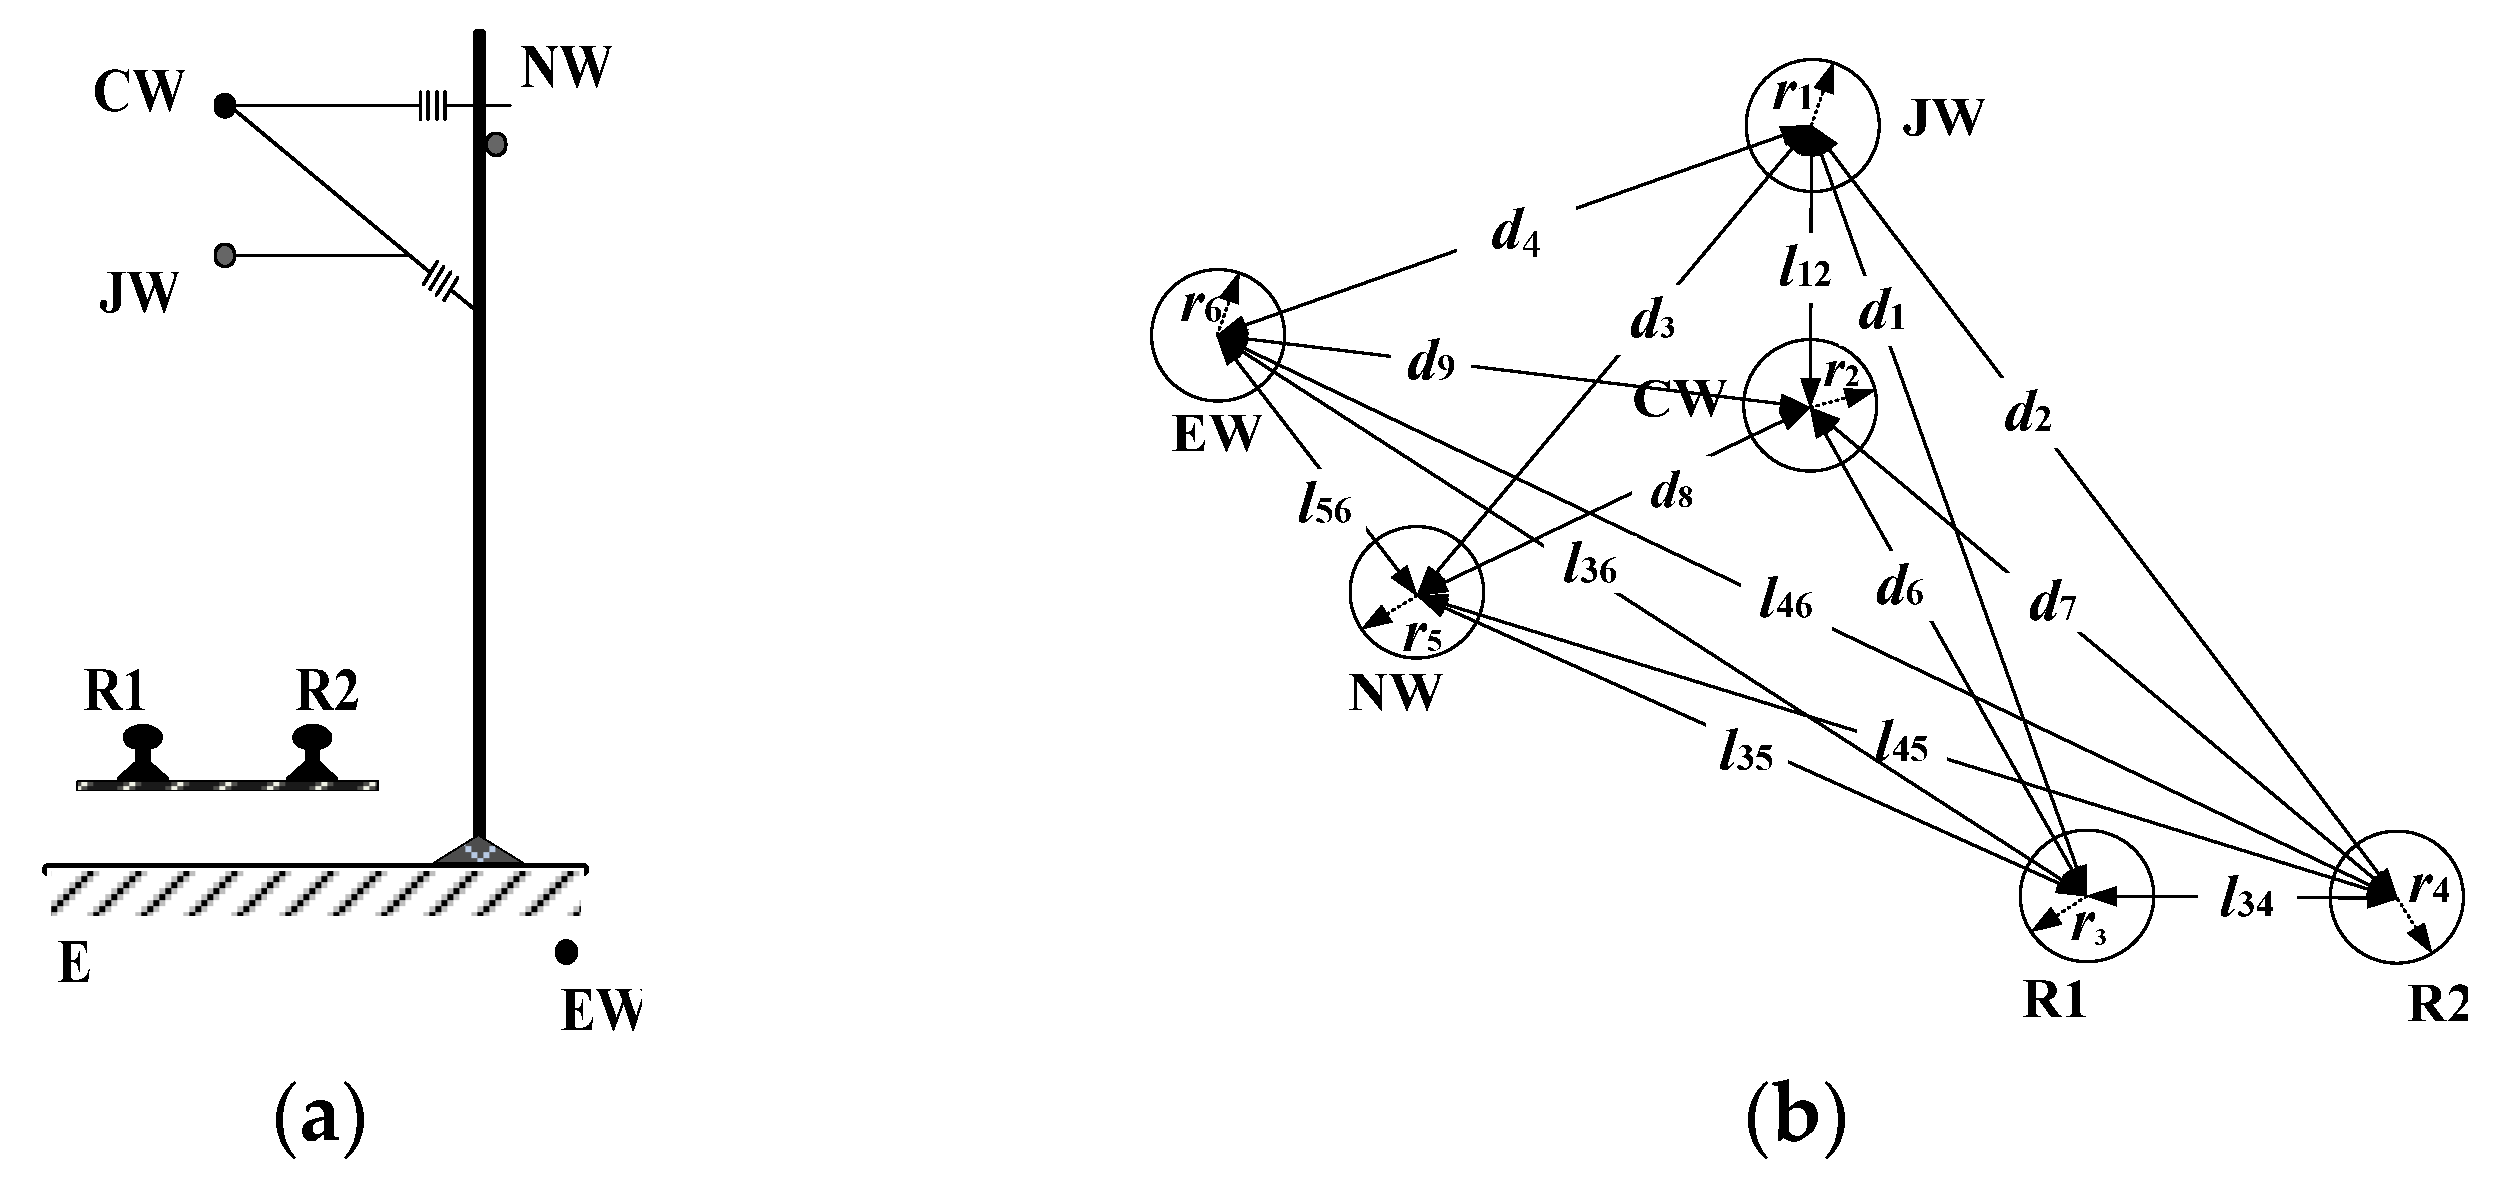
The analyzed grid system structure, namely a direct traction power supply system with the return cable, is illustrated in
Figure 3a. The key parameters for each traction grid conductor analyzed in this paper are listed in
Table 1.
In this figure, the carrier cable, contact wire, two rails, return cable, integrated earth wire, and the earth are labeled as CW, JW, R1 (R2), NW, EW, and E, respectively. The radius and location parameters of the transmission and return conductors are depicted in
Figure 3b. Here, CW and JW serve as the transmission conductors, while R1, R2, NW, EW, and E function as the return conductors. These conductors form an MLC circuit system.
As shown in
Table 2, JW and all return conductors constitute loop circuits 1–5, with the distances between two conductors in each loop circuits (1–4) designated as
d1 to
d4. Similarly, CW and the return conductors form the loop circuits 6–10. The radii of JW, CW, R1, R2, NW, and EW are denoted as
r1 to
r6. The distances between CW and JW, R1 and R2, R1 and NW, R1 and EW, R2 and NW, R2 and EW, and NW and EW are specified as
l12,
l34,
l35,
l36,
l45,
l46, and
l56, respectively.
2.1. Loop Circuit Matrix Modeling and Inductance Calculation
Based on the loop circuits presented in
Table 2, an inductance coefficient matrix is formulated, where the self inductance and mutual inductance components are derived using spatial magnetic field theory. By considering each traction grid loop circuit in
Table 2, the inductance matrix
L is expressed in Equation (1), where
lii represents the self inductance of loop circuit
i, and
lij denotes the mutual inductance between loop circuits
i and
j, satisfying the symmetric property
lij =
lji.
The loop circuits can be categorized into non-earth current return loop circuits and earth current return loop circuits, with the self inductance coefficients varying depending on the circuit type. As an example, Loop circuit 1 in
Table 2 is used to derive the general formula for a non-earth current return loop circuit. Let the current in Loop circuit 1 be denoted as
I1, and the current in Rail 1 be −
I1, together forming the basic spatial magnetic field unit. Applying the magnetic flux calculation formula between two conductors, the self inductance
l11 can be expressed as
where
μ represents the magnetic permeability, and
r1 and
r3 denote the radii of the contact cable and Rail 1, respectively. Using a similar approach, the self inductance coefficients for the other non-earth current return loop circuits, specifically loops 2–4 and 6–9, denoted as
lii (
i = 2, 3, 4, 6, 7, 8, 9), can be determined accordingly.
Loop circuit 5 and Loop circuit 10 correspond to the earth current return loop circuits. The self inductance values
l55 and
l1010 for these loops are given by
where
is the earth equivalent depth,
ρ is the earth resistivity (Ω·m),
f is the frequency, and
r1 and
r2 in order are the radius of the contact cable and carrier cable shown in
Figure 3b.
Next, the mutual inductance between loop circuits
i and
j, denoted as
lij =
lji, is calculated. As an example, the mutual inductance between loops 1 and 7,
l17, is derived. Using the flux linkages
Ψ1 and
Ψ2 (where
Ψ1 and
Ψ2 are the fluxes generated by the current
I1 in loop circuit 1 through the contact cable and Rail 1, respectively, in the loop circuit 7), the total magnetic flux
Ψ1 +
Ψ2 that is induced by loop 1 in loop 7 is calculated. The mutual inductance
l17 is then expressed as
Similarly, the mutual inductance lij between the non-earth current return loops and earth current return loops is obtained.
2.2. Derivation of Traction Grid Impedance
Let the resistance per unit length of conductors JW, CW, R1, R2, NW, EW, and E be denoted as R1, R2, ⋯, R7, respectively, and the equivalent resistance of the traction grid is represented by R. The following considerations are made:
(1) Self-resistance within each loop circuit: This is the sum of the resistances of the transmission and return conductors forming each loop, represented by the diagonal elements of the equivalent resistance matrix R.
(2) Mutual resistance between loop circuits sharing transmission or return conductors: The mutual resistance equals the resistance of the shared conductor, determined by the current and voltage drop across the conductor.
(3) Mutual resistance between independent loop circuits: For circuits that do not share transmission or return conductors, mutual resistance is considered negligible and assumed to be zero.
Therefore, the equivalent resistance of the traction grid,
R (symmetric matrix), can be expressed as
where
ones(5, 5) denotes a 5-dimensional matrix with all elements equal to 1, and diag(*) denotes a diagonal matrix.
Based on Equations (1) and (5), the per-unit-length impedance matrix for each loop circuit is given by
Assume that ∆
U1, ∆
U2, ⋯, ∆
U10 in order represent the voltage drops across the loop circuits from 1 to 10 and
I1,
I2, ⋯,
I10 denote the currents in the respective loops. Given that the 10 loop circuits are connected in parallel and assuming that
I0 is the total current of all transmission or return conductors, the voltage drops can be expressed as ∆
U1 = ∆
U2 = ⋯ = ∆
U10 = ∆
U. Additionally, the total current is the sum of the individual loop currents, such that
I1 +
I2+⋯+
I10 =
I0. The current distribution coefficients for the 10 loops are defined as
k1,
k2, ⋯,
k10, where the loop currents are given by
I1 =
k1I0,
I2 =
k2I0, ⋯,
I10 =
k10I10. Based on the relationship between the voltage drop and magnetic flux in each loop, we can derive the mathematical relationship between the voltage drop, inductance, and current for each individual loop circuit.
The equivalent unit-length traction grid impedance
Z is then derived by
Based on Equation (8), to obtain the impedance value
Z, it is necessary to determine the current distribution coefficients,
k1,
k2, ⋯,
k10. Since the 10 loops are connected in parallel (i.e., ∆
U1 = ∆
U2= ⋯ =∆
U10 = ∆
U) and given that
I1 =
k1I0,
I2 =
k2I0, ⋯,
I10 =
k10I10, assuming ∆
U = 1, Equation (7) can be transformed into Equation (9) as shown below. Therefore, the coefficients
k1,
k2, ⋯,
k10 can be derived from Equation (9).
2.3. Modeling and Validation for Bidirectional Traction Power Supply Systems
Existing studies fully demonstrated that the calculated equivalent impedance parameters using the MLC method better reflect the actual operating conditions of the traction power supply system compared to conventional methods based on Carson’s theory [
17,
18,
19]. To demonstrate the effectiveness and accuracy of the MLC method modeling and the calculation of traction grid impedance parameters, short-circuit experiments were conducted on the Chinese railway line from Chongqing to Lichuan. These experiments were carried out on the feeding arm between Shizhu and Tun Siba. The traction grid system of this line adopts a double-track configuration with a return line direct power supply method.
Figure 4 shows the short-circuit circuit diagram (red arrow represents short-circuit fault,
U and
I in order indicate traction grid voltage and feeder current), and it shows that a parallel substation is installed at the feeding arm midpoint, while a section post (SP) is located at the end. This configuration allows for separate, end parallel, and full parallel power supply modes.
Based on the field test data of terminal parallel power supply and terminal short-circuit conditions at the feeder, the substation bus voltage is 15.64 kV, the recorded current at the 211 circuit breaker of the upward feeder is 2045 A with an impedance angle of 70.6°, and the feeder length is 20.1 km. The current at the 214 circuit breaker of the downward feeder is 1987 A with an impedance angle of 70.7°, and the feeder length is 20.1 km. From the measurements, the unit-length equivalent impedance of the upward, downward, and overall traction grid systems in order are (0.1264 + j0.3589) Ω/km, (0.1294 + j0.3696) Ω/km, and (0.0639 + j0.1821) Ω/km.
According to the electrical configuration and parameters of the traction grid given in
Figure 2 and
Figure 3 and
Table 1, theoretical values were obtained using the MLC method described in this paper, where the unit-length upward or downward grid equivalent impedance is (0.1206 + j0.3779) Ω/km and the overall unit-length equivalent impedance is (0.0603 + j0.1889) Ω/km. These results were compared with test results, which show that the magnitude errors are 4.08%, 1.28%, and 2.35%, while the angle errors are 2.35%, 2.21%, and 2.26%, respectively, indicating a high degree of agreement between the experimental and theoretical results.
3. Derivation of Electrical Quantities
This section demonstrates the derivation of electrical quantities based on the impedance parameters of the bidirectional traction grid system, as shown in
Figure 2. Due to the symmetry of the power supply systems on both sides of the SP and identical methods for deriving short-circuit electrical quantities, the analysis focuses on the left side of the SP.
In the power supply system shown in
Figure 2, the length of each power supply arm on either side of the SP is 20 km, with the distances between the substation and parallel station (PS) and between PS and SP both being 10 km. The traction grid is fed by a 220 kV incoming source with a short-circuit capacity of 2000 MVA. The traction transformer uses a Vv wiring configuration with a 25 MVA capacity and a short-circuit impedance of 10.5%. The rated load power at the feeder end is 11,000 kW, with a power factor of approximately 1. As the parameters and structure of the upward and downward traction grids are identical, the solution processes and results for current distribution and integrated traction grid impedance are the same. Therefore, only the short-circuit fault in the upward traction grid is considered.
For fault localization, currents through the circuit breakers at the substation, PS, and SP must be calculated, as they vary depending on the fault location. As seen in
Figure 2, the traction grid system is divided into two regions by the PS: the first region between the substation and PS, and the second region between the PS and SP. Fault may occur in either region. In
Figure 2, 2QF, 5QF, and 7QF represent the circuit breakers connecting Substation 1, PS 1, and SP to the upward traction grid. The short-circuit current is denoted as
id, with currents through 2QF, 5QF, and 7QF labeled as
iq,
ip and
is. The current derivation involves three steps: first, considering only Substation 1 as the power supply; second, considering only Substation 2; and third, combining the results from the first two steps. When only Substation 1 is the power supply, the short-circuit current and the currents through the 2QF, 5QF, and 7QF are denoted as
id1,
iq1,
ip1, and
is1, respectively; when only Substation 2 is the power supply, the above currents are denoted as
id2,
iq2,
ip2, and
is2. The total currents are
id =
id1 +
id2,
iq =
iq1 +
iq2,
ip =
ip1 +
ip2, and
is =
is1 +
is2. The unit-length traction grid impedance, substation impedance, PS impedance, and SP impedance are denoted as
Z1,
Zq,
Zp, and
ZS, respectively.
3.1. Deduction for the First Region
The distance between Substation 1 and fault location is marked as
x. As shown in
Figure 5a, when only Substation 1 is supplying electric power during a short-circuit event, the upward and downward currents from Substation 1 converge at the short-circuit point through the left and right sides, respectively. The relationship between
iq1,
ip1, and
id1 is given by Equation (10) and the short-circuit current
id1 is calculated by
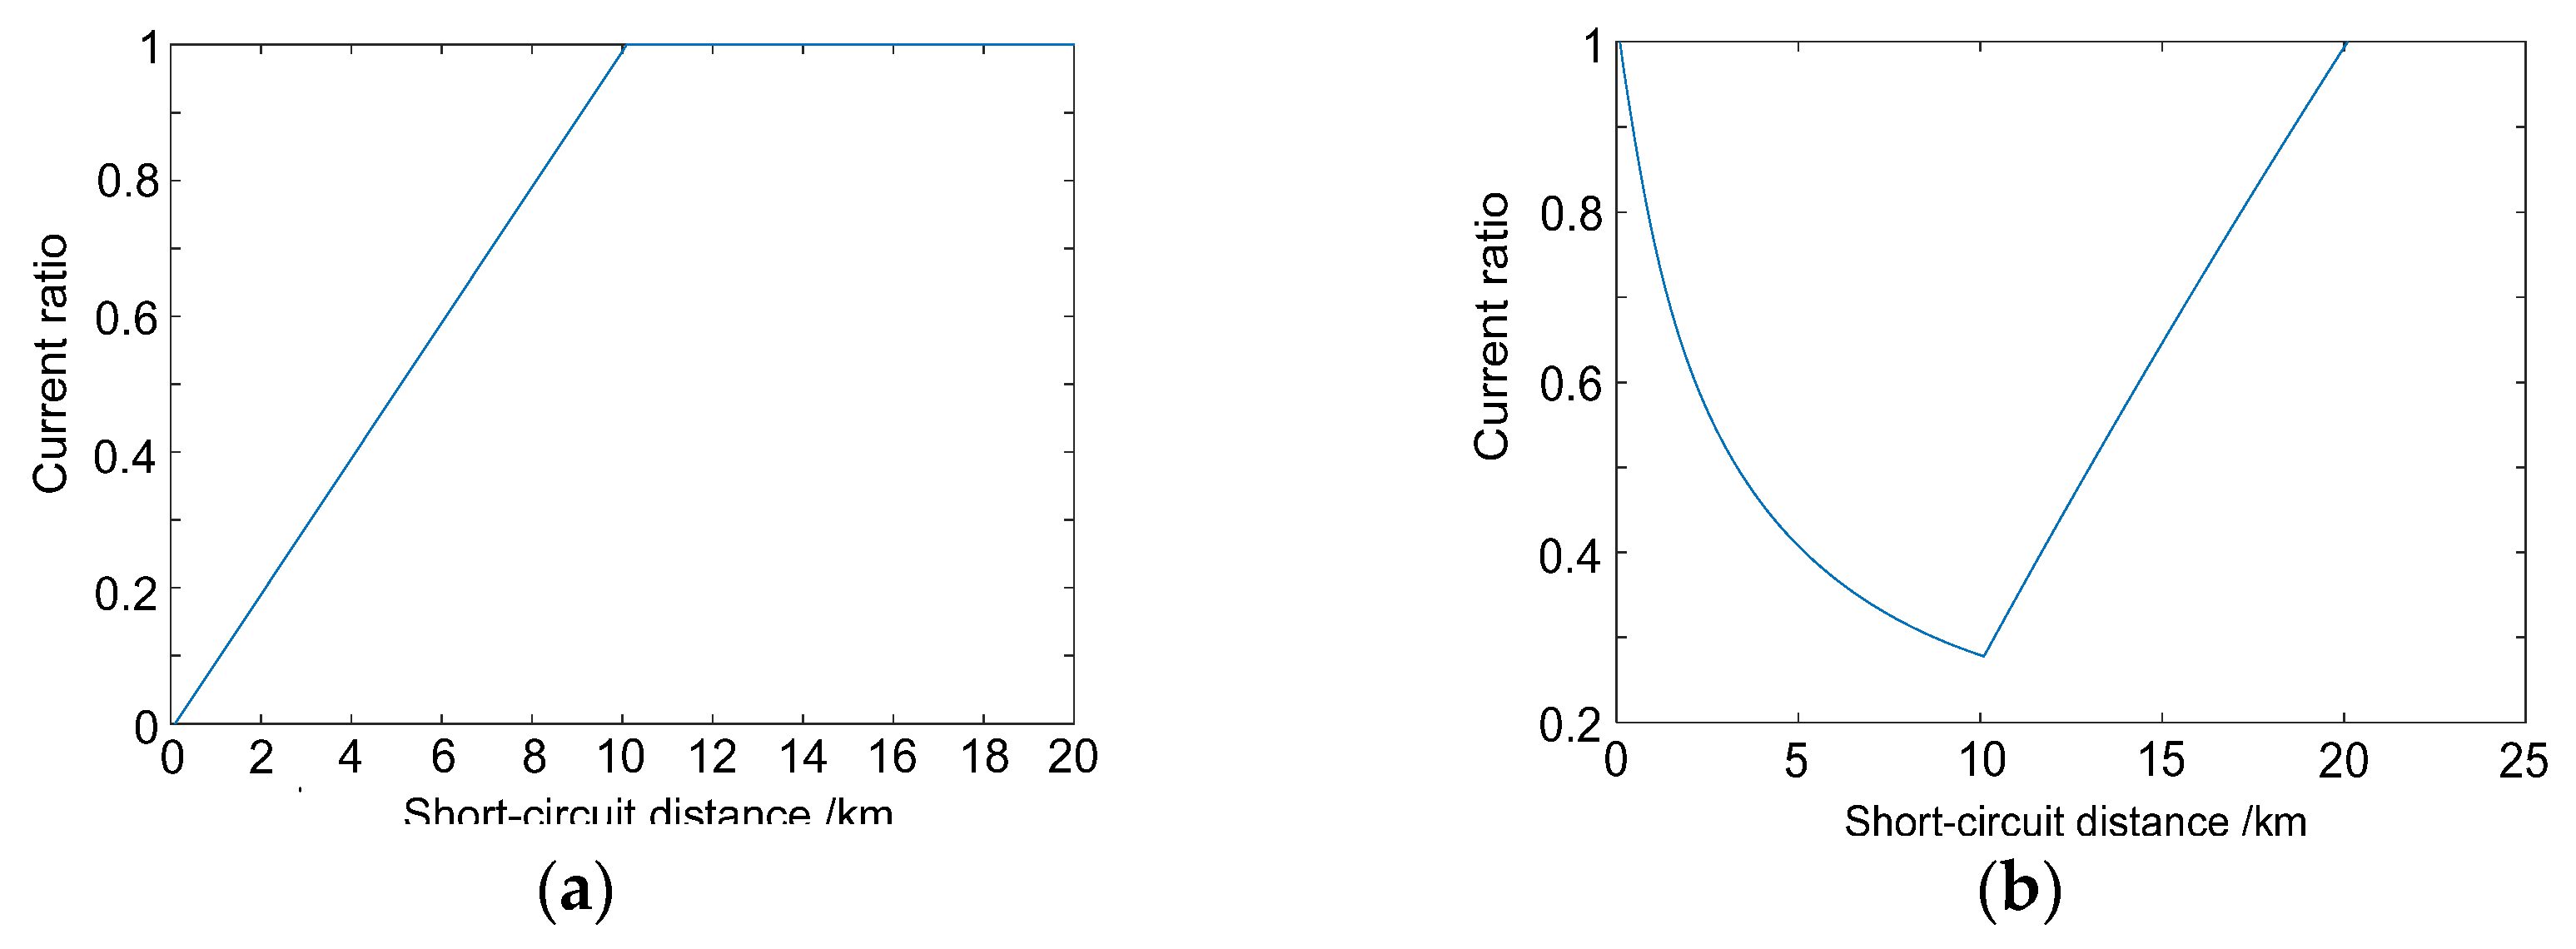
Based on Equations (10) and (11), the curves for the amplitudes of
iq1,
ip1, and
id1 varying with different short-circuit points between Substation 1 and PS 1 are shown in
Figure 5b. As can be observed from the figure, the highest short-circuit current amplitude occurs when the fault is located at the substation.
As shown in
Figure 6a, when only Substation 2 is supplying electric power and a short circuit occurs, the upward and downward grid currents on the section between PS 1 and SP are evenly split, with each carrying half of the short-circuit current
id2. Thus,
is2 =
id2/2. In the region between Substation 1 and PS 1, the relationship between
iq2,
ip2, and
id2 is given by
The short-circuit current
id2 is calculated using the formula presented in Equation (13).
Based on the derivations from Equations (12) and (13), the amplitude curves of
iq2,
ip2, and
id2 for different fault locations are obtained in
Figure 6b. By combining the results from both sections, the total short-circuit current under dual-substation supply is obtained in
Figure 7b. The figure displays the amplitudes of
id and the currents through Substation 1, PS 1, and SP at the upward traction grid circuit breakers, denoted in order as
iq,
ip, and
is. Notably, the short-circuit current reaches a maximum of approximately 12,000 A when the fault is at the substation.
3.2. Deduction for the Second Region
The distance between PS 1 and fault location is marked as x. As shown in
Figure 8a, when only Substation 1 is supplying power and a short circuit occurs, the currents in the upward and downward traction grid between Substation 1 and PS 1 are evenly split, each carrying half of the short-circuit current
id1. Thus,
iq1 =
id1/2. For the section between PS 1 and SP, the relationship between
ip1,
is1, and
id1 is given by Equation (14) and the calculation of
id1 is provided by Equation (15).
Using Equations (14) and (15), the amplitude curves of
iq1,
ip1, and
id1 for different fault locations between PS 1 and SP are shown in
Figure 8b. The highest short-circuit current amplitude occurs when the fault is at the far-left position (PS 1), reaching approximately 7000 A.
As shown in
Figure 9a, when Substation 2 is the sole power supply and a short circuit occurs between PS 1 and SP, the upward and downward currents from Substation 2 pass through SP, converging at the fault location from both sides. The relationship between
id2,
ip2, and
is2 is expressed as
The short-circuit current
id2 is calculated using Equation (17).
The amplitude curves of
iq2,
ip2, and
id2 for various short-circuit distances, derived from Equations (16) and (17), are shown in
Figure 9b. Notably, the highest short-circuit current amplitude at the SP exceeds 5000 A. Combining the results from both sections,
Figure 10b presents the amplitude curves of
id,
iq,
ip, and
is as the two substations jointly supply the fault current.
Figure 11 and
Figure 12 illustrate the Thévenin impedance, monitoring current and voltage amplitudes at the substation, PS 1, and SP, as well as the changes in transverse current ratios with varying fault distances. From figures, with PS 1 serving as the boundary, the variation trends of certain voltage, current, and Thévenin impedance values with fault distance are clearly distinguishable. Some parameters show a linear relationship with fault distance in certain sections, while others exhibit nonlinear behavior in different segments. These variations will be incorporated into the fault calibration methodology presented in the next section.
4. Fault Calibration Strategy
In this section, a fault calibration method is presented, outlined in four steps. Let
Zq denote the equivalent substation impedance,
Zp the PS impedance,
Z1 the unit length impedance of the traction grid, and
uS substation voltage. The first two steps follow the electrical quantity derivation process outlined in
Section 3, while the last two steps utilize the fault distance-dependent electrical quantity variation curves such as
Figure 11 and
Figure 12.
4.1. Step 1: Module Division and Derivation of Electrical Quantity Relationships
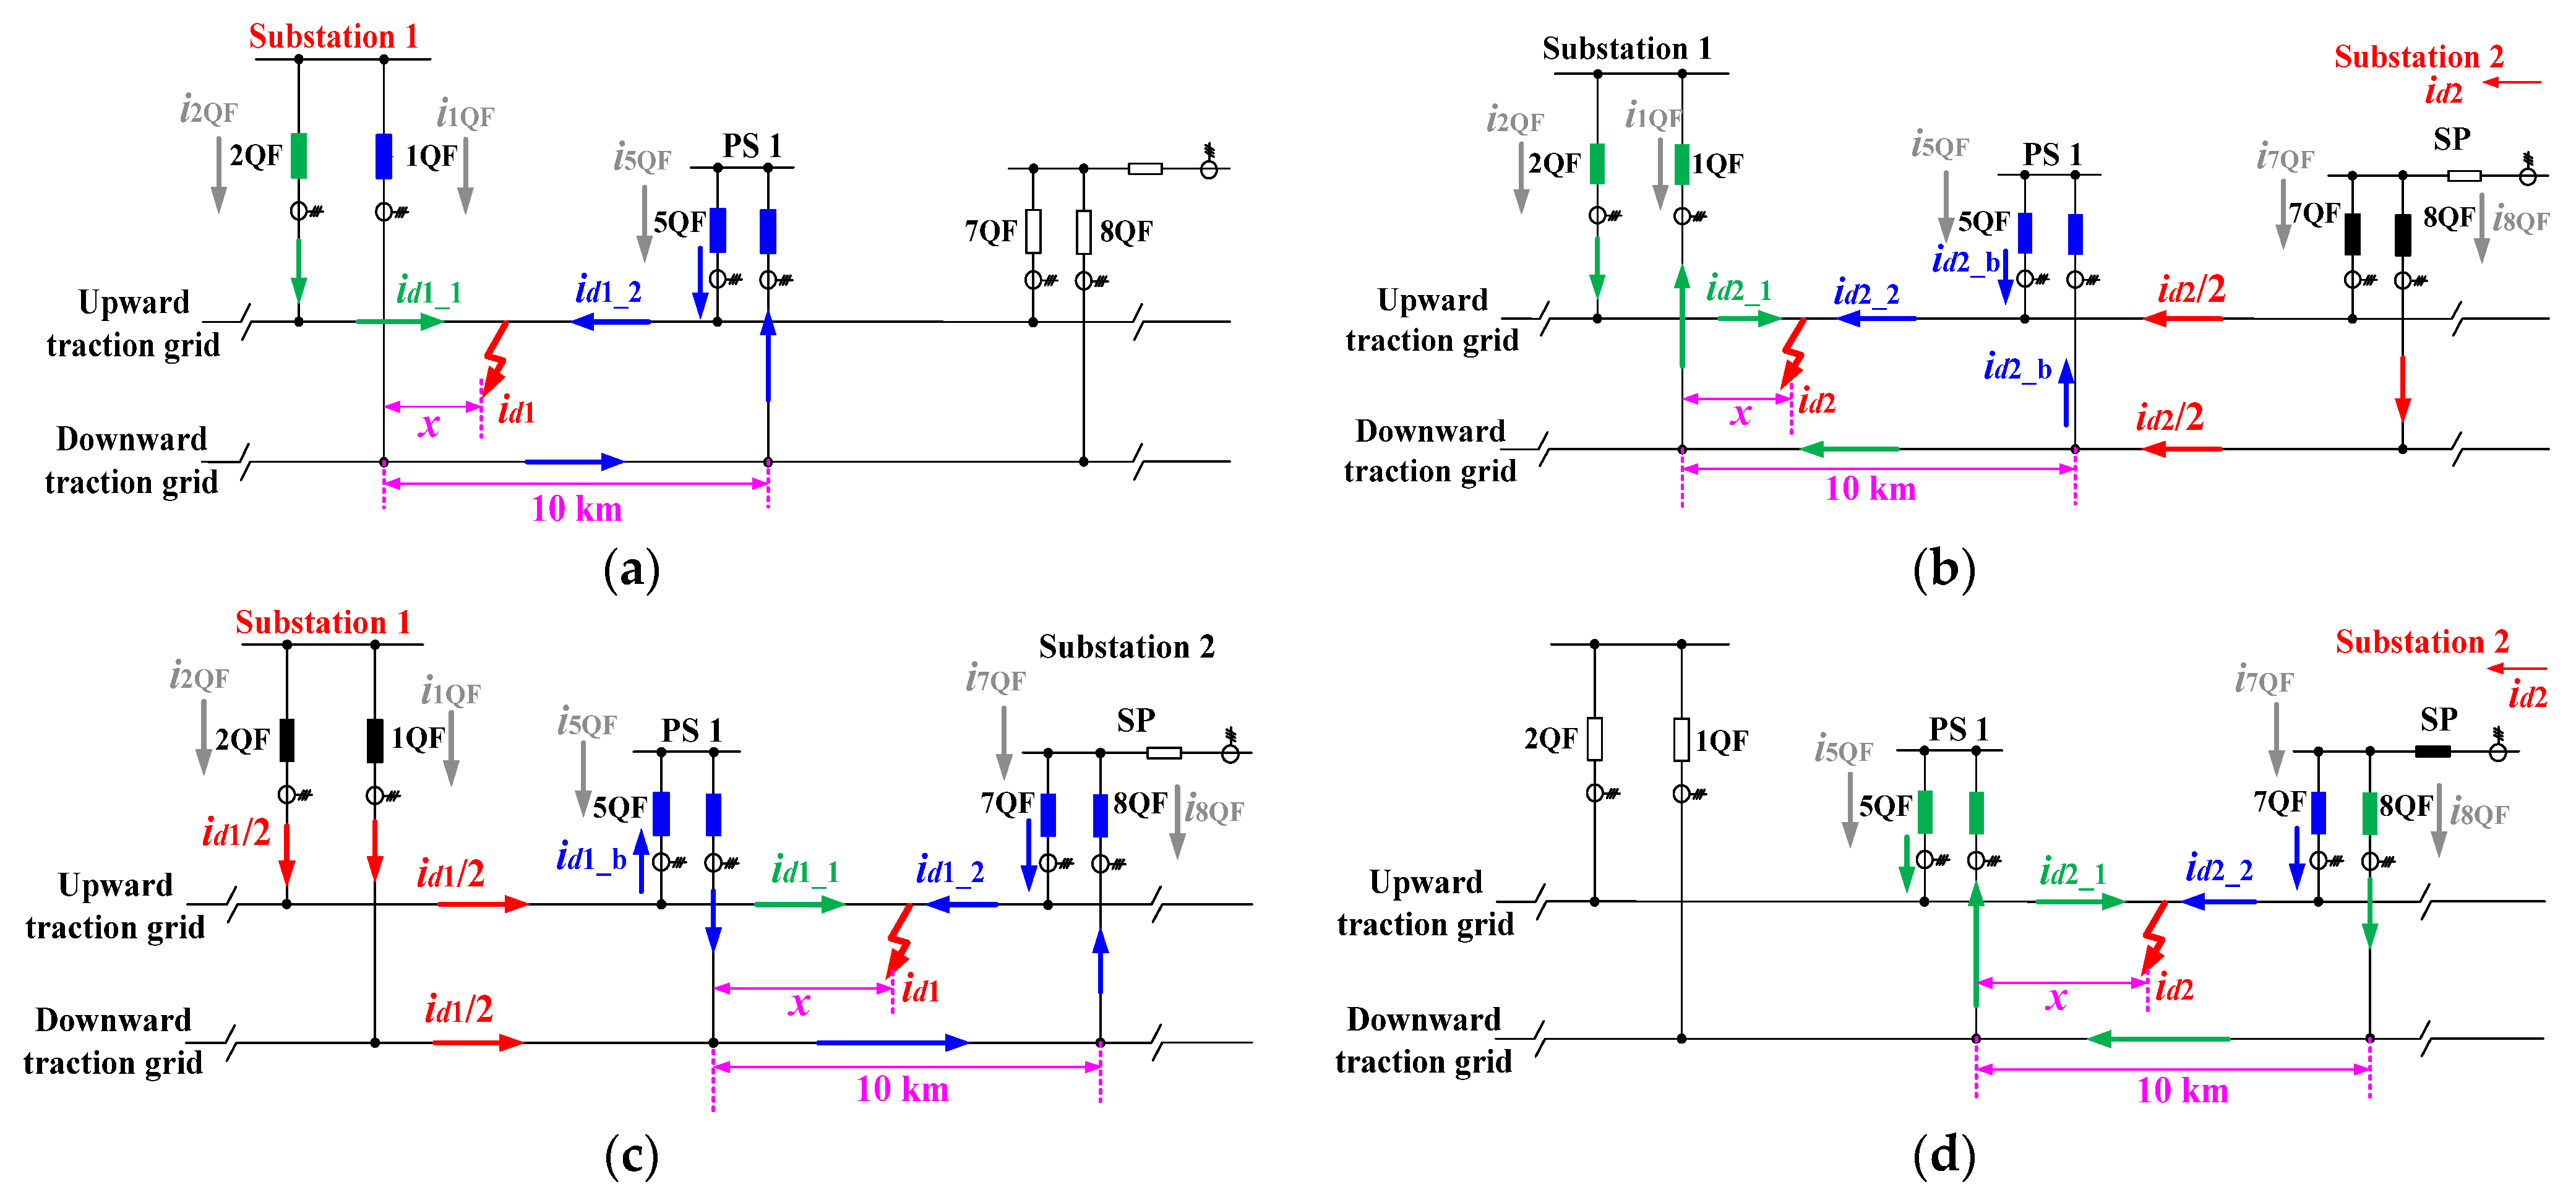
The analysis divides the system into four modules, considering the fault point’s distance from PS 1, as shown in
Figure 13. In
Figure 13a,b, x denotes the distance between Substation 1 and the fault location, while in
Figure 13c,d, it denotes the distance between PS 1 and the fault location. The short-circuit current distribution between adjacent substations and the equivalent traction grid impedance are analyzed.
(a) First Module:
The fault occurs between Substation 1 and PS 1, with the short-circuit current generated solely by Substation 1. As seen in
Figure 13a, the current
id1 consists of
id1_1 and
id1_2, flowing through 2QF and 1QF of Substation 1, respectively. Since the upward and downward traction grid loops are in parallel, the ratio of
id1_1 to
id1_2 is inversely proportional to to their circuit lengths. The
and
can be obtained and the relationship between
id1 and
us is given by
(b) Second Module:
The fault occurs between Substation 1 and PS 1, with Substation 2 as the only voltage source. The current
id2_1 flows through the 2QF of Substation 1, while
id2_2 consists of currents through the 7QF of SP and 5QF of PS 1. In the downward traction grid of PS 1, i
d2/2 is split, with part flowing from Substation 1 to the fault and part flowing from PS 1 to the fault. The ratio of
id2_1 to
id2_b is inversely proportional to the loop lengths, leading to
,
,
, and Equation (19).
(c) Third Module:
The fault occurs between PS 1 and SP, with Substation 1 as the only source. From
Figure 13c, the id1 consists of
id1_1 and
id1_2, where
id1_1 is the sum of currents through 2QF and 5QF, while
id1_b and
id1_2 are the currents of 5QF and 7QF, respectively. At the upward traction grid of PS 1,
id1/2 splits, with part flowing through the SP to the fault (
id1_2) and part through PS 1 to the fault (
id1_b). The ratio of
id1_2 to
id1_b is inversely proportional to their loop lengths. As a result,
,
,
, and Equation (20) are gained.
(d) Fourth Module:
The fault occurs between the PS 1 and SP with Substation 2 as the only source. The
id2 consists of
id2_1 and
id2_2, with their ratio inversely proportional to the loop lengths, leading to the relations
,
, and Equation (21).
4.2. Step 2: Source Superposition and Plotting of Fault Distance-Based Electrical Quantity Curves
When the fault occurs between Substation 1 and PS 1, as shown in the circuit of
Figure 13a,b, the current through the downward feeder breaker 1QF at Substation 1 is
i1QF =
id1_2 −
id2_1; the current through the upward feeder breaker at Substation 1 is
i2QF =
id1_1 +
id2_1; the current through the PS 1 breaker 5QF is
i5QF =
id1_2 +
id2_b; the current through the SP breakers is
i7QF =
i8QF =
id2/2; and the current through the upward or downward breaker at Substation 2 is
id2/2.
When the fault occurs between PS 1 and SP, the current through both the upward and downward feeder breakers at Substation 1 is i1QF = i2QF = id1/2; the current through the PS 1 breaker is i5QF = id2_1 − id1_b; the current through the SP upward breaker is i7QF = id1_2 + id2_2; the current through the SP downward breaker is i8QF = id2_1 − id1_2; and the current through the upward or downward breaker at Substation 2 is id2/2.
The current functions for the substation feeder breakers, PS 1 breakers, and SP breakers are monitored at key nodes, and the corresponding graphs are plotted.
4.3. Step 3: Identification of Traction Grid Fault Section
To determine the fault section relative to PS 1, the Thévenin equivalent impedance of the fault feeder at the corresponding substation is monitored. The following identification can be performed, taking
Figure 11c as an example:
As the fault is between Substation 1 and PS 1, the Thévenin equivalent impedance increases linearly with fault distance.
As the fault is between PS 1 and SP, the Thévenin equivalent impedance does not vary linearly with fault distance.
Thus, monitoring the impedance, the fault section can be identified. If the impedance is below the theoretical value of 10 km, the fault lies between Substation 1 and PS 1; otherwise, it is between PS 1 and SP.
Additionally, the current direction through the incoming line breakers or busbar breakers at the SP helps determine the fault region relative to the two substations. By referencing the directions of fault currents, we can determine whether the fault is located on the upward or downward feeder.
4.4. Step 4: Determination of Fault Location
The location is typically determined using the cross-link current ratio curves. For example, as shown in
Figure 13:
As the fault is between Substation 1 and PS 1, the current through the upward and downward feeders at Substation 1 and the PS 1 current are monitored. The specific location is calculated based on the linear variation in the current ratio curve of
Figure 13a.
As the fault occurs between PS 1 and SP, the current through PS 1 and SP is monitored, and the fault location is determined using the linear variation in the cross-link current ratio curve (
Figure 13b).
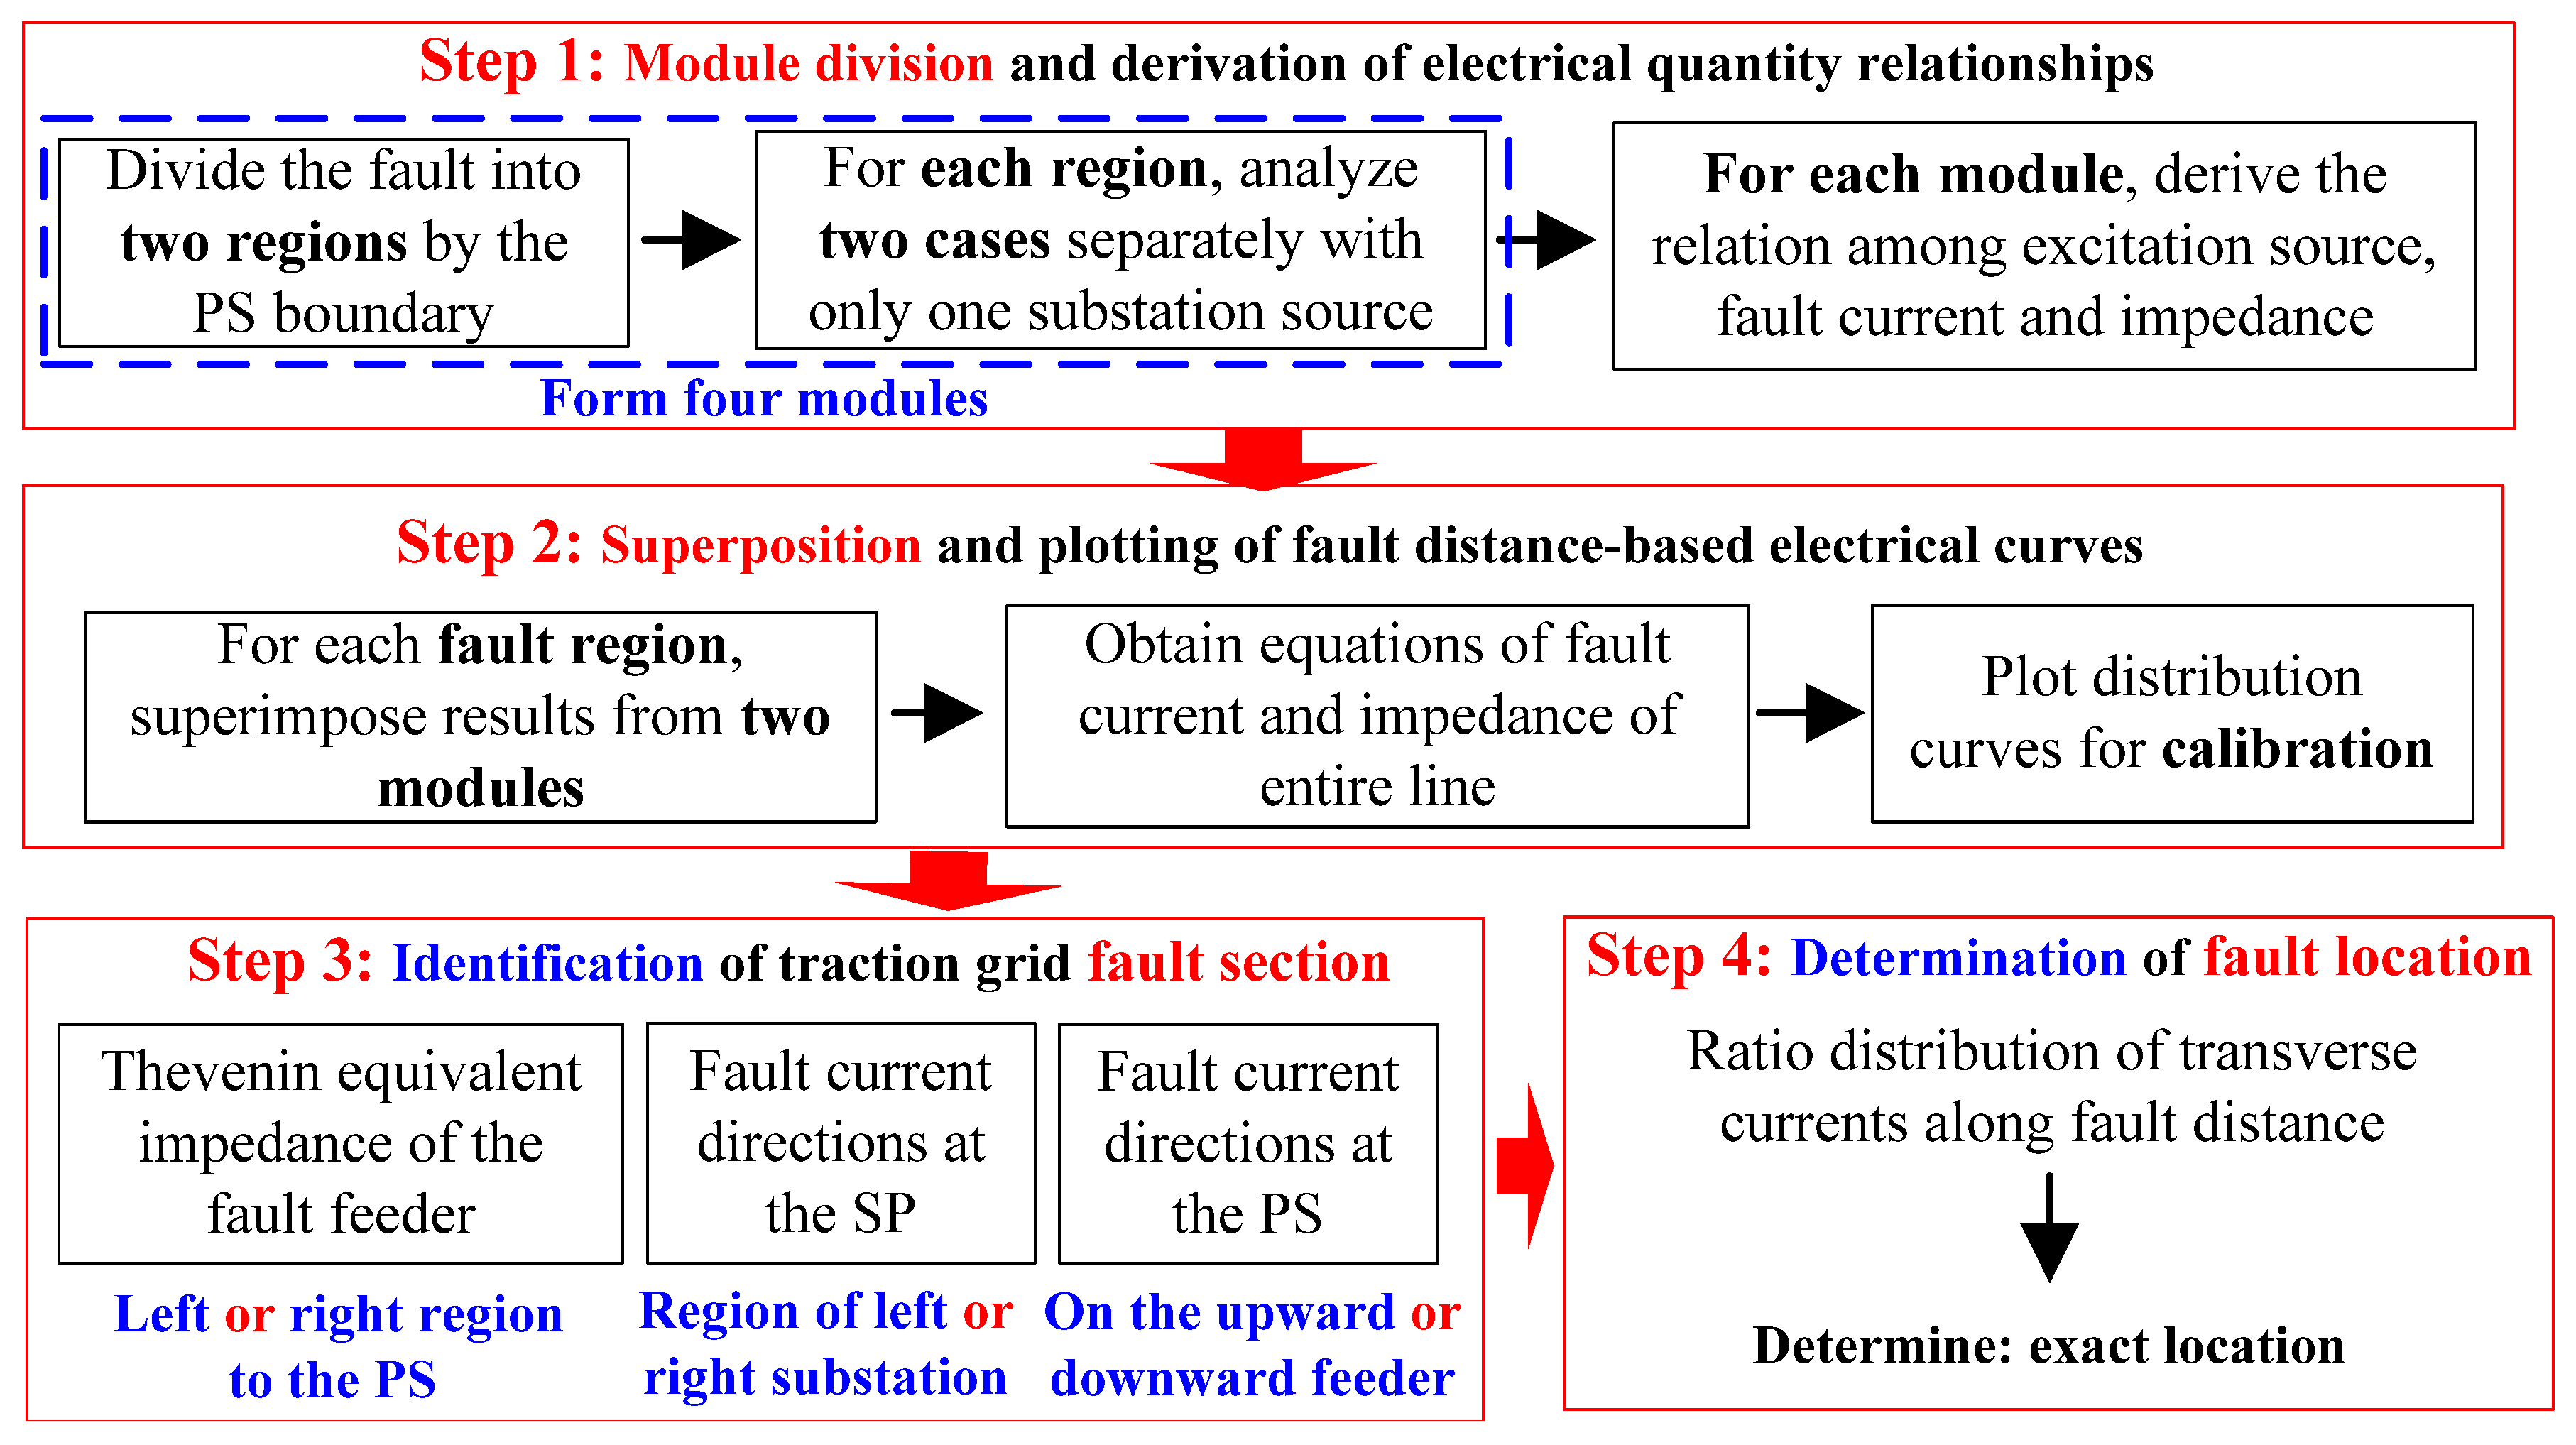
In summary, the complete fault calibration framework for bidirectional traction power supply systems comprises four sequential steps, as illustrated in
Figure 14: (1) module division and derivation of electrical quantity relationships, (2) superposition and plotting of fault distance-dependent electrical curves, (3) fault section identification, and (4) fault location determination.
5. Conclusions
This study proposes a comprehensive fault distance calibration method for bidirectional traction power supply systems in electrified railways, enabling accurate estimation of voltage, current, and Thévenin impedance at substations, section posts, and parallel stations under various fault conditions.
Unlike conventional approaches that oversimplify the earth as a reference conductor, this work introduces a multi-loop circuit model to more realistically represent current return paths. By deriving current distribution coefficients, the calculated equivalent impedance parameters more accurately reflect actual operating conditions. Its validity is experimentally verified on the Chinese Chongqing–Lichuan Railway, demonstrating agreement between calculated and measured parameters, confirming the method’s accuracy and applicability to real-world systems.
Overall, the key contributions of this work are as follows:
It is the first to address relay protection calibration specifically for bidirectional traction grid systems, capturing their structural and operational complexity.
It applies the MLC method to accurately model electrical characteristics in both transmission and return conductors, including the current distribution of the earth path.
It proposes an integrated four-step calibration framework comprising system modeling and electrical quantity derivation, superposition-based synthesis, identification of fault section, and determination of fault location, providing a practical reference for engineering implementation.
