1. Introduction
In recent years, the safety, conservation, and efficient management of bridge stock within the road networks have gained increasing relevance, both due to the strategic role that road infrastructures and bridges play in the socio-economic domain of territories [
1,
2] and because of their growing exposure to natural and anthropogenic risks [
3]. The latter factors contribute to the deterioration of many structures, often built according to out-of-date regulations, subjected to load conditions different from the original ones, exposed to adverse conditions or extreme events, and often not adequately maintained during the service life. The consequences can be severe, as confirmed by collapse events that have resulted in loss of human lives and the interruption of crucial road connections [
4,
5,
6].
To resolve these critical issues, digital technologies have been used in the context of integrated approaches for bridge inspection, monitoring, management, and implementation of maintenance activities. In this context, surveying and digitization techniques are assuming a central role, not only for the acquisition of geometric data and the monitoring of structures, but also for the management and analysis of heterogeneous information.
In particular, digital surveying is commonly used for digitization, geometric-formal analysis, and monitoring of bridges, offering a systematic approach with high precision and replicability. Indeed, surveying based on laser scanning, photogrammetry, and UAV technologies enables the rapid and precise acquisition of three-dimensional data, with advantages in terms of accuracy, repeatability, and accessibility, even in critical areas [
7,
8,
9,
10,
11]. These technologies represent complementary tools of monitoring systems [
12], allowing the detection of large-scale displacements, as in the case of techniques based on satellite images [
13,
14], and deformations of structural components, through the analysis of data acquired via laser scanning and digital photogrammetry, both terrestrial and aerial [
15,
16,
17]. Moreover, the fast acquisition of data through remotely piloted systems (UAVs), combined with the Artificial Intelligence (AI) techniques, is progressively transforming inspection operations, improving the quality of collected data and contributing to the safety and efficiency of operations and assessments [
18,
19,
20,
21,
22,
23,
24,
25].
At the same time, Bridge Management Systems (BMS) [
26,
27] and the use of Building Information Modeling (BIM) are emerging as key tools for collecting and managing information and works throughout the entire life cycle of the artifacts. BIM, considered as a shared digital representation of the physical and functional characteristics of a built environment asset capable of supporting design, management, and maintenance decisions [
28], has proved to be a particularly effective tool in the documentation, conservation, and monitoring of built heritage [
29,
30,
31,
32]. The advantages and benefits of these processes have led to the extension of this procedure to the infrastructure domain and the introduction of the concept of Bridge Information Modeling (BrIM), to highlight its application to bridges. At the same time, combining BrIM and automation techniques, particularly those based on Visual Programming Language (VPL) [
33,
34], opened new perspectives in both advanced parametric modeling [
35,
36] and efficient data management, reducing errors and redundancies typical of manual input.
In recent years, the use of BrIM has led to the analysis and definition of specific modeling and data exchange requirements [
37,
38], as well as the implementation of workflows capable of representing the geometric, material, and functional complexity of existing works [
39,
40,
41,
42,
43]. Several studies addressed the integration of BrIM modeling with bridge information management systems, focusing on digitizing existing structures and using survey data for information modeling. The most recent Scan-to-BIM research has overcome the limitation of manual approaches by proposing automated processes for the geometric and semantic reconstruction of structures [
31,
32,
43]. At the same time, various investigations have explored issues related to information management [
44]. In particular, the potential of visual programming languages such as Dynamo to facilitate data exchange between information models developed in Revit and spreadsheets has been emphasized to ensure the consistent updating of information [
45,
46,
47]. In this regard, the advantages of information models as decision-making and management support tools have also been assessed [
48,
49,
50,
51]. Other authors highlighted the role of BrIM as a central repository for management and maintenance, developing interfaces based on commercial solutions such as UsBIM, Navisworks, or ArcGIS in order to simplify the monitoring and control of bridge conditions [
52,
53,
54]. Finally, the most recent studies on BMS and Digital Twins [
23,
55,
56,
57,
58,
59] have outlined advanced management scenarios advocating the integration of information models, territorial management systems, and real-time monitoring. This opens the way for a more holistic and predictive vision of the maintenance process.
In this international context of increasing digitization of inspection and management processes, Italian policies recalled the importance of documenting and managing road infrastructures and bridges in a more systematic manner. The collapse of the Polcevera Bridge in Genoa in 2018 highlighted the limitations and inconsistencies of national bridge management systems, making this a particularly urgent issue. Following this event, national tools were established to collect and organize data on public assets, such as the National Information Archive of Public Facilities (AINOP) [
60,
61]. In addition, Guidelines for the classification and risk management, safety assessment, and monitoring of existing bridges [
62] were issued, outlining a multilevel operational framework to classify artifacts according to their vulnerabilities and to plan proper interventions to increase their safety level and extend their useful life. The Guidelines foster the use of interoperable information models, designed as digital containers of structured and unstructured data, to support an efficient, transparent, and sustainable management of structures [
49,
52,
58]. However, the practical implementation of these Guidelines often becomes time-consuming and resource-intensive due to fragmented information, limited software interoperability, the technical skills of operators employed by management authorities, and the sensitivity of the technical and scientific context. Several studies have emphasized these challenges [
63,
64], highlighting the importance of using digital systems capable of integrating heterogeneous data and supporting multi-risk assessment processes [
65,
66].
Despite advancements in knowledge and operations, significant challenges remain in the standardization process, data interoperability, and automation of information flow. Although many existing workflows demonstrate the benefits of integrating information modeling, management platforms, and collaborative environments, they often rely on complex architectures or proprietary solutions that require specialized expertise. This substantially limits their applicability within local management contexts, as the required technical skills and associated operational costs may exceed available resources. Furthermore, the information flow between models and databases, which relies on partially automated exchanges, is often unidirectional. This unidirectionality does not always ensure the tracking of inspections over time, nor the continuous and consistent updating of the information model based on external data.
Within this framework, this paper proposes an operational, replicable, and easy-to-use approach to bridge inspections management. The key objective is to enhance and integrate existing knowledge, even when acquired for different purposes or by non-specialist operators, by using open tools and an automated process. The workflow is based on the operational interoperability between NocoDB (v. 0.263.8) for online data management and Revit (2023) for BIM modeling. This is achieved through the exchange of CSV files carried out by Dynamo (v.2.13) graphs, which assure the synchronization of data between the database and the information model. This solution facilitates the storage of relevant information in an online database, filtered and analyzed in VPL software (Dynamo -v. 2.13), and dynamically associated with model elements, thereby ensuring continuous and traceable information updates, reducing manual inputs, and minimizing the risk of data loss.
Herein, the methodology is described in detail, its results are illustrated, and its potential and efficiency are evaluated through application to a use case. The work is a part of broader scientific research into the digitization of the construction sector, focusing on the design and testing of open information exchange processes and protocols. The aim is to create digital systems that support management activities and decision-making processes. This study represents a further progress of the previous authors’ experiences [
40,
67,
68], focusing on the potential of infrastructure digitization and the creation of digital environments to increase safety and management efficiency. Particular attention is paid to marginal but strategic territories, such as those national peripheral (inner) areas [
69,
70], where it is important to develop innovative tools that improve the knowledge, maintenance, and management of the main infrastructure connections.
The document is structured as follows:
Section 2 illustrates the phases of the proposed workflow, from data acquisition and processing to BIM modeling, arriving at the procedure for model and information updating;
Section 3 presents the main results, including the workflow assessment on a real case. Finally,
Section 4 and
Section 5 discuss the results and provide the final remarks.
2. Materials and Methods
The digitalization of the existing infrastructural heritage, particularly of bridges, requires integrated workflows that can support the continuous monitoring of structures and the dynamic management of information through the use of digital information systems. To address these needs, a workflow based on an interdisciplinary approach and on the integration of different digital solutions has been defined. The aim is to generate informative models and a flow for automated updating of the information in support of inspection activities.
The proposed workflow combines the NocoDB platform for data management with information modeling developed using Revit 2023, as well as data automation using graphs in Dynamo. Data exchange between the BIM environment and the database is resolved using structured CSV files, ensuring operational interoperability and data traceability. The entire workflow has been tested on a PC with a 64-bit Microsoft Windows 11 Pro operating system, an Intel Core i7 processor running at 2.60 GHz, 16 GB of RAM, and a NVIDIA GeForce GTX 1650 GPU.
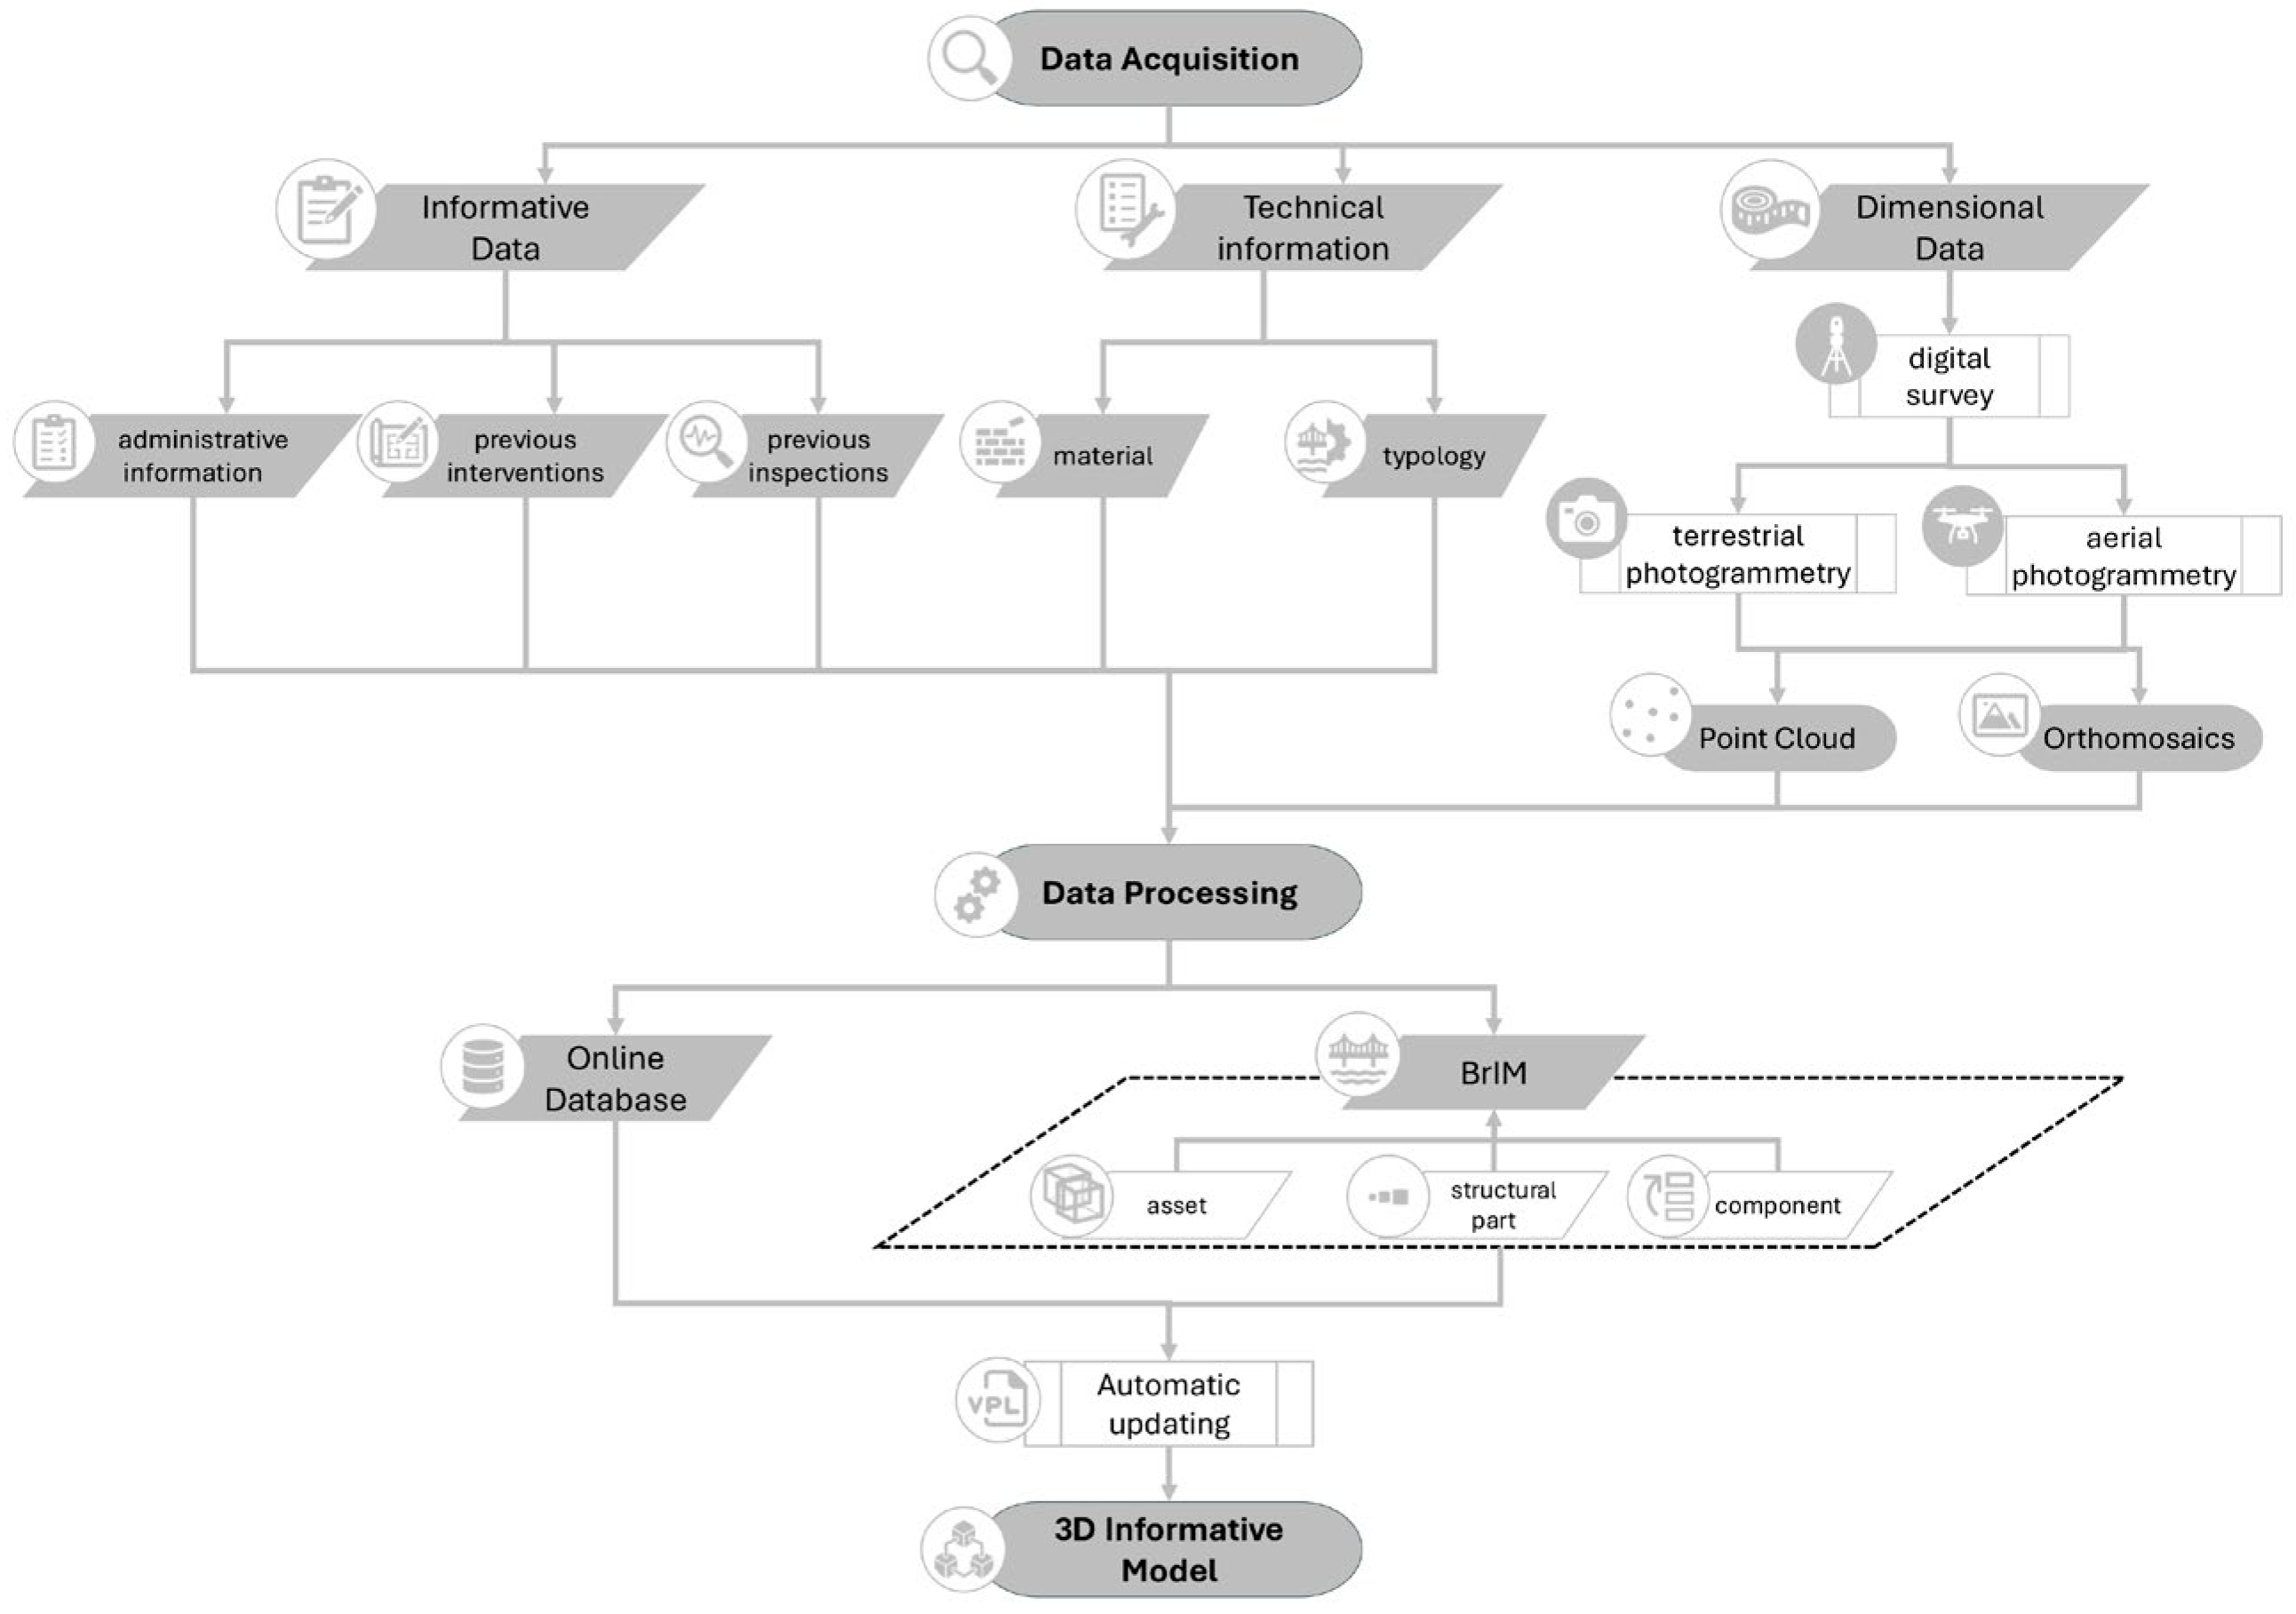
Figure 1 reports the three main phases of the process: (1) collection and organization of the main information about the infrastructure, including the analysis of available technical documentation and data acquired during inspection activities; (2) structuring of the data within an online database and the information modeling of the structure (BrIM), through the definition of a georeferenced, interoperable semantic model; (3) implementation of tailored graphs for the automated updating of information within the model.
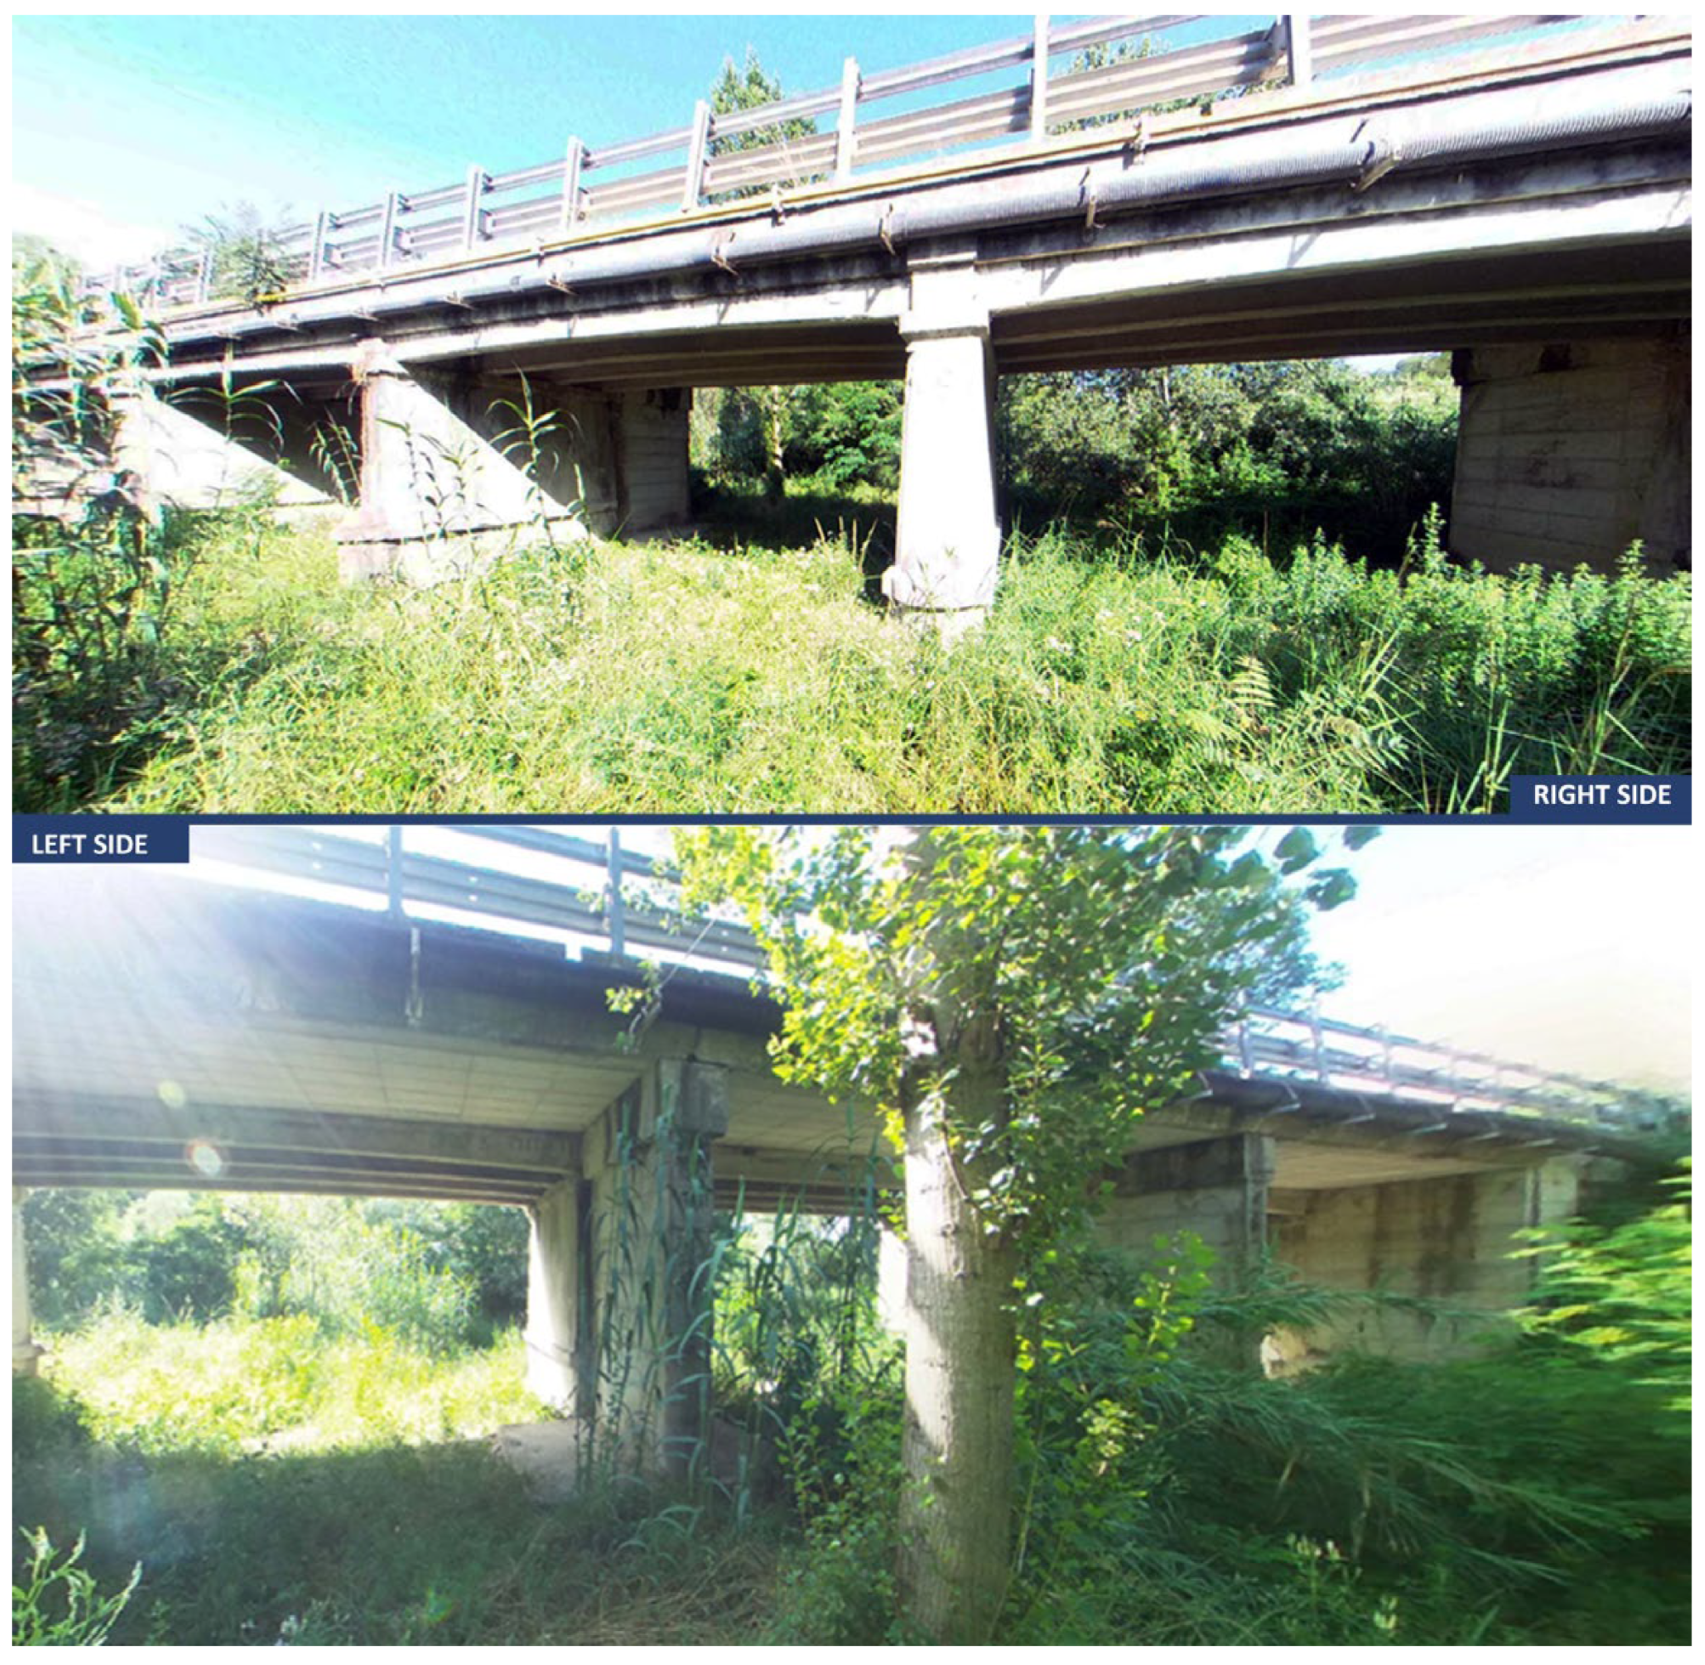
To validate the proposed workflow for automated management of inspections, a reinforced concrete bridge in Southern Italy was selected as an explanatory case (
Figure 2). It is located along a secondary road crossing a river. Although the provincial road network occupies a lower hierarchical level than the national and highway networks, it is crucial for connecting the smaller towns within the regional territory and outlying areas with the major road arteries.
From a typological point of view, the structure belongs to the category of simply supported beam bridges and consists of five spans, each with an average length of 10.80 m.
The piers and abutments present a paired reinforced concrete structure. One of these was added during later widening works to increase the carriageway and allow more vehicles to pass.
In line with the growing attention to the state of health of bridges, the test structure has undergone extensive structural investigation campaigns and, more recently, a detailed instrumental survey campaign, aimed at acquiring more information on the geometric and construction characteristics of the structure and supporting the inspection activities and BIM.
2.1. Heterogeneous Data Acquisition for Current State Characterization
The first phase of the workflow for creating an informative digital replica to support bridge inspection activities requires the collection of heterogeneous technical data, concerning both the typological, construction, and dimensional characteristics of the structure, and informational features, such as administrative data or records of previous inspections [
52,
60,
62]. Such informative digital replicas, as highlighted by recent regulations [
62], must be created based on surveys, metric tests, and ongoing monitoring activities, in order to constitute the structural backbone of the AINOP [
61]. It is therefore required to define a database compliant with MIT Guidelines and structured according to the criteria established by the national AINOP database, capable of collecting all the information required both for the census (Level 0 Census Form) and for visual inspections and defect level assessment (Level 1 Bridge Inspection Form) [
62]. These forms are associated with different levels of inspection and assessment defined by the MIT guidelines [
62], which distinguish between Level 0 (census), Level 1 (visual inspection), and higher levels for in-depth analysis and detailed checks.
The database includes geographical location, functional classification, and main structural information, such as type and construction materials, as well as the chronology of inspection activities. It also contains detailed information on single defects, including their associated weights, extension and intensity coefficients, as defined by MIT Guidelines. Each record is also associated with a unique identification code, enabling the database to be linked to external information tools or digital models.
To create a shared database and ensure fast export in interoperable tabular formats, such as Excel and CSV, the open-source NocoDB platform [
71] was adopted. This platform was selected for creating online relational databases because it provides a low-code, open-source environment that can convert existing spreadsheets into collaborative, SQL-based databases.
This solution was chosen given that it combines the robustness and scalability of relational databases with a user-friendly interface that simplifies data management, even for non-technical users. In addition, the platform enables restricted data access for individual users or groups. These features provide for the creation of tables that can host heterogeneous data. Different views can then be created to effectively collect and manage the heterogeneity of the information gathered, ensuring affordable integration with analysis and research tools.
Photogrammetric surveys, both aerial (drone-based) and terrestrial, were used to collect dimensional and morphological data. This is a well-established methodology for rapid and high-resolution acquisition of three-dimensional data [
72,
73,
74]. Data for photogrammetry were acquired following the preliminary planning of the survey campaign. Specifically, a single data acquisition campaign was conducted for the test bridge, using a DJI Mini2 drone (DJI Sciences and Technologies Ltd, Shenzhen, China) equipped with a 12 MP 1/2.3′′ CMOS RGB sensor for UAV survey (
Figure 3a), and a Canon EOS 1100D camera (Canon Inc., Taiwan, China), with a 12.2 MP 1.8′′ APS-C CMOS sensor, for terrestrial photogrammetry (
Figure 3b). A specialized operator manually controlled the drone’s flight, maintaining a constant distance from the structure. Ten control points (GCPs) were surveyed using the GNSS-RTK global positioning technique for the model’s georeferencing and scaling. These points were marked using 10 high-visibility targets positioned near and on the structure (
Figure 3c).
2.2. Data Processing and Informative Modeling of the Bridge
The second phase consists of the previously acquired data processing to create an informative digital replica.
Digital photogrammetry techniques were used to process the images obtained from both the UAV and the terrestrial camera, using Agisoft Metashape’s Structure-from-Motion (SfM) software (v. 2.2.2.21287). A preliminary visual screening of the image quality was performed, resulting in the absence of blurred and/or occluded images, so that the entire dataset was processed. Once the images were imported into Agisoft Metashape, the photogrammetric workflow was executed as detailed below:
alignment of images and generation of sparse point clouds using available SfM algorithms;
generation of the dense cloud and subsequent filtering of noise and outlier points using confidence filters;
generation of the digital photogrammetric model from the dense cloud, creation of the mesh, and finally, the application of the RGB texturing.
The point clouds obtained through this photogrammetric process were used to create an informative model of the bridge. This modeling process is a crucial component of digitalization efforts aimed at the integrated life cycle management of public works, from design to planned maintenance.
The Building Information Modeling (BIM) approach, when adopted according to openBIM principles and in compliance with UNI 11337 [
75] and UNI EN ISO 19650 [
76], enables the creation of interoperable, semantically structured digital models that can be used in inspection and monitoring processes.
The modeling of existing bridges and viaducts required a critical analysis of available data, such as pre-existing technical documentation, and their integration with geometric information acquired through a digital survey. These data represent the knowledge base for developing a logical and semantic decomposition of the bridge, highlighting spatial, geometric, and structural relationships among the several components.
Modeling was carried out using Autodesk’s Revit parametric software, adopting previously tested manual scan-to-BIM techniques [
8,
40]. In this approach, geometric survey outputs are imported into the software to define the main spatial references of the infrastructure (levels, alignments, characteristic sections), and to build a three-dimensional model with a high Level of Detail (LOD), which is suitable for representing individual components and their relationships.
The model is articulated into logically and semantically defined components, also involving the creation of libraries of parametric objects, representing—via families—elements not included in some BIM authoring software. Each element of the model is also designed to be enriched with information from the bridge database.
Lastly, to ensure process interoperability, information durability over time, and accessibility even to non-specialized operators, the modeling was carried out according to openBIM principles, with a mapping of modeled entities in accordance with the IFC 4.3 standard [
77], as defined by the Guidelines for the application of IFC to bridges and viaducts [
38]. In this phase, particular attention is given to the correct hierarchical and semantic classification of elements in order to ensure durability and interoperability of the model, even in external information environments.
2.3. Semi-Automated Updating of Bridge Informative Model
The resulting BrIM model is not limited to a simple three-dimensional representation of the structure but serves as an active documentation and support tool for inspection and management activities. In this regard, it is essential to enrich or update the parameters of modeled elements using semi-automated procedures.
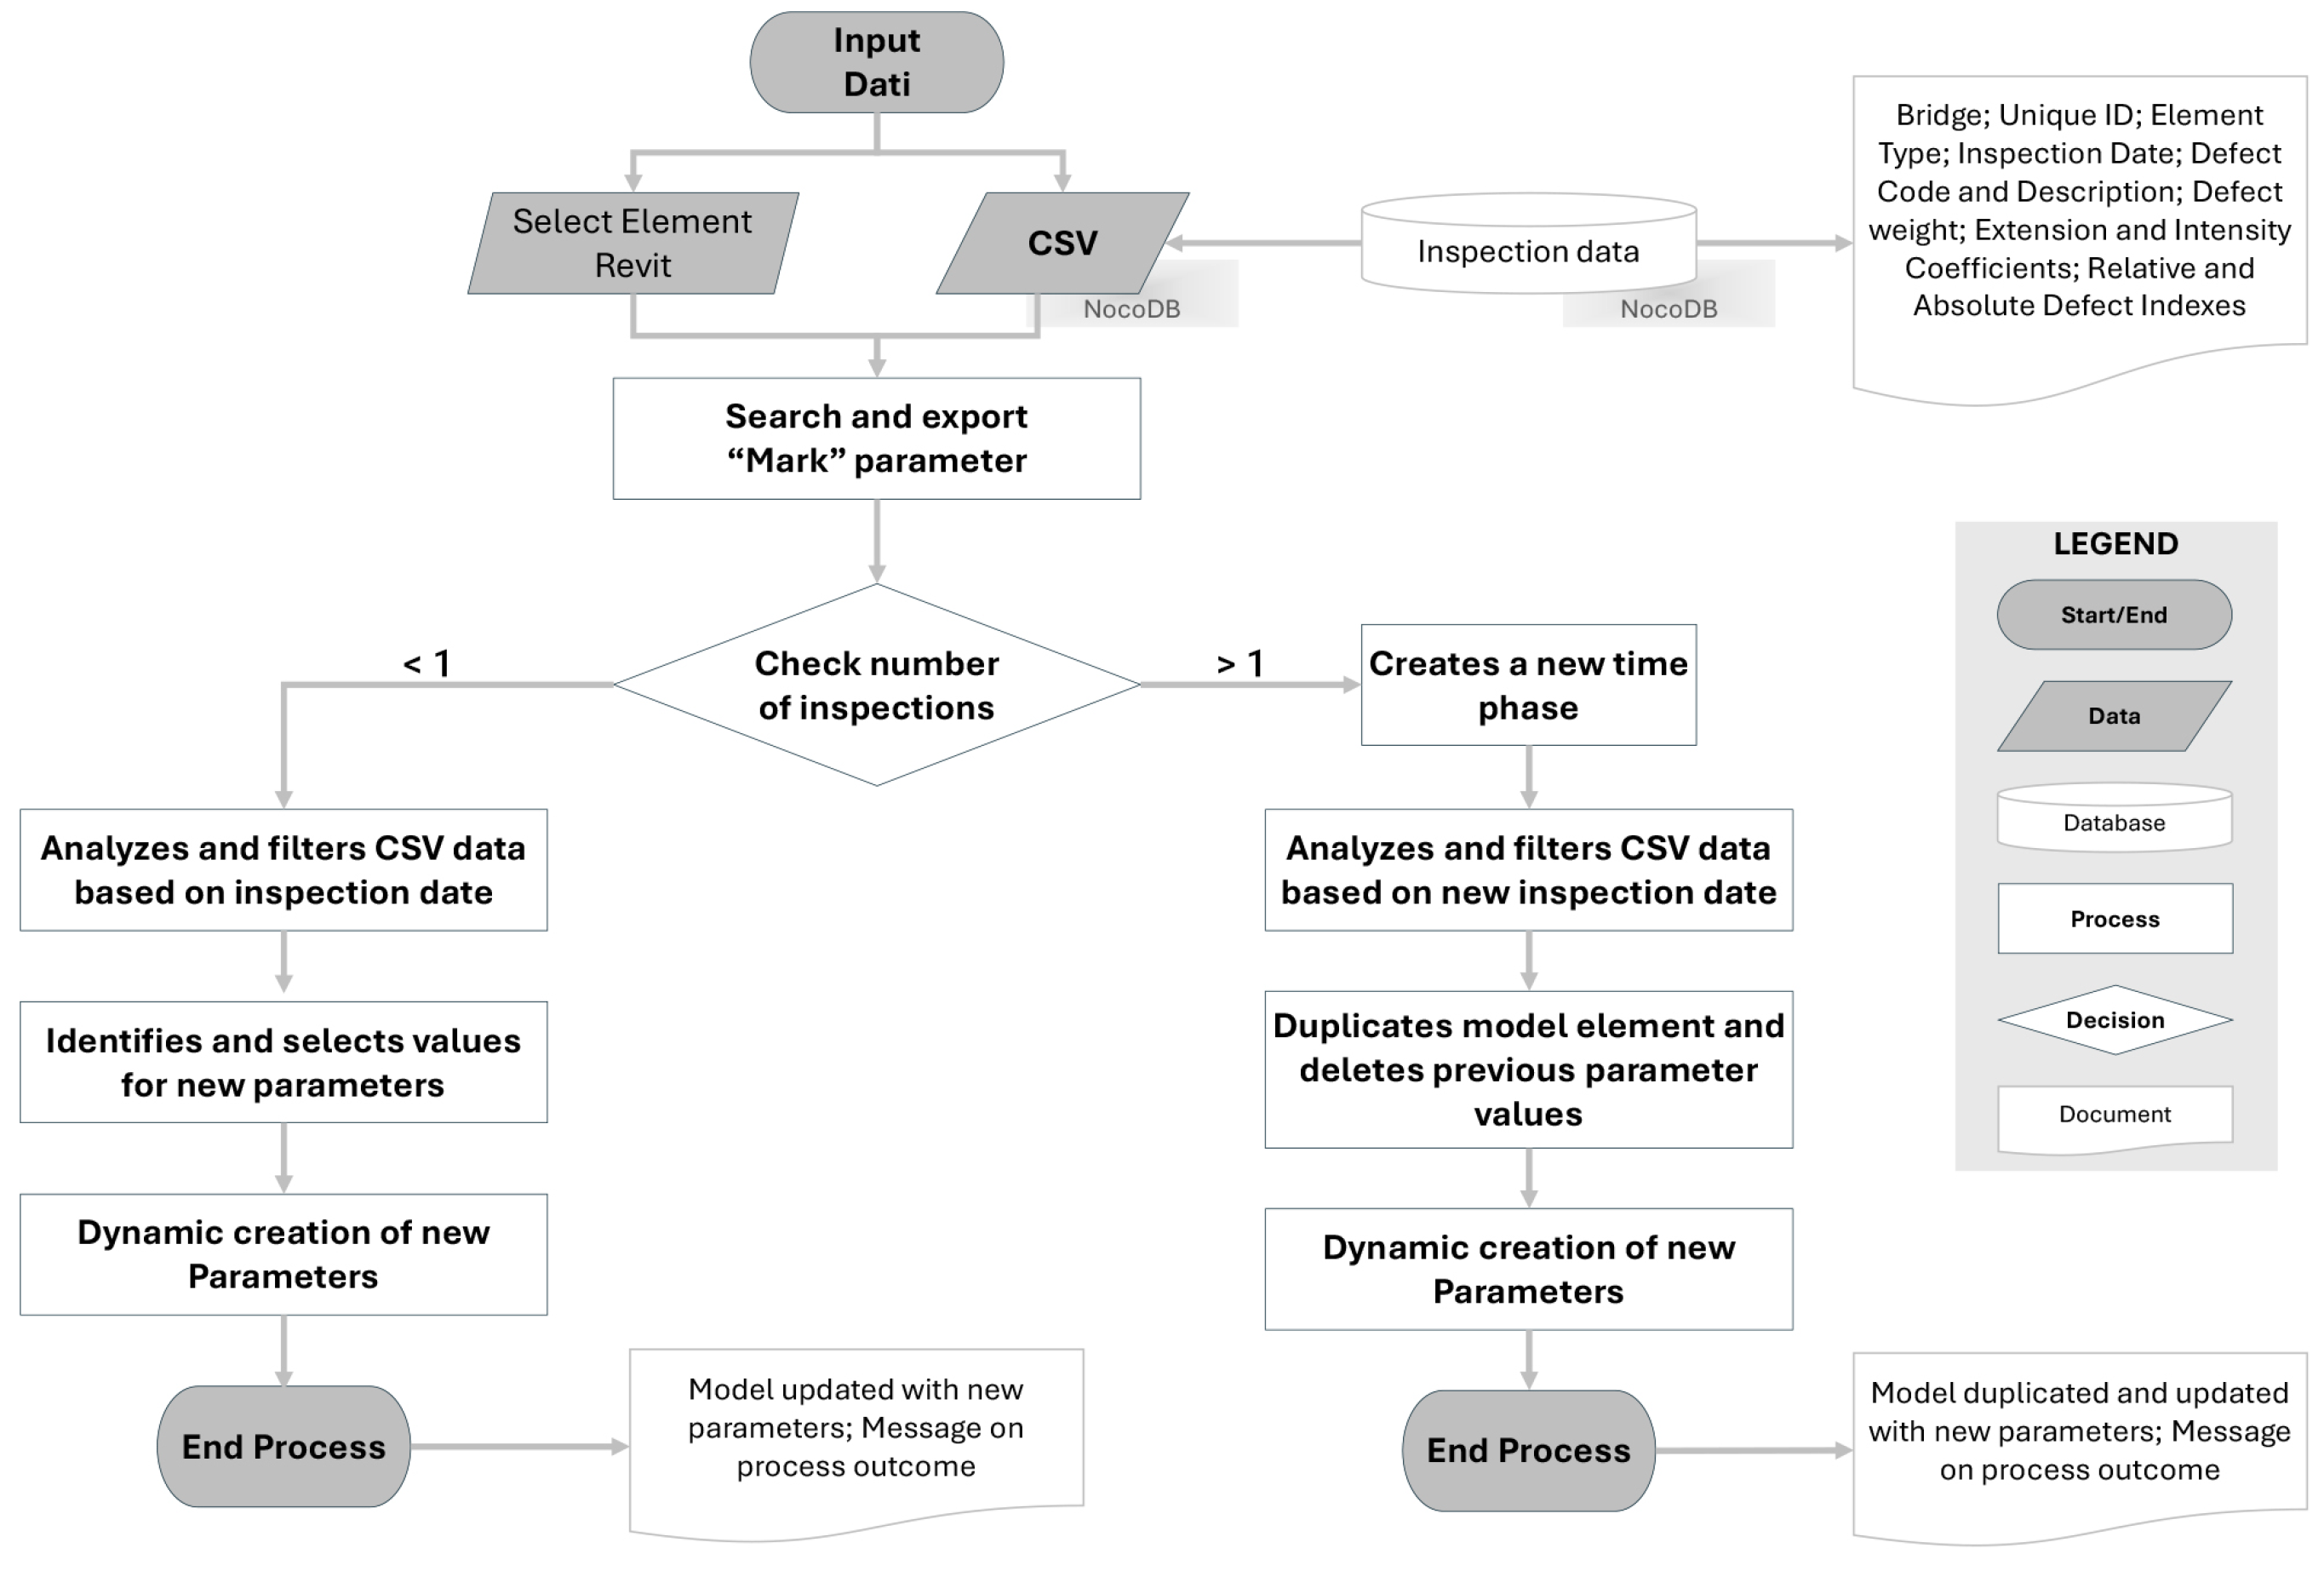
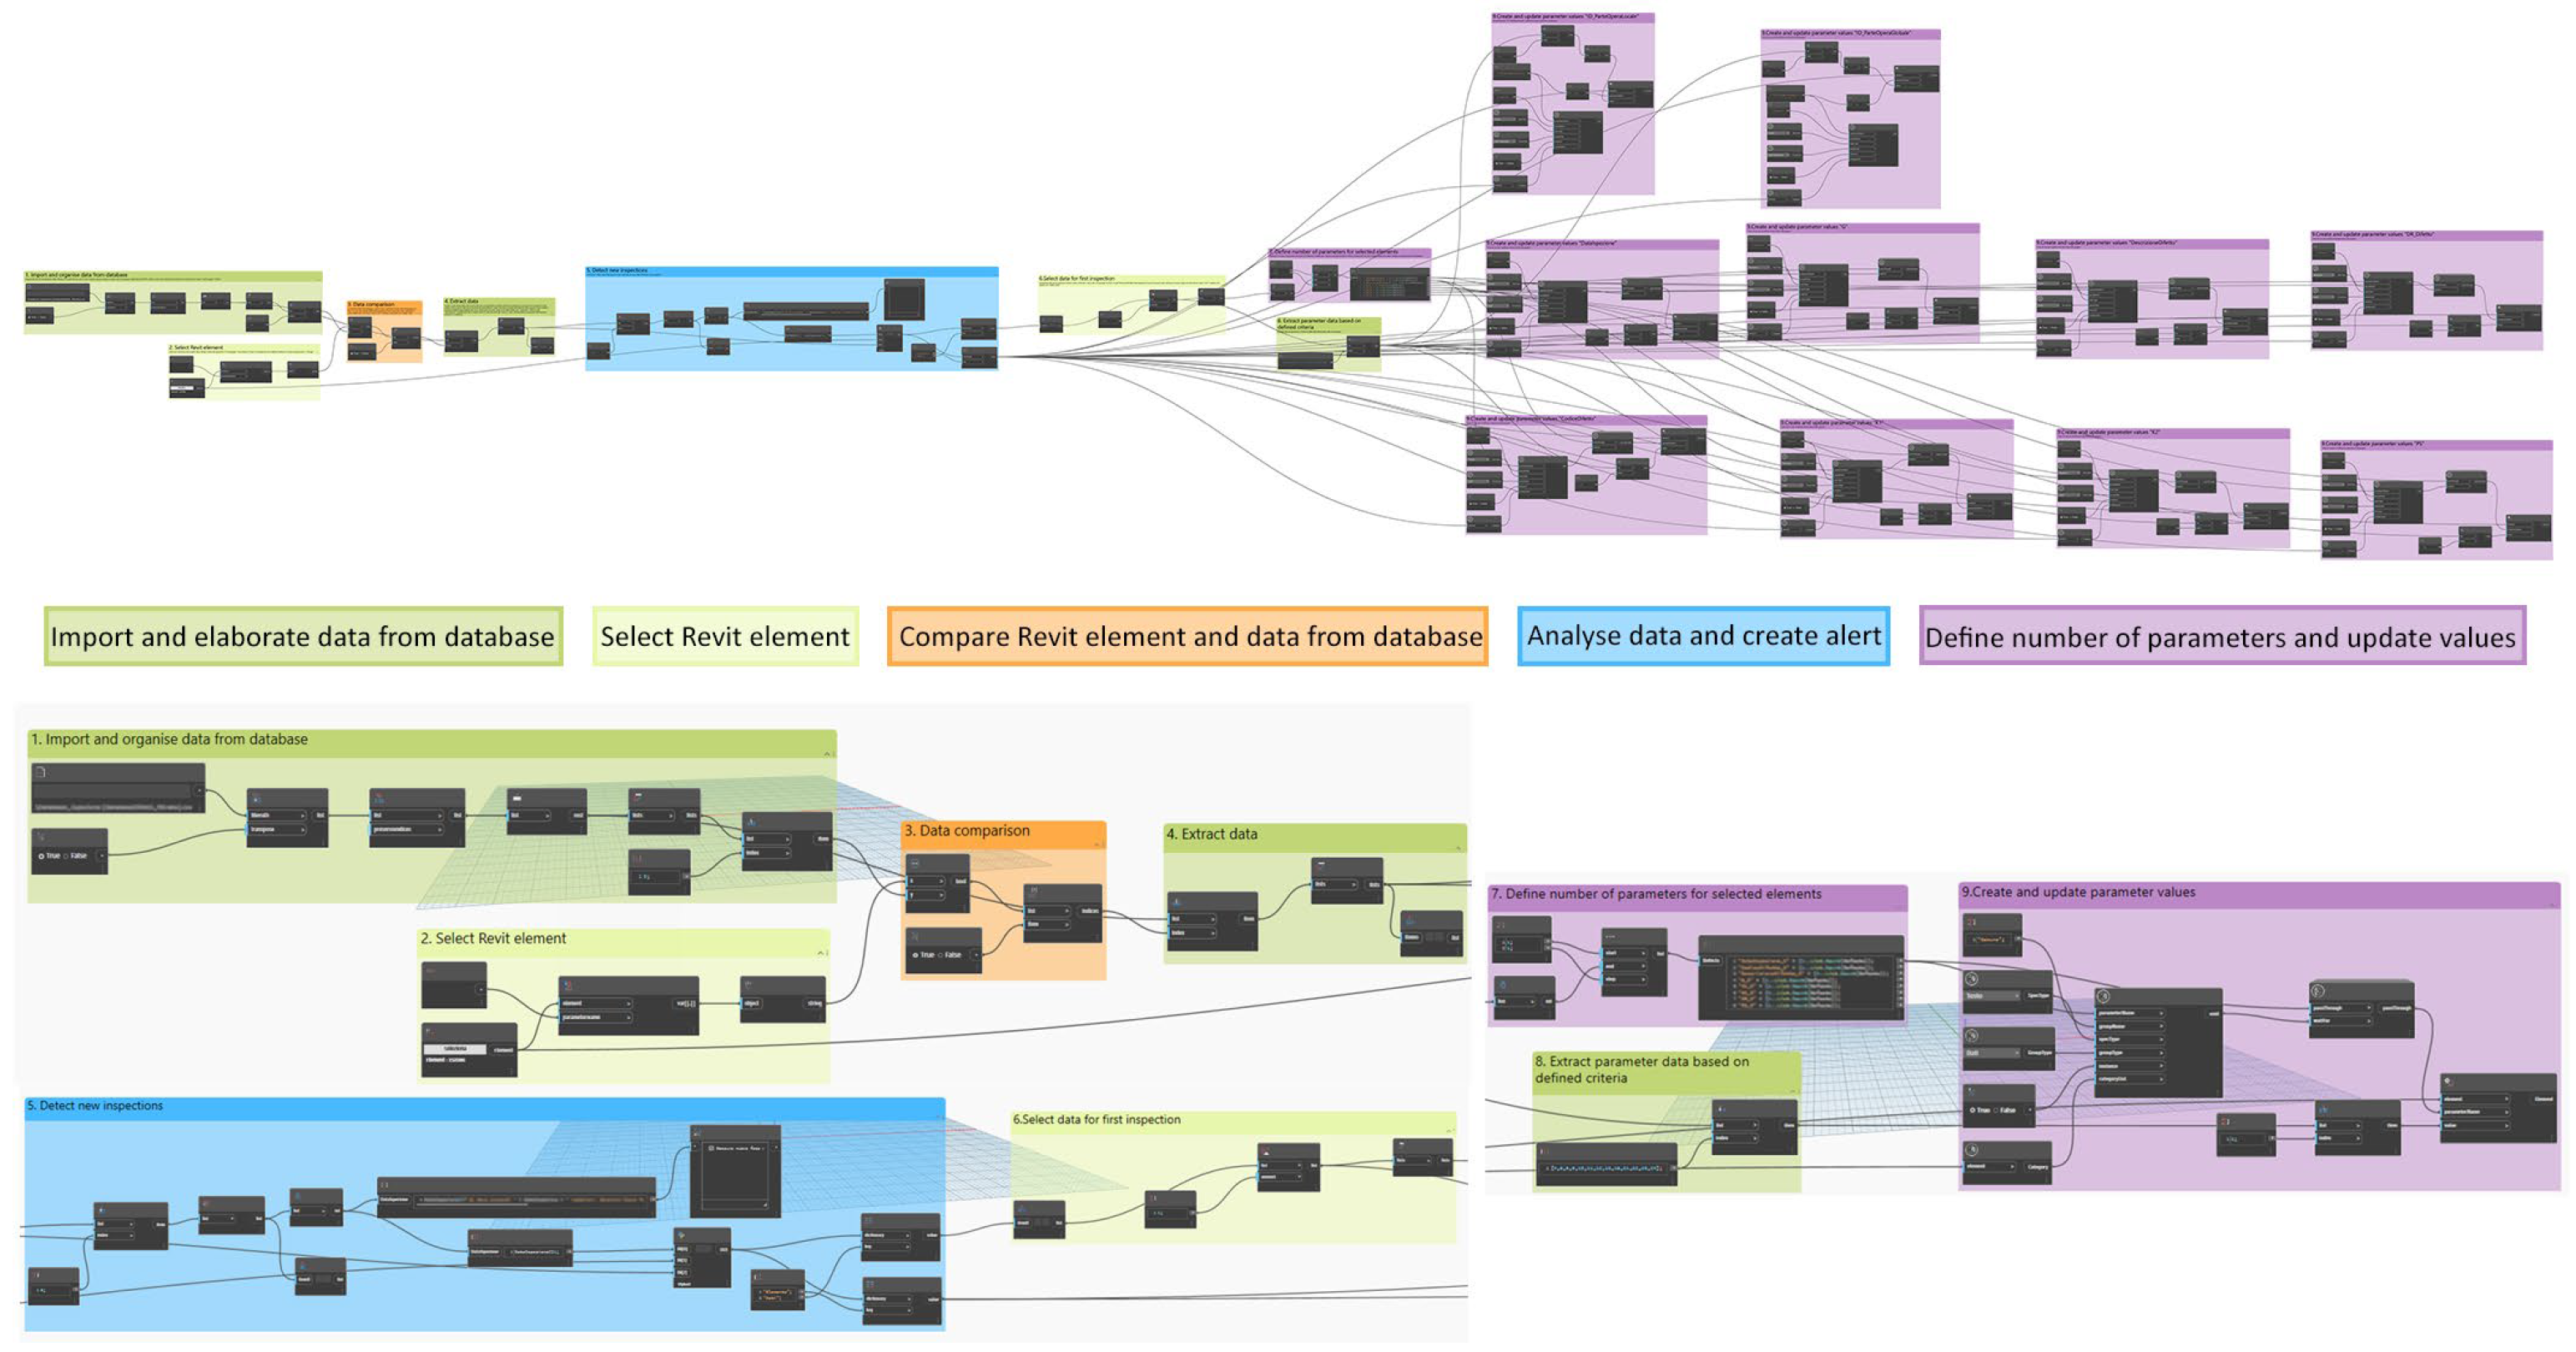
A key element of the workflow consists of two graphs developed in the Dynamo environment (v. 2.13) to interact with Revit 2023. Through VPL, the graphs process the CSV file exported from NocoDB, enabling controlled and automated updates of the information model and ensuring its synchronization with the database (
Figure 4).
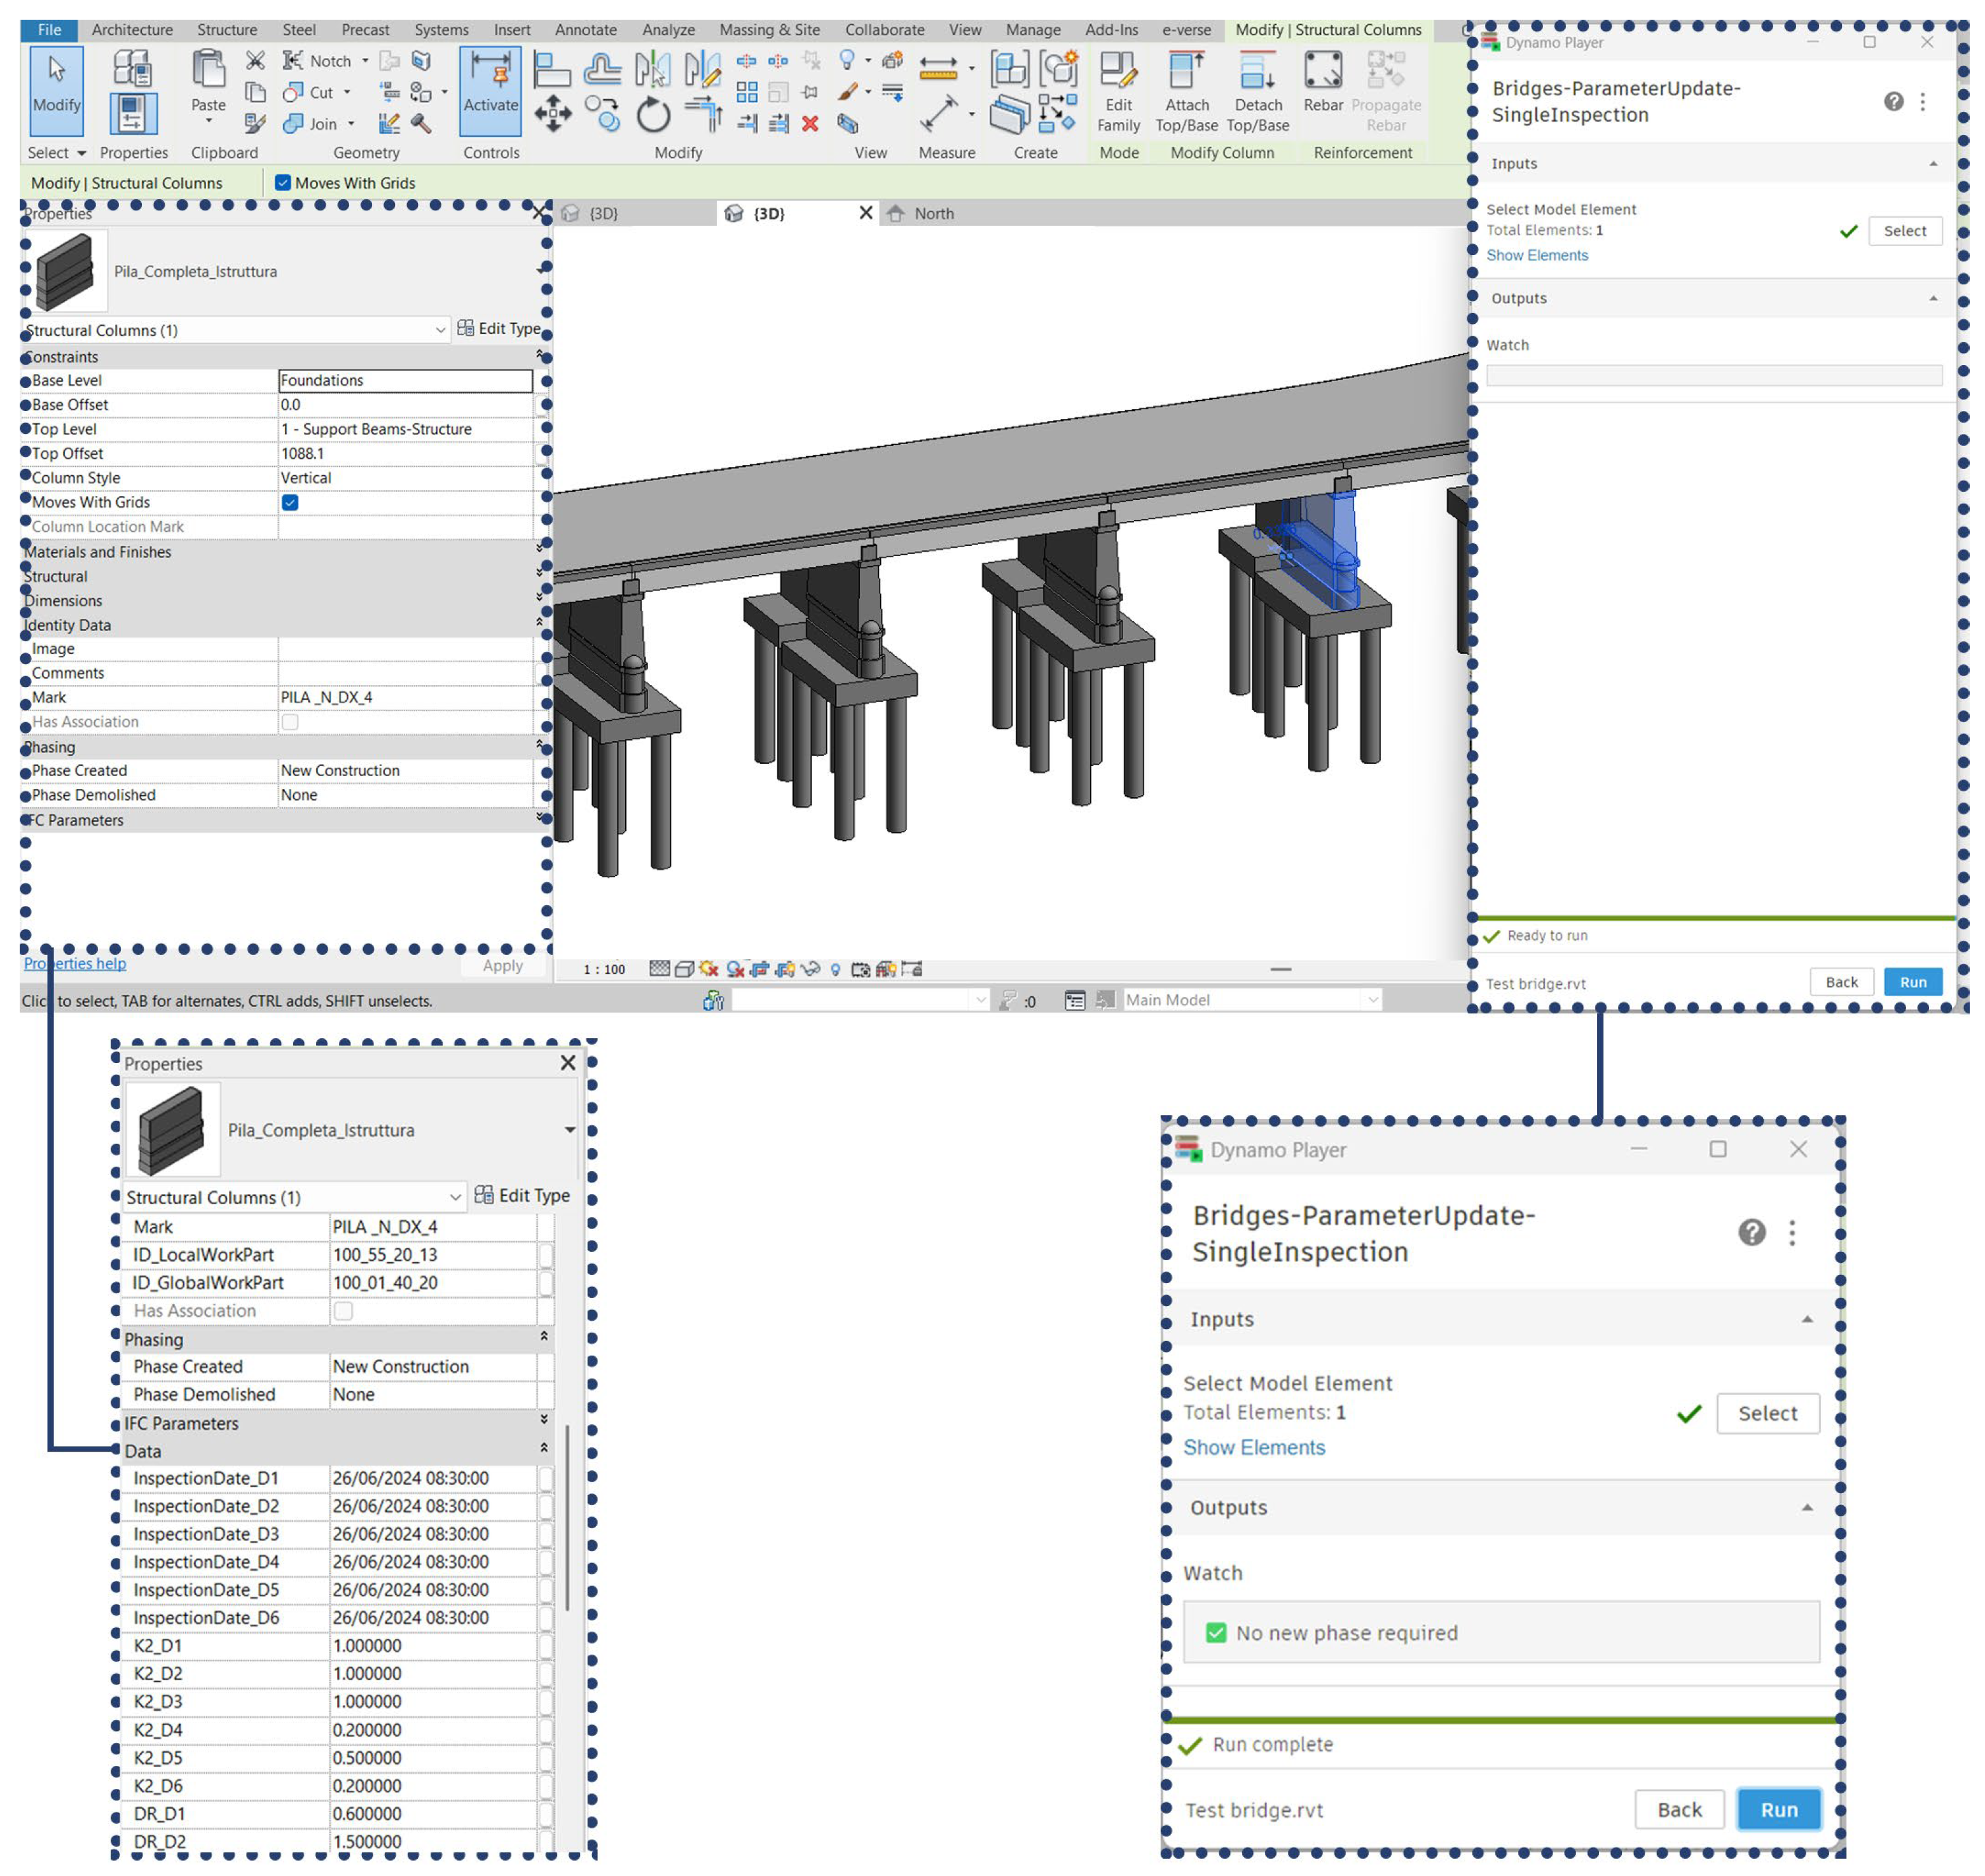
The first graph handles cases where only one inspection has been carried out on the bridge. After selecting the BrIM model element, the graph reads and analyzes the data stored in the CSV file of interest and identifies the values corresponding to the database record by extracting the ‘Mark’ parameter, which matches the unique identification code and represents the link between the two systems. After filtering and retrieving the data for the specific element, the graph nodes verify the uniqueness of the inspection date value and generate a warning about the next steps based on the result. If the value is unique, subsequent nodes import the data into the model by creating custom parameters (e.g., InspectionDate, DefectCode, DefectDescription). Defining a dedicated code block for the automated generation of parameters facilitates the dynamic adaptation of the number of information fields based on database records, thereby reducing the risk of inconsistencies.
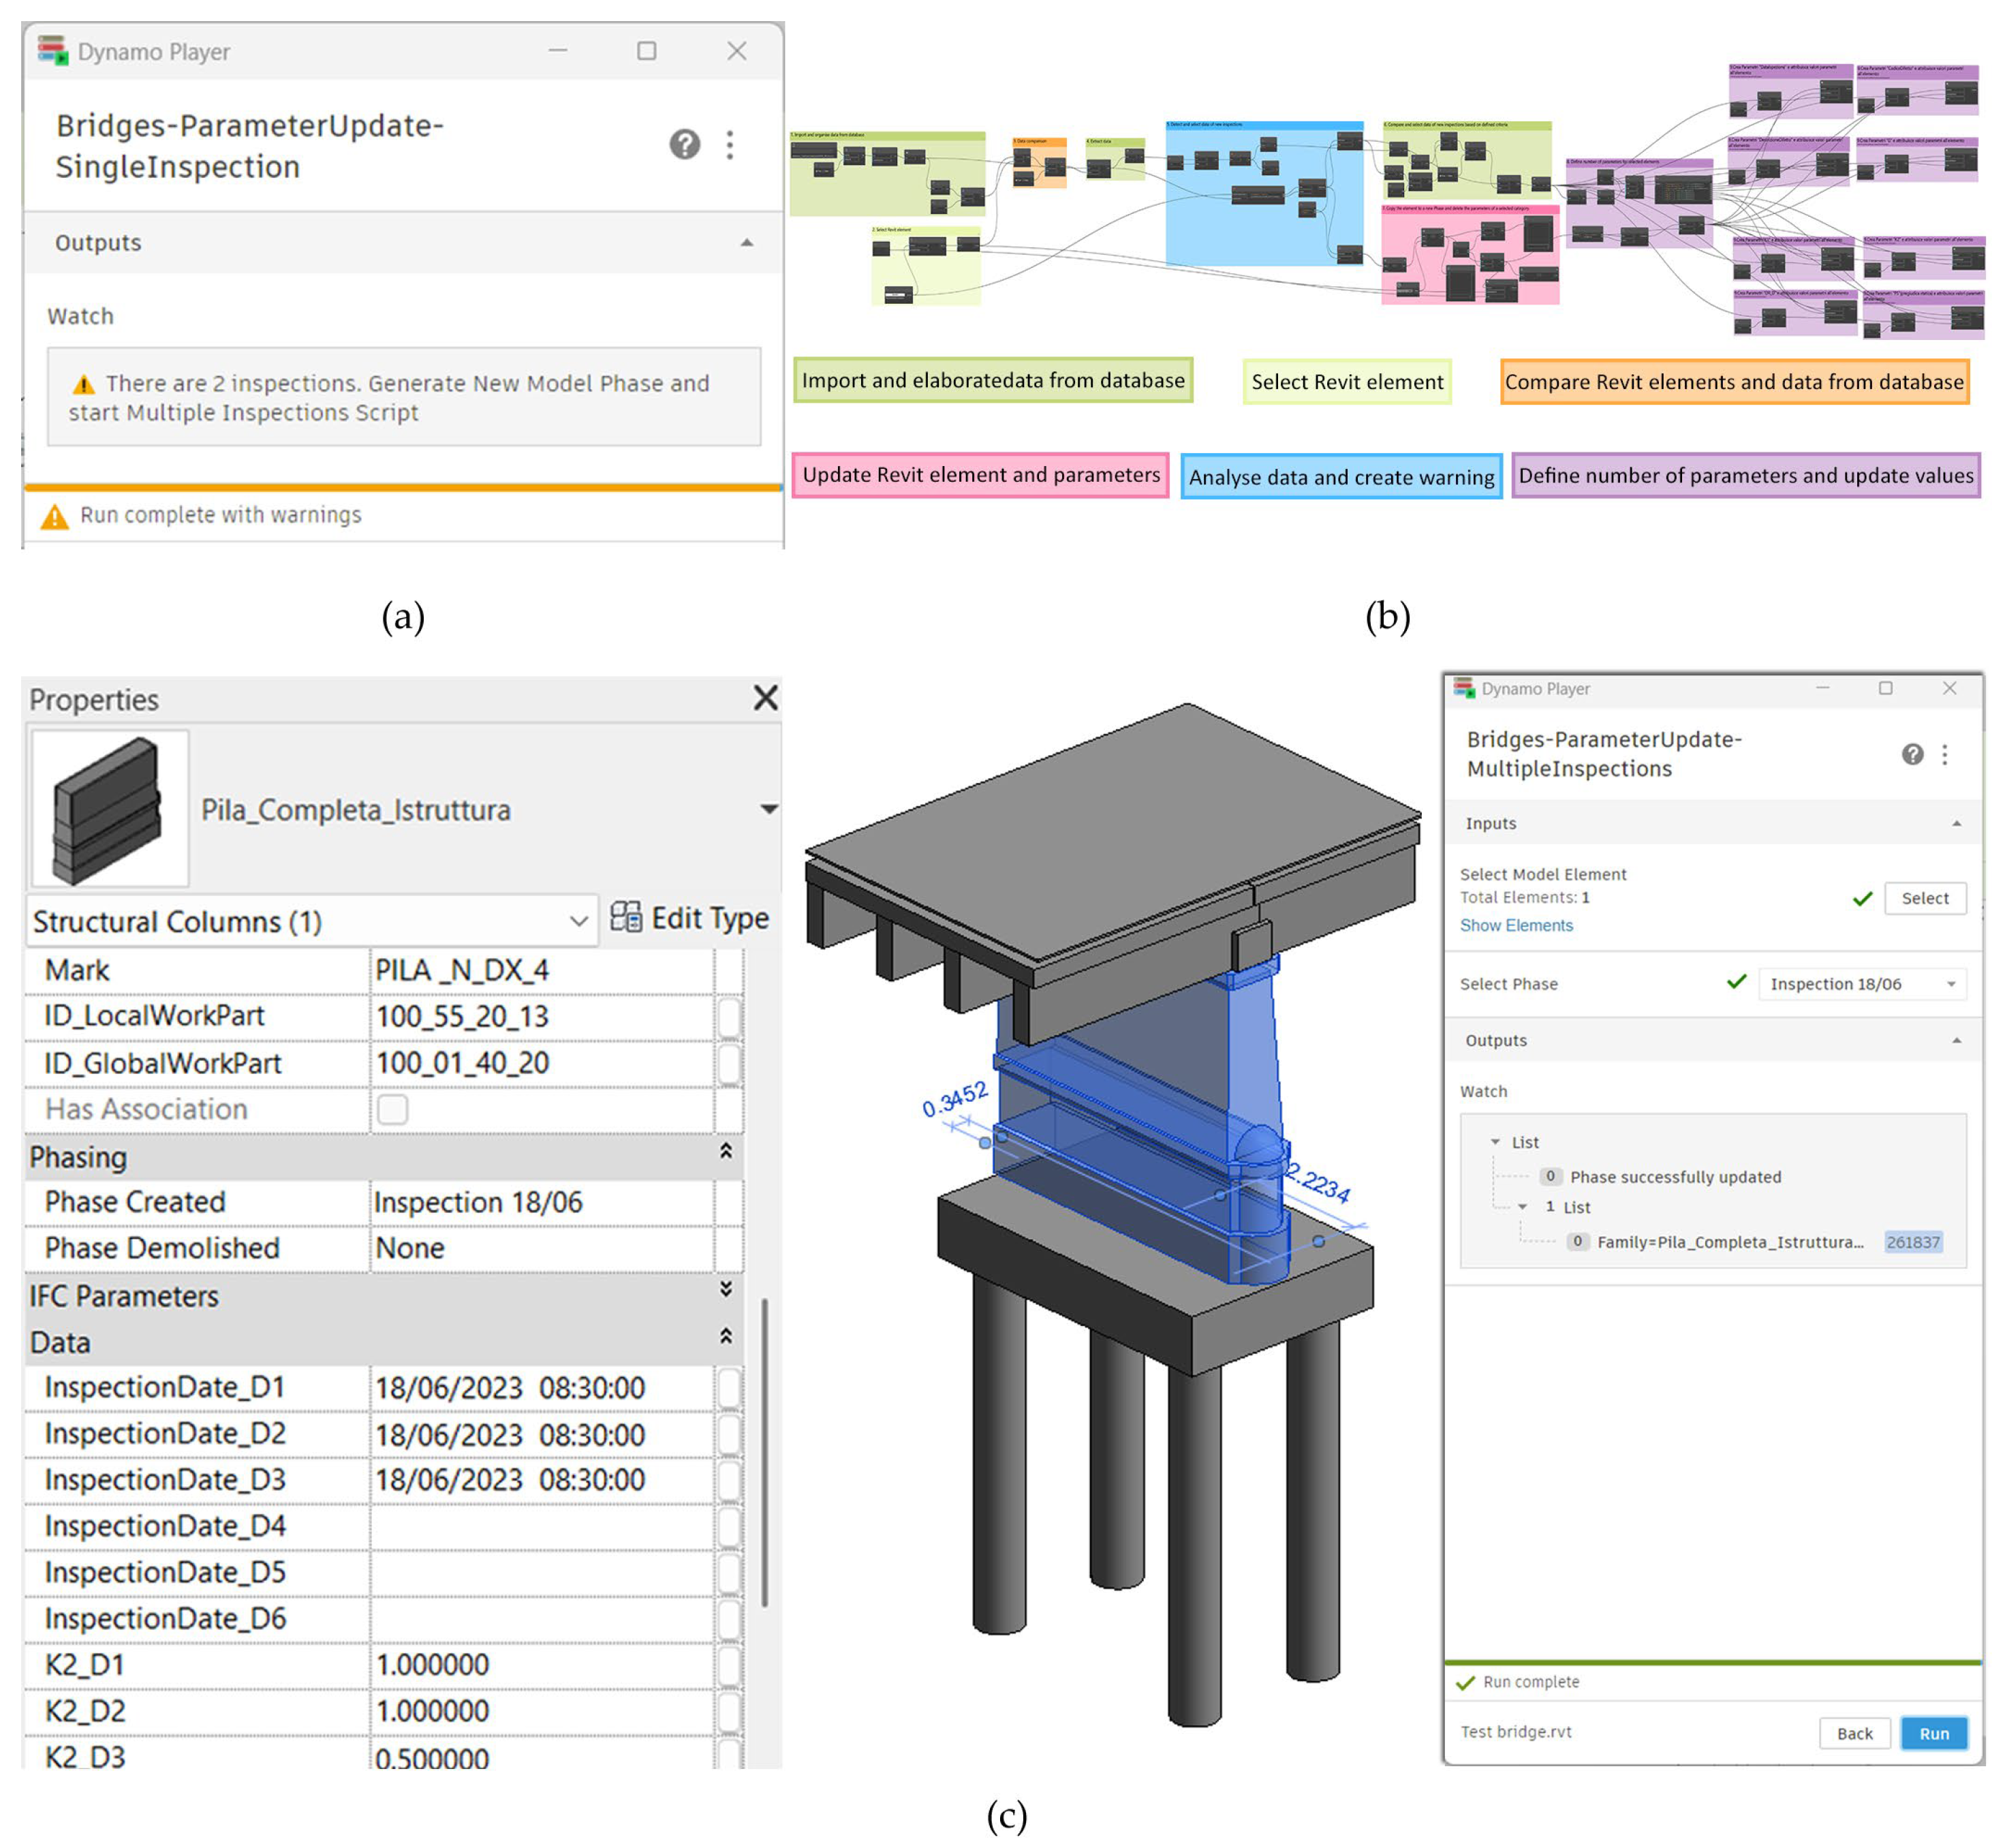
The second graph, on the other hand, is designed to process cases with multiple inspections and can be activated when the first graph generates an alert during the inspection date check. At the development stage described herein, a new project phase corresponding to the inspection date must be manually created prior to execution and provided as an input to the Dynamo routine. Once the new phase is selected, a Python code duplicates the selected element and removes any values associated with the information parameters from previous inspections, automatically updating them with the new information retrieved from the database records.
Both graphs use a mix of native and custom nodes, as well as Python code, to implement logical checks and notify the user about the operations to be performed. The entire process can be managed directly in Revit via Dynamo Player, facilitating the execution of complex and repetitive operations in a simplified manner, also by personnel without programming expertise.
The graphs achieve a high level of automation. Once the manual selection of a model element or a new time phase is made, operations such as filtering, data duplication, element creation, and parameter compilation are performed automatically, reducing errors caused by manual input and cutting the time needed to create, verify, and update parameters by around 70%. The proposed workflow preserves the history of inspection activities and records information acquired in new campaigns, thus enabling the monitoring of bridge conditions over time. In addition, the modular structure of the code allows the workflow to be adapted for other models or types of infrastructure and, with minor modifications, to be applied in international contexts.
3. Results
This section summarizes the main results provided by the application of the proposed methodological workflow to the selected explanatory case, with the aim of assessing its potential, particularly in the automated management of inspection data.
The selected bridge served as an effective testbed for evaluating the coherence and efficiency of the integrated workflow, based on on-site data acquisition, BrIM modeling, and automated information updating.
3.1. Digital Survey of the Bridge
To document in detail the geometric, structural, and morphological characteristics of the test bridge, providing a knowledge base to support inspection and information modeling activities, an instrumental survey campaign was designed and accomplished.
The data acquisition process was carried out by integrating aerial and terrestrial photogrammetry techniques to ensure complete and detailed coverage of the structure.
Specifically, a drone flight was carried out, which resulted in the acquisition of 1896 digital images; at the same time, a terrestrial photogrammetric campaign, which allowed a further 340 photos to be collected, was performed.
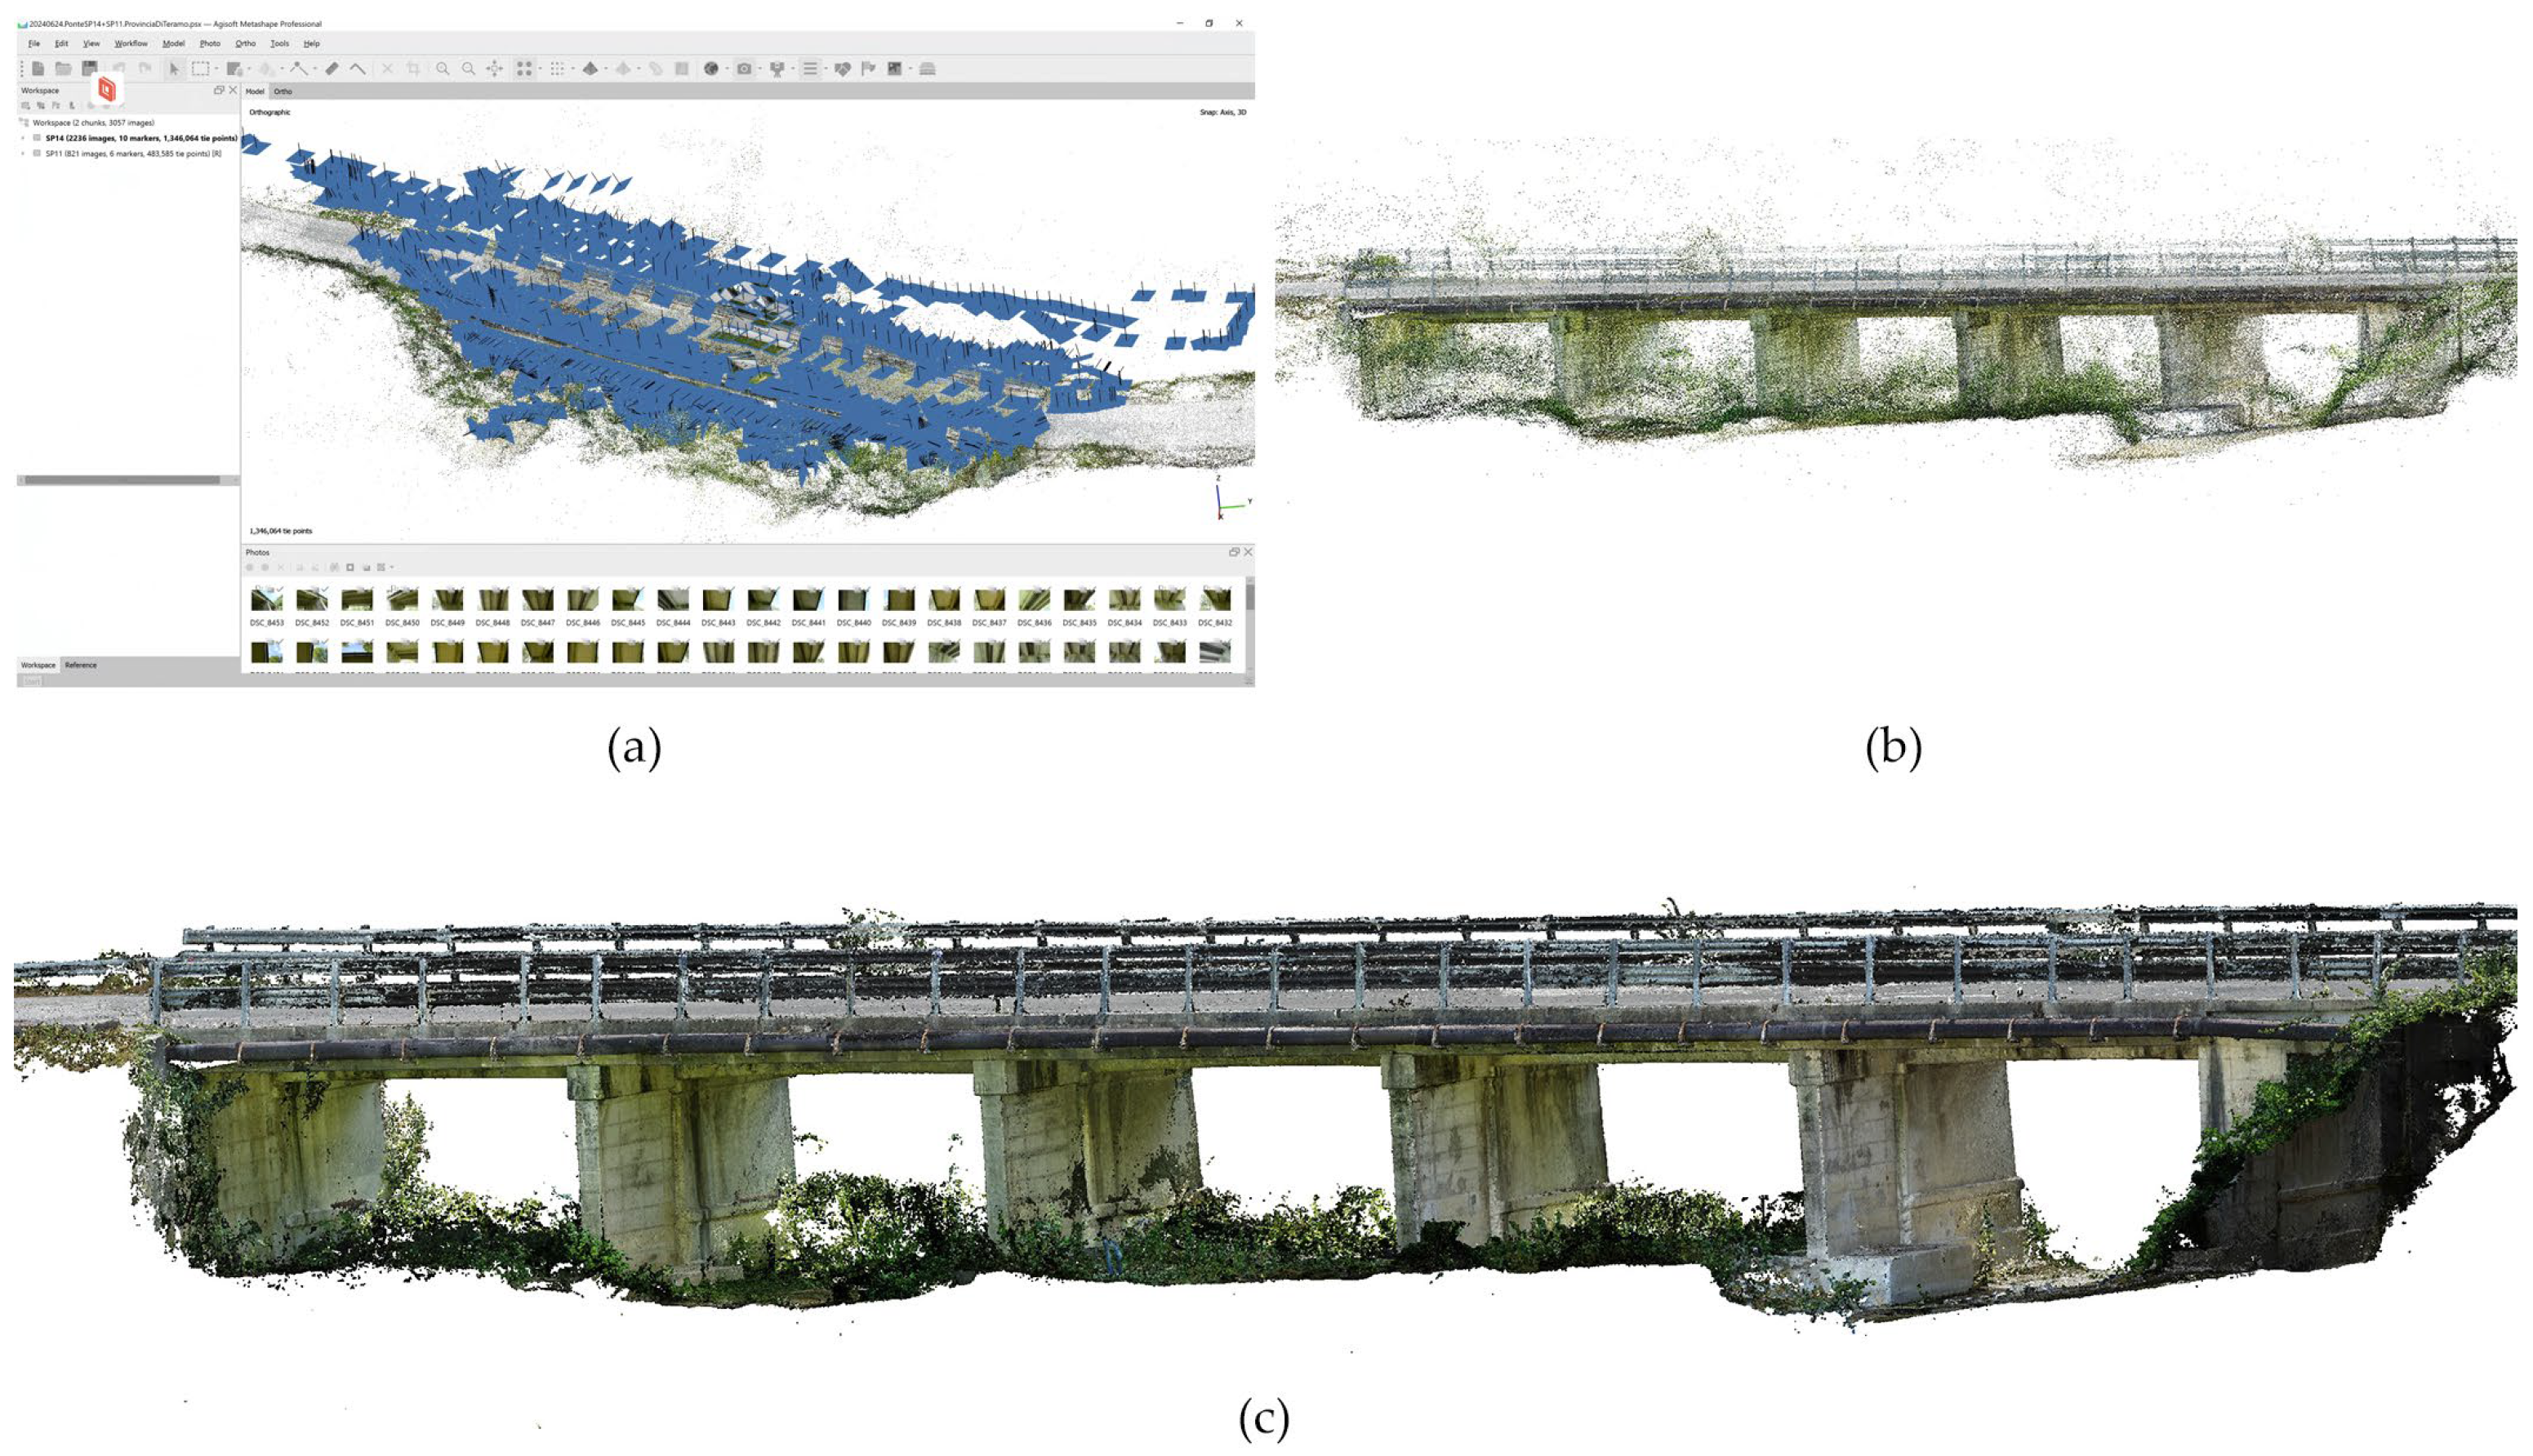
The complete set of 2236 images was processed using SfM techniques, managed within a single chunk to ensure an integrated and coherent workflow. The processing in Agisoft Metashape involved several sequential stages. First, the images were aligned (
Figure 5a) with high-accuracy parameters using the software’s SfM algorithms, resulting in a sparse point cloud of approximately 1.4 million points (
Figure 5b). Subsequently, a dense RGB point cloud of about 463 million points was generated from the sparse reconstruction. This cloud was then filtered using implemented confidence filters to eliminate outliers and reduce noise, resulting in a cloud of around 228 million points (
Figure 5c). This point cloud was georeferenced using seven of the ten GCPs measured with GNSS-RTK global positioning system (
Table 1), resulting in a mean 3D error (RMSE) of 0.068 m, which is consistent with the centimetric range required for the study. This georeferenced data formed the basis for the 3D RGB digital photogrammetric model with approximately 69 million faces (
Figure 6).
The results of this phase supported the inspection activities and the validation of the collected data, while also providing the geometric basis for the successive BrIM modeling of the structure.
3.2. Inspection Tracking Information System
As part of the digitization and information management process for data collected during the census, survey, and inspection of assets, a relational database was developed using the open-source NocoDB platform. The system was structured to normalize information in compliance with national standards and organized into three main tables, consistent with the forms defined in the MIT Guidelines: Element Details Form, Inspection Form, and Census Form. These three tables (
Figure 7), although distinct in terms of purpose and data type, include a unique identification code that allows for the establishment of relationships between the tabs themselves (
ID_Artifact_Manager) and with external relational databases, such as the AINOP archive (
IOP_Code_Artifact).
The Census Form collects data on the location, classification, geometry, and structural characteristics of the asset, as well as information on specific vulnerabilities (seismic, hydraulic, landslide), maintenance history, and infrastructural context.
The Element Details Form describes the decomposition of the bridge into its main components, according to the terminology and coding defined by MIT Guidelines. For each element, in addition to type and material information, the geographic coordinates and location of single components within the structure (e.g., span number) are reported.
The Inspection Form represents the operational core of the information system, as it includes all the fields required for Level 1 inspection forms, such as defect codes and descriptions, the associated weights (G), and extension and intensity coefficients (K1 and K2).
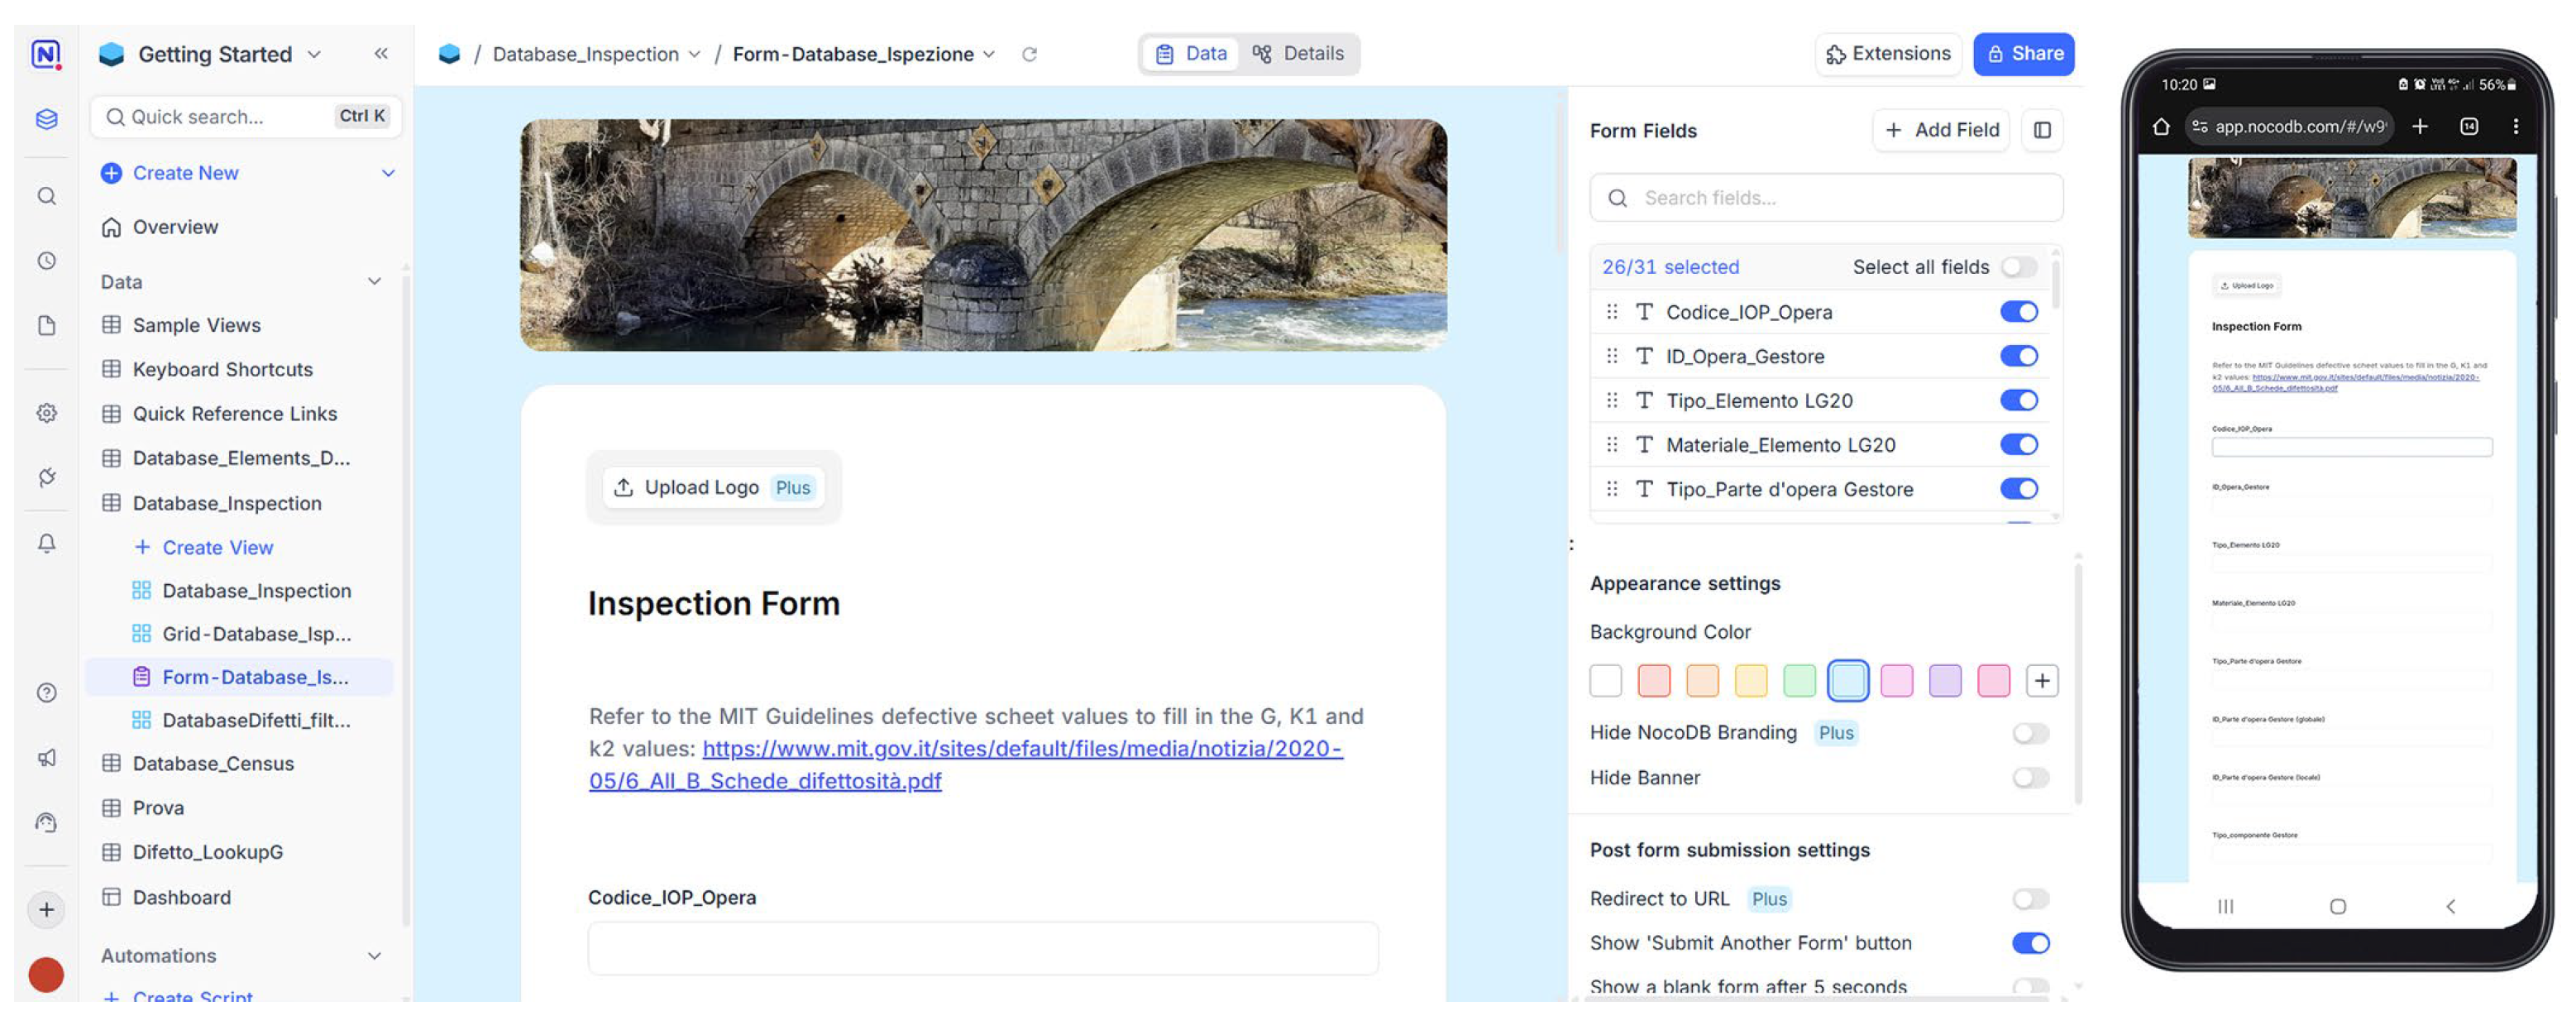
Two visualization modes were set up for the Element Details and Inspection Forms: a grid view, useful for consulting and analyzing the dataset as a whole; and a form view, designed to facilitate data entry by authorized operators during in-field activities, thanks to its intuitive interface and accessibility from a mobile device (
Figure 8). This view enables users to fill in inspection forms directly within the NocoDB platform, ensuring structured data collection and collaborative, multi-user management in real time.
For the test bridge, the workflow was applied experimentally by adopting an inspection approach based on the digital survey output to ensure sufficient accuracy for a reliable assessment of defect characterization. Indeed, the integration of diverse data, such as point clouds and high-resolution images, allows cross-validation of information, thus improving the overall reliability of inspection.
Specifically, the point cloud was used as a spatial reference for the structural decomposition of the asset and the identification and classification of single elements (
Figure 9).
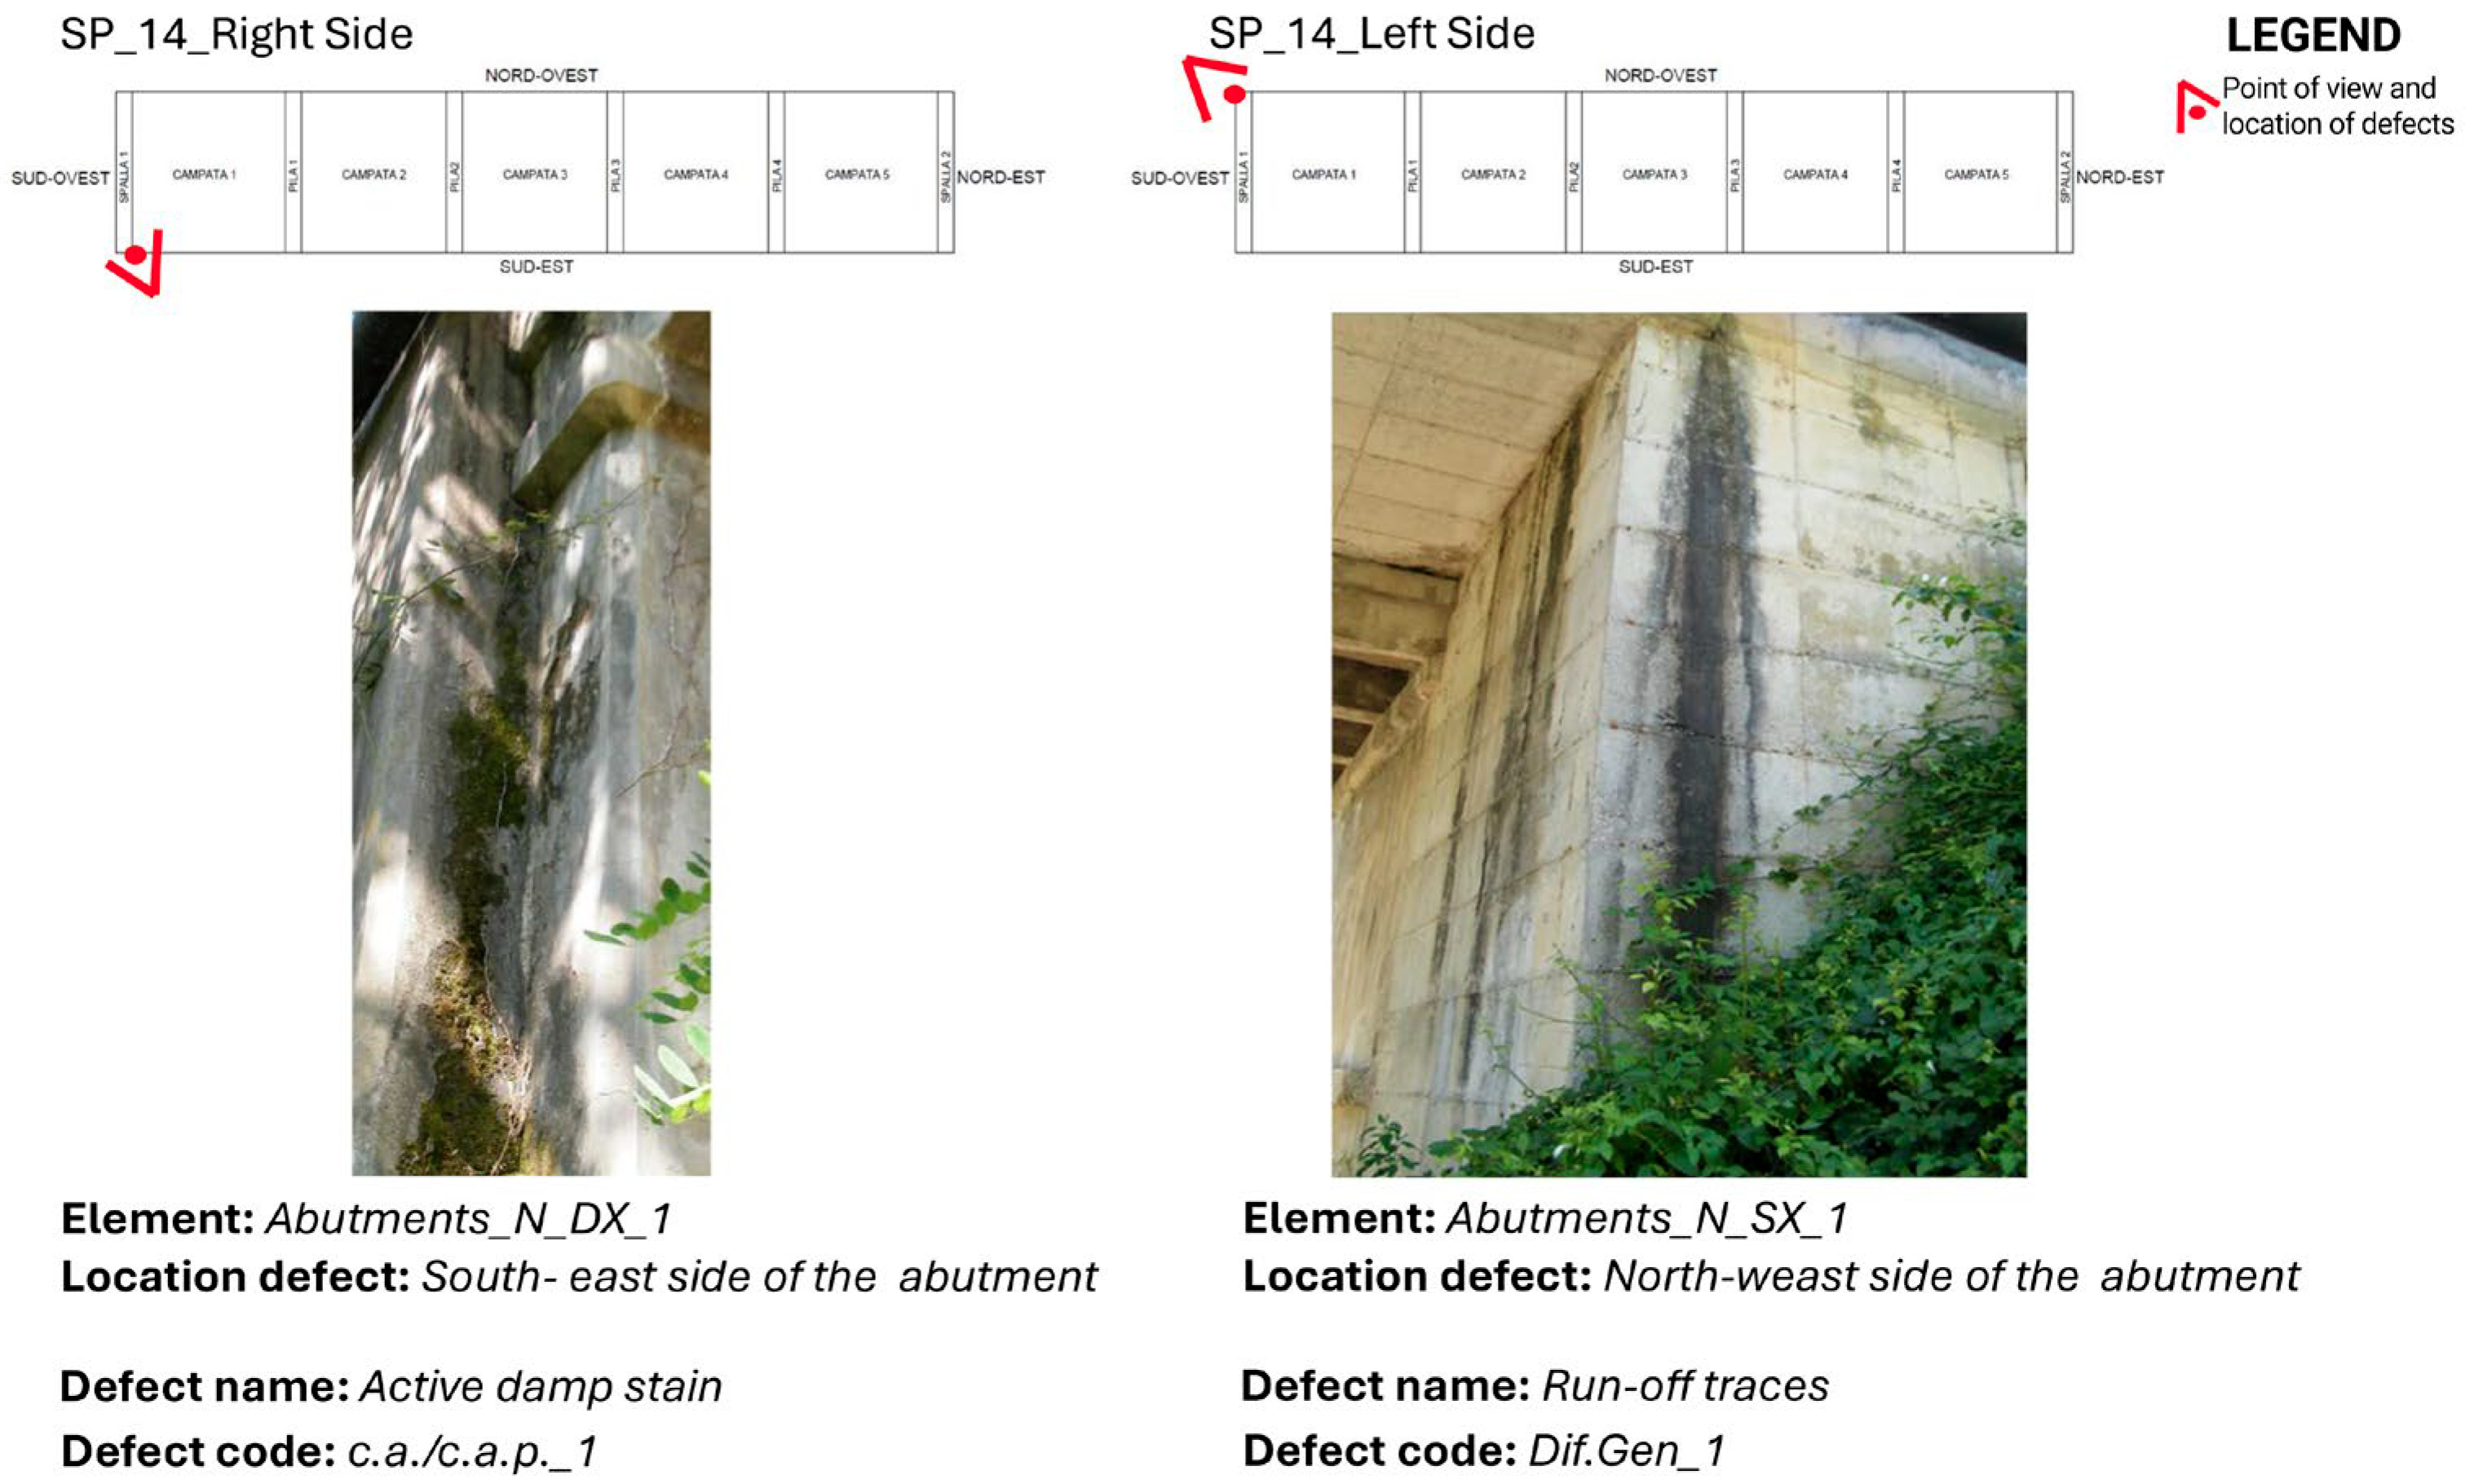
The high-resolution images obtained by drone and reflex camera were used to visually identify and characterize surface defects, in particular moisture stains, runoff phenomena, concrete spalling, localized erosion, and cracks (
Figure 10).
The high image resolution, together with the data derived from the photogrammetric survey, enabled the detection of subtle surface anomalies and supported an effective localization and mapping of damaged areas, including defects in otherwise hard-to-reach locations. Although remote inspections are not intended to systematically replace arm’s-length direct visual inspections, in accordance with current national regulations, they constitute a valuable operational support in situations where direct access is limited, as well as in the verification and validation of inspection reports by infrastructure management personnel. Moreover, it is a topic worth investigating to support and validate the AI-based automated defect recognition procedure [
22,
23], which, in principle, is able to boost the exploitation of image databases.
Therefore, the information derived from the digital survey supported the completion of the inspection form, integrating morphological, material, and descriptive data in accordance with the hierarchical structure defined by infrastructure management standards: asset, structural part, component, and defect.
To ensure a proper tracking of information and an automated updating of the BrIM model parameters in this phase, a unique identification code based on the bridge’s hierarchical structure was also defined. The code is made of several alphanumeric sections that identify the following: the component type; the orientation; the side of the structure; the sequential element number; and, where necessary, the span number reference. This coding logic establishes a direct mapping between the database record and the corresponding BrIM model element, forming the operational basis for the Dynamo graphs.
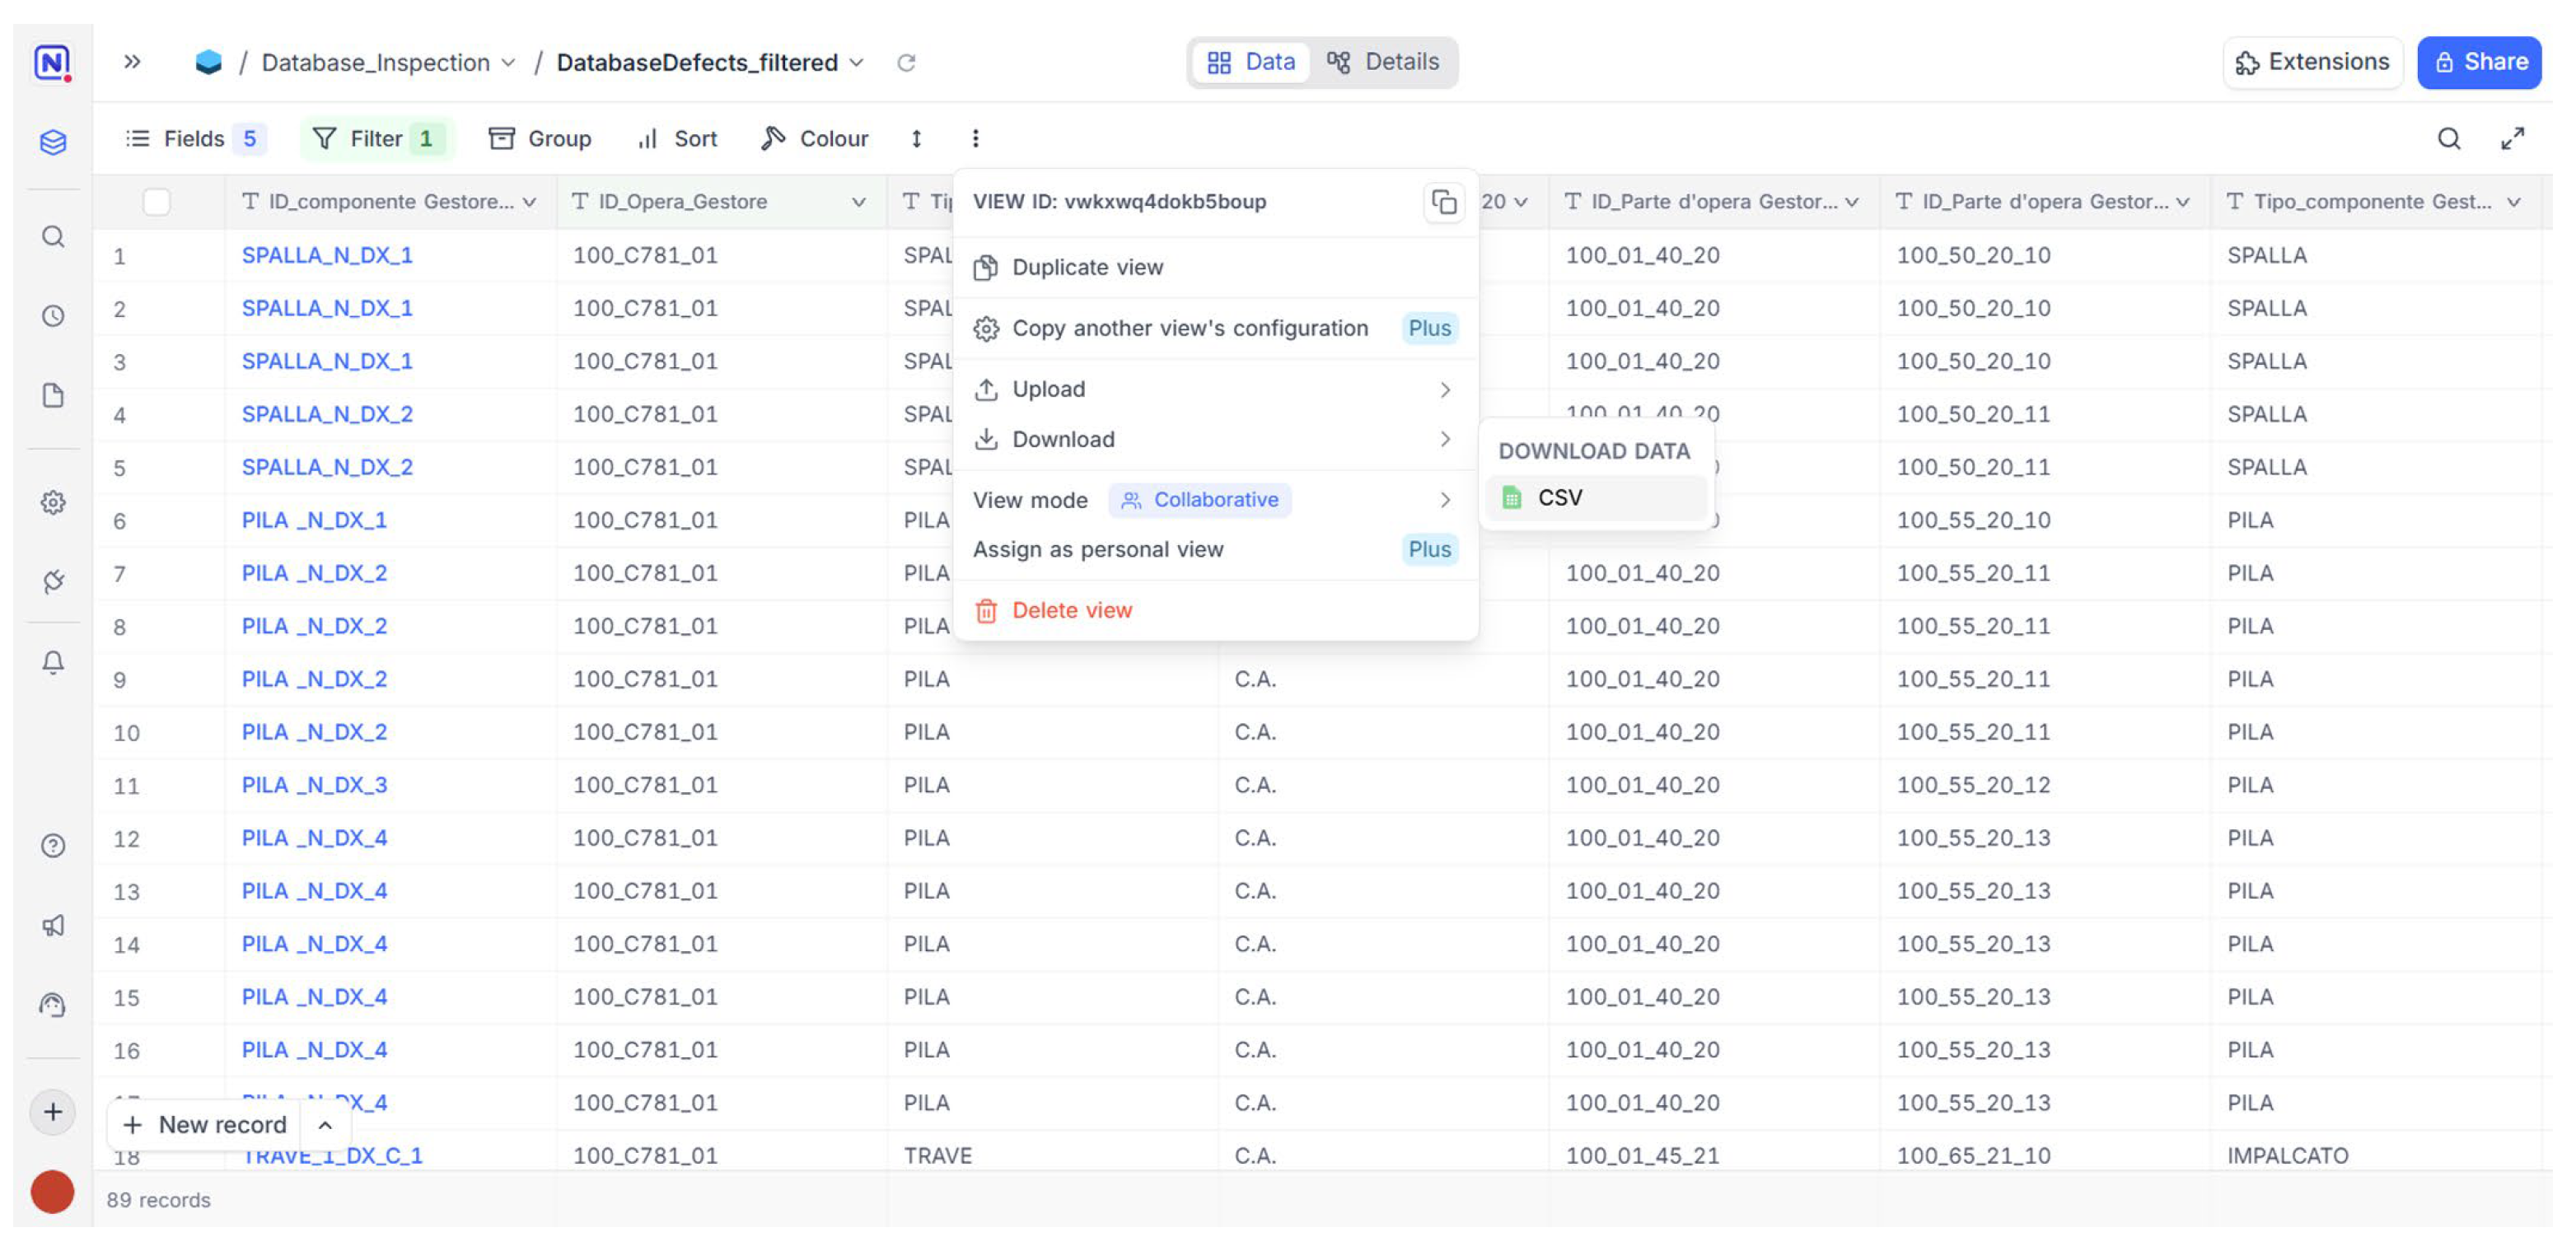
Once the inspection phase was complete and the inspection form had been filled in, the grid view was filtered to extract a selected subset of relevant data fields for exporting to CSV (
Figure 11). This file serves as the input for tailored Dynamo graphs for the automated updating of model parameters, thereby ensuring interoperability between the BIM environment and the external database.
The entire system is designed with a flexible and scalable configuration and represents some concrete, replicable outcome of the experimental workflow. It effectively integrates heterogeneous data, facilitates the direct and collaborative collection of inspection information, and ensures data traceability within a process focused on scheduled maintenance and the conscious preservation of bridges, laying the basis for an operational, data-driven BrIM model.
3.3. Information Modeling of the Bridge
In the management and maintenance of existing bridges, it is recommended to have BIM models with a high Level of Development (LoD), both from a geometric point of view (LoG) and from an informational one (LoI), in line with current regulations [
75,
76]. These models must be constantly updated to integrate data collected in the field during periodic inspections and monitoring.
The parametric modeling of the test bridge was carried out starting from a critical review of the available technical documentation, combined with the data collected during the survey phase and the completion of the inspection forms. This enabled the analysis and understanding of the main characteristics of the structural components, which were then semantically decomposed and modeled, highlighting the geometric and structural relationships between the different elements.
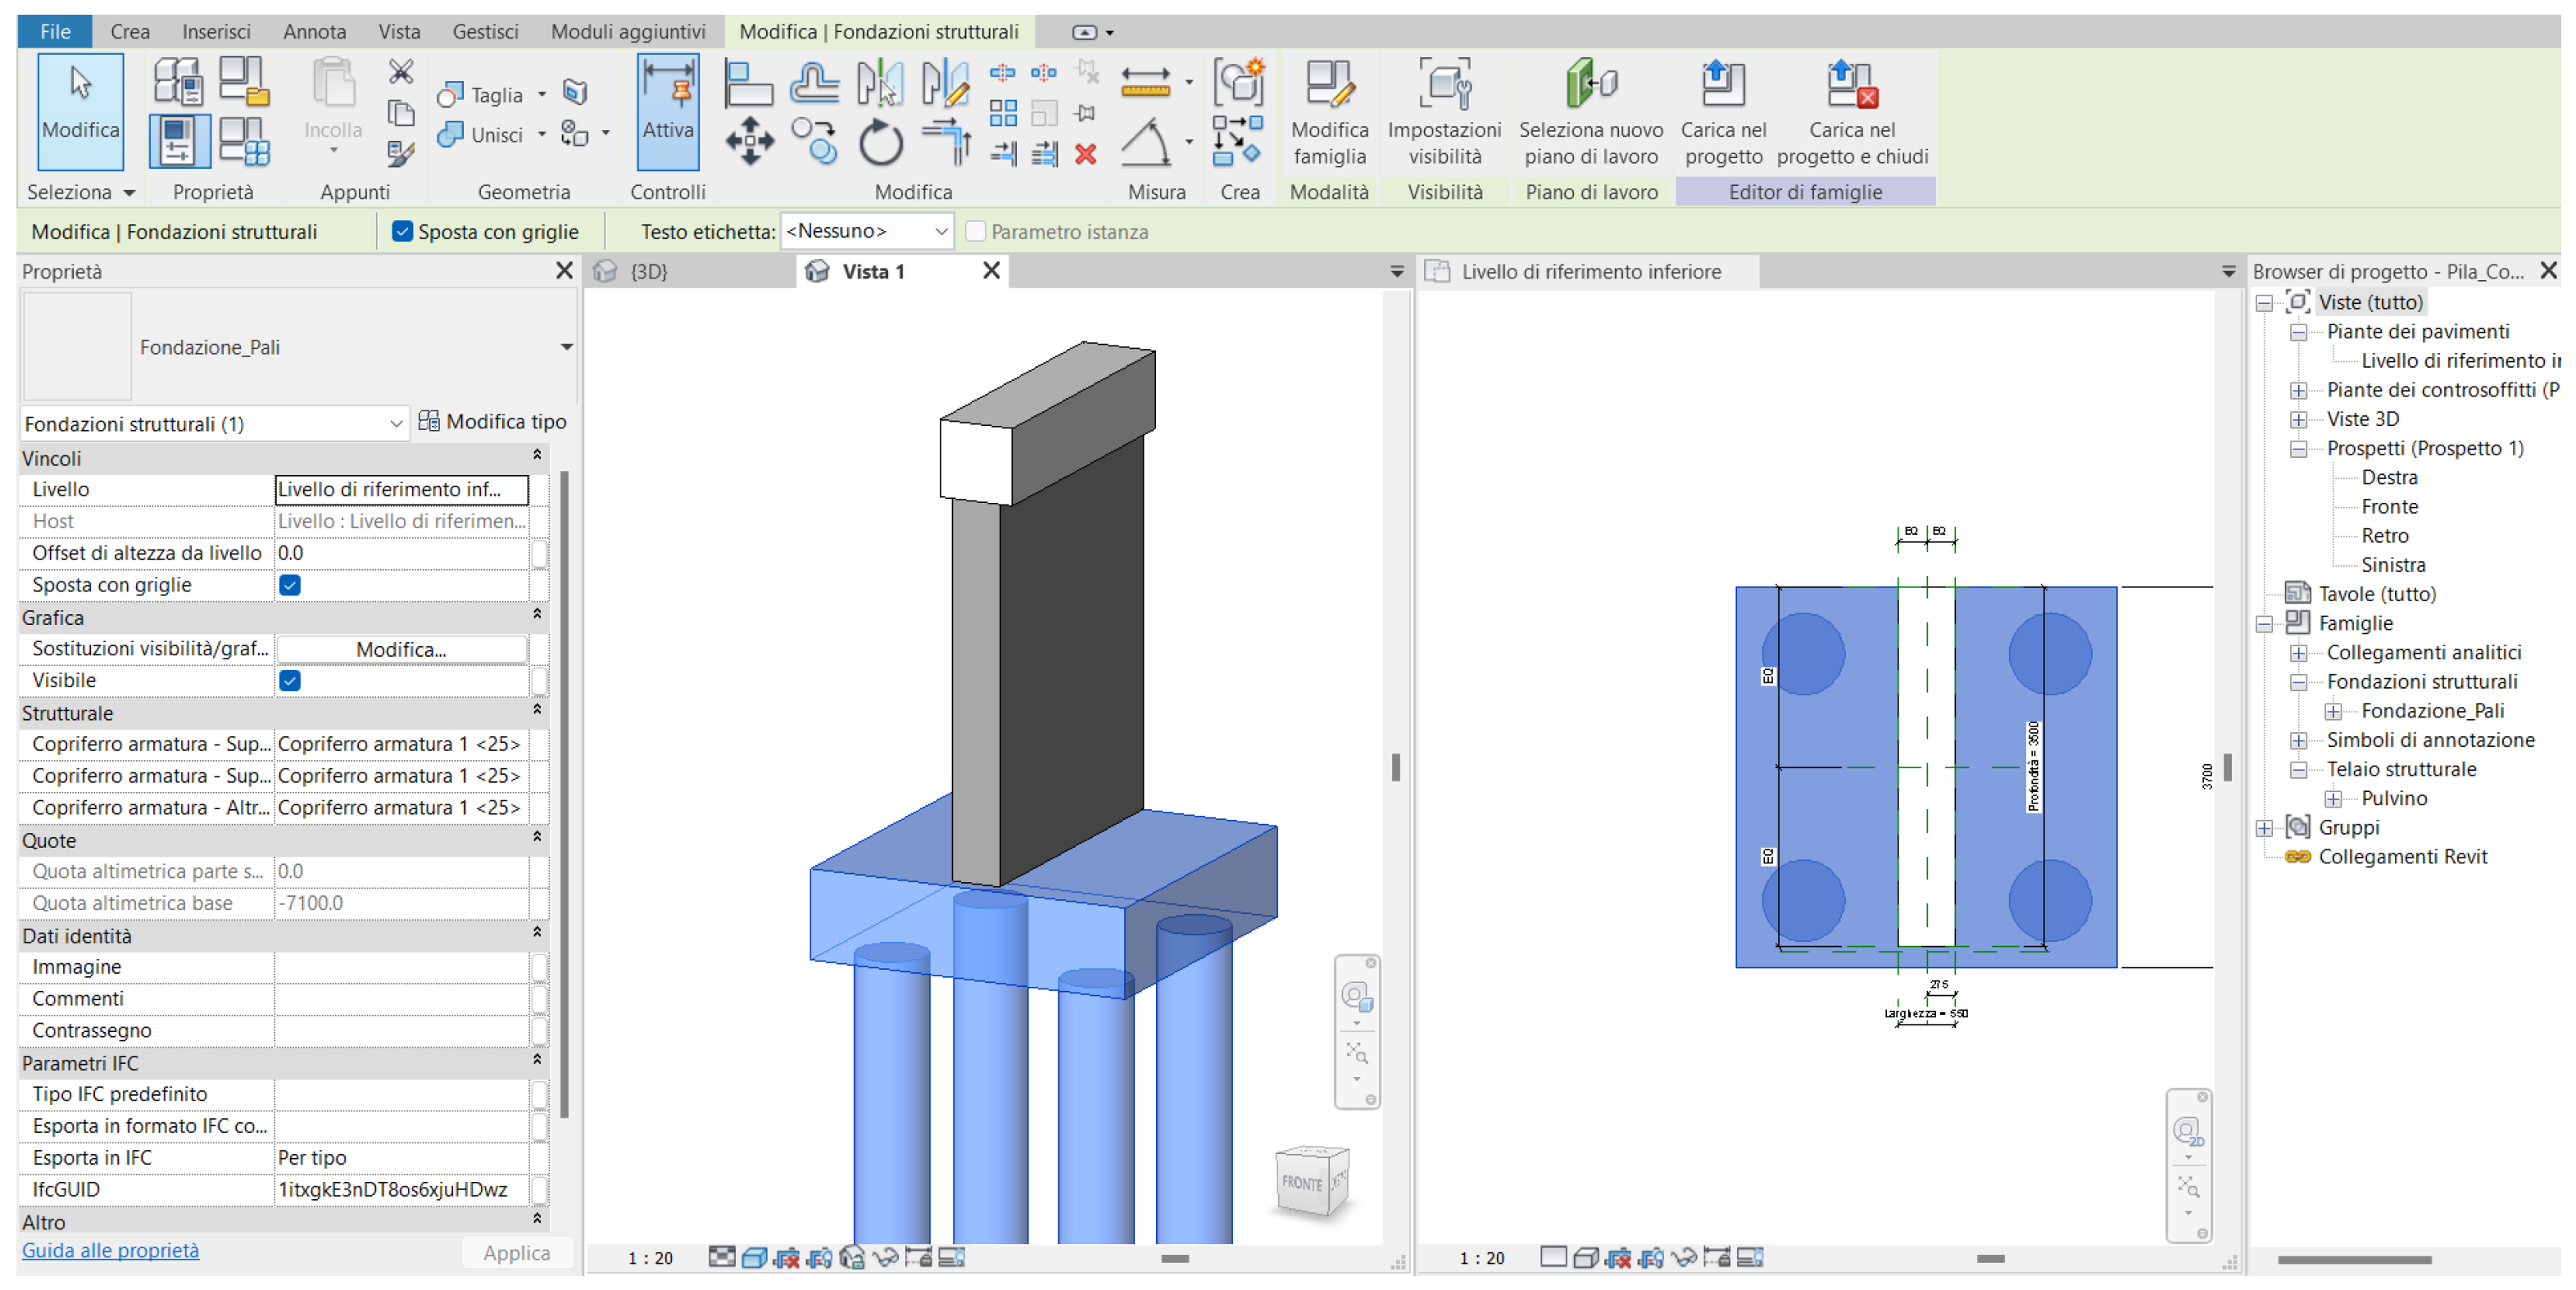
A library of parametric objects was then created to represent the repeatable components of the bridge, in which dimensional and proportional parameters were defined to ensure adaptability to different design requirements (
Figure 12).
The entire modeling process was developed using Revit software (Autodesk), following the scan-to-BIM approach, which was already tested and validated in previous experiences on historic masonry arch bridges [
40]. Once the photogrammetric point cloud was imported into the software, the main reference levels (roadway, beam extrados, foundation) were defined, facilitating the subsequent creation of the 3D model. The modeling was carried out according to the semantic decomposition of components elaborated in the Element Details Form. Novel object libraries and system families that comply with the Level of Information Need (LoIN) requirements for inspections tracking enhance the information model based on a level of development corresponding to LOD E-defined object (
Figure 13). Gathering additional and specific information on structural details, as well as integrating maintenance data for facility management, will enable a higher level of detail to be achieved that is consistent with the subsequent LODs set out in the UNI 11337 standard [
75]. In addition, an assessment of the model’s geometric accuracy yielded a standard deviation of 0.012 m, corresponding to a high level of accuracy (LOA), specifically LOA30 according to USIBD [
78], for inspection and facility management purposes.
To ensure maximum interoperability of the BIM model, the elements of the Revit model were mapped to match the entities of the IFC 4.3 standard [
77]. The information structure of the elements was adapted according to the recommendations of the Guidelines for Bridges and Viaducts by buildingSMART Italia [
38], modifying the IFC classes (IfcBuiltElement, IfcElementAssembly, IfcGroup, etc.) during the export phase (
Figure 14).
3.4. Automated Information Updating Through Dynamo Graphs
In order to achieve a dynamic BrIM model of the test bridge, an automation system based on tailored graphs was developed in the Dynamo visual programming environment for Revit. In detail, the object-oriented VPL environment has been used to check, validate, and integrate the information associated with the defects identified for each component of the bridge, archived in the online database, into the BrIM model. The process, which can be directly managed in Revit through the Dynamo player, enables operators to activate the information updating routine without leaving the modeling environment.
The automated process is based on assigning each element of the model a unique identification code (“Mark”), which allows matching with the information contained in the database. Starting from this unique key, the graphs analyze the data exported in CSV format from the NocoDB database, which collects the bridge defect reports, and associate them with the corresponding elements of the model. The entire information verification and updating process is based on graphs structured in several phases and adapted to different cases, including the presence of a single inspection or multiple inspections for the same element.
The first graph reviews the information available in the database and manages the case in which the bridge component has been subject to a single inspection (
Figure 15). In the first phase, the data are imported and processed through a filtering and normalization operation to allow comparison with the values of the “
Mark” parameter and the successive matching of the values with the model elements. A significant part of the graph involves the control of the inspection dates associated with the selected element; in fact, the graph analyzes the information relating to the inspection date, performing a count through Dynamo’s native nodes. If a single inspection is detected, the data relating to the first inspection are reorganized and structured to obtain a list of distinct values for each information field and to define the number of information parameters to be created for that element (e.g., type and defect codes, relative and absolute defect values, etc.). To generate and manage the input of information related to inspection activities into the model elements, native Dynamo nodes and custom Code Blocks were used, enabling the automated creation of parameters for Revit elements, which were then enriched with the corresponding values retrieved from the list of processed data (
Figure 16).
If the first graph detects multiple inspections for the same element, a warning is generated for the operator, inviting them to create a new time phase and activate a second graph specifically designed for this case (
Figure 17a).
This second graph (
Figure 17b) has the main function of duplicating the element subject to inspection, assigning it to the new project phase, and deleting the values of the parameters already associated, in order to prepare the model to receive a new set of information. The operation is performed through a Python node, which creates a copy of the element under analysis and returns a warning message about the outcome of the operation within Revit’s Dynamo player. Then, a second Python node deletes the values of the information parameters in the copy, acting on the “Data” and “Results Analysis” groups. In this way, the new element is prepared for the association of information (e.g., inspection date, defects, corresponding weights, and defect indices) relating to a successive inspection.
Once the element copy arrangement is completed, the graph compares it with the data present in the database, filters the information relating to the second (or further) inspection, and organizes it by information field based on the identified date and specific mark. In this way, each list created is associated with a specific field, making the transition to the next nodes for updating the BIM element parameters simpler and more structured (
Figure 17c).
Both graphs were operationally applied to the test bridge. The first graph made it possible to automatically and traceably integrate the inspection results into all elements of the BrIM model. The second graph, dedicated to managing cases with multiple inspections, was instead tested on some selected components of the bridge, to which test values were assigned since no further inspections had been carried out on the bridge.
The entire process—from the import and verification of data to the automated generation and assignment of information parameters—takes place automatically, reducing the time required for analysis and parameter updating and minimizing the risk of error compared to manual filling. Furthermore, the system has proven particularly effective both in optimizing BIM model updating operations and in ensuring dynamic and traceable management of the information related to the degradation state of the asset, thus offering a more accurate and up-to-date representation over time.
4. Discussion of the Results
The outputs of the designed procedure confirm the effectiveness of an integrated approach to the digitalization of infrastructure assets, focused on interoperability, dynamic data updating, and support for management and maintenance processes. The tested workflow, which combines digital photogrammetric surveying, BrIM modeling, information management through online databases, and automated information updating through graphs, has proven its efficacy both in accurately representing the bridge’s geometry and in coherently structuring technical data.
In the current context of bridge digitalization, several studies have highlighted the difficulties related to data fragmentation, poor interoperability between systems, and the challenge of constantly updating BIM models. In this framework, the proposed procedure contributes to overcoming some of these critical issues, offering a workflow capable of constantly and dynamically connecting the activities of surveying, modeling, data archiving, and information updating. As a result, quality, traceability, and accessibility of data are guaranteed thanks to the interaction between the various elements of the described system.
Digital data acquisition plays a pivotal role in ensuring the reliability of structural documentation and analysis, providing a level of detail and precision that is useful for assessing the characteristics and current state of single elements. The choice to use an online platform, such as NocoDB, for managing census and inspection forms proved to be functional both for the relational structuring of different information and for its accessibility. The data, while maintaining a strong logical consistency, can be easily shared and accessed in an intuitive and simplified manner by different professionals and technicians. The automated updating of parameters within the informative model through Dynamo overcame the limitations of manual data input. To assess the time savings achieved by the proposed workflow, a comparison was carried out with the conventional manual approach. In a traditional workflow, creating parameters, verifying data consistency, and manually entering values for a single bridge element typically takes approximately 130 s. Using the automated workflow based on Dynamo graphs, the same operation requires only about 40 s, corresponding to a reduction in processing time of around 70%. This time saving becomes even more significant when extended to all components or to complex structures, also reducing the likelihood of errors and ensuring greater consistency and alignment between the online database and the BrIM model.
The latter, developed according to a semantic decomposition of the structure, coherent with international standards, proved to be an effective tool for integrating data from heterogeneous sources and supporting digital monitoring, management, and maintenance planning of existing bridges in an interoperable environment. In this study, the total size of the BrIM model of the test bridge, including all structural components and corresponding information, is approximately 7 MB. The complete modeling process, including semantic structuring and information enrichment via automated data updating, took around five working days, confirming the practical feasibility of the proposed workflow.
An in-depth analysis of these issues could further improve the procedure’s scalability, strengthening the digital model’s role as an operational tool for managing, monitoring, and maintaining existing bridges. It could also provide valuable insights into future workflow developments, including the use of more flexible inspection and dataset management platforms that support open systems.
5. Conclusions
The research has shown how the implementation of an integrated digital workflow, based on interoperable technologies and oriented toward automated procedures, can provide valuable tools to support infrastructure asset management, helping to overcome the critical issues related to fragmentation and obsolescence of information. The integration between bridge-informative modeling (BrIM), relational databases, and visual programming enabled not only the accurate representation of the asset but also the coordinated, dynamic, and continuously updated information.
The case study demonstrated the replicability and effectiveness of this approach, highlighting how structured and interoperable digitalization can support and improve the quality and reliability of inspection, monitoring, and maintenance processes, in response to growing emerging needs for safety, transparency, and sustainability. Indeed, the use of customized routines developed in the Dynamo visual programming environment to automate the import, comparison, and updating of inspection data from the NocoDB CSV file to the Revit model parameters ensured a high degree of automation and complete synchronization between the database and the model. The modular structure of these routines facilitates their adaptation to different BrIM models through modification of the reference CSV file, thereby supporting the management of multiple bridges. Furthermore, the system architecture is based on open-source platforms and open, interoperable standards, which allows its application beyond the national context. Adapting the inspection module records and parameter classification to local standards enables the workflow to be replicated in international scenarios. In addition, NocoDB’s ability to concurrently handle data access and version control mechanisms, along with Dynamo routines’ capacity to function within shared BIM environments, enables a collaborative operation among multiple users.
Notwithstanding the encouraging results herein reported, some aspects of the proposed workflow still require further development. First, the procedure for updating information is divided into two different graphs that handle single and multiple inspections separately. To guarantee easy use even for non-experts, it would be advisable to integrate the two graphs into a single code to minimize the number of manual inputs required. Another important consideration concerns the duplication of model elements to manage inspections over time; this operation tends to increase the size of the source file, making the management of complex or multibridge models more computationally demanding in the long term. Therefore, it may be useful to evaluate alternative solutions, such as web platforms specifically designed for managing temporal data, to improve the procedure’s efficiency. Additionally, the use of non-open-source software, such as Revit, poses a challenge for the transferability of the procedure to different software platforms.
In the broader framework of infrastructure digitalization, this work offers interesting perspectives for extending the workflow to cover other types of bridges, integrating sensor systems for real-time structural monitoring, and aggregating data related to the territory. These advancements can enhance the predictive and decision-making capabilities of the authorities responsible for management.
Resolving the critical issues highlighted above could lead to the implementation of dynamic web platforms that provide a continuously updated temporal representation of technical and territorial data. This would enable multiple risk assessments and analysis of the interactions between the structure and its environment. Such developments could lead to an enhanced Bridge Management System supported by advanced visual tools and/or real digital replicas (twins), ensuring a more informed and effective decision-making. Furthermore, these developments could strengthen the role of the digital information model as an operational tool in the management and maintenance processes of existing bridges.
