1. Introduction
In highway tunnels, the design and operation of ventilation systems are critical for ensuring air quality and traffic safety. This challenge becomes particularly pronounced in high-altitude regions, where environmental factors such as thinner air and lower atmospheric pressure exacerbate efficiency and energy consumption issues in ventilation systems. As a core component of longitudinal tunnel ventilation systems, the performance of jet fans directly determines the overall effectiveness of these systems. However, in practical applications, the efficiency of jet fans is often constrained by multiple factors, among which the installation tilt angle of the fans emerges as a critical influencing parameter.
A significant body of research has focused on jet fans in tunnel environments, aiming to optimize ventilation systems for safety and efficiency. Xu et al. [
1] conducted numerical simulations to analyze the impact of jet fan placement at curved tunnel entrances versus straight tunnel sections on airflow velocity, pressure distribution, and pressure boost coefficients within curved tunnels. Their results demonstrated that positioning jet fans in straight tunnel sections notably enhanced pressure boost efficiency, with the pressure boost coefficient increasing by 8.5% to 27% under smaller tunnel curvature radii. Ma et al. [
2] investigated the longitudinal spacing, lateral spacing, installation height, jet angle, and deflection parameters in curved tunnels based on jet flow characteristics. Li et al. [
3] developed a tunnel ventilation network model using the Scott–Hinsley algorithm and validated its reliability through field measurements. Their study further identified tunnel slope and fire-induced pressure as critical factors influencing smoke distribution.
CFD and experimental studies on tunnel ventilation. The objective of Lee et al.’s [
4] paper is to realize a CFD (Computational Fluid Dynamics) analysis to evaluate the ventilation characteristics of the Banana Jet Fan with different pitch angles (0~20 degrees) and to determine the optimal angle. Tao et al. [
5] obtained an OPA of 8° for a jet fan with a diameter less than or equal to 900 mm and 6° for a jet fan with a diameter more than 900 mm. In Wang et al. [
6], a tunnel under construction at an altitude of 3500 m in the Sichuan–Tibet Railway was taken as the background; the key parameters of jet tunnel ventilation technology were simulated numerically and analyzed by combining the response surface method while taking the altitude factor into consideration. The obtained results demonstrate that two jet fans with an air volume of 2250 m
3/min could boost the tunnel air pressure by 12.85 Pa, making the air flow smoother in the tunnel. Wu et al. [
7] analyzed the flow field characteristics and variations in the cross-sectional average static pressure of jet fans in curved tunnels, revealing that the installation configuration of jet fans exerts a decisive influence on tunnel ventilation efficiency.
Ventilation network design and pollution control. Wang et al. [
8] conducted field measurements to derive altitude-dependent correction coefficients for carbon monoxide and particulate matter concentrations in operational tunnels. Based on these findings, they subsequently developed ventilation control standards tailored for high-altitude regions, explicitly accounting for environmental constraints such as low atmospheric pressure, hypoxic conditions, and subzero temperatures. Chen et al. [
9] conducted a field experimental study addressing urban tunnels characterized by complex connectivity, high traffic volume, low vehicle speeds, and significant pollutant emissions. They developed comprehensive data reflecting composite average emission factors for carbon monoxide (CO) and nitrogen oxides (NOx) from vehicles on Chinese municipal roadways. Guo et al. [
10] employed an analogy-based methodology integrated with real-world vehicle emission testing to determine the annual reduction rate of smoke emissions in high-altitude tunnels. These findings establish critical reference guidelines for ventilation design in high-altitude highway tunnels.
Innovative ventilation strategies and numerical simulations. Wang et al. [
11] developed a comprehensive tunnel ventilation design framework encompassing optimized shaft layout, precise calculation of design airflow rates, strategic selection of cross-passage configuration locations, quantitative analysis of cross-passage air exchange efficiency, and validation of pollutant concentration thresholds. Notably, for unidirectional tunnels with longitudinal slopes spanning 7 to 10 km, they innovatively proposed a novel ventilation strategy. The study analyzed velocity fields and identified critical ventilation parameters, with simulation results demonstrating strong consistency with empirical formulas, thereby validating the methodological accuracy. The research subsequently expanded the analysis to dual-fan configurations with varying spacing combinations, evaluated through a comprehensive coefficient K. Notably, an optimized longitudinal spacing range of 100–115 m was determined to maximize ventilation efficiency. Yang et al. [
12] analyzed the key factors influencing thrust based on an analytical jet fan model and derived a tunnel-specific thrust calculation formula. Through theoretical calculations, they determined the required number of jet fans in tunnel ventilation systems, thereby providing theoretical support for the design and optimization of tunnel ventilation.
Fire and Smoke Control in Tunnels. Aliaksei et al. [
13] conducted experimental and computational fluid dynamics (CFD) simulations to investigate smoke flow dynamics in inclined tunnel fires. They developed an empirical model characterizing the longitudinal attenuation of smoke temperature and velocity along the tunnel axis. These findings hold significant practical implications for enhancing tunnel fire prevention strategies. The research conducted by Betta V et al. [
14] employed CFD software (Fluent Inc.) to simulate tunnel ventilation performance under various operational scenarios. The study revealed that the installation angle of jet fans (ranging from 0° to 10°) exerts a significant influence on both pressure distribution within the tunnel and temperature control during fire incidents. This minor adjustment was demonstrated to substantially enhance tunnel safety performance, while providing critical reference for the optimization of ventilation design. Ciro Caliendo [
15] and other researchers evaluated the safety benefits of flame-retarded asphalt in tunnel pavements during fires. CFD simulations show that adding flame retardants reduces CO and CO
2 levels, lowers evacuation risks, and improves firefighter safety compared to traditional asphalt. J. Glasa, L. Valasek, L. Halada, and P. Weisenpacher [
16] demonstrated how to use the Fire Dynamics Simulator (FDS) and its Evac (Fluent Inc.)module to model fire and evacuation in road tunnels. It analyzes the behavior of individual and group evacuees in fire scenarios, highlighting the impact of fire on evacuation and specific features of using FDS + Evac for tunnel fire simulations.
To optimize the installation angle of jet fans in high-altitude tunnels and enhance their operational efficiency, this study addresses the performance degradation of jet fans under low atmospheric pressure and reduced air density at high altitudes. Focusing on a 3300 m altitude highway tunnel, we established a full-scale three-dimensional numerical model of a longitudinal jet ventilation system. Through CFD simulations using FLUENT software (ANSYS 2022 R1), this work reveals the nonlinear relationship between installation tilt angles (0–10°) and jet fan performance, specifically demonstrating that when the tilt angle was set at 4°, the comprehensive influence coefficient of the fan reached a peak value of 0.82, with the lift pressure increasing to 19.66 Pa, representing a 16.3% enhancement compared to the conventional 0° installation. Analysis of turbulent kinetic energy (TKE) distribution characteristics revealed that the 4° tilt angle configuration achieved synergistic optimization of energy efficiency and flow field stability through two mechanisms: (1) expanding the effective jet coverage area to increase airflow influence range by 2.1 m, and (2) reducing TKE loss at the bottom region by 18.6%. This study establishes critical angular thresholds (4° tilt angle) and provides quantitative regulation criteria for parameter design of ventilation systems in high-altitude tunnels, particularly addressing the dual requirements of energy conservation and airflow control precision in hypoxic environments.
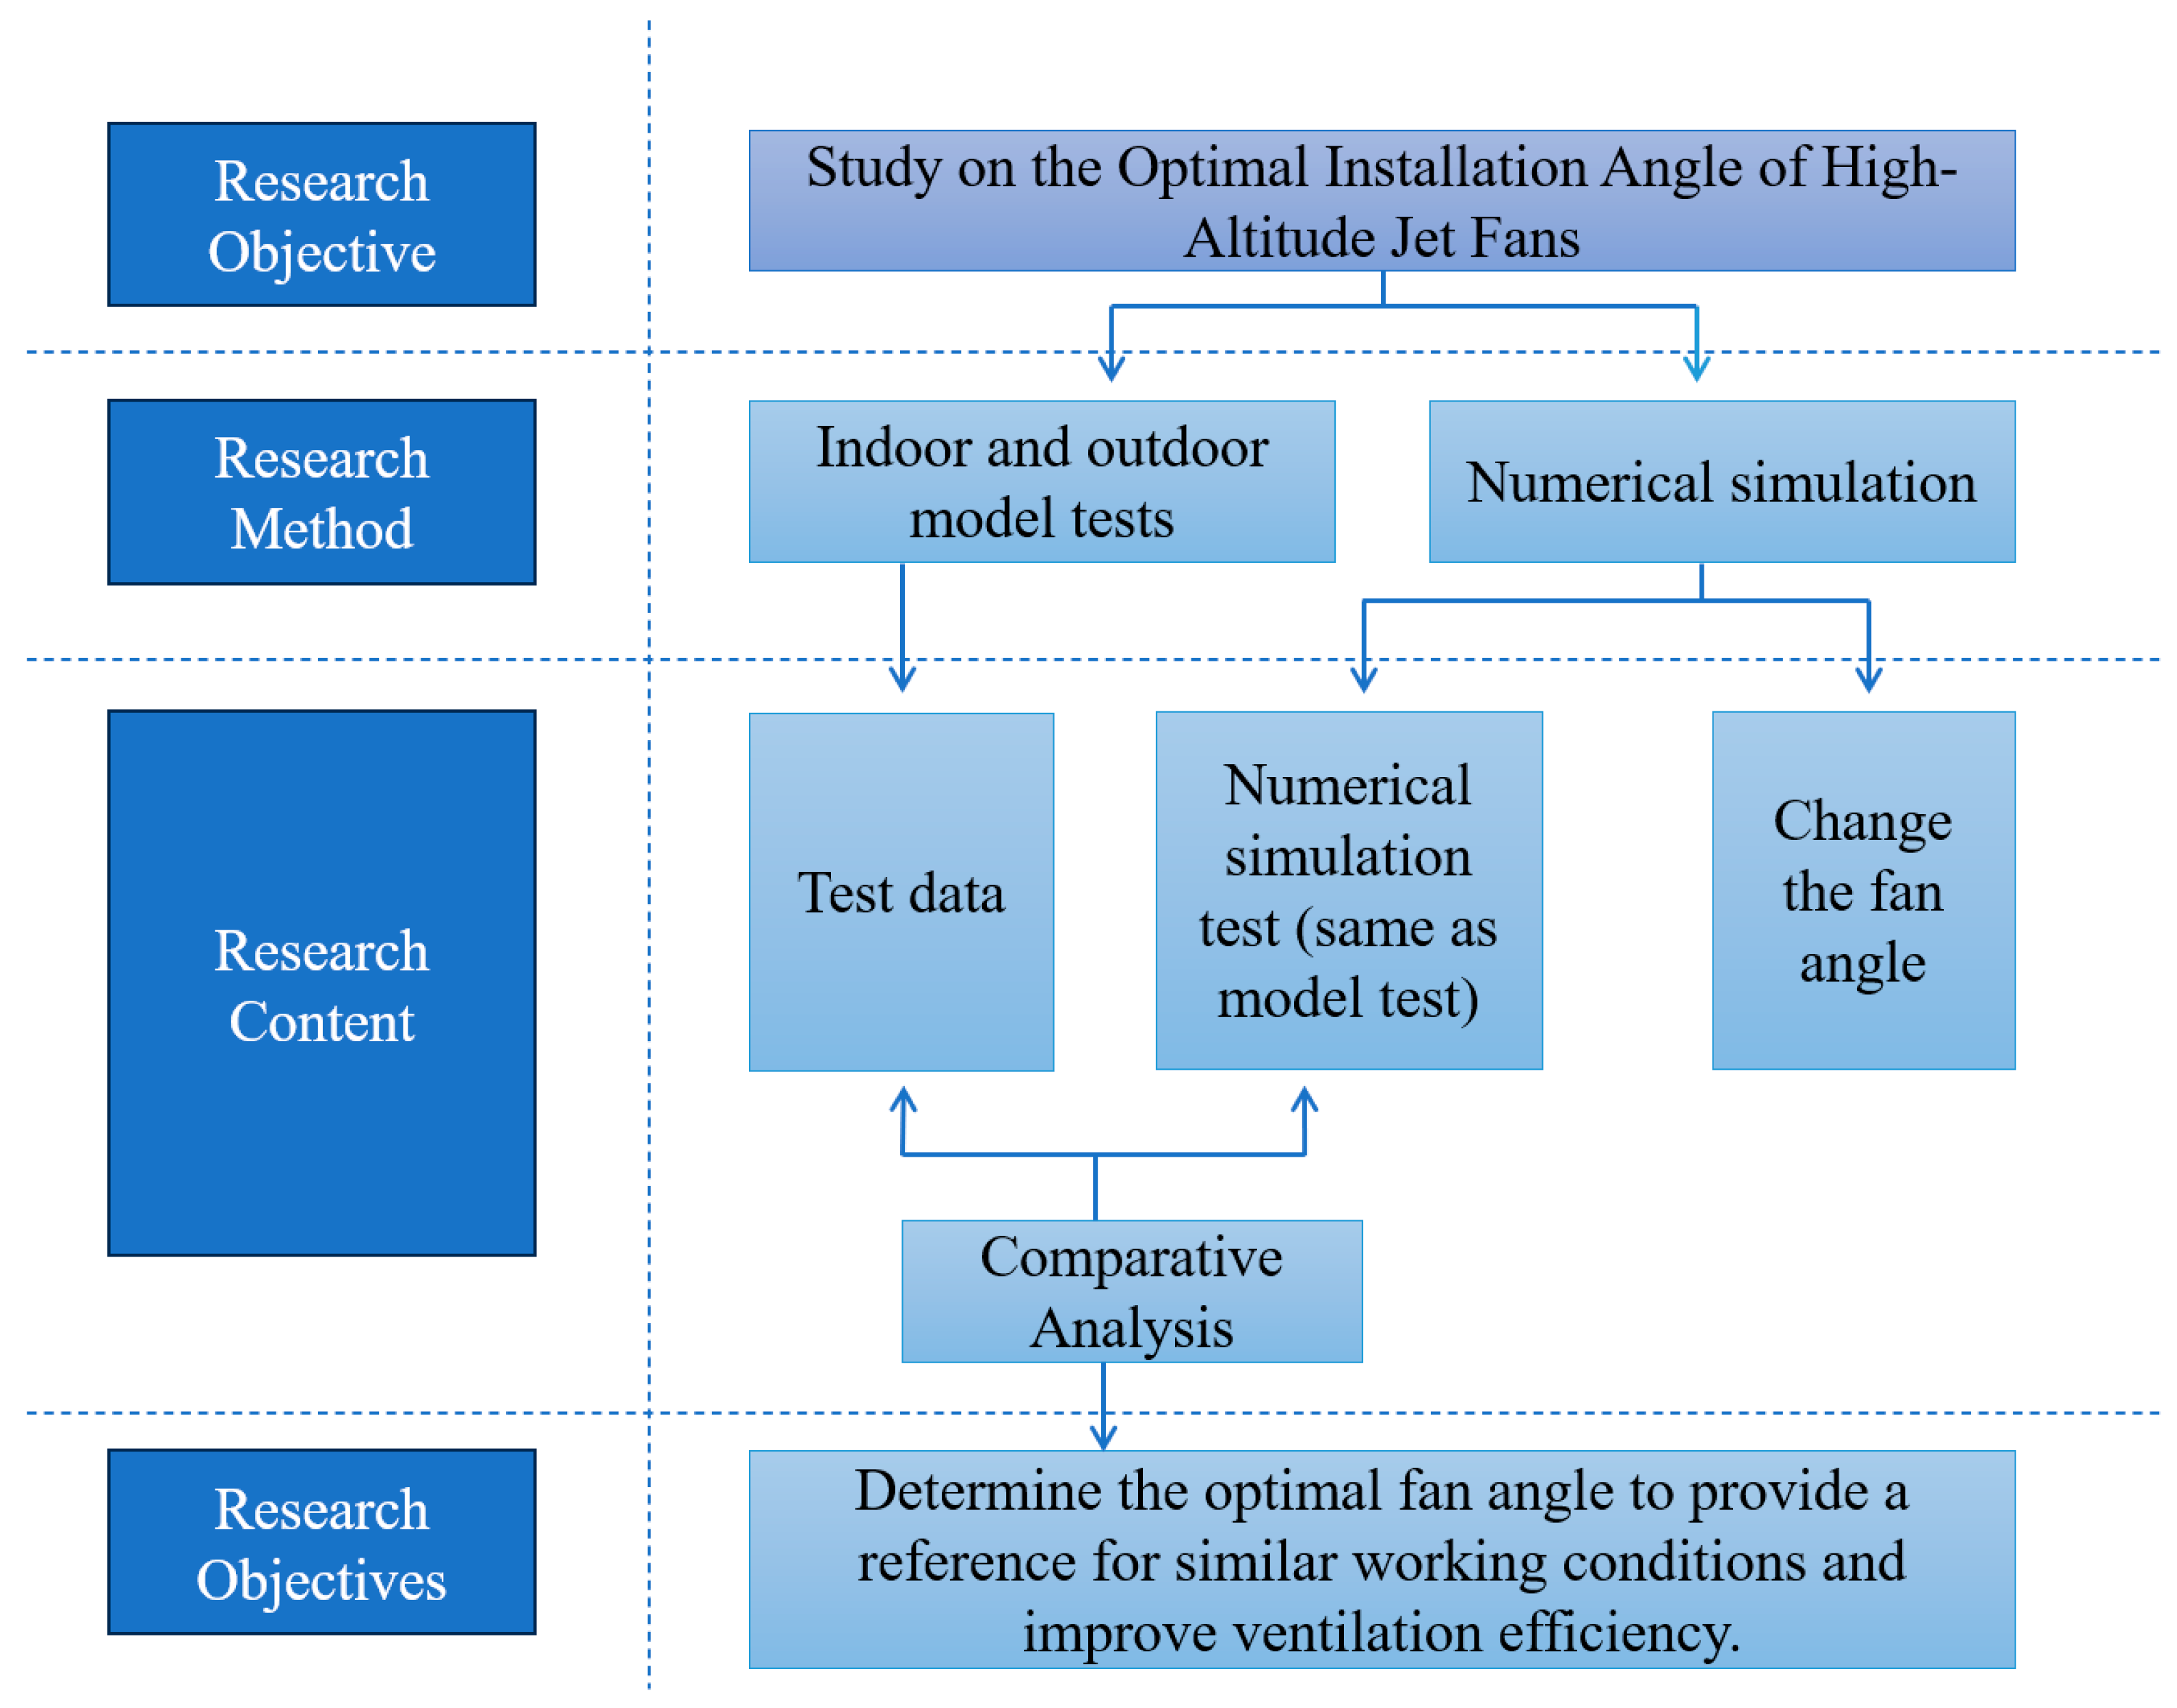
Figure 1 presents the technical steps involved in this study.
2. Engineering Context
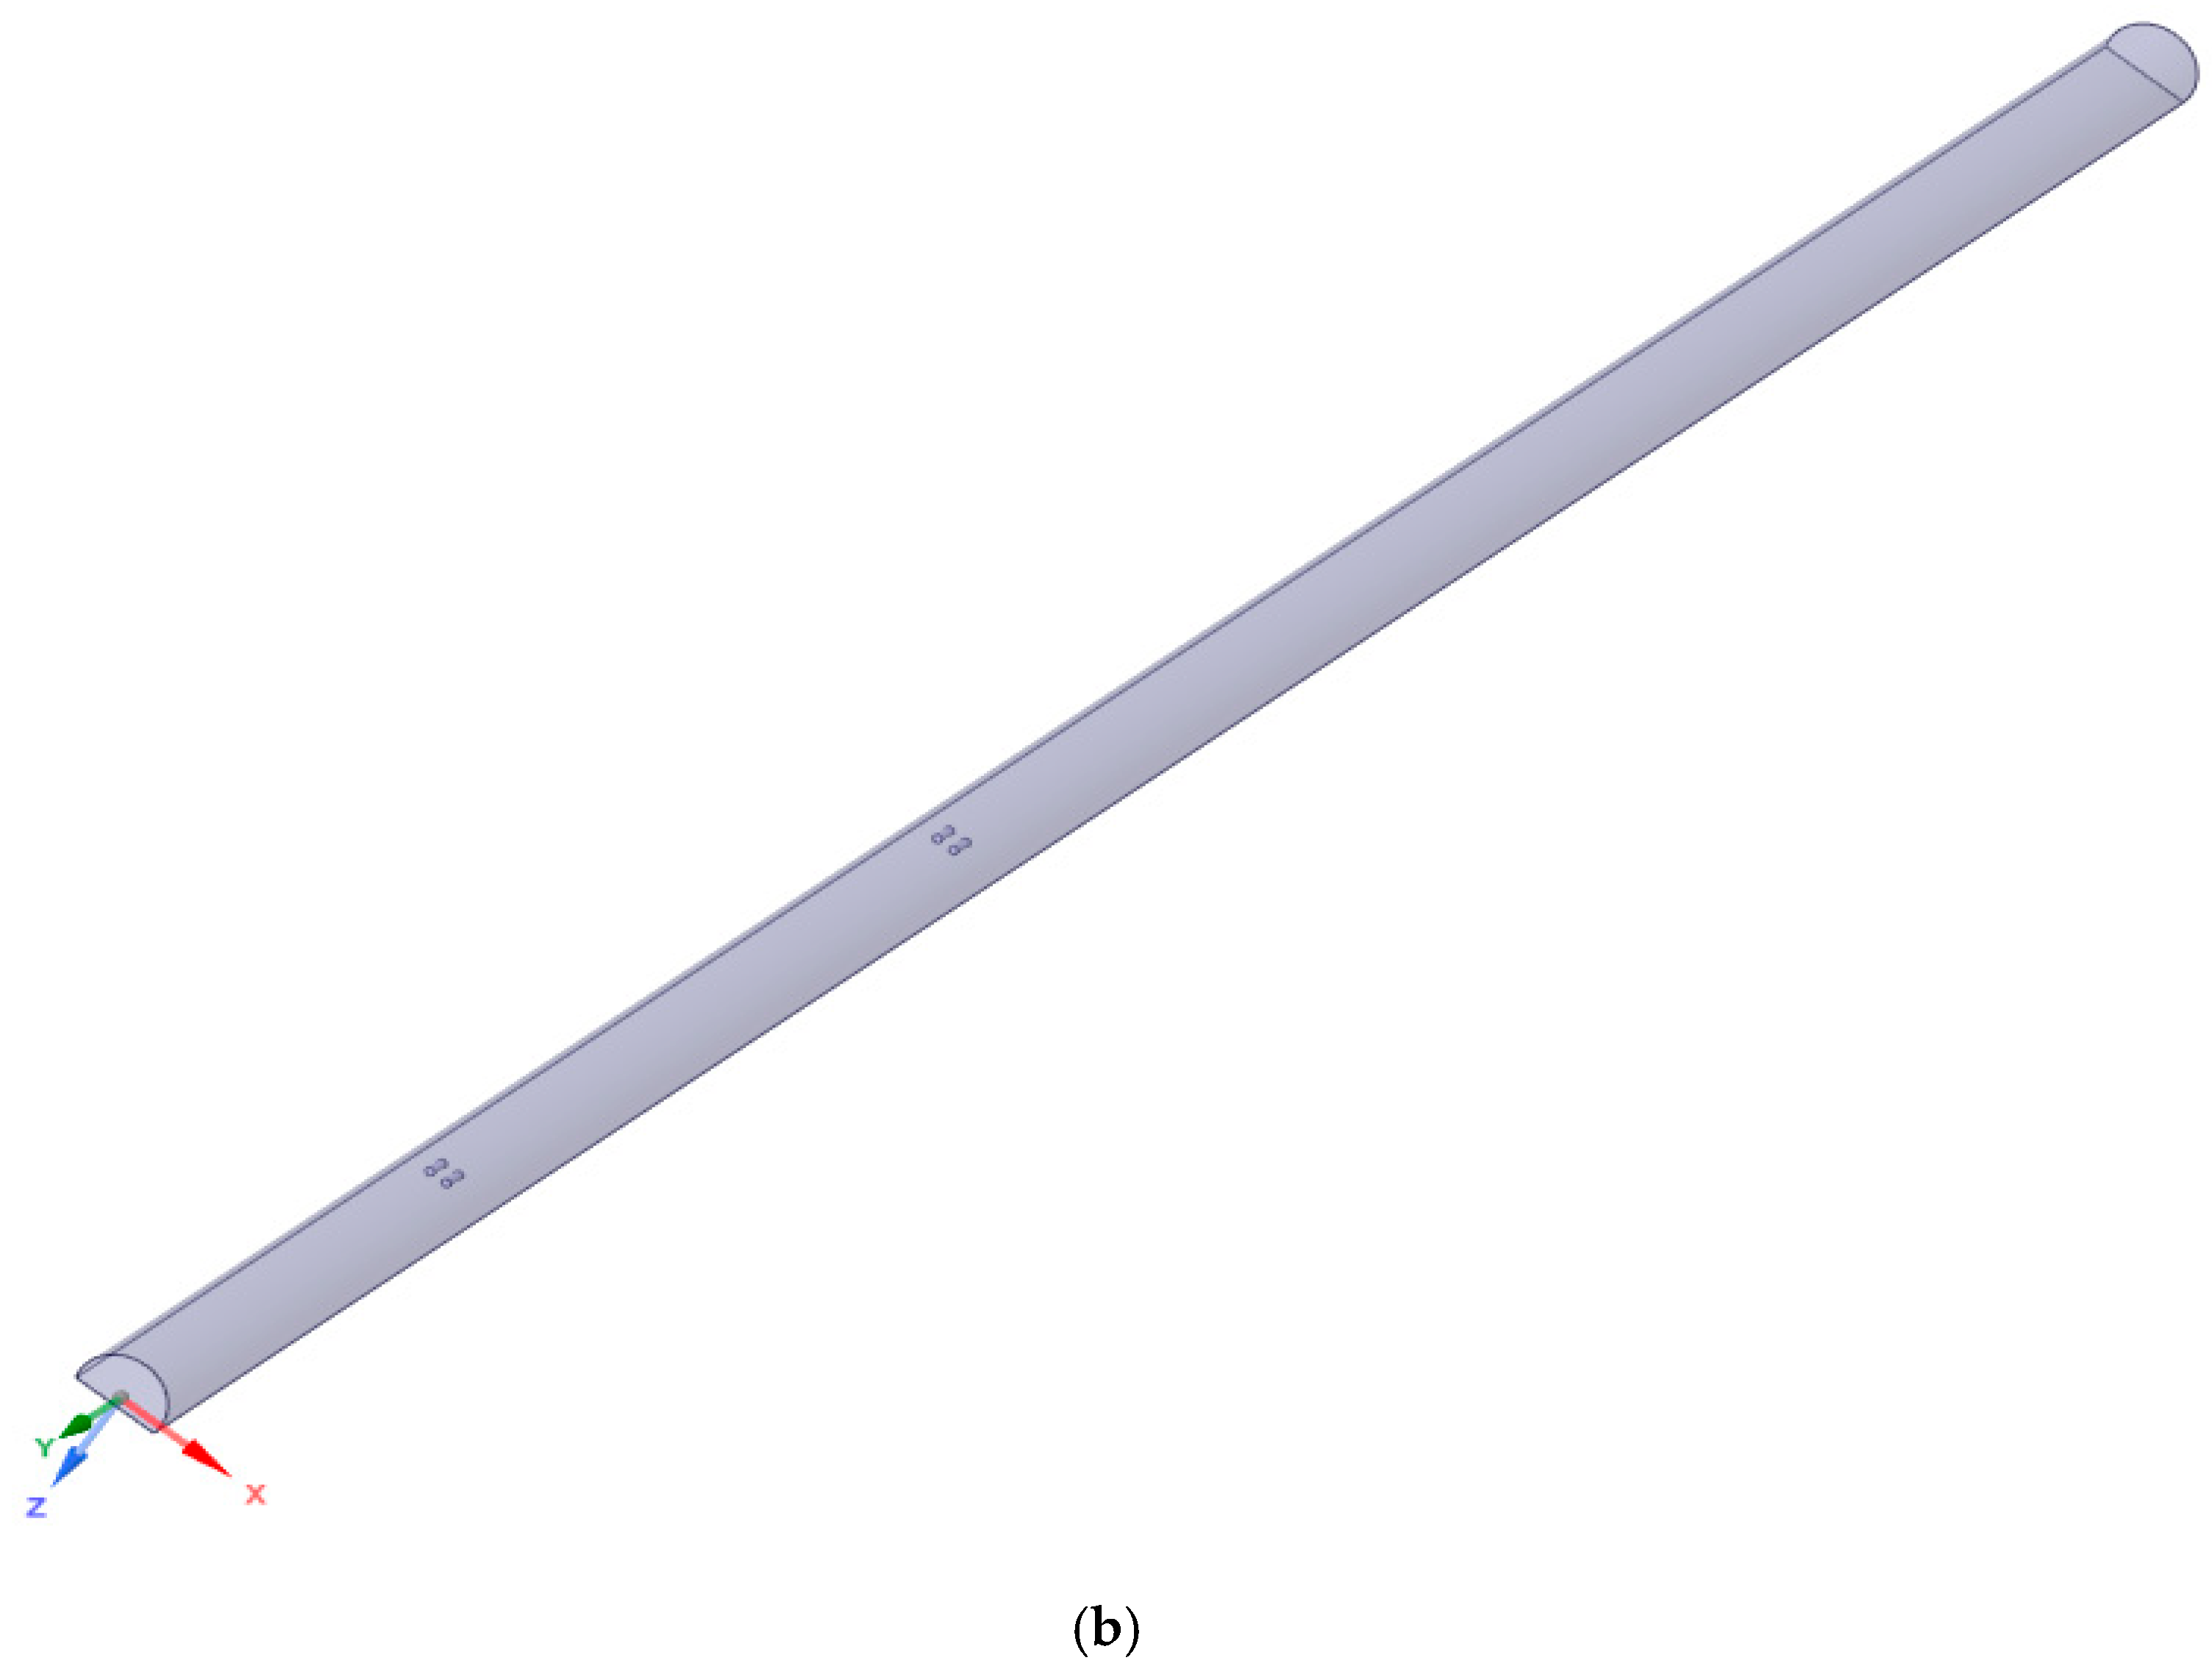
The tunnel prototype is located at an elevation of 3300 m, with a right-line length of 960 m and a left-line length of 978 m. It is situated in the Gannan alpine humid zone, characterized by a continental plateau climate. This region experiences significant thermal variations, with average annual temperatures of 4.6 °C, a peak monthly temperature of 14.8 °C in July, and a low of −7.6 °C in January. Precipitation is concentrated between May and September, accounting for 83–88% of the annual average of 580 mm. The area’s high humidity and rapidly changing seasonal conditions influence ventilation and air flow in the tunnel. To enhance computational efficiency, this study analyzes a representative 500 m segment of the right tunnel.
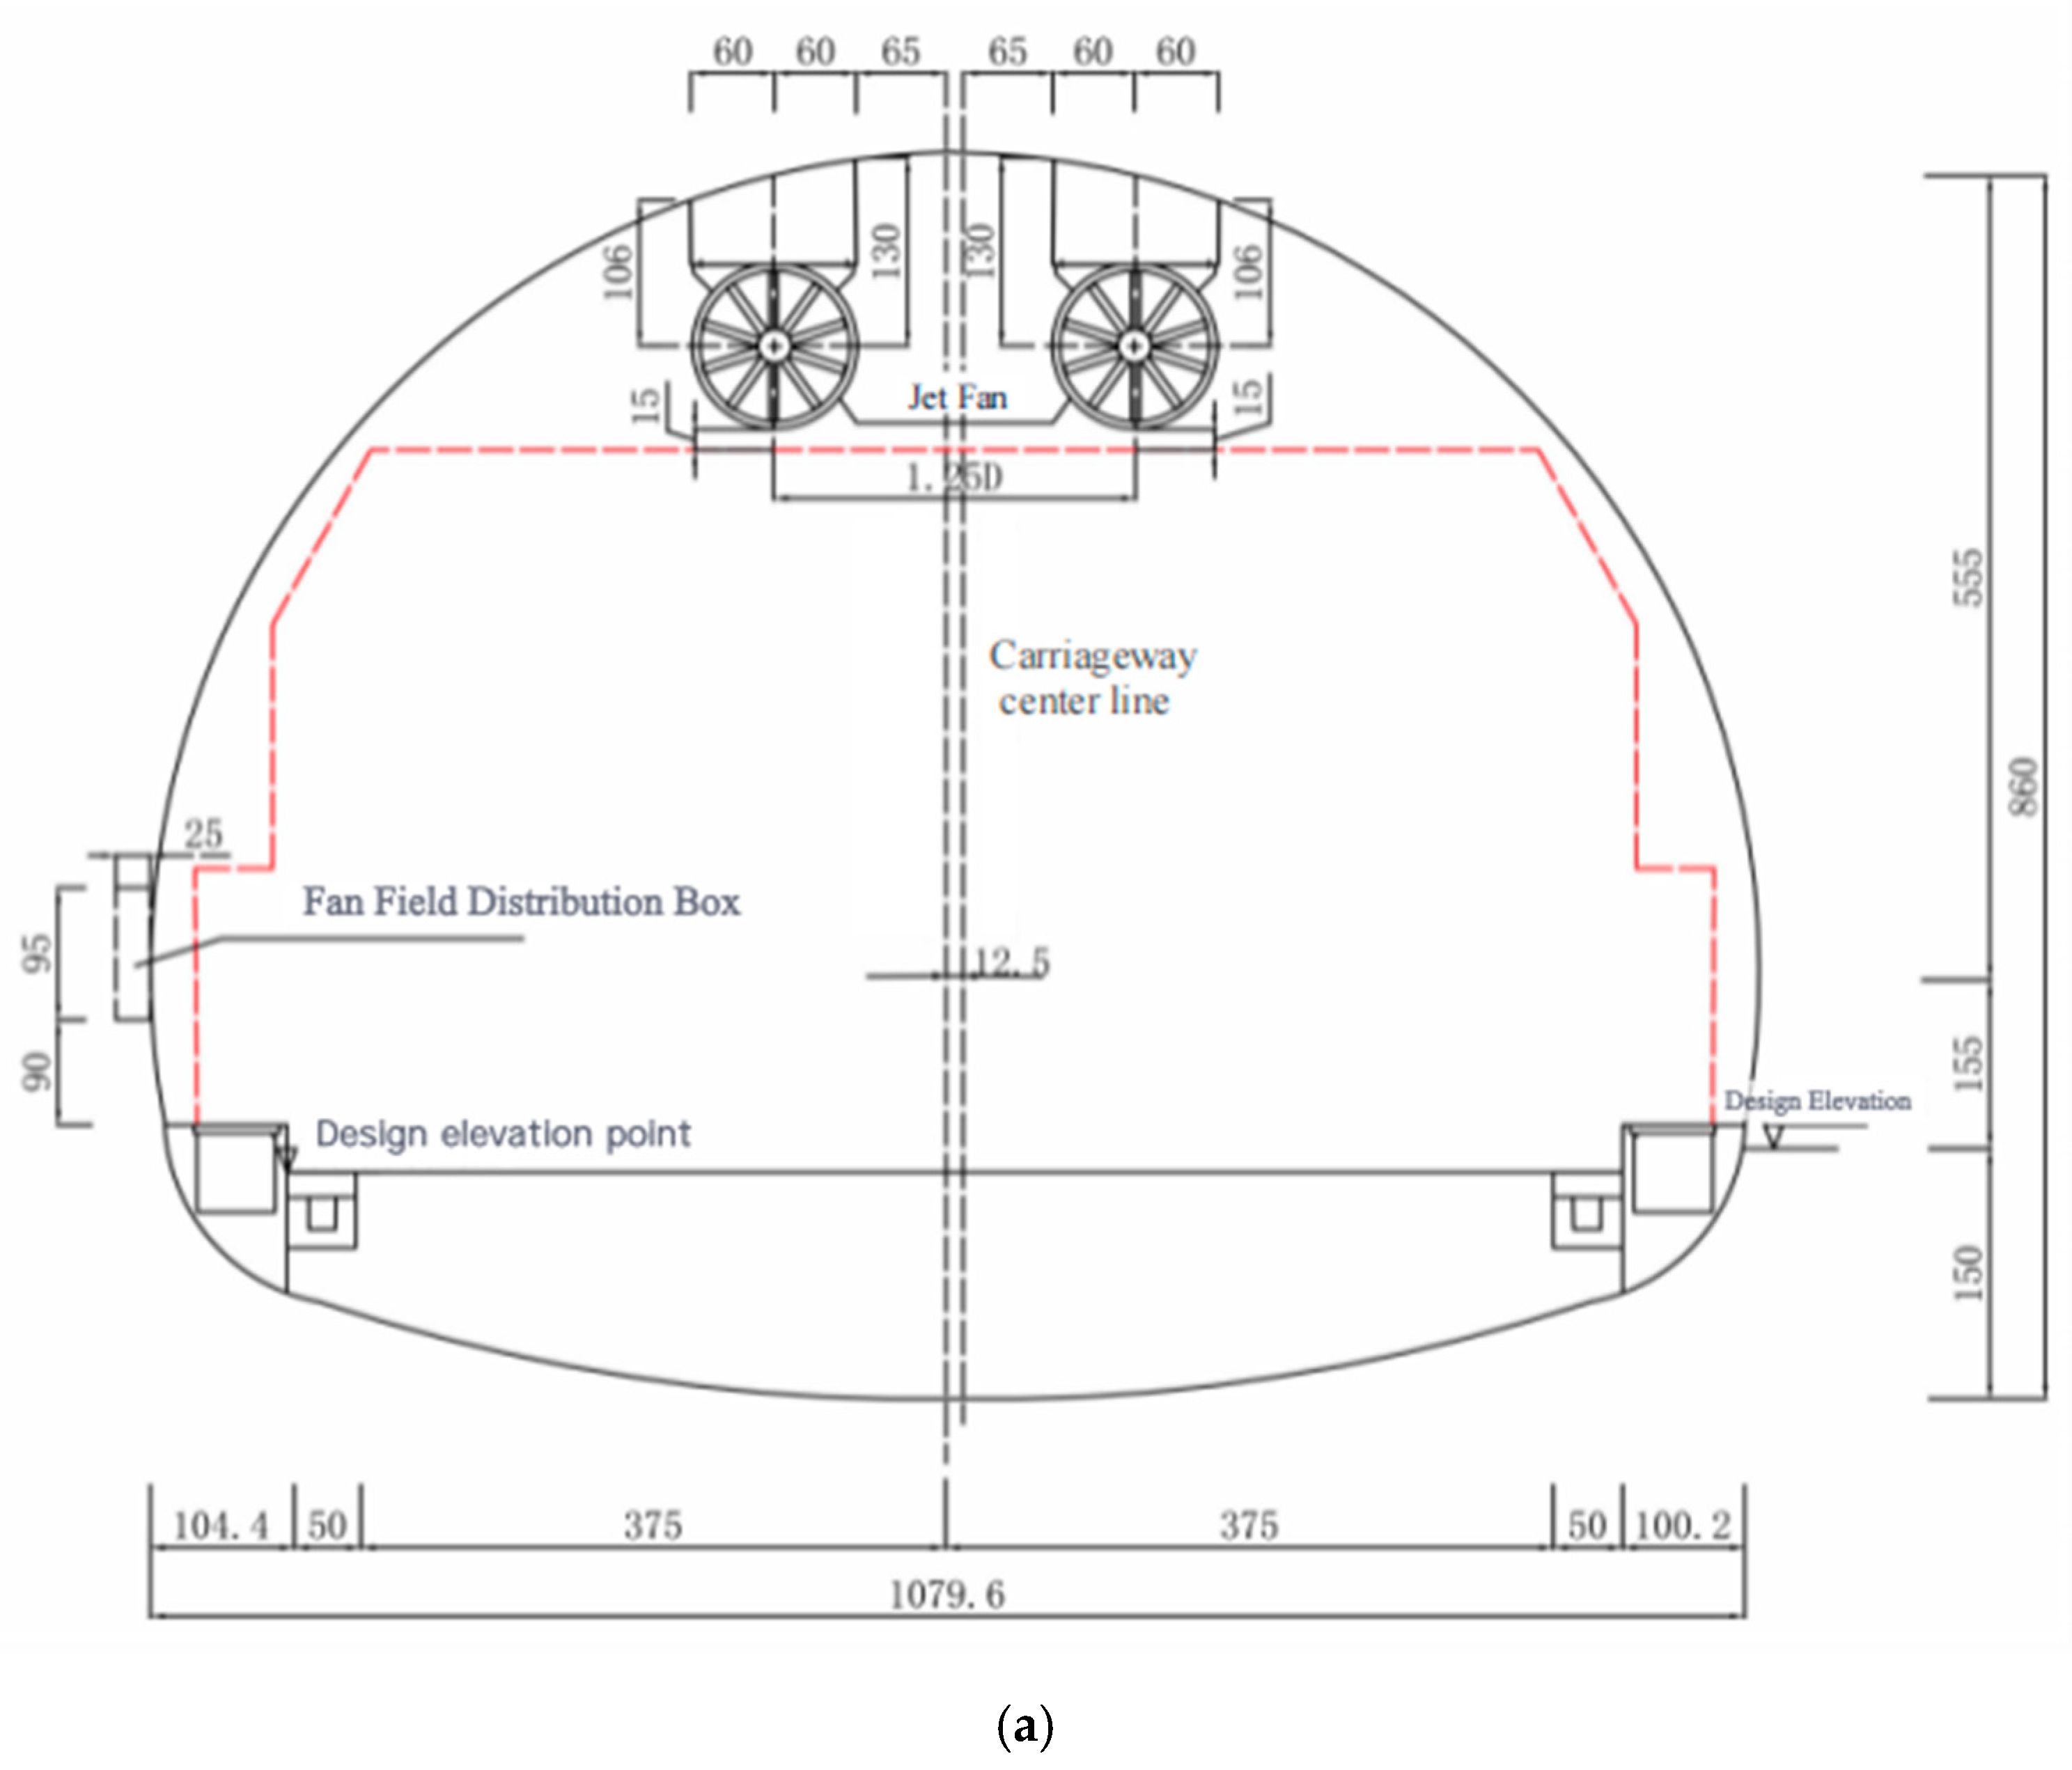
In this study, a set of two Type 1120 fans was installed in the tunnel for investigation. The fan impeller diameter is 1120 mm, and it is a two-way jet fan (reversible), which is widely used in ventilation systems such as highway tunnels, railway tunnels, and subways in China. With specific arrangement parameters as follows: positioned 100 m from the tunnel entrance, maintaining a transverse clearance of 1.25 D (where D represents the fan diameter), and spaced 0.15 m from the structural clearance boundary.
4. Model Development
4.1. Turbulence Model
The air flow within tunnel ventilation systems constitutes a highly nonlinear and intricate three-dimensional turbulent flow. Consequently, the accurate simulation of turbulent flow is pivotal to achieving precise modeling of the overall flow dynamics. The primary methodologies employed in turbulent flow research include: direct numerical simulation (DNS), large eddy simulation (LES), and the Reynolds-averaged Navier–Stokes (RANS) approach Li et al. [
17].
The present study employs the reformulated RNG k-ε variant of eddy-viscosity models, which demonstrates enhanced capability in handling strong swirling flows, curved wall boundaries, and streamline curvature effects prevalent in engineering computations. This turbulence closure scheme provides superior predictive accuracy for confined aerodynamic configurations characteristic of tunnel environments. The governing equations are formulated as follows: turbulent kinetic energy k transport, Equation (1); turbulent dissipation rate ε, Equation (2); and turbulent viscosity, Formula (3), as per Wang et al. [
18].
The turbulent kinetic energy k transport equation is as follows:
The turbulent kinetic energy dissipation rate
ε transport equation is as follows:
where
—The variation in turbulent kinetic energy under the effect of the mean velocity gradient;
—Variation in kinetic energy under buoyancy effects;
—Impact of turbulent fluctuating dilatation on total dissipation rate in compressible flows;
—Turbulent viscosity;
—The reciprocal of the effective turbulent Prandtl number for turbulent kinetic energy k;
—The reciprocal of the effective turbulent Prandtl number for dissipation rate ε;
The turbulent viscosity coefficient is calculated using the following formula:
where
;
.
Through the calibration of critical parameters , R, the modified RNG k-ε turbulence model exhibits enhanced responsiveness in resolving transient flow regimes and strongly curved streamline conditions.
4.2. Boundary Conditions
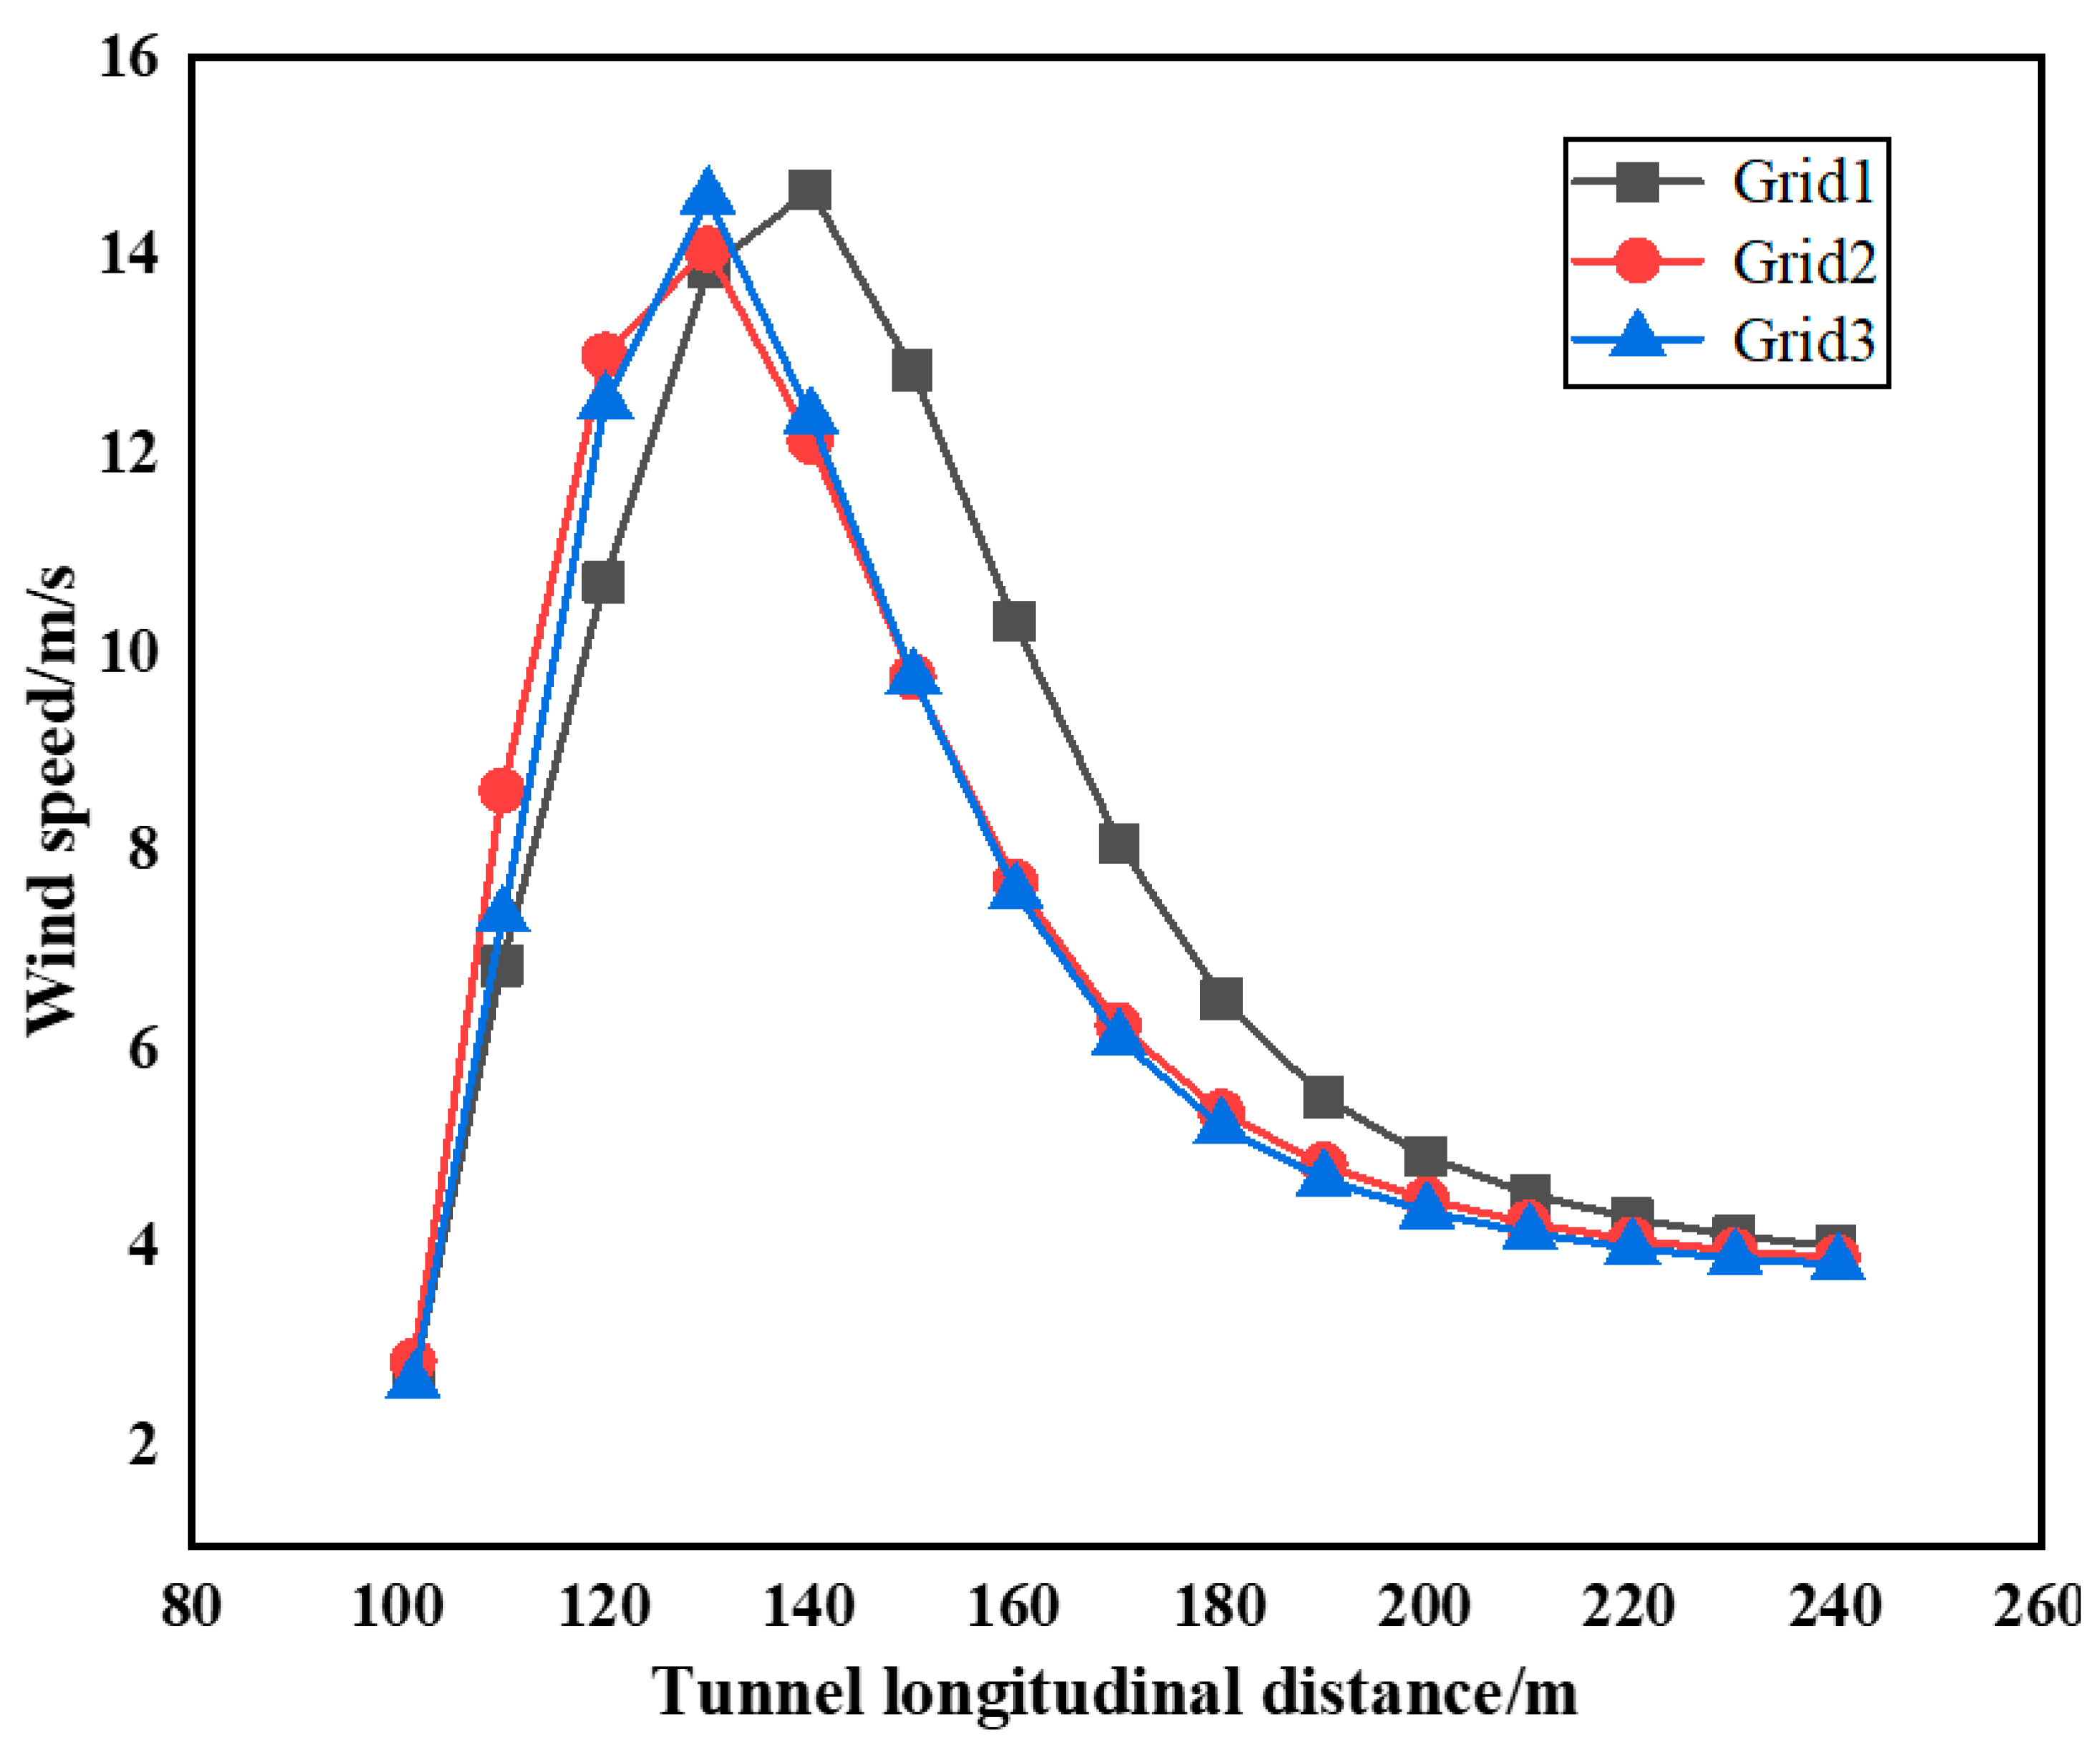
The computational mesh was imported into the CFD software (ANSYS 2022 R1) FLUENT for iterative calculations. A pressure-based solver was employed with the RNG k-
turbulence model implemented for the numerical simulations [
19,
20].
In computational fluid dynamics (CFD) simulations, fluid density is recognized as a critical governing parameter that directly determines solution accuracy. This physical coupling becomes particularly significant in high-altitude environments where ambient pressure reduction at elevated altitudes induces corresponding density diminution. To preserve thermodynamic consistency between numerical solutions and actual atmospheric conditions, the implementation of altitude-compensated density correction must be systematically implemented through barometric adaptation algorithms. The barometrically compensated air density at 3000 m altitude was calibrated to 0.9 kg/m
3. The ventilation system employed a Model 1120 axial-flow jet fan, specifically engineered for high-altitude applications with the following performance characteristics. The wind speed of the fan is set to 30 m/s, the fan wall is configured as a smooth wall, and the tunnel wall is a concrete wall, which is defined as a stationary non-slip wall, and its roughness height is set to 0.002 m and the wall roughness constant is 0, as per Wang et al. [
21], as shown in
Table 3.
The numerical framework was established under the following rigorously defined premises and operational protocols:
- (1)
This study investigates the jet ventilation system in high-altitude highway tunnels, with a focus on air as the research medium. In the analysis of airflow dynamics within tunnels, the airflow velocity typically remains subsonic, ventilation pressures operate within the ambient atmospheric range, and temperature fluctuations exhibit negligible magnitudes. Consequently, the volumetric variations in tunnel gases can be considered insignificant in terms of their effect on computational accuracy requirements. Therefore, the airflow in this study was treated as an incompressible fluid as per the paper, a treatment that streamlined the simulation workflow and enhanced computational efficiency.
- (2)
Fluid viscosity plays a critical role in practical flow phenomena and poses significant research challenges. In real fluid motion, internal frictional resistance arises due to intermolecular interactions, a phenomenon that fundamentally characterizes the intrinsic viscous behavior of fluids. This investigation specifically focuses on frictional energy dissipation mechanisms during aerodynamic processes. The jet flow generated by ventilation fans involves laminar-turbulent transitional regimes, which constitute complex nonstationary flow phenomena characterized by spatiotemporal variability Wu et al. [
22].
4.3. Results Analysis
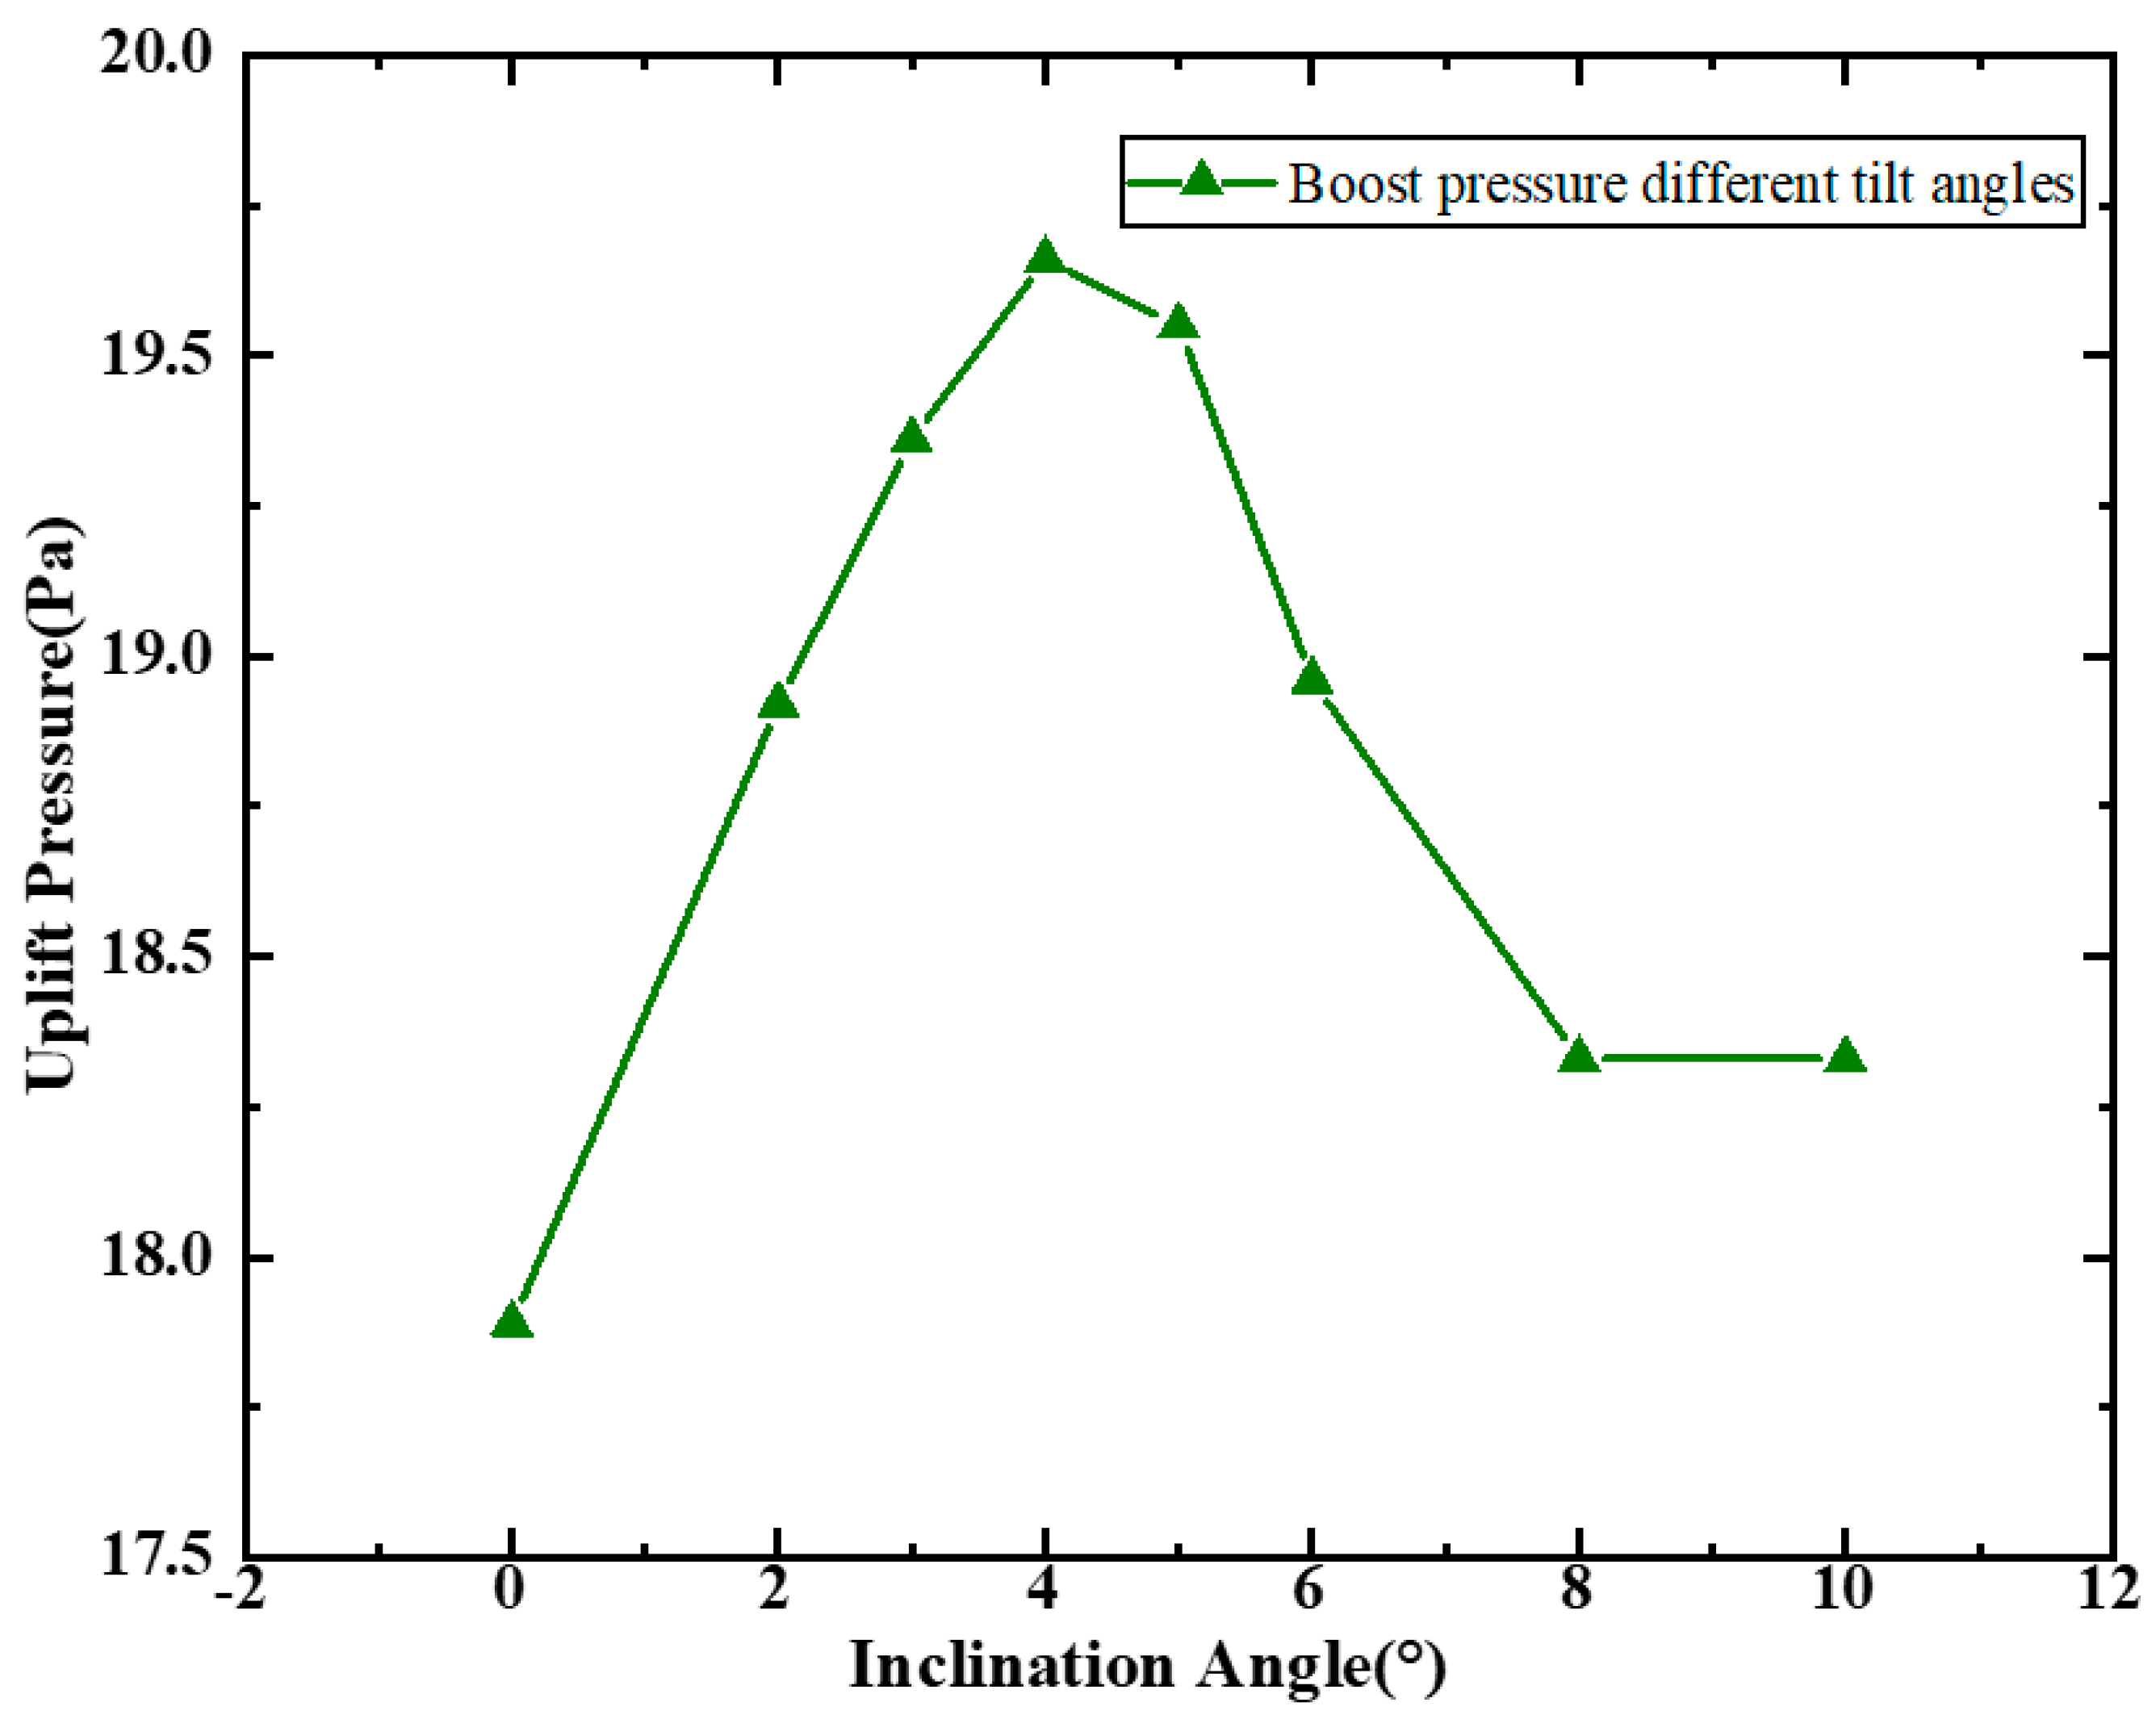
The domestically patented banana-shaped tunnel jet fans incorporate design enhancements that integrate inlet frictional effects. This innovative measure has yielded significant improvements in operational efficiency. Currently, this novel fan configuration has not yet been widely implemented in most longitudinal jet ventilation tunnels across China. Prior to the widespread implementation of this technology, determining the optimal installation inclination angle is imperative to ensure peak fan performance under identical operational conditions, thereby generating substantial economic returns. This section establishes numerical simulations based on the banana-shaped tunnel jet fan configuration, with computational parameters including a jet airflow velocity of 30 m/s and inclination angles β including 0°, 2°, 3°, 4°, 5°, 6°, 8°, and 10°. The resultant lift pressure characteristics derived from these simulations are systematically documented in
Table 4 and
Figure 13.
In tunnel ventilation engineering, the installation angle of axial fans constitutes a critical parameter governing performance. As shown in
Figure 10, aerodynamic performance exhibits significant angular dependence. Notably, within the 0–4° tilt angle range, the lift coefficient demonstrates a consistent upward trend with increasing installation angles. This aerodynamic enhancement can be attributed to the progressive reduction in high-velocity airflow contact area with tunnel walls under elevated tilt configurations. The diminished wall interaction effectively reduces frictional resistance forces, thereby improving longitudinal airflow propulsion efficiency.
However, when the tilt angle extends into the 4–10° operating range, the comprehensive performance coefficient exhibits a reverse degradation trend. This phenomenon originates from multiple interacting mechanisms: Although enhanced tilt configurations achieve further reductions in airflow-tunnel wall frictional resistance, they simultaneously amplify vortical structures at the jet fan discharge region. These augmented vortex formations not only cause flow destabilization through momentum flux dissipation but also reduce thrust transmission efficiency while inducing corresponding decreases in lift coefficient values.
Furthermore, increased tilt angles induce significant alterations in near-field flow characteristics at the fan discharge region, manifested through enhanced flow field instability indices. This dual impact mechanism simultaneously compromises operational efficiency and elevates energy dissipation rates. The observed nonlinear performance response suggests the existence of a threshold angle, beyond which vortex-induced momentum losses and hydrodynamic instability mechanisms dominate over initial frictional resistance reductions. Consequently, the aerodynamic optimization process necessitates strict angular constraints to balance competing flow phenomena, suppressing turbulent energy cascades while maintaining favorable pressure gradient distributions. Comparative studies [
16] examining wall shear stress at tunnel ceilings and floors, thrust, and thrust variation rate across different fan pitch angles have identified 6° as the optimal installation angle. For traffic congestion scenarios, the optimal pitch angle ranges from 2° to 4°. These findings align with our research conclusions on the optimal installation angle for jet fans in straight high-altitude tunnels.
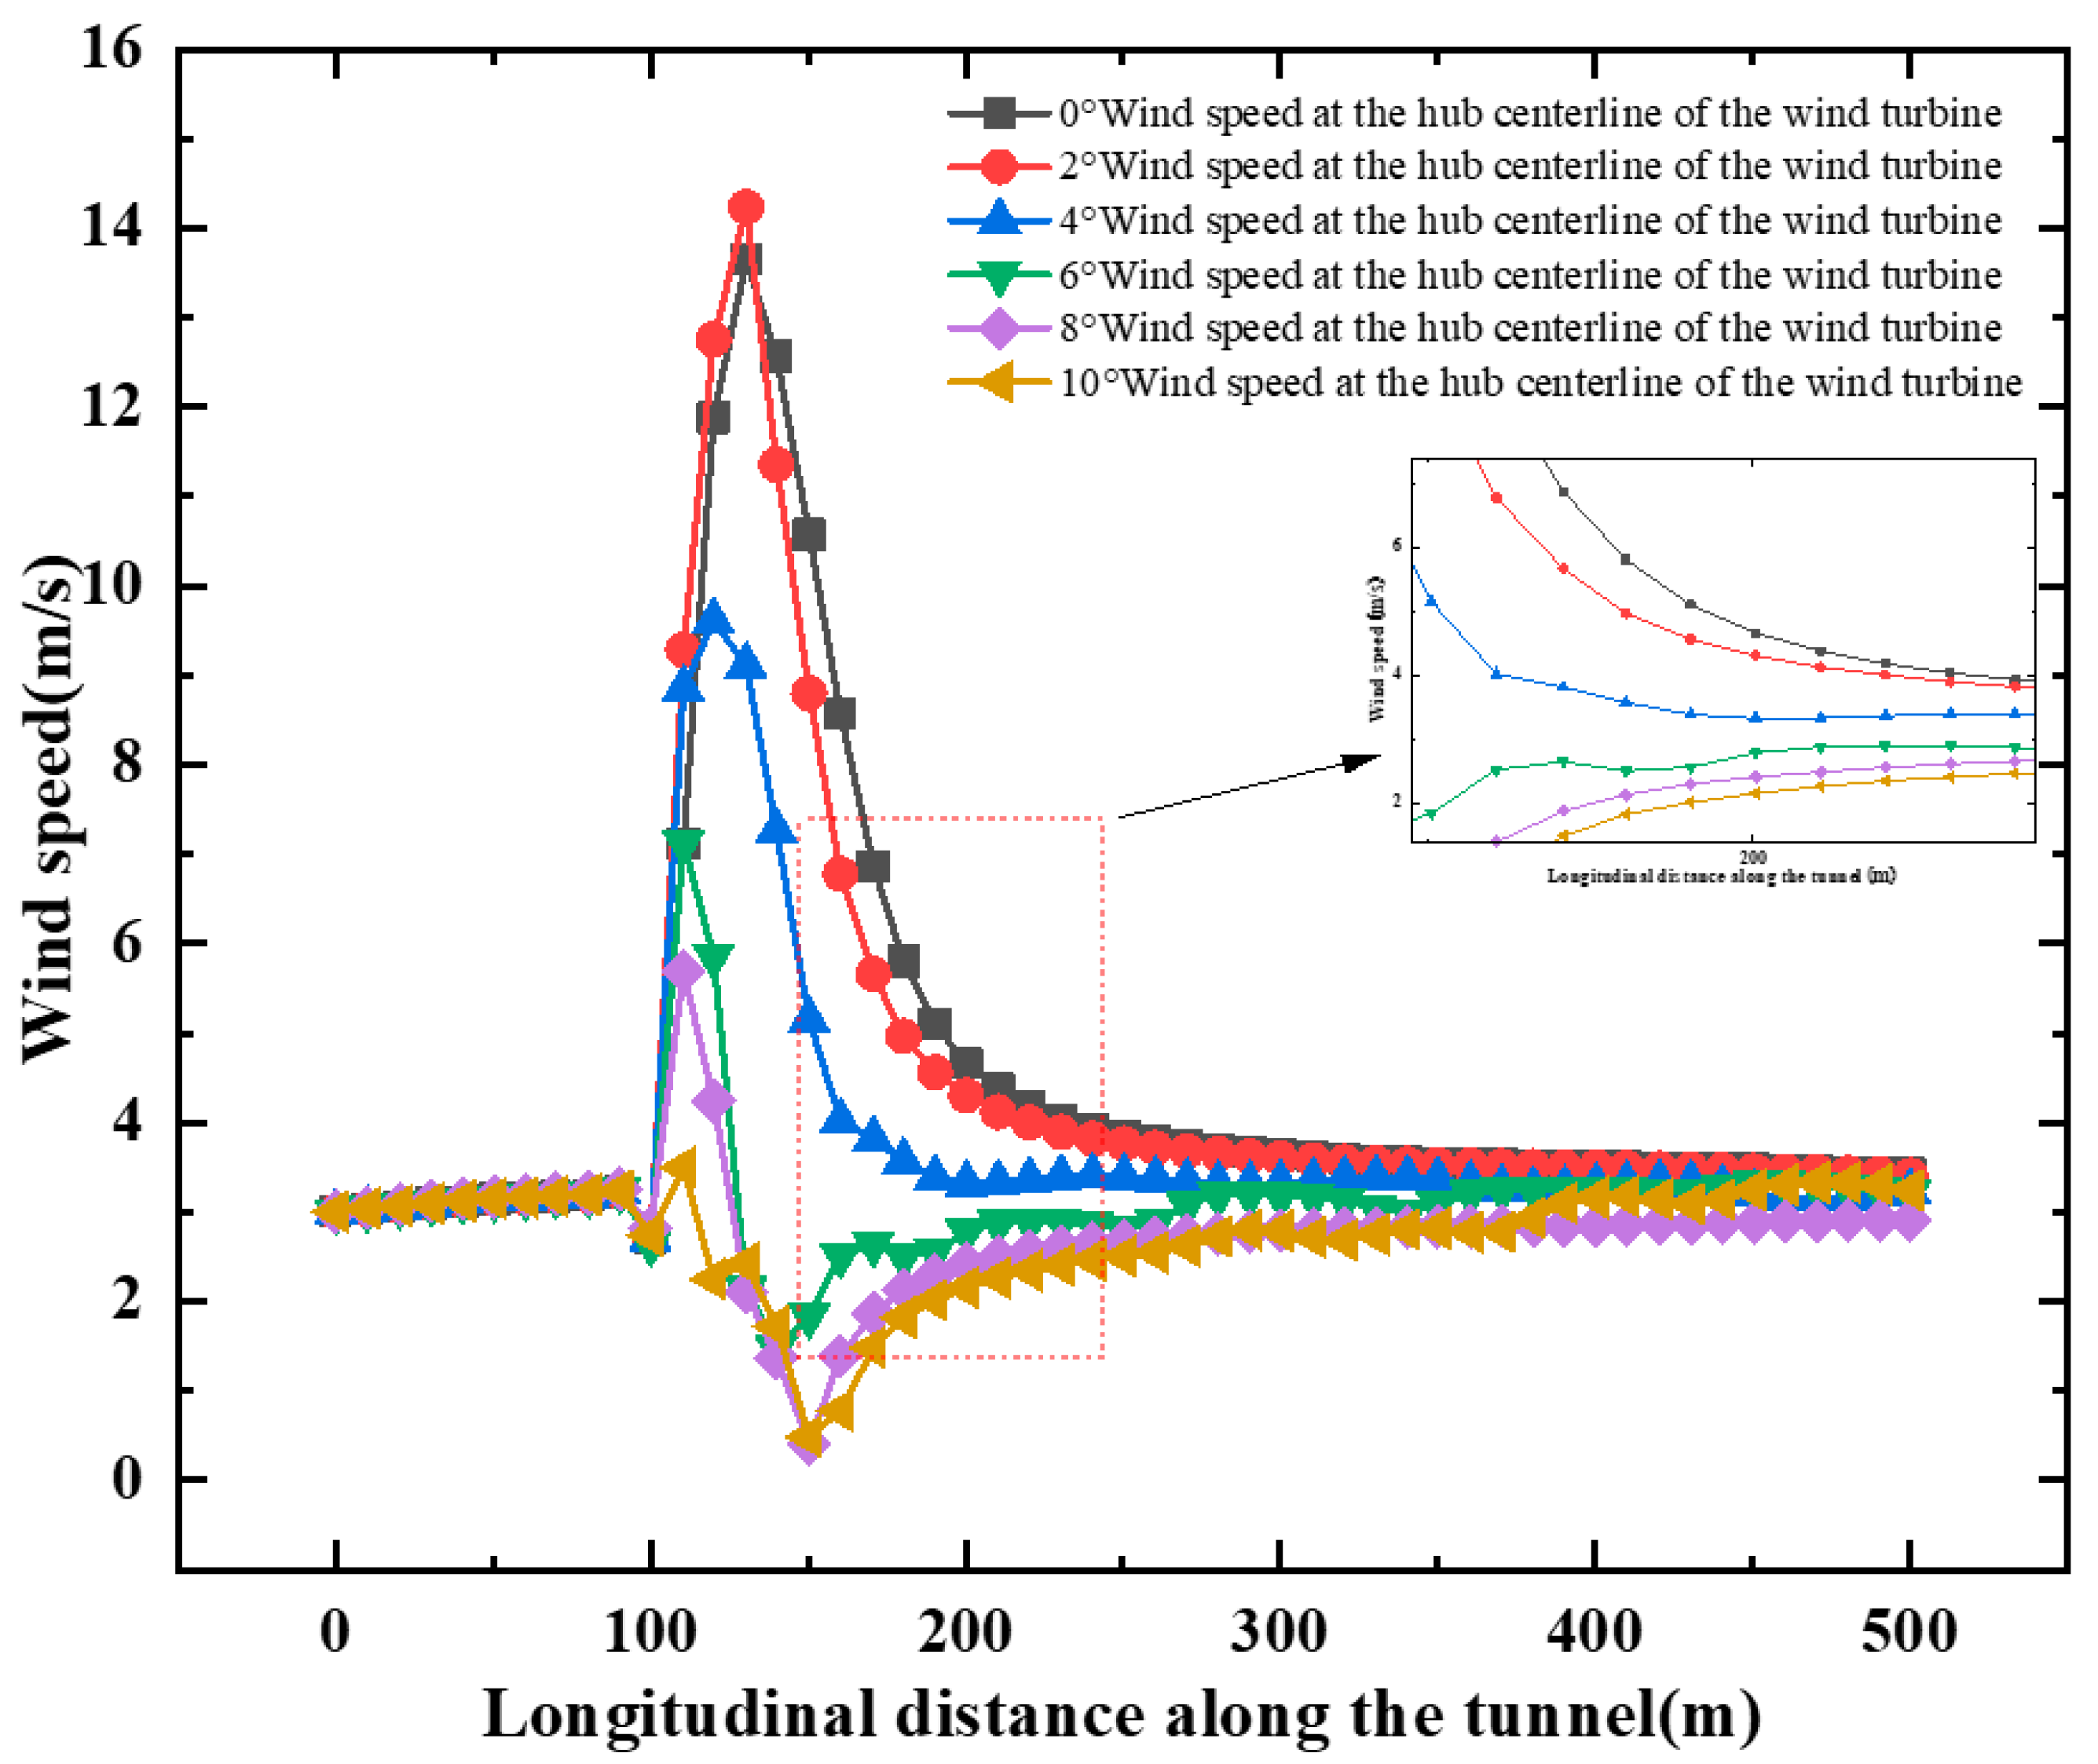
As illustrated in
Figure 14, airflow velocity demonstrates progressive attenuation along the longitudinal tunnel distance at installation angles of 0°, 2°, and 4°. Conversely, configurations with 6°, 8°, and 10° tilt angles exhibit a distinctive triphasic evolution pattern: an initial acceleration phase, a subsequent decay segment, and a terminal gradual recovery stage. The velocity profile manifests sequential augmentation, reduction, and eventual mild resurgence with increasing longitudinal distance, ultimately converging to comparable terminal values across all configurations at the tunnel exit region. This phenomenon reveals two critical aerodynamic mechanisms. First, although initial thrust generation varies significantly across different installation angles, such differential effects undergo progressive attenuation during airflow propagation through the tunnel, culminating in velocity homogenization at the exit plane. Comparative analysis of peak velocities between 0°/2° configurations and larger angles demonstrates an inverse relationship between installation angle magnitude and maximum airflow velocity. Notably, at the 150 m monitoring station, configurations with 6°, 8°, and 10° tilt angles exhibit velocity minima, suggesting that larger installation angles (≥6°) initiate flow separation and enhance turbulent kinetic energy production. These coupled mechanisms exert dual inhibitory effects on both airflow distribution uniformity and propulsion efficiency. The angular dependency of these aerodynamic behaviors is fundamentally rooted in the restructuring of momentum transfer mechanisms induced by blade angle variations, and modified pressure gradient distributions that alter energy conversion pathways within the flow field.
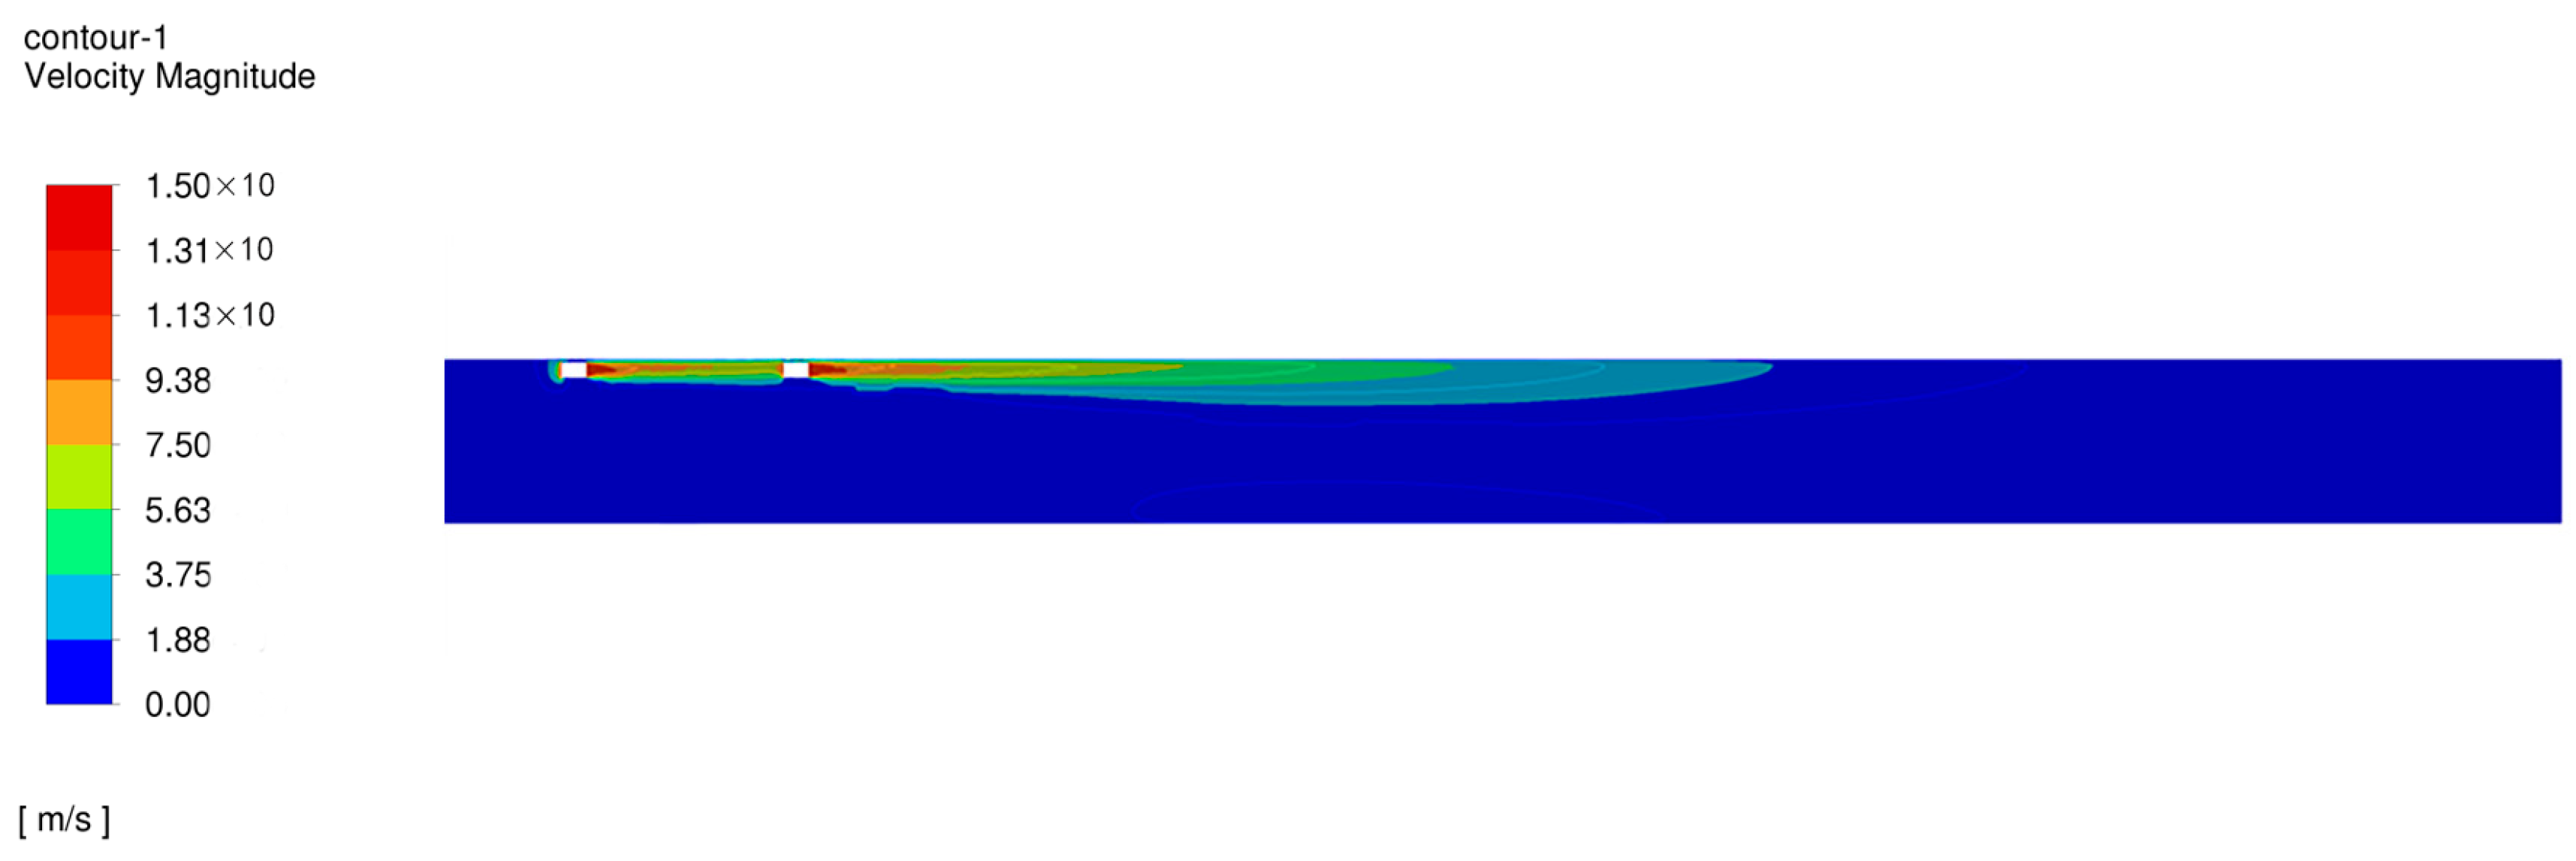
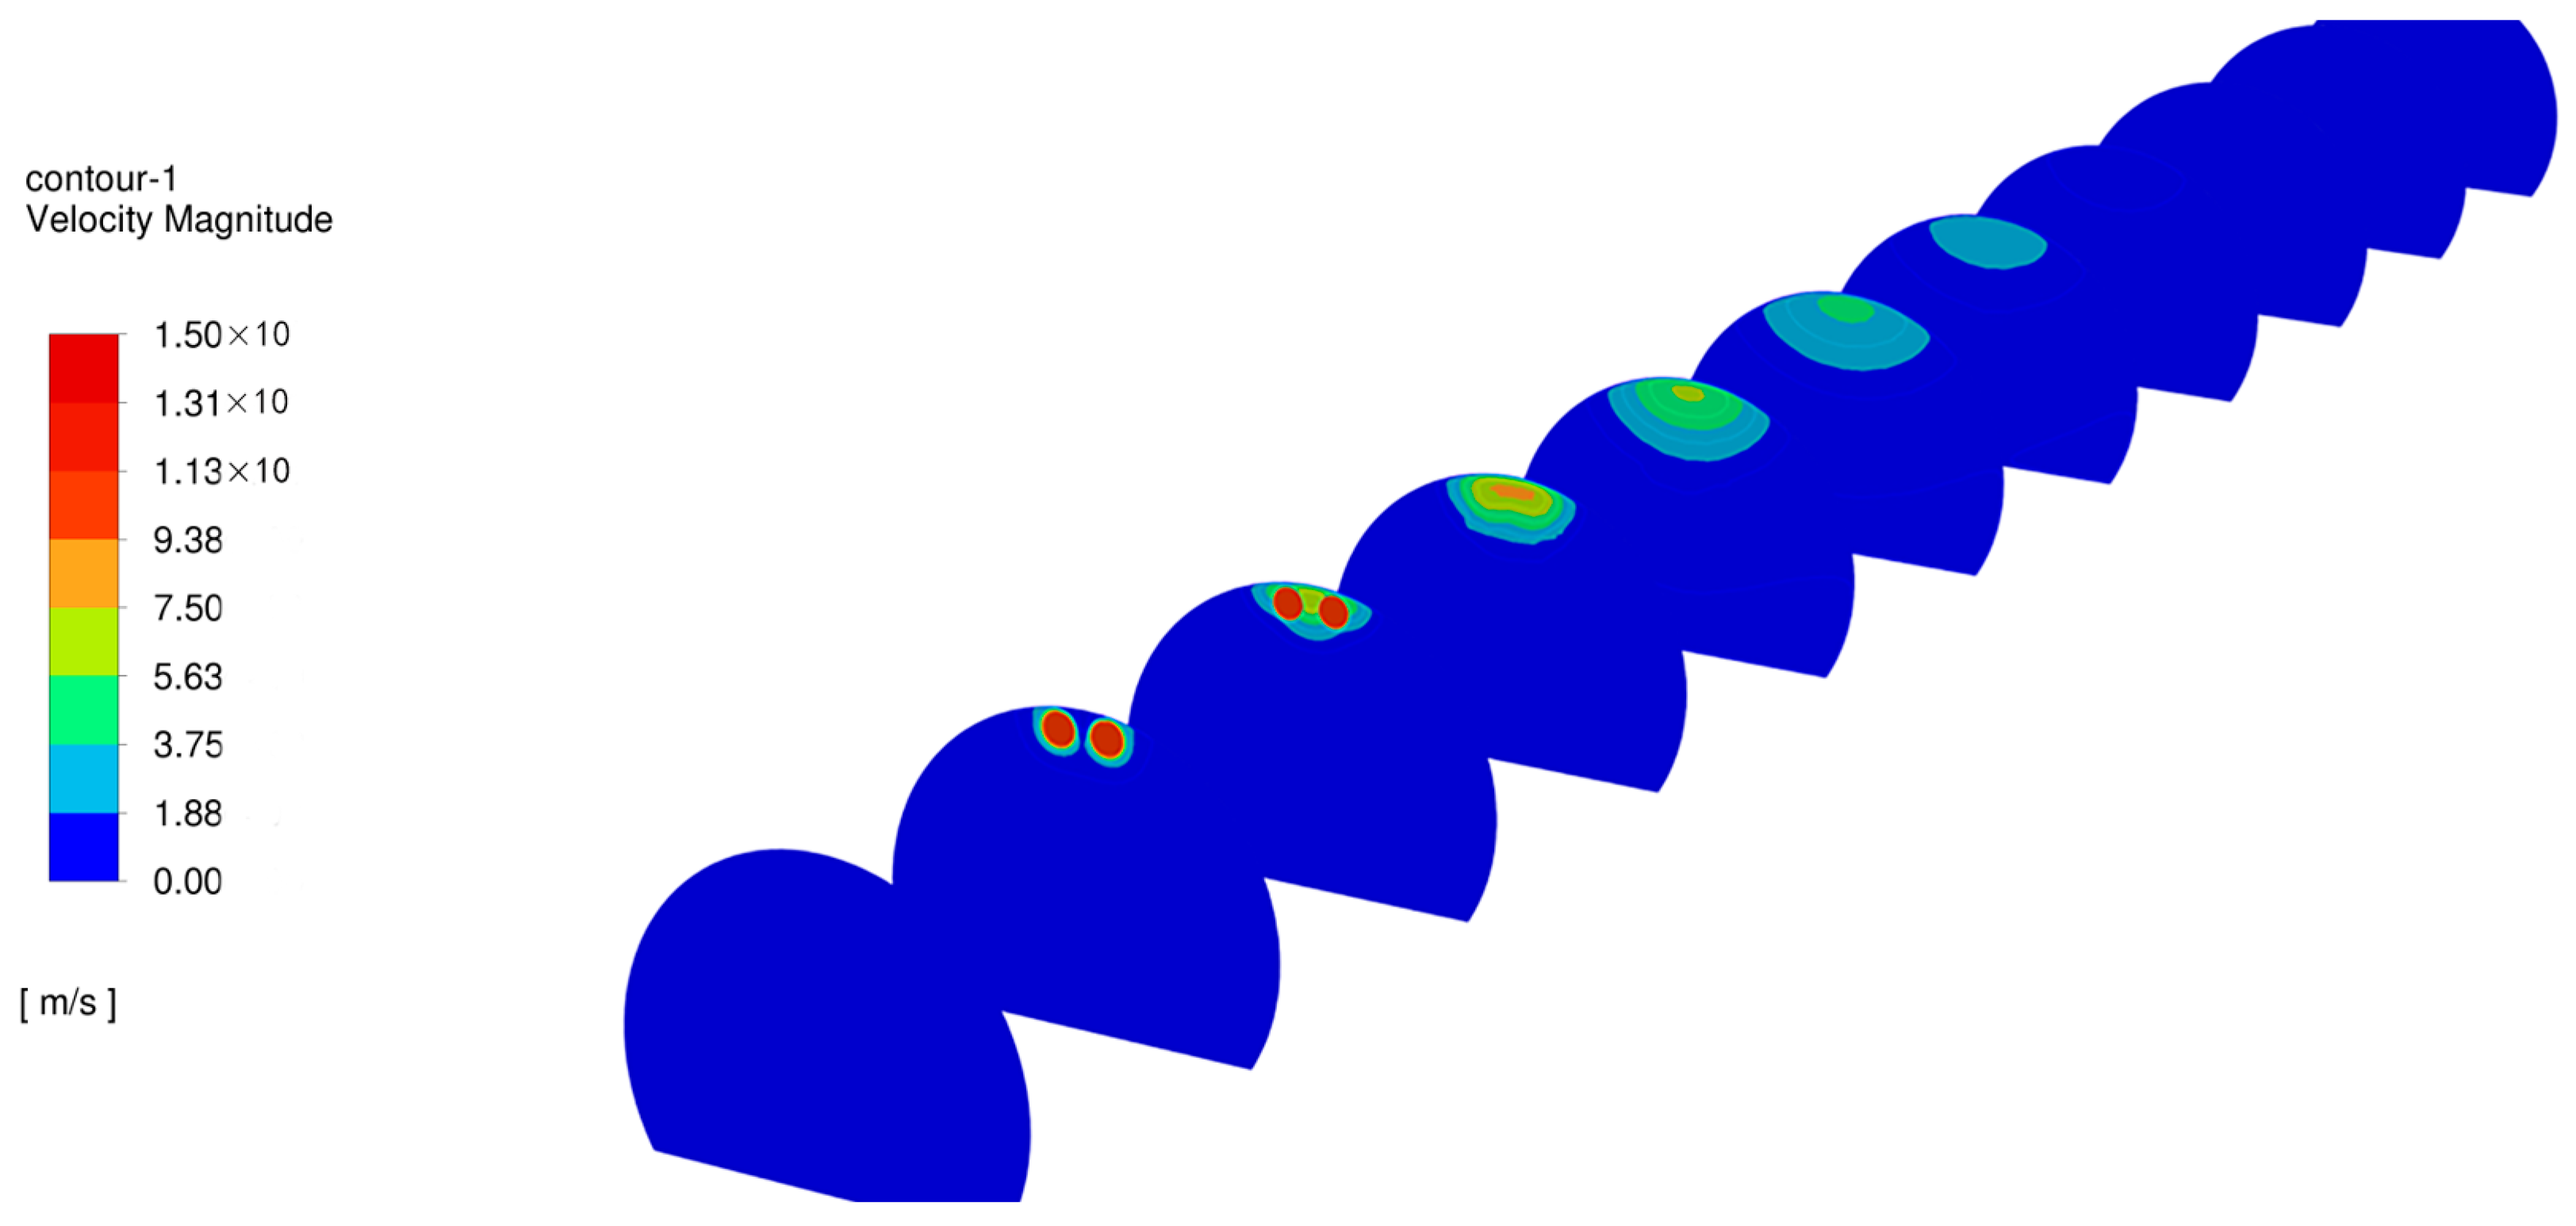
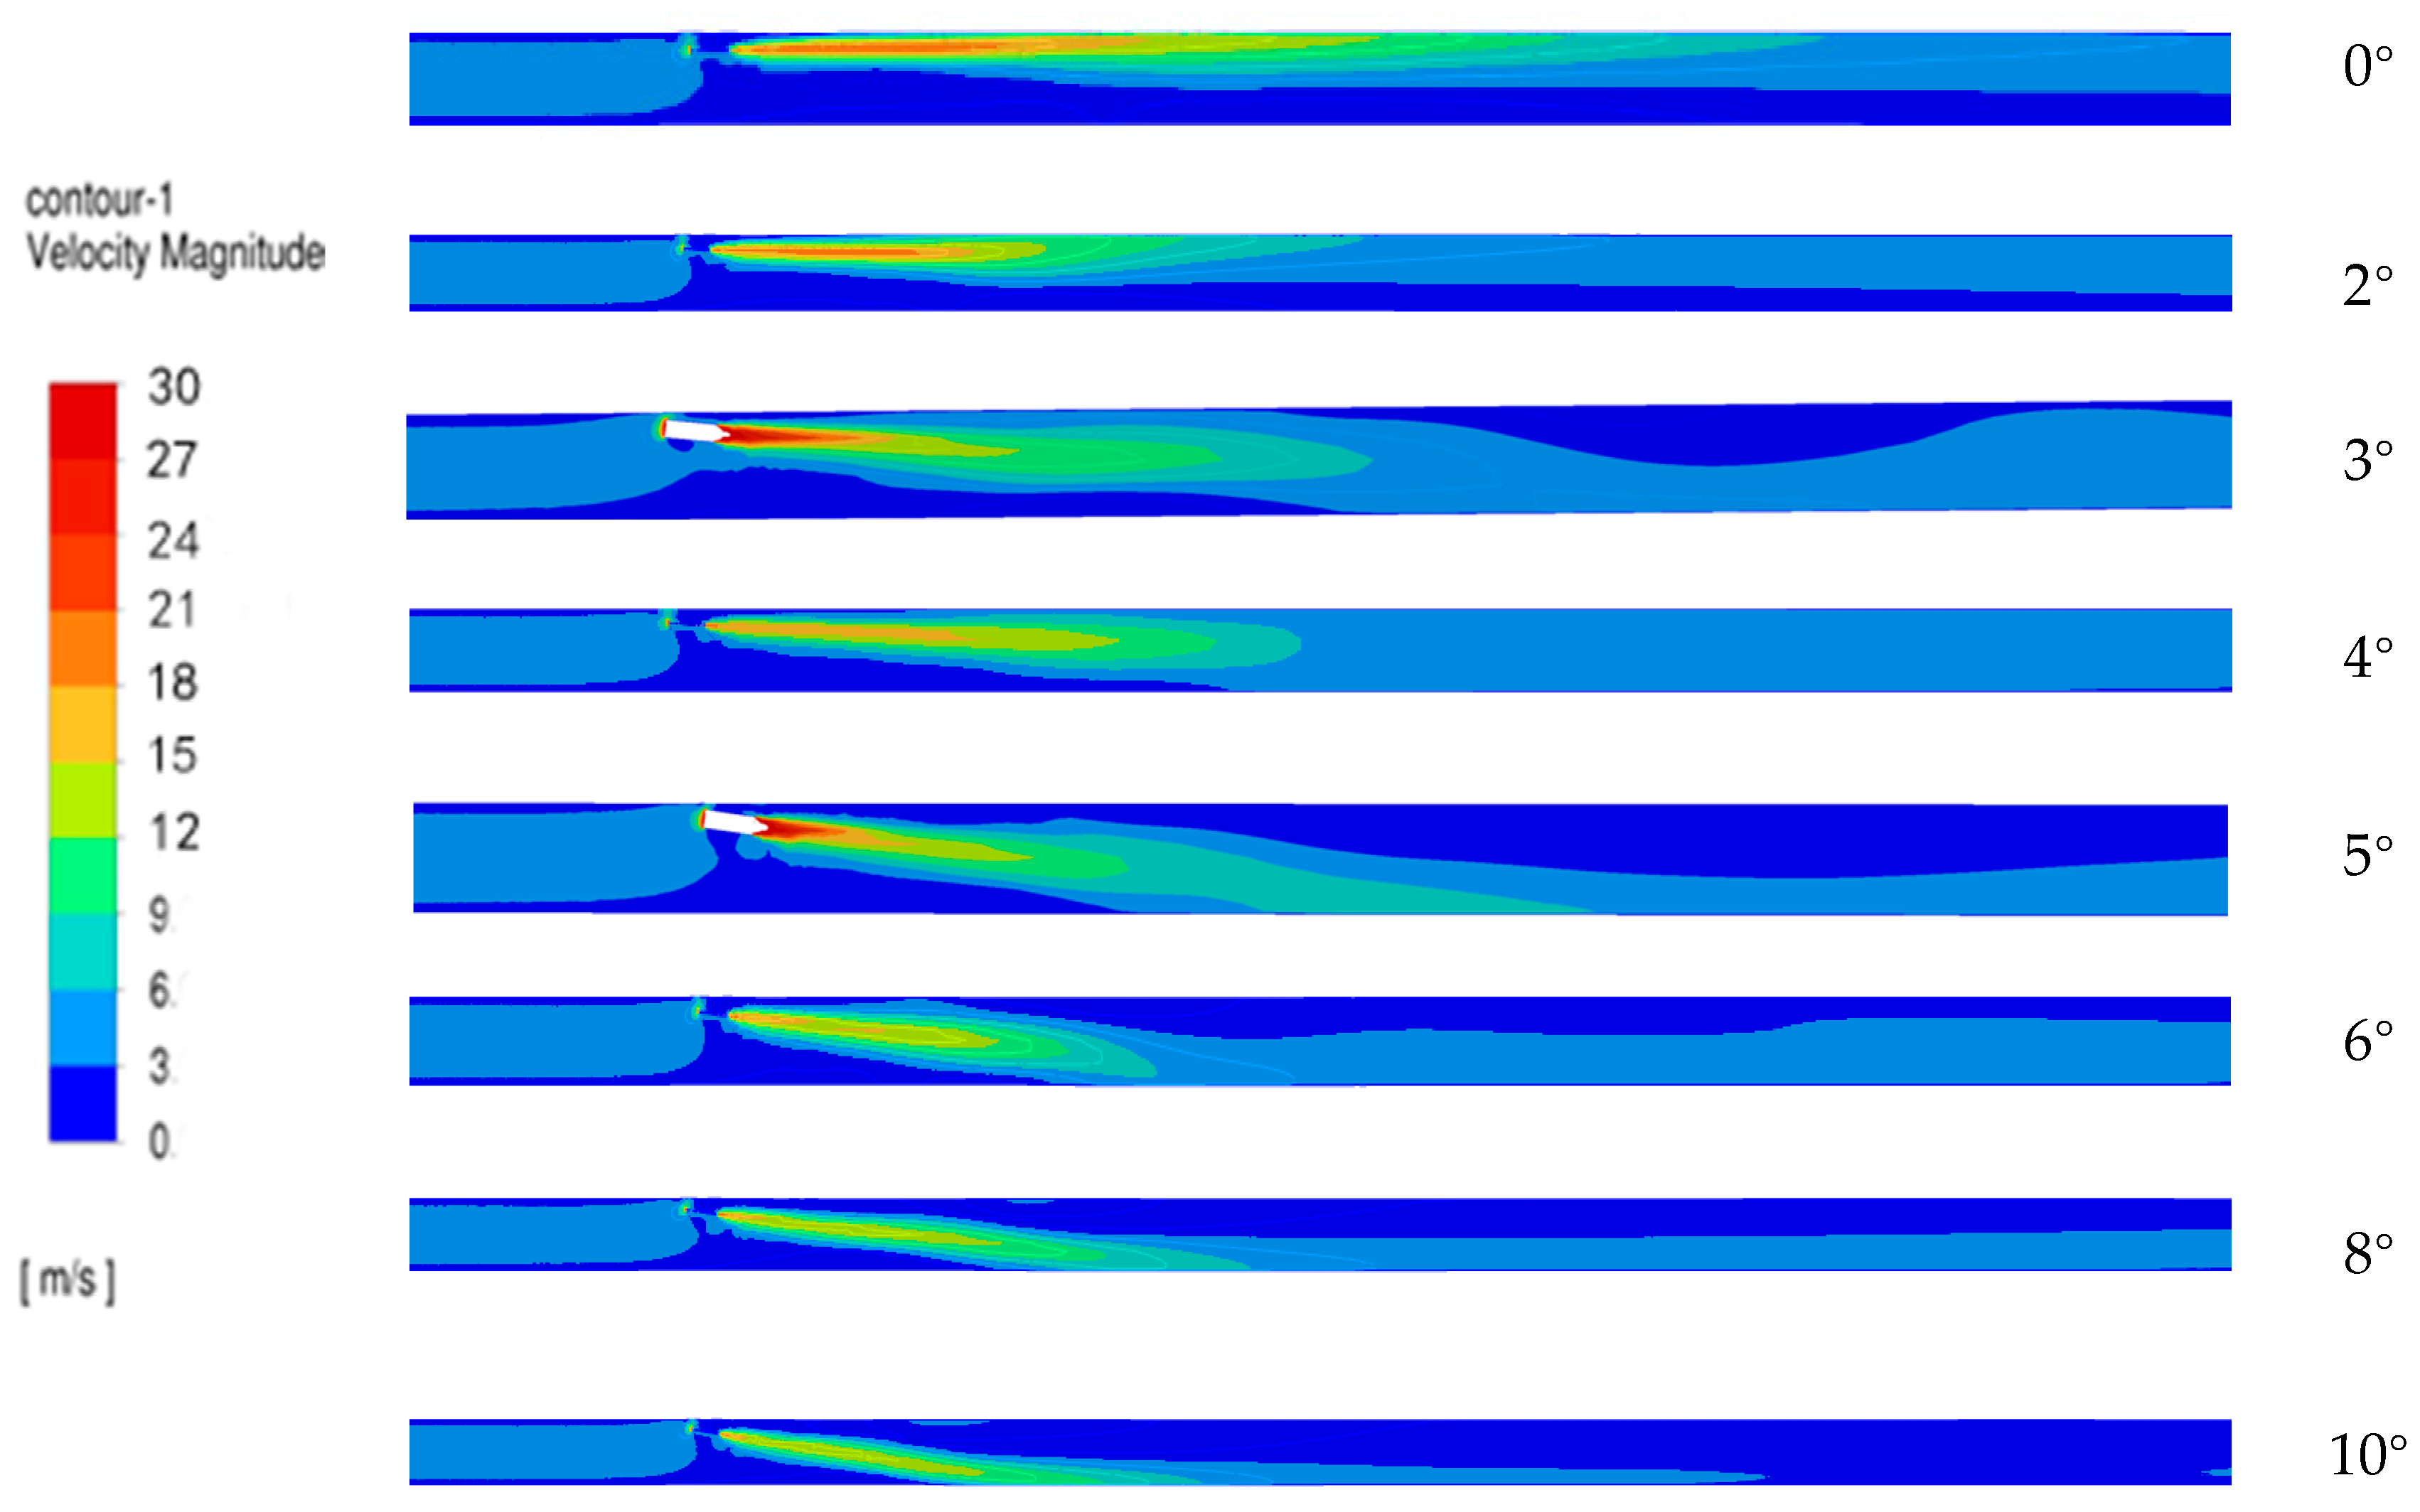
Figure 15 further elucidates the impact of fan tilt angles on high-velocity airflow distribution within the tunnel. When horizontally positioned, the fan exhibits stable development of high-velocity airflow, with an extended influence range predominantly in the upper tunnel section. However, as the fan tilts downward, the airflow becomes progressively confined between the tunnel ceiling and floor, resulting in a gradual reduction in its affected area. Notably, within tilt angles ranging from 0° to 4°, the fan’s influence range demonstrates an unexpected expansion, which might be attributed to enhanced airflow uniformity along the tunnel cross-section and diminished frictional losses. However, as the tilt angle further increases from 4° to 10°, a progressive reduction in the fan’s effective coverage is observed. At tilt angles of 3° and 5°, the lift forces reached 19.36 Pa and 19.55 Pa, respectively, both closely approximating the value observed at the 4° tilt angle. Particularly at a 10° tilt angle, premature collision of high-velocity airflow with the tunnel floor occurs prior to flow stabilization, resulting in a substantial loss of kinetic energy that ultimately diminishes the fan’s overall operational impact within the tunnel. This energy dissipation not only compromises airflow propulsion efficiency but also potentially elevates energy consumption and maintenance requirements. A study by Gao et al. [
23] indicates that for helical tunnels at high altitudes with radii below 700 m, laterally offsetting fan groups 0.25 m–0.5 m toward the tunnel inner wall significantly enhances pressure rise efficiency. Excessive pitch angles induce pronounced vortex formation in the downstream cross-section, demonstrating that deflection angles should not exceed 4°.
In conclusion, the tilt angle configuration of ventilation fans critically governs the performance of tunnel ventilation systems, significantly influencing both airflow distribution efficiency and critical operational parameters, including energy expenditure and system reliability. Optimal ventilation efficacy necessitates meticulous optimization of fan orientation, requiring comprehensive consideration of aerodynamic interactions that encompass wall friction effects, vortex generation patterns, and flow field stability characteristics. This systematic approach enables enhanced operational efficiency in tunnel ventilation systems while simultaneously fulfilling safety imperatives, economic viability, and sustainable operation requirements in tunnel engineering.
Mathematical fitting was performed on the lift-pressure data of the fan at different tilt angles, with separate analyses for cases including and excluding 3° and 5° inclinations. The results show that these tilt angles have no significant effect on the accuracy of the fitting formula. At an altitude of 3300 m, the lift pressure of a single set (two units) of Type 1120 jet fans under varying tilt angles (including 3° and 5°) can be described by a polynomial fitting formula, as given in Equation (4).
where y represents the lift pressure of the fan, and x denotes the fan at different tilt angles.
Figure 16 shows the comparison between the fitted formula data and calculated values of fan lift pressure under various tilt angles. The figure demonstrates that this formula can accurately characterize the variation trend of fan lift pressure at different tilt angles, providing valuable insights for relevant engineering applications.
