1. Introduction
The city of Doha is situated in a hot, humid climate within the Arabian Gulf environment. With the lack of natural vegetation being an evident characteristic, the region’s governments invest resources to increase the green cover within cities. For example, Kuwait initiated a multi-phase project to plant one million trees to enhance the state’s beauty. Simultaneously, urbanization has rapidly expanded in the city of Doha over the last two decades. The city can be considered a good representative of Arabian Gulf cities, as it experiences the Gulf’s extremely hot, humid climate and is positioned centrally between the UAE, Bahrain, the Eastern Area of KSA, and Kuwait cities. The city has experienced rapid development and a construction boom over the last two decades, leading to the population increasing to 2.4 million in 2018.
Alongside its infrastructure projects, city landscaping and pedestrian outdoor experiences are prime priorities on the Qatari agenda [
1]. The increasing infrastructure footprint reflects the saturation of the built environment within older districts, where very few lands are left undeveloped. Studying these districts provides invaluable opportunities to capitalize on and replicate the best AEC (Architecture, Engineering, and Construction) practices and to avoid mistakes in new areas. Understanding the microclimate within these developed lands, based on their geometry and configurations, is essential to influence decisions related to newly established areas. While a bibliometric study [
2] showed the scarcity of UHI studies in the Arabian Gulf region compared to the USA, China, Europe, and India, studies in Doha and other cities located in hot climate regions [
3,
4,
5,
6] discuss specific aspects related to UHI during the daytime, including traffic, vegetation, and urbanization in general. However, these studies lack distinction between the diurnal effects of UHI, which are more pronounced in hot regions’ built environments. Moreover, none of these studies have explored the specific impact of building geometry on UHI. Therefore, studying this aspect during the early nighttime hours, when the difference in temperature rapidly accelerates, enhances our understanding of UHI patterns in the region.
Moreover, residential zones share similar applications but have a wide range of regulations and land use parameters, resulting in significantly different geometries. The residential typology provides a solid basis for a microclimate study, as they have many common characteristics related to design and operations yet vary in geometry and proximities according to building regulations.
This paper aims to investigate the urban heat island (UHI) effect due to building geometry in the context of Doha’s residential zones. Therefore, the study has the following objectives:
The study will compare UHI effects represented by microclimate heat-related parameters in two residential settlements, which considerably vary in terms of the UHI effect. The two settlements selected for this study are Al-Markhyya and Al-Mansoura. This paper refers to these areas as low-rise (LR) and high-rise (HR), respectively.
Through simulations, the study will estimate and analyze the dry bulb temperature and sky view factor parameters of UHI in typical geometries for each settlement based on building regulations and zoning requirements stated by Qatari land use and zoning regulations. Simulating the dry bulb temperature will help investigate UHI’s diurnal patterns in rural and urbanized areas in hot regions.
The study will conduct site measurements for the actual land surface temperature in both areas at the same time of the night on multiple nights and according to the timeline of this study.
Recent advances in urban-climate and urban-design research increasingly frame city geometry as an active thermal-control system rather than a static backdrop, revealing its decisive leverage over radiative balance and the UHI effect. This insight underscores the need to examine geometry-coded parameters like height-to-width ratios, setbacks, sky-view factors to pinpoint those that most intensify nocturnal heat retention. Emerging parametric simulation and measurement workflows now help understanding these relationships rapidly across contrasting urban forms, supplying the performance-based evidence designers and regulators require to embed thermal-resilience targets in future zoning requirements and design guidelines.
2. Literature Review
The increase in near-surface temperature within the city is one of the side effects of urbanization. This rise in temperature often results in unpleasant conditions for people outdoors and can pose significant health hazards. Urban heat island (UHI) effects extend beyond just outdoor human comfort and are responsible for increased cases of heat-related illnesses and fatalities. A study of the influence of street canyons on pedestrian comfort in Philadelphia [
7] has suggested that the urban heat island (UHI) effect is a significant component that amplifies the effects of heat stress on inhabitants. Mahmoud [
8] investigated the relationship between a newly built housing development in Aswan, Egypt, and the urban heat island effect. Based on the building orientation and configuration, the study identified a difference of 20 °C in Physiological Equivalent Temperature (PET) within the studied development. This increase in PET is associated with adverse impacts on human health, given the already hot climates of Egypt and Middle Eastern countries and the additional effects of climate change on human discomfort in the urban environment.
The study of the urban heat island (UHI) effect stems from the relatively new field of urban climate. Simultaneously, UHI involves a wide range of disciplines with various interests [
9]. Consequently, most studies were conducted within a brief timeframe and utilized different sets of parameters spanning these disciplines. It is crucial for studies engaged with the climate and the built environment to clearly define the parameters under study, scope, scale, and time interval.
Researchers from different disciplines, including climatology, physics, geography, geology, biology, engineering, ecology, urban planning, architecture, and social sciences, all contribute to the field of urban climate, often referring to it as “Home” [
9]. Their approaches to the field also vary according to the effect’s scale and time aspects. For instance, the study of air circulation within a park has a local scale ranging from hundreds of meters to several kilometers and a timeframe of several hours within the day and night. However, studying the impact of sun-breaker devices involves a microscale of the building facade at a precise time during the day.
More specifically, interactions between UHI and the built environment involve multiple parameters, including the city climate’s status, solar irradiance at various spectra and conditions [
10], characteristics of urban surfaces [
11], building geometry [
7,
8,
12,
13,
14,
15], relative vegetation [
3,
4,
6,
12,
13,
16,
17], relative thermal loads [
12], and traffic stresses [
5], the urban development adds. Kaloustian and Bechtel, as well as Bechtel et al. [
18,
19], suggest that urban form and design play a critical role in shaping UHI intensity. Their studies map local climate zone (LCZ) classifications based on urban and natural forms with the land surface temperature (LST) provided by satellite imagery. Factors such as building density, street orientation, and green space distribution actively contribute to the creation of localized heat islands within cities. Closely spaced urban forms and the lack of green space can create environments that trap heat and limit air circulation. Similarly, Athukorala et al. [
11] followed a remote sensing approach based on the MODIS temporal dataset and the categorization of Greater Cairo into three types of patches: impervious, green, and bare land surfaces. The study identified a greater difference in the diurnal temperature of impervious urban areas compared to other areas. This effect rapidly increases with the expansion of impervious surfaces, representing urbanization. Ali-Toudert and Mayer [
15] studied cities in hot, arid climates, represented by Ghardaia, Algeria, using different configurations of aspect ratios and street canyon orientations. The study found that high aspect ratios (H/W = 2 or above) are optimal for urban settings during summer, especially for a N–S orientation, as they provide more shading. Additionally, the study suggested the use of integrated architectural shading elements such as arcades and tree lines if wide streets are to be planned.
While comprehensive investigations need to consider a closed-loop system comprising all the parameters mentioned earlier for the area under study, studying the influence of specific parameters apart from others can be achieved by conducting quasi-experimental research using field measurements and simulations of hypothetical computational models, as direct experimental tools are not applicable for urban studies due to uncontrolled conditions and the scale. As the focus of this study is related to building geometry, other parameters will be neutralized, even though their contribution to temperature increase is undeniable. More importantly, building geometry was found to be crucial in determining the outdoor thermal environment [
20].
Table 1 shows a group of studies on the influence of building geometry on UHI, their methods, and related parameters.
Collecting historical climatic data is the first step in establishing the weather conditions during the last decades. These conditions are then used to create a benchmark by which other scenarios of urbanized areas can be compared. The data can be extracted from the nearest weather station to properly represent the area under study. It is essential that the station is located within an open space with no obstructions for wind and solar radiation to negate the impact of the city’s urbanization. Weather data includes dry and wet bulb temperatures, relative humidity, and wind speed. These metrics define the overall climate of the area at a specific time. As the increase in temperature is a primary measurable effect of UHI, the dry bulb temperature can be simulated for different urban settings based on the benchmark established by the historical data.
For the shape of the street canyon (depth, length, and symmetry); building geometry; and configuration, the sky view factor (SVF) is considered one of the primary metrics used [
21]. Ali-Toudert and Mayer [
15] identified the SVF’s ability to represent building geometry’s contribution to UHI. Their study also showed the significant role of orientation in increasing temperature during the daytime. While they selected simplified urban geometry to represent the H/W ratio and street canyon orientation, the results showed a preference for tall buildings with an H/W of 2 or more. In this case, either H/W or SVF can be used to represent the geometry. However, the study of specific zones needs to use SVF, as the H/W ratio is not consistent throughout the street canyon. SVF can be measured at the existing site, calculated, or simulated for a point within a mass model. While SVF is based on a single point, averaging the metric at multiple points can represent the overall plane’s exposure to the sky. A study by Middel et al. [
22] investigated the sky view factor footprint of multiple cities using a big data approach by analyzing Google Street View images. Hodul et al. [
14] used Landsat data to estimate the SVF of the Greater Vancouver area in Canada. Wu et al. [
23] recommend a 5 m grid for SVF simulations in the urban setting. Tools like Rhino Grasshopper and T4SU are used to simulate and estimate the overall SVF condition of a specific area.
Field measurements and data collected from satellite imagery reflect the combined contribution of all the above inputs with no clear breakdown. As conducting laboratory experiments is not possible on the urban level, simulations facilitate the study of these parameters while controlling the others. Simulations use historical climatic data as a benchmark by which the increase in temperature caused by specific urban configurations can be estimated. Using this methodology allows us to neutralize the impacts of vegetation, construction materials, and traffic. Although they are not necessarily similar in the different residential zones, simulations can filter out their impacts and facilitate apple-to-apple comparisons between the building geometry (specifically) in these zones. Similar studies [
15,
24] were conducted on hypothetical models regardless of the specific impacts of traffic or vegetation. Moreover, field measurements at nighttime can be used to support (or deviate from) simulation results, providing more insight into the role of specific parameters of urban geometry on UHI.
On the other hand, near-surface temperature is a primary metric for the urban heat island, as it is directly connected with the definition of UHI. Metrics like land surface temperature and dry bulb temperature can also be used in cases where there is a lack of proper data collection for near-surface temperature. Land surface temperature (LST) can be retrieved from satellite imagery or directly measured from the field using thermal imaging tools. However, utilizing available satellite datasets shows multiple limitations due to the lack of precision (for 1 km resolution) and the incompleteness of nighttime datasets. Yang et al. [
25] identified further shortcomings in satellite imagery data, such as the limitations to surface measurements and emissivity estimations. For dry bulb temperature, simulations can be used to apply corrections to temperature benchmarks (from historical data) based on the geometry of the urban form under study. Nonetheless, a few random dry bulb temperature measurements can be taken to verify the accuracy of the simulation model.
Siddiqui [
3] argued that the effect of the urban heat island is reversed in areas lacking vegetation and located in hot climates like Doha. His study is based on the fact that inner-city areas include more vegetation and shading than the city’s peripheries. Vegetation is used extensively inside the city as a beautification element, while, in other regions, plants grow outside the city naturally and with higher density. On the other hand, tall buildings cast shade on horizontal surfaces and provide a cooler ambiance for pedestrians during the day. Mohammed and Salman [
24] compared two hypothetical residential configurations in Baghdad City, and similar to Ghardaia [
15], they found that high-rise developments provide cooler environments with lower T
mrt and LST during the daytime. The study found insignificant changes during nighttime. Almarakby et al. [
16] used local climate zoning (LCZ) to study the relationship between UHI and urban forms. Contrary to former studies, this one found no correlation between the two. For instance, the low-rise district (Al-Shorouq City) and the mid-rise district (Fatimid Cairo) were associated with higher UHI values compared to the high-rise area (Al-Nasr City). Another low-rise area (Garden City) was found to have the minimum UHI among the four areas. Using the same tool with satellite imagery of Beirut City, Kaloustian and Bechtel [
18] found an increase of around 6 °C in high-/mid-rise areas compared to the AUB campus and an increase of around 20 °C on the roofs of the same areas compared to vegetation class temperatures.
Table 1.
UHI-related literature; cities studied; methodology used; and parameters collected, measured, or estimated.
Table 1.
UHI-related literature; cities studied; methodology used; and parameters collected, measured, or estimated.
| Study | City | Methodology | Parameters Studied | Related Findings |
|---|
| [7] | Philadelphia | Math. model, Site measurement | Building height, Surfaces, Ambient temp., RH | Methodology for modeling heat stresses and heat-vulnerable population based on GIS and field measurements. |
| [8] | Aswan | Simulation, Site measurement | SVF, PET | Significant variance in PET according to building configuration and orientation. |
| [14] | Vancouver | Satellite imagery | SVF | Methodology for measuring City SVF using satellite imagery |
| [15] | Ghardaia | Computational Model, Simulation | SVF, albedo, orientation, Tmrt | Street orientation role for seasonal trade-offs.
Tmrt increase due to low SVF, while H/Wof 2 or more provides an optimized form. |
| [26] | Vancouver, Uppsala | Simulation, Site measurement, Math. Model | Near-surface temp., Building geometry, Surfaces | Mathematical model representing the cooling of urban surfaces based on thermal and radiative properties. |
| [27] | Cairo | Satellite imagery, Statistical model | LST, Temporal parameters | UHI intensity and surface albedo are negatively correlated with warming in the daytime and nighttime LST. |
| [28] | Egypt—General | Theoretical, Simulation | SVF | Qualitative variables for Plaza and Canyon geometry in relation to SVF. |
| [22] | Multiple cities | Site measurement (Google Street images), Statistical | SVF | Methodology for averaging city SVF using data collected from panoramic photos |
| [29] | UAE, Multiple cities | Simulation, Site measurements | Urban form, SVF, Tmrt | Compact designs with high H/W ratios have cooler air temperatures during the day. |
| [24] | Baghdad | Simulation | SVF, Tmrt, Ambient temp., LST | Insignificant effect of building geometry on nighttime air temperature compared to a negative effect on Tmrt and LST |
Historical weather data and Landsat-8 satellite images confirm an increase in land surface temperature during the day in rural areas compared to the built environment. However, the urban heat island (UHI) effect is primarily manifested during the first hours of the night when impervious surfaces in urbanized areas fail to emit the heat absorbed during the day back to the sky, beyond the city scale [
7]. The vertical surfaces of tall buildings, which provide shade during the daytime, trap long waves and retain them within the urban space at nighttime [
30]. In contrast, permeable ground materials outside the city, with no vertical surfaces around, allow for a direct release of heat. The temperature difference between both areas at nighttime reflects the UHI phenomenon, even in hot climates. This difference becomes evident in areas with long street canyons fully populated with buildings.
Some studies [
7,
15,
20] have highlighted the trade-offs that building geometry and street orientation offer to compensate for seasonal and diurnal priorities. For instance, tall buildings that provide shade during the daytime intercept long waves at night and cause an increase in temperature. Mohammed and Salman [
24], however, suggested that mitigating daytime temperature should be prioritized over the insignificant temperature increase at nighttime. The study showed a significant role of building geometry in T
mrt and LST compared to its contribution to air temperature. This is justified by the shading effect they provide during the daytime, as their interception of long waves was considered trivial. Elkhazindar et al. [
29] confirmed the ability of UAE’s tall buildings with a lower sky view factor (SVF) to secure lower air temperatures during the summer. The study concluded with recommendations for more compact urban forms and for a lower sky view factor to mitigate the increase in temperature in the context of hot, humid climates. However, Ha et al. [
31] explained the significant negative impact of SVF on nighttime air temperatures compared to the trivial positive impact on daytime ones.
These seasonal and diurnal priorities are less evident in Arabian Gulf cities. As shown by many studies [
3,
24,
29], summer daytime temperature is the prime concern for outdoor thermal comfort in hot, humid climates. Despite these thermal comfort priorities, the study of UHI should be sincere to its definition and mainly linked with the nighttime increase in temperature. Therefore, the seasonal thermal needs shall not be confused with UHI.
3. Materials and Methods
A combination of approaches is adopted to collect, prepare, and analyze the data for this study. These approaches include air temperature simulation, sky view factor calculation, field measurements, and the collection of historical data. The intent of employing multiple approaches is to provide a robust understanding of the relationship under study, supported by a variety of tools and techniques.
3.1. Study Area
Over the last two decades, urbanization in Doha has expanded at accelerating rates, leading to an increase in the adverse effects of the urban heat island (UHI) phenomenon. New residential areas have been developed to meet the needs and desires of the inhabitants for convenient residences. This study has selected two fully functional residential areas in Doha with significantly different building regulations and zoning requirements. The study will focus on the parameters directly connected to the geometry of buildings and their proximities, such as height, number of floors, setbacks, and floor area ratio. Therefore, it is essential to note that regulations related to vegetation, for example, are excluded, although they generally reduce the UHI effect. Elliot et al. [
32] discussed many green infrastructure and design solutions for mitigating the UHI effect under architectural, infrastructure, and planning categories, covering passive design, materials, wind, vegetation, transport, land use, and others. While each of these aspects can mitigate the UHI effect, this study ignores the factors not directly related to building geometry and configurations. Studying the two distinct zones makes it viable to estimate the impact on other zones in between and establish the status quo baseline of residential zones in Doha.
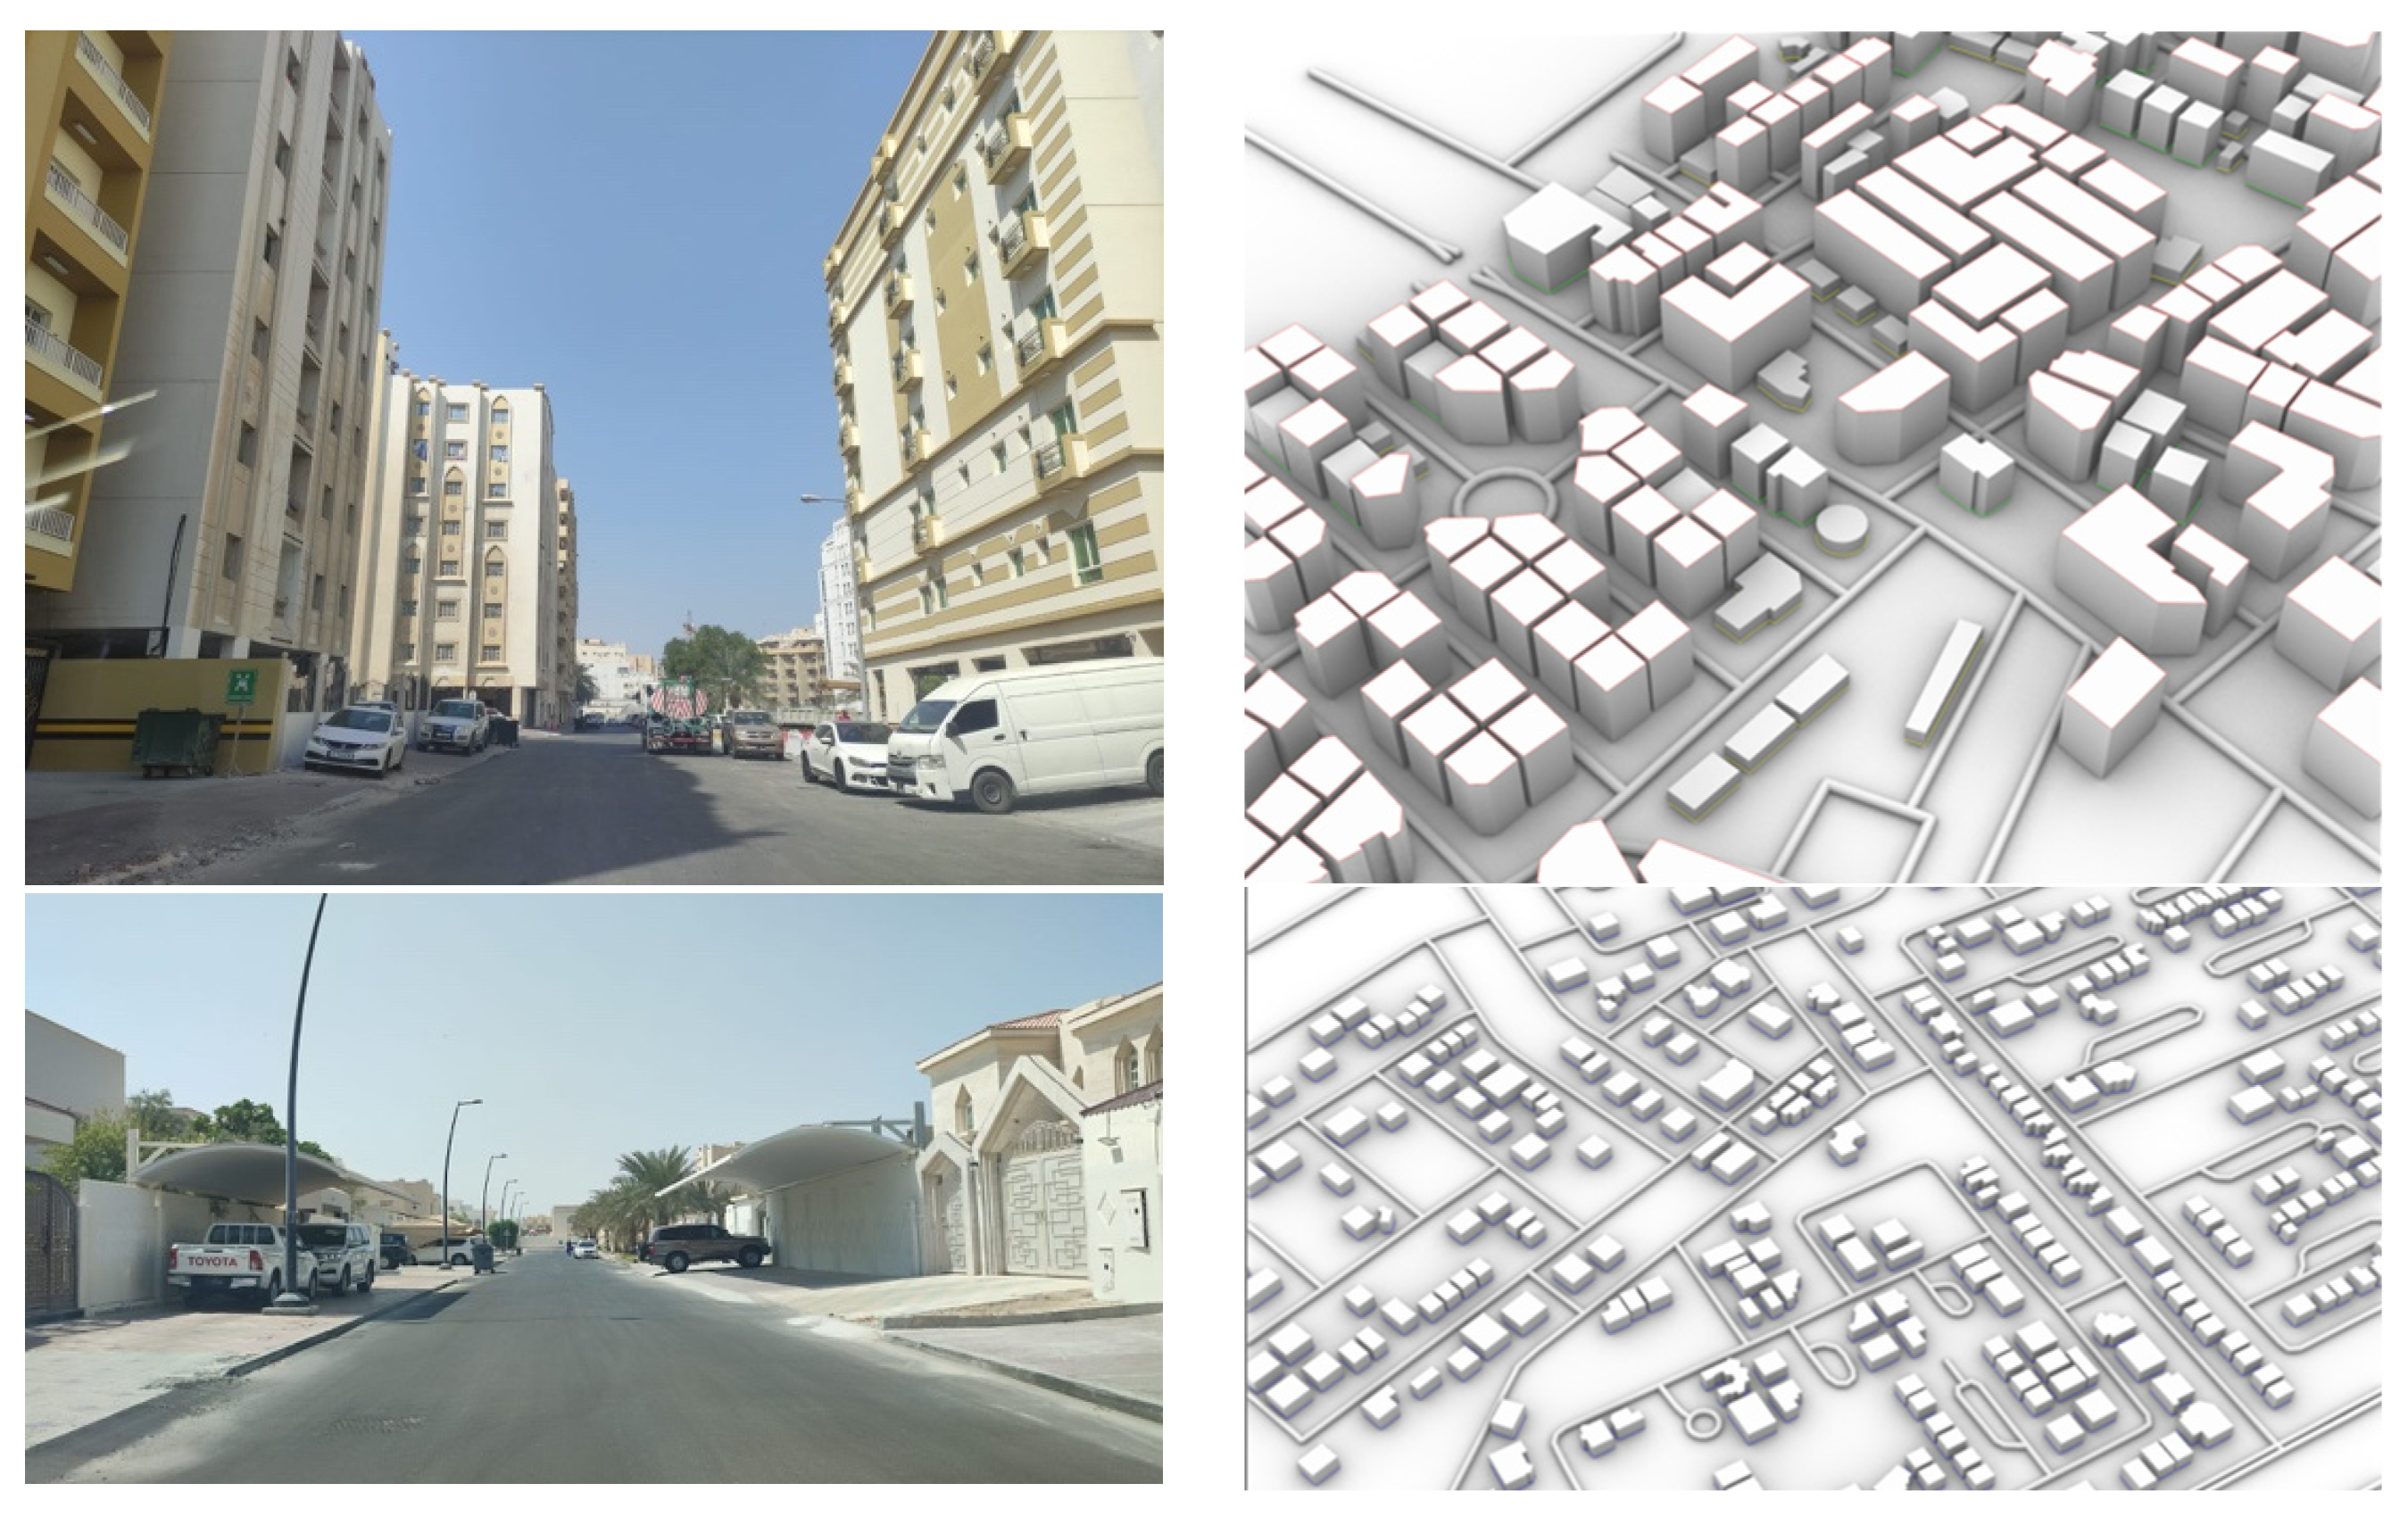
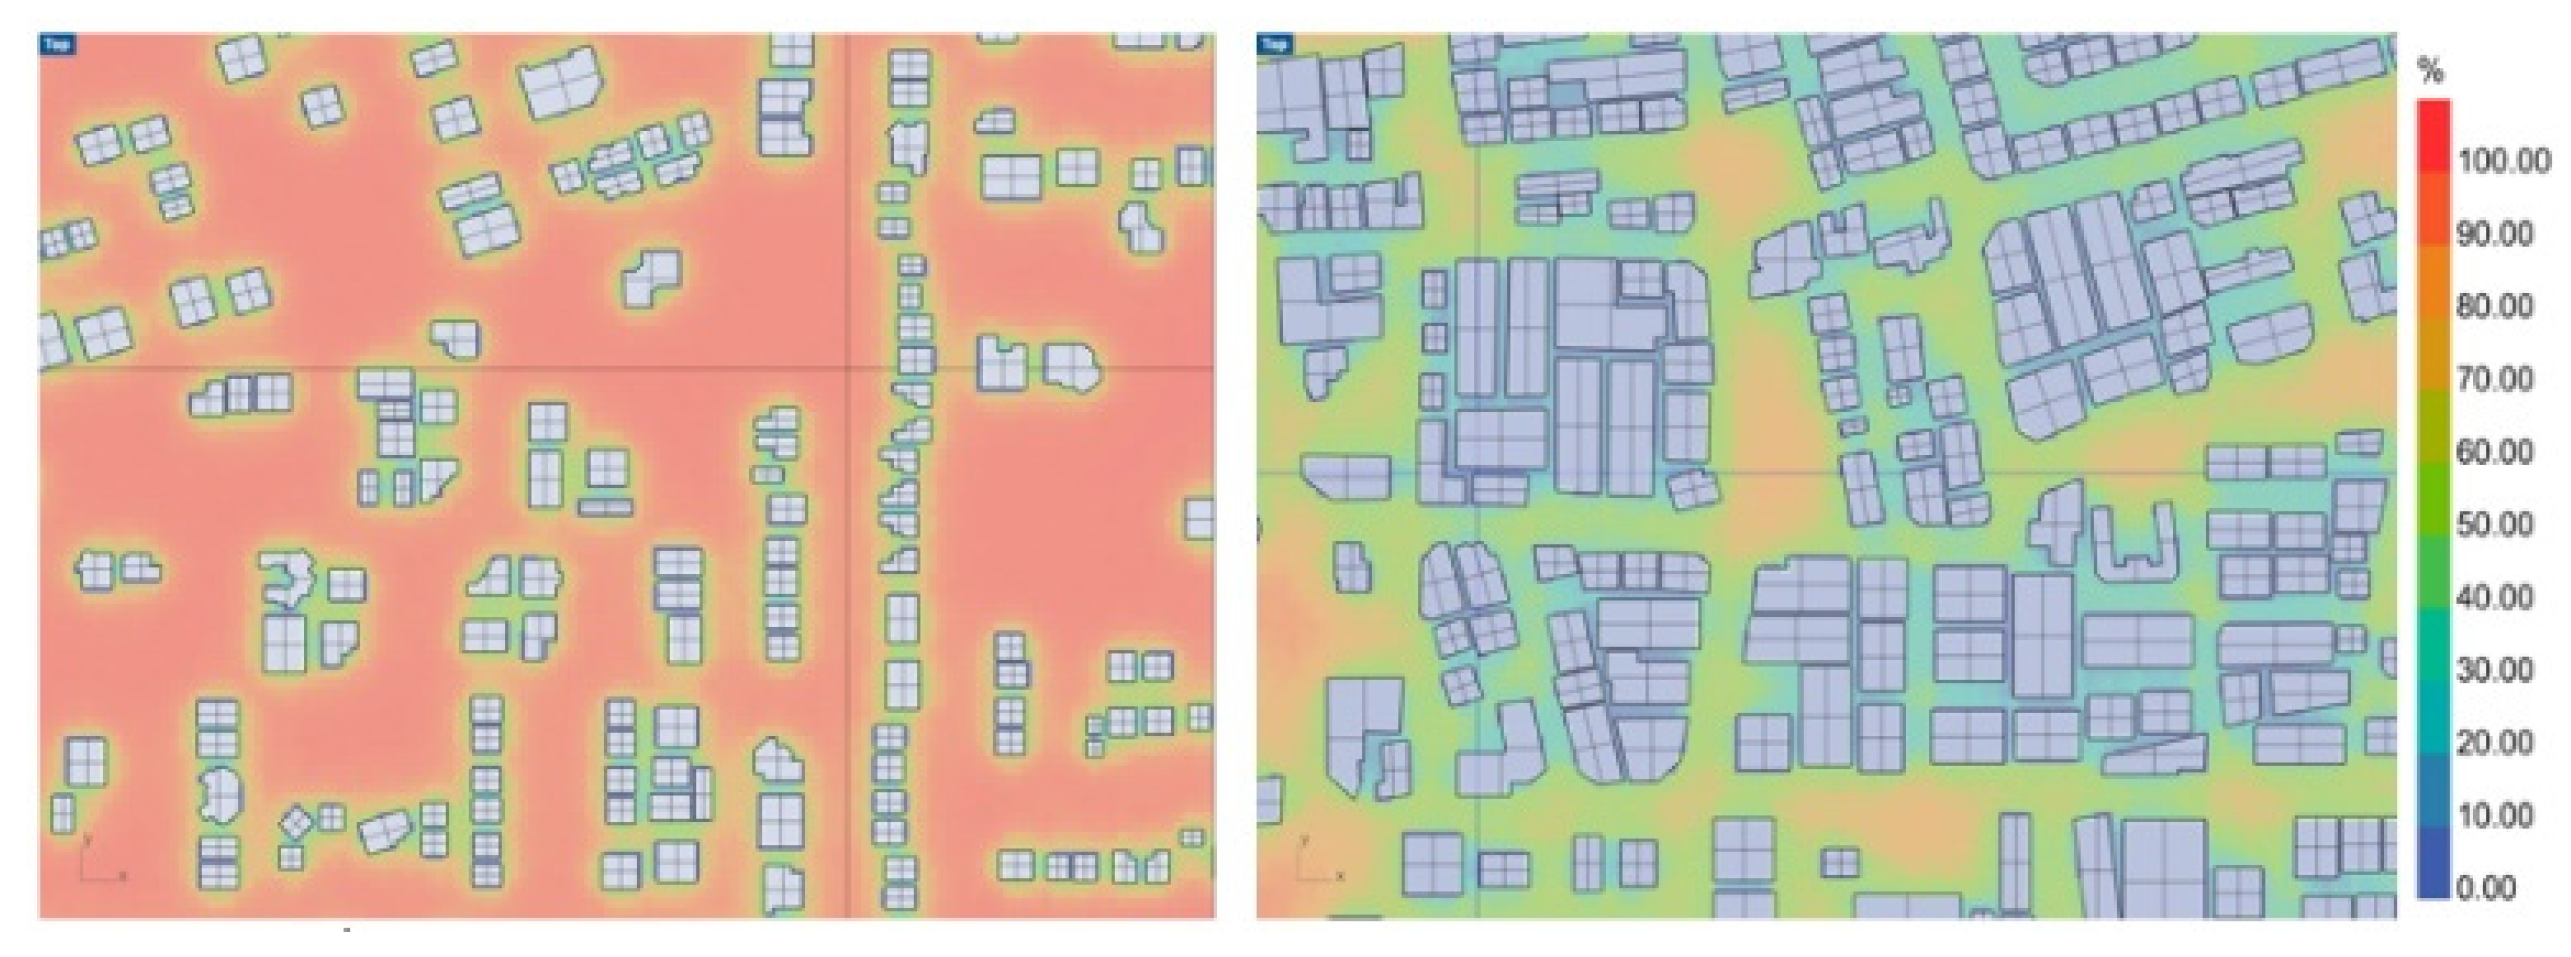
The first zone selected for this study is the LR Quarter, where detached houses are limited to two floors (ground floor, first floor, and penthouse, abbreviated as G + 1 + P). Buildings have abundant setbacks with less footprint on the site. The HR zone, however, consists of mid- to high-density multi-family residential buildings, ground plus seven floors, and bulky geometry with relatively minimal setbacks.
Figure 1 indicates the primary land use for both areas.
Table 2 provides a comparison between the regulations of both land uses. However, physical visits have revealed that most of the buildings in HR were exempted from the footprint requirements. The plot areas of these buildings were much less than the thresholds stipulated for the “ground plus seven floors (G + 7)” allowance mentioned in the regulations. Therefore, the simulations discarded the requirements not applicable to match the actual site as closely as possible.
3.2. Estimating Urban Heat Island Effect
Computer simulations are commonly used to estimate many UHI-related parameters, such as dry bulb temperature and sky view factor. This study utilizes several tools to estimate these parameters based on urban forms, placements, and physical properties. The study creates typical models of hypothetical urban environments based on the applied zoning requirements in the selected settlements to estimate the increase in dry bulb temperature and the sky view factor.
A few computational tools are commonly used for outdoor environment thermal simulations. While extensively used in research, ENVI-met v4 software is limited by coarse voxel sizes and long simulation runtimes. However, the Ladybug plugin has recently emerged as a solid alternative for microclimate simulations, taking advantage of the Rhino Grasshopper ecosystem, which provides a familiar modeling platform and easy visual scripting. The tool has also been introduced to the Revit-Dynamo ecosystem. Ladybug thermal simulations provide instant and reliable results, permitting quick iterative studies compared to hours-long ENVI-met simulations.
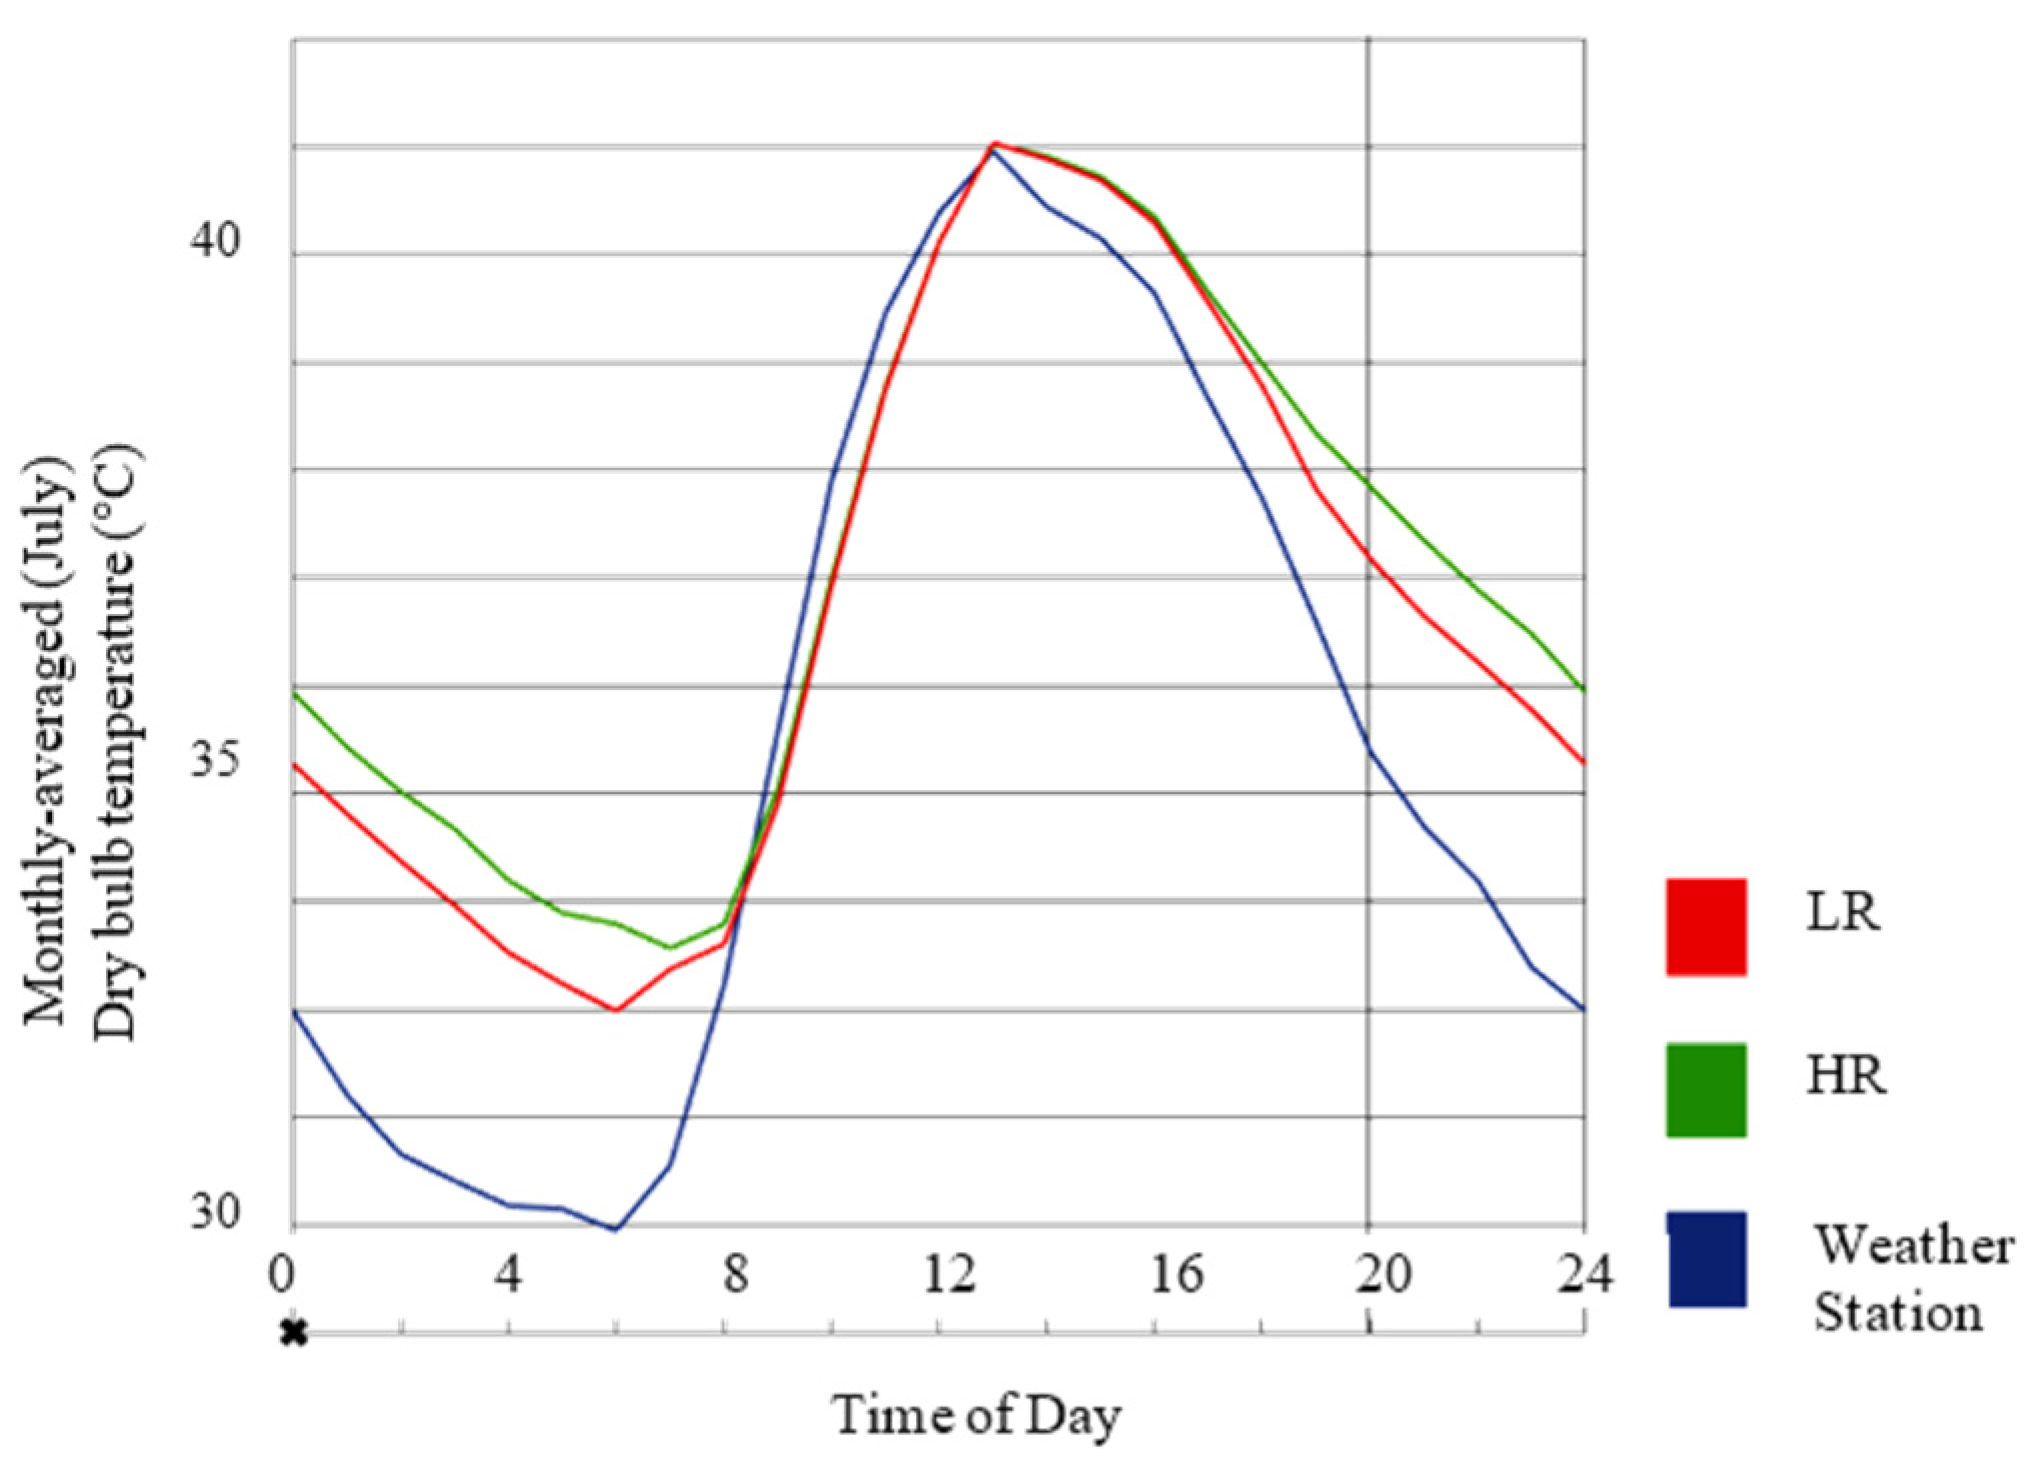
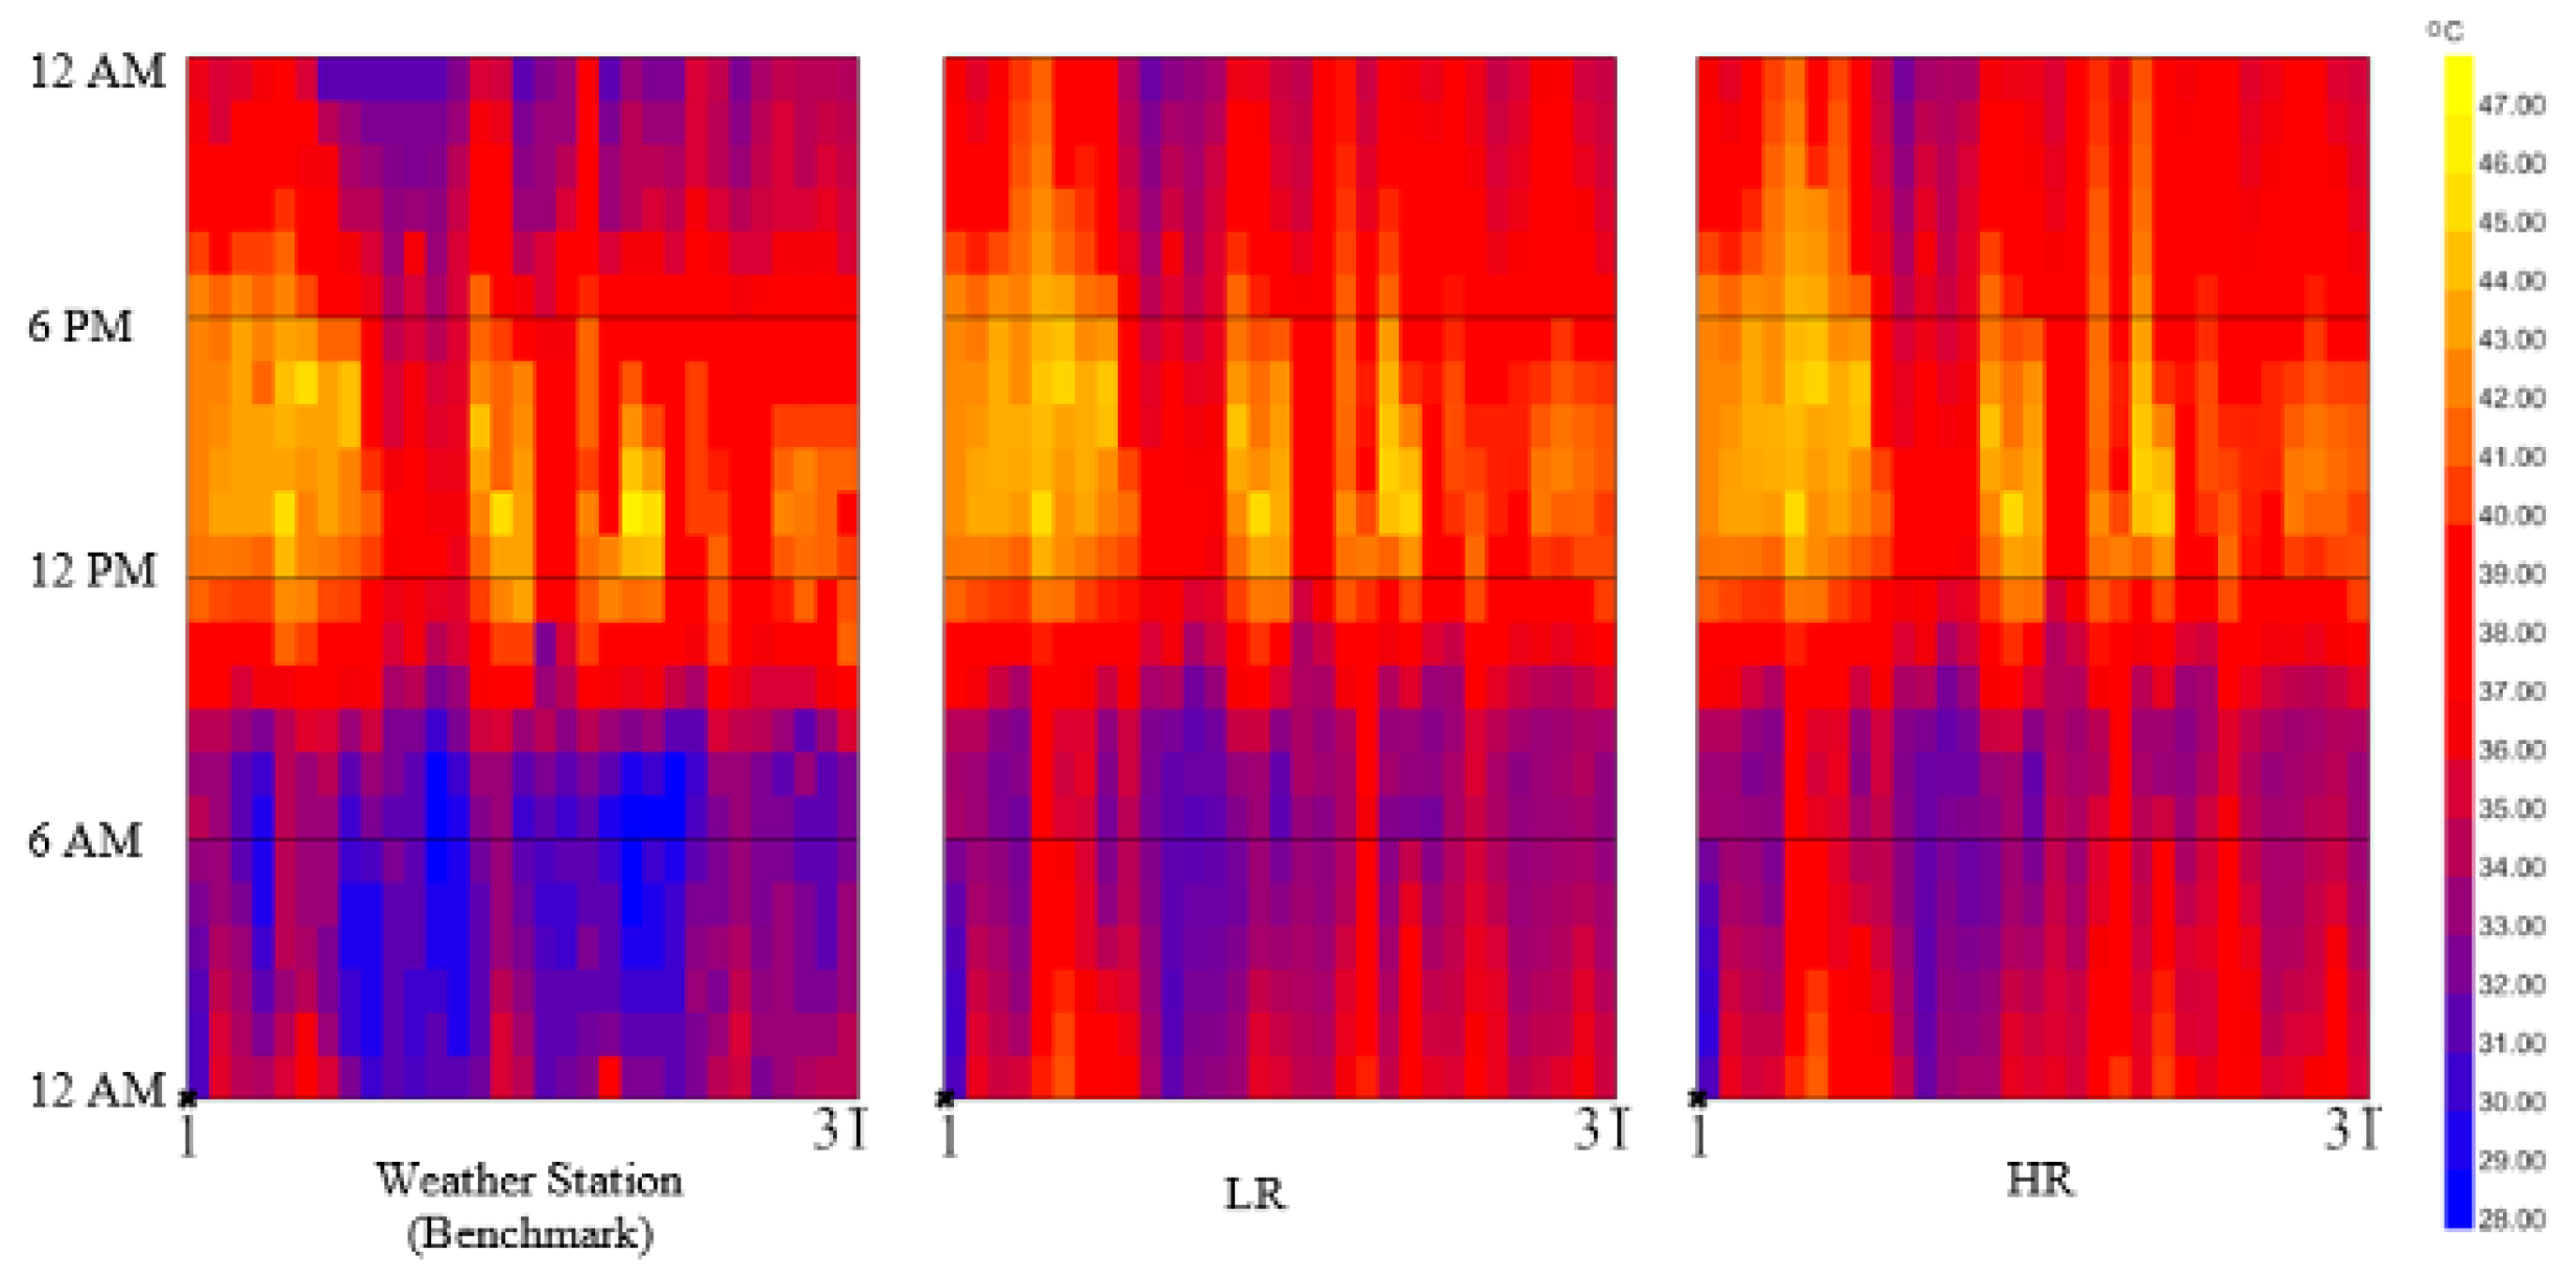
The simulation of the increase in dry bulb temperature is compared to readings recorded by the weather station located at Doha International Airport and obtained from Climate.OneBuilding website. Dry bulb temperature is a critical parameter for measuring the urban heat island, as it is mainly manifested by the difference in air temperature between rural and urbanized areas [
7]. Dragonfly and urban weather generator (UWG) tools simulate this parameter and reproduce new EnergyPlus weather files for both models. The simulation considers the month of July, associated with the highest monthly averaged dry bulb temperature, as illustrated by historical data. The simulation results are formatted in the form of the temperature difference over 24 h, representing an average day in July. The urban heat island, represented by the difference between the temperature of the inner city and the rural area of the near-surface air layer, reaches its maximum in the early hours of the summer nights with a calm, clear sky [
26,
30,
33,
34]. Therefore, this difference is expected to be primarily evident at this time.
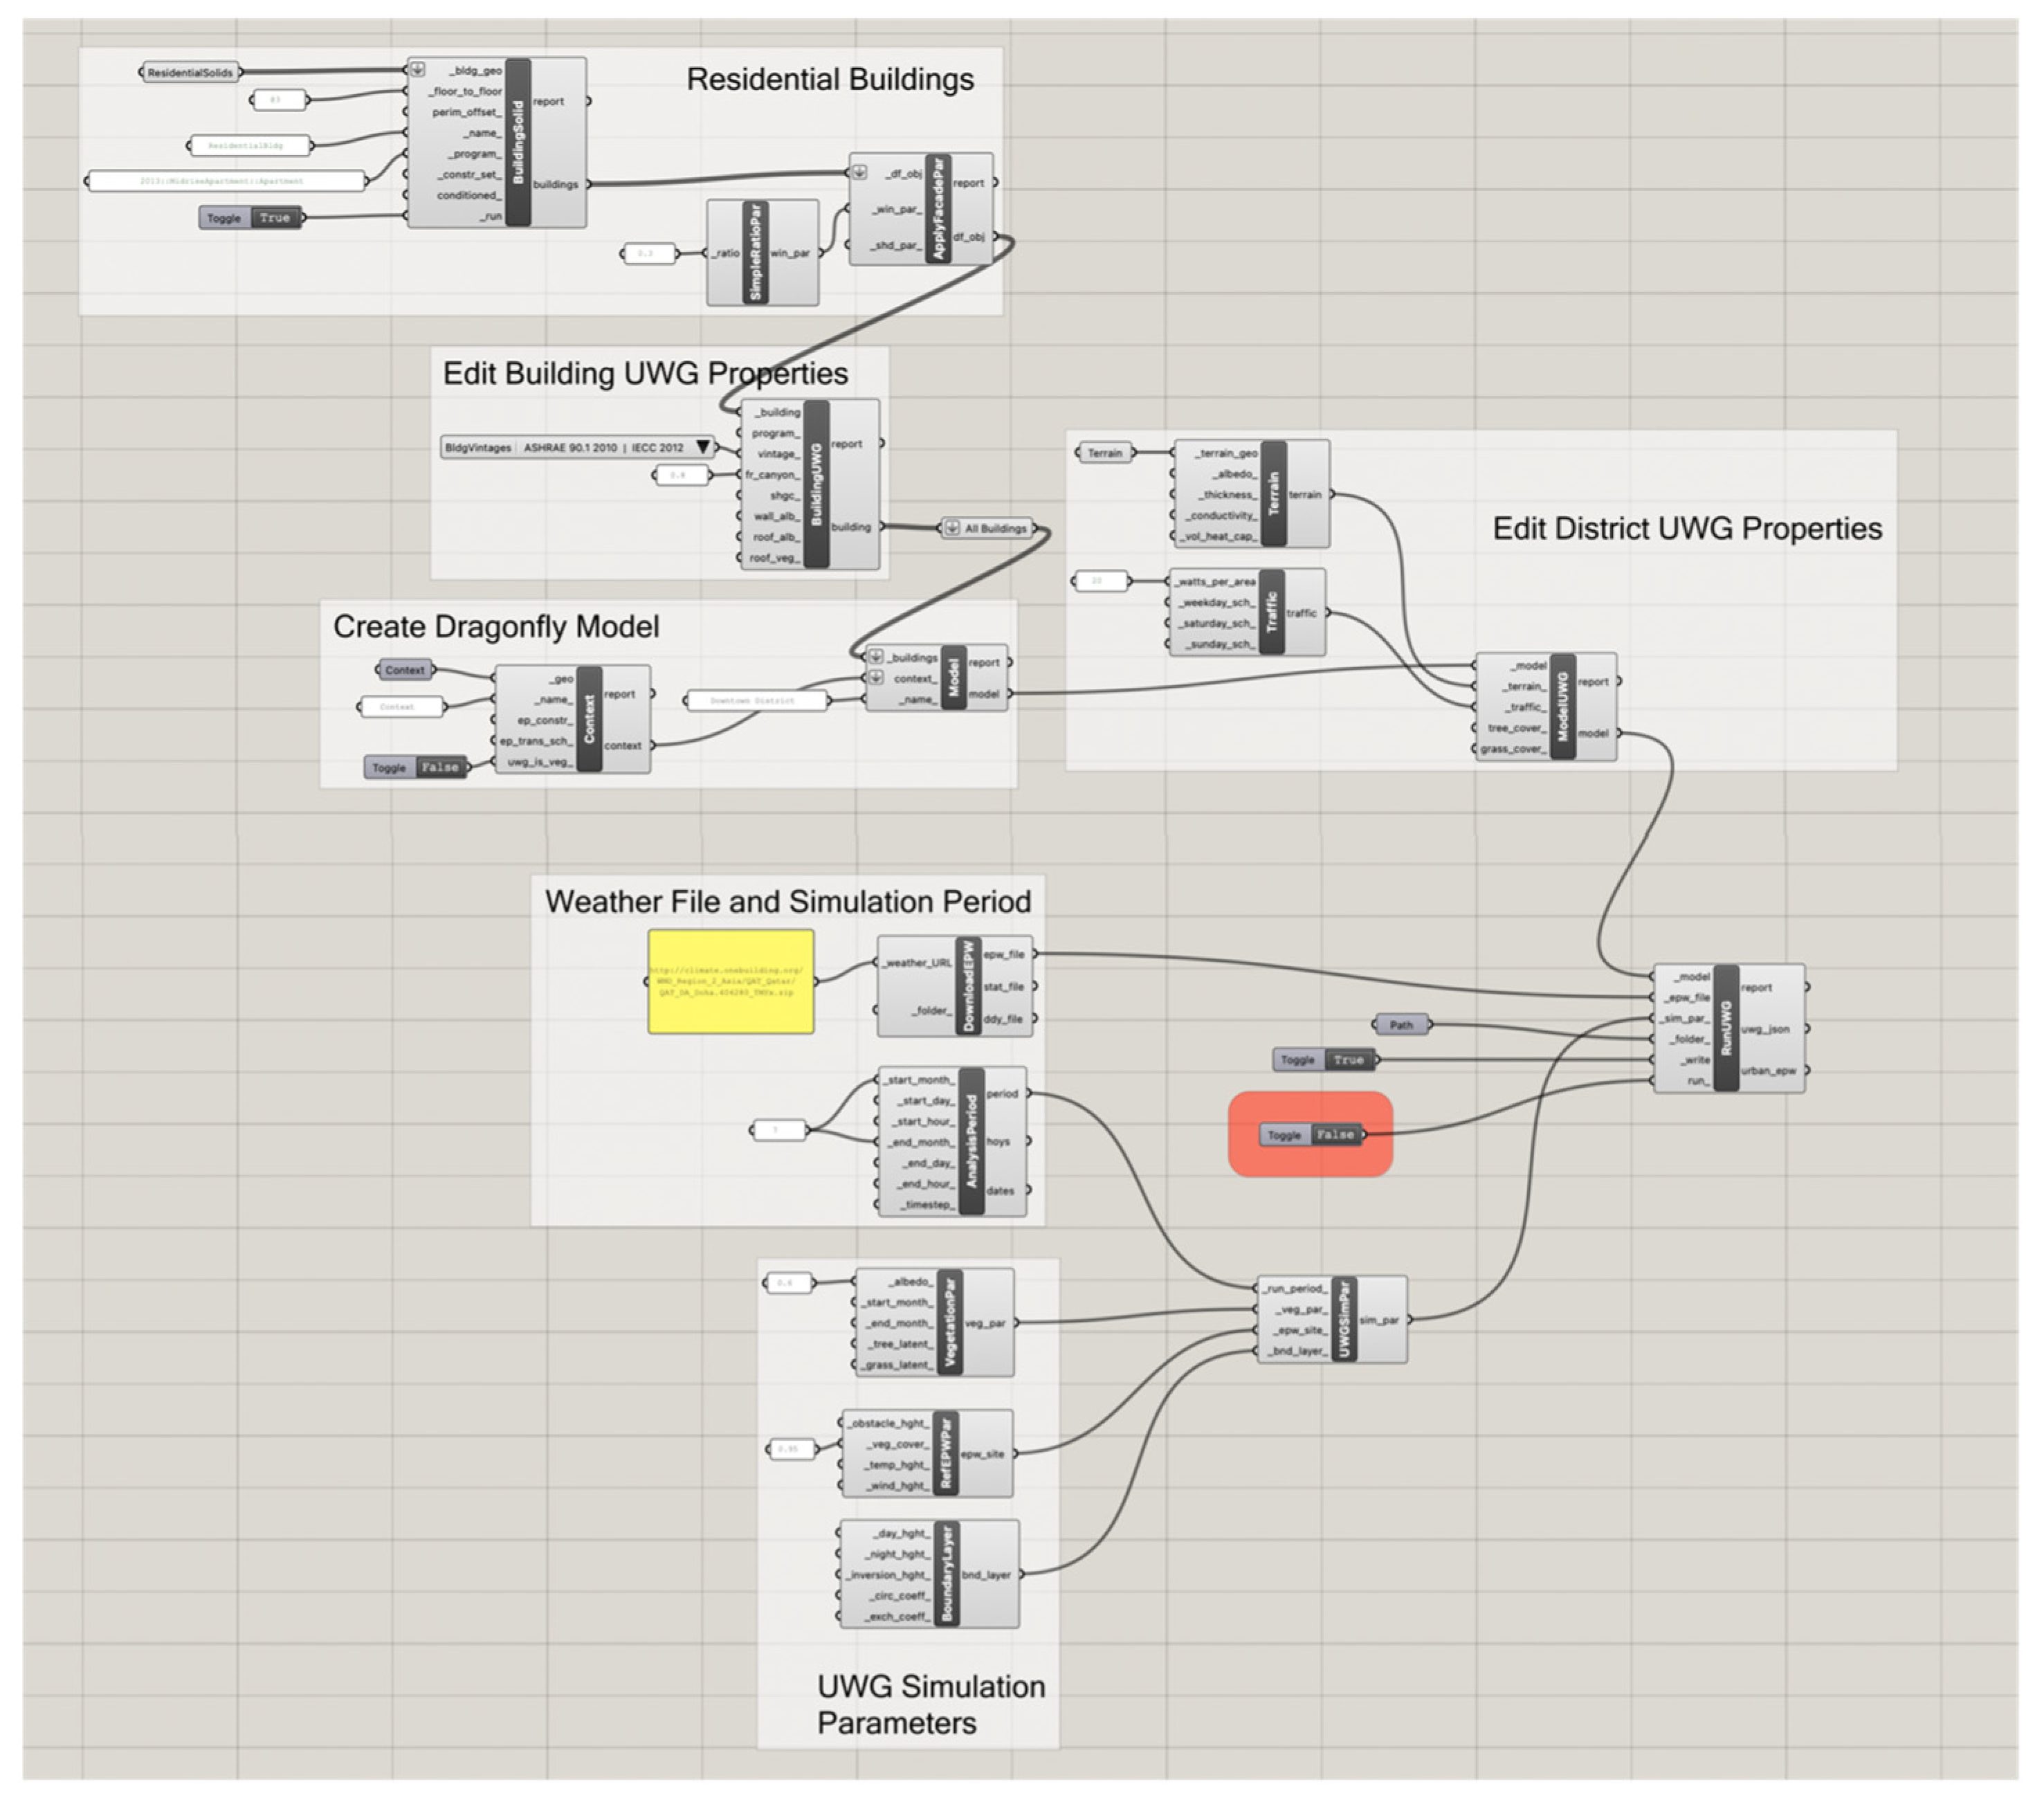
Figure 2 shows the procedure designed in the Grasshopper, Ladybug, and UWG tools to conduct the simulation. The UWG tool was developed based on a thesis by Bueno [
35] applied to several cities for testing and that received multiple refinements from a group of researchers [
36]. Ladybug simulations were validated in comparison to other simulation tools, primarily ENVI-met [
37], or to actual air temperature [
38,
39] and not only show agreement with other simulated and measured values but also demonstrate the tool’s competency in optimization studies.
Although Sky view factor calculations can be computed using the general mathematical equation (
, where α is vertical angle function of the azimuth angle π) [
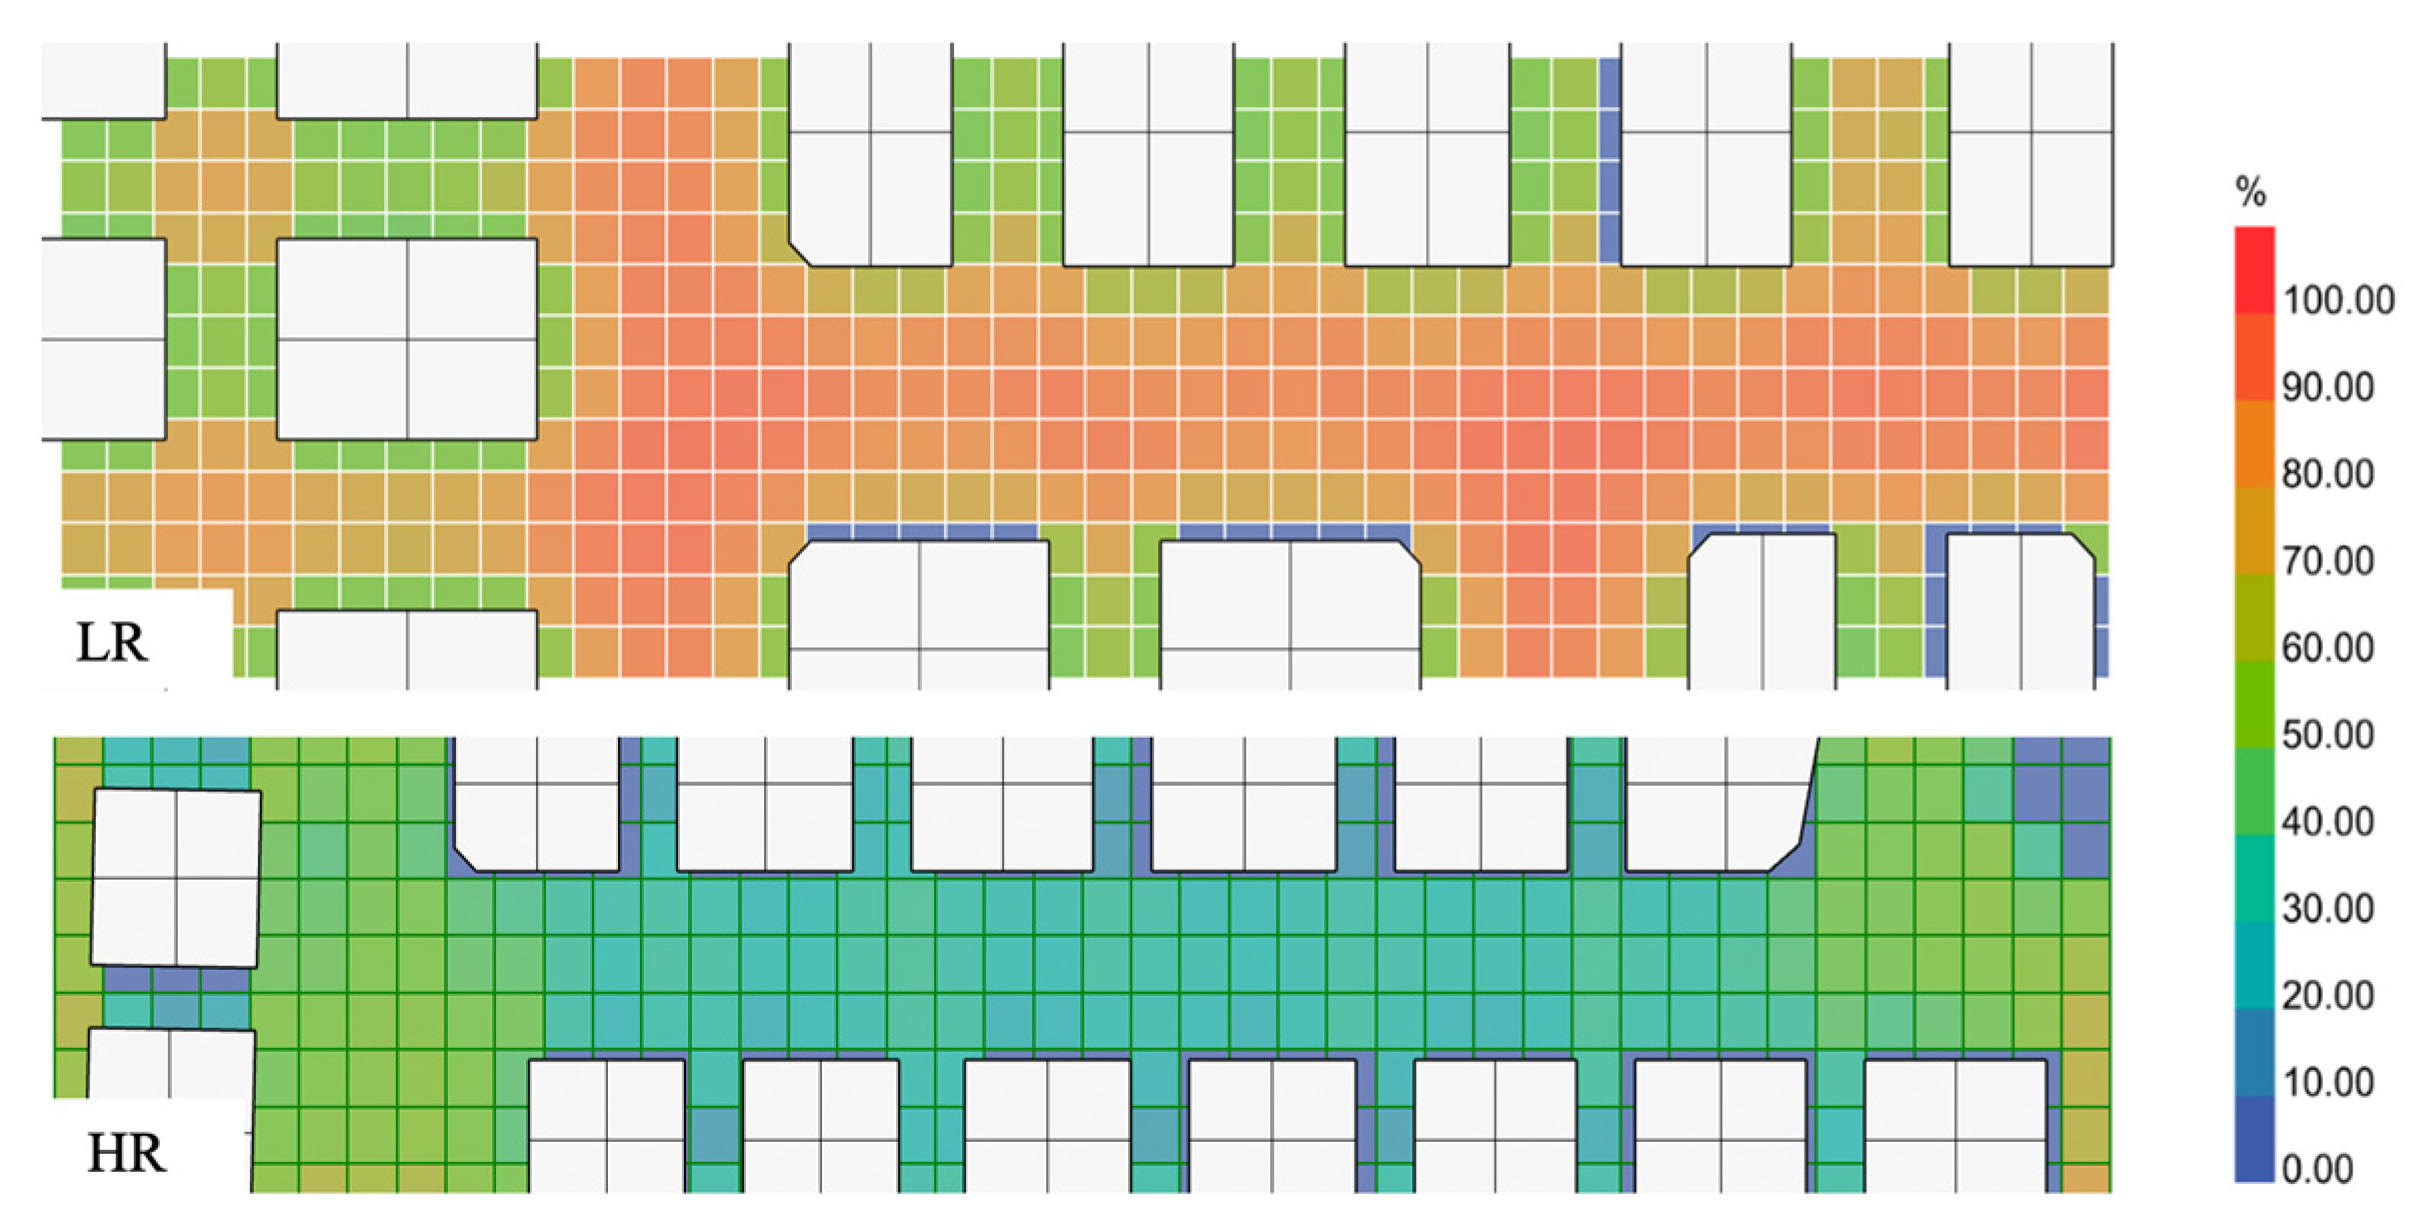
15], simulations can be utilized to quickly calculate the sky view factor over the street-level areas in the two regions. Unlike the rural environment where the sky view is unobstructed, in built environments, vertical surfaces play a significant role in retaining heat near ground levels. The street canyon, a form of built environment characterized by tall buildings with narrow streets, makes it difficult for surfaces to dissipate heat accumulated throughout the day back to the sky. The sky view factors can be estimated based on building geometry and proximity to other buildings.
Ladybug tools are open-source add-ons for the Grasshopper visual scripting tool that provide indoor and outdoor environmental-related simulations for models created in the Rhino environment. Similar to the dry bulb temperature simulation, a procedure to estimate the sky view factor is designed, as depicted in
Figure 3. These procedures were inspired by sample files provided by the authors of the tools (acknowledgments to Chris Mackey). The sky view factor is simulated in two street canyons in the selected areas. A grid of 5 m is employed, with the SVF estimated at the intersections of the gridlines, as suggested by Wu et al. [
23]. An average SVF is then calculated based on the values estimated at the grid points. Both simulations use the same models for the two regions.
3.3. Site Measurements
The land surface temperature (LST) metric is commonly used in investigating a microclimate at a specific time and location. The actual LST can be practically measured by various devices and tools. Many satellite products provide periodic data for LST at daily, weekly, and monthly intervals. This study initially considered freely available datasets provided by NASA’s MODIS 11A product for nighttime LST with a 1 km resolution. While other satellite products may offer better resolution or time intervals, only MOD11A provides the necessary nighttime average measurements. For example, Landsat 8 provides LST at a 30 m resolution but lacks distinctive nighttime measurements. Two studies [
11,
27] have used the MODIS dataset to evaluate the spatial and temporal characteristics of nighttime surface urban heat in Greater Cairo. Bechtel et al. [
19] utilized the MODIS dataset for annual temperature cycles in mapping 50 cities, as the dataset contains diurnal records. However, the low resolution (1 km resolution) of the dataset prompted the study to utilize Landsat 8 as a secondary source for LST data. The study concluded with significant variations between the two datasets, presenting a challenge for their integration.
During our study, we also found that some areas in Doha are not covered by the dataset due to their proximity to the shoreline, awkwardly excluded by MODIS imagery. This leads to inconsistent results in the averaged LST of monthly intervals. The coarse resolution of the dataset provides district-averaged LST, serving as a useful indicator for comparing temperatures. However, it is essential to note that these measurements incorporate heat generated by traffic, thermal demands of buildings, and heat mitigated by vegetation, with no easy separation or breakdown of the contributions from these sources.
The nighttime dataset exhibits a significant difference in temperature compared to the daytime dataset. This corresponds with the nature of the urban heat island (UHI); during the daytime, surfaces in both rural and urbanized areas are exposed to solar irradiance. In Qatar, the lack of natural vegetation in rural areas diminishes the generally expected temperature difference. This phenomenon is also observable in the satellite images taken during the daytime [
3]. Conversely, during nighttime, radiated heat (loaded by long waves) in urbanized areas is captured by the impervious nature of surface materials and the reflective effect of vertical surfaces of buildings. Radiative cooling differences are more pronounced under such conditions compared to daytime conditions.
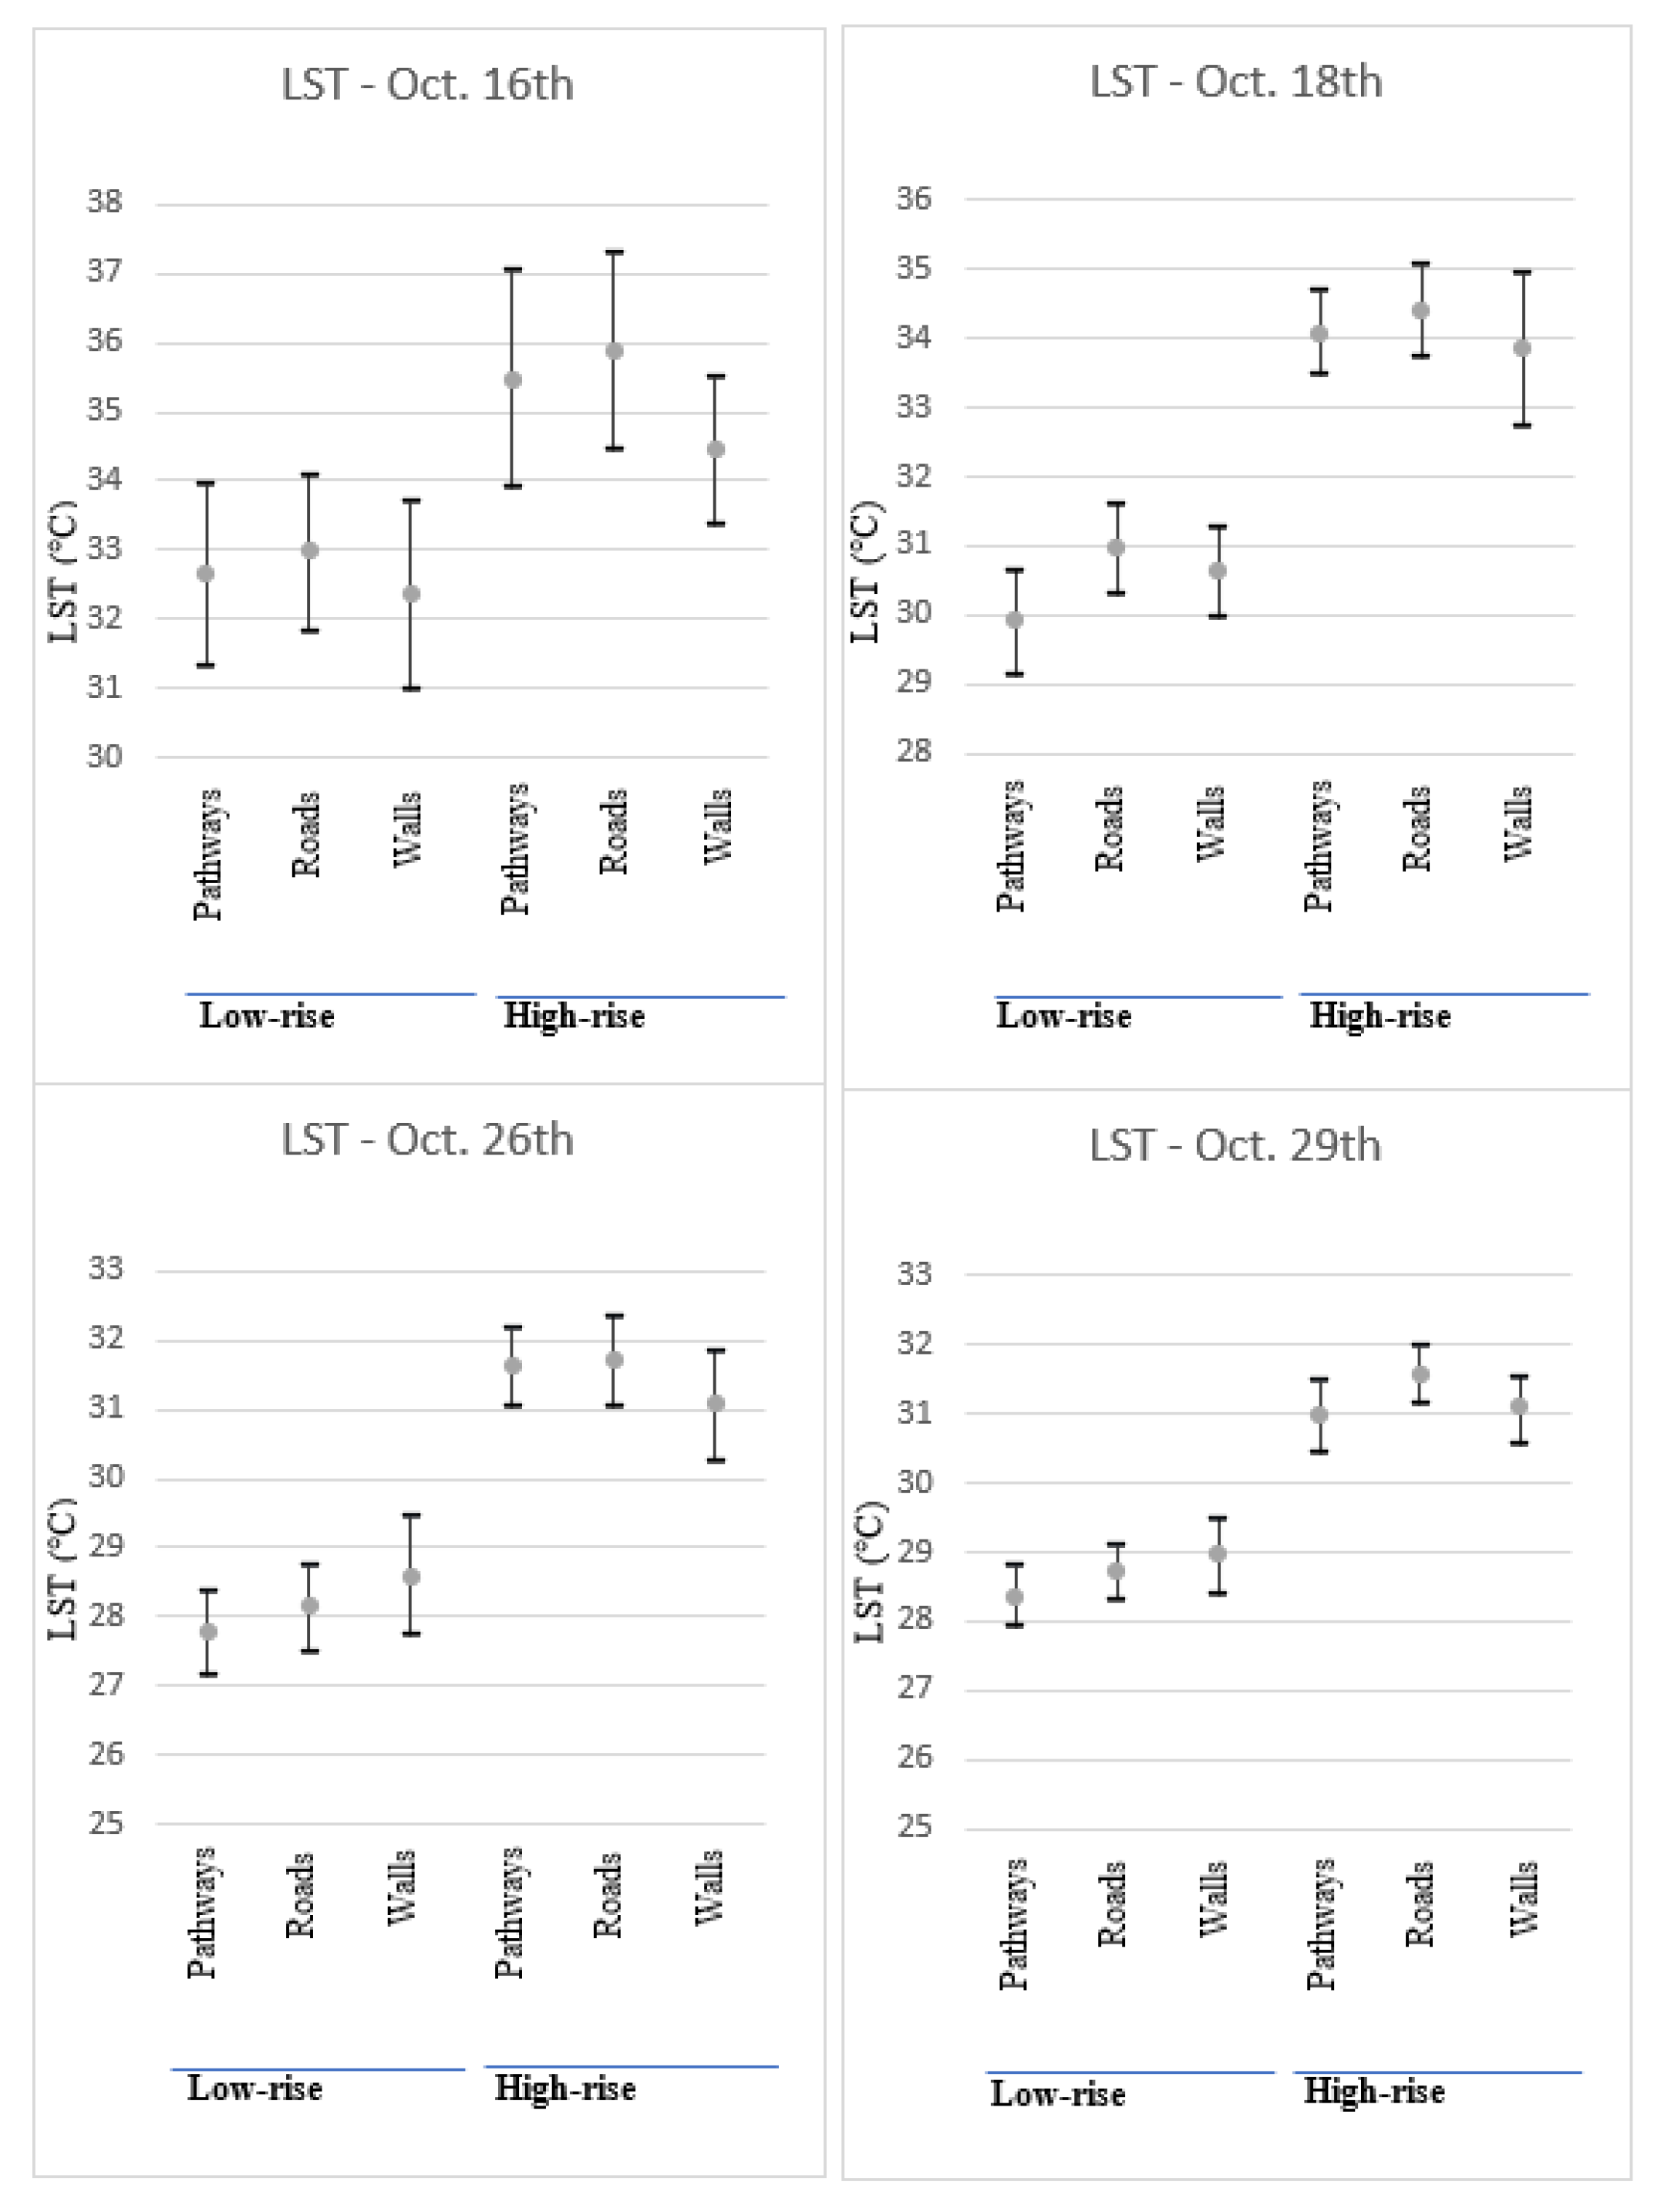
The low-resolution limitation of satellite imagery underscores the necessity for immediate site measurements. These field measurements are gathered through thermal imaging visits to both settlements to assess the typical surface temperatures. These visits were conducted at 7:00 p.m. on various nights in October. This particular time is presumed to correspond with the highest increase in dry bulb temperature difference, as corroborated by the preliminary results of the simulation. October, however, was chosen due to constraints associated with the study’s timeline. Readings were taken for typical hardscape surfaces in designated areas of the selected quarters. Surface temperature fluctuates depended on the type of surface being examined. Consequently, land surface temperature (LST) readings were compared based on the surface application (such as asphalt roadways, sidewalks, and walls). The gathered measurements were analyzed using basic statistical tools (T-table) to compute the average LST. Measurements were conducted on four different days (two weekdays and two weekend days) simultaneously in the two areas. A thermal imaging tool was employed to gather an adequate number of samples for each surface type, including roads, pathways, and walls. Where feasible, areas exposed to traffic or air conditioning equipment were avoided to mitigate their impact on the urban heat island (UHI) effect. The selected surfaces were chosen to be similar in both areas: asphalt for the roads, concrete interlocking for the pathways, and light-colored plastered CMU materials for the walls.
5. Discussion
The increase in air temperature in low SVF neighborhoods due to building geometry during nighttime has been neglected by most studies in the region, as reviewed earlier [
3,
24,
29], in favor of mitigating the harsh daytime temperatures. From the perspective of thermal comfort, this approach is justified by the effect of shadows cast by architectural elements, as suggested by Ali-Toudert and Mayer [
15]. Dry bulb temperature simulations, however, show a negligible advantage for HR zones during the morning hours (8 a.m.–12 p.m.) when compared to the temperature difference in the afternoon and evening hours. Moreover, shading offered by tall buildings can reduce LST but has an insignificant impact on air temperature during the daytime [
24]. On the contrary, urbanization effects during nighttime have a noticeable influence on both metrics. These results are in agreement with Ha et al. [
31] regarding a negative correlation between SVF and nighttime air temperature, while SVF has been found to be insignificant for daytime air temperature.
Heat carried by long waves during the nighttime is obstructed by vertical planes at the two sides of the relatively narrow street canyon. Heat blocked by the vertical surfaces is reflected back, causing increments in near-surface temperature, as depicted by dry bulb simulations. The SVF metric is a key performance indicator for assessing UHI associated with building geometry, apart from other physical factors of the built environment, as evident in many studies and tools. Yet, unlike nocturnal studies, SVF should be accompanied by the orientation for daytime studies, as noted by Ghardaia [
15], in which high H/W aspect ratios were preferred for the Algerian desert city. Daytime studies for three hot climate cities (Doha, Baghdad, Abu Dhabi) [
3,
24,
29] indicate an increase in air temperature in urbanized areas when compared to rural ones. Our study, however, found that this difference is minimal, while nighttime air temperature is evidently higher in high-rise zones, confirming that UHI is more pronounced in the early hours of the night. Lin et al. [
20] suggested a negative correlation between building geometry and nighttime air temperature. This phenomenon was found evident in the case of Doha, Qatar.
LST measurements reveal striking variations between the two zones based on hardscape surface type. While the figures indicate an insignificant role of the intrinsic characteristics of hardscape surfaces on nighttime LST, they do show consistent and noticeable differences between the LST of the same materials in the two zones. In the LR zone, concrete pavements consistently exhibit the lowest LST due to their high solar reflectance, whereas vertical surfaces notably show the lowest LST in the HR zone. This suggests that flat surfaces situated in areas with high SVF dissipate heat more rapidly compared to those in high-rise areas. Vertical surfaces, however, serve more as intermediaries for heat loss to the atmosphere rather than being primary receivers. The LSTs of dark asphalt and bright walls in the LR zone were found to be comparable, despite differences in solar reflectance between the materials. Conversely, in the HR zone, asphalt consistently exhibits higher LSTs, as discussed earlier.
The primary LST difference, however, lies between the two zones, supporting the influence of building geometry. Unlike the findings from daytime studies in hot climate cities [
3,
15], this effect is reversed during nighttime, with heat being retained more in high-rise developments. Ali-Toudert and Mayer [
15] proposed the utilization of high aspect ratios due to their ability to cast longer shadows during the day across various orientations. Makido et al. [
4] generated maps of predicted air temperature for Doha for a day in May at 1 p.m. using three statistical models based on Landsat 8 dataset imagery. While the resulting maps did not exhibit any correlation with building geometry, the study focused more on the proximity to open spaces, green areas, and water bodies. Siddiqui [
3] illustrated a pattern of cooler urban areas based on Landsat 8 daytime LST, contrasting with our nighttime LST measurements revealing cooler low-rise zones.
Comparing the absolute LST values of weekdays and weekends is challenging, as they are typically influenced by the prevailing weather conditions of each day. However, measurements indicate that there is a smaller disparity in LST between the two zones during weekends. This diminished gap can be attributed to the influence of traffic and human activity during weekdays, which generates heat that permeates the surrounding surfaces. Given the higher concentration of households, the intensity of traffic and human activity is significantly greater in HR zones. As this effect diminishes notably during weekends, the disparity in LST between residential zones also decreases.
6. Conclusions
The UHI effect is correlated with multiple factors in the built environment, one of which is building regulations that determine the spatial arrangement between building forms and their surroundings. This study investigated the effect of UHI through various urban form metrics in two residential zones in Doha, utilizing simulation, historical data, and on-site measurements. These metrics include dry bulb temperature, land surface temperature, and sky view factor. The study concluded by establishing a correlation between UHI and urban density. While all approaches confirmed this relationship, it was found that data extracted from satellite datasets did not align with data collected from on-site measurements for the same month of the year.
On the other hand, increasing the density of the urban setting has ample benefits for the sustainability of the built environment and the efficiency of the infrastructure, including enhanced walkability, a diverse mix of uses and proximity to services, reduced transportation miles traveled, and improved serviceability of mass transit solutions. While this study leans towards low-density development in terms of mitigating urban heat island effects, building form assessments are not restricted to a single aspect but instead consider optimizations and trade-offs between a range of criteria. These criteria may encompass real estate factors such as land prices. Authorities could explore compromise solutions by reducing urban density (for instance, through enhancing setbacks) and regulating land prices.
Regarding geometry, the more compact and bulkier the buildings are, the higher the UHI effect tends to be. Decisionmakers must assess the costs and benefits of specific urban forms in relation to the aforementioned aspects to determine the most suitable forms for the city.
This paper has endorsed many findings from other studies in the context of Doha City, highlighted relationships between UHI and other parameters, and proposed several findings related to its aims. However, the main results of this study can be listed as follows:
There is a clear correlation between the increase in temperature, the primary performance indicator of UHI, in the built environment and building height, bulkiness, and proximity.
The simulation of dry bulb temperature reveals similar patterns in rural and inner-city zones between 8 a.m. and 12 p.m., supporting claims related to the reversed UHI effect in hot regions. However, the early hours of the night exhibit a significant rate of temperature change in favor of rural areas, peaking at 8:00 p.m. during the study period. Similar results have been identified for low-rise residential areas when compared to high-rise ones, albeit with less intensity.
Site measurements demonstrate a striking and consistent difference in temperature between the residential zones studied. The land surface temperature was approximately 3 °C higher in the high-rise zone during October. Extending this study to the summer months would likely reveal further temperature differences. Additionally, site measurements also indicate temperature variations according to hardscape type within the same zone.
Satellite imagery does not offer comprehensive data for the case of Doha. Similar limitations might be encountered in other coastal cities, as the selected satellite product masks out water bodies that necessitate different computation methods. For many days, the data for vast areas in the city were either invisible, inconsistent, or affected by the minimum default values.
Overall, this study clarifies how key geometric variables govern thermal outdoor comfort, offering urban designers quantitative methods for adjusting massing, setbacks, and proportions to street canyons to enhance human outdoor experience. When embedded in zoning and design guidelines, these finding can justify more permeable low-rise configurations or mandate offsetting measures in high-rise contexts. Yet thermal optimization must be balanced against other aspects like land-use efficiency, social equity, and economic feasibility, leaving practitioners and regulators to negotiate a resilient urban form that satisfies multiple, sometimes competing, objectives.
The study, however, encountered several limitations and challenges concerning timeline, scale, and resources. As a pilot study, the timeline for direct measurements was confined to October. Expanding data collection to the year would yield a more comprehensive trend of data throughout the various seasons. The scale of the study was restricted to two residential zones with varying geometries and proximities. While these zones represent the extremes of the residential building geometry spectrum, incorporating additional zones with differing heights and floor area ratios (FARs) could refine our understanding of the relationship between geometry and UHI, including its linearity or nonlinearity. Regression models could establish more precise and generalized correlations. Moreover, adding more zones could enhance our comprehension of the relationship between energy consumption for cooling loads and land surface temperature (LST).
Satellite imagery data do not consistently provide data for Doha City for each night, as expected. Data were either masked out, contained systematic errors, or were unavailable for many nights. Although the MODIS dataset includes the night_view_time data to demonstrate the correction applied for each zone to differentiate between observations related to daytime and those related to nighttime, it is unclear which observations and for which hours are averaged for the nighttime LST. Early simulations indicated that 7:00 p.m. is the hour when the difference in the dry bulb temperature starts to accelerate. Site measurements for LST were initiated based on these early results. The final results of the simulations indicate that 8:00 p.m. is a slightly better time for taking measurements. Due to the limited time frame, it was not feasible to restart measurements after obtaining the final results of the simulations.


