Article

1D Finite Element Modeling of Bond-Slip Behavior and Deflection in Reinforced Concrete Flexural Members

1
Department of Structural Engineering, Faculty of Civil Engineering, Damascus University, Damascus P.O. Box 30621, Syria
2
L2MGC, CY Cergy-Paris University, 95031 Neuville-sur-Oise, France
3
Faculty of Engineering, University of Balamand, Tripoli P.O. Box 100, Lebanon
*
Author to whom correspondence should be addressed.
Designs 2025, 9(3), 75; https://doi.org/10.3390/designs9030075
Submission received: 31 May 2025 / Revised: 15 June 2025 / Accepted: 16 June 2025 / Published: 18 June 2025

Abstract

The serviceability limit state (SLS) is a crucial aspect of structural design, ensuring that reinforced concrete structures perform satisfactorily under everyday loading conditions without excessive deflections, vibrations, or cracking that could compromise their functionality or aesthetics. This study investigates the bond-slip relationship in flexural reinforced concrete members. The focus is on the influence of concrete fracture properties on the stress and strain distribution in the cracked zone. A 1D Finite Element Method (FEM) model was developed to better predict the distribution of stress and slip along the length of the reinforcement as well as the deflection. The proposed method uses material models and their interactions to provide a reliable analysis of the nonlinear behavior of RC beams, including crack width and crack spacing. A database built with numerous experimental results available in the bibliographic references allowed for the validation of the model. The results of some phenomenological models were discussed. A comprehensive analysis of the Eurocode 2 (EC2) method for calculating the deflection and cracking control of RC members was also performed. The results indicate a clear enhancement in the precision of deflection prediction in comparison to the perfect bond assumptions outlined in Eurocode 2. Additionally, the research successfully quantifies a 4–17% increase in deflection attributable to bond-slip effects.

1. Introduction

Deflection control in reinforced concrete (RC) beams is a critical serviceability requirement to ensure structural functionality, occupant comfort, and aesthetic integrity under working loads. Excessive deflections can lead to cracking of partitions and finishes and may impair the use of a structure even if safety is not at risk. As a result, design codes impose deflection limits (often as a fraction of span) to safeguard serviceability, and deflection considerations frequently govern the sizing of RC members [1,2]. Indeed, it is widely recognized that the span-to-depth ratio of beams is often limited by deflection rather than by the requirement for ultimate strength [3,4]. Adequate deflection control is essential not only for normal service conditions but also for long-term performance, as time-dependent deflections due to creep and shrinkage can accumulate and cause serviceability problems [5,6]. These considerations underscore the importance of developing reliable deflection prediction methods for RC beams.
In modern structural engineering, the increasing use of high-strength concrete, advanced reinforcement systems, and nonstandard geometries has exposed the limitations of conventional design codes such as Eurocode 2 and ACI 318. These codes often rely on simplified assumptions, including perfect bond and empirical stiffness modifiers, which may not adequately capture the complex interaction between steel and concrete under service loads. In particular, bond-slip behavior becomes critical in long-span members, lightly reinforced sections, and structures subjected to cyclic or time-dependent loading. This study addresses these challenges by developing a physically informed finite element model that explicitly incorporates bond-slip effects, offering improved deflection predictions and crack control strategies for both standard and advanced RC applications.
Despite their widespread use, current code-based deflection predictions, such as those in ACI 318-19 and Eurocode 2, exhibit notable limitations due to their empirical and simplified nature [5,7] Traditional methods like Branson’s effective moment of inertia approach rely on assumptions that overlook complex behaviors such as partial bond-slip and the gradual reduction in tension stiffening. These effects are often generalized through empirical factors, which can lead to inaccuracies, particularly in members with high-strength materials, nonstandard loading or support conditions, and long spans [7,8]. Although ACI 318-19 [9] has adopted a modified inertia expression using Bischoff’s tension stiffening model to enhance accuracy, especially for lightly reinforced members [4], discrepancies between predicted and actual deflections remain significant [5,7]. Furthermore, the lack of consideration for factors like size effects and specific load histories, combined with generalized safety margins, can result in either overly conservative or insufficiently safe designs [1,10] These challenges highlight the need for more advanced and context-sensitive deflection prediction methods.
Accurate deflection prediction in RC beams depends on the proper representation of tension stiffening. This effect enhances post-cracking stiffness and can significantly reduce service load deflections [11]. However, tension stiffening degrades with increased cracking and bond deterioration under sustained or cyclic loading [8,12]. Current provisions address tension stiffening indirectly, e.g., through the effective moment of inertia or stiffness reduction factors, which often fail to reflect its variability [6]. Over-simplification or neglect of this mechanism can lead to deflection and overestimation, particularly in lightly reinforced or fiber-reinforced members [8,13]. Additionally, size effects significantly influence deflection behavior; as beam dimensions increase, differences in crack behavior and reduced nominal tensile strength due to statistical effects become more pronounced [5,7,10]. These variations often result in earlier cracking and larger deflections than predicted by models calibrated on smaller specimens [6]. Moreover, long-term behaviors such as creep and shrinkage exhibit depth-dependent variations that are amplified in larger members [12]. Collectively, these findings emphasize the limitations of simplified code approaches and the need for more advanced, physically informed deflection models.
The bond between steel reinforcement and concrete is crucial to deflection in reinforced concrete (RC) beams. This mechanism governs how effectively cracks transfer tensile forces and affect stiffness. Under loading, micro-slips at the steel-concrete interface cause cracks to widen. Increased slip weakens the tension in the concrete between cracks, reducing stiffness and causing greater deflections, particularly under higher or cyclic loading conditions [2,12]. Conventional models assume perfect compatibility up to cracking, which oversimplifies the behavior [2,7]. In reality, partial interaction causes the reinforcement to elongate independently of the concrete, lowering the effective flexural stiffness. Current design codes do not explicitly account for deformations arising from crack widening due to bond-slip [2]. To improve deflection prediction, researchers have proposed partial-interaction models that incorporate bond–slip relationships, thereby allowing for differential strains and capturing the progressive stiffness degradation as cracks evolve [12]. Such models better reflect the time-dependent nature of tension stiffening loss. Recent investigations have shown that bond-slip is a main cause of increased deflections over time, emphasizing the need for its inclusion in realistic deflection analyses [5]. Unlike comparative studies on bond-slip models, this work focuses on developing a 1D FE model that integrates bond-slip mechanics (Fib-MC2010) and validates its accuracy against experimental data.
Researchers have developed advanced analytical and numerical approaches for improved prediction accuracy in reinforced concrete beams, including the inclusion of tension stiffening and an effective tensile concrete area for stiffness computations [11,14]. These models are often calibrated using empirical data or inverse analysis of experimental results to more accurately represent the transfer of post-cracking tension from steel to concrete. Genetic algorithms are also used to enhance the effective moment of inertia formulas by fitting them to extensive datasets, improving their sensitivity to key variables [1,14].
Nonlinear finite element analysis (FEA) is now a powerful tool for deflection prediction. These simulations can capture complex behaviors such as material nonlinearity, crack propagation, tension softening, and bond–slip interaction between steel and concrete. FEA incorporating bond elements and concrete damage models has shown strong agreement with experimental load–deflection responses, often predicting deflections within 5–15% of measured values [2,12]. Discrete cracking and embedded tension stiffening laws are proving effective. However, the computational demands and need for material parameter calibration are spurring efforts to develop reliable alternatives to full-scale simulations. Machine learning (ML) is a powerful tool for predicting deflection in reinforced concrete (RC) beams. ML algorithms can estimate deflections with high accuracy. Early studies have shown that ML approaches can predict midspan deflections across various reinforcement configurations [15]. Furthermore, ML has been effectively applied to forecast long-term deflections—including creep-related effects—by leveraging early-age data and material properties, offering a faster and reasonably accurate alternative to traditional iterative calculations [16]. These emerging ML techniques, along with advanced analytical models and high-fidelity simulations, aim to overcome the limitations of conventional methods. By accounting for complex factors, these tools provide more reliable and efficient deflection predictions. Their integration into engineering practice promises improved structural safety and more economical designs, mitigating the risks associated with overly conservative or inadequate estimations.

2. Material Models

The choice of Eurocode 2 (EC2) material models for concrete and steel was guided by their widespread use in structural design and their compatibility with nonlinear fracture-based modeling. EC2 provides well-established stress–strain relationships that are suitable for short-term loading conditions and can be extended to incorporate post-cracking behavior. Although EC2 does not explicitly model bond-slip, its formulations serve as a robust base for coupling with bond-slip laws such as those defined in the fib Model Code 2010. This integration allows the model to capture the degradation of stiffness due to interfacial slip while maintaining consistency with design standards.
For a nonlinear analysis, EC2 [17] proposes the following stress-strain relationship under a short-term compressive load (Figure 1a).
σ c f c m = k η η 2 1 + k 2 η
where η = ε c ε c 1 , k = 1.05 E c ε c 1 f c m and ε c 1 = 0.7 f c m 0.31 < 2.8 × 10 3 . The failure strain εcu1 can be taken equal to 3.5 × 10⁻³.
While tensile strength is generally neglected in structural design per EC2 [17], its inclusion is critical for accurately predicting the behavior of reinforced concrete members [18]. Experimental results demonstrate that, under controlled displacement, concrete exhibits linear behavior up to the tensile strength limit, followed by a progressive softening response [3]. This reduction in tensile resistance is associated with crack initiation and propagation. Beyond a critical crack opening, the tensile resistance effectively reduces to zero [19]. The behavior of concrete in direct tension can be described by the model proposed by Wang and Hsu [20]. This model is expressed by Equation (2) and is shown in Figure 1b.
σ t = E c ε t ε t ε c r σ t = f c t m ε c r ε 0.4 ε t > ε c r
with ε c r = f c t m E c the cracking strain.
The adopted model (Equation (2)) incorporates tension stiffening via a power-law softening branch, essential for simulating post-cracking stress redistribution. This approach is validated against direct tensile tests and avoids the unrealistic assumption of zero tensile strength post-cracking in EC2.
For steel reinforcement, the bilinear stress–strain relationship defined in EC2 [17] is adopted (Figure 1c). The initial linear segment extends up to the yield stress fy, followed by a plastic plateau or a hardening branch extending to the ultimate strain εuk, with a maximum stress value f y k = 1.25 f y . The bilinear stress-strain curve balances simplicity and accuracy, with a defined yield plateau and hardening branch. This is sufficient for serviceability analysis.

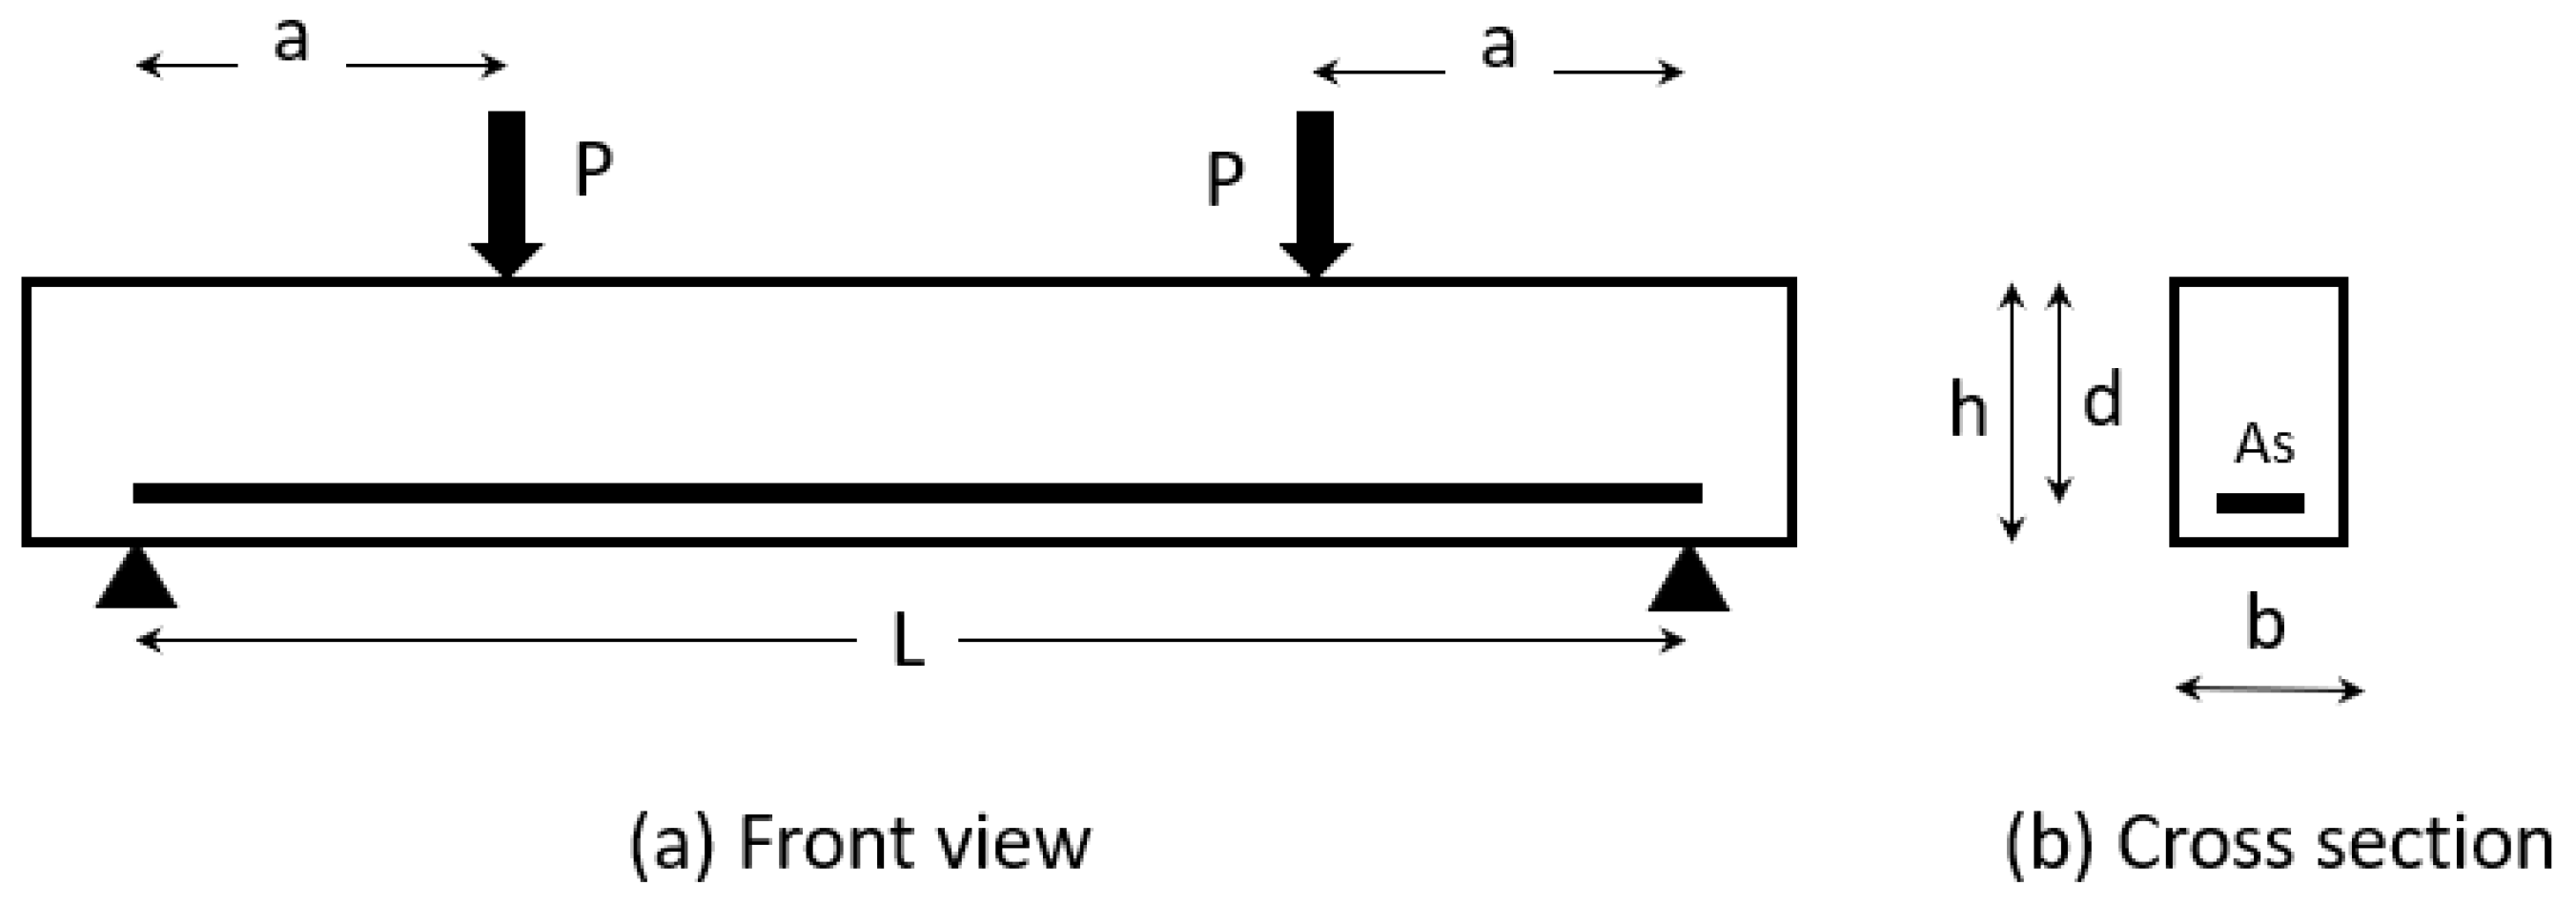
3. Database for Validation of Proposed Models

This study compiles a curated database of reinforced concrete beams tested under four-point bending (Figure 2), focusing exclusively on conventional concrete to ensure consistency. This dataset serves as a valuable resource for validating numerical models. By focusing on conventional concrete, this work ensures broad applicability while minimizing variability from advanced material compositions (e.g., recycled aggregate, fiber-reinforced or high-performance).
The selection criteria required each study to report complete material properties and steel reinforcement yield strength. Four-point bending was chosen for its ability to produce a pure flexural region between loading points. The database includes key geometric and mechanical parameters to support reliable comparisons. All data is presented in Appendix A. The results retained from each paper are the load-deflection curve, with particular attention to the yielding load and the corresponding displacement.

4. Deflection of Reinforced Concrete Beams

A reinforced concrete beam subjected to monotonic bending undergoes three distinct phases of behavior. Initially, both concrete and steel respond elastically, with linear stress–strain relationships in both tension and compression. During this uncracked elastic phase, the neutral axis is located at the centroid of the uncracked cross-section. As loading increases, flexural cracks initiate in the tension zone near the region of maximum moment when the tensile stress exceeds the tensile strength of concrete. Following crack initiation, these cracks propagate upward toward the neutral axis, which gradually shifts upward due to the loss of tensile stiffness in the cracked concrete. This phase concludes when the tensile reinforcement yields. In the final stage, the failure phase yielding of the steel reinforcement leads to increased crack widths and significant deflection. Continued loading results in the crushing of the concrete in the compression zone, ultimately leading to structural failure [21].
The Serviceability Limit State (SLS) defines the condition under which a structure remains functional, comfortable, and durable under service (working) loads, even if structural collapse is not imminent. One of the primary SLS criteria is deflection control, as excessive deflections can damage non-structural components, exacerbate crack widths, and permit the ingress of moisture and aggressive agents, accelerating the corrosion of embedded reinforcement.

4.1. Short-Term Deflection Calculation According to EC2 [17]

The method adopted by Eurocode 2 (EC2) for calculating short-term deflection is based on evaluating the curvature of the cross-section under a specified bending moment (Figure 3). The deflection is determined by integrating the effective curvature ( 1 r e f f ) along the length of the member, considering both cracked and uncracked sections [17,21]. This curvature can be expressed by the following equation:
1 r e f f = ξ 1 r c r + 1 ξ 1 r u c
Here, ξ is a distribution ξ = 1 β M c r M 2 and β is a stand taken equal to 1.0 for short-term loads.
Figure 3. Stress and strain diagrams in the cracked phase before steel yielding.
Designs 09 00075 g003
For a given moment, the curvature of the uncracked section based on linear elastic theory is given by
1 r u c = M E c m I u c
where Iuc is the second moment of area of the uncracked section, and Ecm is the modulus of elasticity of concrete.
Similarly, the cracked curvature is expressed as
1 r c r = M E c m I c r
with Icr the second moment of area of the cracked transformed section.
The moment of inertia for uncracked and cracked sections can be expressed by Equation (6).
I u n = b h 3 12 + b h 0.5 h x u n 2 + n α A s h x u n d 0 2 I c r = b x 3 3 + n α A s d x 2
A key challenge in determining Icr lies in evaluating the depth of the neutral axis, x. Figure 3c assumes a linear strain distribution based on Bernoulli’s hypothesis, implying that cross-sections remain plane after deformation. Under service load conditions, the stress distribution in both concrete and steel can also be considered linear (Figure 3d). Assuming a perfect bond between the steel and concrete and neglecting the tensile strength of the concrete, the force equilibrium between the compressive zone of concrete and the tensile force in the steel reinforcement yields the following expression for the neutral axis depth:
x = n α A s + n α 2 A s 2 + 2 b n α A s d b
These assumptions are valid for under-reinforced sections, where the steel yields in tension prior to the failure of concrete in compression. According to classical beam theory, the midspan deflection under four-point bending (as illustrated in Figure 2) can be calculated using the following equation:
Δ c r = M 24 E c I e f f 3 L 2 4 a 2 = 1 24 r e f f 3 L 2 4 a 2

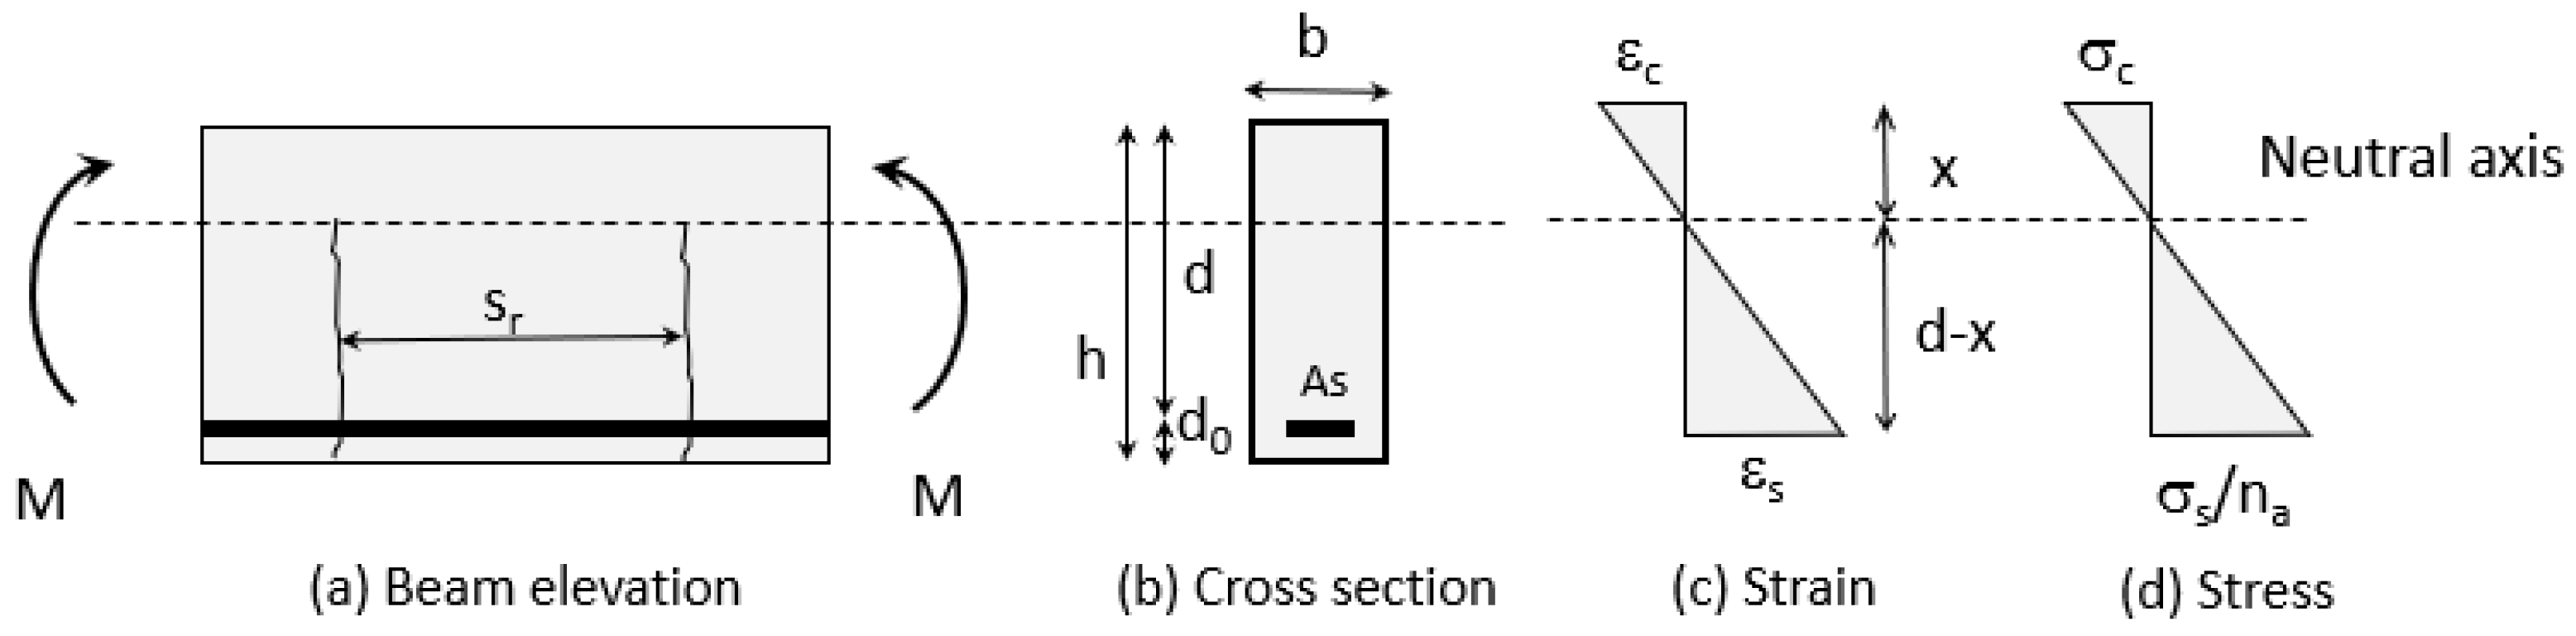
4.2. Fracture Mechanics-Based Sectional Model

A sectional fracture mechanics-based mechanical model for RC beams is necessary because traditional approaches proposed in design codes are based on empirical assumptions and idealized material behavior [17,21]. Simplified assumptions ignore real material behavior, in particular post-crack resistance in tension, where it is assumed that concrete loses all tensile strength after cracking. Moreover, the assumption of no slip between rebar and concrete overestimates the stiffness of RC members and underestimates the deflection [18].
The first version of the model used in the present work was proposed by Mohamad et al. [18] and was then slightly modified by Bakleh et al. [22], but both versions assumed perfect steel-concrete bonds. The model assumes that plane sections remain plane (Bernoulli’s hypothesis). This means that strains vary linearly over the depth of the section (Figure 4). As a function of the curvature, κ, and the mean normal strain, ε0, at the beam axis, the deformation of each fiber in the cross-section can be defined. The strain in the strip positioned at y distances from the center of the beam can be calculated using Equation (9).
ε ( y ) = ε 0 + h 2 y κ
The beam’s cross-section is made up of a reinforcement bar and layered strips of concrete. Each strip can only be elongated, so the task is to create a correlation between forces and strains in both compression and tension (Figure 4b). Equation (1) is used to calculate the compressive stress in the compression zone while Equation (2) is used to calculate the stress in the tension zone (Figure 4d). The stress of the reinforcement strip is determined by means of the EC2 relationship represented in Figure 1c.
The equilibrium equations for the internal and external forces are mathematically nonlinear due to the nonlinear behavior of the assumed material and therefore an analytical model is required to solve the system expressed by Equation (10). Solving these nonlinear equations consists of finding the values of curvature, κ, and mean strain, ε0, that satisfy the equilibrium of the section. The equilibrium equations are solved using the Newton–Raphson method with two variables. The cross-section is divided into n + 1 strips, defining n layers, to eliminate the integral of Equation (10). The force of each layer is computed by multiplying the average stress by the layer’s area which allows sums to be used in place of the integral.
N i n t e r n a l = h / 2 + h / 2 σ . d A = b . h i = 1 n σ i + A s . σ s = 0                           M i n t e r n a l = h / 2 + h / 2 y . σ . d A = b . h i = 1 n y i . σ i + A s . σ s . h 2 d 0 = M e x t e r n a l  
Once the curvature has been determined, the height of the compression zone can be given by the expression x = ε c κ .
The crack spacing, sr, can be expressed by the following equation proposed by EC2 [17].
s r = k 3 c + k 1 k 2 k 3 ϕ ρ p , e f f
with ρ p , e f f = A s A c , e f f and A c , e f f = b × min ( 2.5 h d ; h 2 ; h x 3 ) . For ribbed bars under bending (k2 = 1.0), EC2 suggests that s r , m a x = 3.4 c + 0.425 ϕ ρ p , e f f which represents the maximum expected crack spacing.
The final crack width (wk) is calculated as
w k = s r , m a x ε s m ε c m
where ε s m ε c m is the difference in mean strains between steel and concrete.

4.3. Stress and Strain Distribution Between Two Cracks

Figure 5a shows the distribution of forces at two adjacent cracks that are subjected to a constant bending moment. Moving towards the center of the block, the stress in the steel decreases while the tensile stress in concrete increases due to bond mechanisms [23]. The bond-slip relationship describes how shear stress, τb, develops at the steel-concrete interface due to relative displacement called slip, s (Figure 5b).
The stress–slip relationship used in this work is the Fib-MC2010 [24] relationship, which is described by Equation (13).
τ b = τ b , m a x s s 1 α 0 < s s 1 τ b , m a x ( τ b , m a x τ b f ) s s 1 s 2 s 1 s 1 < s s 2 τ b , m a x = τ b f s > s 2
For ribbed bar and when the bond conditions are qualified as good τ b , m a x = 2.5 f c m and τ b m = 0.4 τ b , m a x . The slip s1 is taken equal to 1.0 mm while s2 is taken equal to 2.0 mm. Finally, the power α equals to 0.4.
Figure 5c,d show the reinforcement and concrete interfaces for an infinitesimal element of length Δx. The equilibrium equations read:
Δ N s x = π ϕ τ b x Δ x Δ N c x = π ϕ τ b x Δ x d σ s x d x = 4 ϕ τ b x d σ c x d x = π ϕ A c , e f f τ b x
The slip at the interface between the reinforcement and the concrete is defined by
s x = u s x u c , t x
where us(x) and uc,t(x) are the displacements along the x-axis of the reinforcement and concrete, respectively. The derivative of Equation (15) gives the variation of slip with x:
d s x d x = ε s x ε c , t x
Beyond the Fib-MC2010 bond-slip model adopted here, alternative approaches exist to simulate steel-concrete interaction, including discrete interface layers (e.g., cohesive zone models) for localized slip, spring elements to represent interfacial shear transfer, and damage-plasticity models for micro-mechanical behavior. However, these methods typically require 2D/3D finite element frameworks, which are computationally intensive and incompatible with the 1D Euler-Bernoulli beam theory.

4.4. 1D Finite Element Modeling of the Stress Distribution Between Two Cracks

This paragraph presents a one-dimensional finite element (FE) model for analyzing the distribution of slip and curvature in reinforced concrete (RC) beams under bending, with two flexural cracks. The proposed model adopts the Fib-MC2010 bond-slip relationship (Equation (13)) due to its empirical validation and widespread use in RC analysis. While other bond-slip models exist (e.g., interface layers, spring elements), this study prioritizes computational efficiency and compatibility with 1D Euler-Bernoulli beam theory. The model accounts for the nonlinear interaction between concrete and steel reinforcement through the bond-slip relationship given in Equation (13). The strong form of equilibrium Equation (14) is discretized using linear shape functions, which leads to a nonlinear stiffness matrix that incorporates contributions from concrete ( K C = A c t E C ( ε ) B C T B C d x ), steel ( K S = A S E S ε B S T B S d x ), and bond ( K b o n d = N T d τ b d x N d x ). These matrices are superimposed into the global stiffness matrix K g l o b a l = K C + K S + K b o n d , which is updated iteratively within a Newton–Raphson scheme to resolve geometric and material nonlinearities, ensuring equilibrium between internal forces and external loads at each load step. This approach enables accurate prediction of slip, curvature, and stress redistribution in the cracked RC beam under progressive loading.
The equilibrium equations are solved using an incremental-iterative Newton–Raphson scheme, which is a type of nonlinear finite element analysis. The load is applied incrementally, with each step initiating an iteration loop to minimize the residual force vector R = F e x t F i n t , where Fext is the external load and Fint is the internal force vector derived from stresses in concrete, steel, and bond-slip.
At each iteration, the tangent stiffness matrix Kglobal is computed to solve for the displacement correction Δ U = K g l o b a l 1 × R . The displacements are updated as U k + 1 = U k + Δ U , with a relaxation factor (e.g., 0.8) to enhance convergence. The convergence is checked against a tolerance R 10 6 ; if unmet after a maximum number of iterations, the step size is reduced. This robust algorithm accurately models the progressive slip, curvature development and load redistribution in the RC beam, thereby ensuring equilibrium is always achieved. Finally, the curvature is calculated using the expression κ i = ε s i d x i . The detailed algorithm is given in Appendix C.
The primary objective of our study was not to compare multiple commercial or academic software packages, but rather to develop and validate a dedicated 1D finite element model that explicitly incorporates bond-slip behavior. The model was implemented in a custom numerical environment to allow full control over the constitutive laws and numerical schemes. The proposed model is more accurate than Manfredi’s initial model [25], which omits the contribution of concrete to traction in the equilibrium equations. Many researchers later adopted the aforementioned model, as did Oliveira et al. [26] and more recently Jakubovskis et al. [27]. Oliveira et al. [26] assumed that the cross-section cracked at nodes, and that, between two cracked nodes, the behavior of concrete in tension is linear up to the tensile strength, after which it remains constant along the tensile zone. The second limitation of their work is that they proposed a linear slip between cracks, which may impact the results. The approach of Jakubovskis et al. [27] omitted the post-cracking behavior of concrete and also simplified the tensile behavior in non-cracked sections between two cracked nodes, assuming a linear stress varied linearly from the neutral axis towards the extremely tensile fiber.
In terms of finite element modeling, previous approaches have involved setting an initial slip value at the level of the first crack. An inner loop then propagates stresses and strains along the length of the beam using fixed spatial increments, while considering the bond stress at each point. The inner loop terminates when the error, defined as the difference between the target steel stress and the computed stress at the final node, falls below the tolerance threshold. If the inner loop does not converge, the initial slip of the outer loop is modified and the process is repeated until convergence is reached. The computational efficiency of this bond-slip analysis method depends on several factors, such as nested iterative loops, fixed spatial discretization and convergence criteria. The outer bisection loop adjusts the initial slip value and requires multiple iterations to converge. Each iteration involves an inner loop that moves along the length of the beam to calculate stresses and strains at specific points. The algorithm proposed in this work is the most efficient in terms of computational cost while correctly accounting for nonlinear slip and post-cracking behaviors, which have been simplified in other approaches [25,26,27].

4.5. 1D Finite Element Matrix System for RC Beam

The finite element formulation for the Euler-Bernoulli beam problem is derived from the principle of virtual work, which enforces equilibrium by balancing work [28,29]. The weak form of the governing equation is expressed as
0 L E I ( κ ) d 2 w dx 2 d 2 δ w dx 2 d x = 0 K q x δ w d x + B o u n d a r y   t e r m s
where w ( x ) is the transverse displacement, E I κ is the flexural rigidity, q x is the distributed load, and δ w is a kinematically admissible virtual displacement. The displacement field w x is approximated using cubic Hermitian shape functions N(x) in order to discretize this equation. This yields w x N x u e , where u e = w 1 , θ 1 , w 2 , θ 2 T contains nodal displacements and rotations. The curvature κ ( x ) , defined as the second derivative of displacement, is derived from the curvature-displacement matrix B x = d 2 N dx 2 , resulting in κ x = B ( x ) u e .
Cracking and bond-slip cause an increase in localized curvature, modifying the moment-curvature relationship (M-κ). To capture the effect of cracking on the curvature, the secant stiffness EI(κ) is evaluated at each integration point as
E I k = M κ c r a c k e d   r e g i m e I u n u n c r a c k e d   r e g i m e
The stiffness matrix and internal forces are evaluated using Lobatto quadrature, which includes endpoint evaluations to better capture localized cracking effects near supports or high-moment regions:
K e = i = 1 n g p w i E I x i B T x i B x i J F e , i n t = i = 1 n g p w i B T x i M J
Here, EI(xi) and M are updated at each integration point based on the current curvature, κ(xi), ensuring that the model reflects progressive stiffness degradation due to cracking. As cracks propagate under increasing loads, the global stiffness matrix evolves. This requires the iterative solution technique described in the previous paragraph.

5. Results

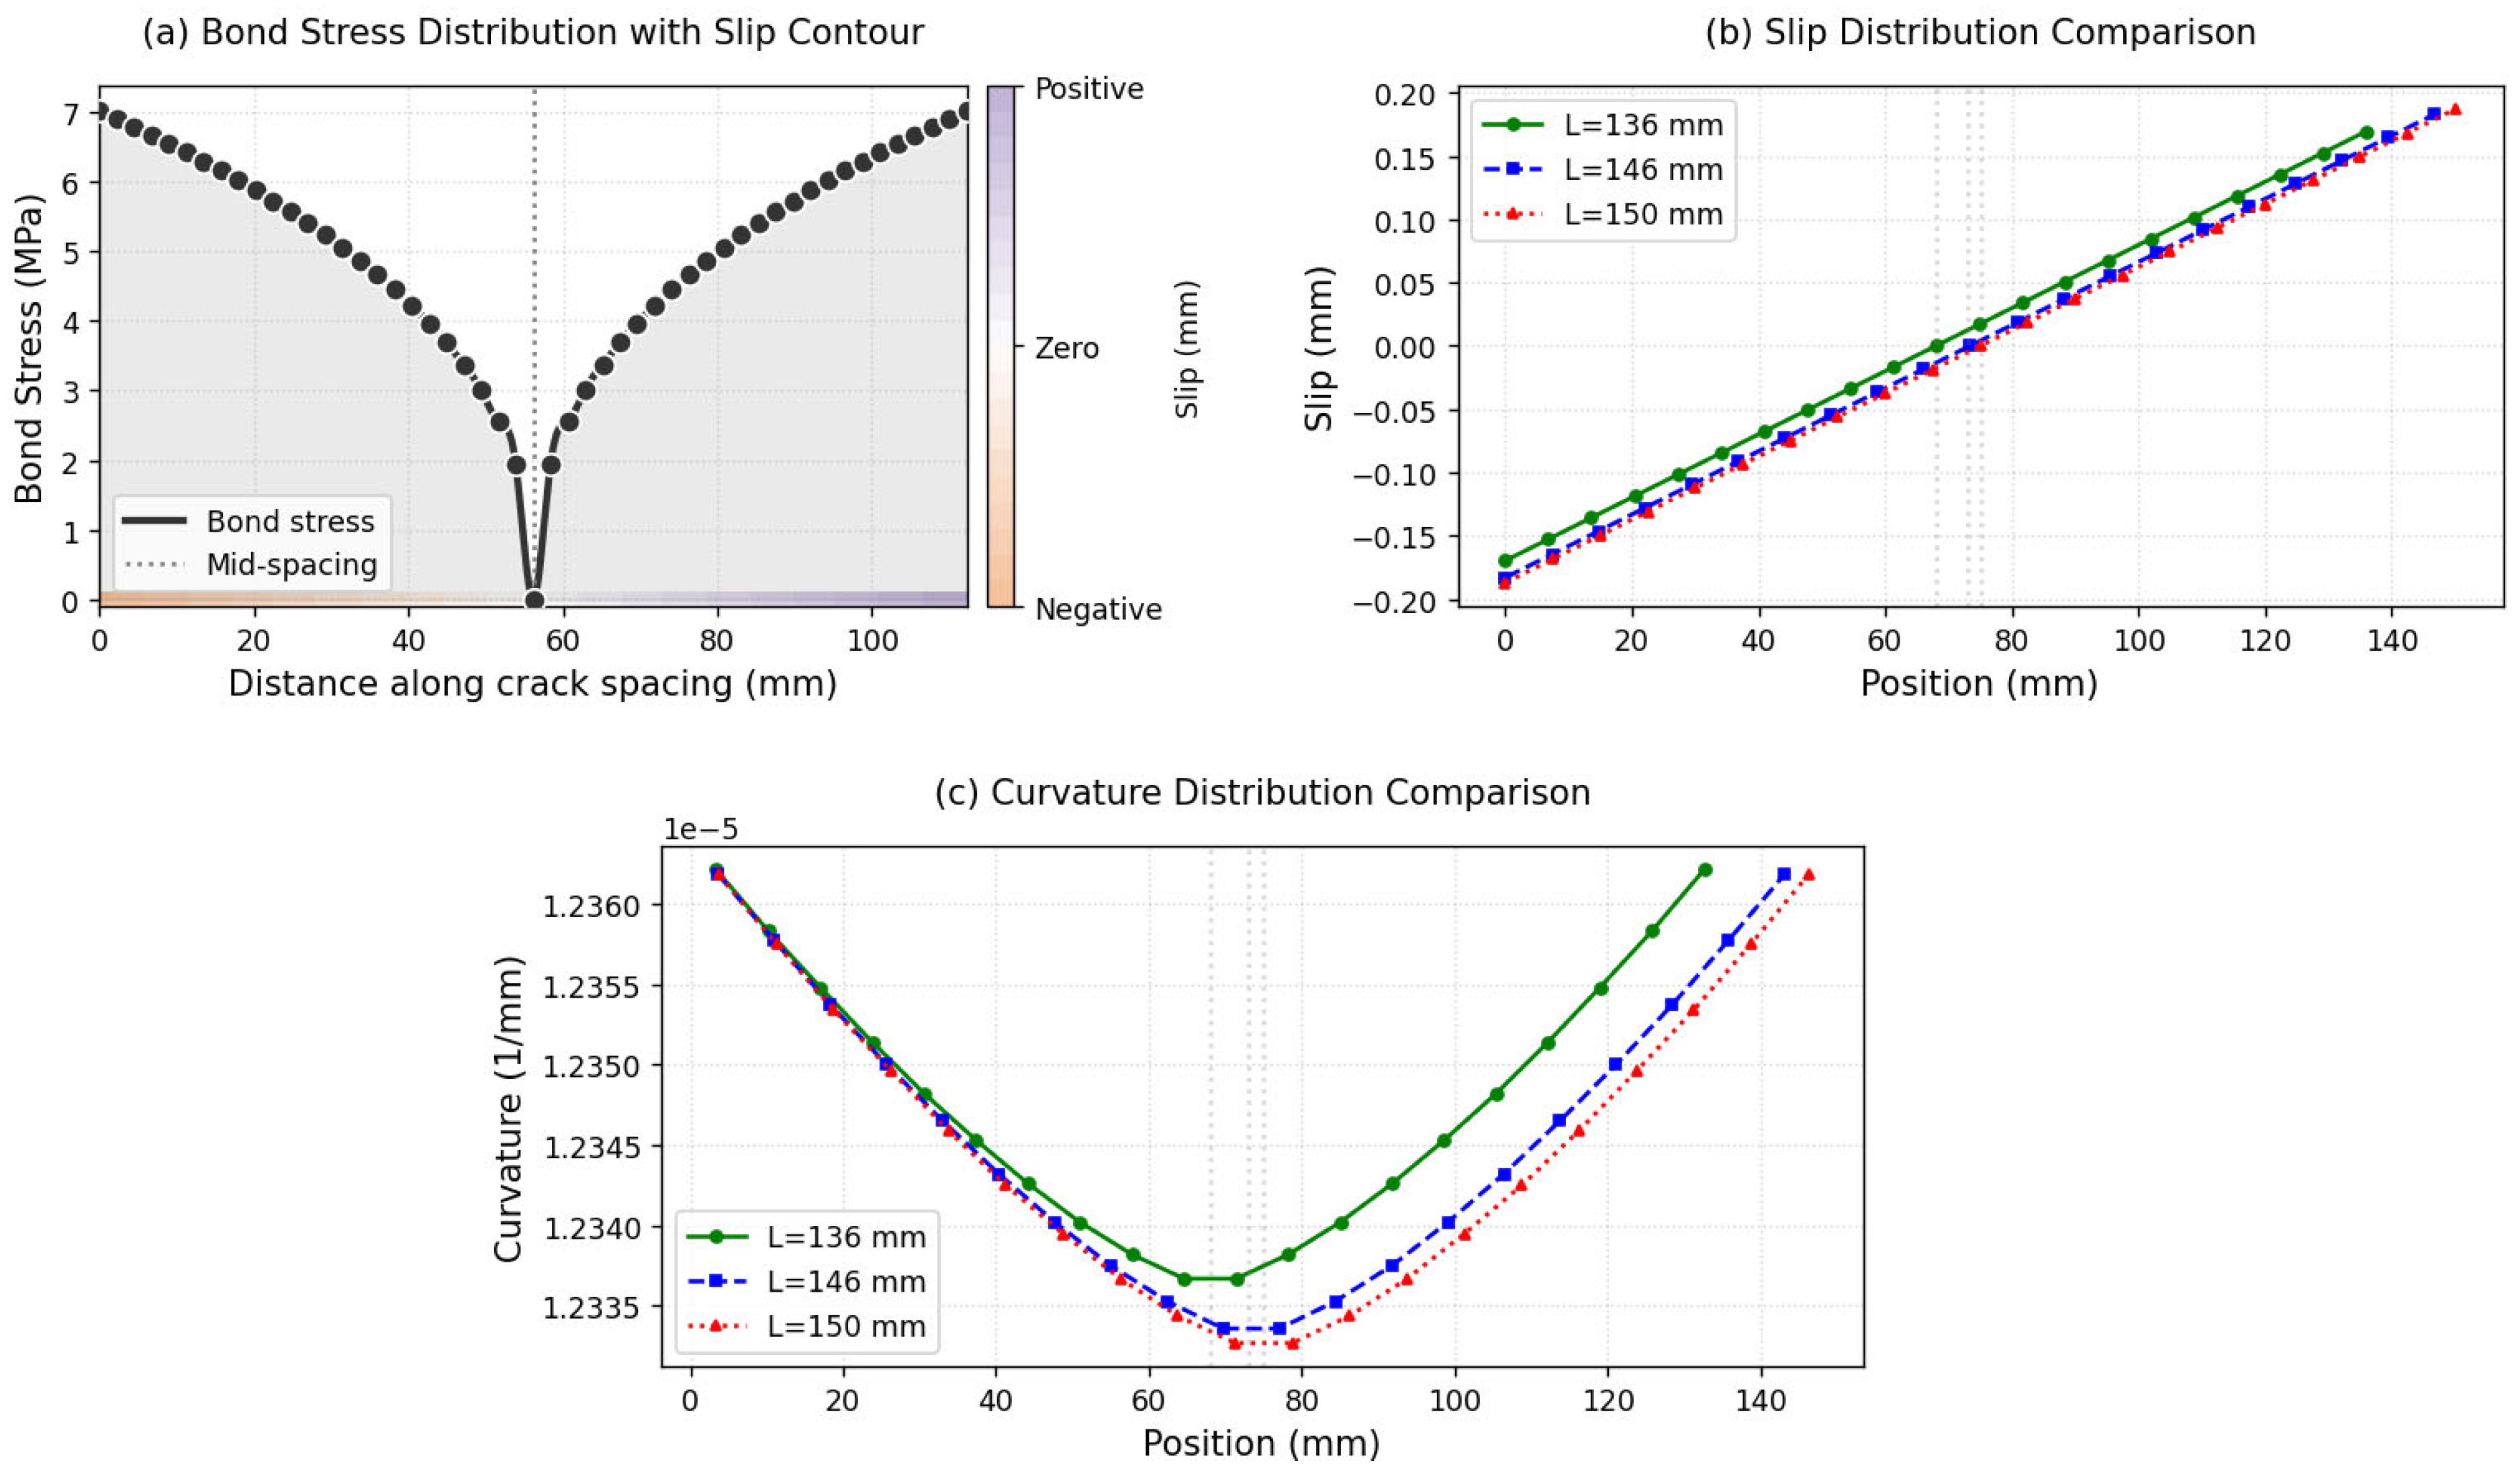
5.1. Bond Stress Distribution Between Two Flexural Cracks

The beam selected for validating the models developed in this study is the H50-0 beam, which was tested by Seara-Paz et al. [30]. The geometry of the beam and the properties of the materials used are summarized in Table A1.
Analysis of the crack map shows that the average spacing between the primary cracks is 136 mm, which is close to half the height of the section, h 2 = 150   m m , and the cracking spacing value calculated using Equation (11), s r = 146   m m .
Figure 6a shows bond stress peaking at 7.03 MPa at crack ends (±0.102 mm slip) and dropping to zero at midspan. The parabolic stress–slip relationship demonstrates load transfer between concrete and steel, critical for crack control and anchorage design. The symmetrical parabolic curve reflects load transfer mechanics, with higher stress where deformation is resisted most. Figure 6b shows that slip follows a near-linear variation along the crack spacing, transitioning from negative to positive values with zero-crossing at mid-spacing, indicating a balanced bond stress distribution between steel and concrete. Although the slip value increases with larger spacing, this symmetry suggests that there is uniform interfacial shear transfer, with the magnitude of the slip scaling proportionally with the distance between two cracks. Figure 6c demonstrates remarkably stable curvature values (~1.23 × 10⁻⁵ mm−1) despite varying slip conditions, confirming that global flexural stiffness dominates local bond-slip effects. The findings show that the beam’s composite action is robust so the spacing of the cracks will be determined by Equation (11).
Figure 7a shows a comparison of the experimental load-deflection curve and the results of the finite element (FE) model, with perfect bond and bond-slip effects assumed. The experimental curve shows typical nonlinear behavior, progressing from elastic response through cracking and yielding. The FE perfect bond model overestimates stiffness and load capacity, particularly post-cracking, resulting in lower deflections than observed experimentally. The FE bond-slip model, accounting for relative movement between reinforcement and concrete, better captures the experimental response. Figure 7b compares the deflections of experimental, FE, and analytical models at the yielding moment, revealing key insights into bond-slip behavior. The experimental deflection (20.83 mm) exceeds all predictions, suggesting complexities like material variability or imperfect boundary conditions.

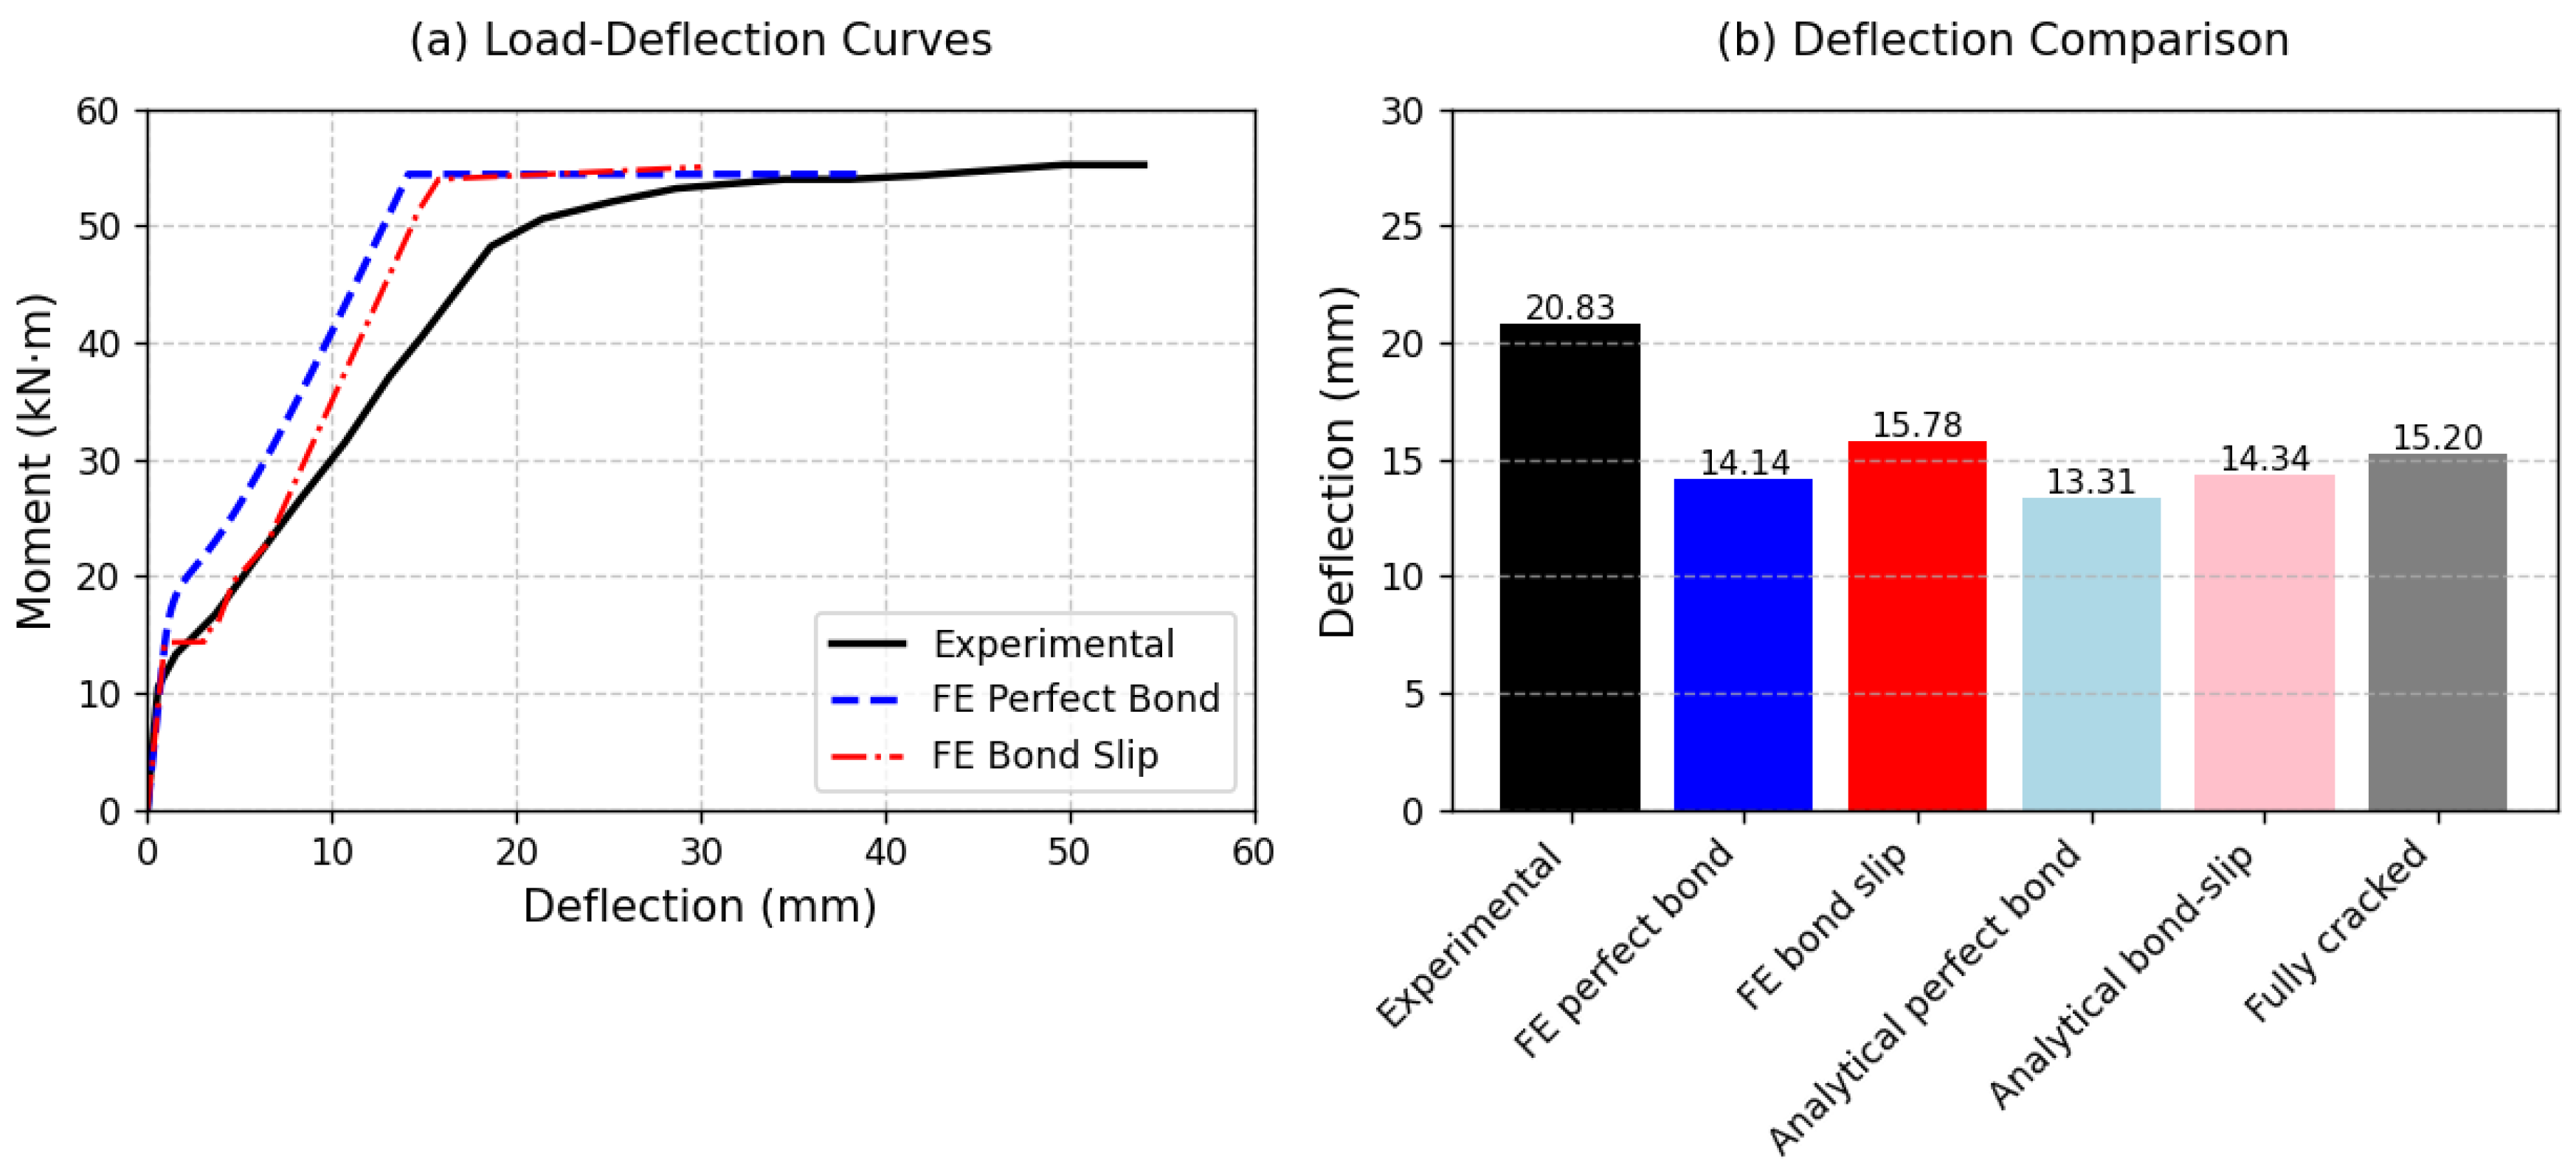
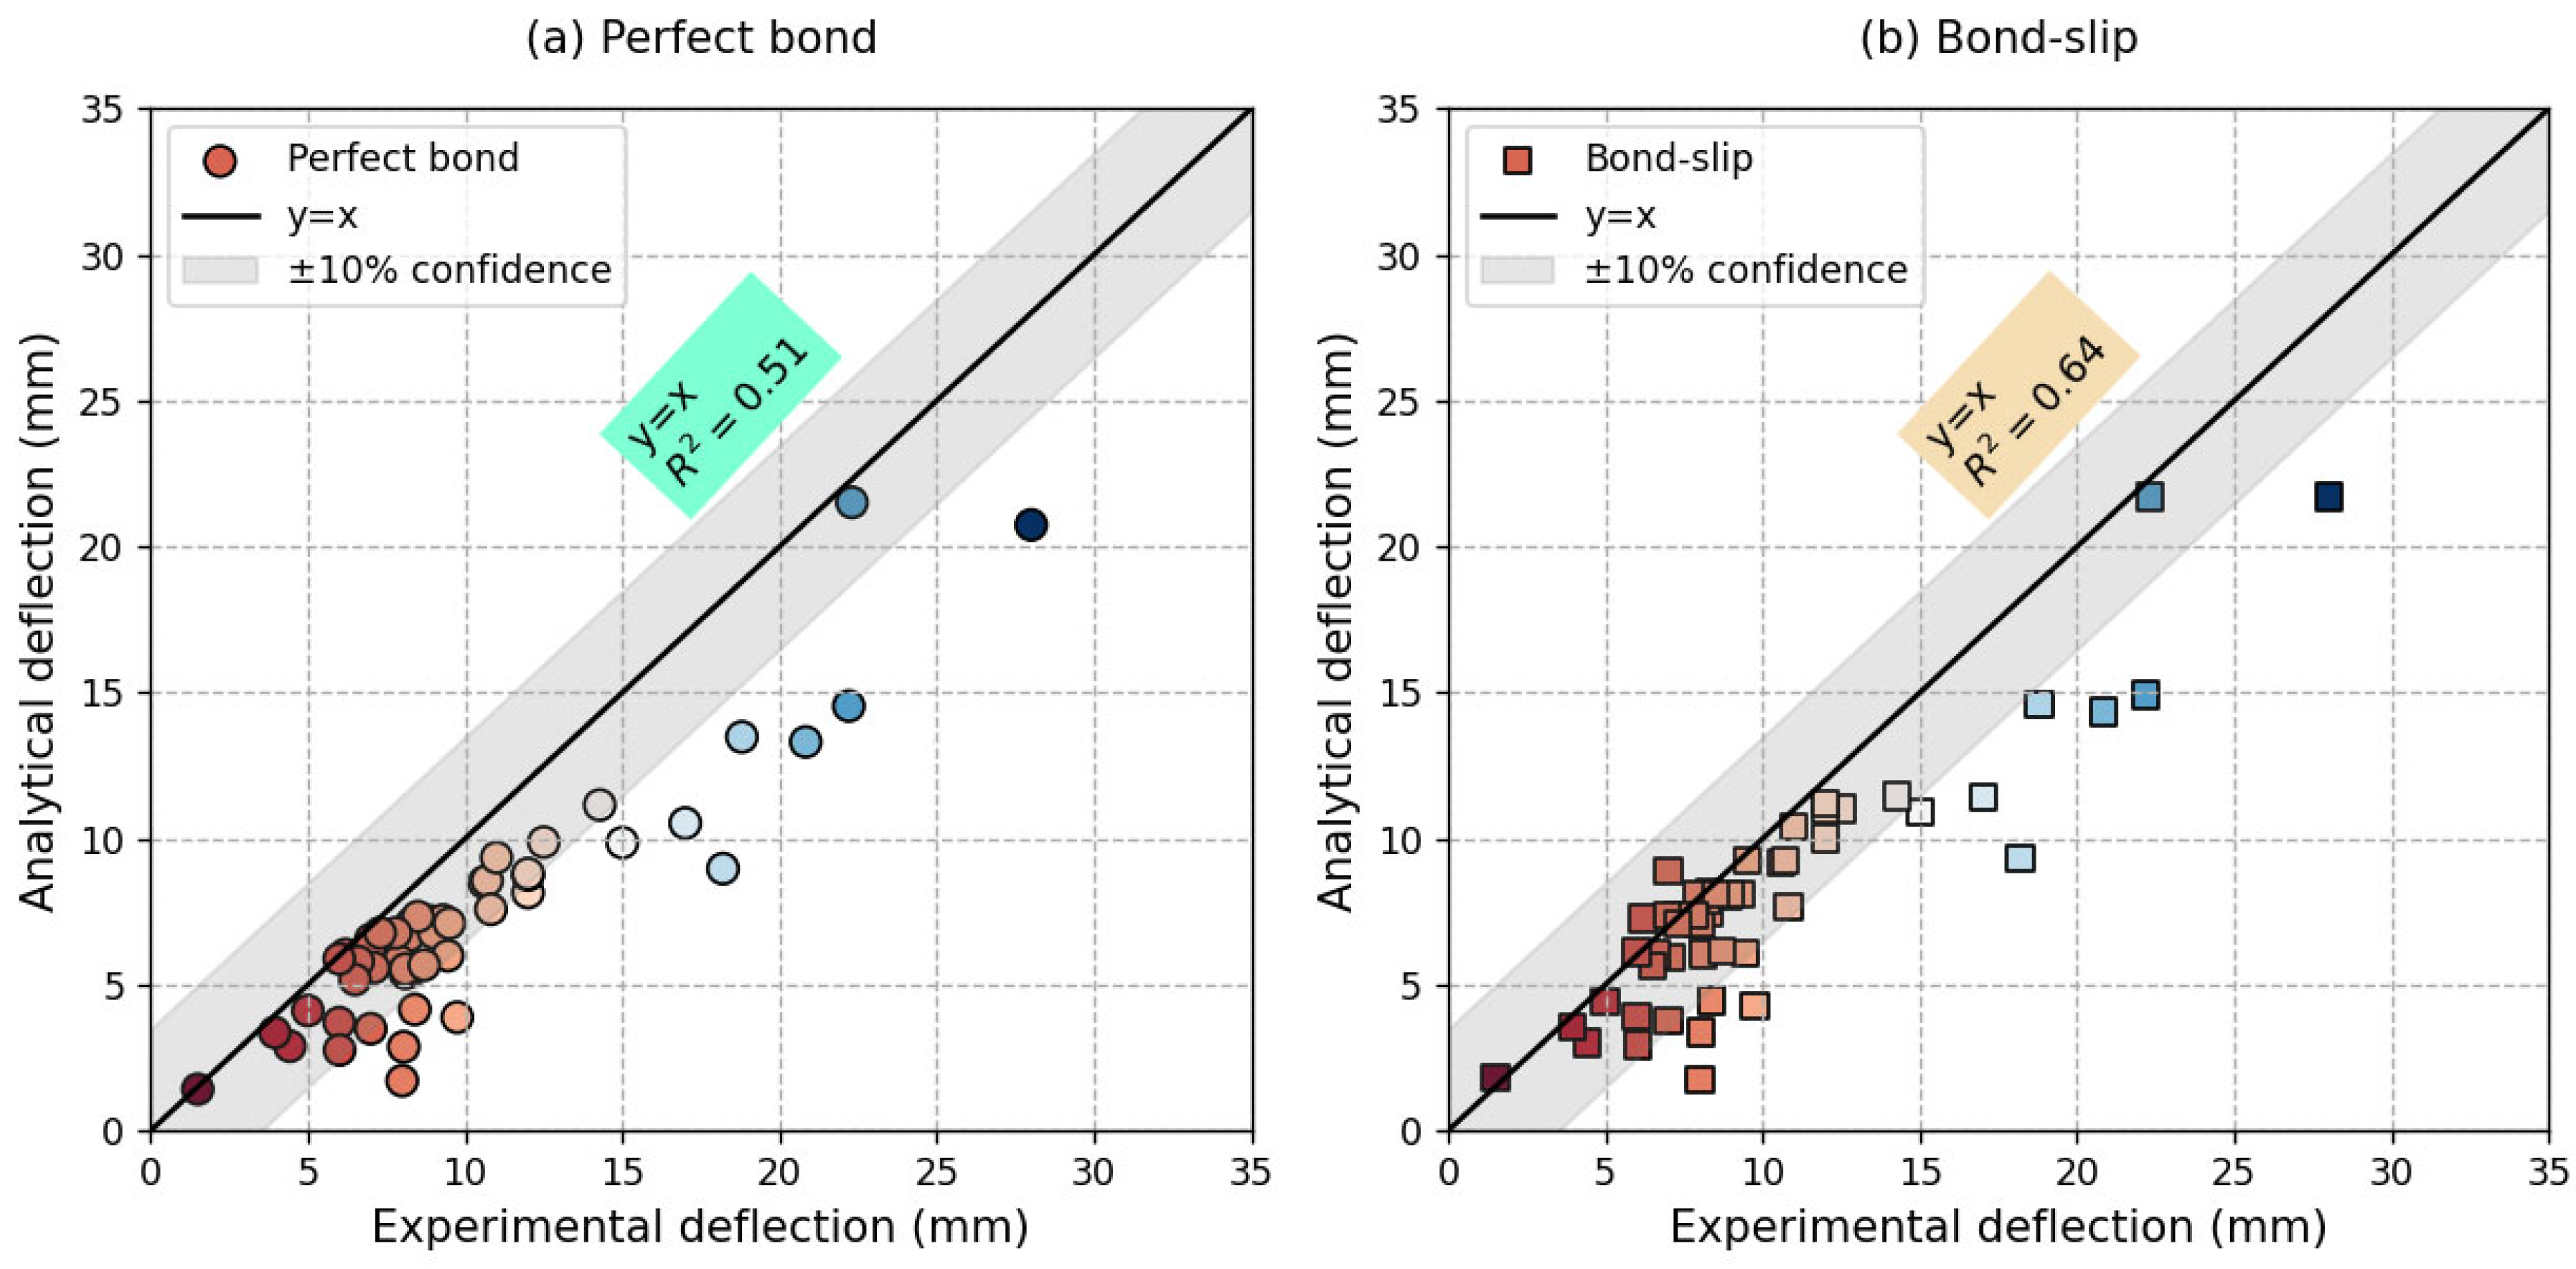
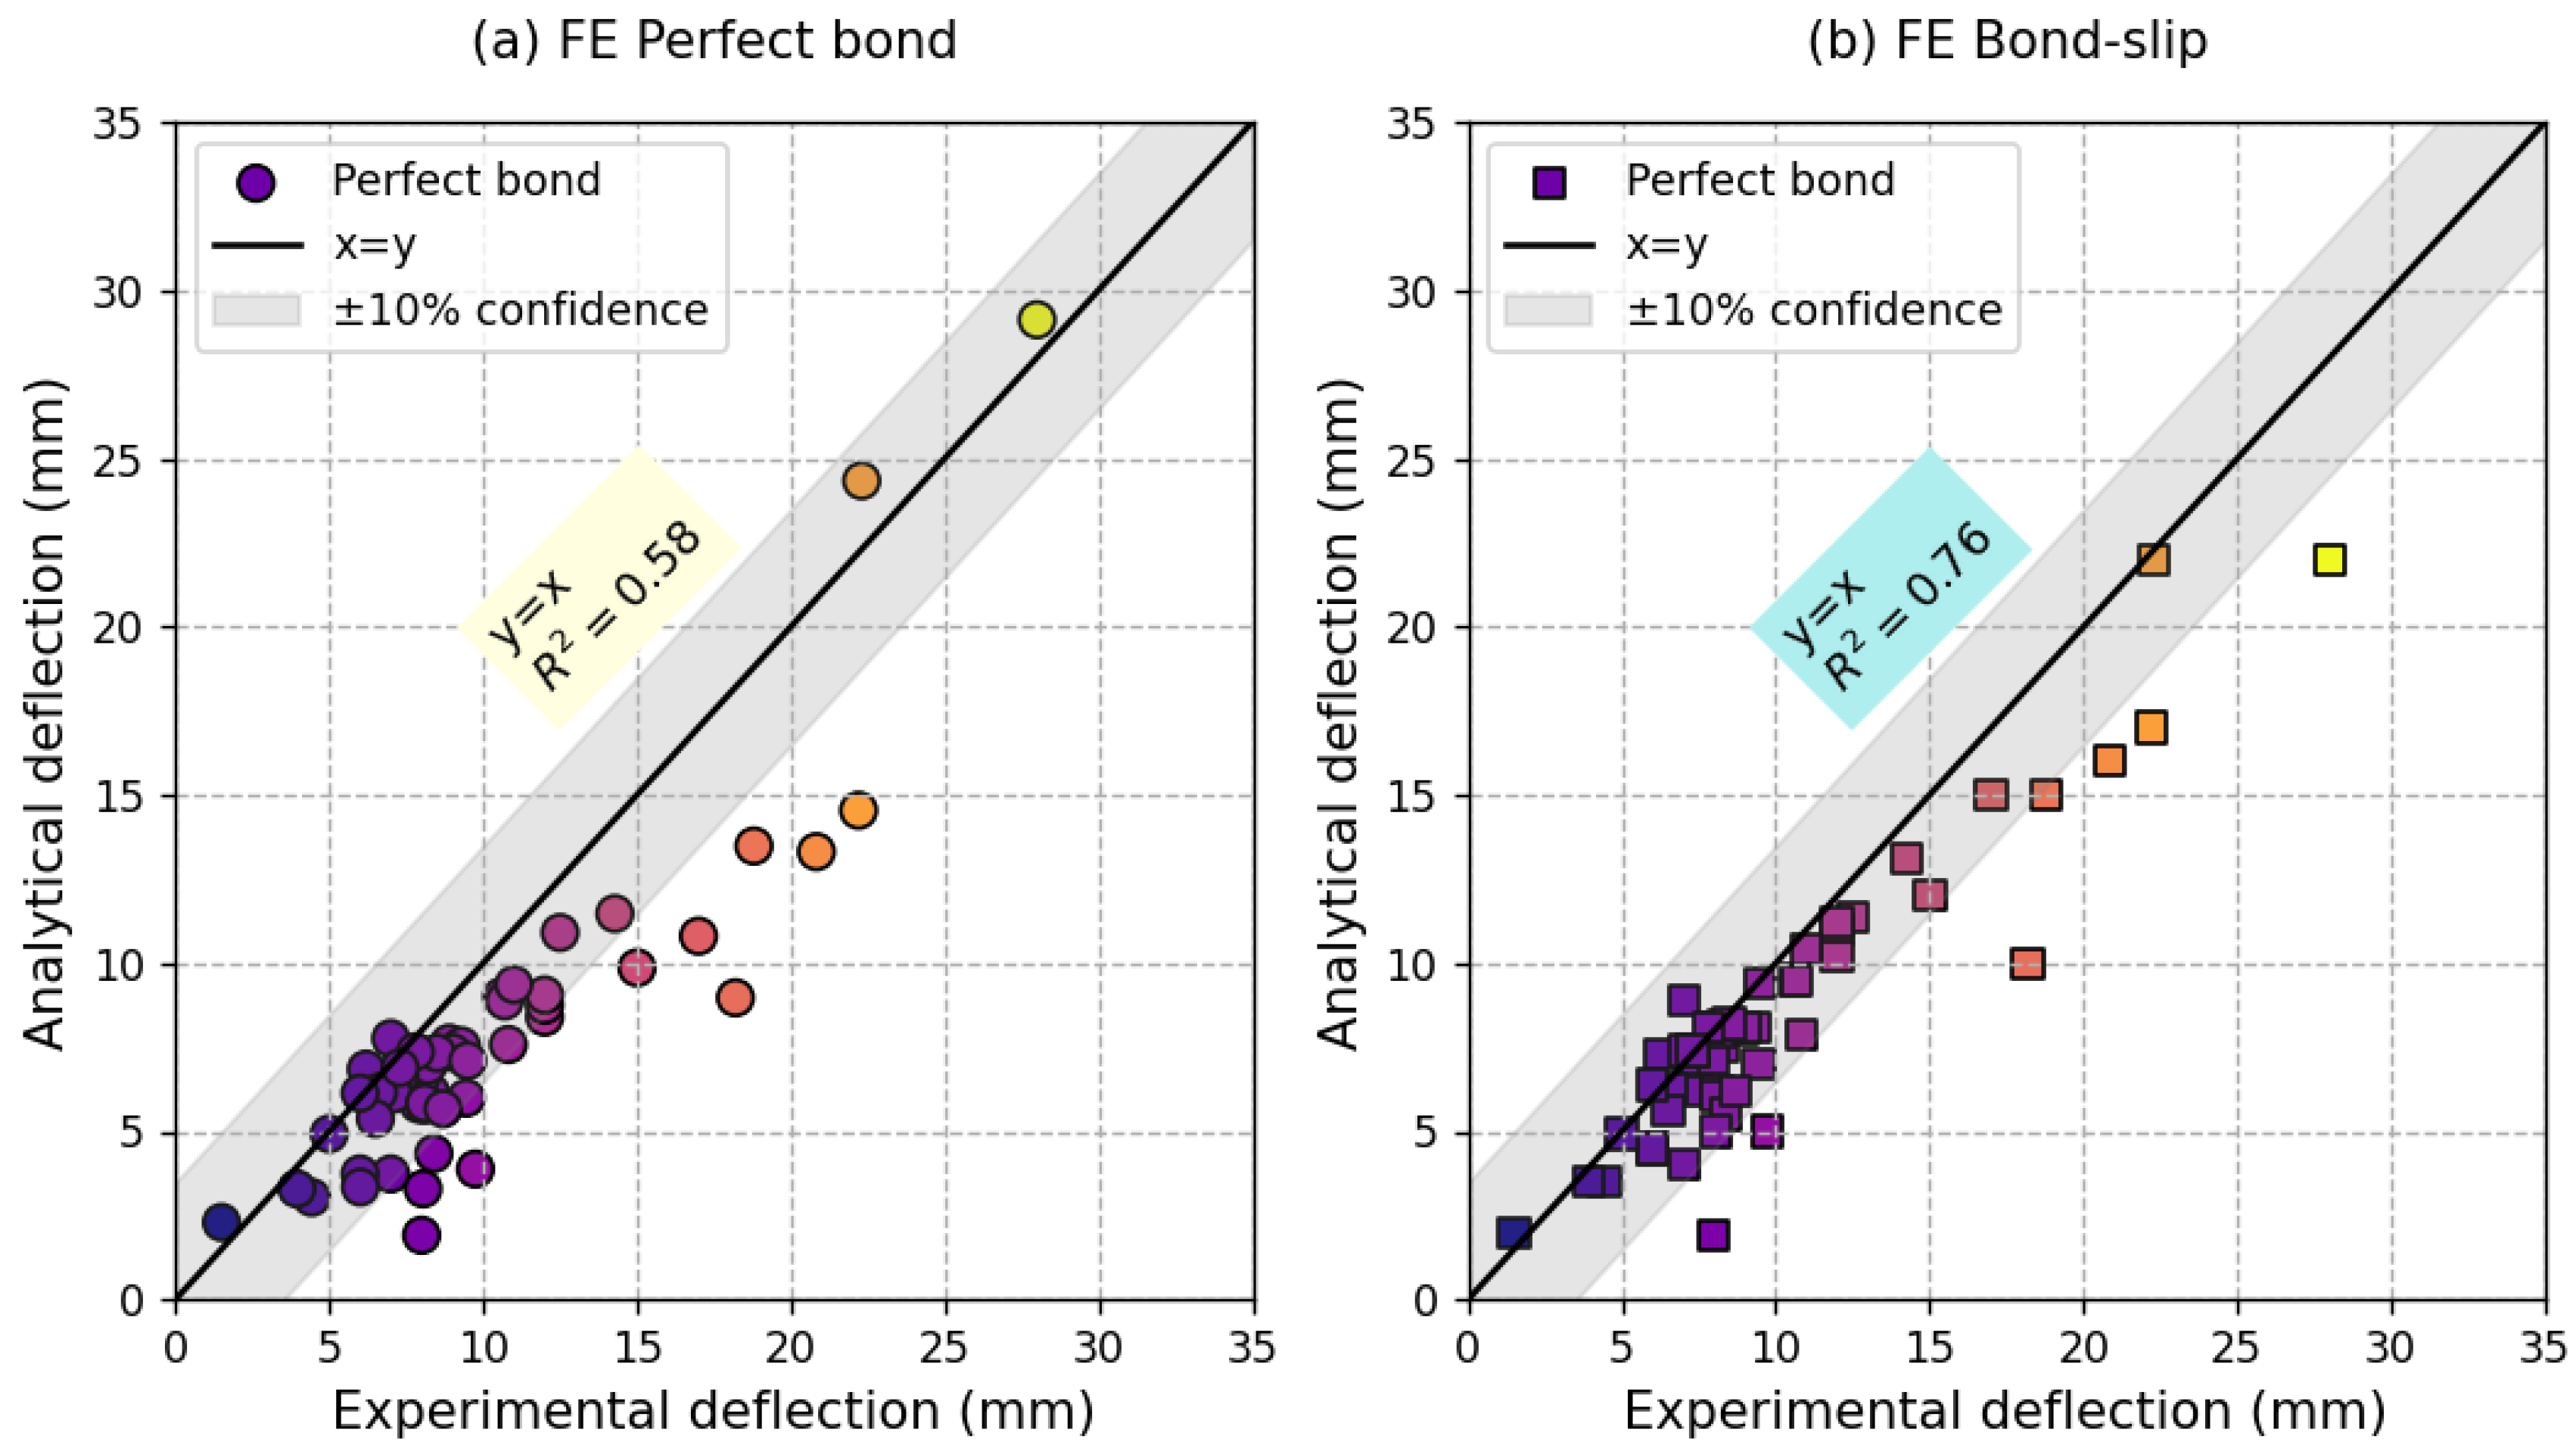
5.2. Validation of the Proposed FE Model

Beams in the database were analyzed using Equation (11) (perfect bond) and the method in Appendix B (slip effect on deflection) as shown in Figure 8. It can be noticed that, when considering the effect of slip, the correlation between the experimental results and the predicted values improves from R2 = 0.51 to R2 = 0.64. The bond-slip model is the better choice for deflection predictions, as it aligns more closely with experimental results within the ±10% confidence level. The perfect bond model, while simpler, shows a higher deviation. The bond-slip model outperforms the perfect bond model with lower MAE (2.12 vs. 2.78 mm) and RMSE (3.02 vs. 3.52 mm), and more points within ±10% bounds (79.2% vs. 75.5%). Both models show similar negatively skewed residuals, suggesting slight underprediction of larger deflections, but the bond-slip approach provides better overall accuracy.
Figure 9 shows that the 1D finite element model developed in this study slightly improves the prediction of deflections when a perfect bond is considered. However, the model performs better when the bond-slip effect is considered. The close agreement between analytical and experimental deflections in Figure 9b confirms that bond-slip effects must be explicitly considered in design calculations to ensure structural reliability. The results demonstrate that the Bond-Slip Model outperforms the Perfect Bond Model in all evaluated metrics, exhibiting lower prediction errors (MAE: 1.72 mm vs. 2.51 mm; RMSE: 2.47 mm vs. 3.26 mm), a higher percentage of points within the ±10% confidence band (86.8% vs. 79.2%), and more pronounced negative skewness (−1.30 vs. −0.90) with heavier-tailed error distribution (kurtosis: 1.71 vs. 0.71), indicating the Bond-Slip Model’s superior accuracy and reliability in predicting deflection behavior while maintaining a conservative bias (consistent underprediction trend) that is particularly valuable for structural safety considerations.
While the proposed 1D FE model demonstrates a 19% improvement in deflection prediction accuracy when bond-slip effects are considered, residual discrepancies remain. These can be attributed to several factors. First, boundary conditions in experimental setups may deviate from the idealized supports assumed in the model, introducing localized stiffness or rotation that affects deflection measurements. Second, material variability—particularly in concrete tensile strength and bond quality—can lead to deviations between predicted and observed behavior. Third, experimental measurement uncertainties, especially in crack width and deflection tracking, may contribute to the scatter in the validation data.
Building on these findings, the choice of modeling approach should reflect the specific goals of the analysis. For serviceability-focused assessments where accurate deflection prediction is paramount, we recommend using models that explicitly incorporate bond-slip behavior, such as the one developed in this study. Conversely, for ultimate limit state evaluations or large-scale structural simulations, more comprehensive 2D or 3D models with interface elements or damage-plasticity formulations may be more suitable.

6. Conclusions

The study presented a one-dimensional (1D) finite element model for predicting the deflection of reinforced concrete beams by integrating tension stiffening, bond-slip, and material nonlinearity. The numerical results were validated against a database of 51 tested beams and compared with analytical predictions from the EC2 design standard. The developed 1D FE model outperforms conventional methods by explicitly modeling bond-slip effects, improving deflection prediction accuracy from R2 = 0.64 to R2 = 0.76 when bond-slip is considered. The developed 1D FE model demonstrates superior performance in comparison with conventional methods through explicit bond-slip modeling. This superior performance results in a 19% improvement in deflection prediction accuracy (R2 increasing from 0.64 to 0.76) when interfacial slip effects are accounted for.
Residual discrepancies may stem from testing conditions (e.g., boundary constraints and material variability) that warrant further investigation. Future work should focus on isolating these experimental factors to refine the model’s robustness.

Author Contributions

Conceptualization, R.M. and M.A.A.A.K.; methodology, G.W. and A.J.; software, G.W.; validation, R.M., M.A.A.A.K. and A.J.; formal analysis, G.W. and M.A.A.A.K.; investigation, R.M.; resources, R.M. and M.A.A.A.K.; data curation, R.M. and A.J.; writing—original draft preparation, R.M. and G.W.; writing—review and editing, M.A.A.A.K.; visualization, G.W.; supervision, M.A.A.A.K. and G.W. All authors have read and agreed to the published version of the manuscript.

Funding

This research received no external funding.

Data Availability Statement

The raw data supporting the conclusions of this article will be made available by the authors upon request.

Conflicts of Interest

The authors declare no conflicts of interest.

Abbreviations

The following abbreviations are used in this manuscript:
LBeam span
bCross-section width
hCross-section height
d0Concrete cover height
dEffective height, d = h − d0
aDistance between the applied load and the support
AsReinforcement area
PApplied load
fySteel yield strength
fcmConcrete compressive strength
fckCharacteristic compressive strength equal to fcm-8 (MPa)
fctmConcrete splitting tensile strength
EcConcrete elastic modulus
EsSteel elastic modulus
xHeight of the compressive zone
εcConcrete compressive strain
εctConcrete tensile strain at the interface rebar-concrete
εc1Concrete compressive strain at peak stress
εcu1Concrete failure strain
εtConcrete tensile strain
εsSteel rebar tensile strain
σcConcrete compressive stress
σtConcrete tensile stress
σsSteel tensile stress
na = Es/EcModular ratio
srCracks spacing
MApplied bending moment
1 r c r Curvature of cracked section
1 r u c Curvature of uncracked section
McrCracking moment
ε0Mean normal strain
κCurvature
C = d0Concrete cover to the longitudinal reinforcement
ϕBar diameter
ρp,effEffective reinforcement ratio
AC, effEffective tension area of concrete
k1Bond coefficient (0.8 for ribbed bars, 1.6 for plain bars)
k2Strain distribution coefficient (0.5 for pure tension, 1.0 for bending)
k3Empirical coefficient (recommended equal to 3.4)
k4Empirical coefficient (recommended equal to 0.425)
NCCompressive force in the compression bloc
NTTensile force in the tension bloc
NsTensile force in rebar
τbBond stress
τb,maxMaximum value of bond stress
τbfResidual bond strength
s1Slip corresponding to the bond strength
s2Slip corresponding to the residual bond strength
KCConcrete stiffness matrix
KSSteel stiffness matrix
KbondBond-slip stiffness matrix
BCConcrete strain-displacement matrix
BSSteel strain-displacement matrix
NShape functions for slip
κiCurvature of the ith element in the FE model
xiPosition of the neutral axis for the ith element
BCurvature-Displacement Matrix is the second derivative of the shape functions
wiThe weights associated with the Gauss-Lobatto quadrature rule at integration point i
JJ = Le is the Jacobian of the mapping from the natural coordinate to the physical coordinate
εslipSteel strain due to slip
LbBond transfer length

Appendix A

This appendix recapitulates the beams retained from the literature to validate the models developed in this study. Table A1 provides a summary of the geometry of each beam, the details of the reinforcement and the mechanical properties of the concrete used. The concrete compressive strength and the steel rebar yield strength for each of the 51 beams selected are measured experimentally. However, the elastic modulus was not given for seven formulations, while the tensile strength was not provided for 18 formulations, as shown in the table. These data can still be calculated from the compressive strength using the following two equations, which were proposed by EC2 [17].
E C M P a = 22,000 f c m 10 1 / 3
f c t m = 0.3 f c k 2 / 3 f c k 50   M P a f c t m = 2.12 l n 1 + f c m 10 f c k > 50   M P a
Table A1. Database used in the present study.
PaperBeamL
(mm)
b
(mm)
h
(mm)
a
(mm)
As
(mm2)
fy
(MPa)
fcm
(MPa)
fctm
(MPa)
Ec
(MPa)
Ajdukiewicz [31]BNNm-b22400200300800452.441061.84.541,900
BNNh-b2452.41036.751,900
BNNm-b1804.260.84.241,500
BNNh-b1804.2100.97.251,900
Ignjatoviç [32]NAC-130002003001000150.855543.73.126,600
NAC-2763.4
Kang [33]H0-1.82700135270900576.1410.864.54.237,700
H0-1.5402.1389.1
H0-1265.5407.6
H0-0.5157.1377.0
N0-1.8576.1410.838.63.329,200
N0-1.5402.1389.1
N0-1265.5407.6
N0-0.5157.1377.0
Wardeh [34]BN-11500150200500402.155038.63.639,400
BN-2307.9
Sato [35]v-01-10WB2200150200700157.133230.62.930,342
v-01-13WB265.5353
v-01-16WB402.1342
v-01-10WB-d157.133232.53.029,200
v-01-13WB-d265.5353
v-01-16WB-d402.1342
hv-01-13WB265.533168.73.031,854
v30-03-wb265.5331106.46.344,080
v45-03-wb265.533157.03.031,854
v60-03-wb265.533140.23.532,113
vex45-03-wb265.533155.33.636,347
Seara-Paz [30]H50-034002003001275.5402.150060.74.336,300
H65-046.94.035,200
Arezomandi [36]CC-F-6-12700300460900567.156837.23.534,500
CC-F-7-1760.3517
CC-F-6-2567.156834.23.033,100
CC-F-7-2760.3517
Dar [37]OB50003005001666188556119.2-21,300
Shen [38]B01600150300550226.254842.1-33,200
Choobbor [39]US1690120240563.3157.1540.138.78--
Wei [40]Ref225020030097525840040-39,000
Song [41]B-1280020030010001140.445539.1-32,100
Zhang [42]RC2100150250900628.441045.22.2634,500
Nguyen [43]RC2400130300850307.9500352.030,000
Wu [44]R2000150250700508.942060.5-34,634
Ahmed [45]BM45501903401925942.556535-31,900
Deng [46]RC11600150250550157.143537.43.3535,000
Ren [47]NR1700150200600226.250032.2--
Wang [48]L01960230270880480.734034.8--
Yoo [49]RC-PI2222125250743567.0647945--
Zhang [50]BO1600150300500265.544030-30,000
El-Emam [51]CB12200200300850157.144830.82.63-
Feng [52]RCBS1800200300600157.130032.7--
Karabulut [16]SC20-11000150200300157.142020.0--
Shi [53]RC1400150200500265.540037.82.6631,100

Appendix B

The analytical calculation of slip strain (εslip) in reinforced concrete beams requires a rigorous approach that follows fib MC2010 guidelines [24]. The process starts using Equation (7) to determine the steel stress (σs) and strain (εs) in the reinforcing bars.
For bond-slip analysis, the critical parameter is the bond transfer length, Lb, derived from the equilibrium equation:
L b = ϕ σ s 4 τ a v g
where ϕ represents the bar diameter and τavg is the average bond stress. The slip magnitude, s, is obtained by solving the integral of the bond tress distribution along the transfer length, yielding the following closed-form solution:
s = τ a v g τ m a x 1 / α
Finally, the slip strain is calculated as ε s l i p = s L b and the total strain is equal to ε t o t a l = ε s + ε s l i p .
In EC2 [17], the bond length (called the anchorage length, Lb) ensures proper force transfer between the reinforcement and the concrete. It depends on the bond conditions good or poor, the concrete compressive strength fck, the rebar diameter ϕ and the steel stress σsd.
EC2 (Clause 8.4.3) defines the basic required anchorage length, L b , r e q d as
L b , r e q d = ϕ 4 . σ s d f b d
where σsd is the design stress in the bar at the anchorage start, and fbd is the design bond strength (Clause 8.4.2). The design bond strength (fbd) is dependent on the compressive strength and the bond conditions. It is calculated by the following equation:
f b d = 2.25 η 1 η 2 f c t d
where:
η1 = bond condition coefficient (1.0 for good conditions and 0.7 for poor conditions)
η2 = bar diameter effect (1.0 for ϕ 32   m m else 132 ϕ / 100 for ϕ > 32   m m )
fctd = design tensile strength of concrete f c t d = 0.7 f c t m γ C = 1.5 .
The bond length is expressed using the following equation:
L b d = α 1 α 2 α 3 α 4 α 5 L b , r e q d L b , m i n
where:
α1: Effect of bar shape (α1 = 1.0 for strait bars and α1 = 0.7 for hooks/bend bars).
α2: Effect of concrete cover ( α 2 = 0.7 1 0.15 c d ϕ / ϕ 1.0 ) with cd = min (cover, half spacing between bars).
α3: Confinement by transverse reinforcement α 3 = 1 K λ 0.7 with λ = A s t A s t , m i n / A s . A s t represents the cross-sectional area of the transverse reinforcement along the design anchorage length Lbd while A s t , m i n is the cross-sectional area of the minimum transverse reinforcement = 0.25 As for beams and 0 for slabs. Finally, K ranges from 0 to 0.1.
α4: Welded transverse bars (α4 = 0.7 if welded bars are present otherwise 1.0).
α5: Lateral pressure’s effect ( 0.7 1 0.04 p 1.0 ). p is the transverse pressure [MPa].
The minimum anchorage length (Clause 8.4.4) is calculated as L b , m i n = m a x 0.3 L b , r e q d , 10 ϕ , 100   m m . The transmission length Lt can be taken equal to L t = 0.7 L b d to account for the non-uniform distribution of the bond along the length.
Conversely, starting from the transmission length, we can calculate the average bond stress according to the expression:
τ a v g = 1 n b a r s π ϕ L t M y d x 3 τ m a x

Appendix B.1. Worked Example

Consider a beam of a cross-section b = 300 mm, h = 500 mm with a steel reinforcement composed of 3 ribbed bars of a diameter ϕ = 16 mm giving A s = 3 × π 16 2 4 = 603.2 mm2.
The concrete characteristic of compressive strength f c k = 25   M P a requiring a means of compressive strength f c m = 25 + 8 = 33   M P a and the steel yield strength f y = 500   M P a with E s = 200   G P a .
This example shows the effect of slip on deflection when the beam is subjected to a bending moment corresponding to the yielding moment. The beam is simply supported with a span of L = 6000 mm and it is subjected to four-point bending, with the load at a distance of a = 2000 of each support (Figure 2). When the calculation is performed, the safety factors will not be considered because the yield moment is a limit case. The concrete cover thickness is taken d 0 = 50   m m leading to an effective height d = 500 50 = 450   m m .
The elastic modulus of concrete is calculated using Equation (A1) which gives E c = 22,000 33 10 0.3 = 31,475.8   M P a . Hence the modular ratio n a = E s E c = 200,000 31,475.8 = 6.35 .
The calculated concrete tensile strength according to Equation (A2) is f c t m = 0.3 25 2 / 3 = 2.56   M P a . The height of the compressive area using Equation (7) yields x = 95.2   m m .
The yielding moment (My) is the bending moment at which the longitudinal tensile reinforcement reaches its yield strength (fyk), while the concrete in the compression zone remains below its crushing strain. Based on this assumption it can be calculated using the following equation:
M y = A s f y d x 3
For the given values the yielding moment is M y = 126.1   k N · m . The analysis results are given in Table A2.
Table A2. Summary of beam analysis results.
ParameterSymbolValueUnitRemark
Yielding momentMy126.1kN.mEquation (A9)
Uncracked curvature κ u n = 1 / r u n 1.22 × 10−61/mmEquation (4)
Cracked curvature κ c r = 1 / r c r 7.05 × 10−61/mmEquation (5)
Effective curvature κ e f f = 1 / r e f f 6.62 × 10−61/mmEquation (3)
Midspan deflection Δ c r 25.36mmEquation (8)
Transmission lengthLt476mm
Average bond stress τ a v g 4.2MPaEquation (A8)
Slips0.05mmEquation (A4)
Slip induced curvature Δ κ s l i p 2.74 × 10−71/mm Δ κ s l i p = s L t d x
Total curvature κ t o t a l 6.89 × 10−61/mm κ t o t a l = κ e f f + Δ κ s l i p
Total midspan deflection Δ t o t a l 26.41mmEquation (8)
The example shows that, when the slip effect is considered on the deflection, its value increases by Δ t o t a l Δ c r = 26.41 25.36 = 4 % . Tacking f c t d = 0.7 f c t m γ c = 1 , the transmission length will be reduced to 317.3 mm leading to a deflection increase of 17%.

Appendix C

The Newton–Raphson algorithm is employed in this study to solve the nonlinear equilibrium equations arising from the 1D finite element model of reinforced concrete beams with bond–slip effects. This iterative method is essential for capturing the nonlinear behavior of materials and the bond interface under service loads.
Algorithm Steps:
1.
Initialization:
-
Define the initial displacement vector U⁰ (usually zero).
-
Set the external load increment ΔFext.
-
Choose a convergence tolerance (e.g., 10−6) and a relaxation factor (e.g., 0.8).
2.
Iteration Loop (per load step):
For each load increment, iterate until convergence:
a.
Compute Internal Forces:
Fint = Fint(Uᵏ)
Derived from the stress state in concrete, steel, and bond–slip interface.
b.
Compute Residual Vector:
Rᵏ = FextFint(Uᵏ)
c.
Assemble Tangent Stiffness Matrix:
Kglobal = KC + KS + Kbond
Contributions from
-
Concrete: KC = ∫ Act EC(ε) BCᵀ BC dx
-
Steel: KS = ∫ AS ES(ε) BSᵀ BS dx
-
Bond: Kbond = ∫ Nᵀ (dτb/ds) N dx
d.
Solve for Displacement Correction:
ΔU = Kglobal−1 Rᵏ
e.
Update Displacements
Uᵏ⁺1 = Uᵏ + α ΔU
α is the relaxation factor to improve convergence.
f.
Check Convergence:
||Rᵏ⁺1|| ≤ tolerance
If not satisfied, repeat from step (a).
3.
Post-Convergence:
Once converged, compute derived quantities:
-
Curvature: κᵢ = εs,i/(d − xᵢ)
-
Slip and stress distributions

References

  1. D’Antino, T.; Pisani, M.A. A Proposal to Improve the Effectiveness of the Deflection Control Method Provided by Eurocodes for Concrete, Timber, and Composite Slabs. Materials 2021, 14, 7627. [Google Scholar] [CrossRef] [PubMed]
  2. El-Zeadani, M.; Rashid, R.S.M.; Amran, M.Y.H.; Hejazi, F.; Jaafar, M.S. Short-term deflection of RC beams using a discrete rotation approach. Int. J. Adv. Struct. Eng. 2019, 11, 473–490. [Google Scholar] [CrossRef]
  3. Beljkaš, Ž.; Baša, N. Neural Networks—Deflection Prediction of Continuous Beams with GFRP Reinforcement. Appl. Sci. 2021, 11, 3429. [Google Scholar] [CrossRef]
  4. Kim, S.-W.; Han, D.-S.; Kim, K.-H. Evaluation of Shear Effect on Deflection of RC Beams. Appl. Sci. 2021, 11, 7690. [Google Scholar] [CrossRef]
  5. Visintin, P.; Sturm, A.B.; Oehlers, D.J. Long- and short-term serviceability behavior of reinforced concrete beams: Mechanics models for deflections and crack widths. Struct. Concr. 2018, 19, 489–507. [Google Scholar] [CrossRef]
  6. Zakrzewski, M.; Domski, J. Cracking Behavior and Deflections in Recycled-Aggregate Beams Reinforced with Waste Fibers Subjected to Long-Term Constant Loading. Materials 2023, 16, 3622. [Google Scholar] [CrossRef]
  7. Kaklauskas, G.; Sokolov, A. A peculiar value of M to M ratio: Reconsidering assumptions of curvature analysis of reinforced concrete beams. Appl. Eng. Sci. 2021, 7, 100053. [Google Scholar] [CrossRef]
  8. Dancygier, A.N.; Berkover, E. Cracking localization and reduced ductility in fiber-reinforced concrete beams with low reinforcement ratios. Eng. Struct. 2016, 111, 411–424. [Google Scholar] [CrossRef]
  9. ACI 318-19; Building Code (ACI 318-19) and Commentary on Building Code Requirements for Structural Concrete (ACI 318R-19). American Concrete Institute: Farmington Hills, MI, USA, 2019.
  10. Daud, R.A.; Daud, S.A.; Al-Azzawi, A.A. Tension stiffening evaluation of steel fibre concrete beams with smooth and deformed reinforcement. J. King Saud Univ.—Eng. Sci. 2021, 33, 147–152. [Google Scholar] [CrossRef]
  11. Teng, L.; Zhang, R.; Khayat, K.H. Tension-Stiffening Effect Consideration for Modeling Deflection of Cracked Reinforced UHPC Beams. Sustainability 2021, 14, 415. [Google Scholar] [CrossRef]
  12. Hasan, N.M.S.; Visintin, P.; Oehlers, D.J.; Bennett, T.; Sobuz, H.R. Time dependent deflection of RC beams allowing for partial interaction and non-linear shrinkage. Mater. Struct. 2019, 52, 52. [Google Scholar] [CrossRef]
  13. Fantilli, A.P.; Orfeo, B.; Caldentey, A.P. The deflection of reinforced concrete beams containing recycled steel fibers. Struct. Concr. 2021, 22, 2089–2104. [Google Scholar] [CrossRef]
  14. Amin, A.; Foster, S.J.; Kaufmann, W. Instantaneous deflection calculation for steel fibre reinforced concrete one way members. Eng. Struct. 2017, 131, 438–445. [Google Scholar] [CrossRef]
  15. Karabulut, M. Machine Learning-Driven Flexural Performance Prediction and Experimental Investigation of Glass Fiber-Reinforced Polymer Bar-Reinforced Concrete Beams. Polymers 2025, 17, 713. [Google Scholar] [CrossRef]
  16. Karabulut, M. Nonlinear Load-Deflection Analysis of Steel Rebar-Reinforced Concrete Beams: Experimental, Theoretical and Machine Learning Analysis. Buildings 2025, 15, 432. [Google Scholar] [CrossRef]
  17. Comité Européen de Normalisation. Eurocode 2. Design of Concrete Structures—Part 1: Common Rules for Building and Civil Engineering; European Committee for Standardization: Brussels, Belgium, 2004. [Google Scholar]
  18. Mohamad, R.; Hammadeh, H.; Kousa, M.; Wardeh, G. Fracture Based Non Linear Model For Reinforced Concrete Beams. GEOMATE J. 2020, 18, 110–117. Available online: https://geomatejournal.com/geomate/article/view/408 (accessed on 1 January 2020). [CrossRef]
  19. Hillerborg, A.; Modéer, M.; Petersson, P.-E. Analysis of crack formation and crack growth in concrete by means of fracture mechanics and finite elements. Cem. Concr. Res. 1976, 6, 773–781. [Google Scholar] [CrossRef]
  20. Wang, T.; Hsu, T.T.C. Nonlinear finite element analysis of concrete structures using new constitutive models. Comput. Struct. 2001, 79, 2781–2791. [Google Scholar] [CrossRef]
  21. Mosley, B.; Bungey, J.; Hulse, R. Reinforced Concrete Design: To Eurocode 2, 6th ed.; Palgrave Macmillan: New York, NY, USA, 2007. [Google Scholar]
  22. Bakleh, B.; Hasan, H.; Wardeh, G. Analytical Model for the Prediction of Instantaneous and Long-Term Behavior of RC Beams under Static Sustained Service. Appl. Mech. 2023, 4, 31–43. [Google Scholar] [CrossRef]
  23. Wardeh, G.; Ghorbel, E.; Gomart, H.; Fiorio, B. Experimental and analytical study of bond behavior between recycled aggregate concrete and steel bars using a pullout test. Struct. Concr. 2017, 18, 811–825. [Google Scholar] [CrossRef]
  24. CEB-FIP. Model Code 2010; International Federation for Structural Concrete: Lausanne, Switzerland, 2012. [Google Scholar]
  25. Manfredi, G.; Pecce, M. A refined R.C. beam element including bond–slip relationship for the analysis of continuous beams. Comput. Struct. 1998, 69, 53–62. [Google Scholar] [CrossRef]
  26. Oliveira, R.S.; Ramalho, M.A.; Corrêa, M.R.S. A layered finite element for reinforced concrete beams with bond–slip effects. Cem. Concr. Compos. 2008, 30, 245–252. [Google Scholar] [CrossRef]
  27. Jakubovskis, R.; Kaklauskas, G.; Gribniak, V.; Weber, A.; Juknys, M. Serviceability Analysis of Concrete Beams with Different Arrangements of GFRP Bars in the Tensile Zone. J. Compos. Constr. 2014, 18, 04014005. [Google Scholar] [CrossRef]
  28. Öchsner, A.; Merkel, M. One-Dimensional Finite Elements; Springer International Publishing: Cham, Switzerland, 2018. [Google Scholar] [CrossRef]
  29. Oñate, E. Structural Analysis with the Finite Element Method Linear Statics; Springer: Dordrecht, The Netherlands, 2013. [Google Scholar] [CrossRef]
  30. Seara-paz, S.; González-fonteboa, B.; Martínez-abella, F.; Eiras-lópez, J. Flexural performance of reinforced concrete beams made with recycled concrete coarse aggregate. Eng. Struct. 2018, 156, 32–45. [Google Scholar] [CrossRef]
  31. Ajdukiewicz, A.B.; Kliszczewicz, A.T. Comparative Tests of Beams and Columns Made of Recycled Aggregate Concrete and Natural Aggregate Concrete. J. Adv. Concr. Technol. 2007, 5, 259–273. [Google Scholar] [CrossRef]
  32. Ignjatovic, I.S.; Marinkovic, S.B.; Miskovic, Z.; Savic, A.R. Flexural behavior of reinforced recycled aggregate concrete beams under short-term loading. Mater. Struct. 2013, 46, 1045–1059. [Google Scholar] [CrossRef]
  33. Kang, T.H.-K.; Kim, W.; Kwak, Y.-K.; Hong, S.-G. Flexural Testing of Reinforced Concrete Beams with Recycled Concrete Aggregates. ACI Struct. J. 2014, 111, 607–616. [Google Scholar] [CrossRef]
  34. Wardeh, G.; Ghorbel, E. Experimental Investigation and Analytical Study on the Flexural Behavior of Reinforced Recycled Aggregate Concrete Beams. J. Mod. Mech. Eng. Technol. 2018, 5, 1–23. [Google Scholar] [CrossRef]
  35. Sato, R.; Maruyama, I.; Sogabe, T.; Sogo, M. Flexural Behavior of Reinforced Recycled Concrete Beams. J. Adv. Concr. Technol. 2007, 5, 43–61. [Google Scholar] [CrossRef]
  36. Arezoumandi, M.; Smith, A.; Volz, J.S.; Khayat, K.H. An experimental study on flexural strength of reinforced concrete beams with 100% recycled concrete aggregate. Eng. Struct. 2015, 88, 154–162. [Google Scholar] [CrossRef]
  37. Dar, M.A.; Verma, A.; Malalasekara, P.; Kok, A.; Quek, J.; Pang, S.D. Hybrid strengthening scheme for reinforced concrete beams: Flexural behaviour and large-scale testing. Eng. Struct. 2024, 301, 117206. [Google Scholar] [CrossRef]
  38. Shen, J.; Dai, H.; Zhou, G.; Shi, J. Flexural behavior of pre-damaged RC beams strengthened with UHPFRC-CFRP grid layer. Eng. Struct. 2024, 317, 118669. [Google Scholar] [CrossRef]
  39. Choobbor, S.S.; Hawileh, R.A.; Abu-Obeidah, A.; Abdalla, J.A. Performance of hybrid carbon and basalt FRP sheets in strengthening concrete beams in flexure. Compos. Struct. 2019, 227, 111337. [Google Scholar] [CrossRef]
  40. Wei, J.; Teng, L.; Khayat, K.H. Coupled effect of fiber type and reinforcement ratio on flexural behavior of reinforced beams cast with super workable concrete. Constr. Build. Mater. 2024, 438, 137039. [Google Scholar] [CrossRef]
  41. Song, L.; Wei, M.; Zhang, X.; Li, C.; Dong, Z.; Wang, Y. Flexural performance of reinforced concrete beams repaired with BFRP grid-TSUHDC. Constr. Build. Mater. 2024, 443, 137748. [Google Scholar] [CrossRef]
  42. Zhang, Z.; Liu, D.; Abdalla, J.A.; Hawileh, R.A.; Qin, F.; Xu, X. Flexural behavior of reinforced concrete beams externally strengthened with ECC and FRP grid reinforcement. Constr. Build. Mater. 2024, 446, 137964. [Google Scholar] [CrossRef]
  43. Nguyen, M.H.; Ho, M.H.; Tran, V.R.; Phan, H.N.; Nguyen, D.D.N.; Huynh, P.N. Flexural performance of reinforced concrete beams strengthened with prestressed FRP sheets: Experiments and numerical investigations. Case Stud. Constr. Mater. 2024, 21, e03475. [Google Scholar] [CrossRef]
  44. Wu, F.; Lei, S.; Liu, Z.; Cao, J.; Liu, L. Flexural behavior of RC beams strengthened with CFRP grid-reinforced engineering cementitious composite. Structures 2024, 67, 106978. [Google Scholar] [CrossRef]
  45. Ahmed, I.; Reichenbach, S.; Kromoser, B. Flexural behaviour of reinforced concrete beams with voids: Topology optimisation basis. Structures 2024, 67, 107037. [Google Scholar] [CrossRef]
  46. Deng, L.; Liu, Y.; Zhou, Z.; Zou, Y.; Shi, W.; Jin, Z.; Zhong, Q. Flexural performance of BFRP grid–ECC in strengthening damaged RC beams. Structures 2024, 69, 107420. [Google Scholar] [CrossRef]
  47. Ren, Y.; Guo, R.; Liu, A.; Xia, M.; Pan, Y. Study on flexural behaviour and analytical model of RC beams strengthened with FRP grid-ECC composite layers. Structures 2025, 73, 108445. [Google Scholar] [CrossRef]
  48. Wang, Y.; Zheng, H.; Chen, H.; Chen, Z.; Zhuang, N. Experimental and numerical study on the flexural properties of RC beams with different CFRP-strengthened schemes. J. Build. Eng. 2024, 97, 110734. [Google Scholar] [CrossRef]
  49. Yoo, D.-Y.; Chun, B.; Choi, J.; Min, K.-H.; Shin, H.-O. Enhancing the flexural capacity of RC beams under various loading rates through strengthening with ultra-high-performance fiber-reinforced concrete. Dev. Built Environ. 2024, 20, 100581. [Google Scholar] [CrossRef]
  50. Zhang, Z.; Qin, H. Study on Flexural Performance of Reinforced Concrete Beams Strengthened with FRP Grid–PCM Composite Reinforcement. Appl. Sci. 2024, 14, 9013. [Google Scholar] [CrossRef]
  51. El-Emam, H.M.; Ata, B.; Ahmad, S.S.E.; Salim, H.A.; Reda, R.M. Enhancing Flexural Resistance in Pre-Damaged RC Beams with Near-Surface Mounted GFRP Bar and Bolt Anchoring System. Buildings 2024, 14, 723. [Google Scholar] [CrossRef]
  52. Feng, X.; Liu, D.; Long, X.; Duan, K.; Zuo, J.; Liu, W.; Dong, H. Flexural Capacity of the Normal Sections of Concrete Beams Strengthened with Corrugated Steel Plates. Buildings 2024, 14, 1398. [Google Scholar] [CrossRef]
  53. Shi, C.; Jin, S.; Wang, C.; Yang, Y. Enhancing Flexural Behavior of Reinforced Concrete Beams Strengthened with Basalt Fiber-Reinforced Polymer Sheets Using Carbon Nanotube-Modified Epoxy. Materials 2024, 17, 3250. [Google Scholar] [CrossRef]
Figure 1. Material models, (a) stress-strain concrete compression model, (b) stress-strain concrete tensile model, (c) stress-strain steel model.
Designs 09 00075 g001
Figure 2. Longitudinal and cross-section of a reinforcement concrete beam.
Designs 09 00075 g002
Figure 4. Principal of sectional model.
Designs 09 00075 g004
Figure 5. Flexural bond mechanism in embedded bar.
Designs 09 00075 g005
Figure 6. Slip and curvature variations as a function of the crack spacing.
Designs 09 00075 g006
Figure 7. (a) Load-deflection curves, (b) Deflections at yielding moment.
Designs 09 00075 g007
Figure 8. Experimental versus analytical deflection, (a) perfect bond, (b) bond-slip effect.
Designs 09 00075 g008
Figure 9. Experimental versus FE calculated deflection, (a) perfect bond, (b) bond-slip effect.
Designs 09 00075 g009
Disclaimer/Publisher’s Note: The statements, opinions and data contained in all publications are solely those of the individual author(s) and contributor(s) and not of MDPI and/or the editor(s). MDPI and/or the editor(s) disclaim responsibility for any injury to people or property resulting from any ideas, methods, instructions or products referred to in the content.

