Article

3D Printed Voronoi Structures Inspired by Paracentrotus lividus Shells

by
Alexandros Efstathiadis
1,
Ioanna Symeonidou
1,
Konstantinos Tsongas
2,
Emmanouil K. Tzimtzimis
3 and
Dimitrios Tzetzis
3,*
1
Department of Architecture, University of Thessaly, 38334 Volos, Greece
2
Department of Industrial Engineering and Management, School of Engineering, International Hellenic University, 57001 Thessaloniki, Greece
3
Digital Manufacturing and Materials Characterization Laboratory, School of Science and Technology, International Hellenic University, 57001 Thermi, Greece
*
Author to whom correspondence should be addressed.
Designs 2023, 7(5), 113; https://doi.org/10.3390/designs7050113
Submission received: 31 August 2023 / Revised: 22 September 2023 / Accepted: 25 September 2023 / Published: 29 September 2023

Abstract

:
The present paper investigates the mechanical behavior of a biomimetic Voronoi structure, inspired by the microstructure of the shell of the sea urchin Paracentrotus lividus, with its characteristic topological attributes constituting the technical evaluation stage of a novel biomimetic design strategy. A parametric design algorithm was used as a basis to generate design permutations with gradually increasing rod thickness, node count, and model smoothness, geometric parameters that define a Voronoi structure and increase its relative density as they are enhanced. Physical PLA specimens were manufactured with a fused filament fabrication (FFF) printer and subjected to quasi-static loading. Finite element analysis (FEA) was conducted in order to verify the experimental results. A minor discrepancy between the relative density of the designed and printed models was calculated. The tests revealed that the compressive behavior of the structure consists of an elastic region followed by a smooth plateau region and, finally, by the densification zone. The yield strength, compressive modulus, and plateau stress of the structure are improved as the specific geometric parameters are enhanced. The same trend is observed in the energy absorption capabilities of the structure while a reverse one characterizes the densification strain of the specimens. A second-degree polynomial relation is also identified between the modulus, plateau stress, and energy capacity when plotted against the relative density of the specimens. Distinct Voronoi morphologies can be acquired with similar mechanical characteristics, depending on the design requirements and application. Potential applications include lightweight structural materials and protective gear and accessories.

1. Introduction

Cellular structures can be commonly found in nature and have been observed in bones, seashells, and the plant kingdom [1,2,3]. Such structures are a product of billions of years of natural evolution and manage to achieve exceptional mechanical properties while maintaining low weight and minimal usage of material and energy [4], traits that are vital for the survival of organisms in nature. More specifically, the shell of the sea urchin Paracentrotus lividus has been shown, under scanning electron microscope (SEM) analysis, to be comprised of a porous structure known as the stereom which resembles a foam, as illustrated in Figure 1 [5]. The porous calcite shell provides the urchin with the necessary toughness and impact resistance to protect itself from environmental threats and predators [6,7,8].
Cellular structures have a variety of cells shapes and can generally be categorized as honeycombs [9], closed- or open-cell foams [10], and lattice formations with regularly arranged cells like gyroid [11], truncated cuboctahedron [12], and octet-truss [13] lattices. The natural formation of the urchin’s stereom closely resembles the geometric formation of a 3D Voronoi diagram [14]. As a result, Voronoi diagrams have been employed for the design and fabrication of biomimetic porous structures and materials [1,15]. Traditional fabrication techniques include gas injection in melts [16], the co-expansion method of powders, and blowing agents mixtures [17], or foaming by gases produced through a reduction reaction [18], and are mainly used to produce polymer and metal foams [19,20,21]. Such structures have found application as energy absorption parts in the aeronautic and automotive industries [22], insulators [23], automotive catalysts [24], and in medical applications like orthopedic implants [19,25]. Nevertheless, the above construction techniques have held back the accuracy, the complexity, and the reproducibility of such structures [10,26]. Advancements in 3D printing technologies make it possible to overcome these obstacles and fabricate intricate porous materials efficiently, with high precision and control over their geometry, in a large variety of advanced materials [27,28,29,30,31].
Another constraint for the design and fabrication of cellular structures and materials has been the available Computer Aided Design (CAD) software. Until recently, researchers have generally been limited to simplistic Voronoi design techniques with limited control over the model’s geometric parameters and have relied on the overall relative density of the structure as a characterization basis [32,33,34]. Although relative density has been proven to play an important role in the mechanical performance of such topologies [35,36], several geometric characteristics can alter a sample’s relative density [15,17,37]. Progress in algorithmic, parametric design enables designers, nowadays, to create fully customizable algorithms containing several interactive parameters that can control a wide range of the geometric attributes of the cellular structure while requiring little computational power [38,39,40]. As a result, new approaches to the study and mechanical characterization of such morphologies can be explored based on their topological design.
The present paper aims to examine the technical evaluation of a biomimetic Voronoi structure inspired by the porous microstructure of the stereom of the sea urchin Paracentrotus lividus as part of the development of a novel strategy for biomimetic design. More specifically, the goal of the study is to investigate the mechanical performance of the structure in relation to its characteristic geometric properties. A parametric algorithm was implemented for the emulation of the biological structure. The biomimetic digital model was taken as the basis for the generation of a series of models with variable design parameters. The node count, the rod radius, and the smoothness of the geometry were modified, and physical specimens were printed in a fused filament fabrication (FFF) 3D printer. The mechanical properties and fracture behavior of the structure were examined experimentally under quasi-static compression loading and finite element analysis (FEA) was carried out to validate the results.

2. Materials and Methods

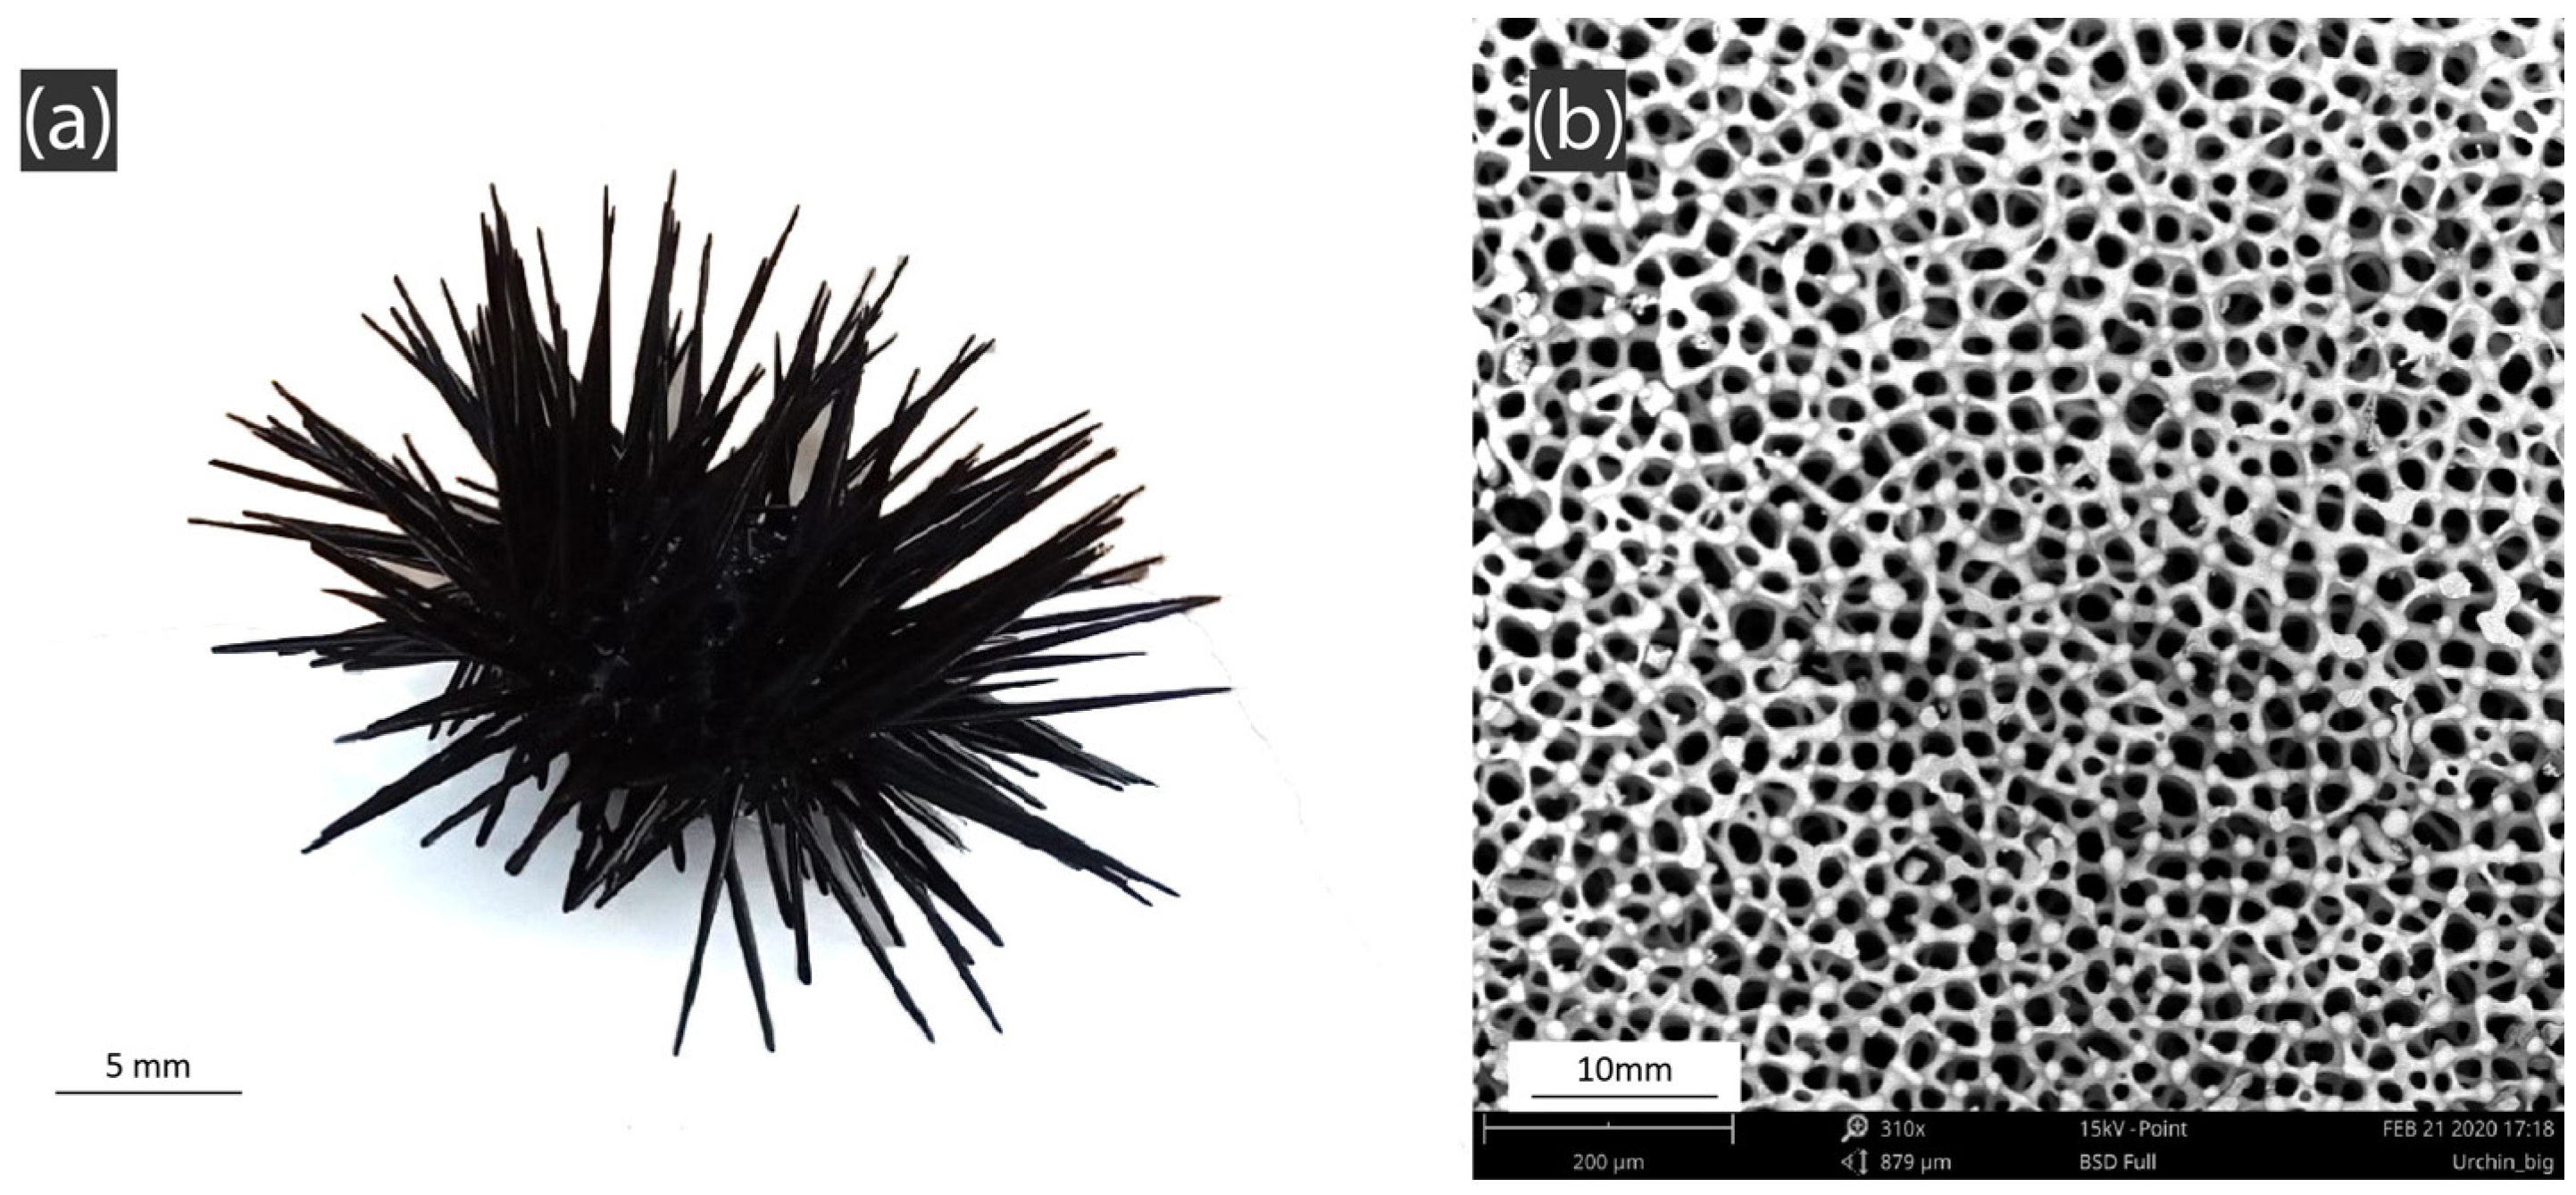
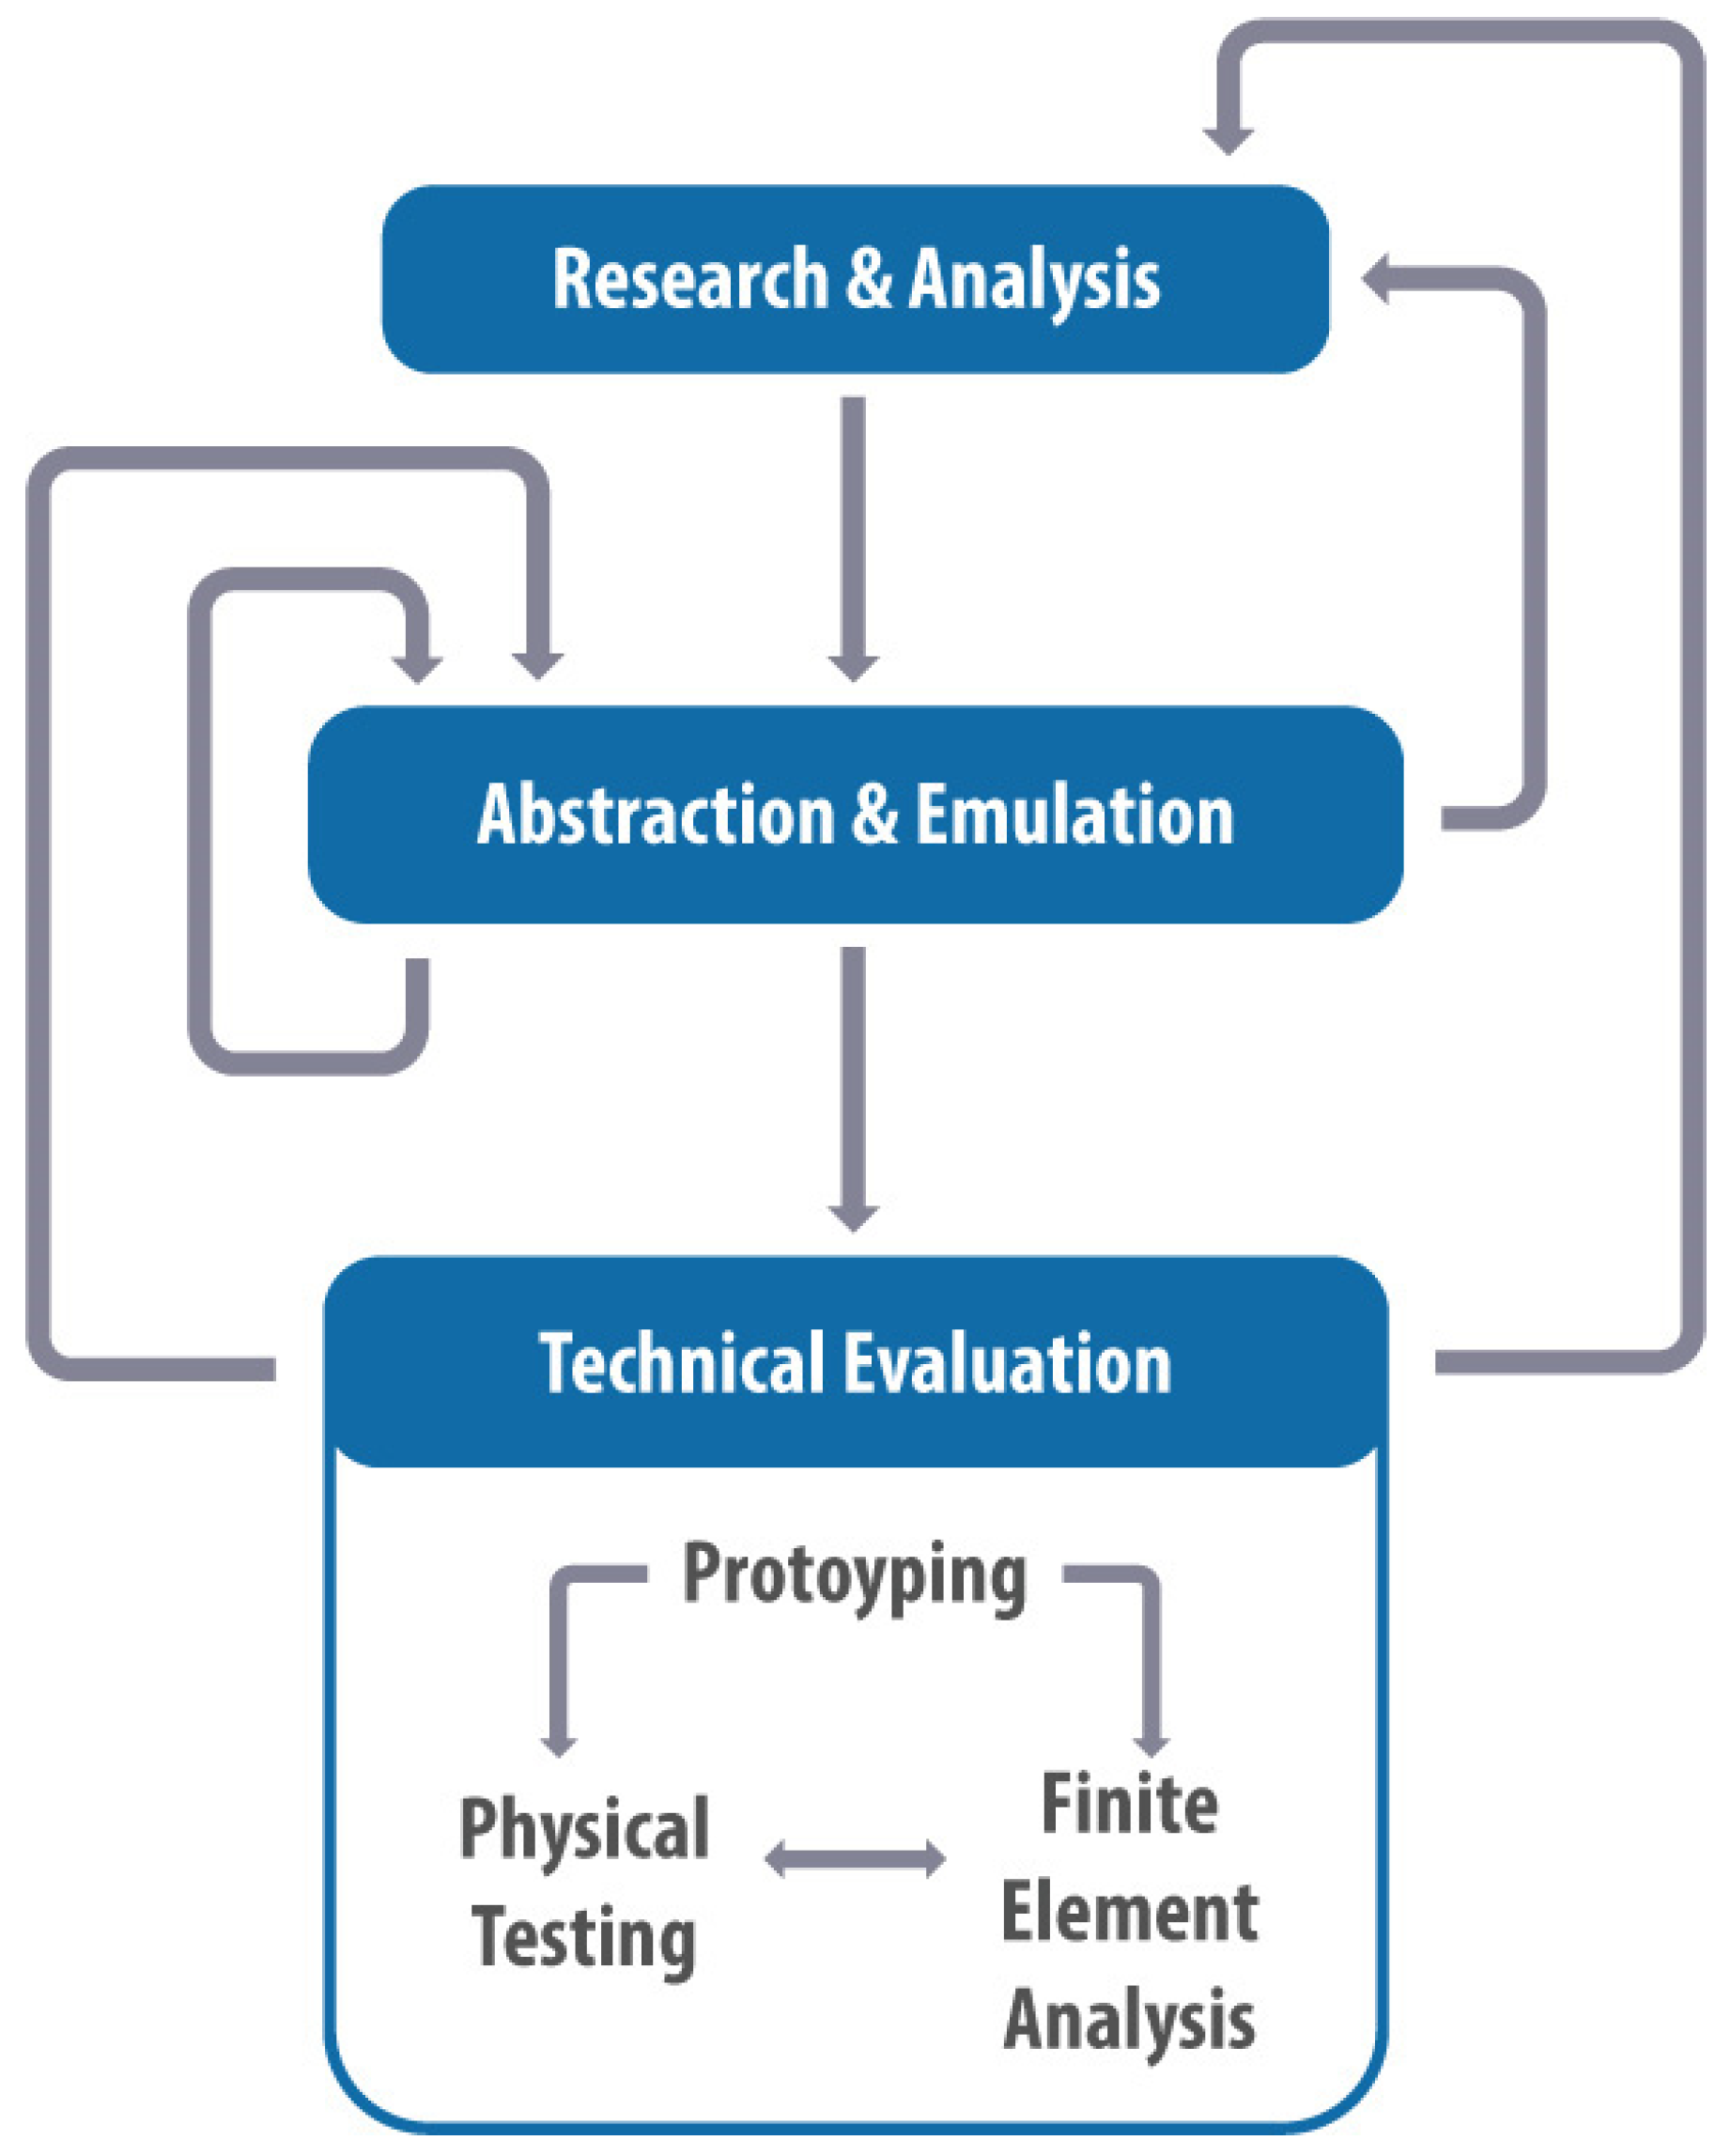
2.1. Biomimetic Design Strategy

A novel biomimetic design strategy that was developed as part of the present research serves as a guideline for the technical evaluation of the Voronoi structure inspired by Paracentrotus lividus shell microstructure. The strategy consists of three separate stages: “Research and Analysis”, followed by “Abstraction and Emulation”, and concluded with the “Technical Evaluation” phase. The workflow of the strategy is not linear, but instead consists of bi-directional feedback loops that inform and counter-inform the three stages as seen in Figure 2. More specifically the “Technical Evaluation” phase incorporates the prototyping of the structure with the aid of additive manufacturing technologies and the mechanical characterization through testing of the physical samples combined with finite element analysis (FEA). The printing process was informed by the topological intricacies of the structure while fabrication constraints counter-informed the design. Furthermore, the functional role of the biological structure informed the testing process and FEA.

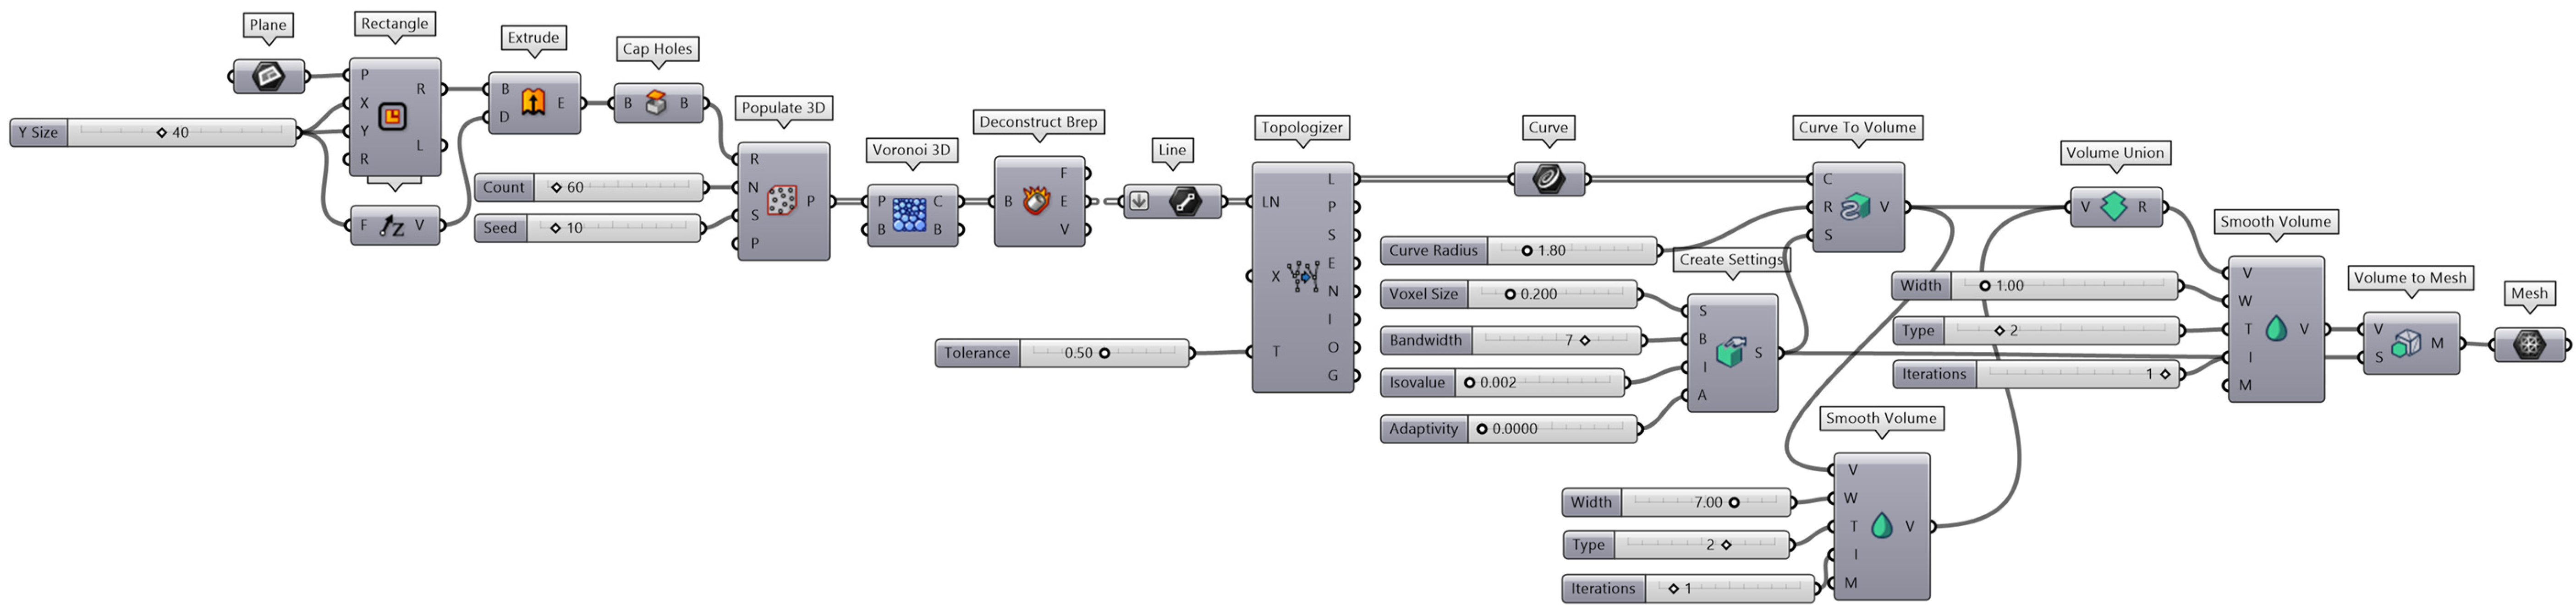
2.2. Design Parameters and 3D Printing

A parametric design algorithm, emulating the morphogenetic process of a 3D Voronoi diagram [5], was developed with the aid of the computer-aided design (CAD) software Rhinoceros 3D and Grasshopper 3D (v. Rhino 7, 7.1.20343.09491, Robert McNeel & Associates, Seattle, WA, USA) in a previous stage of this research. A custom set of points is created within a bounding geometry. Spheres are drawn around each point and are expanded at the same rate until they come into contact so that planar faces are created that form convex polyhedrons. Their edges are extracted, forming the rods of the Voronoi structure. A custom thickness can be applied to them with the aid of the plug-in Dendro (ECR Labs, Los Angeles, CA, USA). The same tool is used to smooth out the volume. The algorithm was further developed by applying a volume Boolean union between the original Voronoi volume and the volume that is derived after the smoothing process. This was deemed necessary to ensure constant rod thickness beyond the boundaries of the smoothing operation around the volume’s nodes, which are the junction points of 2 or more rods. The updated definition is illustrated in Figure 3 as scripted in the Grasshopper environment.
A baseline model (Model 1) was established [5], with XYZ dimensions of 40 mm× 40 mm × 40 mm, node count of 60, rod radius 1.8 mm, and smoothness scale 1. Variations of this model were generated with successive changes in geometric parameters that define a 3D Voronoi structure and have significant impact on its relative density [14]. Initially, the node count was changed to 80 and then to 100. Afterwards, the rod radius was altered to 2 mm and 2.2 mm. Lastly, the smoothness was set to 4 and 7. All the geometric parameters of the models are shown in Table 1. The 3D printing of the specimens was conducted with a Creality Ender 3 Pro printer (Shenzhen Creality 3D Technology Co., Shenzhen, China) using a commercial PLA filament (NEEMA3D, Petroupolis, Greece). The slicing process was carried out on the Ultimaker Cura slicer (v.4.9.1, Ultimaker, Utrecht, The Netherlands). An outer wall speed of 15 mm/s was selected. The speed for inner walls and infill was set at 30 mm/s. The layer thickness was adjusted at 0.2 mm, as a compromise between quality and printing time which ranged from 6 to 7 h. A lines infill pattern was chosen along with 100% infill density. A 0.4 mm diameter nozzle was used which was heated to 205 °C, while the temperature of the build platform was set at 55 °C. No additional support structures were utilized. The complete printing parameters can be found in Table 2. The digital and the 3D printed models are illustrated in Figure 4.

2.3. Compression Testing Supported by FEA

Three specimens of each model were printed (for a total of 21) in order to derive a statistical model of the mechanical properties of the Voronoi structure. The compressive behavior of the printed samples was examined on a Testometric M500-50AT system (Testometric company, Rochdale, United Kingdom) and compression tests were conducted with a constant deformation rate of 5mm/min. The ANSYS™ software (Ansys® Academic Research Mechanical, Release 23.1, ANSYS, Inc., Canonsburg, PA, USA) was used to study the mechanical behavior of all the Voronoi lattice structures. An explicit dynamic analysis was conducted to accurately simulate the mechanical response of the lattices which was necessary to capture their large deformations and bi-linear material behavior.
A convergence study was performed to ensure a mesh-independent response, which showed that stress convergence was achieved with nearly 130,000 elements for each verification model. Specific density or relative density is defined as the ratio of the density of a porous material to that of the solid material from which it is made [41]. The porosity P (%) of each sample was determined according to the following equation [18]:
P = 1 ρ ρ s × 100
where ρ is the density of the Voronoi structure in g/cm3 and ρs is the density of PLA (1.24 g/cm3) [42]. Stress σ (MPa) was calculated as the ratio between force F (N) and the apparent cross-sectional area A (mm2) of the specimens [43]:
σ = F A ,
Strain ε (%) was estimated as the percentage of the ratio between deflection L (mm) and initial height h (mm) of the samples [44]:
ε = L h 100 ,
In order to calculate the energy absorption capacity of the biomimetic Voronoi structure, the densification strain εD must first be determined. Densification strain is the effective strain when the cells of the Voronoi structure have entirely collapsed, and further strain would compress the bulk PLA material. The densification strain εD of porous materials is derived based on its energy absorption efficiency [45], which is calculated with the following equation:
η ε = 1 σ ε 0 ε σ ε d ε ,
The densification strain εD is the strain that corresponds to the maximum value of the η(ε) curve [32,45]. After this point, the stress increases rapidly, as the bulk material is compressed, resulting in a substantial drop in the efficiency of the structure [32]. A typical energy efficiency curve is illustrated in Figure 5 for Model 1 of the designed and fabricated specimens. The energy absorption efficiency η of the model is plotted against the strain ε. The value of strain corresponding to the maximum value of the efficiency curve is the densification strain εD of Model 1 [45].
The plateau stress σpl is a significant parameter used to assess the compressive performances of porous materials as it describes the plateau region of the stress–strain curve of cellular solids and is calculated by the following equation [46]:
σ p l = 1 ε D ε y ε D ε y σ ε d ε ,
where εy is the yield strain, which corresponds to the onset of plastic deformation.
Porous structures absorb energy at an almost constant load until the densification strain, when the load rapidly increases. Thus, the energy absorption capacity Wv (MJ/m3) of the foams is estimated by the energy absorbed per unit of volume up to the densification strain εD. [45]:
W v = 0 ε D σ ε ,
And the specific energy absorption Wm (KJ/kg) as the energy absorbed per unit of mass [47]:
W m = W v ρ

3. Results and Discussion

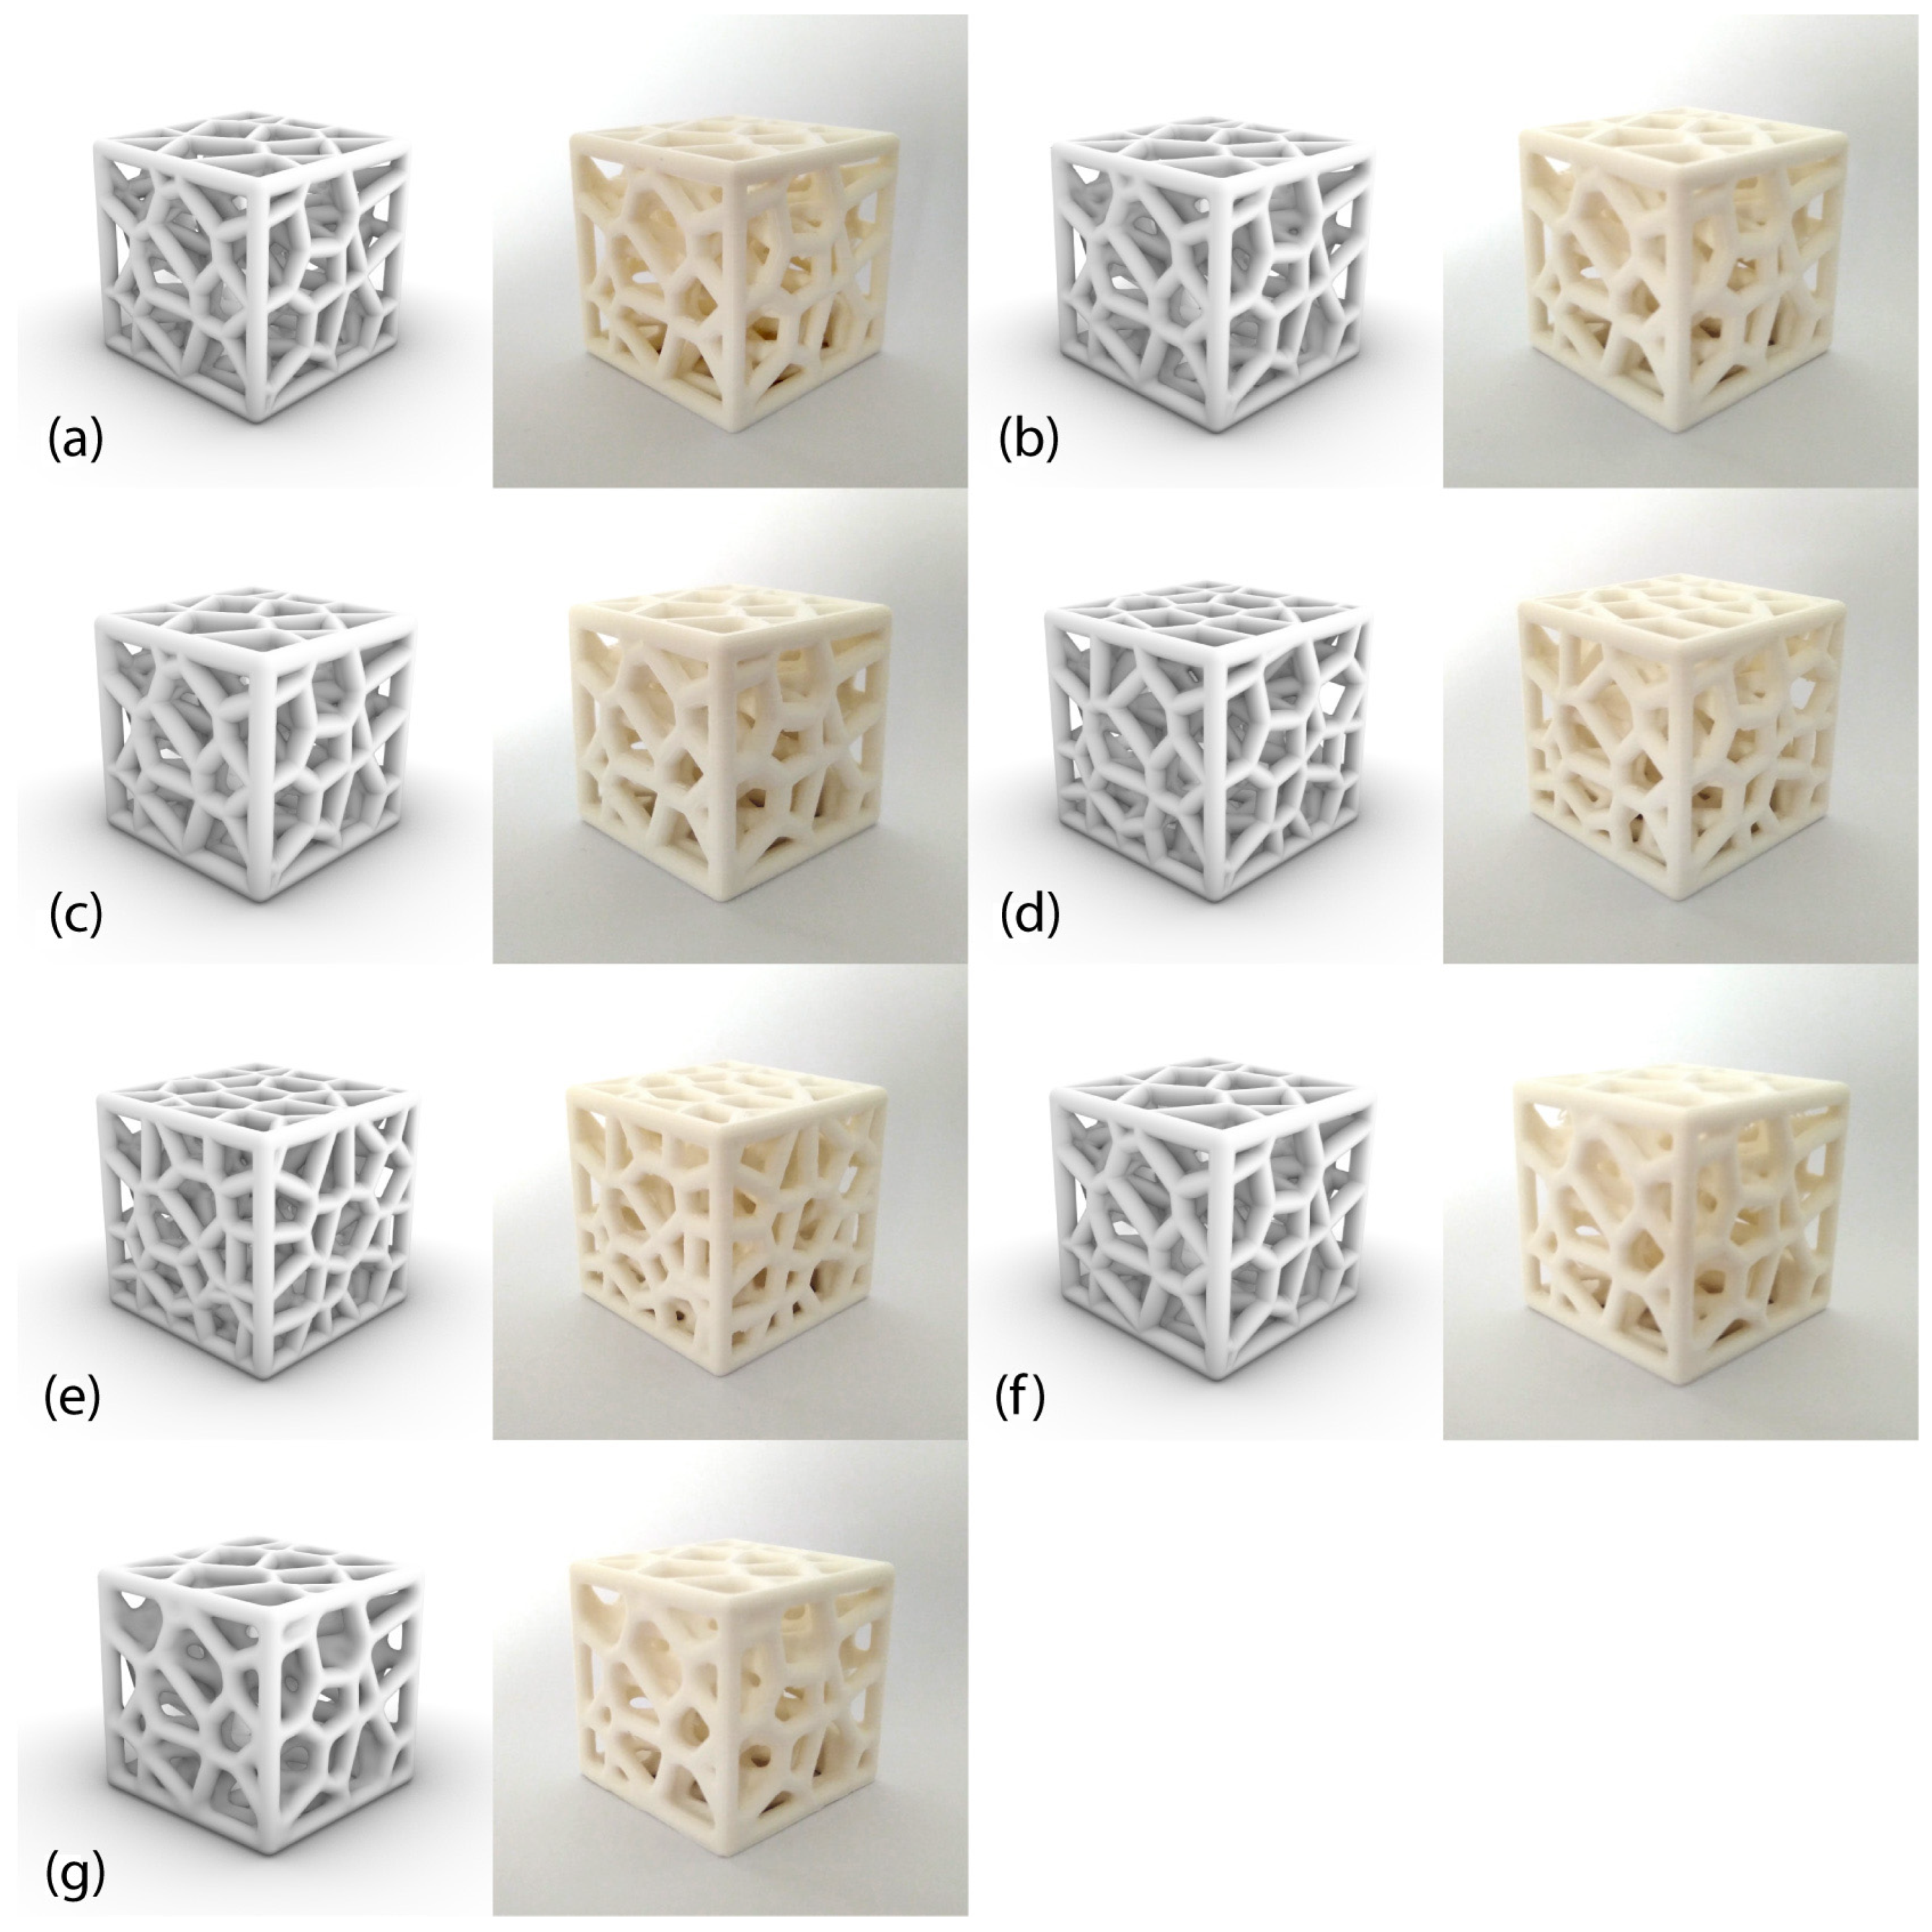
3.1. Characterization of the Biomimetic Voronoi Structure

In order to examine the mechanical response of the biomimetic Voronoi structures, it is necessary to first evaluate the impact of the changes in the geometric parameters of the structure on the overall relative density of the designed unit cells. It is also important to determine and compare the relative density of the 3D printed samples in relation to the designed ones and identify potential discrepancies. In Table 3, the designed relative density of the digital models is compared to the calculated values of the 3D printed physical models. First of all, it becomes obvious that the relative density of the structure can be increased either by increasing the thickness of the rods, or by raising the number of total nodes or by smoothing the geometry, as more material is added to it. More specifically, the relative density of the baseline Model 1 is 0.44 for the digital model and 0.4 ± 0.004 for the printed one, a discrepancy of 9.09%. In Models 2 and 3, the designed relative density is raised to 0.52 and 0.61, respectively, as the thickness of the rods is also raised to 2 mm and 2.2 mm. The calculated relative density of Model 2 is 0.48 ± 0.005, a difference of 7.69% and relative density of Model 3 is 0.56 ± 0.005, a difference of 8.2%. In Models 4 and 5, as the nodes are increased to 80 and 100, so increases the designed relative density to 0.53 and 0.60. Once again, a discrepancy of 7.55% and 8.33% can be observed in the calculated values which were determined to be 0.49 ± 0.03 and 0.55 ± 0.03, respectively. The designed relative density of Model 6 (smoothness 4) is 0.46 and the relative density of Model 7 (smoothness 7) is 0.5. The value for the printed Model 6 is 0.42 ± 0.08, a deviation of 8.7% and for the printed Model 7 is 0.46 ± 0.02, a discrepancy of 8%. It becomes evident that the difference in relative density between the digital and physical models is consistent among all specimens, a trend that can be attributed to limitations of the fused filament fabrication technology [48].

3.2. Compression Results of the Biomimetic Voronoi Structures

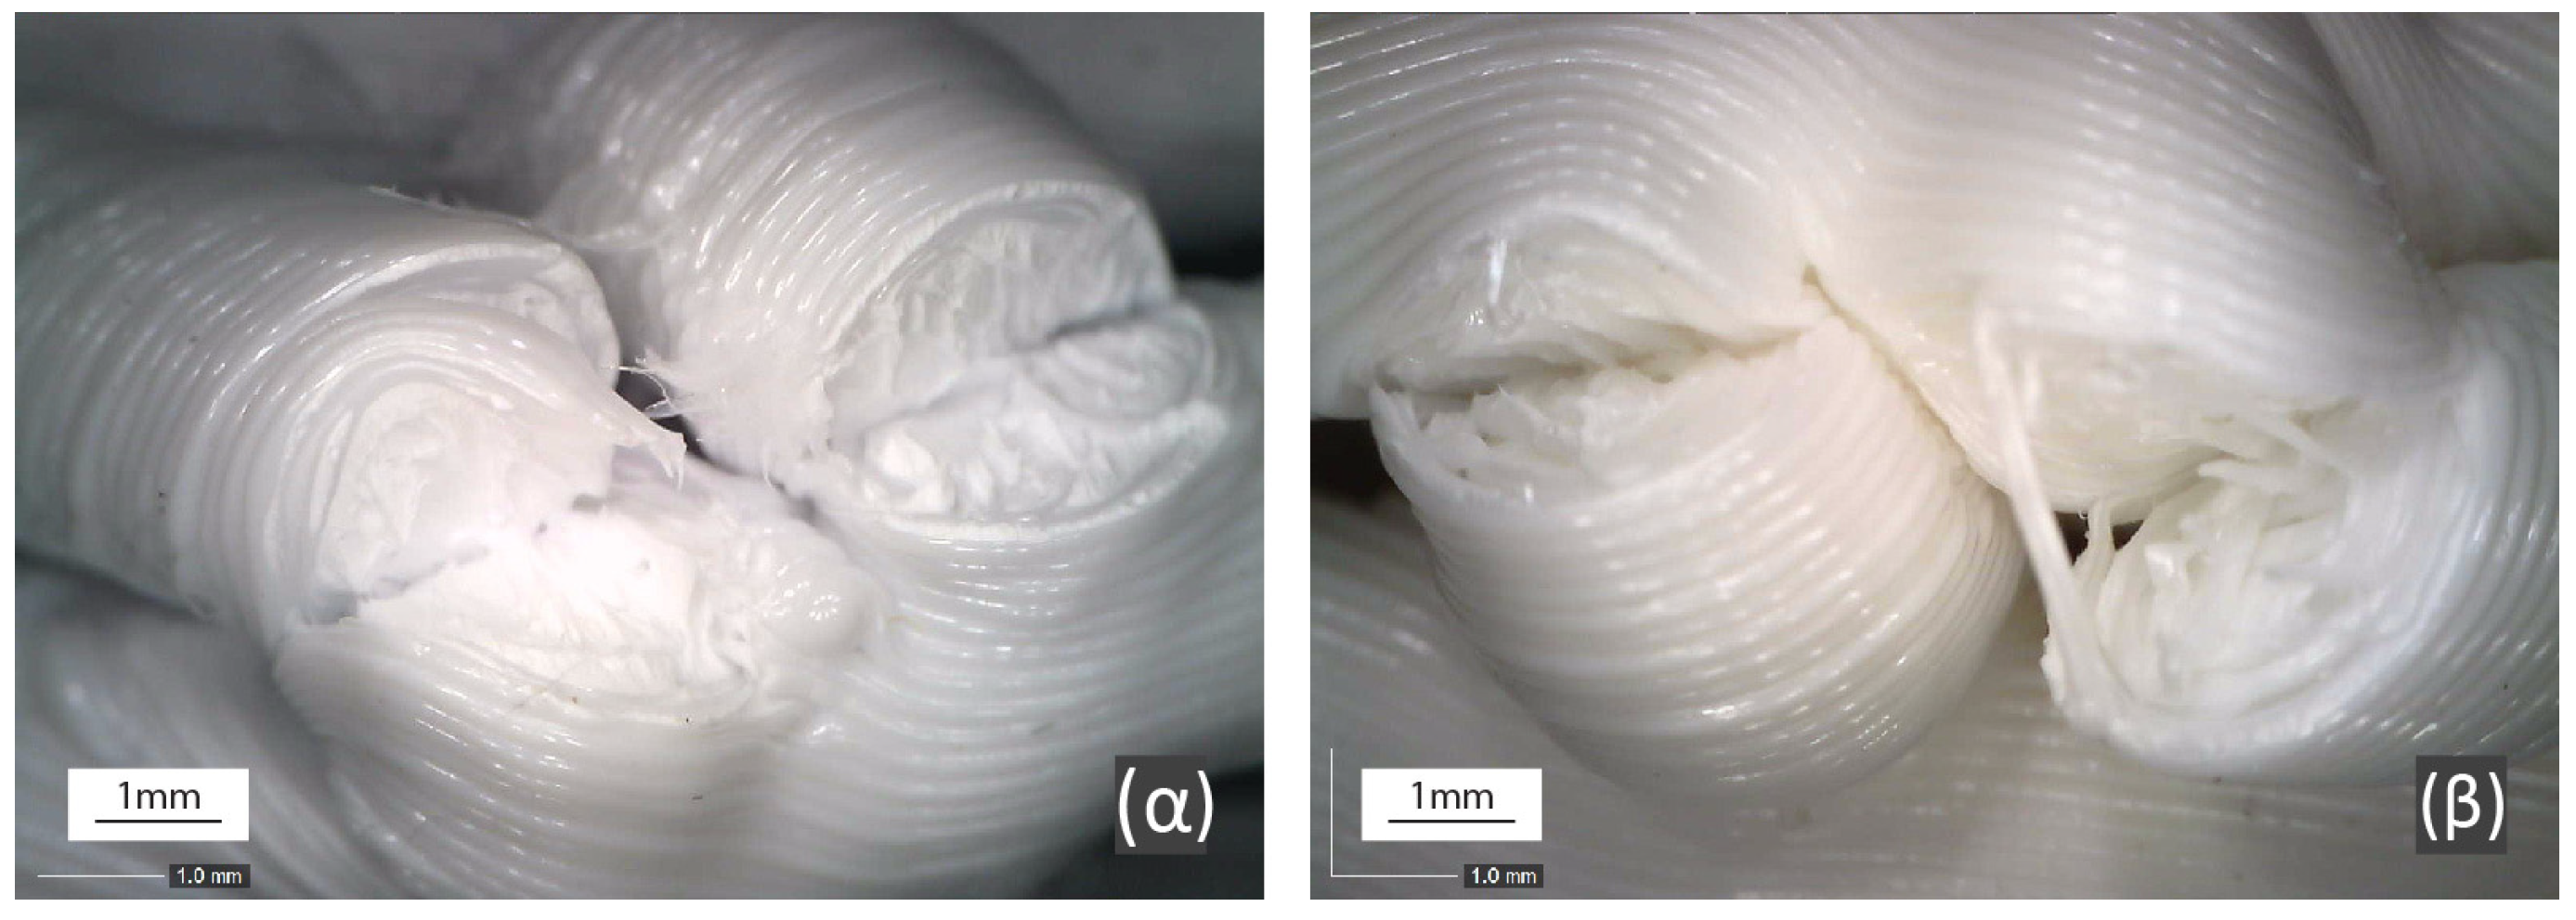
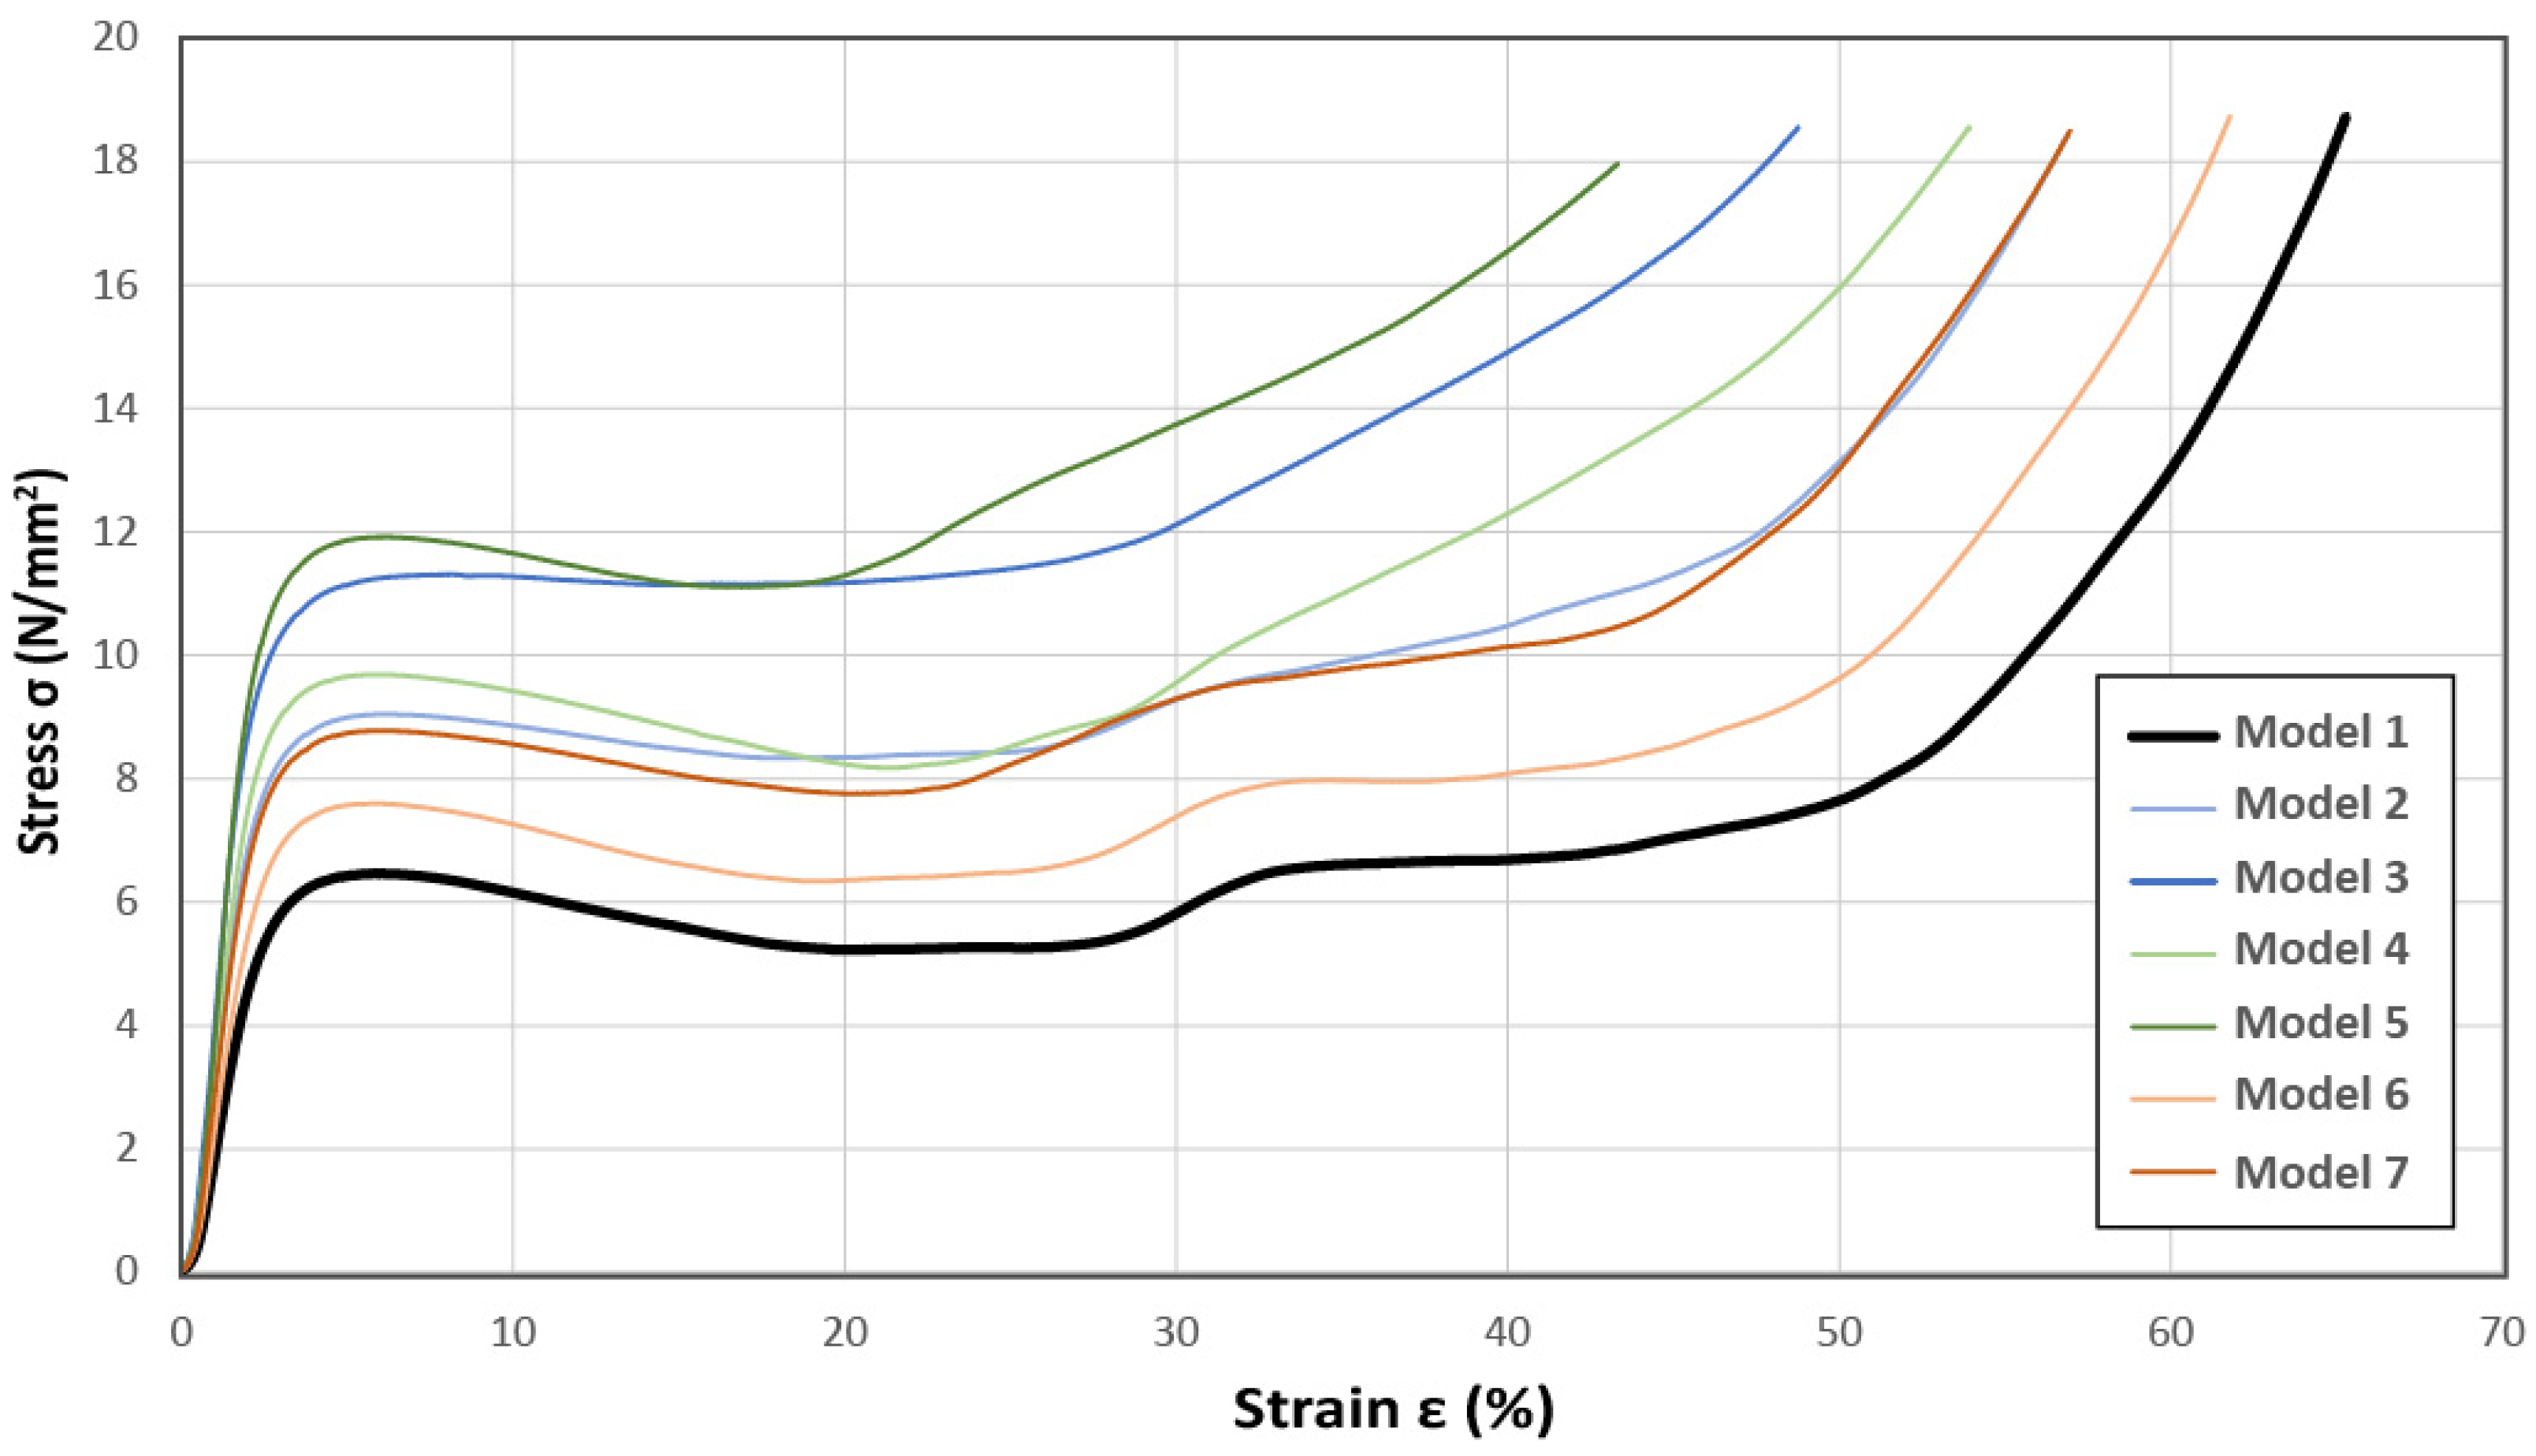
3.2.1. Compressive Behavior, Strength, and Modulus

The compression tests of the biomimetic Voronoi structure reveal a repeated behavior across all specimens which can be distinguished into three separate zones. The first is the elastic zone where the stress increases linearly. It is followed by a long plateau region where the rods of the structure progressively buckle and collapse while absorbing energy up until the densification strain. At this point, all the cells of the Voronoi have completely collapsed and the densification portion begins which is characterized by a sharp increase in stress as the bulk material is compressed. Figure 6 shows frames of the samples during compression. The second and third column of frames document the gradual failure of the rods in the plateau region. The failure mechanism of the rods can be traced to buckling and layer delamination, as shown in Figure 7, a behavior that is characteristic to 3D printed structures [17,32]. The fourth frames column highlights the fully compacted cells at the onset of the densification zone. It becomes evident that a recurring trend emerges across all models despite their geometric discrepancies that is in agreement with the typical mechanical behavior of porous structures as documented in relevant literature [17,32,34].
The above behavior can also be observed in the stress–strain curves of the models in Figure 8. The curves can be generally considered smooth, with minimal oscillations since the rods compact without fracturing catastrophically. Table 4 shows the mechanical properties of the biomimetic Voronoi models as calculated based on the data derived from the stress–strain curves. Several trends can be identified. As the thickness of the rods increase in Models 2 and 3, so does the strength of the structure. More specifically, the yield strength, σy, of Model 1 (baseline) is 6.26 ± 0.12 MPa, 8.80 ± 0.12 MPa for Model 2, and 10.84 ± 0.10 MPa for Model 3. The compressive modulus E of the porous structure is also improved as the rods become thicker. Model 1 has a compressive modulus of 310.29 ± 15.38 MPa, Model 2 has 443.64 ± 1.10 MPa, and Model 3 has 603.66 ± 13.93 MPa. It should be noted that the strength and modulus of the structures are significantly lower than those of PLA because of their porous geometry and anisotropic layer bonding in the rods [49].
The yield strength of Model 4 is 9.47 ± 0.13 MPa and the yield strength of Model 5 is 11.55 ± 0.40 MPa. Their compressive modulus is 498.31 ± 8.83 MPa and 658.07 ± 80.29 MPa, respectively. It can be concluded that as the number of nodes of a Voronoi structure is raised, so increases the structure’s strength and stiffness. Furthermore, Model 6 has a yield strength of 7.40 ± 0.06 MPa and compressive modulus of 381.33 ± 11.40 MPa, and Model 7 has 8.57 ± 0.45 MPa and 443.01 ± 14.37 MPa, respectively. It becomes obvious that when smoothing out the overall geometry, and essentially filleting its sharp edges, its strength and stiffness are improved, a principle that generally applies to design and engineering [50,51].

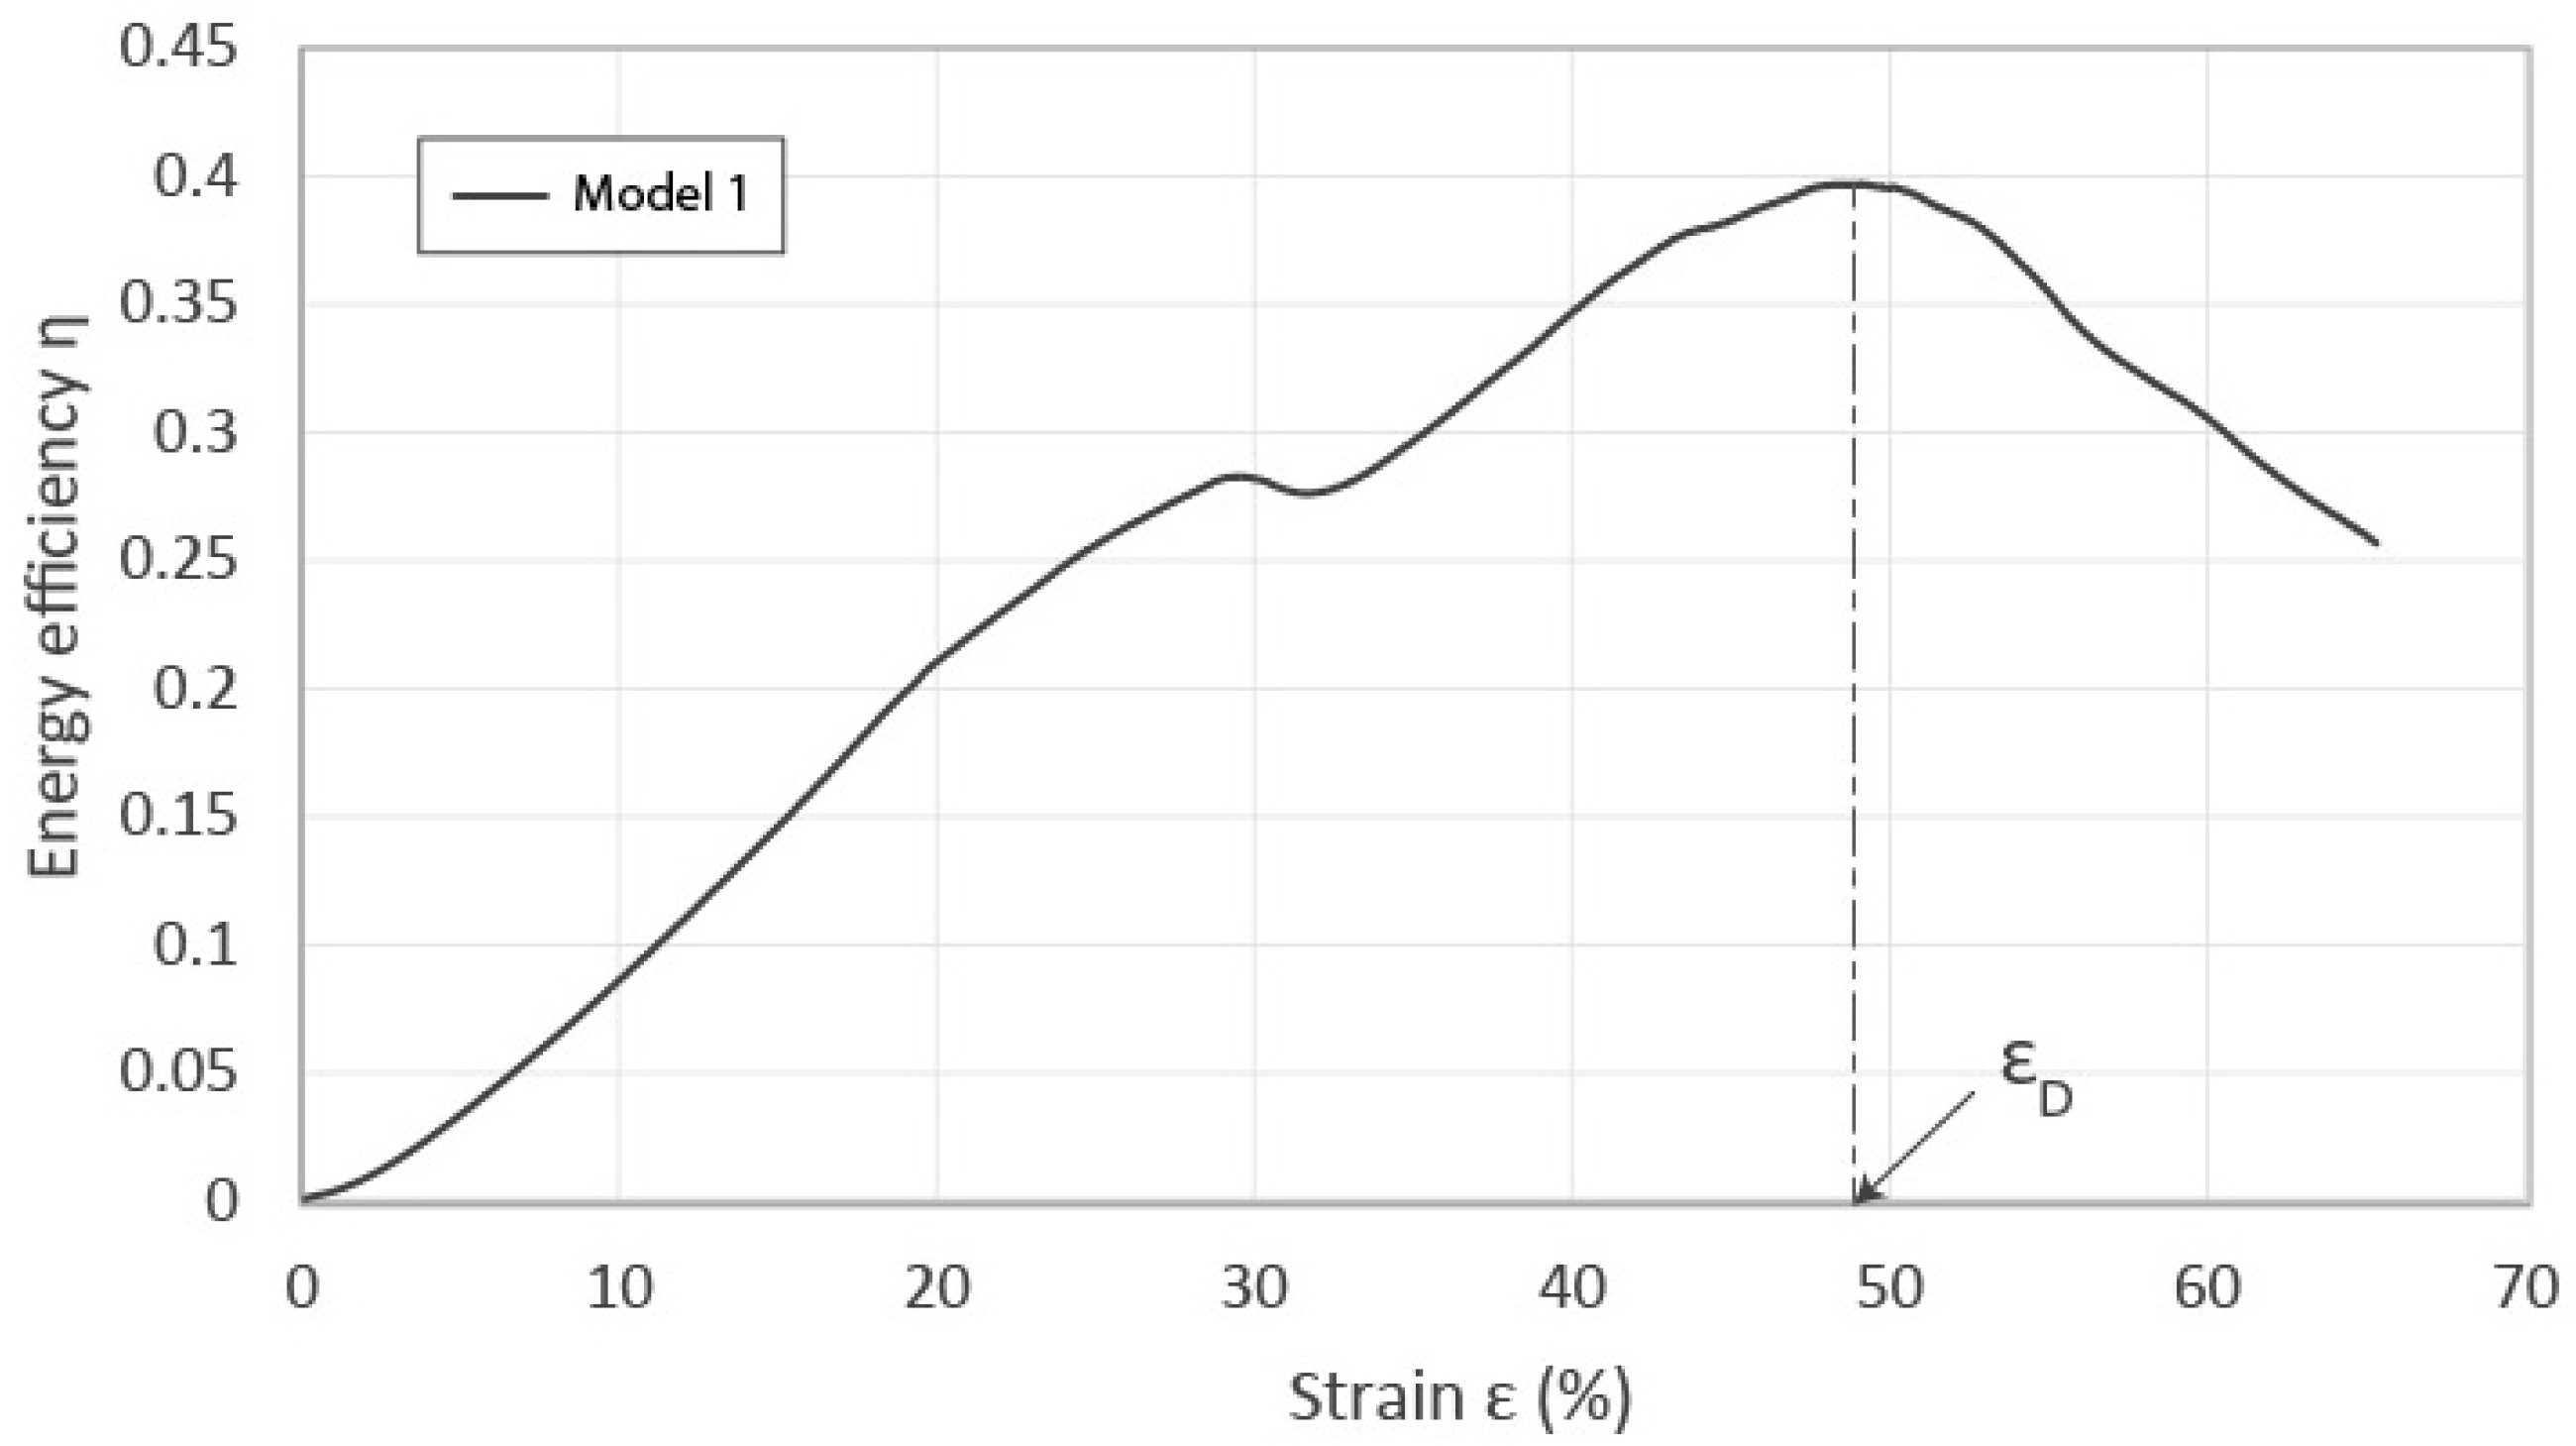
3.2.2. Densification Strain, Plateau Stress, and Energy Absorption

The densification strain, εD, of Model 1 is 49.39 ± 1.28%. Model 2 has a densification strain of 47.61 ± 1.14%, and Model 3, 47.43 ± 0.47%. The densification strain of Model 4 is 48.68 ± 1.30% and Model 5, 46.57 ± 0.42%. Models 6 and 7 have a densification strain of 48.88 ± 1.59% and 45.07 ± 0.83%, respectively. A reverse trend can be identified in these results. As the thickness of the rods, the number of nodes, and the smoothness of the structure are raised, the densification strain gradually decreases. This can be attributed to the additional PLA material that increases its overall compressible volume, allowing for smaller densification strain values and the observed decline. The plateau stress, σpl, of Model 1 is 6.15 ± 0.09 MPa, while the plateau stress for Models 2 and 3 were calculated at 9.38 ± 0.14 MPa and 12.64 ± 0.22 MPa, indicating a rising trend as the struts become thicker. A similar trend is noticed as the node count is raised according to the values of Models’ 4 and 5 plateau stress which are 10.31 ± 0.02 MPa and 13.55 ± 0.55 MPa, respectively. The same can be said for enhancing the smoothness of the structure, since Models 6 and 7 demonstrate plateau stresses of 7.42 ± 0.08 MPa and 8.94 ± 0.41 MPa, respectively. A correlation between the strength of the structure and plateau stress can be traced. Thicker rods, more nodes, and smoother edges increase not only the compressive strength of the Voronoi structure but also the sustained stress at which the structure progressively collapses up until the densification point is reached.
The baseline Model 1 has an energy capacity Wv of 2.94 ± 0.11 MJ/m3 and specific energy capacity Wm of 6.01 ± 0.30 KJ/kg. The calculated energy capacity and specific energy capacity for Model 2 are 4.32 ± 0.14 MJ/m3 and 7.26 ± 0.31 KJ/kg and Model 3 are 5.78 ± 0.09 MJ/m3 and 8.38 ± 0.20 KJ/kg, respectively. Similarly, to yield strength and plateau stress, the energy absorption capability of the structure increases as the radius of the rods is raised. Model 4 is characterized by an energy capacity of 4.85 ± 0.14 MJ/m3 and a specific capacity of 7.98 ± 0.19 KJ/kg while Model 5 shows 6.07 ± 0.19 MJ/m3 and 8.85 ± 0.27 KJ/kg, respectively. Thus, it becomes obvious that the Voronoi structure can absorb more energy when the count of its nodes is increased. Lastly, the capacities of Models 6 and 7 are 3.51 ± 0.14 MJ/m3 and 3.89 ± 0.19 MJ/m3 and their specific capacities are 6.75 ± 0.37 KJ/kg and 6.85 ± 0.31 KJ/kg; therefore, smoother Voronoi geometries have superior energy absorption. Overall, enhanced geometric parameters result in higher energy dissipation through rod buckling and collapse at higher constant stress rates.

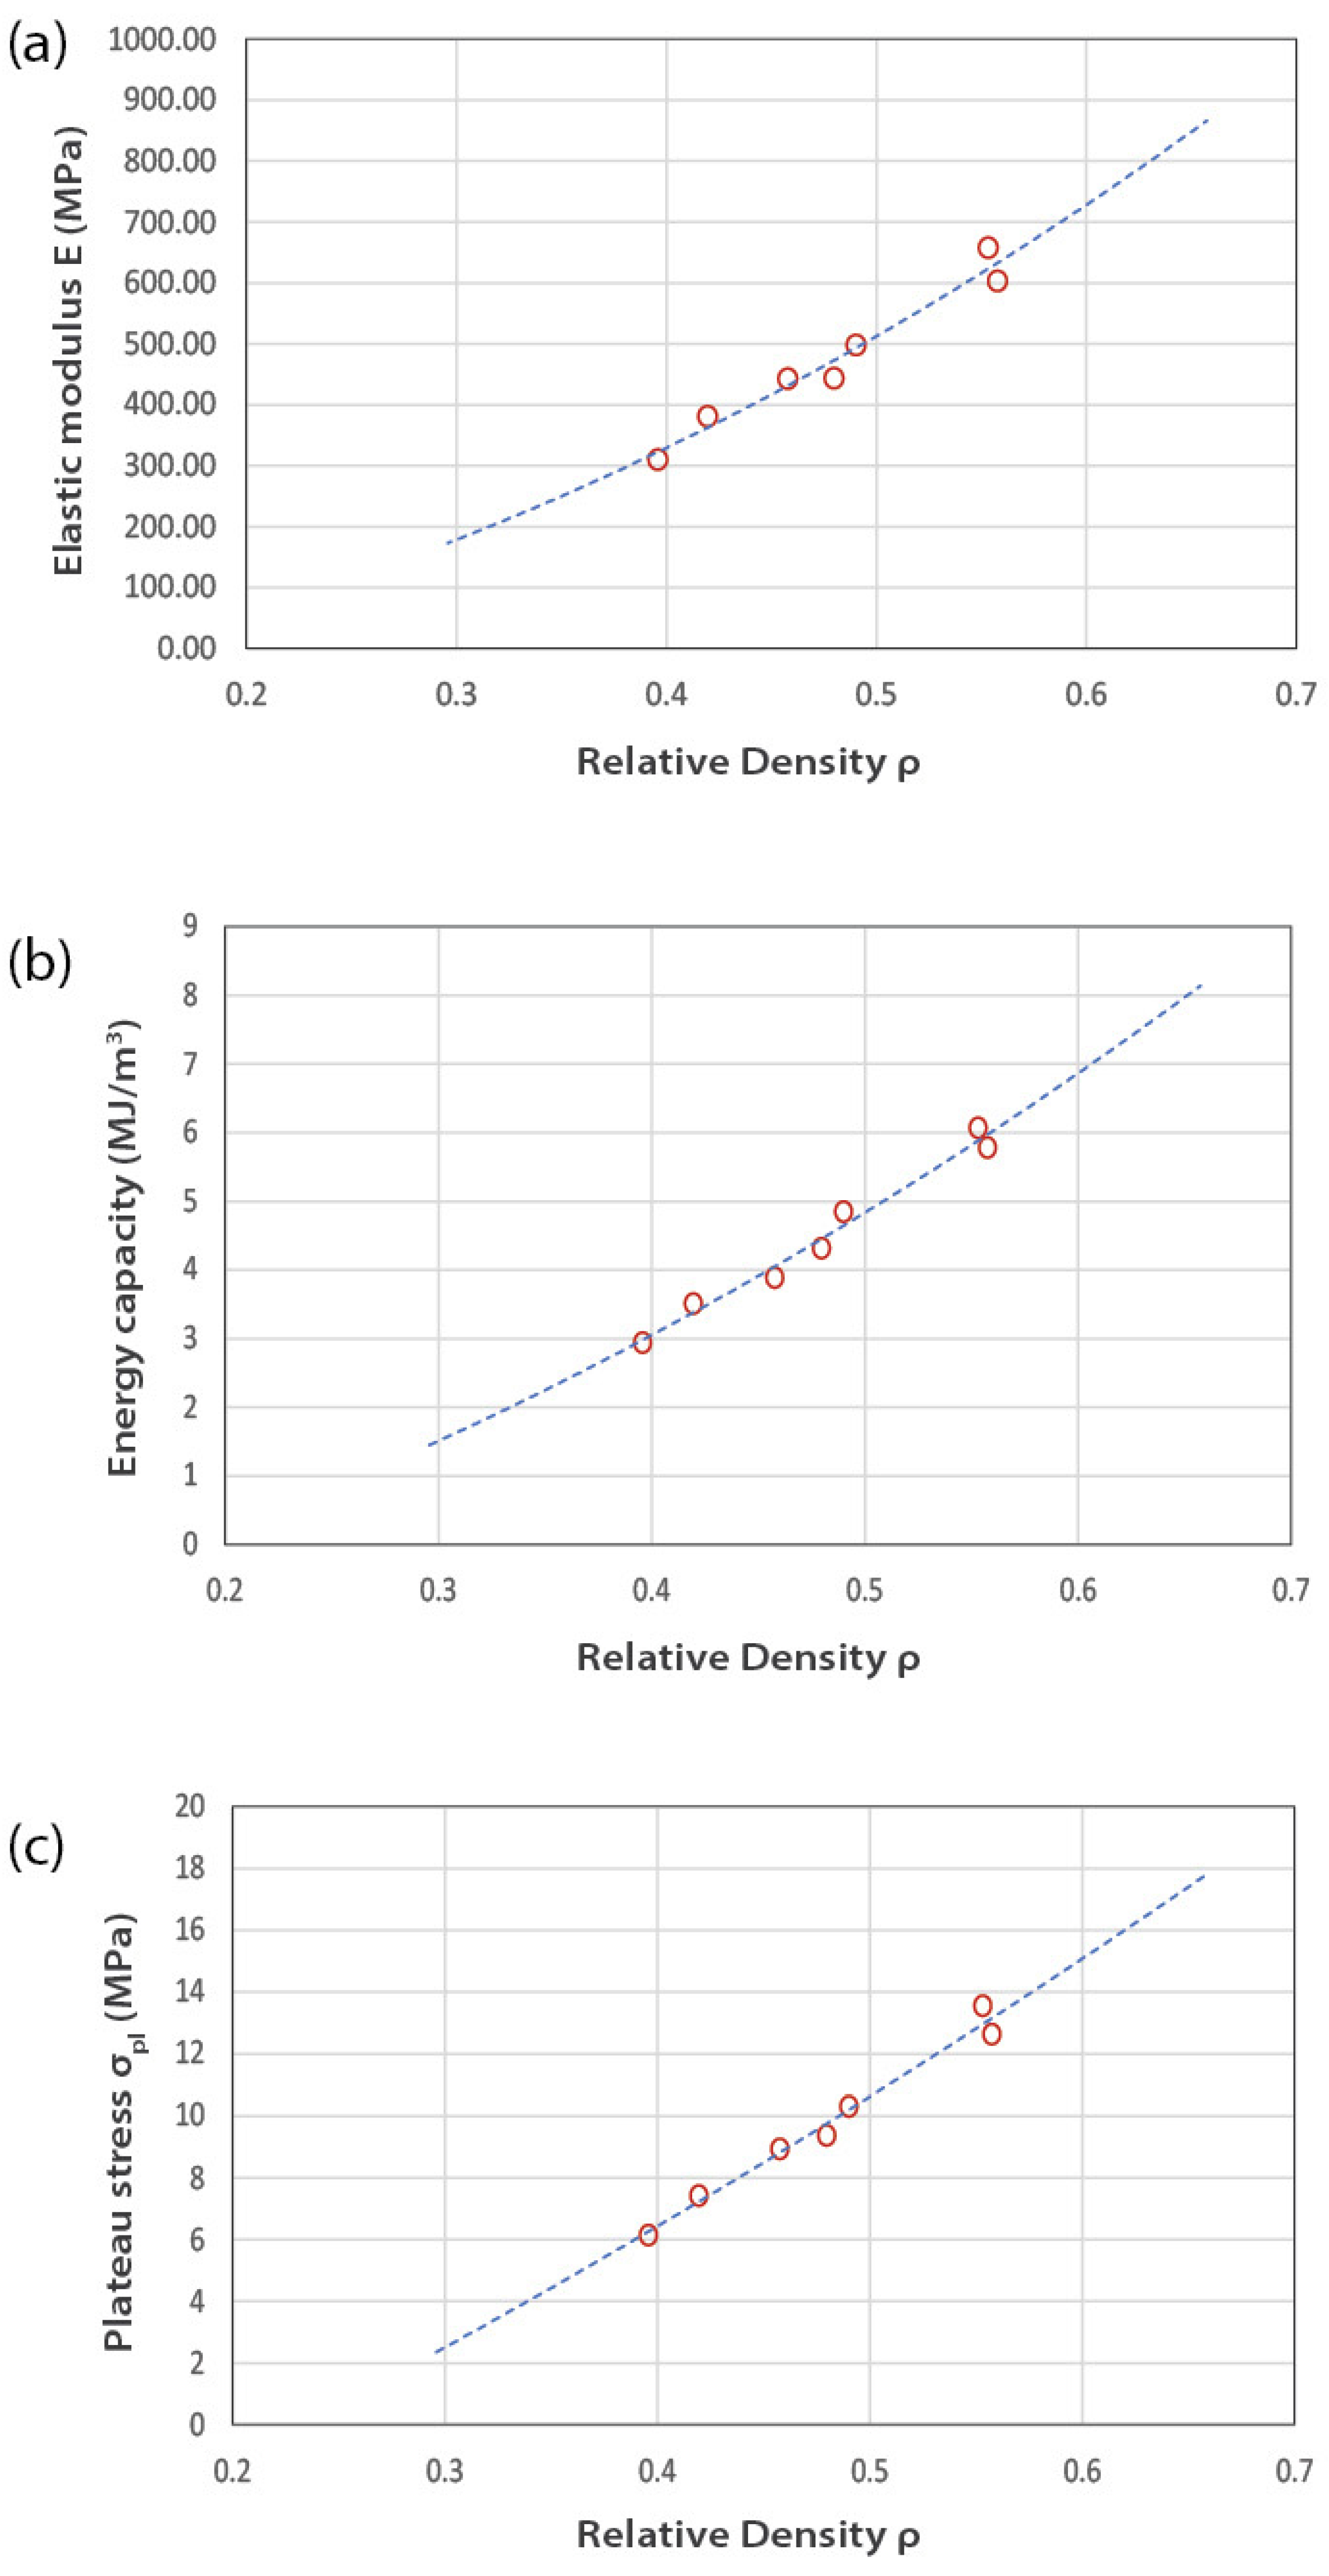
3.2.3. Correlation of Mechanical Properties to Relative Density

When the modulus of the different samples is plotted against their relative density, a second-degree polynomial correlation is revealed (R2 = 0.9596), as illustrated in Figure 9a. The same relation can be observed when the energy absorption capacity (R2 = 0.9783) of the samples is plotted against their respective relative densities, as shown in Figure 9b. A second-degree polynomial expression (R2 = 0.9804) also describes the relation between plateau stress and relative density in Figure 9c. This trend can be translated as an accelerated increase in the mechanical properties of the structure as more material is added to it and its relative density is raised. It becomes obvious that such an improvement can be achieved either by increasing the thickness of the rods, or by raising the number of the nodes, or by smoothing the geometry, depending on the design requirements or technical and fabrication constraints.

3.3. FEA Validation of Experimental Results

The verified material model from the FEA-supported nanoindentation method [5] has been introduced into the FE model to assess the compression performance of the Voronoi structures. Furthermore, a computational model was utilized to assess the stress response of the 3D printed specimens when subjected to compression. A thorough explicit dynamic analysis was carried out to precisely replicate the mechanical behavior of the lattice structures. This was crucial to accurately represent their substantial deformations and material behavior characterized by a bi-linear pattern. A study has been conducted to confirm that the results were consistent regardless of the mesh density, finding that stress convergence was obtained with approximately 130,000 elements in each model used for verification. The Voronoi structures were subjected to a stepwise vertical velocity applied to the top plate, while the reaction force was measured at the bottom with a fixed boundary condition. The experimental results were used to obtain actual values of the vertical displacement. The force values were determined from the deformation and compared to the experimental results.
The meshing was produced with hexahedral elements for the top compression plate and tetrahedral elements for more complex geometries. Figure 10a displays the force-displacement behavior obtained through finite element analysis (FEA), which demonstrates good agreement between the force-displacement data generated by the FEA simulations and the experimental compression tests for the 3D printed specimens. However, at larger displacements, the experimental curves deviate more from the FEA simulation because of the greater influence of 3D printing defects on the bending response. The material model parameters were analyzed to minimize the differences between the simulated and experimental force-displacement data. Thus, the deformation and equivalent von Mises stress distribution results for the 3D printed Voronoi lattice structures under compressive load, presented in Figure 10b,c, may accurately identify the regions of high stress in the structures. In contrast to previous research [52,53,54,55,56,57,58,59,60,61,62], lattice structures similar to those in our current study exhibited improved physical and mechanical characteristics, particularly in terms of a more significant enhancement in compressive strength and energy absorption. Based on the mechanical test results, it can be concluded that using computationally generated (FEA) compression test data, combined with actual measurements, could be an effective method for characterizing the mechanical deformation behavior of 3D printed Voronoi configurations.

4. Conclusions

The technical evaluation stage of a Voronoi structure, inspired by the shell of the sea urchin Paracentrotus lividus, has been the focus of the present paper. The stage entails 3D printing the structure followed by mechanical characterization through testing of the physical samples combined with finite element analysis. It is part of a novel biomimetic design strategy that consists of three separate stages: “Research and Analysis”, “Abstraction and Emulation”, and “Technical Evaluation” that are interconnected via bi-directional loops of feedback.
A parametric algorithm was utilized for the generation of seven different structures with progressive changes in the geometric parameters of rod thickness, node count, and edge smoothness. All the physical specimens were printed with the aid of FFF technology and commercial PLA filament. A consistent divergence was observed between the designed and fabricated relative density of the models which can be attributed to limitations of the 3D printing technology. Compression testing of the physical specimens reveals a common behavior, characterized by an initial linear elastic zone, followed by a long plateau region of progressive collapse of the structure until the densification point is reached in which the cellular structure has completely collapsed, and the bulk material starts to compress. The yield strength and Elastic modulus of the structure increases as the rod thickness, node count, and smoothness are increased. The plateau stress is also raised as the geometric parameters of the structure are enhanced. However, a reverse trend is detected in the densification strain which can be explained by the additional PLA material that increases the overall compressible volume of the material.
The energy capacity and specific energy capacity of the biomimetic structure is also improved as the rod thickness, node count, and smoothness are increased. A second-degree polynomial relation between the Elastic modulus, plateau stress, and energy capacity of the structure and its relative density is detected which is due to accelerated enhancement of its mechanical properties as more material is added. The present research has shown that the relative density and, subsequently, the material properties of a biomimetic Voronoi structure can be enhanced, with great accuracy and reproducibility, through diverse design strategies, either by increasing the thickness of the rods, raising the node count, or by smoothing out sharp edges, depending on the application or design requirements. The conducted finite element analysis validates the above results through good agreement between the force–displacement data generated by the simulations and the experimental compression tests.
Potential applications of the biomimetic Voronoi structure include lightweight structural materials in architectural applications, protective gear and accessories like helmets, or automotive parts. Further research includes the implementation and validation of the biomimetic strategy of analysis, emulation, and technical evaluation in other cases of biological shells to development a series of biomimetic solutions that could serve as the basis of a comprehensive database of biomimetic design concepts.

Author Contributions

Conceptualization, A.E. and I.S.; methodology, A.E., I.S., K.T. and D.T.; software, A.E., I.S. and K.T.; investigation, A.E. and E.K.T.; visualization, A.E.; writing—original draft preparation, A.E. and K.T.; supervision, I.S. and D.T.; funding acquisition, A.E.; validation, E.K.T. formal analysis, A.E. and E.K.T.; data curation, A.E., E.K.T. and K.T. writing—review and editing, I.S., A.E., K.T. and D.T. project administration, I.S. All authors have read and agreed to the published version of the manuscript.

Funding

The research is conducted in the operating framework of the Center of Research Innovation and Excellence of University of Thessaly (Invitation to submit applications for the grant of scholarships to doctoral candidates of University of Thessaly) and was funded by the Special Account of Research Grants of University of Thessaly.

Data Availability Statement

Not applicable.

Conflicts of Interest

The authors declare no conflict of interest.

References

  1. Fantini, M.; Curto, M.; De Crescenzio, F. A Method to Design Biomimetic Scaffolds for Bone Tissue Engineering Based on Voronoi Lattices. Virtual Phys. Prototyp. 2016, 11, 77–90. [Google Scholar] [CrossRef]
  2. Grun, T.B.; Nebelsick, J.H. Structural Design of the Echinoid’s Trabecular System. PLoS ONE 2018, 13, e0204432. [Google Scholar] [CrossRef] [PubMed]
  3. Department of Mathematics, Physics and Descriptive Geometry, Faculty of Civil Engineering, University of Belgrade; Čučaković, A.; Jović, B.; Komnenov, M.; Department of Landscape Architecture and Horticulture, Faculty of Forestry. Biomimetic Geometry Approach to Generative Design. Period. Polytech. Archit. 2016, 47, 70–74. [Google Scholar] [CrossRef]
  4. Silva, E.C.N.; Walters, M.C.; Paulino, G.H. Modeling Bamboo as a Functionally Graded Material: Lessons for the Analysis of Affordable Materials. J. Mater. Sci. 2006, 41, 6991–7004. [Google Scholar] [CrossRef]
  5. Efstathiadis, A.; Symeonidou, I.; Tsongas, K.; Tzimtzimis, E.K.; Tzetzis, D. Parametric Design and Mechanical Characterization of 3D-Printed PLA Composite Biomimetic Voronoi Lattices Inspired by the Stereom of Sea Urchins. J. Compos. Sci. 2022, 7, 3. [Google Scholar] [CrossRef]
  6. Vermeij, G.J. A Natural History of Shells; Princeton University Press: Princeton, NJ, USA, 1993; ISBN 978-0-691-08596-8. [Google Scholar]
  7. Grunenfelder, L.K.; Suksangpanya, N.; Salinas, C.; Milliron, G.; Yaraghi, N.; Herrera, S.; Evans-Lutterodt, K.; Nutt, S.R.; Zavattieri, P.; Kisailus, D. Bio-Inspired Impact-Resistant Composites. Acta Biomater. 2014, 10, 3997–4008. [Google Scholar] [CrossRef]
  8. Smith, A.B. Stereom Microstructure of the Echinoid Test. Spec. Pap. Palaeontol. 1980, 25, 1–81. [Google Scholar]
  9. Compton, B.G.; Lewis, J.A. 3D-Printing of Lightweight Cellular Composites. Adv. Mater. 2014, 26, 5930–5935. [Google Scholar] [CrossRef]
  10. Wang, S.; Zheng, Z.; Zhu, C.; Ding, Y.; Yu, J. Crushing and Densification of Rapid Prototyping Polylactide Foam: Meso-Structural Effect and a Statistical Constitutive Model. Mech. Mater. 2018, 127, 65–76. [Google Scholar] [CrossRef]
  11. Pelanconi, M.; Ortona, A. Nature-Inspired, Ultra-Lightweight Structures with Gyroid Cores Produced by Additive Manufacturing and Reinforced by Unidirectional Carbon Fiber Ribs. Materials 2019, 12, 4134. [Google Scholar] [CrossRef]
  12. Amin Yavari, S.; Ahmadi, S.M.; Wauthle, R.; Pouran, B.; Schrooten, J.; Weinans, H.; Zadpoor, A.A. Relationship between Unit Cell Type and Porosity and the Fatigue Behavior of Selective Laser Melted Meta-Biomaterials. J. Mech. Behav. Biomed. Mater. 2015, 43, 91–100. [Google Scholar] [CrossRef] [PubMed]
  13. Ling, C.; Cernicchi, A.; Gilchrist, M.D.; Cardiff, P. Mechanical Behaviour of Additively-Manufactured Polymeric Octet-Truss Lattice Structures under Quasi-Static and Dynamic Compressive Loading. Mater. Des. 2019, 162, 106–118. [Google Scholar] [CrossRef]
  14. Li, K.; Gao, X.-L.; Subhash, G. Effects of Cell Shape and Strut Cross-Sectional Area Variations on the Elastic Properties of Three-Dimensional Open-Cell Foams. J. Mech. Phys. Solids 2006, 54, 783–806. [Google Scholar] [CrossRef]
  15. Fantini, M.; Curto, M. Interactive Design and Manufacturing of a Voronoi-Based Biomimetic Bone Scaffold for Morphological Characterization. Int. J. Interact. Des. Manuf. IJIDeM 2018, 12, 585–596. [Google Scholar] [CrossRef]
  16. Banhart, J. Aluminium Foams for Lighter Vehicles. Int. J. Veh. Des. 2005, 37, 114. [Google Scholar] [CrossRef]
  17. Ben Ali, N.; Khlif, M.; Hammami, D.; Bradai, C. Mechanical and Morphological Characterization of Spherical Cell Porous Structures Manufactured Using FDM Process. Eng. Fract. Mech. 2019, 216, 106527. [Google Scholar] [CrossRef]
  18. Murakami, T.; Ohara, K.; Narushima, T.; Ouchi, C. Development of a New Method for Manufacturing Iron Foam Using Gases Generated by Reduction of Iron Oxide. Mater. Trans. 2007, 48, 2937–2944. [Google Scholar] [CrossRef]
  19. Wang, Y.; Shen, Y.; Wang, Z.; Yang, J.; Liu, N.; Huang, W. Development of Highly Porous Titanium Scaffolds by Selective Laser Melting. Mater. Lett. 2010, 64, 674–676. [Google Scholar] [CrossRef]
  20. Malewska, E.; Prociak, A. Porous Polyurethane-Polystyrene Composites Produced in a Co-Expansion Process. Arab. J. Chem. 2020, 13, 37–44. [Google Scholar] [CrossRef]
  21. Utsunomiya, T.; Yamaguchi, R.; Hangai, Y.; Kuwazuru, O.; Yoshikawa, N. Estimation of Plateau Stress of Porous Aluminum Based on Mean Stress on Maximum-Porosity Cross Section. Mater. Trans. 2013, 54, 1182–1186. [Google Scholar] [CrossRef]
  22. Jung, A.; Diebels, S.; Koblischka-Veneva, A.; Schmauch, J.; Barnoush, A.; Koblischka, M.R. Microstructural Analysis of Electrochemical Coated Open-Cell Metal Foams by EBSD and Nanoindentation: Microstructural Analysis of Electrochemical Coated Open-Cell Metal Foams. Adv. Eng. Mater. 2014, 16, 15–20. [Google Scholar] [CrossRef]
  23. Degischer, H.-P.; Kriszt, B. Handbook of Cellular Metals: Production, Processing, Applications, 1st ed.; Wiley: Hoboken, NJ, USA, 2002; ISBN 978-3-527-30339-7. [Google Scholar]
  24. Agrafiotis, C. Deposition of Nanophase Doped-Ceria Systems on Ceramic Honeycombs for Automotive Catalytic Applications. Solid State Ion. 2000, 136–137, 1301–1306. [Google Scholar] [CrossRef]
  25. Wang, X.; Xu, S.; Zhou, S.; Xu, W.; Leary, M.; Choong, P.; Qian, M.; Brandt, M.; Xie, Y.M. Topological Design and Additive Manufacturing of Porous Metals for Bone Scaffolds and Orthopaedic Implants: A Review. Biomaterials 2016, 83, 127–141. [Google Scholar] [CrossRef] [PubMed]
  26. Bates, S.R.G.; Farrow, I.R.; Trask, R.S. 3D Printed Polyurethane Honeycombs for Repeated Tailored Energy Absorption. Mater. Des. 2016, 112, 172–183. [Google Scholar] [CrossRef]
  27. Yang, Y.; Song, X.; Li, X.; Chen, Z.; Zhou, C.; Zhou, Q.; Chen, Y. Recent Progress in Biomimetic Additive Manufacturing Technology: From Materials to Functional Structures. Adv. Mater. 2018, 30, 1706539. [Google Scholar] [CrossRef] [PubMed]
  28. Song, X.; Tetik, H.; Jirakittsonthon, T.; Parandoush, P.; Yang, G.; Lee, D.; Ryu, S.; Lei, S.; Weiss, M.L.; Lin, D. Biomimetic 3D Printing of Hierarchical and Interconnected Porous Hydroxyapatite Structures with High Mechanical Strength for Bone Cell Culture. Adv. Eng. Mater. 2019, 21, 1800678. [Google Scholar] [CrossRef]
  29. Gong, P.; Zhai, S.; Lee, R.; Zhao, C.; Buahom, P.; Li, G.; Park, C.B. Environmentally Friendly Polylactic Acid-Based Thermal Insulation Foams Blown with Supercritical CO2. Ind. Eng. Chem. Res. 2018, 57, 5464–5471. [Google Scholar] [CrossRef]
  30. Lehmhus, D.; Vesenjak, M.; Schampheleire, S.; Fiedler, T. From Stochastic Foam to Designed Structure: Balancing Cost and Performance of Cellular Metals. Materials 2017, 10, 922. [Google Scholar] [CrossRef]
  31. Maiti, A.; Small, W.; Lewicki, J.P.; Weisgraber, T.H.; Duoss, E.B.; Chinn, S.C.; Pearson, M.A.; Spadaccini, C.M.; Maxwell, R.S.; Wilson, T.S. 3D Printed Cellular Solid Outperforms Traditional Stochastic Foam in Long-Term Mechanical Response. Sci. Rep. 2016, 6, 24871. [Google Scholar] [CrossRef]
  32. Wang, S.; Ding, Y.; Yu, F.; Zheng, Z.; Wang, Y. Crushing Behavior and Deformation Mechanism of Additively Manufactured Voronoi-Based Random Open-Cell Polymer Foams. Mater. Today Commun. 2020, 25, 101406. [Google Scholar] [CrossRef]
  33. Tang, L.; Shi, X.; Zhang, L.; Liu, Z.; Jiang, Z.; Liu, Y. Effects of Statistics of Cell’s Size and Shape Irregularity on Mechanical Properties of 2D and 3D Voronoi Foams. Acta Mech. 2014, 225, 1361–1372. [Google Scholar] [CrossRef]
  34. Almonti, D.; Baiocco, G.; Tagliaferri, V.; Ucciardello, N. Design and Mechanical Characterization of Voronoi Structures Manufactured by Indirect Additive Manufacturing. Materials 2020, 13, 1085. [Google Scholar] [CrossRef] [PubMed]
  35. Gibson, L.J.; Ashby, M.F. Cellular Solids: Structure and Properties, 2nd ed.; Cambridge University Press: Cambridge, UK, 1997; ISBN 978-0-521-49911-8. [Google Scholar]
  36. Gaitanaros, S.; Kyriakides, S. On the Effect of Relative Density on the Crushing and Energy Absorption of Open-Cell Foams under Impact. Int. J. Impact Eng. 2015, 82, 3–13. [Google Scholar] [CrossRef]
  37. Siegkas, P. A Computational Geometry Generation Method for Creating 3D Printed Composites and Porous Structures. Materials 2021, 14, 2507. [Google Scholar] [CrossRef] [PubMed]
  38. Nordin, A.; Hopf, A.; Motte, D. Generative Design Systems for the Industrial Design of Functional Mass Producible Natural-Mathematical Forms. In Proceedings of the 5th International Congress of International Association of Societies of Design Research, IASDR, Tokyo, Japan, 26–30 August 2013; pp. 2931–2941. [Google Scholar]
  39. Aish, R.; Woodbury, R. Multi-Level Interaction in Parametric Design. In Smart Graphics; Butz, A., Fisher, B., Krüger, A., Olivier, P., Eds.; Lecture Notes in Computer Science; Springer: Berlin/Heidelberg, Germany, 2005; Volume 3638, pp. 151–162. ISBN 978-3-540-28179-5. [Google Scholar]
  40. Bertacchini, F.; Bilotta, E.; Demarco, F.; Pantano, P.; Scuro, C. Multi-Objective Optimization and Rapid Prototyping for Jewelry Industry: Methodologies and Case Studies. Int. J. Adv. Manuf. Technol. 2021, 112, 2943–2959. [Google Scholar] [CrossRef]
  41. Bose, S.; Vahabzadeh, S.; Bandyopadhyay, A. Bone Tissue Engineering Using 3D Printing. Mater. Today 2013, 16, 496–504. [Google Scholar] [CrossRef]
  42. Sharma, P.; Pandey, P.M. Morphological and Mechanical Characterization of Topologically Ordered Open Cell Porous Iron Foam Fabricated Using 3D Printing and Pressureless Microwave Sintering. Mater. Des. 2018, 160, 442–454. [Google Scholar] [CrossRef]
  43. Zein, I.; Hutmacher, D.W.; Tan, K.C.; Teoh, S.H. Fused Deposition Modeling of Novel Scaffold Architectures for Tissue Engineering Applications. Biomaterials 2002, 23, 1169–1185. [Google Scholar] [CrossRef]
  44. Anitha, R.; Arunachalam, S.; Radhakrishnan, P. Critical Parameters Influencing the Quality of Prototypes in Fused Deposition Modelling. J. Mater. Process. Technol. 2001, 118, 385–388. [Google Scholar] [CrossRef]
  45. Tan, P.J.; Reid, S.R.; Harrigan, J.J.; Zou, Z.; Li, S. Dynamic Compressive Strength Properties of Aluminium Foams. Part I—Exp. Data Observations. J. Mech. Phys. Solids 2005, 53, 2174–2205. [Google Scholar] [CrossRef]
  46. Li, Q.M.; Magkiriadis, I.; Harrigan, J.J. Compressive Strain at the Onset of Densification of Cellular Solids. J. Cell. Plast. 2006, 42, 371–392. [Google Scholar] [CrossRef]
  47. Ren, H.; Shen, H.; Ning, J. Effect of Internal Microstructure Distribution on Quasi-Static Compression Behavior and Energy Absorption of Hollow Truss Structures. Materials 2020, 13, 5094. [Google Scholar] [CrossRef]
  48. Vicente, M.F.; Canyada, M.; Conejero, A. Identifying Limitations for Design for Manufacturing with Desktop FFF 3D Printers. Int. J. Rapid Manuf. 2015, 5, 116. [Google Scholar] [CrossRef]
  49. Pinto, V.C.; Ramos, T.; Alves, S.; Xavier, J.; Tavares, P.; Moreira, P.M.G.P.; Guedes, R.M. Comparative Failure Analysis of PLA, PLA/GNP and PLA/CNT-COOH Biodegradable Nanocomposites Thin Films. Procedia Eng. 2015, 114, 635–642. [Google Scholar] [CrossRef]
  50. Xing, J.; Qie, L. Fillet Design in Topology Optimization. In Proceedings of the 2020 7th International Conference on Information Science and Control Engineering (ICISCE), Changsha, China, 18–20 December 2020; IEEE: Piscataway, NJ, USA, 2020; pp. 639–643. [Google Scholar]
  51. Singh, A.; Chauhan, P.S.; Pandit, P.P.; Narwariya, M. Effect of Notch Fillet Radius on Tensile Strength of 817M40 Notched Bar. IOP Conf. Ser. Mater. Sci. Eng. 2021, 1136, 012070. [Google Scholar] [CrossRef]
  52. Kladovasilakis, N.; Tsongas, K.; Kostavelis, I.; Tzovaras, D.; Tzetzis, D. Effective Mechanical Properties of Additive Manufactured Strut-Lattice Structures: Experimental and Finite Element Study. Adv. Eng. Mater. 2021, 24, 2100879. [Google Scholar] [CrossRef]
  53. Kladovasilakis, N.; Tsongas, K.; Kostavelis, I.; Tzovaras, D.; Tzetzis, D. Effective mechanical properties of additive manufactured triply periodic minimal surfaces: Experimental and finite element study. Int. J. Adv. Manuf. Technol. 2022, 121, 7169–7189. [Google Scholar] [CrossRef]
  54. Zoumaki, M.; Mansour, M.T.; Tsongas, K.; Tzetzis, D.; Mansour, G. Mechanical Characterization and Finite Element Analysis of Hierarchical Sandwich Structures with PLA 3D-Printed Core and Composite Maize Starch Biodegradable Skins. J. Compos. Sci. 2022, 6, 118. [Google Scholar] [CrossRef]
  55. Kladovasilakis, N.; Tsongas, K.; Tzetzis, D. Finite Element Analysis of Orthopedic Hip Implant with Functionally Graded Bioinspired Lattice Structures. Biomimetics 2020, 5, 44. [Google Scholar] [CrossRef]
  56. Giarmas, E.; Tsongas, K.; Tzimtzimis, E.K.; Korlos, A.; Tzetzis, D. Mechanical and FEA-Assisted Characterization of 3D Printed Continuous Glass Fiber Reinforced Nylon Cellular Structures. J. Compos. Sci. 2021, 5, 313. [Google Scholar] [CrossRef]
  57. Kladovasilakis, N.; Charalampous, P.; Boumpakis, A.; Kontodina, T.; Tsongas, K.; Tzetzis, D.; Kostavelis, I.; Givissis, P.; Tzovaras, D. Development of biodegradable customized tibial scaffold with advanced architected materials utilizing additive manufacturing. J. Mech. Behav. Biomed. Mater. 2023, 141, 105796. [Google Scholar] [CrossRef] [PubMed]
  58. Mansour, M.T.; Tsongas, K.; Tzetzis, D. Carbon-Fiber- and Nanodiamond-Reinforced PLA Hierarchical 3D-Printed Core Sandwich Structures. J. Compos. Sci. 2023, 7, 285. [Google Scholar] [CrossRef]
  59. Mansour, M.T.; Tsongas, K.; Tzetzis, D. 3D Printed Hierarchical Honeycombs with Carbon Fiber and Carbon Nanotube Reinforced Acrylonitrile Butadiene Styrene. J. Compos. Sci. 2021, 5, 62. [Google Scholar] [CrossRef]
  60. Kladovasilakis, N.; Tsongas, K.; Karalekas, D.; Tzetzis, D. Architected Materials for Additive Manufacturing: A Comprehensive Review. Materials 2022, 15, 5919. [Google Scholar] [CrossRef] [PubMed]
  61. Fu, T.; Hu, X.; Yang, C. Impact Response Analysis of Stiffened Sandwich Functionally Graded Porous Materials Doubly-Curved Shell with Re-Entrant Honeycomb Auxetic Core. Appl. Math. Model. 2023, 124, 553–575. [Google Scholar] [CrossRef]
  62. Zhao, G.; Fu, T.; Li, J. Study on Concave Direction Impact Performance of Similar Concave Hexagon Honeycomb Structure. Materials 2023, 16, 3262. [Google Scholar] [CrossRef]
Figure 1. (a) A fresh sample of the sea urchin Paracentrotus lividus; (b) the porous structure of its shell.
Designs 07 00113 g001
Figure 2. The stages “Research and Analysis”, “Abstraction and Emulation”, and “Technical Evaluation” of the novel biomimetic strategy are interconnected via bi-directional feedback loops. The Technical Evaluation stage consists of prototyping and mechanical characterization of the biomimetic model.
Designs 07 00113 g002
Figure 3. The updated definition in the Grasshopper environment. A volume Boolean union is added to ensure constant rod thickness.
Designs 07 00113 g003
Figure 4. Designed and fabricated samples: (a) Model 1; (b) Model 2; (c) Model 3; (d) Model 4; (e) Model 5; (f) Model 6; and (g) Model 7.
Designs 07 00113 g004
Figure 5. A typical energy efficiency curve η(ε) for Model 1 of the biomimetic Voronoi structure and the respective densification strain.
Designs 07 00113 g005
Figure 6. Compressive behavior up until the densification point of: (a) Model 1; (b) Model 2; (c) Model 3; (d) Model 4; (e) Model 5; (f) Model 6; and (g) Model 7.
Designs 07 00113 g006
Figure 7. Microscopic images in (α,β) show typical failure points of the rods as they buckle under compressive load and the bonded 3D printed layers are separated.
Designs 07 00113 g007
Figure 8. Stress–strain curves of the biomimetic Voronoi models.
Designs 07 00113 g008
Figure 9. A second-degree polynomial correlation is discernible when the following factors are plotted against their relative densities: (a) Elastic modulus; (b) energy capacity; and (c) plateau stress of the Voronoi structures.
Designs 07 00113 g009
Figure 10. (a) Experimental load–displacement response for the Voronoi lattice structures curve-fitted by FEA generated data; (b) vertical deformation and (c) stress distribution of the Voronoi structure under compression load, utilizing the PLA material properties in the FE model.
Designs 07 00113 g010
Table 1. Geometric parameters of the printed and tested models.
ModelNode CountRod Radius (mm)Smoothness Scale
1601.81
26021
3602.21
4801.81
51001.81
6601.84
7601.87
Table 2. Printer parameters.
Printer ParameterValue
Nozzle size0.4 mm
MaterialsPLA
Layer Thickness0.2 mm
Wall Thickness0.8 mm
Infill PatternLines
Infill Density100%
Outer Wall Speed15 mm/s
Inner Wall Speed30 mm/s
Infill Speed30 mm/s
Printing Temp.205 °C
Build Plate Temp.55 °C
SupportNo
Print Time6–7 h
Table 3. Designed relative density of the models compared to the calculated values of the 3D printed specimens.
ModelDesigned
Relative Density
Calculated
Relative Density
Discrepancy (%)
10.440.40 ± 0.0049.09
20.520.48 ± 0.0057.69
30.610.56 ± 0.0058.2
40.530.49 ± 0.037.55
50.60.55 ± 0.038.33
60.460.42 ± 0.088.7
70.50.46 ± 0.028
Table 4. Mechanical properties of the biomimetic Voronoi structures.
ModelPorosity (%)Yield Strength
(MPa)
Compressive
Modulus (MPa)
Densification Strain (%)Plateau
Stress (MPa)
Energy Capacity (MJ/m3)Specific Energy Capacity (KJ/kg)
160.43 ± 0.436.26 ± 0.12310.29 ± 15.3049.39 ± 1.286.15 ± 0.092.94 ± 0.116.01 ± 0.30
252.03 ± 0.478.80 ± 0.12443.64 ± 1.1047.61 ± 1.149.38 ± 0.144.32 ± 0.147.26 ± 0.31
344.25 ± 0.5010.84 ± 0.10603.66 ± 13.9347.43 ± 0.4712.64 ± 0.225.78 ± 0.098.38 ± 0.20
450.99 ± 0.289.47 ± 0.13498.31 ± 8.8348.68 ± 1.3010.31 ± 0.024.85 ± 0.147.98 ± 0.19
544.69 ± 0.3211.55 ± 0.40658.07 ± 80.2946.57 ± 0.4213.55 ± 0.556.07 ± 0.198.85 ± 0.27
658.04 ± 0.857.40 ± 0.06381.33 ± 11.4048.88 ± 1.597.42 ± 0.083.51 ± 0.146.75 ± 0.37
754.23 ± 0.218.57 ± 0.45443.01 ± 14.3745.07 ± 0.838.94 ± 0.403.89 ± 0.196.85 ± 0.31
Disclaimer/Publisher’s Note: The statements, opinions and data contained in all publications are solely those of the individual author(s) and contributor(s) and not of MDPI and/or the editor(s). MDPI and/or the editor(s) disclaim responsibility for any injury to people or property resulting from any ideas, methods, instructions or products referred to in the content.

