

Support Vector Machine Binary Classifiers of Home Presence Using Active Power


Abstract
:1. Introduction
2. Materials and Methods
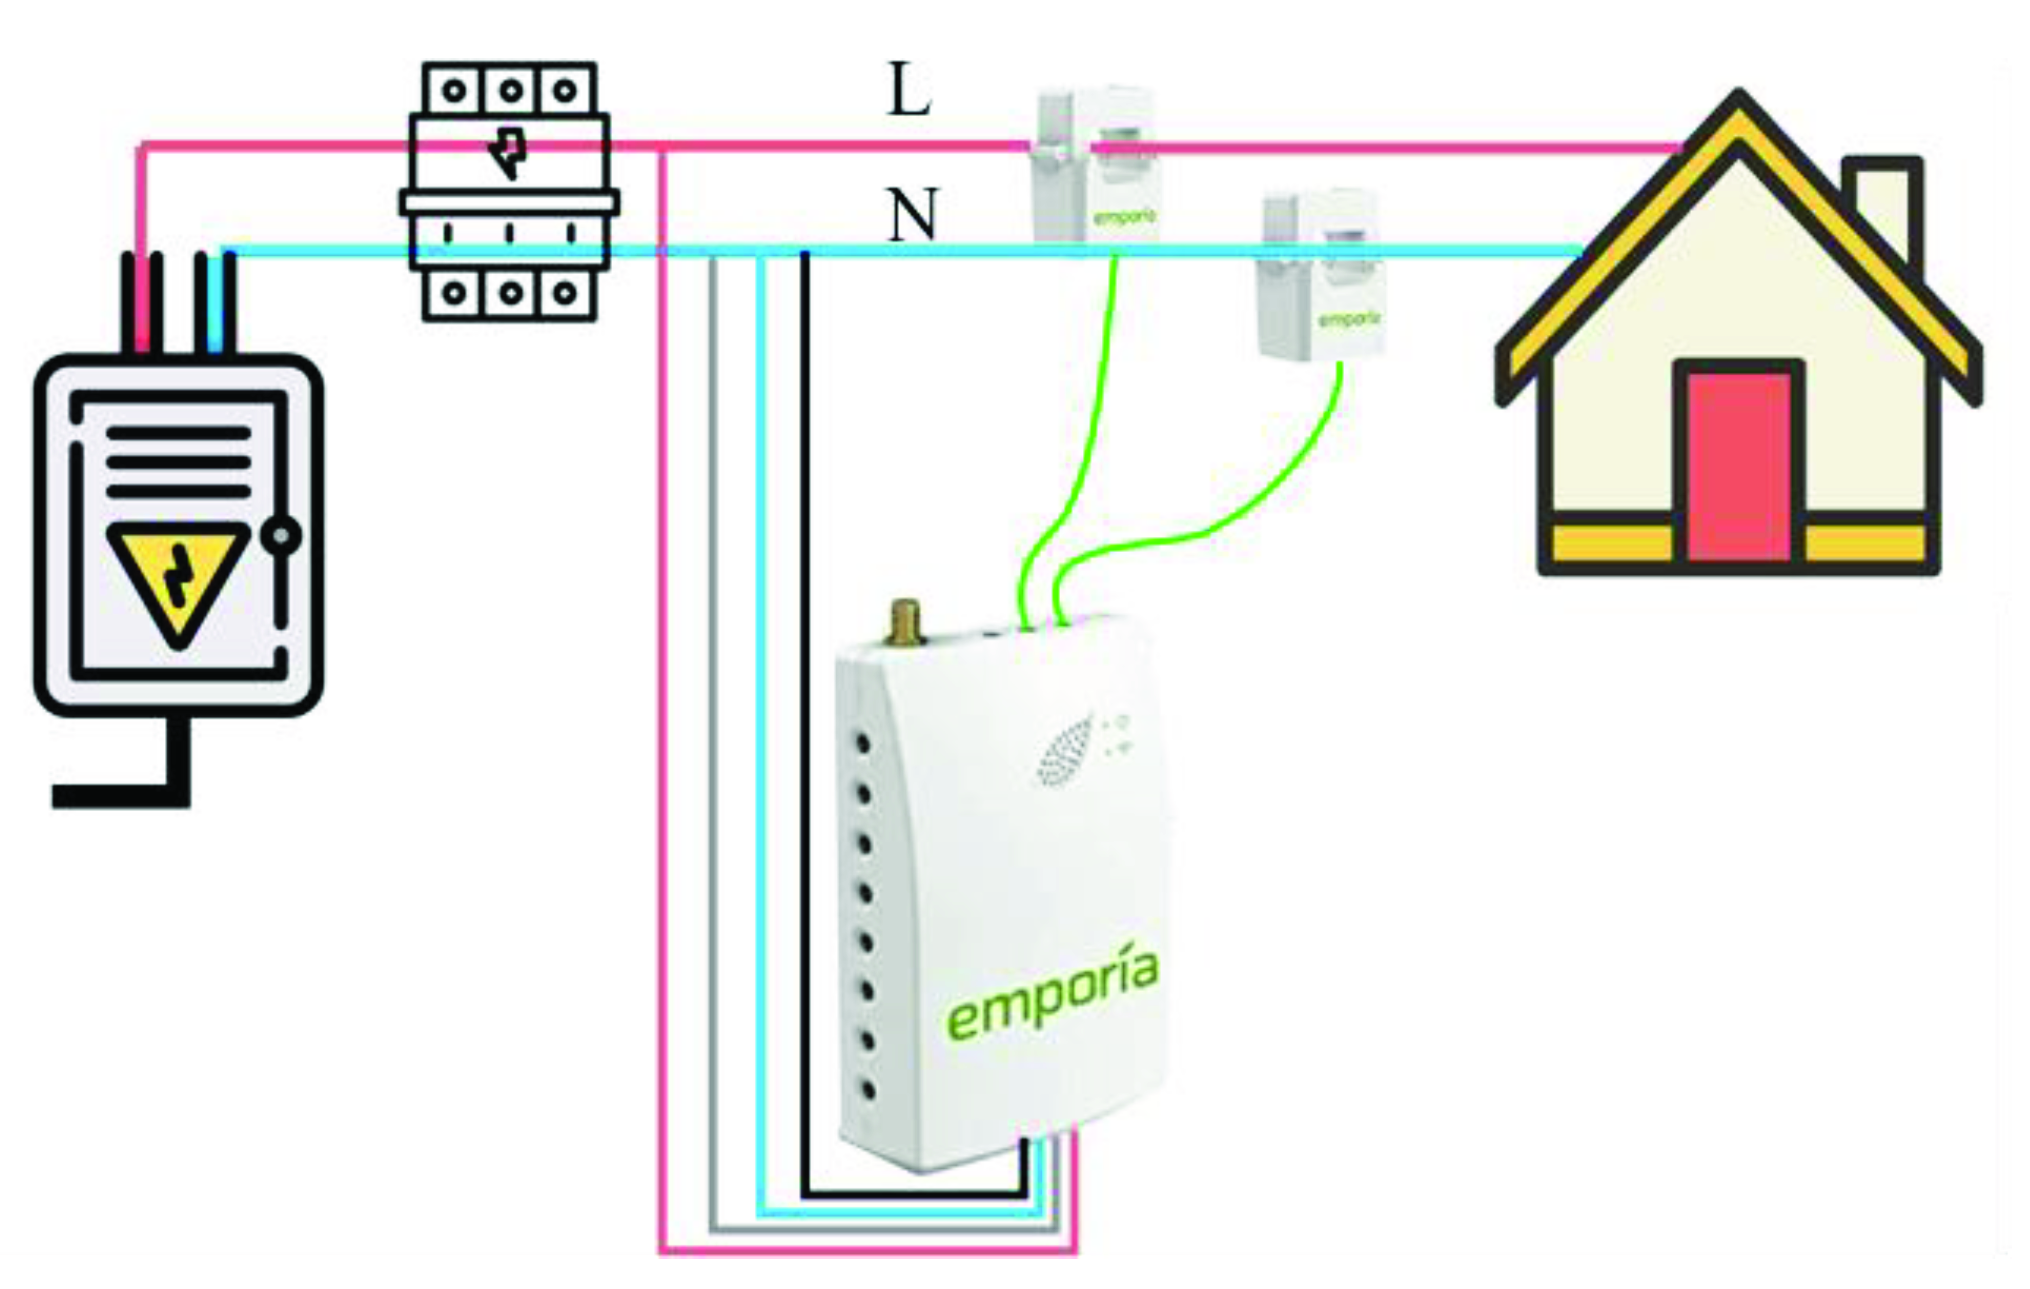
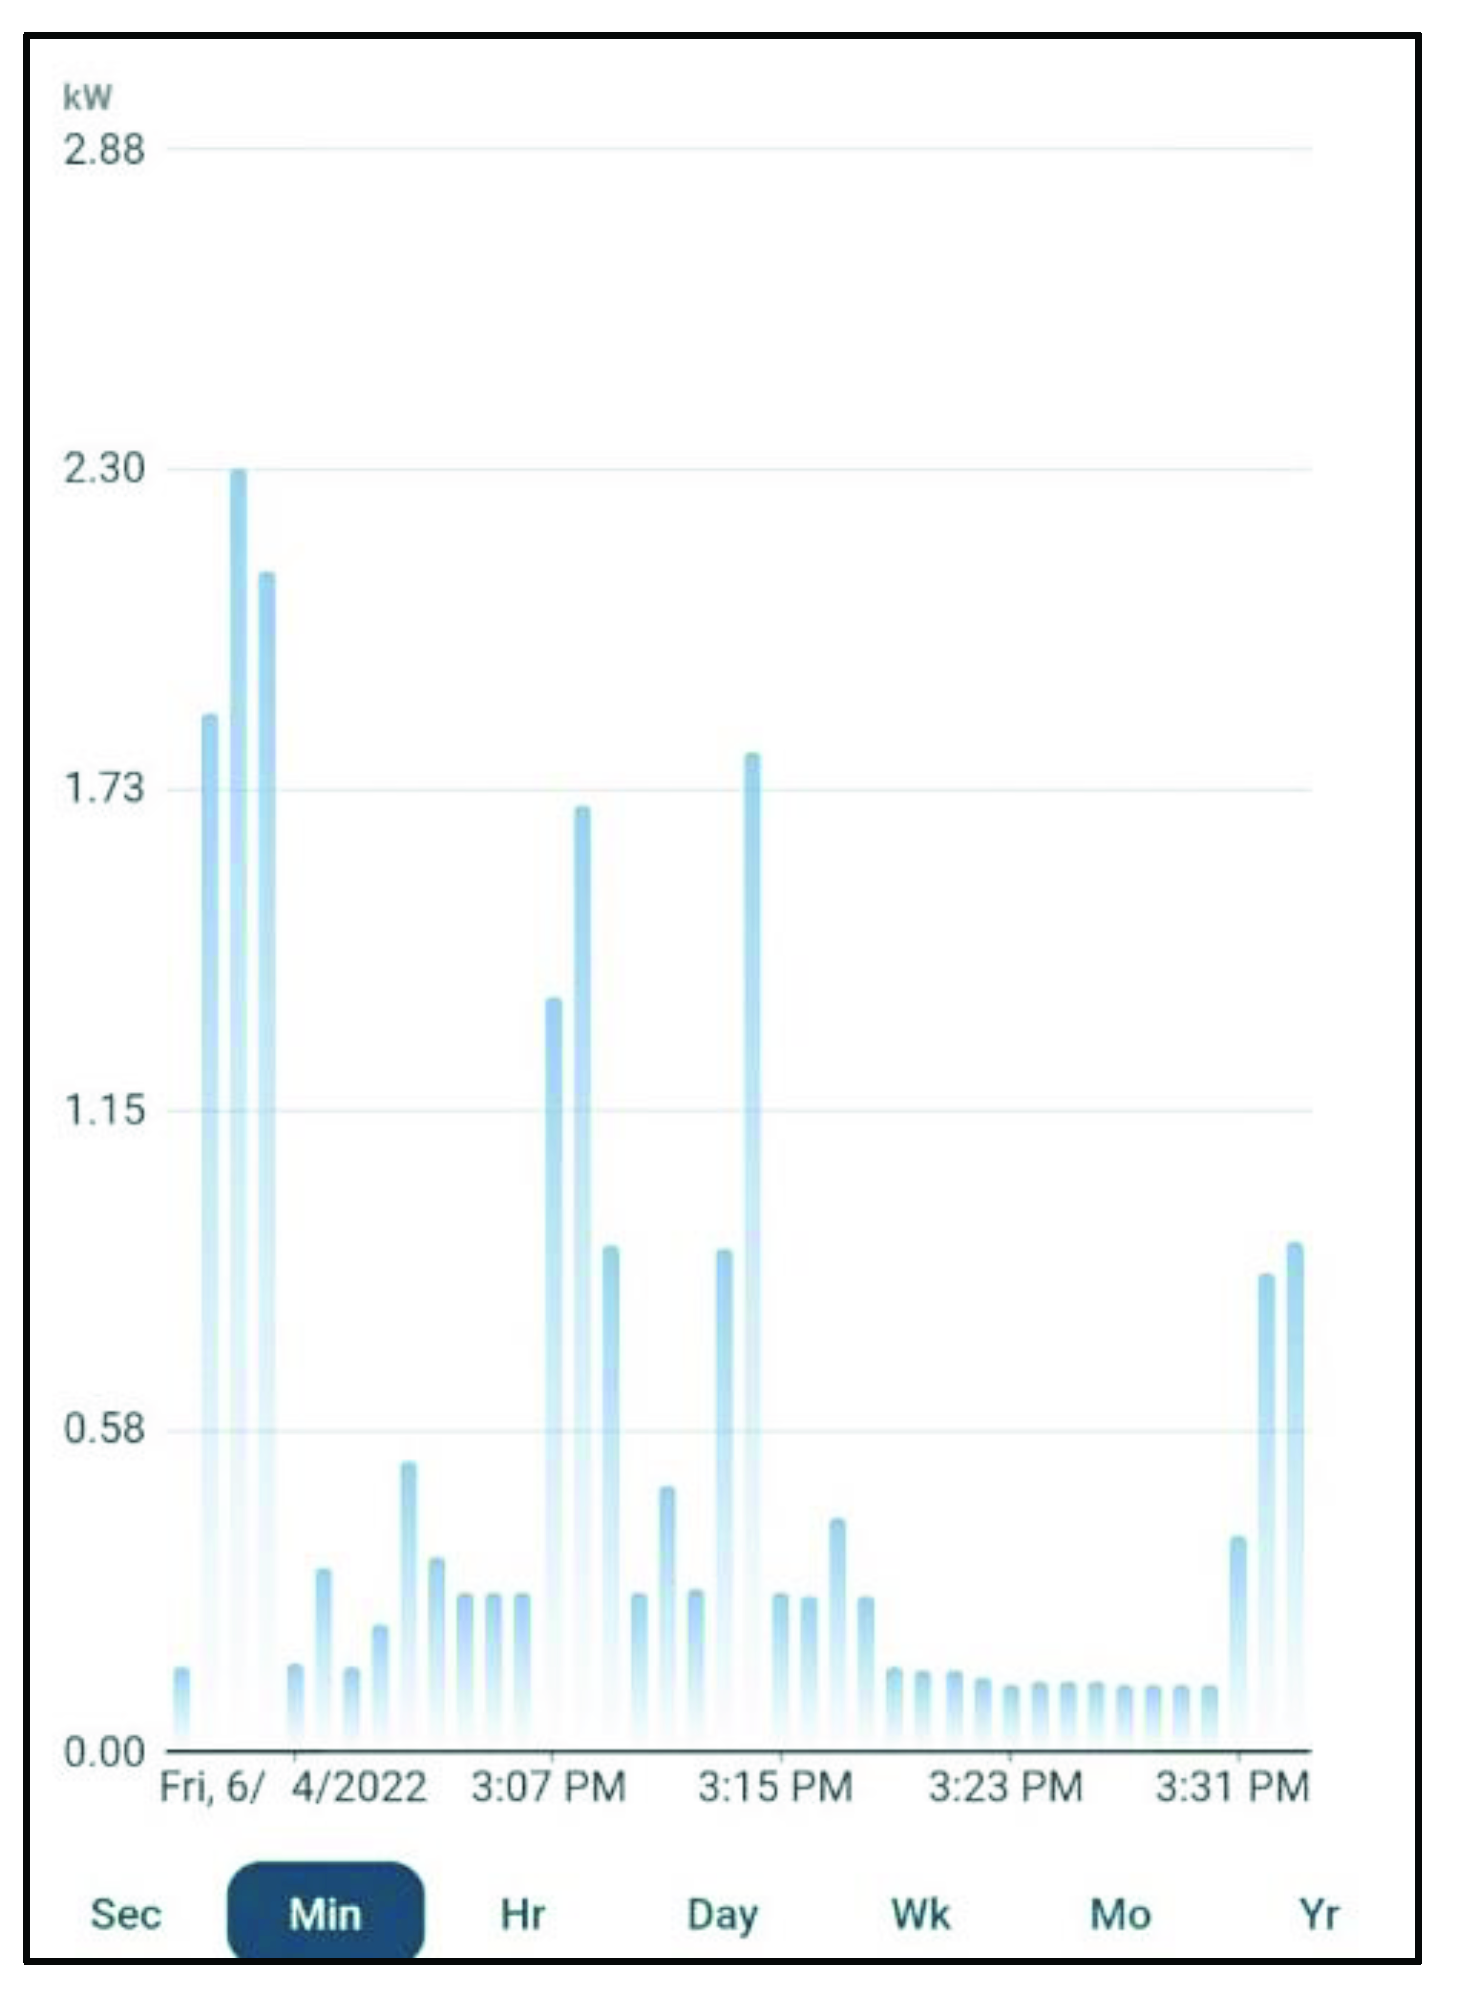
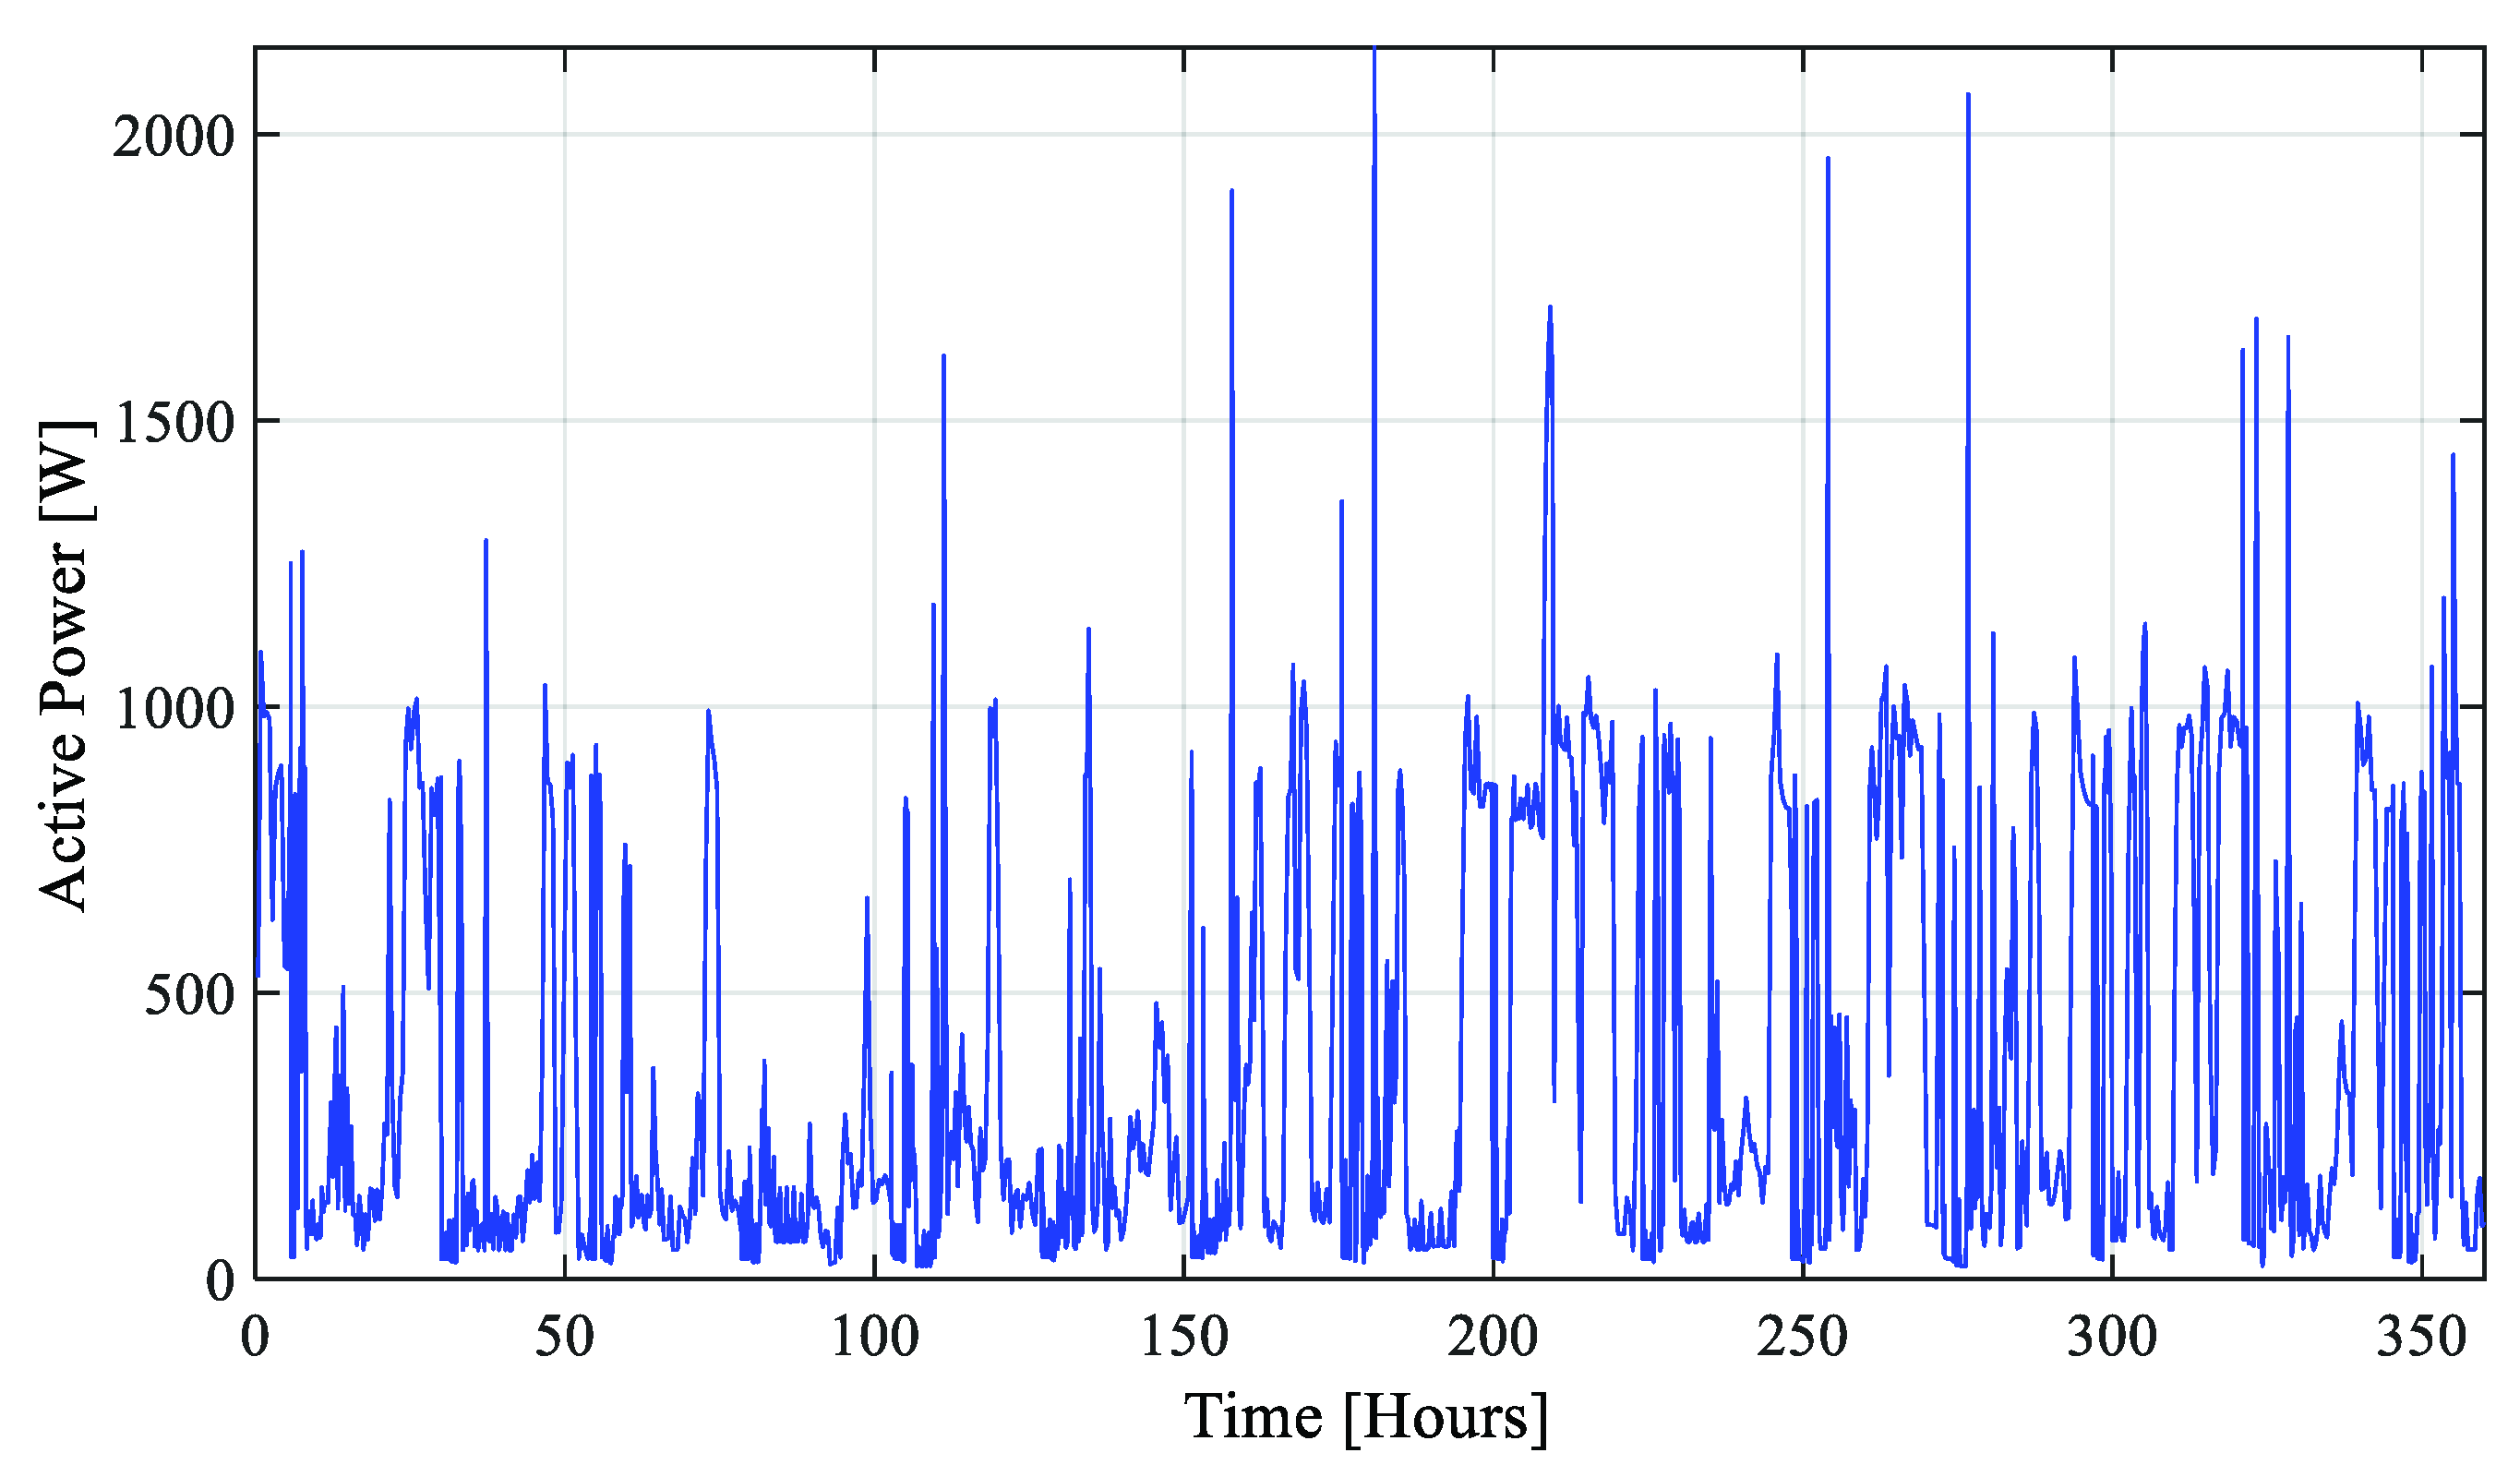
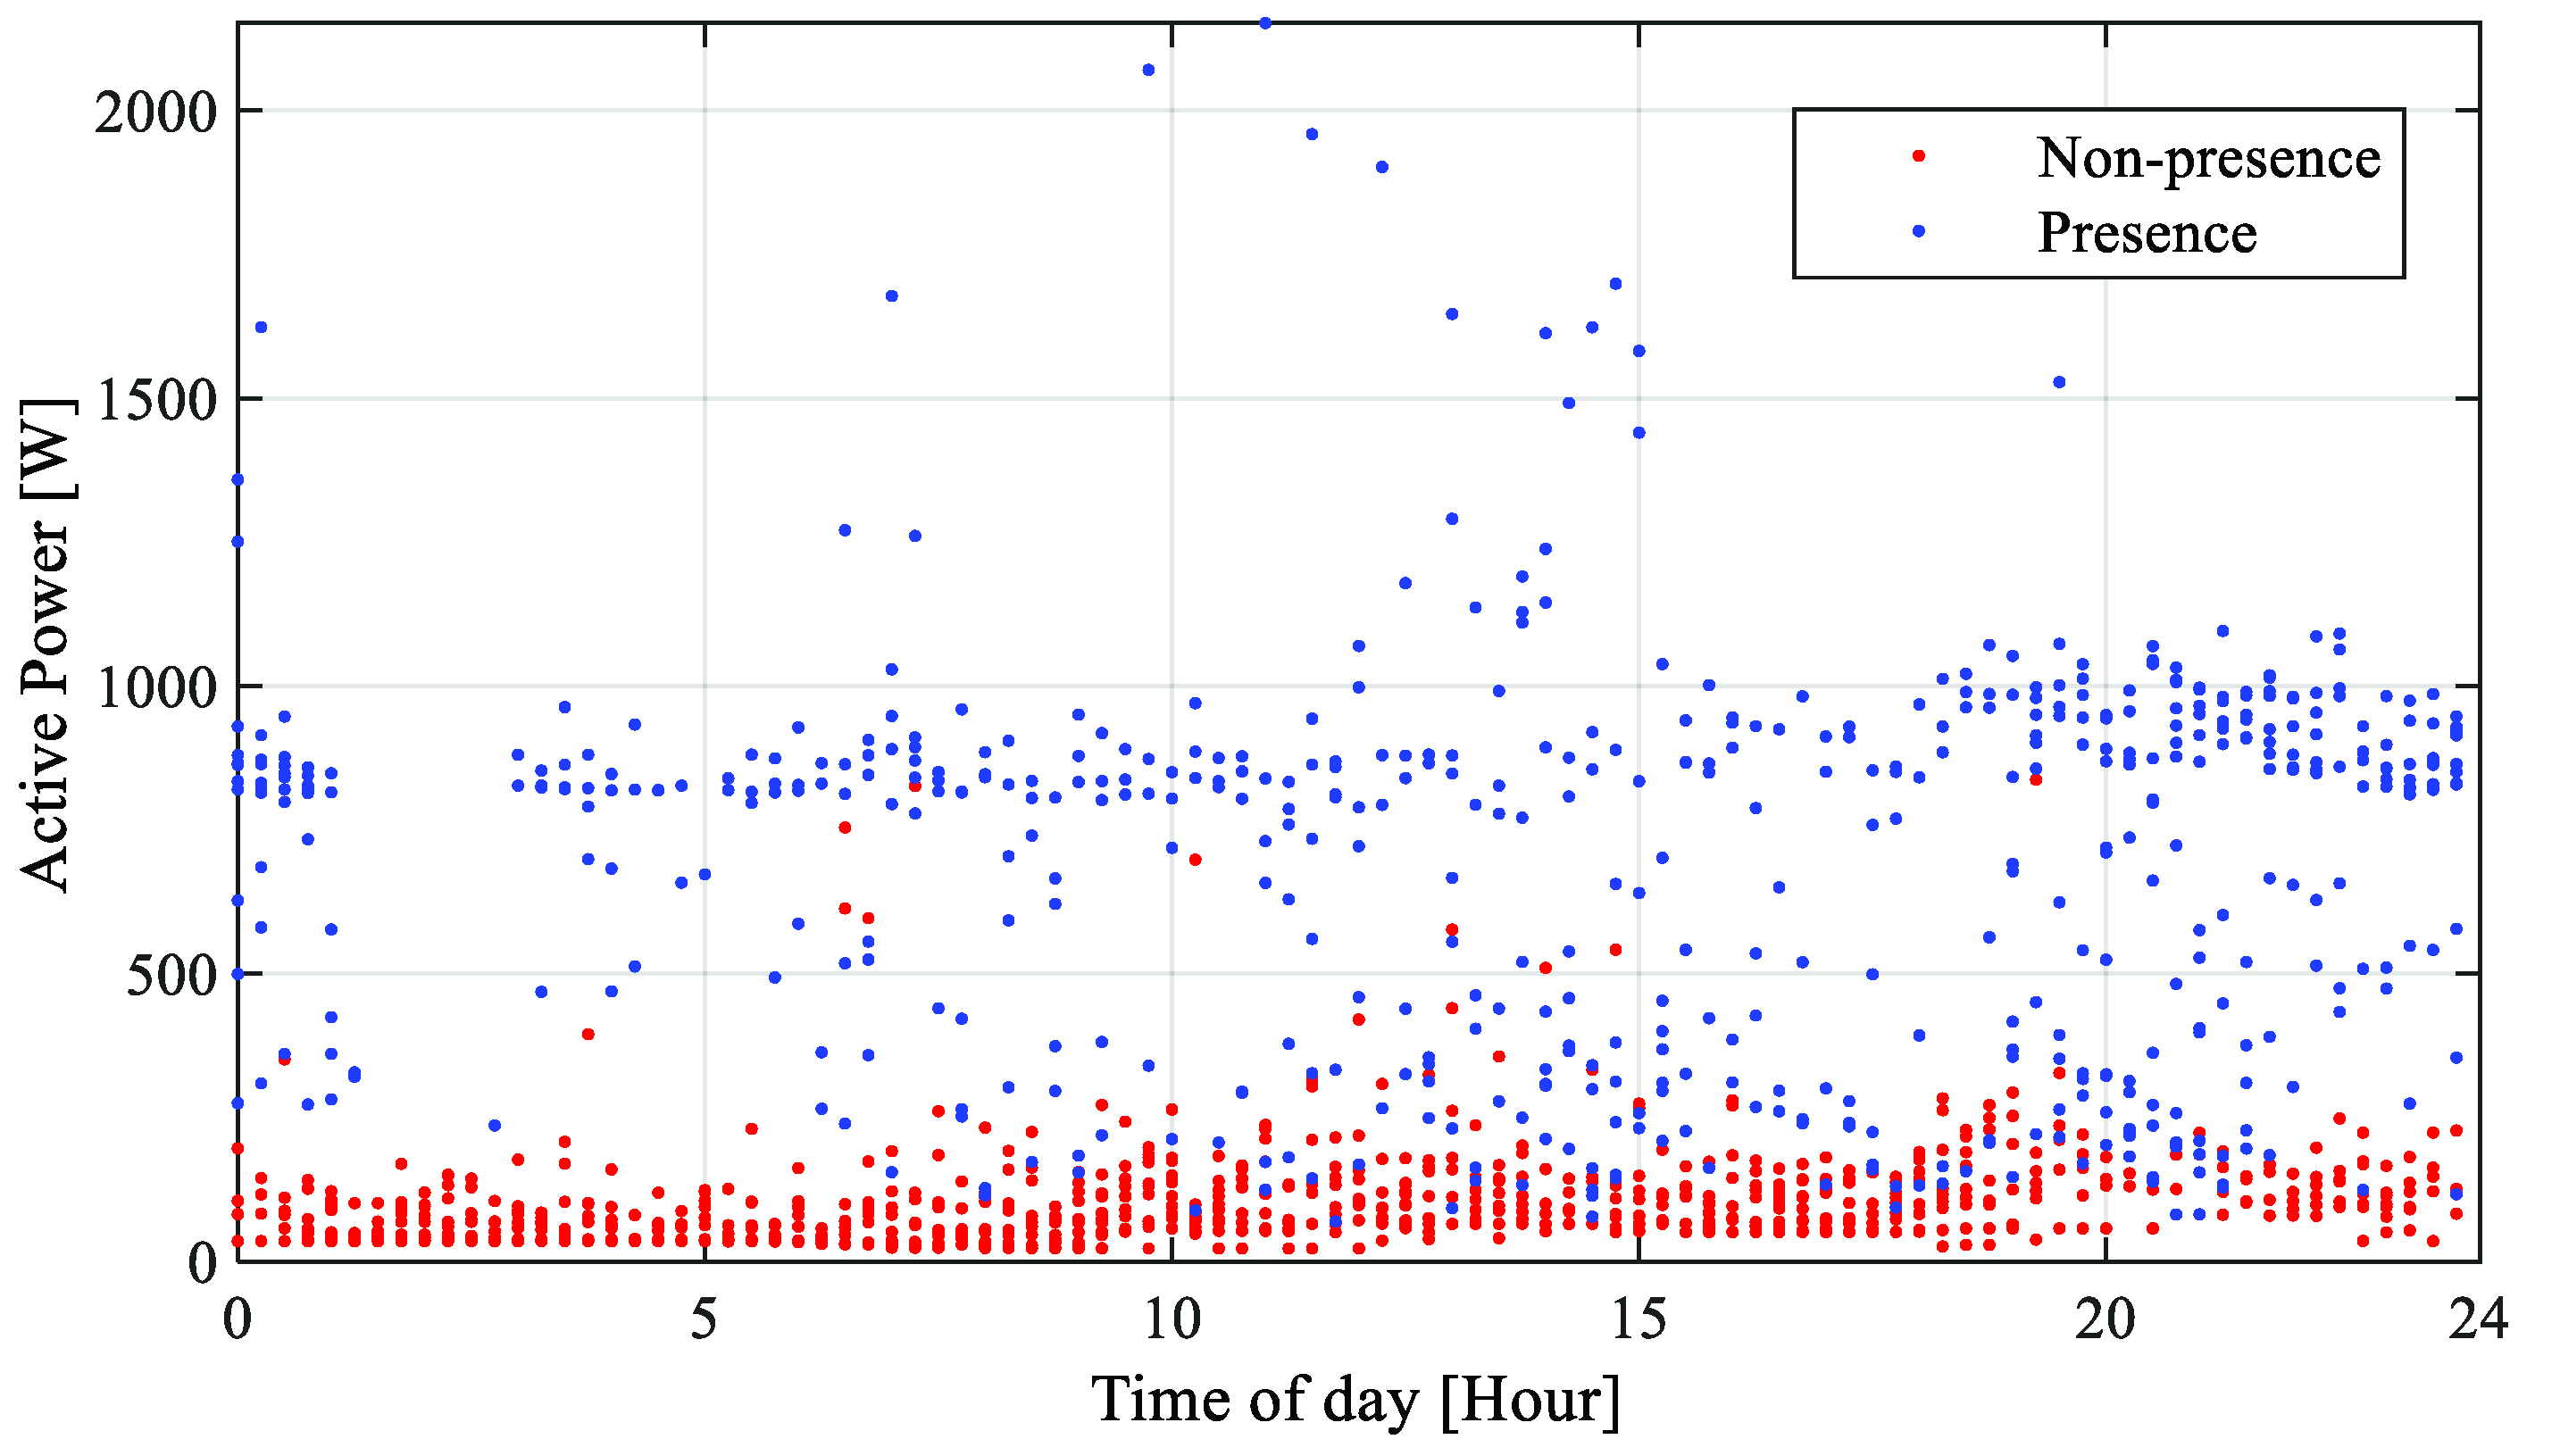
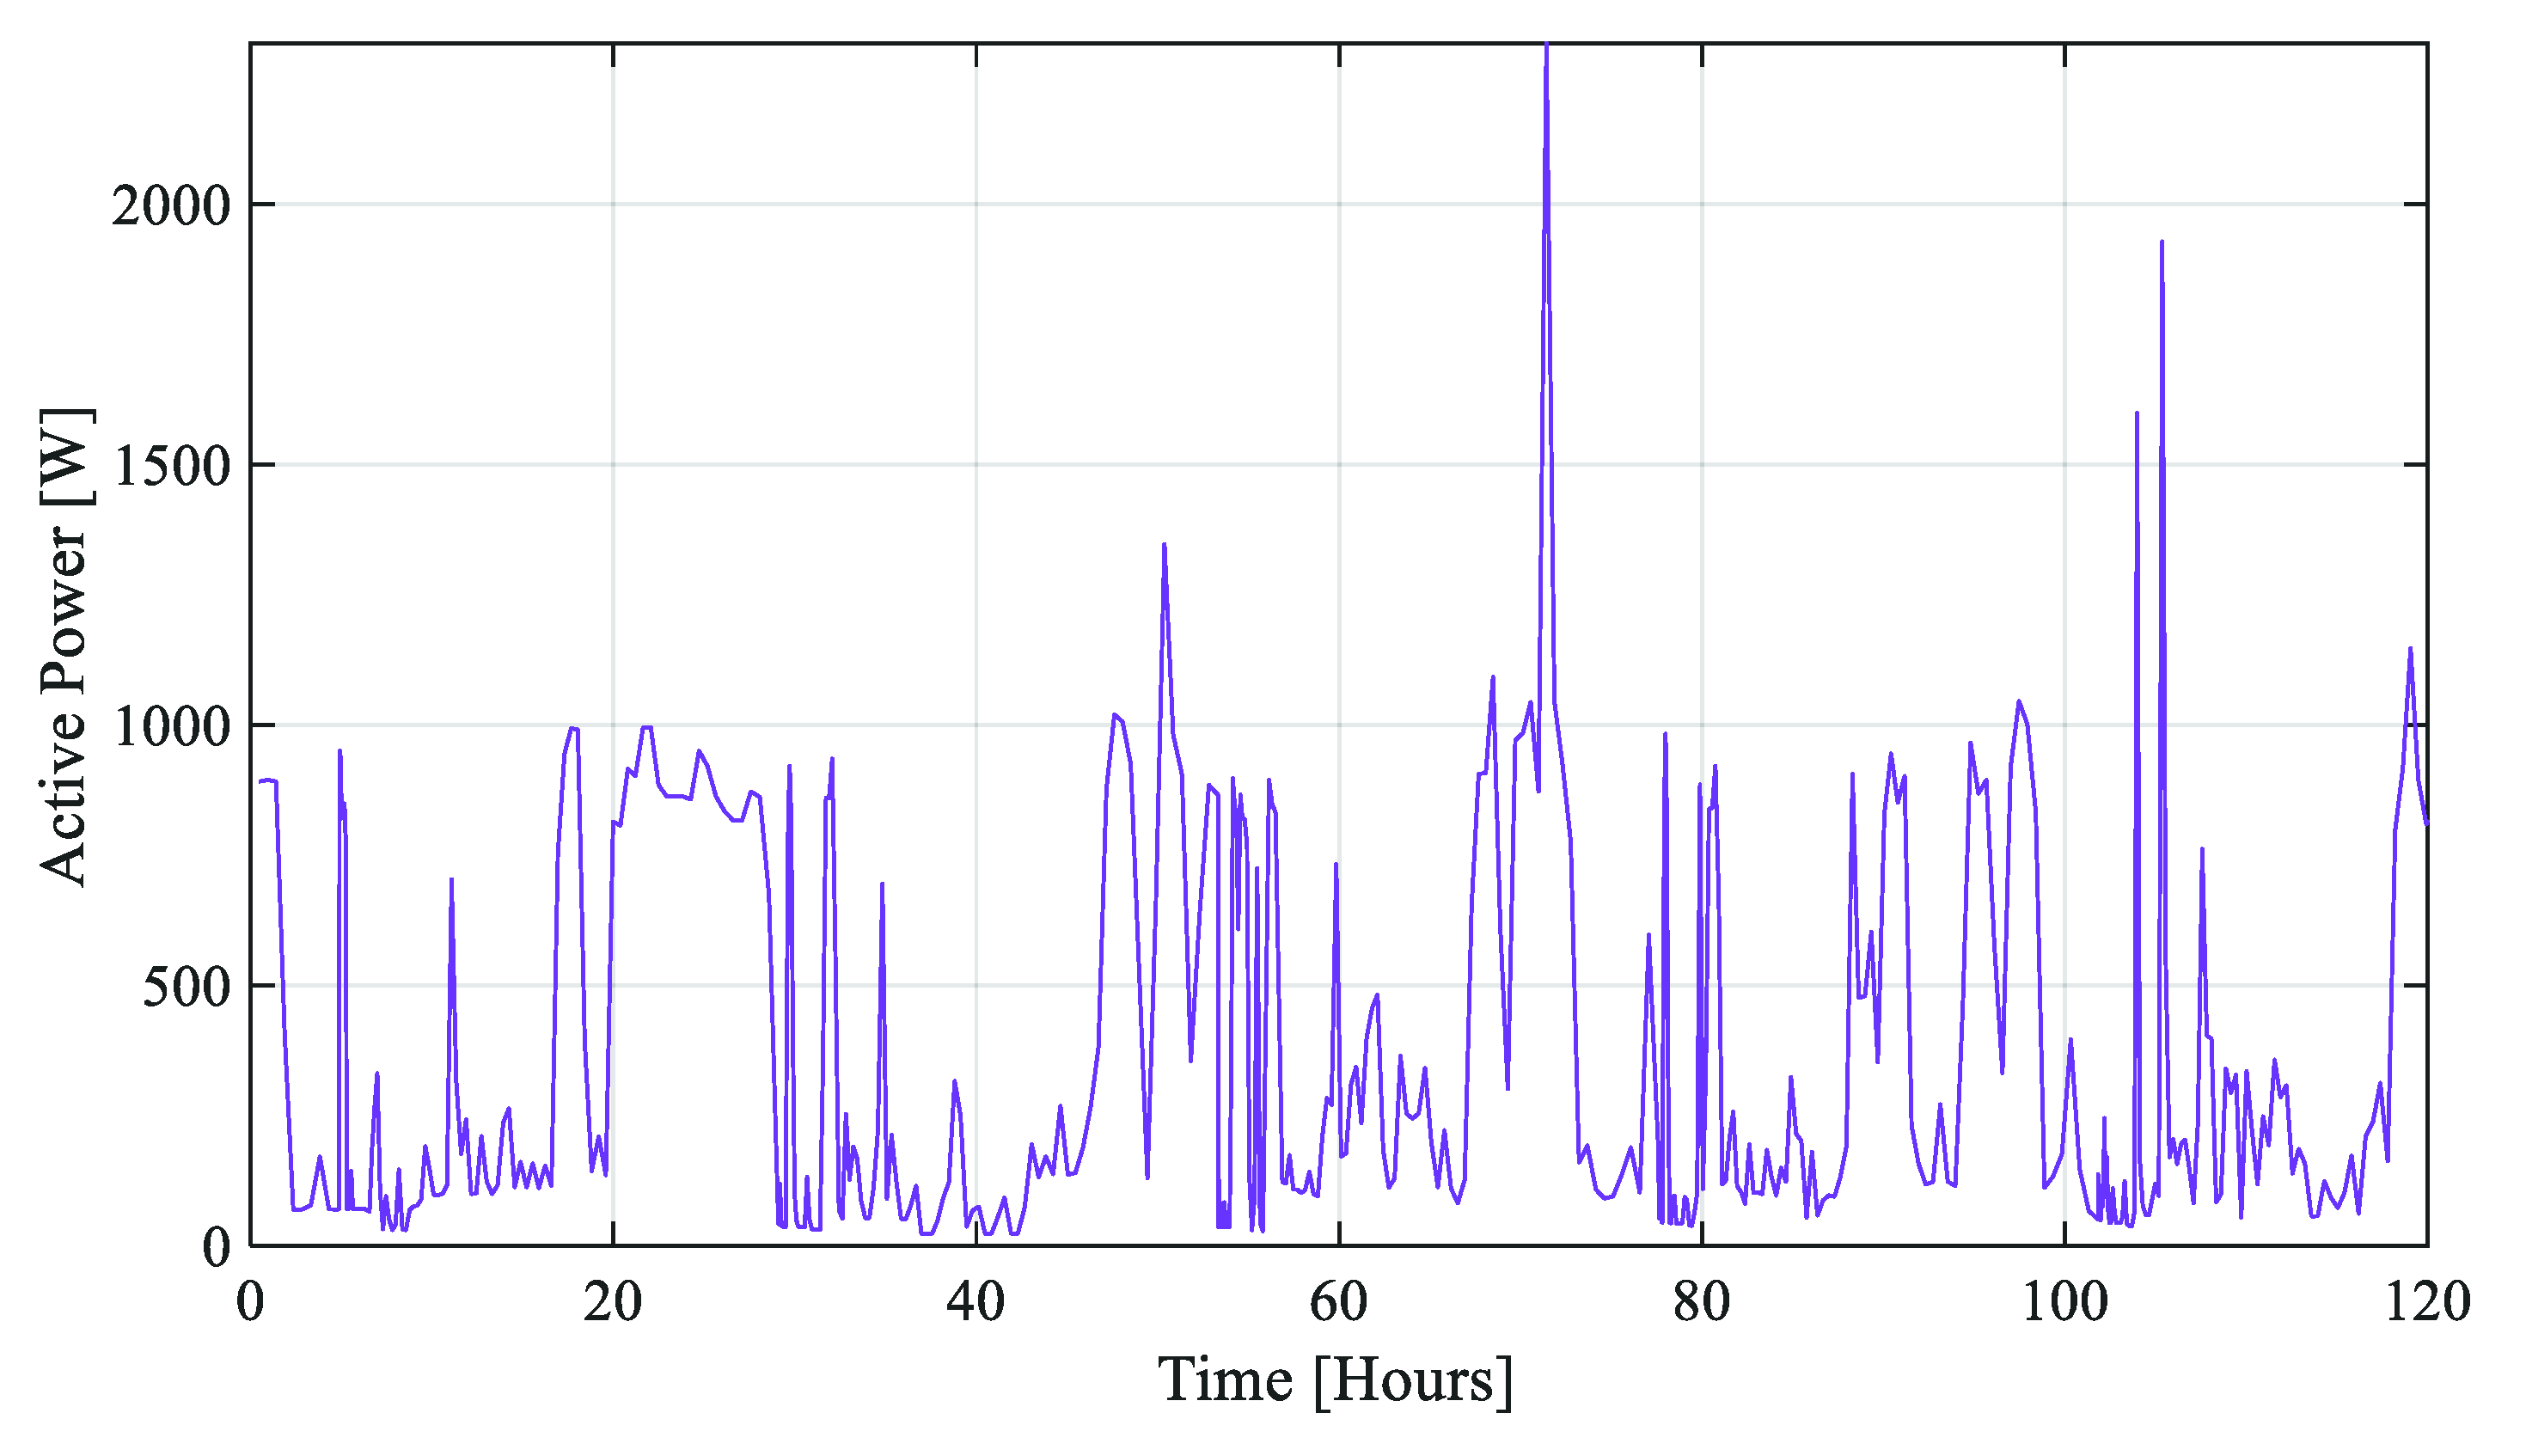
2.1. Data
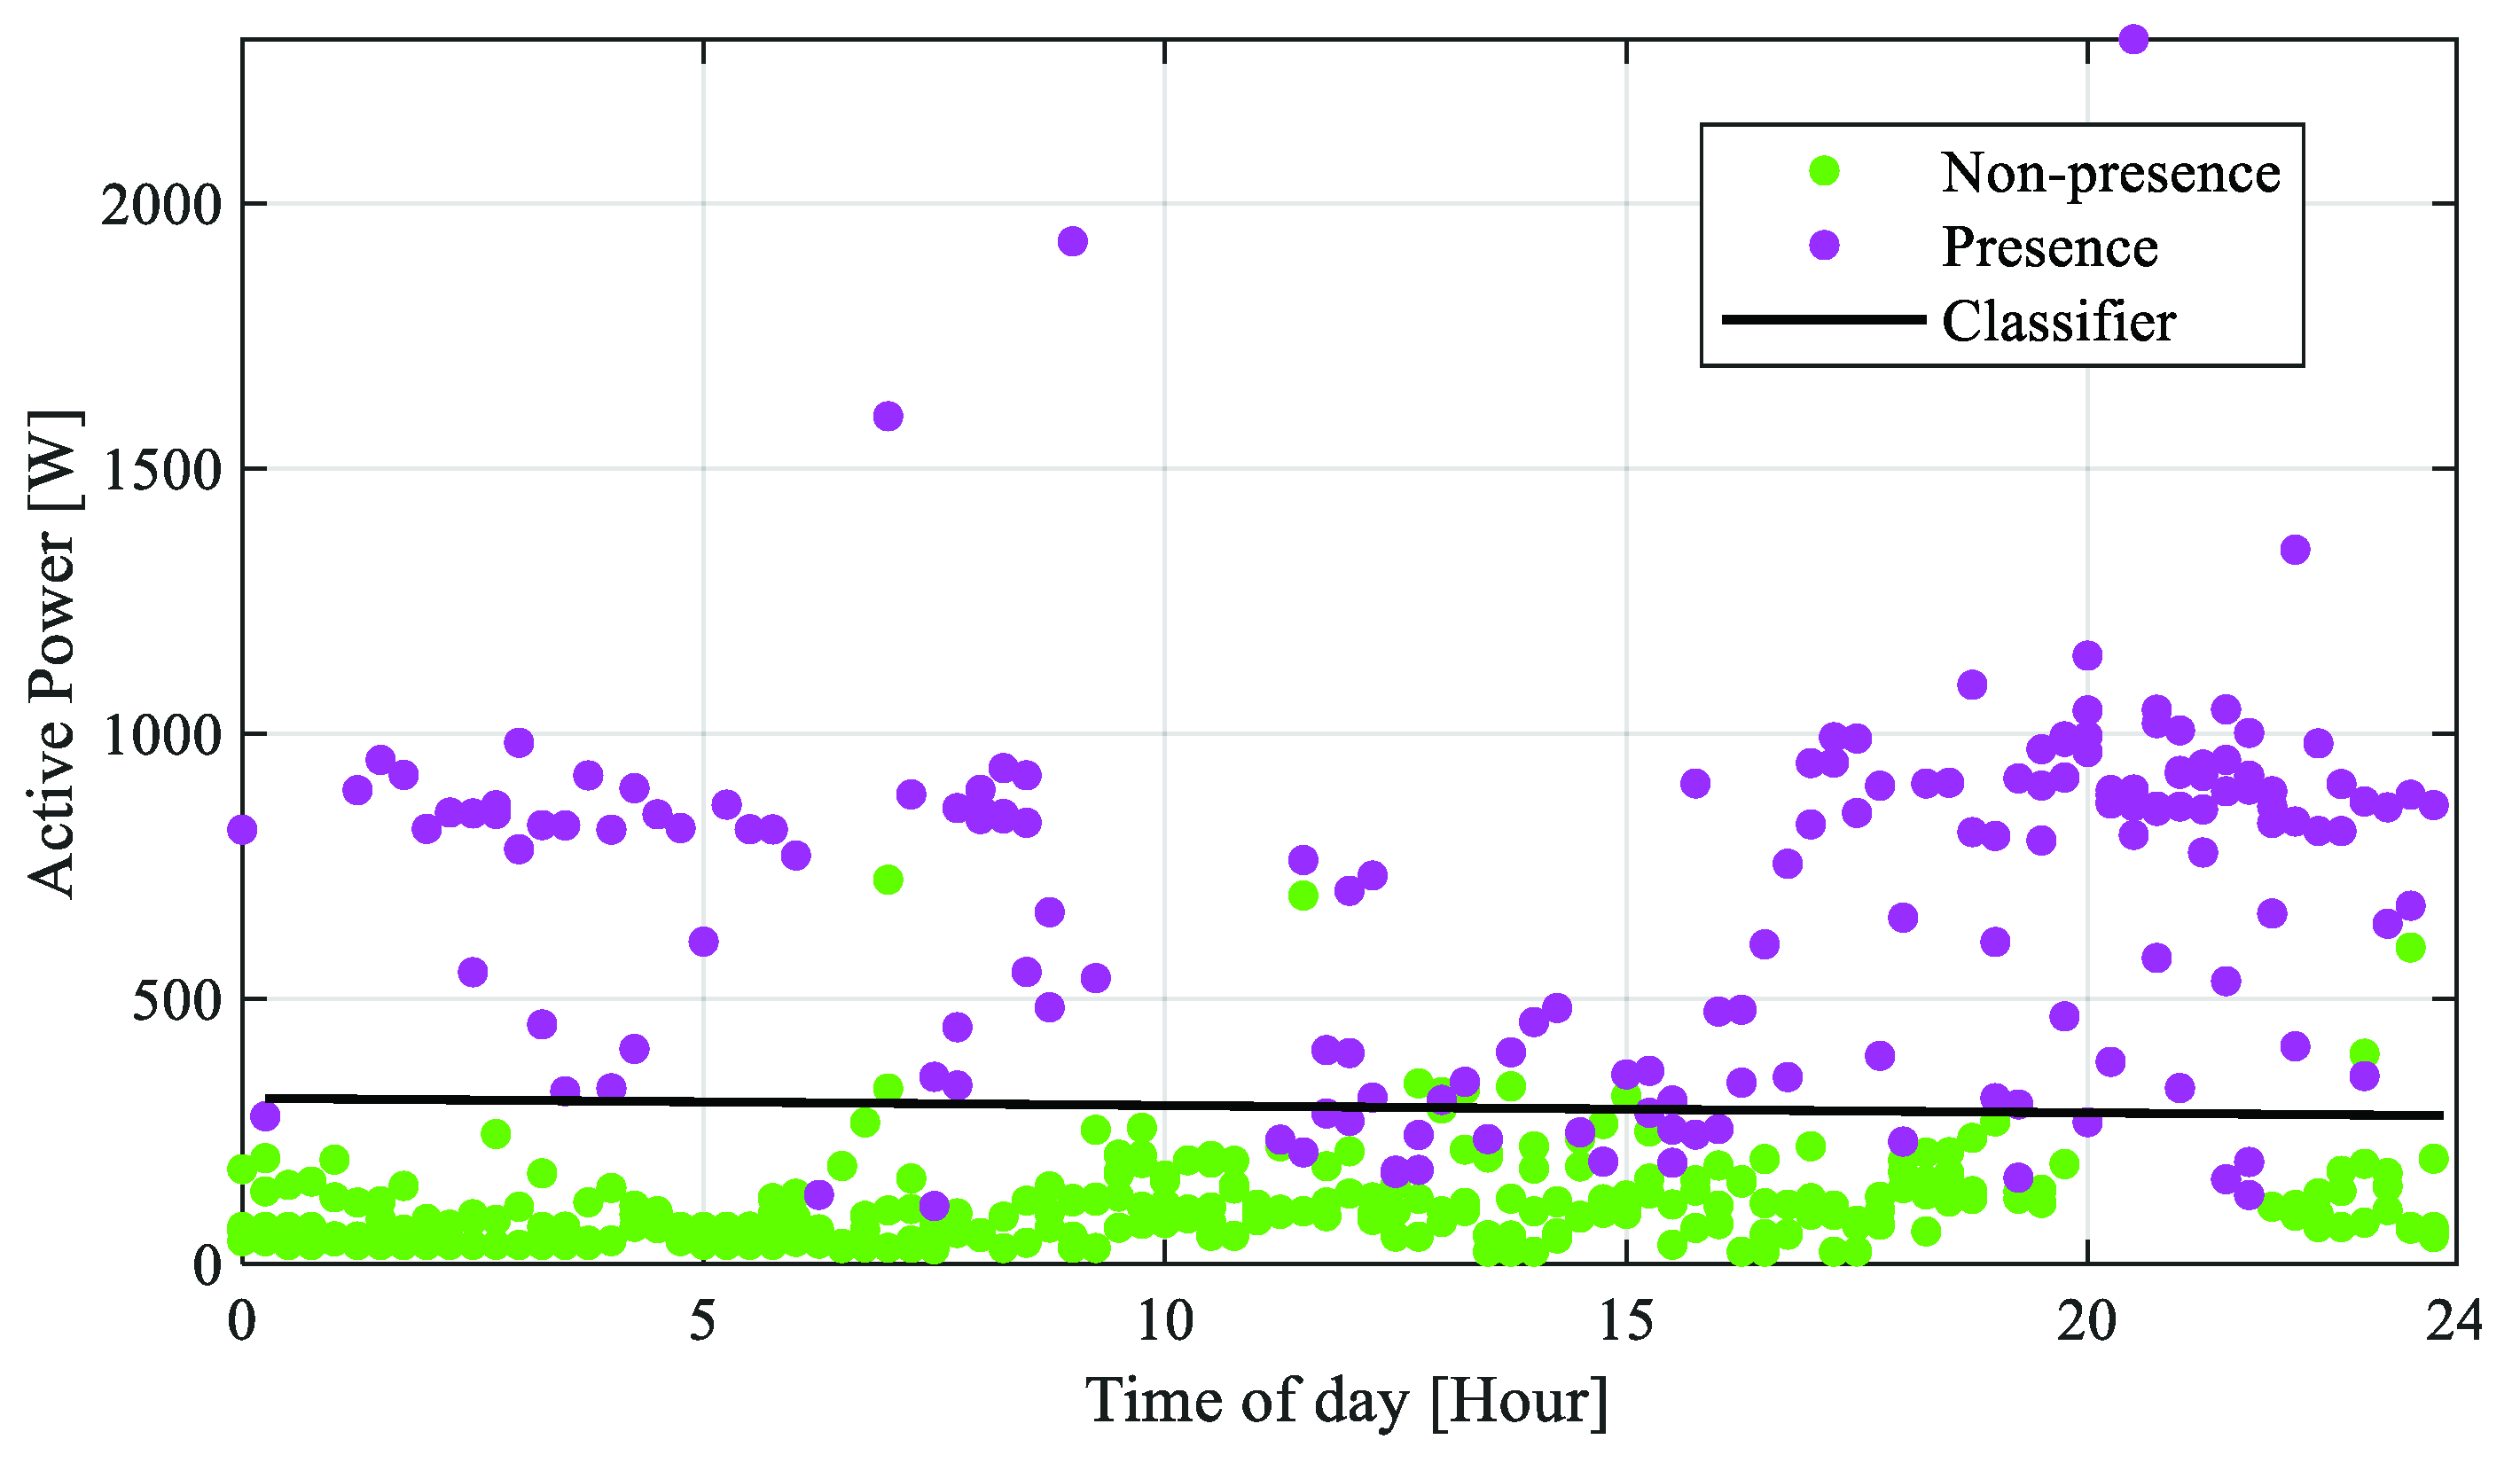
2.2. Classifiers
3. Results
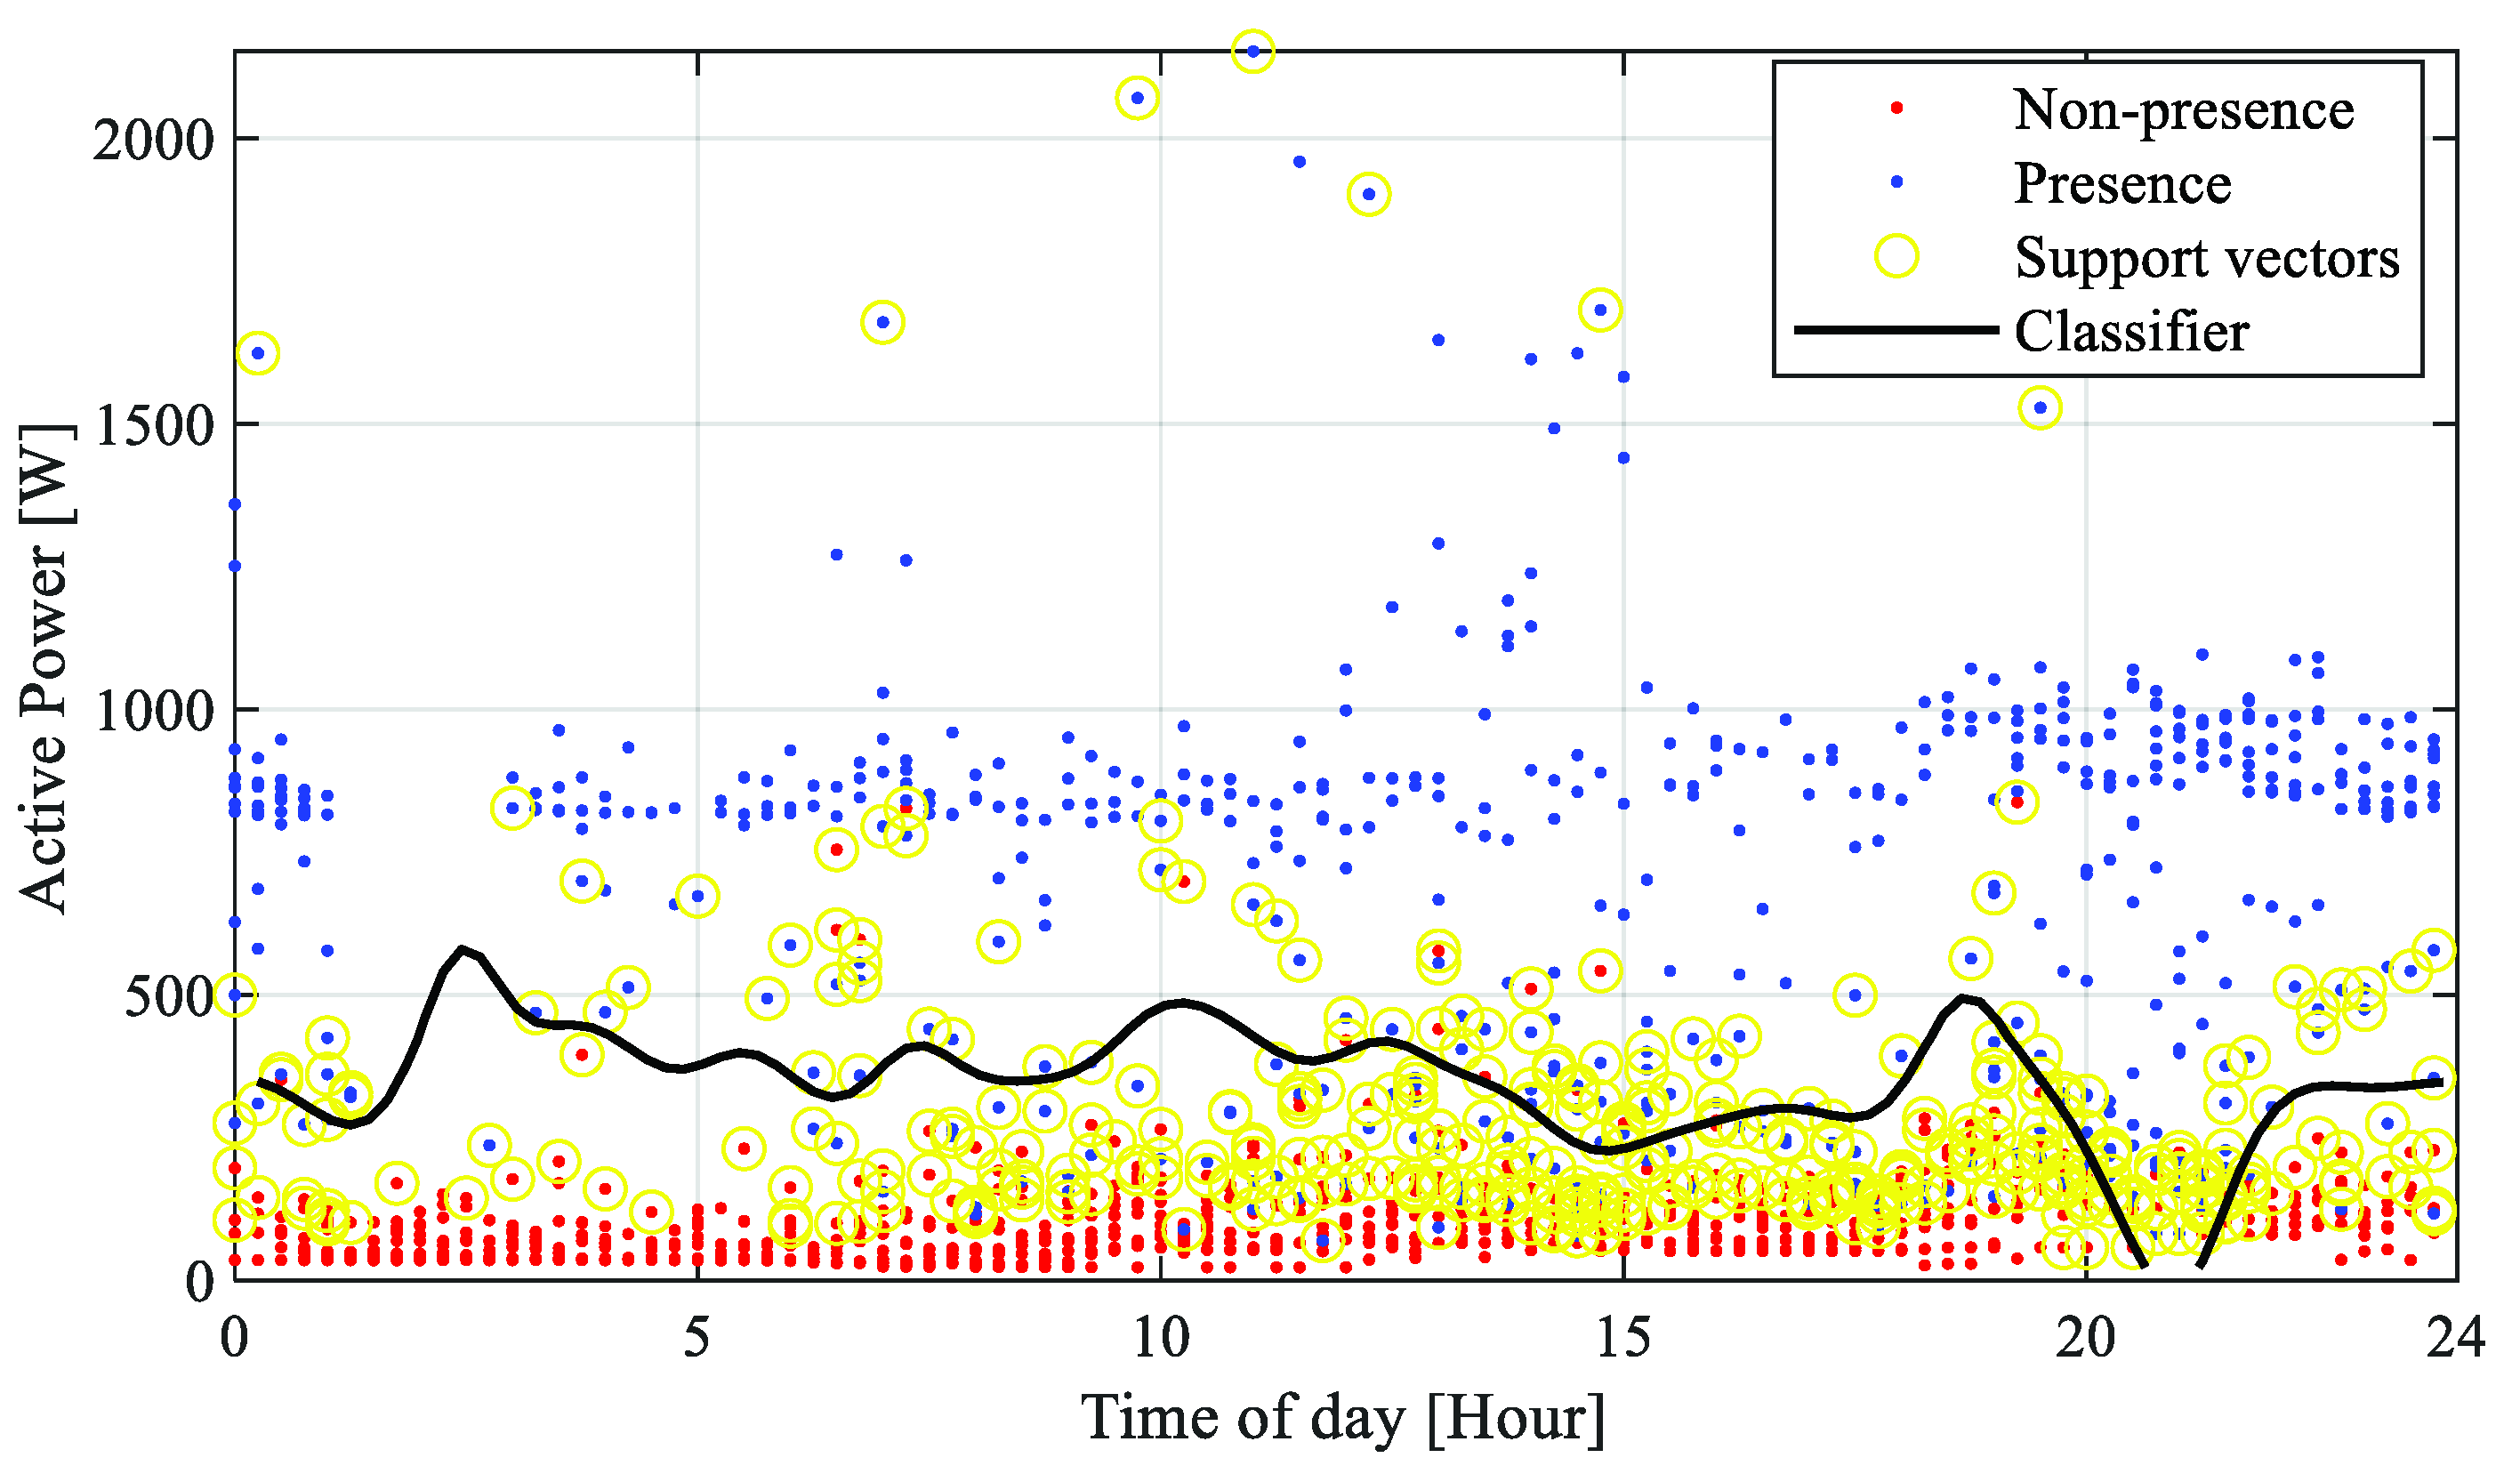
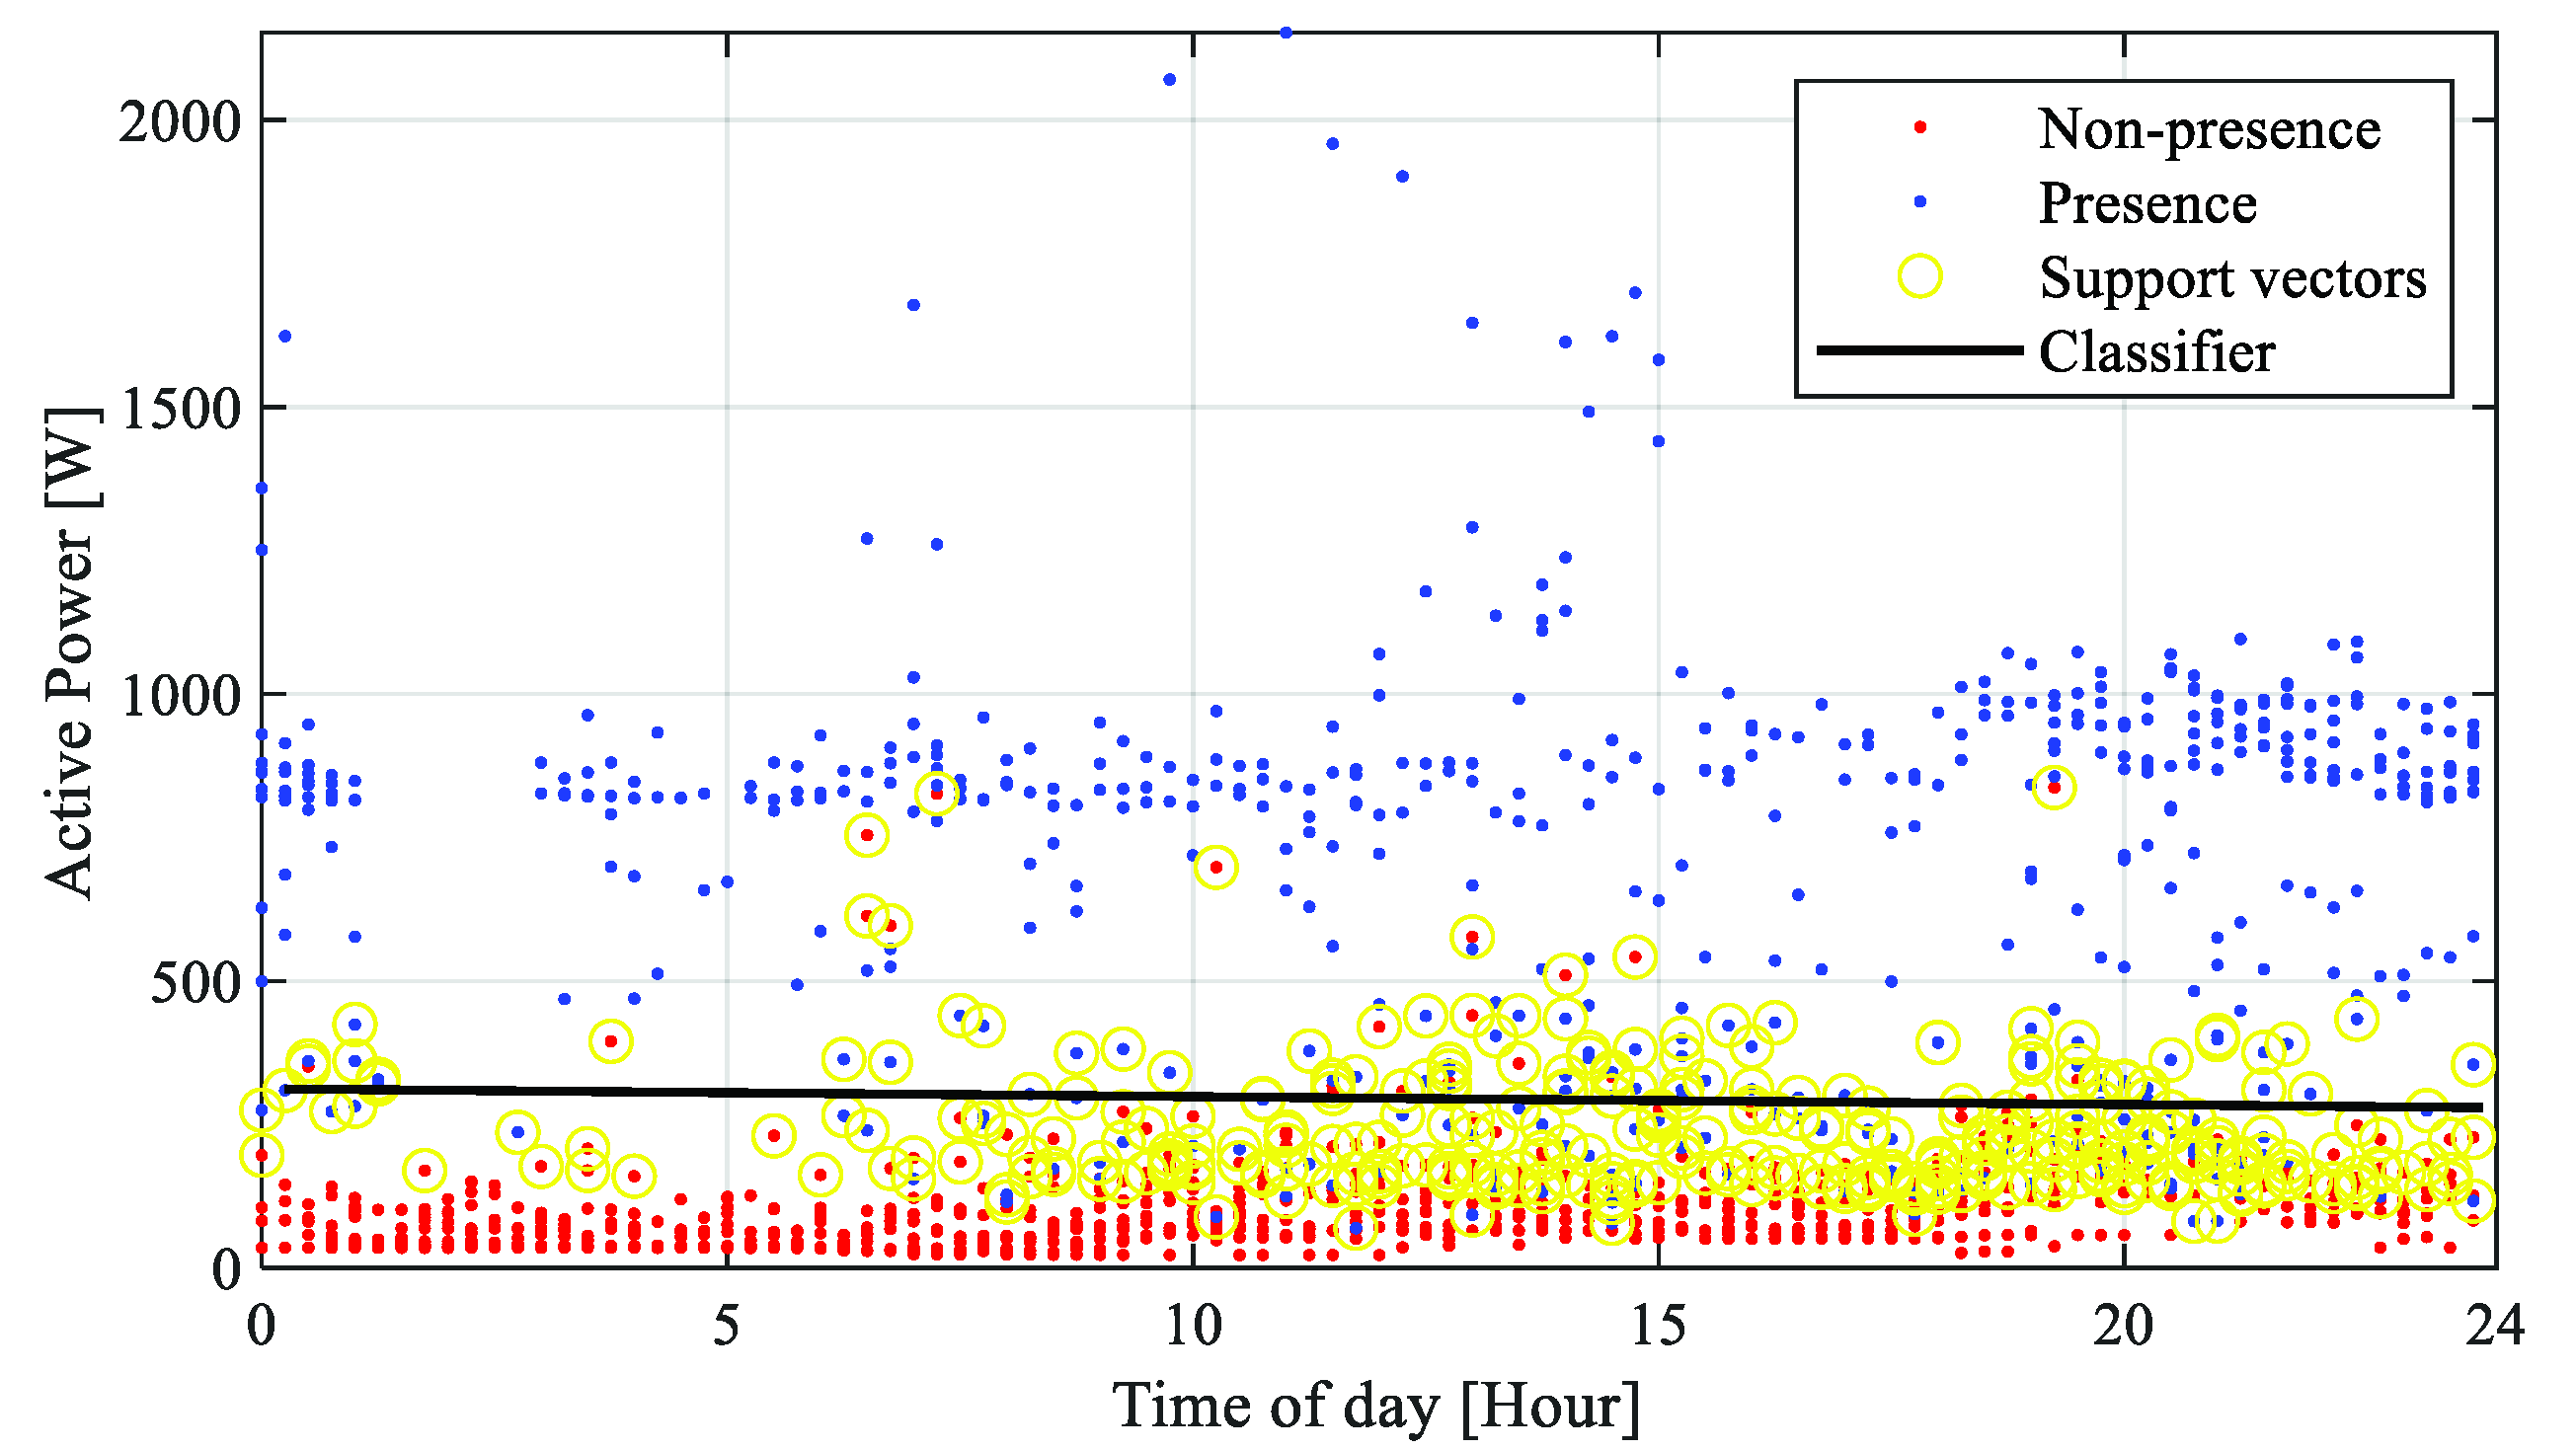
3.1. Training
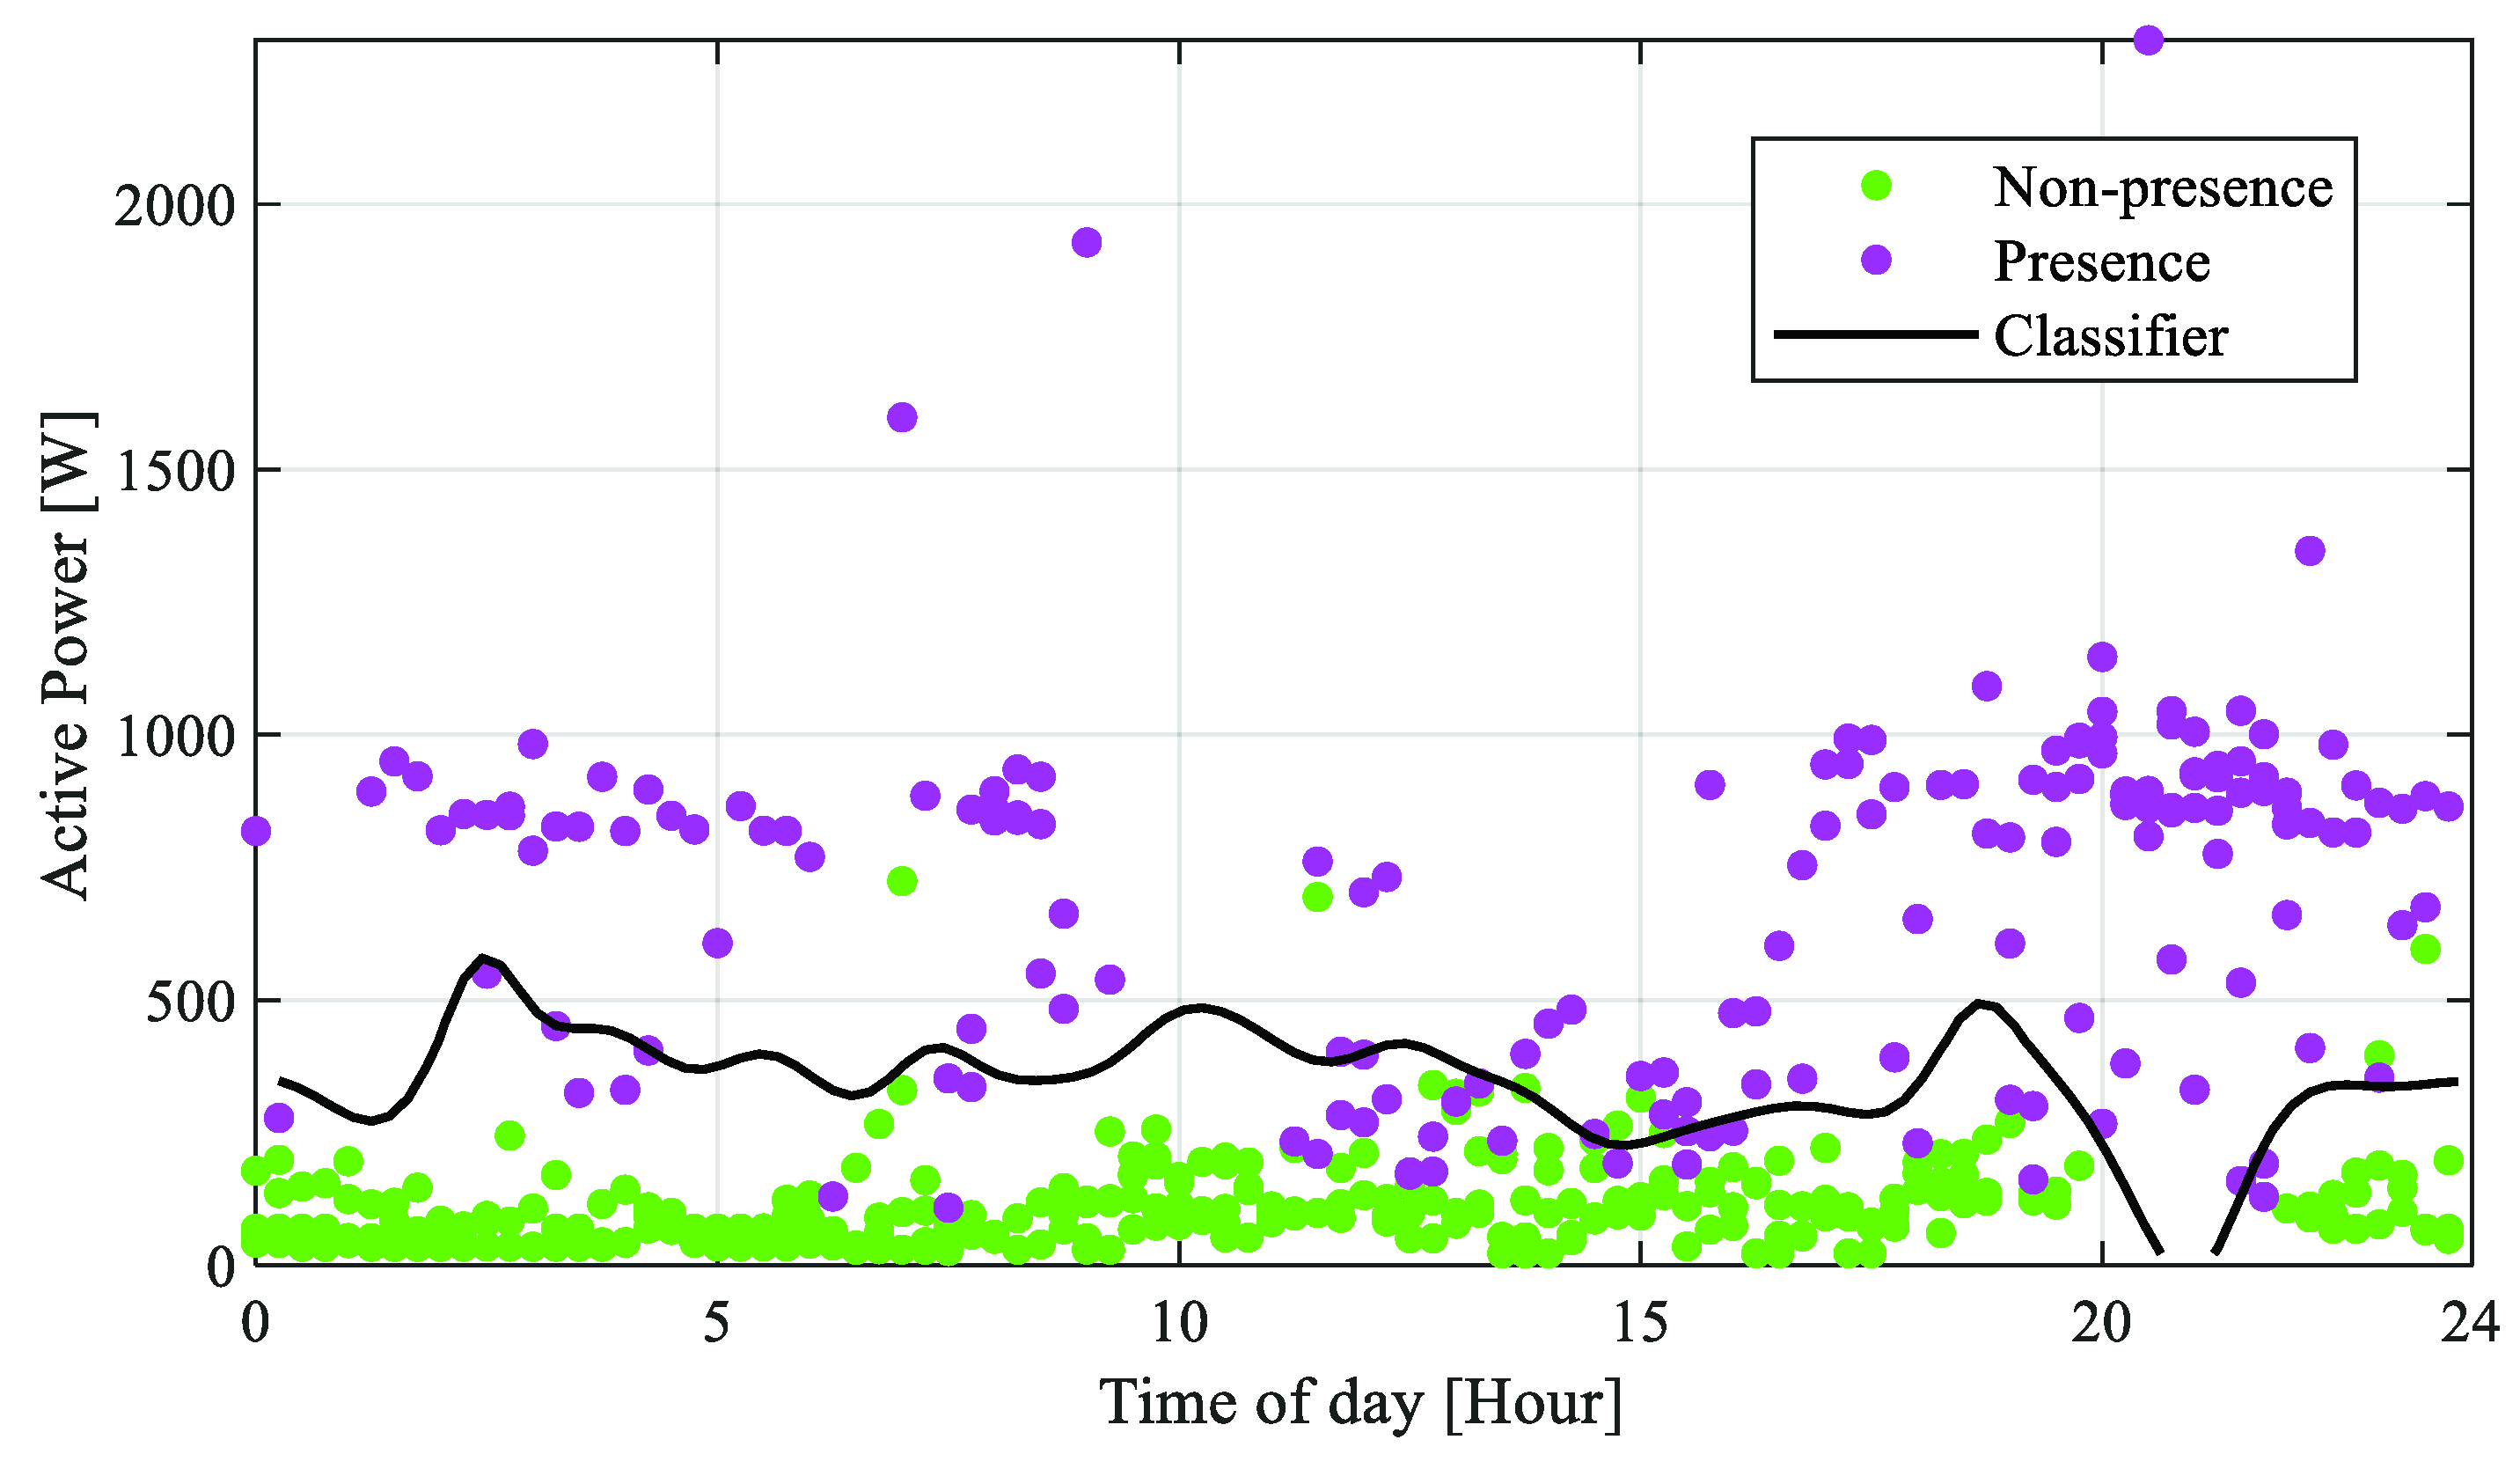
3.2. Validation
4. Discussion
5. Conclusions
Author Contributions
Funding
Institutional Review Board Statement
Informed Consent Statement
Data Availability Statement
Acknowledgments
Conflicts of Interest
References
- Taştan, M. A low-cost air quality monitoring system based on Internet of Things for smart homes. J. Ambient Intell. Smart Environ. 2022, 14, 351–374. [Google Scholar] [CrossRef]
- Adoghe, A.U.; Owuama, E.C.; Oguntosin, V.; Morawo, B. Design and Implementation of a Low-Cost Cloud-Powered Home Automation System. J. Eng. Sci. Technol. Rev. 2022, 15, 177–192. [Google Scholar] [CrossRef]
- Esquicha-Tejada, J.D.; Copa-Pineda, J.C. Low-Cost and Energy-Efficient Alternatives for Home Automation using IoT. Int. J. Interact. Mob. Technol. 2022, 16, 153–168. [Google Scholar] [CrossRef]
- Paredes-Torres, M.; Cando-Zumba, A.d.R.; Varela-Aldás, J. Income Tax for Microenterprises in the COVID-19 Pandemic: A Case Study on Ecuador. Sustainability 2022, 14, 2537. [Google Scholar] [CrossRef]
- Chioran, D.; Valean, H. Low Cost Autonomous Learning and Advising Smart Home Automation System. Intell. Autom. Soft Comput. 2022, 31, 1939–1952. [Google Scholar] [CrossRef]
- Liu, Y.; Liu, Q.; Guan, H.; Li, X.; Bi, D.; Guo, Y.; Sun, H. Optimization Strategy of Configuration and Scheduling for User-Side Energy Storage. Electronics 2021, 11, 120. [Google Scholar] [CrossRef]
- Behrendt, F. Cycling the Smart and Sustainable City: Analyzing EC Policy Documents on Internet of Things, Mobility and Transport, and Smart Cities. Sustainability 2019, 11, 763. [Google Scholar] [CrossRef] [Green Version]
- Kumar, S.; Tiwari, P.; Zymbler, M. Internet of Things is a revolutionary approach for future technology enhancement: A review. J. Big Data 2019, 6, 111. [Google Scholar] [CrossRef] [Green Version]
- Toapanta, J.; Miranda, M.; Andaluz, V.H.; Palacios-Navarro, G.; Varela-Aldás, J. Control of a Security Door Through the Internet of Things. In Communications in Computer and Information Science; Springer: Berlin/Heidelberg, Germany, 2022; pp. 391–397. [Google Scholar]
- Zantalis, F.; Koulouras, G.; Karabetsos, S.; Kandris, D. A Review of Machine Learning and IoT in Smart Transportation. Futur. Internet 2019, 11, 94. [Google Scholar] [CrossRef] [Green Version]
- Sfar, A.R.; Chtourou, Z.; Challal, Y. A systemic and cognitive vision for IoT security: A case study of military live simulation and security challenges. In Proceedings of the IEEE 2017 International Conference on Smart, Monitored and Controlled Cities (SM2C), Kerkennah-Sfax, Tunisia, 17–19 February 2017; pp. 101–105. [Google Scholar]
- Andrade, R.; Ortiz-Garcés, I.; Tintin, X.; Llumiquinga, G. Factors of Risk Analysis for IoT Systems. Risks 2022, 10, 162. [Google Scholar] [CrossRef]
- Lin, T.-W. A Privacy-Preserved ID-Based Secure Communication Scheme in 5G-IoT Telemedicine Systems. Sensors 2022, 22, 6838. [Google Scholar] [CrossRef] [PubMed]
- Riaz, A.R.; Gilani, S.M.M.; Naseer, S.; Alshmrany, S.; Shafiq, M.; Choi, J.-G. Applying Adaptive Security Techniques for Risk Analysis of Internet of Things (IoT)-Based Smart Agriculture. Sustainability 2022, 14, 10964. [Google Scholar] [CrossRef]
- Ullah, I.; Alkhalifah, A.; Khan, M.A.; Mostafa, S.M. Cost-Effective Proxy Signcryption Scheme for Internet of Things. Mob. Inf. Syst. 2021, 2021, 2427434. [Google Scholar] [CrossRef]
- Zanella, A.; Bui, N.; Castellani, A.; Vangelista, L.; Zorzi, M. Internet of Things for Smart Cities. IEEE Internet Things J. 2014, 1, 22–32. [Google Scholar] [CrossRef]
- Astill, J.; Dara, R.A.; Fraser, E.D.G.; Roberts, B.; Sharif, S. Smart poultry management: Smart sensors, big data, and the internet of things. Comput. Electron. Agric. 2020, 170, 105291. [Google Scholar] [CrossRef]
- Alsareii, S.A.; Shaf, A.; Ali, T.; Zafar, M.; Alamri, A.M.; AlAsmari, M.Y.; Irfan, M.; Awais, M. IoT Framework for a Decision-Making System of Obesity and Overweight Extrapolation among Children, Youths, and Adults. Life 2022, 12, 1414. [Google Scholar] [CrossRef]
- Khan, F.; Siddiqui, M.A.B.; Rehman, A.U.; Khan, J.; Asad, M.T.S.A.; Asad, A. IoT Based Power Monitoring System for Smart Grid Applications. In Proceedings of the IEEE 2020 International Conference on Engineering and Emerging Technologies (ICEET), Lahore, Pakistan, 22–23 February 2020; pp. 1–5. [Google Scholar]
- Jebroni, Z.; Afonso, J.A.; Tidhaf, B. Home Energy Monitoring System Towards Smart Control of Energy Consumption. In Lecture Notes of the Institute for Computer Sciences, Social Informatics and Telecommunications Engineering; Springer: Berlin/Heidelberg, Germany, 2019; pp. 40–53. [Google Scholar]
- Varela-Aldás, J.; Silva, S.; Palacios-Navarro, G. IoT-Based Alternating Current Electrical Parameters Monitoring System. Energies 2022, 15, 6637. [Google Scholar] [CrossRef]
- Ahmed, M.M.; Qays, M.O.; Abu-Siada, A.; Muyeen, S.M.; Hossain, M.L. Cost-Effective Design of IoT-Based Smart Household Distribution System. Designs 2021, 5, 55. [Google Scholar] [CrossRef]
- Almusaylim, Z.A.; Zaman, N. A review on smart home present state and challenges: Linked to context-awareness internet of things (IoT). Wirel. Netw. 2019, 25, 3193–3204. [Google Scholar] [CrossRef]
- Buele, J.; Morales-Sánchez, J.C.; Varela-Aldás, J.; Palacios-Navarro, G.; Ayala-Chauvin, M. Electric Monitoring System for Residential Customers Using Wireless Technology. In Lecture Notes in Computer Science (Including Subseries Lecture Notes in Artificial Intelligence and Lecture Notes in Bioinformatics); Springer: Berlin/Heidelberg, Germany, 2022; pp. 560–575. [Google Scholar]
- Hussain, H.; Javaid, N.; Iqbal, S.; Hasan, Q.; Aurangzeb, K.; Alhussein, M. An Efficient Demand Side Management System with a New Optimized Home Energy Management Controller in Smart Grid. Energies 2018, 11, 190. [Google Scholar] [CrossRef]
- Khan, M.; Silva, B.N.; Han, K. Internet of Things Based Energy Aware Smart Home Control System. IEEE Access 2016, 4, 7556–7566. [Google Scholar] [CrossRef]
- Bola, M.H.; Onwuka, E.N.; Zubair, S. An Efficient Energy Management in Buildings Using IoT—A Survey. In Proceedings of the IEEE 2019 15th International Conference on Electronics, Computer and Computation (ICECCO), Abuja, Nigeria, 10–12 December 2019; pp. 1–6. [Google Scholar]
- Minh, Q.N.; Nguyen, V.-H.; Quy, V.K.; Ngoc, L.A.; Chehri, A.; Jeon, G. Edge Computing for IoT-Enabled Smart Grid: The Future of Energy. Energies 2022, 15, 6140. [Google Scholar] [CrossRef]
- Kwon, K.; Lee, S.; Kim, S. AI-based home energy management system considering energy efficiency and resident satisfaction. IEEE Internet Things J. 2021, 9, 1608–1621. [Google Scholar] [CrossRef]
- Sepasgozar, S.; Karimi, R.; Farahzadi, L.; Moezzi, F.; Shirowzhan, S.; Ebrahimzadeh, S.M.; Hui, F.; Aye, L. A Systematic Content Review of Artificial Intelligence and the Internet of Things Applications in Smart Home. Appl. Sci. 2020, 10, 3074. [Google Scholar] [CrossRef]
- Mosavi, A.; Salimi, M.; Faizollahzadeh Ardabili, S.; Rabczuk, T.; Shamshirband, S.; Varkonyi-Koczy, A. State of the Art of Machine Learning Models in Energy Systems, a Systematic Review. Energies 2019, 12, 1301. [Google Scholar] [CrossRef] [Green Version]
- Burlig, F.; Knittel, C.; Rapson, D.; Reguant, M.; Wolfram, C. Machine Learning from Schools about Energy Efficiency. J. Assoc. Environ. Resour. Econ. 2020, 7, 1181–1217. [Google Scholar] [CrossRef]
- Abdel-Razek, S.A.; Marie, H.S.; Alshehri, A.; Elzeki, O.M. Energy Efficiency through the Implementation of an AI Model to Predict Room Occupancy Based on Thermal Comfort Parameters. Sustainability 2022, 14, 7734. [Google Scholar] [CrossRef]
- Seyedzadeh, S.; Rahimian, F.P.; Glesk, I.; Roper, M. Machine learning for estimation of building energy consumption and performance: A review. Vis. Eng. 2018, 6, 5. [Google Scholar] [CrossRef]
- Jadhav, A.; Mostafa, S.M.M.; Elmannai, H.; Karim, F.K. An Empirical Assessment of Performance of Data Balancing Techniques in Classification Task. Appl. Sci. 2022, 12, 3928. [Google Scholar] [CrossRef]
- Zendehboudi, A.; Baseer, M.A.; Saidur, R. Application of support vector machine models for forecasting solar and wind energy resources: A review. J. Clean. Prod. 2018, 199, 272–285. [Google Scholar] [CrossRef]
- Muzzammel, R.; Raza, A. A Support Vector Machine Learning-Based Protection Technique for MT-HVDC Systems. Energies 2020, 13, 6668. [Google Scholar] [CrossRef]
- Gao, Y.; Sun, S. An empirical evaluation of linear and nonlinear kernels for text classification using Support Vector Machines. In Proceedings of the IEEE 2010 Seventh International Conference on Fuzzy Systems and Knowledge Discovery, Yantai, China, 10–12 August 2010; pp. 1502–1505. [Google Scholar]
- Chauhan, V.K.; Dahiya, K.; Sharma, A. Problem formulations and solvers in linear SVM: A review. Artif. Intell. Rev. 2019, 52, 803–855. [Google Scholar] [CrossRef]
- Álvarez-Alvarado, J.M.; Ríos-Moreno, J.G.; Obregón-Biosca, S.A.; Ronquillo-Lomelí, G.; Ventura-Ramos, E.; Trejo-Perea, M. Hybrid Techniques to Predict Solar Radiation Using Support Vector Machine and Search Optimization Algorithms: A Review. Appl. Sci. 2021, 11, 1044. [Google Scholar] [CrossRef]
- Lentzas, A.; Vrakas, D. Machine learning approaches for non-intrusive home absence detection based on appliance electrical use. Expert Syst. Appl. 2022, 210, 118454. [Google Scholar] [CrossRef]
- Htun, S.N.N.; Zin, T.T.; Hama, H. Virtual Grounding Point Concept for Detecting Abnormal and Normal Events in Home Care Monitoring Systems. Appl. Sci. 2020, 10, 3005. [Google Scholar] [CrossRef]
- Franco, P.; Martinez, J.M.; Kim, Y.-C.; Ahmed, M.A. IoT Based Approach for Load Monitoring and Activity Recognition in Smart Homes. IEEE Access 2021, 9, 45325–45339. [Google Scholar] [CrossRef]
- Nawal, Y.; Oussalah, M.; Fergani, B.; Fleury, A. New incremental SVM algorithms for human activity recognition in smart homes. J. Ambient Intell. Humaniz. Comput. 2022, 13, 1–18. [Google Scholar] [CrossRef]
- Emporia Gen 2 Vue Energy Monitor. Available online: https://www.emporiaenergy.com/technical-specs (accessed on 30 September 2022).
- Cristianini, N.; Shawe-Taylor, J. An Introduction to Support Vector Machines and Other Kernel-Based Learning Methods; Cambridge University Press: Cambridge, UK, 2000; ISBN 9780521780193. [Google Scholar]


| Features | Details |
|---|---|
| Input voltage | 100–240 [V] |
| Current | Max 200 [A] |
| 200A sensor ports | 3 × 3.5 mm two-pole audio connector |
| Frequency | 50–60 [Hz] |
| Power Consumption | Max 3 W |
| Phase | single-phase up to 240 [V] line-neutral single, split-phase 120/240 [V] three-phase up to 415 Y/240 [V] (no Delta) |
| WiFi | 2.4 GHz 802.11 b/g/n |
| Certification | UL/IEC/EN 62368-1 |
| Operating Conditions | −40 to +50 [°C] | 0 to 80% RH |
| Prediction | ||||
|---|---|---|---|---|
| Non-Presence | Presence | Performance | ||
| Label | Non-Presence | 300 | 8 | 97.4% |
| Presence | 32 | 140 | 81.4% | |
| Total | 91.67% | |||
| Prediction | ||||
|---|---|---|---|---|
| Non-Presence | Presence | Performance | ||
| Label | Non-Presence | 298 | 10 | 96.75% |
| Presence | 25 | 147 | 85.47% | |
| Total | 92.71% | |||
Publisher’s Note: MDPI stays neutral with regard to jurisdictional claims in published maps and institutional affiliations. |
© 2022 by the authors. Licensee MDPI, Basel, Switzerland. This article is an open access article distributed under the terms and conditions of the Creative Commons Attribution (CC BY) license (https://creativecommons.org/licenses/by/4.0/).
Share and Cite
Varela-Aldás, J.; Toasa, R.M.; Baldeon Egas, P.F. Support Vector Machine Binary Classifiers of Home Presence Using Active Power. Designs 2022, 6, 108. https://doi.org/10.3390/designs6060108
Varela-Aldás J, Toasa RM, Baldeon Egas PF. Support Vector Machine Binary Classifiers of Home Presence Using Active Power. Designs. 2022; 6(6):108. https://doi.org/10.3390/designs6060108
Chicago/Turabian StyleVarela-Aldás, José, Renato Mauricio Toasa, and Paul Francisco Baldeon Egas. 2022. "Support Vector Machine Binary Classifiers of Home Presence Using Active Power" Designs 6, no. 6: 108. https://doi.org/10.3390/designs6060108