Article

Optimization and Design of a Flexible Droop Nose Leading Edge Morphing Wing Based on a Novel Black Widow Optimization (B.W.O.) Algorithm—Part II

1
Research Laboratory in Active Controls, Avionics, and Aeroservoelasticity (LARCASE), École de Technolgie Supérieure, Université du Québec, 1100 Notre-Dame West, Montreal, QC H3C1K3, Canada
2
Department of Industrial Engineering, Università di Bologna, Via Zamboni, 33, 40126 Bologna, Italy
*
Author to whom correspondence should be addressed.
Designs 2022, 6(6), 102; https://doi.org/10.3390/designs6060102
Submission received: 15 September 2022 / Revised: 18 October 2022 / Accepted: 20 October 2022 / Published: 1 November 2022
(This article belongs to the Section Vehicle Engineering Design)

Abstract

:
This work presents an aerodynamic and structural optimization for a Droop Nose Leading Edge Morphing airfoil as a high lift device for the UAS-S45. The results were obtained using three optimization algorithms: coupled Particle Swarm Optimization-Pattern Search, Genetic Algorithm, and Black Widow Optimization algorithm. The lift-to-drag ratio was used as the fitness function, and the impact of the choice of optimization algorithm selection on the fitness function was evaluated. The optimization was carried out at various Mach numbers of 0.08, 0.1, and 0.15, respectively, and at the cruise and take-off flight conditions. All these optimization algorithms obtained effectively comparable lift-to-drag ratio results with differences of less than 0.03% and similar airfoil geometries and pressure distributions. In addition, an unsteady analysis of a Variable Morphing Leading Edge airfoil with a dynamic meshing scheme was carried out to study its flow behaviour at different angles of attack and the feasibility of leading-edge downward deflection as a stall control mechanism. The numerical results showed that the variable morphing leading edge reduces the flow separation areas over an airfoil and increases the stall angle of attack. Furthermore, a preliminary investigation was conducted into the design and sensitivity analysis of a morphing leading-edge structure of the UAS-S45 wing integrated with an internal actuation mechanism. The correlation and determination matrices were computed for the composite wing geometry for sensitivity analysis to obtain the parameters with the highest correlation coefficients. The parameters include the composite material qualities, thickness, ply angles, and the ply stacking sequence. These findings can be utilized to design the flexible skin optimization framework, obtain the target droop nose deflections for the morphing leading edge, and design an improved model.

1. Introduction

Various environmental requirements have pushed the aircraft industry to design fuel-efficient and quieter aircraft [1]. One possible strategy is improving an aircraft’s aerodynamic efficiency, thus reducing the fuel needed for flights. However, the traditional approaches to further increase the aerodynamic efficiency (such as the lift-to-drag ratio) using the conventional wing configurations are facing limitations. Accordingly, researchers are introducing novel, cutting-edge technologies, such as adaptive morphing structures for flight optimization and flow management over the wing [2,3,4,5]. Morphing structures have been investigated for several years, and the problems faced are mentioned in the literature [6,7,8,9,10,11,12,13,14]. A wide range of morphing structures has been studied in the aviation industry on fighter aircraft [15], regional aircraft [16,17,18], uncrewed air vehicles [19,20,21,22], and General Aviation aircraft [8,23,24].
“Morphing” may be mainly used on uncrewed aerial vehicles due to their smaller scale and lesser complexity in terms of wing design structure and energy consumption, especially in terms of actuation power (UAVs) [25,26,27,28,29,30]. A telescoping spar and rib system was used to build an Unmanned Aerial Vehicle (UAV) morphing wing capable of modifying its wing span and altering its chord [31]. When compared to its non-morphing original base geometry, a numerical study revealed a drag reduction of up to 23%. Another survey of a medium-sized experimental UAV, ANTEX-M, in which wing morphing aerodynamic optimization of the wing’s upper surface between its leading edge and 55% of its chord, as well as on the changing of the entire wing’s geometry [21]. Similarly, a combat UAV’s aerodynamic and structural multidisciplinary design optimization was carried out, and improved performances were obtained, as shown in [32].
The Research Laboratory in Active Controls, Avionics, and AeroServoElasticity (LARCASE) participated in a morphing wing project called the “Morphing Architectures and Related Technologies for Wing Efficiency Improvement—CRIAQ MDO 505” [33,34] and CRIAQ 7.1 project called “ Laminar Flow Improvement on an Aeroelastic Research Wing” [35,36].
There have been great successes in aircraft optimization processes in the past decade. New intelligent algorithms and computational solvers have completely re-formed the way aircraft design is thought, including through “morphing wing optimization.” Proper analysis of aircraft design using optimization techniques has eliminated the hefty experimental costs of earlier methods and has resulted in improved algorithms and computational solvers [37,38]. In addition, these optimization processes have utilized gradient-based and gradient-free algorithms [37].
The optimization in aircraft design, specifically morphing technology, is significant because the optimized design is required to satisfy the required mission, flight operation, and performance needs. Thus, the choice of the optimization algorithm and the parameterization method is needed, and the comparative analysis makes it possible to obtain suitable outcomes. Although the gradient-based techniques usually have the fastest convergence rates than the metaheuristics, the metaheuristic algorithms have the advantages of solution accuracy, flexibility, and obtaining global optimum solutions. Furthermore, implementing morphing wing technology in the UAV increases the number of design variables, and optimization is required at different mission segments; therefore, finding the optimal global solution becomes essential.
Such as metaheuristics (MHs) were implemented in the inverse problem-based optimization system identification method for small fixed-wing UAVs [39]. A flight test is undertaken to obtain data for the proposed scheme and MHs performance. Based on Freidman’s statistical test, the L-SHADE method was optimal for longitudinal and lateral dynamics, with R-square errors of 0.5465 and 0.0487, respectively. Another study resulted in the design of a reliability optimization methodology based on double-loop optimization (D.O.) approach to solve a multiobjective conceptual design problem of a fixed-wing UAV [40]. Again, state-of-the-art meta-heuristics were employed, and the optimum dynamic parameter settings reduced runtime by 22.5% compared to the traditional metaheuristic run while keeping the competitive results.
A metaheuristic optimization based on a genetic algorithm was used for the UAS-S4 airfoil’s upper surface [41]. The genetic algorithm was coupled with three different optimization methods, and the optimal global solution was obtained for the wing tip demonstrator airfoil. In addition, the algorithm was proven to be robust as it converged to the optimal global region in less than 10 iterations or generations.
An Improved Fruit Fly Optimization Algorithm (IFOA) was developed and used with a C.F.D. solver to handle aerodynamic design optimization challenges [42]. To minimize the drag coefficient, the IFOA was utilized to optimize three aerodynamic shape designs using a C.F.D. solver. In addition, the algorithm’s convergence efficiency was shown for the inverse airfoil design.
The transient aerodynamic characteristics of a flexible leading edge need to be explored, and more research on optimization approaches in the field of morphing wings is required. Many techniques have been used to reduce or eliminate dynamic stalls, including flap fluctuations, synthetic jet/periodic stimulation, and plasma actuators [43,44]. Given that the local shape near the airfoil leading edge significantly affects the formation and evolution of dynamic stall vortices [45] changing the leading edge shape could be a more efficient technique to reduce dynamic stall. Variable Droop Leading-Edge (VDLE) devices can provide active flow control to reduce the local Mach number and provide a better pressure distribution towards the leading edge, thereby delaying or eliminating the dynamic stall [46,47].
The drooping of the leading edge of the FX63-137 airfoil at low Reynolds numbers was investigated in [48]. The drooped leading edge has an effective angle of attack five degrees lower than the rest of the airfoil, which allows a higher maximum lift coefficient and a smaller stall angle. Such a leading-edge angle deflection could improve pressure distribution, reduce an unfavorable pressure gradient, and delay flow separation.
The integration of a leading-edge droop and a Gurney flap to improve rotor airfoil dynamic stall and post-stall was investigated [49]. The dynamic stall was delayed for a 20-degree leading-edge droop and 0.5 percent chord Gurney flap. Moreover, the maximum lift coefficient increased, but the negative pitching moment decreased, increasing the lift-to-drag ratio.
A variable droop leading edge was examined to analyze dynamic stall control [50]. The results demonstrated a high reduction in the dynamic stall. With suitable lift coefficients, considerable reductions in drag and pitching-moment coefficients were obtained, and positive damping revealed useful to remove torsional instabilities. The researchers demonstrated that the airfoil variable droop leading-edge reduced drag and increased the dynamic stall’s pitching moment. These results were also obtained for the UH-60A rotor. A numerical technique based on loosely coupled C.F.D. and complete structural dynamics improved the rotor efficiency and performance.
Although there have been many investigations into the aerodynamic optimization of morphing wings, most studies focus on examining the optimization framework. First, it is significant to study the impact of metaheuristic selection on aerodynamic optimization outcomes and computing time because insufficient data was found in the literature. Second, the use of dynamic meshing with time-dependent morphing airfoil parametrization is hardly observed in the literature. It becomes imperative to analyze the unsteady flow behavior of morphing wings at various angles of attack and the possibility of leading-edge downward deflection as a stall control mechanism.
The research presented in this paper has two broader objectives: To compare three different optimization algorithms and identify the best method for the optimization technique. The optimization algorithms used are the Black Widow Optimization Algorithm, the Genetic Algorithm, and Particle Swarm Optimization. Firstly, the optimal algorithm will be used to optimize the aerodynamic Design of a morphing airfoil under various flight conditions. The second goal is to use a dynamic meshing approach to investigate the unsteady variable morphing leading edge to determine the flow physics and the practicality of leading-edge downward deflection as a stall control mechanism. In addition, a preliminary investigation on the design and sensitivity analysis of a morphing leading-edge structure coupled with an internal actuation system for the UAS-S45 wing will be conducted. Finally, the parameters affecting the wing model will be explored to improve further optimization studies and the prediction of possible failures for each finite element.

2. Methodology

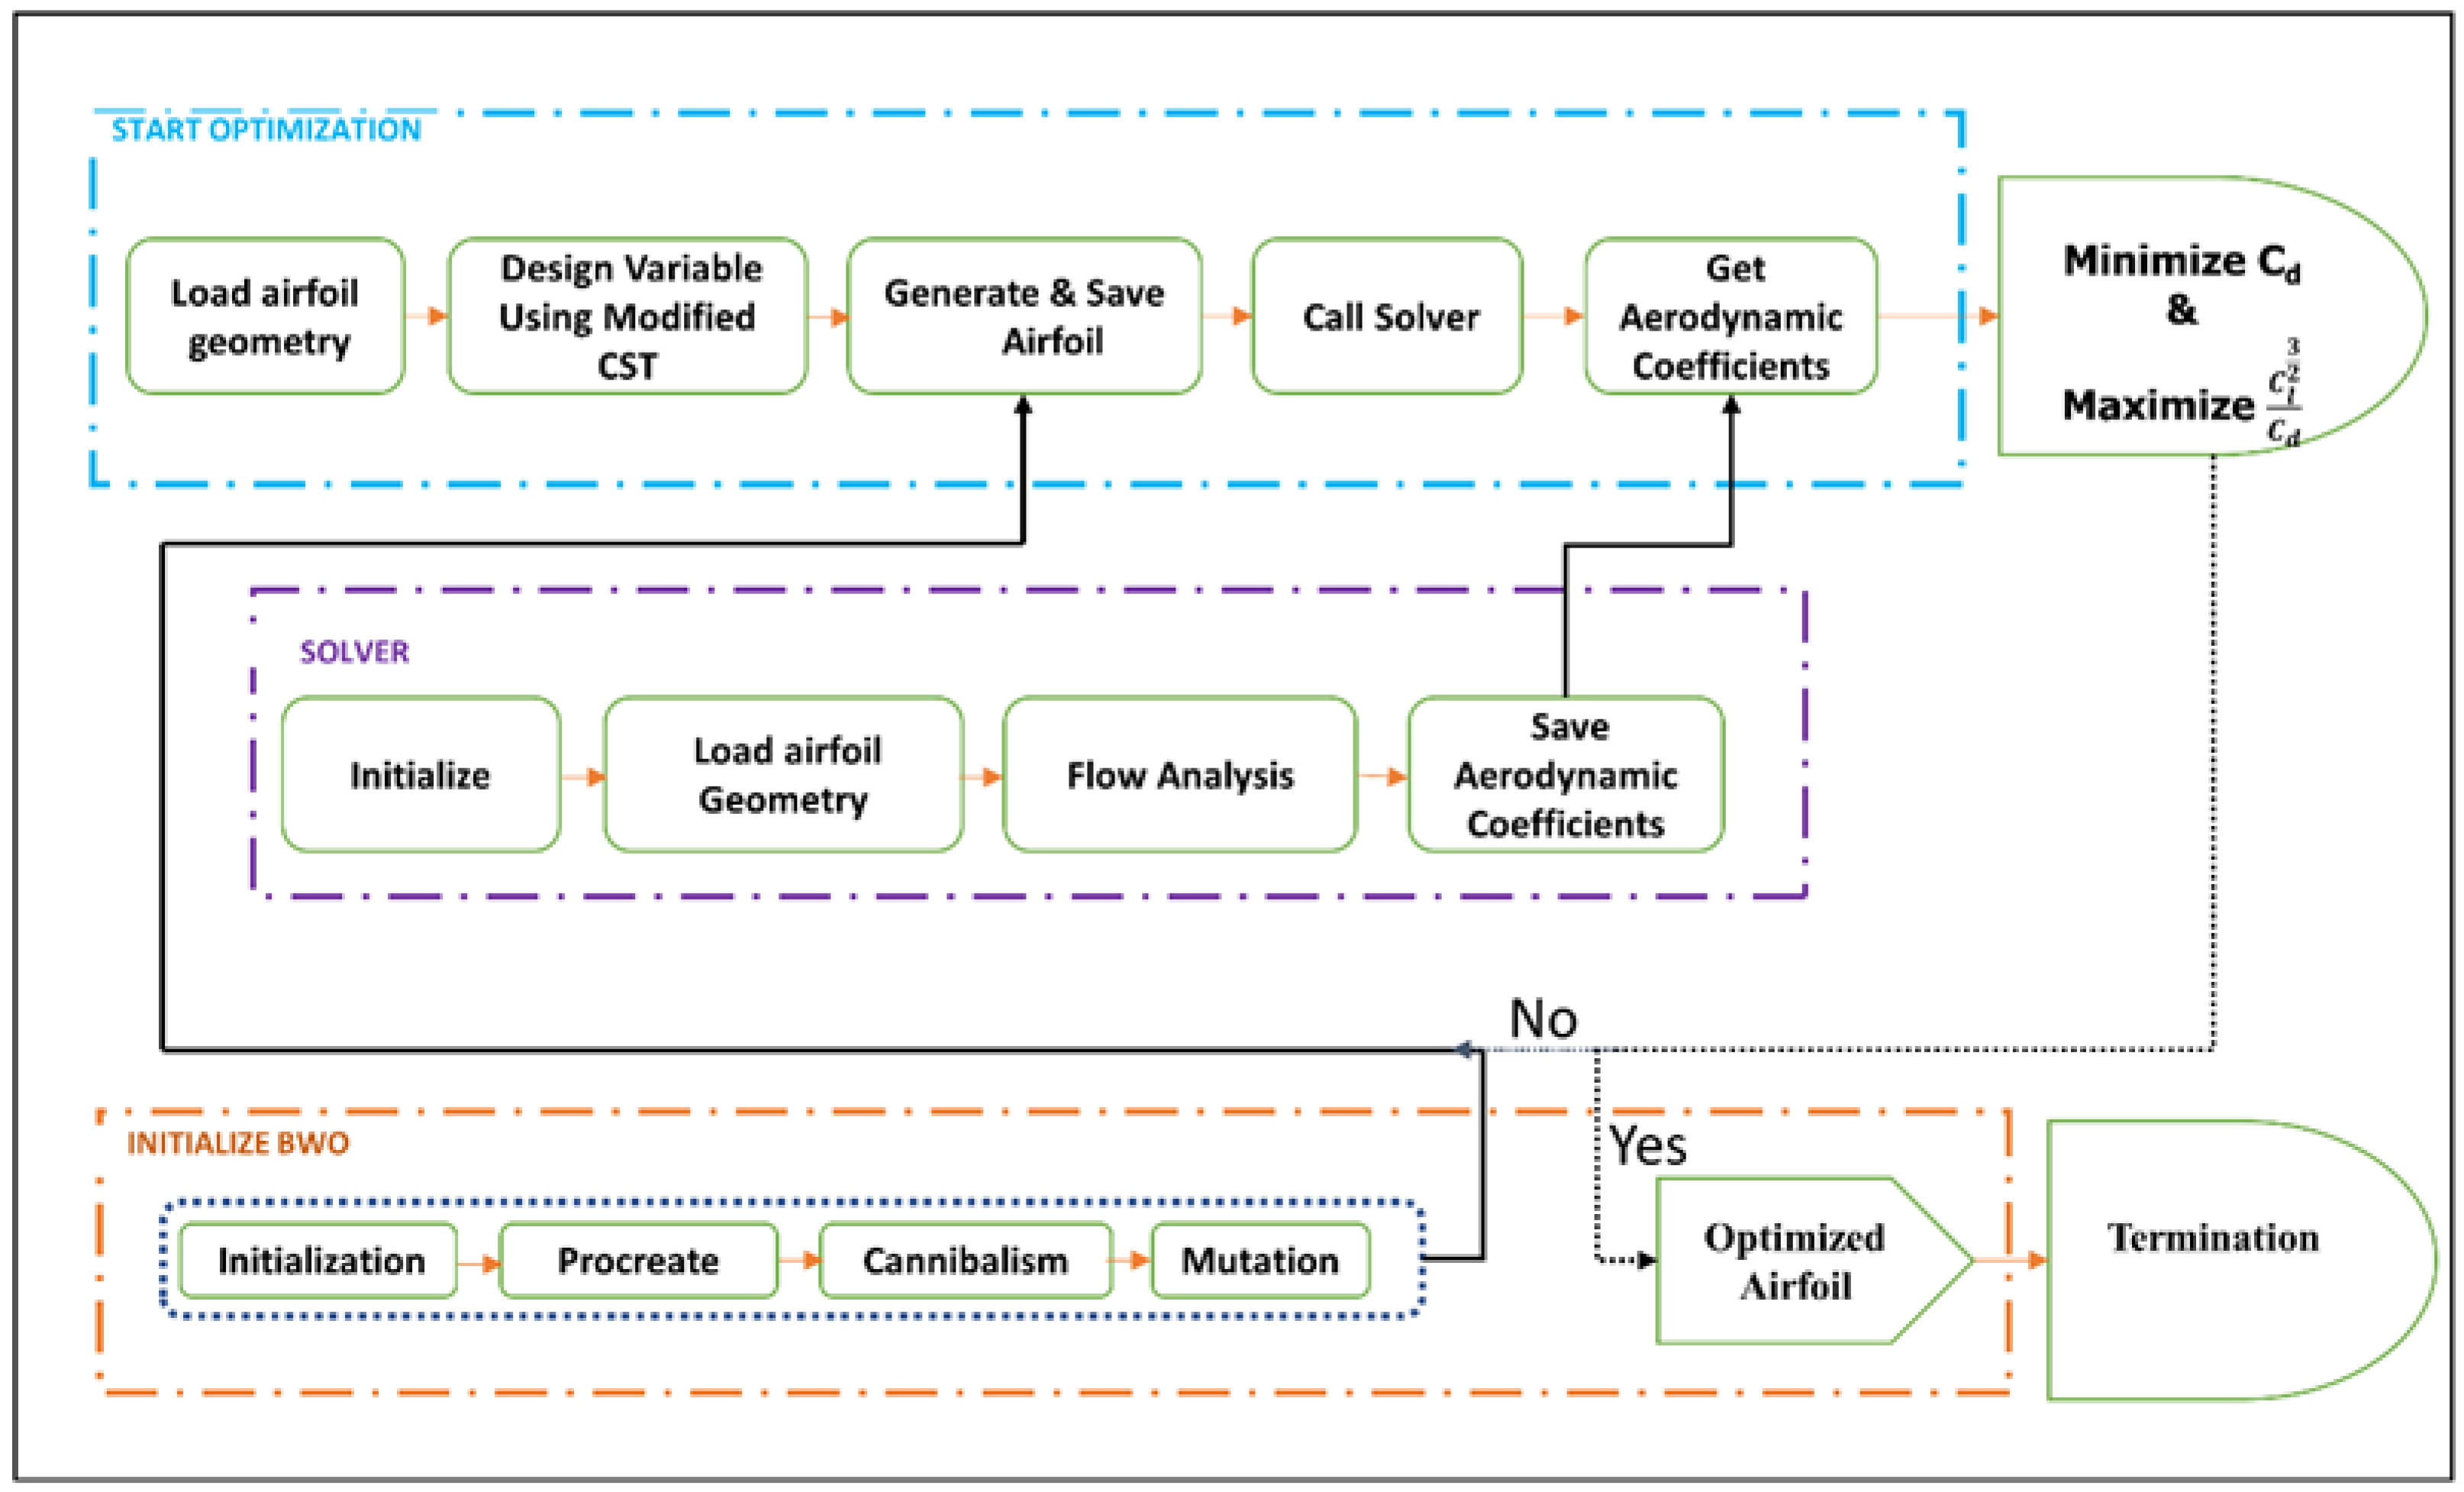
2.1. Aerodynamic Design Optimization

An aerodynamic shape optimization framework defines the Droop Nose Leading Edge (DNLE) morphing. This morphing changes the leading edge to its required aerodynamic shape when actuated. The control of such a kind of morphing involves formulating an objective function for a model using a geometric shape parameterization, an aerodynamic flow solver, and an optimization algorithm to implement the methodology. Figure 1 depicts the optimization framework that was employed in this study. It enables shape parameterization integration with an aerodynamic solver and optimization algorithm. The shape design and the managed control of airfoil shape variables, simultaneously respecting geometrical constraints, is carried out by a parameterization technique called C.S.T. (class/shape transformation), an aerodynamic solver (either XFoil or the Transition S.S.T. model) were used, and three different optimization algorithms to compare their convergence: the Genetic Algorithm (G.A.), Particle Swarm Optimization (PSO) and the Black Widow Optimization (B.W.O.). Our previous paper describes the optimization procedure in detail [51].

2.2. Numerical Approach

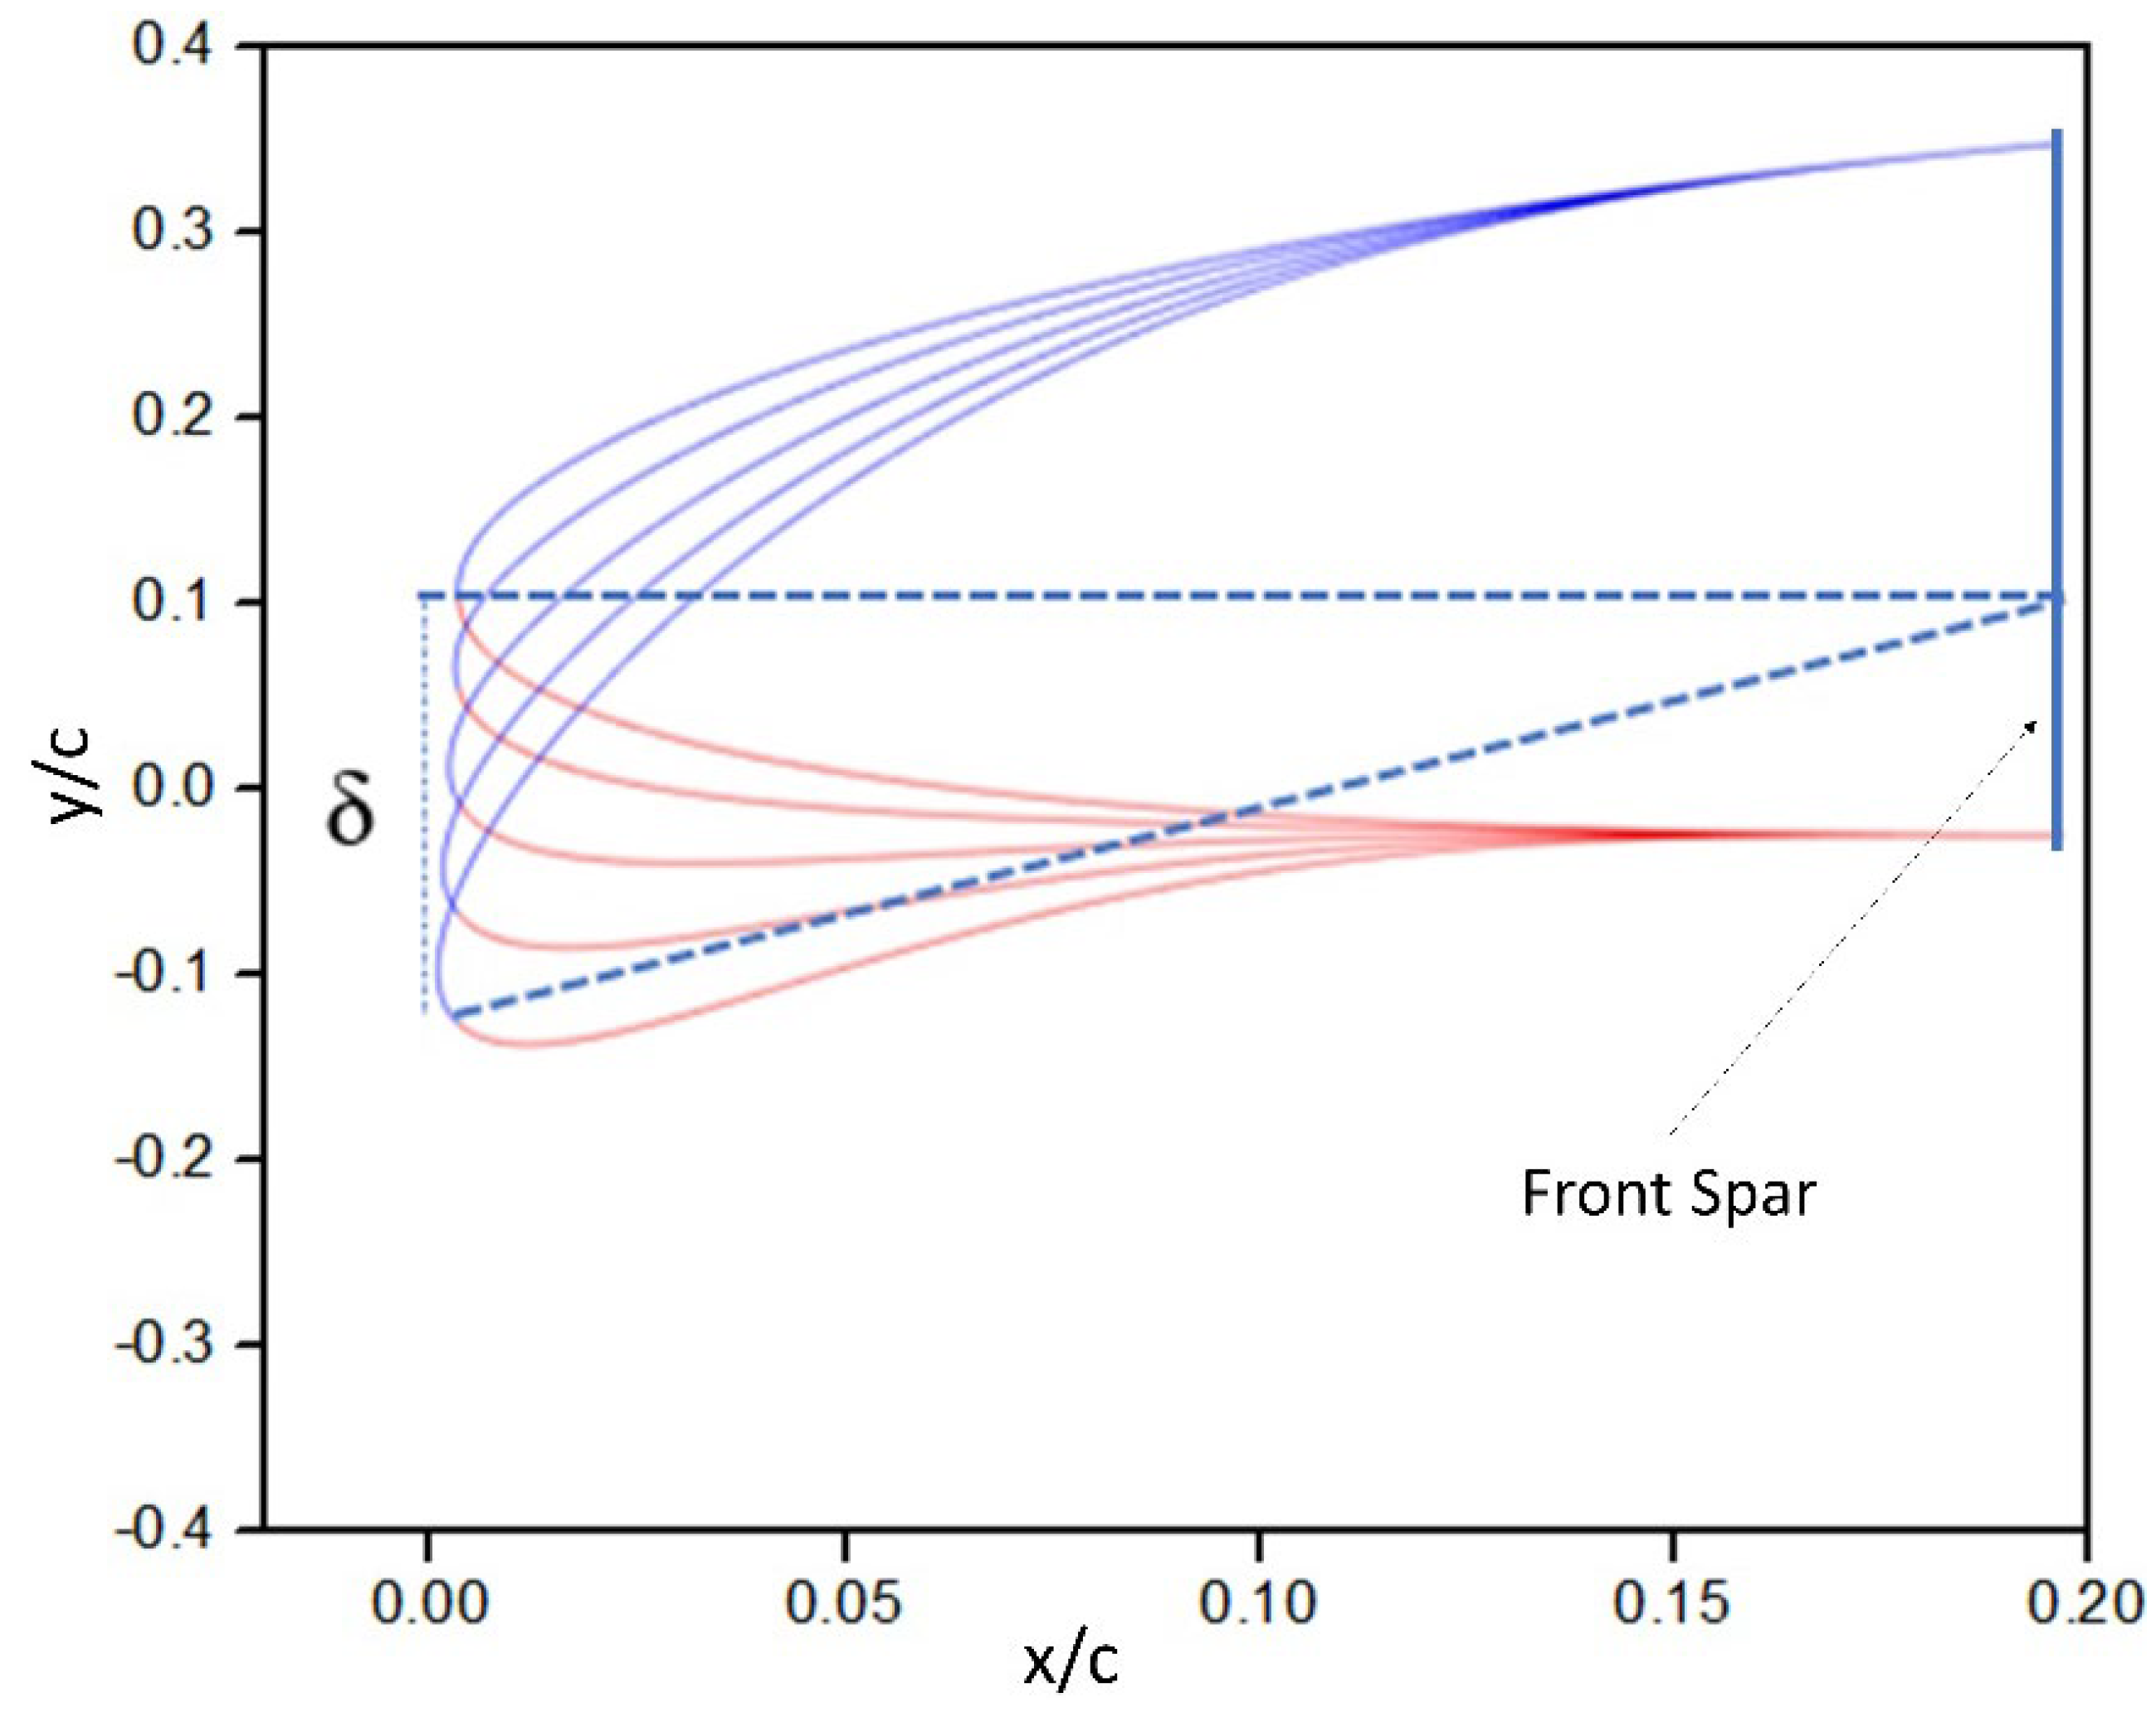
2.2.1. Morphing Model and Method

In the computational framework, a numerical analysis tool is used to evaluate the performance of a dynamic morphing leading edge airfoil geometry in terms of its aerodynamics. A flexible morphing leading edge can achieve a chord-wise and span-wise differential camber variation with the same structural system by providing a smooth shape with no additional gap. A numerical method with dynamic mesh and User-Defined Functions (UDFs) was adopted to study the aerodynamic characteristics of the morphing wing. The Variable Morphing Leading Edge (VMLE) process was obtained in Ansys Fluent.
The parametrization approach used for the leading-edge deflection is based on the third-order polynomial deformation, in which the surface nodes are moved according to the parameterization technique. For the UAS-S45 airfoil, this approach consists of its thickness distribution added to an unsteady shape parametrization of its camber line. The morphing wing section is located in the 0–16% chord of the airfoil, while the rest of the airfoil is fixed. Figure 2 illustrates the motion of the morphing leading edge, where δ is the maximum leading-edge deflection, indicating the vertical distance between the initial unmorphed leading-edge position and the maximum (final) position of the morphing leading edge.

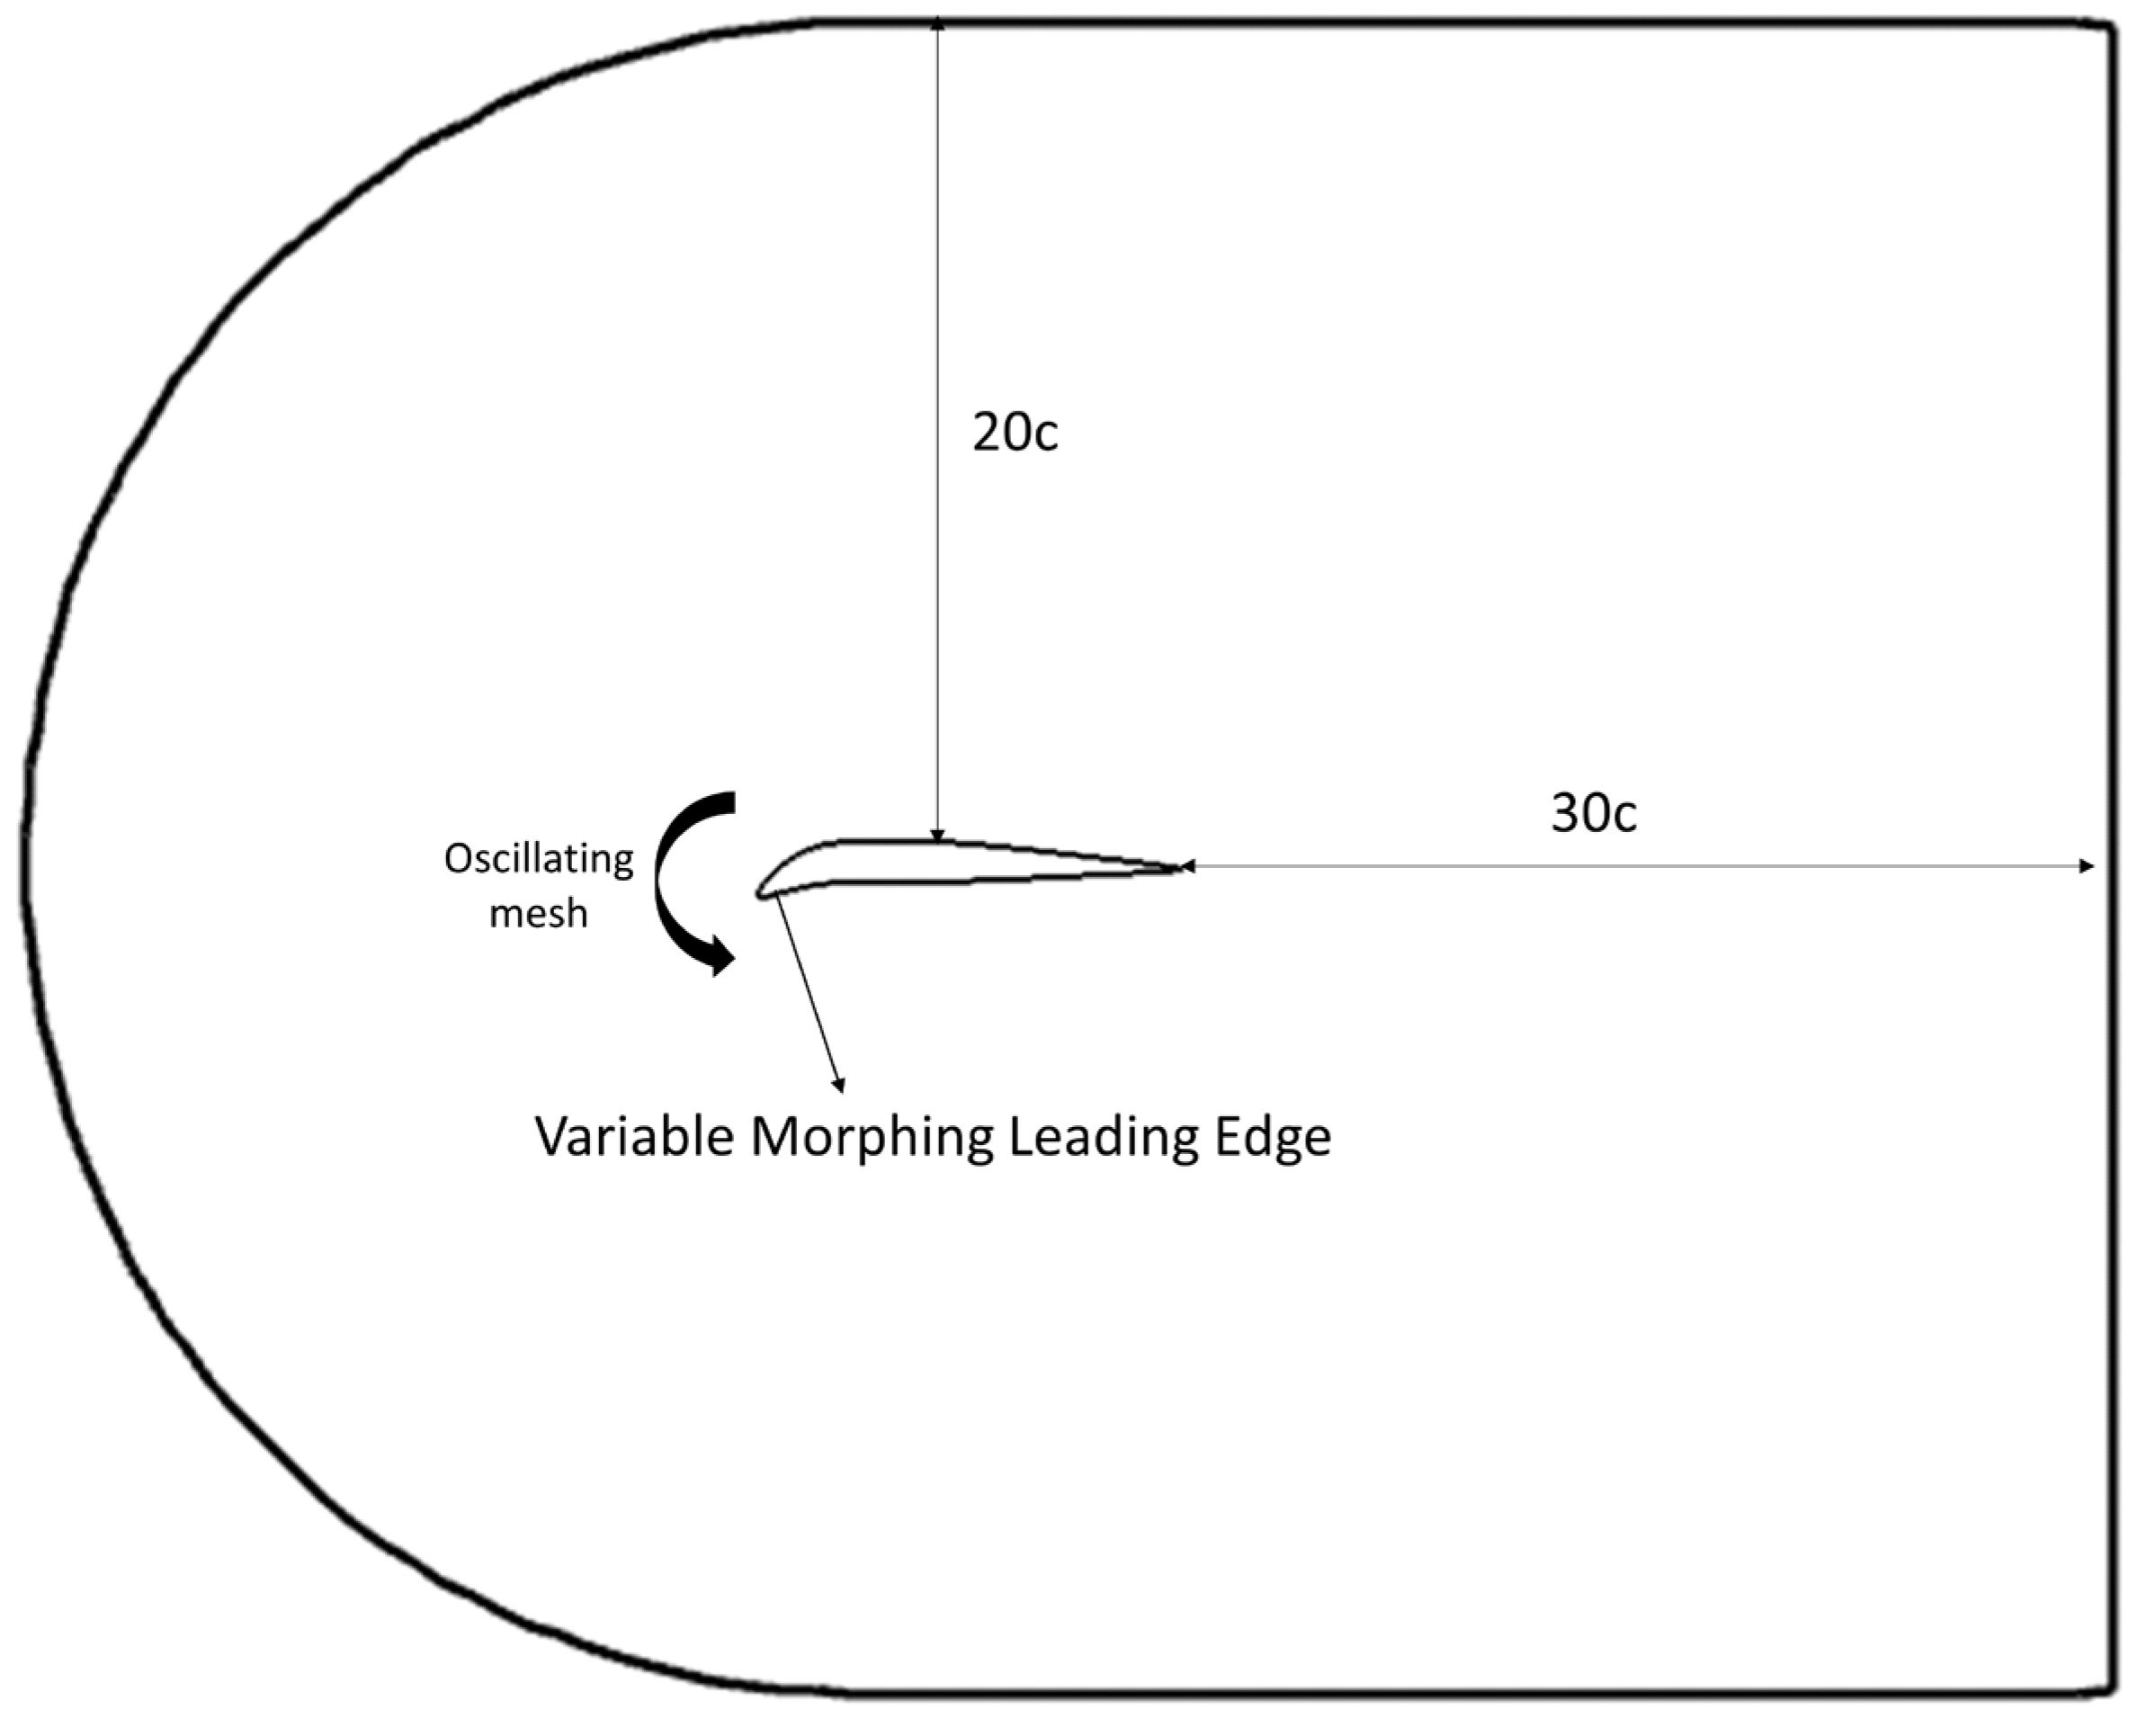
2.2.2. Computational Domain and Method

The C-shaped computational flow domain consists of a UAS-S45 airfoil with a morphing leading edge, as shown in Figure 3. In the present investigation, the γ R e θ     turbulence model was used, and to keep the grids in the viscous sublayer; the first layer height in the wall required a y +   less than one. All spatial terms in conservation equations are discretized using the second-order upwind approach. The solver manages the pressure-velocity coupled algorithm, and the gradient term is computed using the least-squares cell-based configuration. Four boundary conditions are a velocity inlet, a pressure outlet, symmetric faces with airfoils, and a no-slip condition on the wall. The inlet and pressure far field are located at 20-chord lengths (20 c) distance from the leading edge, and the outlet domain is 30 c away. All test cases are performed for a Reynolds number Re = 2.4 × 10⁶ from chord data and a Mach number of 0.10 in a free steam flow velocity of 34 m/s at standard sea-level conditions.

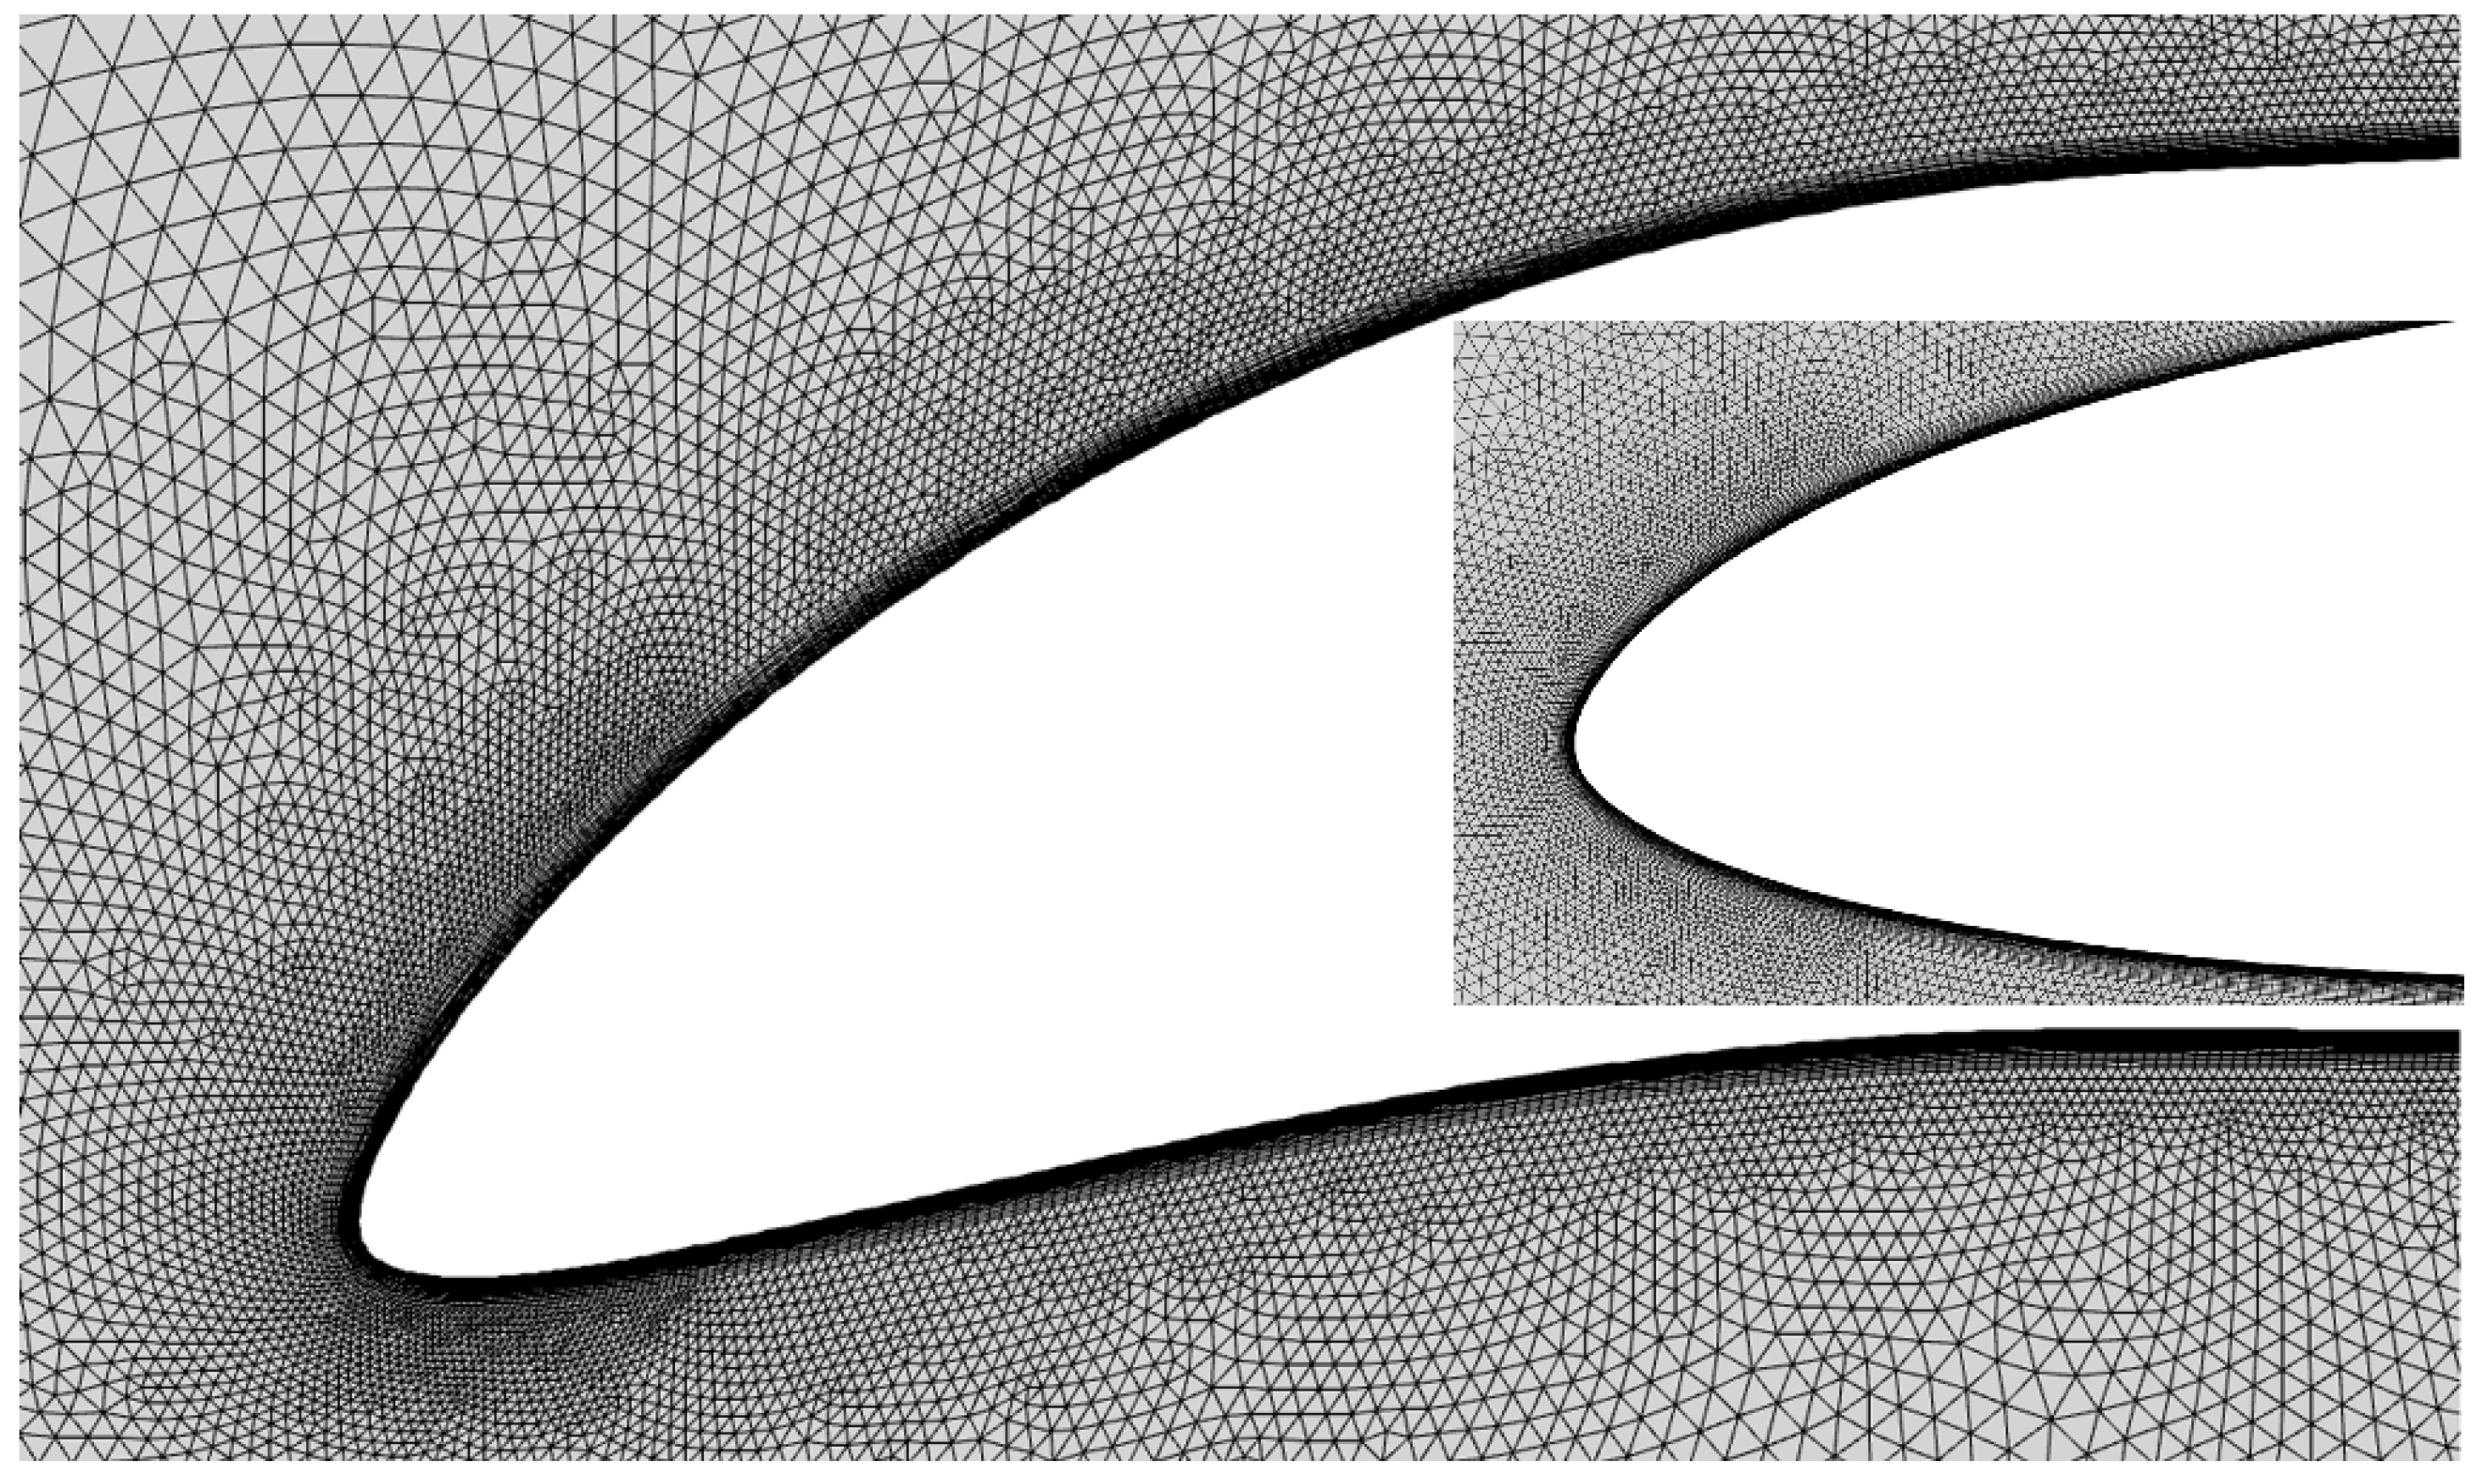
2.2.3. Dynamic Mesh Technique

The dynamic mesh update methods included in ANSYS Fluent were utilized to simultaneously deform the mesh and the geometry while maintaining a high-quality mesh. Diffusion-based smoothing was used because it is more robust at mesh quality preservation (as required for moving boundaries) than spring-based smoothing. The mesh grid is shown in Figure 4. In addition, a User-Defined Function (UDF) was created to include the unsteady parametrization method to use the dynamic meshing schemes in Ansys Fluent. The UDF uses the DEFINE_GRID_MOTION macro included in Ansys Fluent.

3. Results and Discussion

The optimization methodology described in our previous paper [51] was used to determine and improve the aerodynamic performance of the morphing leading-edge airfoil.
The aerodynamic shape optimization was designed to maximize the lift-to-drag coefficient at different Mach numbers of 0.08, 0.1, and 0.15. The unsteady aerodynamic analysis of the morphing leading edge with its downward deflection and its influence on the stall angle of attack was then presented.

3.1. Optimization Results

Three different types of optimizers were utilized, as mentioned previously: the Black Widow Optimization (B.W.O.), the Genetic Algorithm (G.A.), and the Particle Swarm Optimization (PSO). In addition, the C.S.T. parameterization controlled the airfoil shape changes with the angle of attack and leading-edge deflection as variables. All these optimizations were performed at a Mach number of 0.1. Table 1 shows the different algorithm parameters used in the optimization process.
Several separate CPUs were used to minimize the optimization process runtime for different flight cases with all three optimization algorithms. In addition, the optimization was performed to maximize the lift-to-drag ratio as the fitness objective.
The hybrid optimizer based on Particle Swarm Optimization (PSO) coupled with the Pattern Search algorithm was used for the UAS-S45 optimization to enhance the solution convergence and refinement. The PSO is based on a simplified social behavior study closely related to the swarming theory, with a solution set represented by particles that heuristically explore a search space. The efficiency of PSO concerning the efficiency of a genetic algorithm is due to its independence on parameters, namely crossovers and mutations; information is shared amongst the population of particles to update the solution. The updated position of a particle depends on the best solution found by the single particle itself and by the best seen by the whole swarm. This way, the space is explored efficiently, and local minimums do not affect the optimization results.
Figure 5a,b show the pressure coefficient plots for an angle of attack of 2° and 6°, respectively, and a Mach number of 0.1. The morphed airfoil presents a smoother pressure peak at an angle of 2°, with an increased lift-to-drag ratio. It can be observed that a significant pressure variation occurred near the leading edge on the airfoil’s upper side. The suction peak was progressively smoothed and redistributed from the reference airfoil to the optimized airfoil, which can be observed by forming a region of lower pressure on the morphing skin, slowly dissipating up to the mid chord. The pressure bump consecutive to the suction peak in the optimized airfoil was indicative and succeeded by a region providing for the total lift. The upper side pressure curve for the 6° angle of the attack shows the flow acceleration generating a separation bubble, which then attaches to the airfoil.
Genetic algorithms (G.A.s) can solve a wide variety of optimization problems, regardless of whether the fitness function is stable or non-stationary (changes over time), linear or nonlinear, continuous or discontinuous, or subject to random noise. Moreover, because a population’s offspring operates independently, it can simultaneously explore the search space in various directions.
The pressure coefficients obtained by the G.A. are close to those obtained using a hybrid optimizer based on a PSO algorithm, as shown in Figure 6.
The Black Widow Optimization (B.W.O.) algorithm is well-known for its different stages and implementations (Procreate, Cannibalism, and Mutation) at various parameters, including the procreating rate, cannibalism rate, and mutation rate. Figure 7 presents the pressure coefficient plots, showing that the morphing airfoil has a smoother pressure peak at 2° than at 6° and a better lift-to-drag ratio. On the upper surface of an airfoil, the main pressure variation occurred around the leading edge, where a reduced pressure area was formed on the morphing skin, which then gradually degraded up to mid-chord. Further results have been added in Appendix A.
The three optimization algorithms revealed that the B.W.O. converged quickly to the best optimal solution. Therefore, a B.W.O. algorithm-based method was used to investigate additional cases at different angles of attack and Mach numbers of 0.08, 0.1, and 0.15. The analysis was performed to better understand the optimization results at various flight conditions to determine its effectiveness. The lift-to-drag ratios at the three Mach numbers of 0.08, 0.1, and 0.15 and angles of attack from 0 to 10 in 2-degree increments are presented in Figure 8. At Mach 0.08, it is clear that the best improvements in efficiency are obtained at angles of attack of 4 to 6°. Similar trends (best performance) are noticed for Mach 0.10 and 0.15 and 6° angle of attack. Overall, the objective of maximizing the CL/CD ratio showed promising results for all angles of attack.
Figure 9a shows the convergence plots cost variation with the number of iterations obtained with these algorithms at the cruise flight condition. According to the convergence plot for cruise flight conditions at an angle of attack of 20 degrees, the GA requires 16 iterations to achieve a global minimum value of 0.01271, the PSO requires 15 iterations to achieve a global minimum value of 0.01270, and the B.W.O. requires only 14 iterations to reach the global minimum value of 0.012690. For the climb flight condition considered at a 6° angle of attack, both the G.A. and the PSO require 18 iterations to reach the global minimum values of 0.0074038 and 0.0074029, respectively, and the B.W.O. requires only 15 iterations to achieve a global minimum value of 0.007399, as shown in Figure 9b. Thus, the Black Widow Optimization algorithm proved superior to the other two.

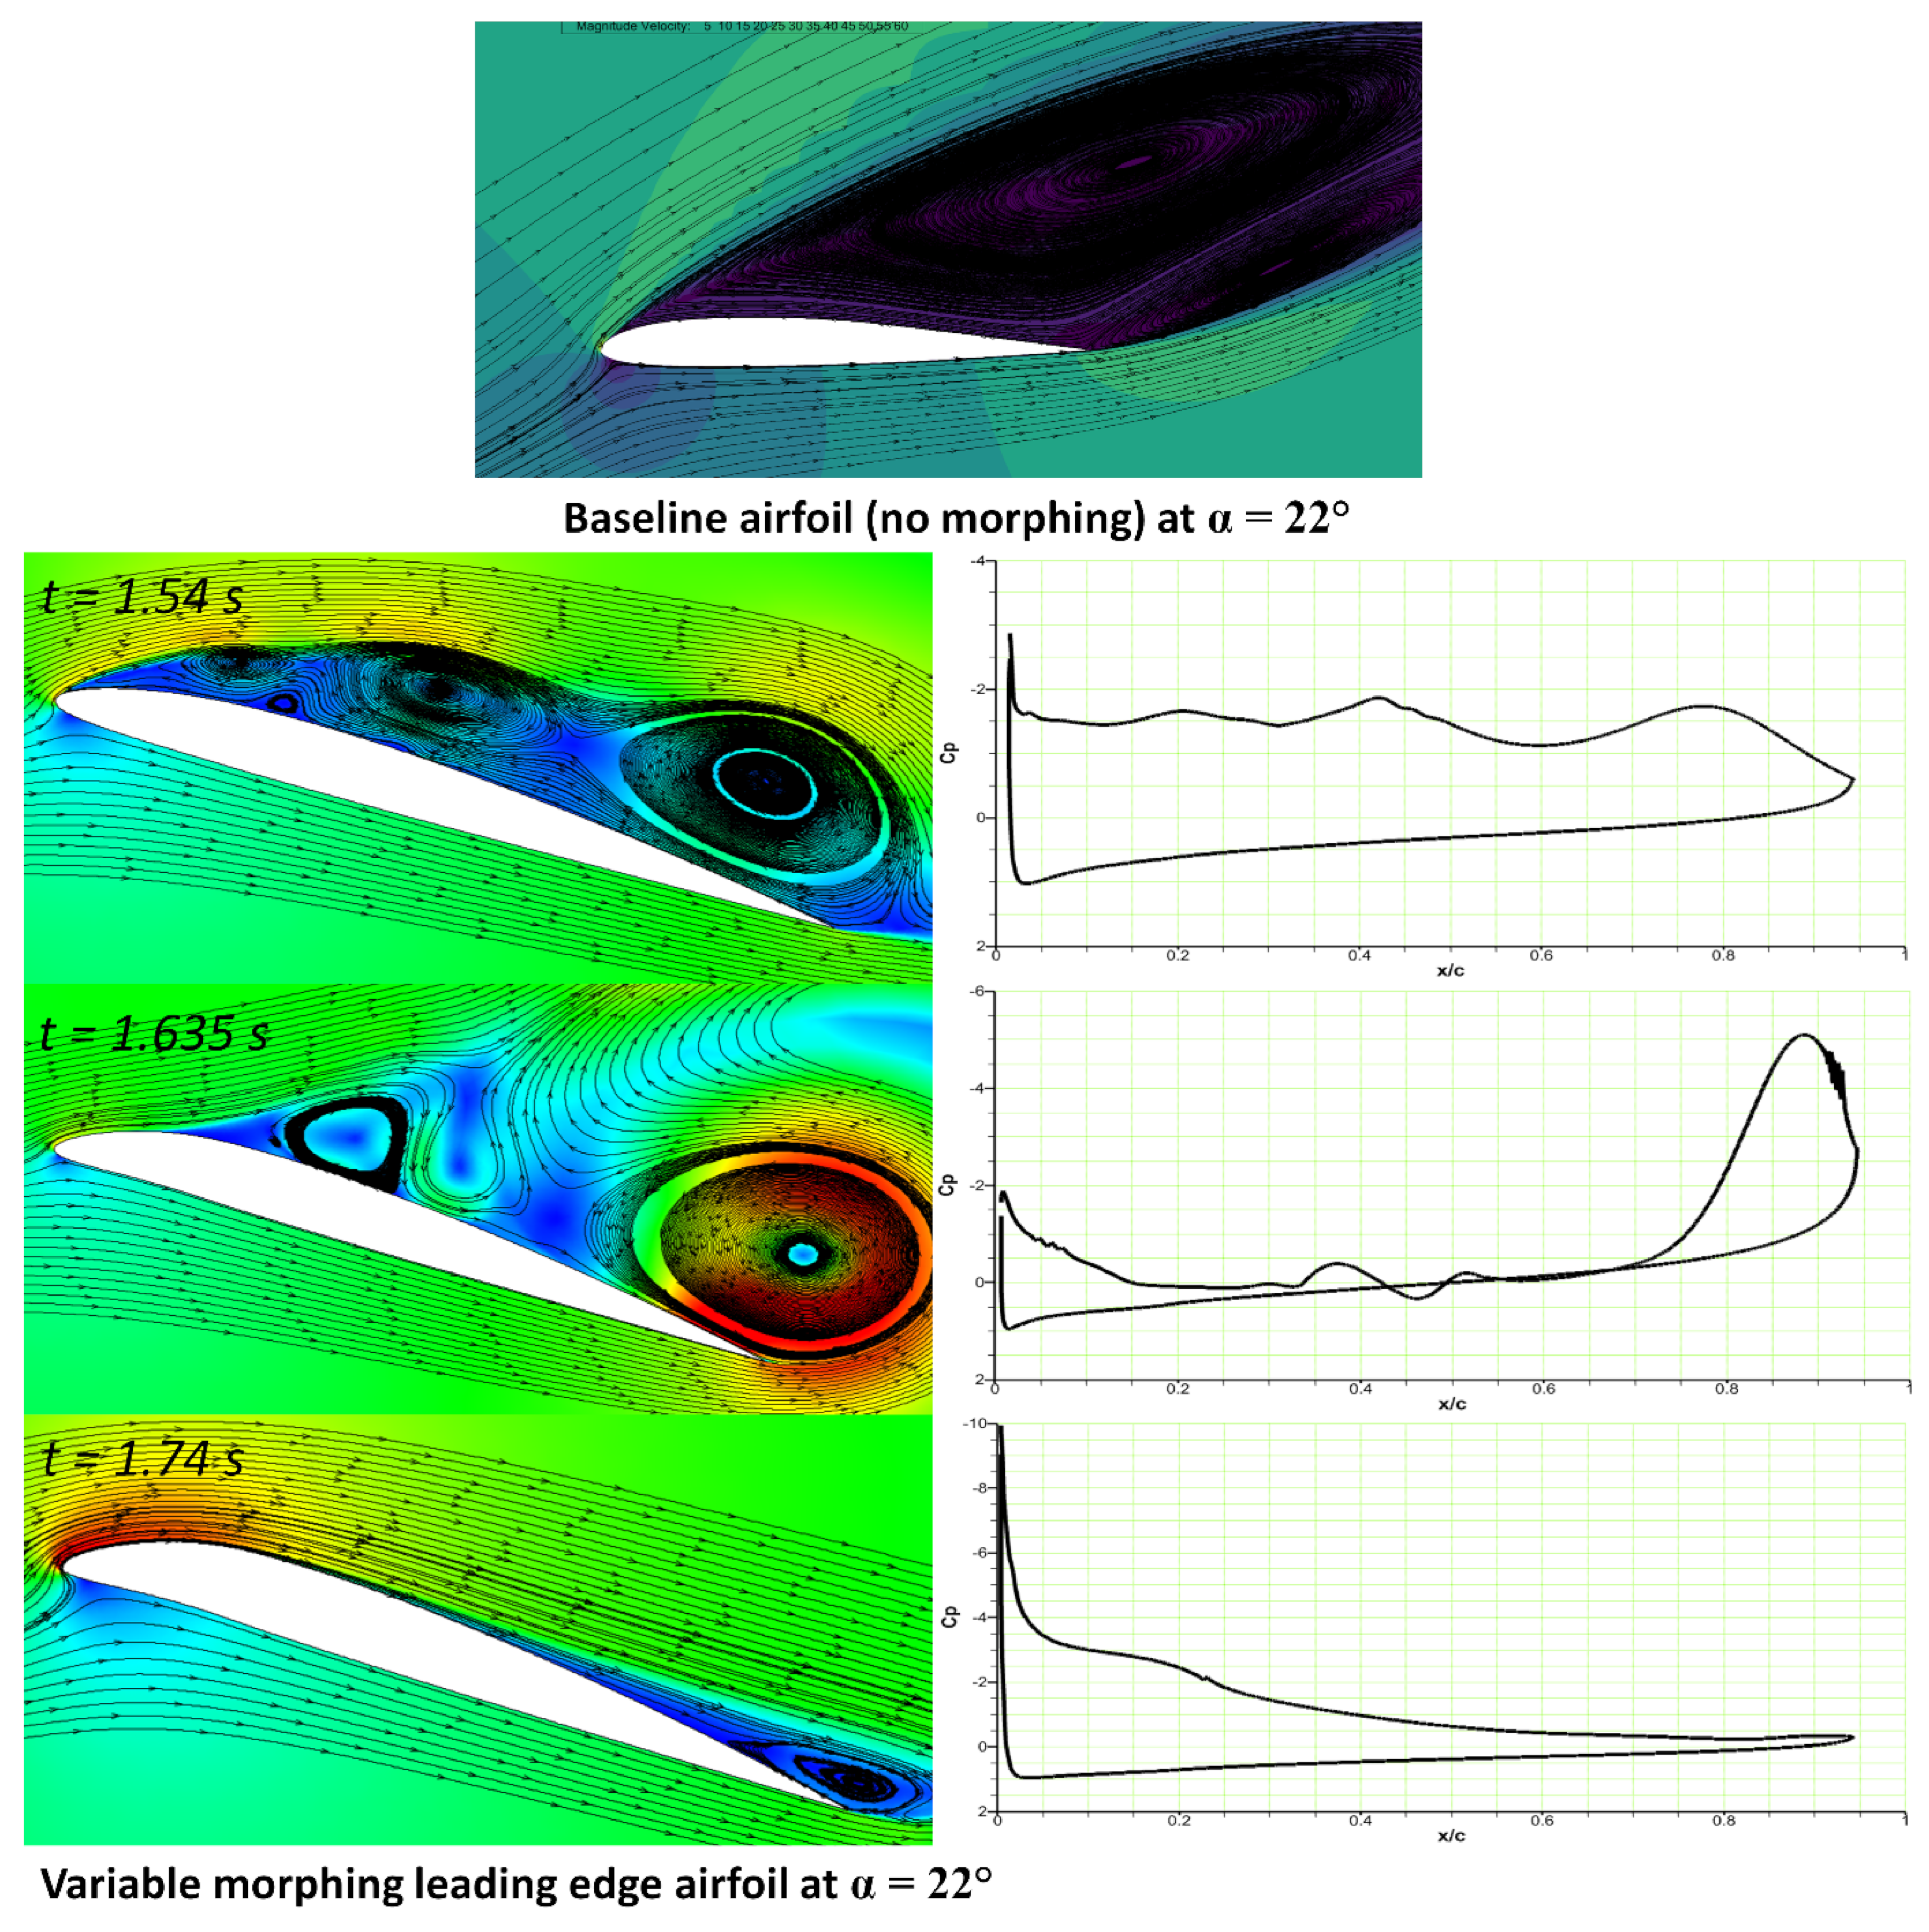
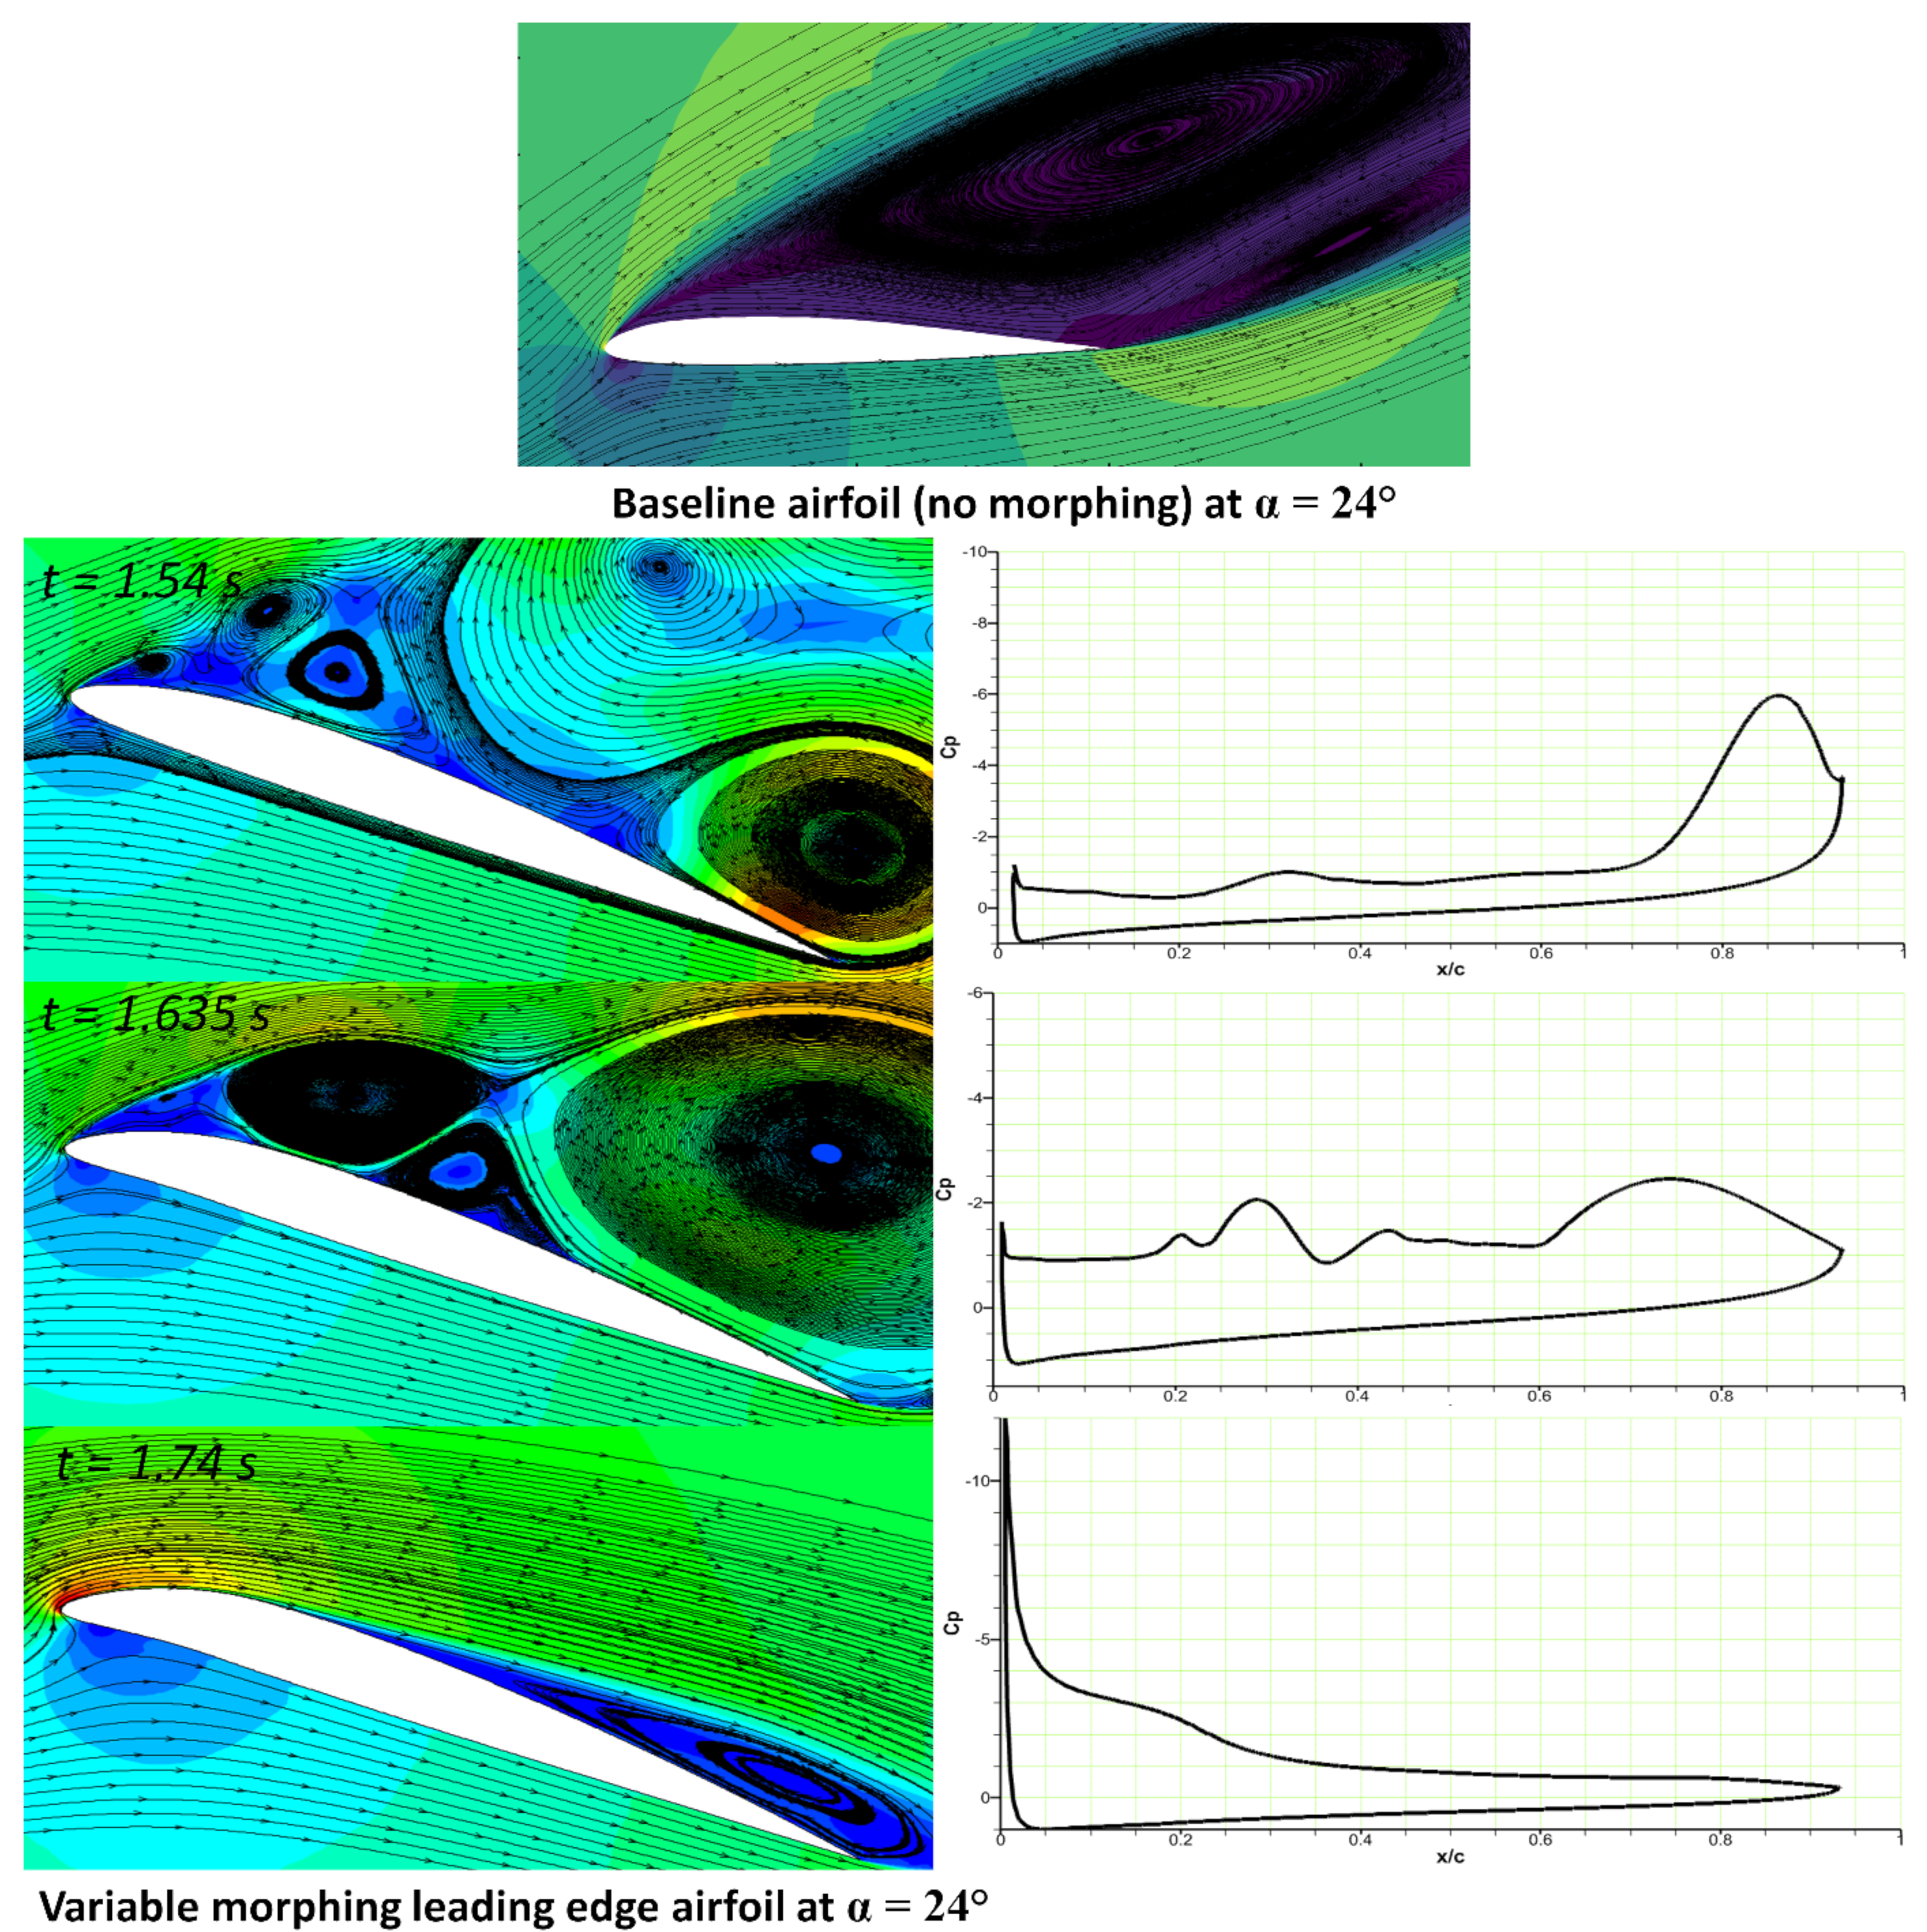
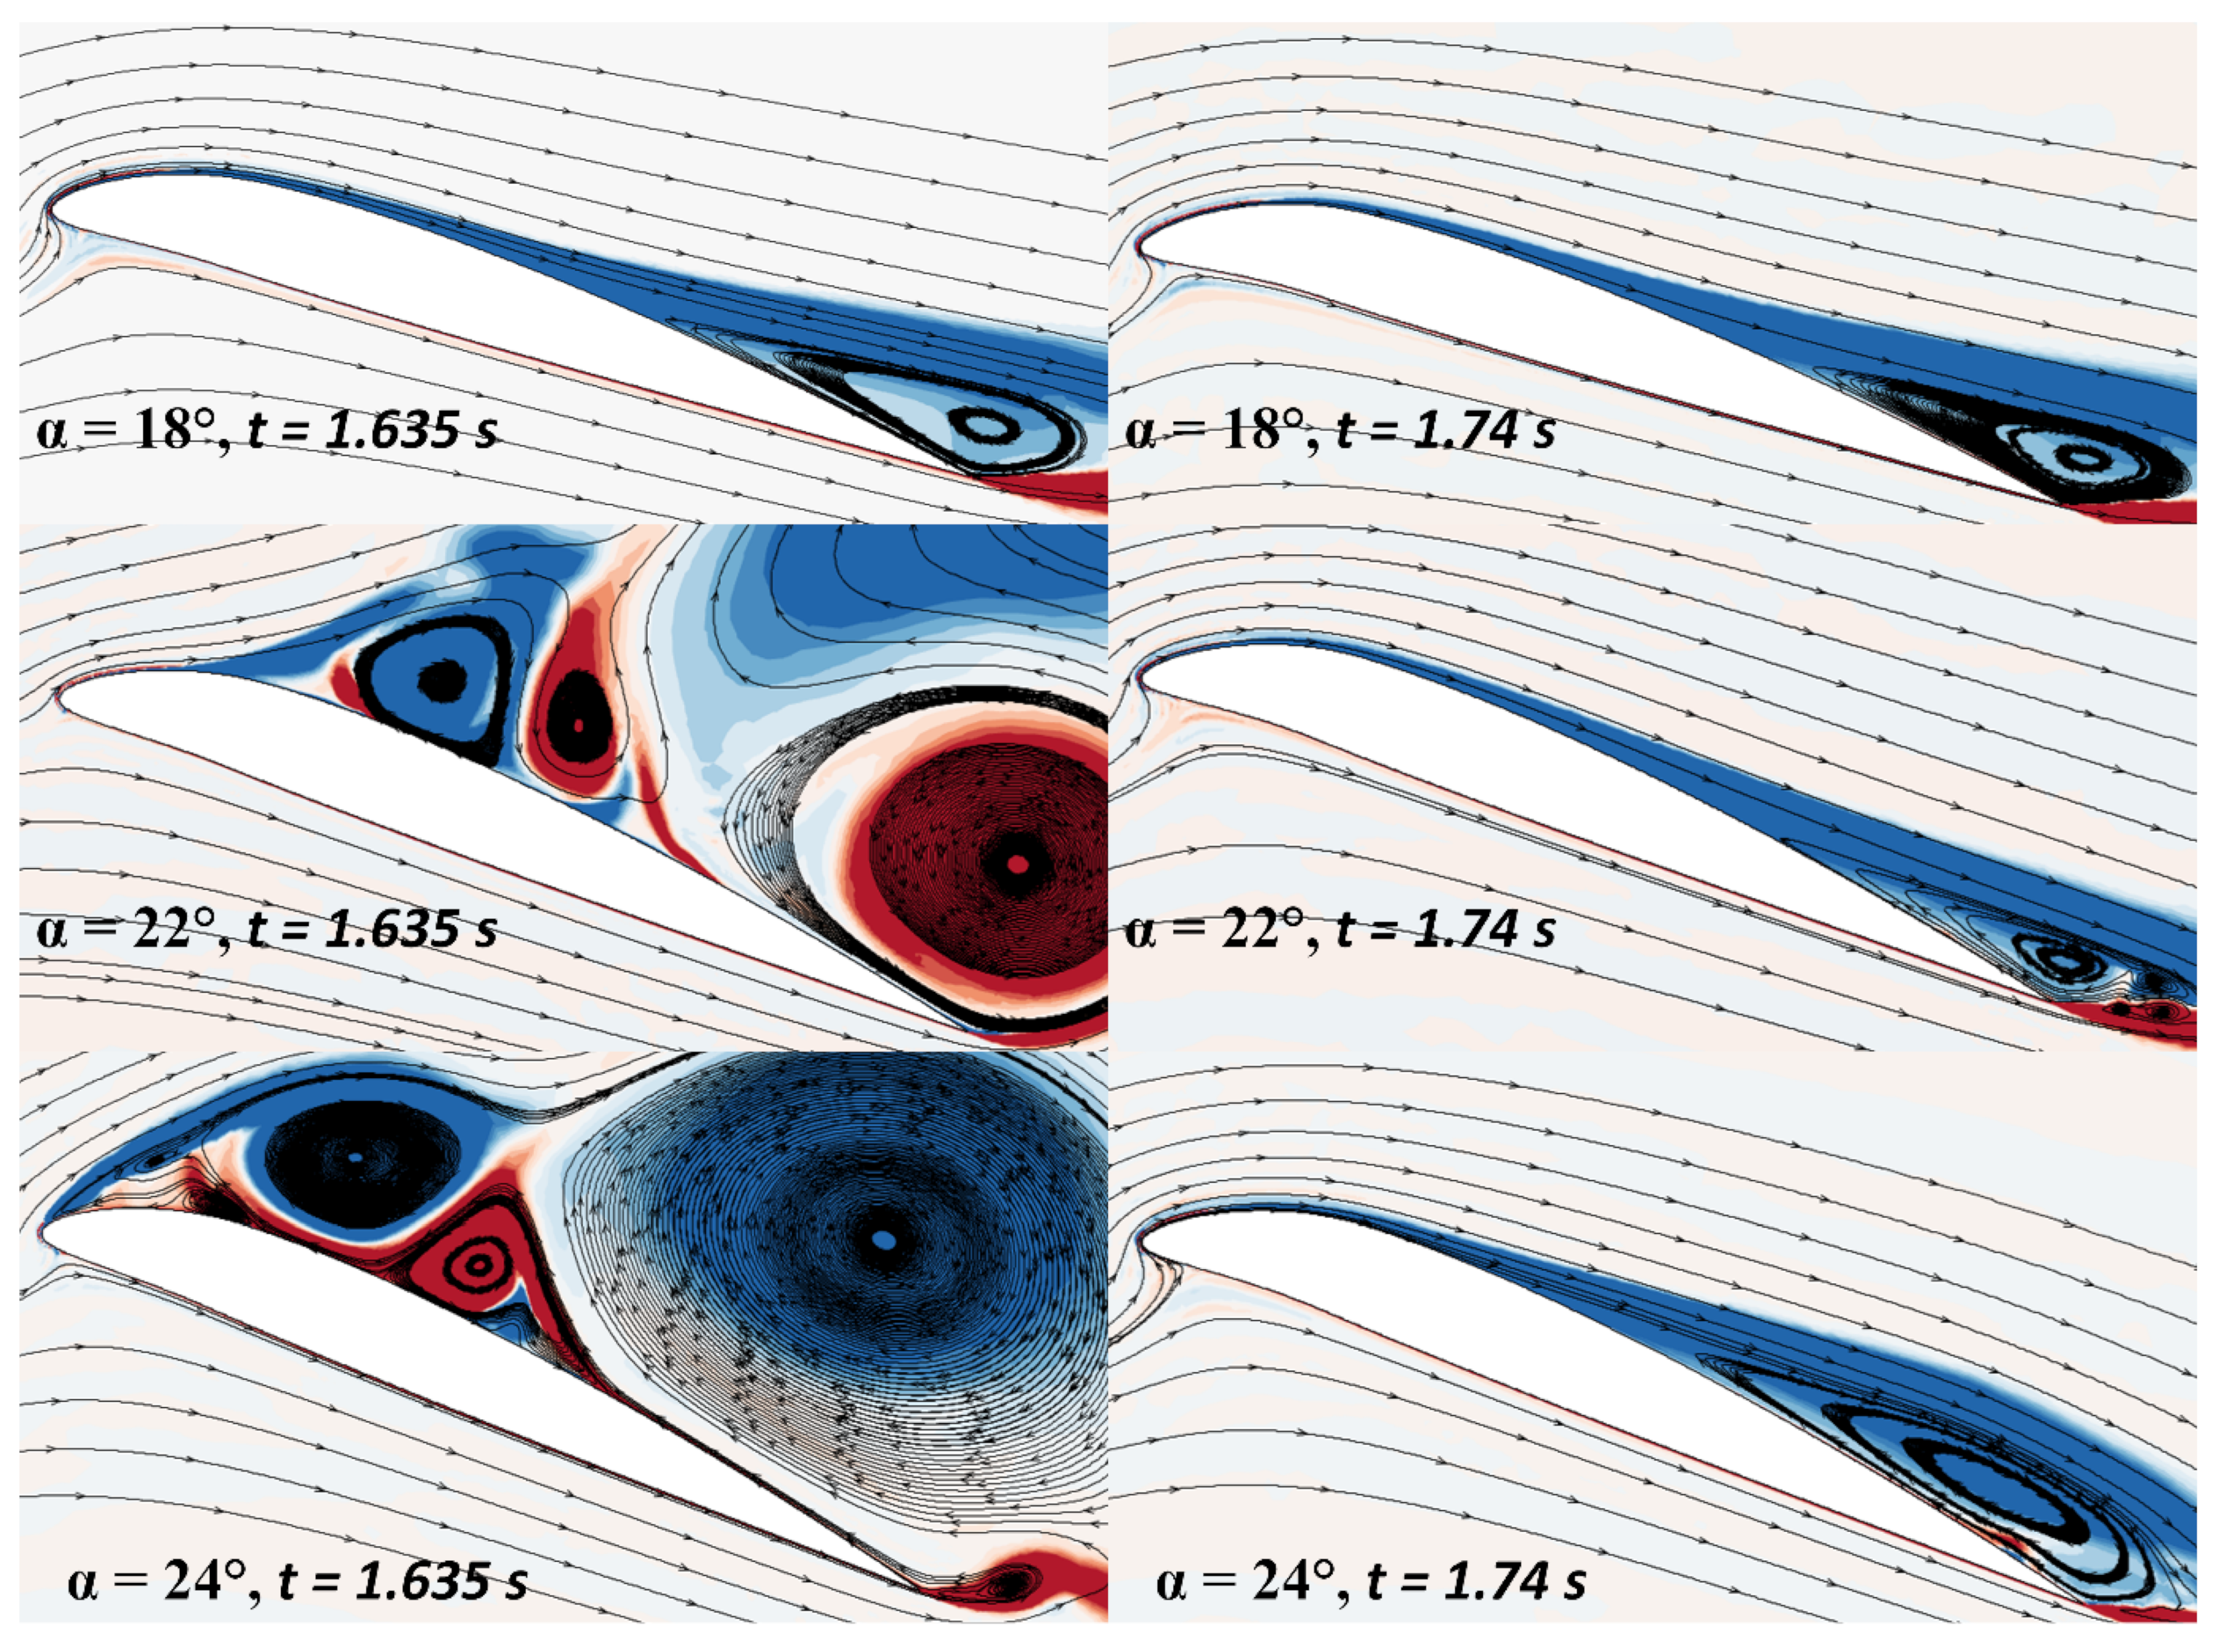
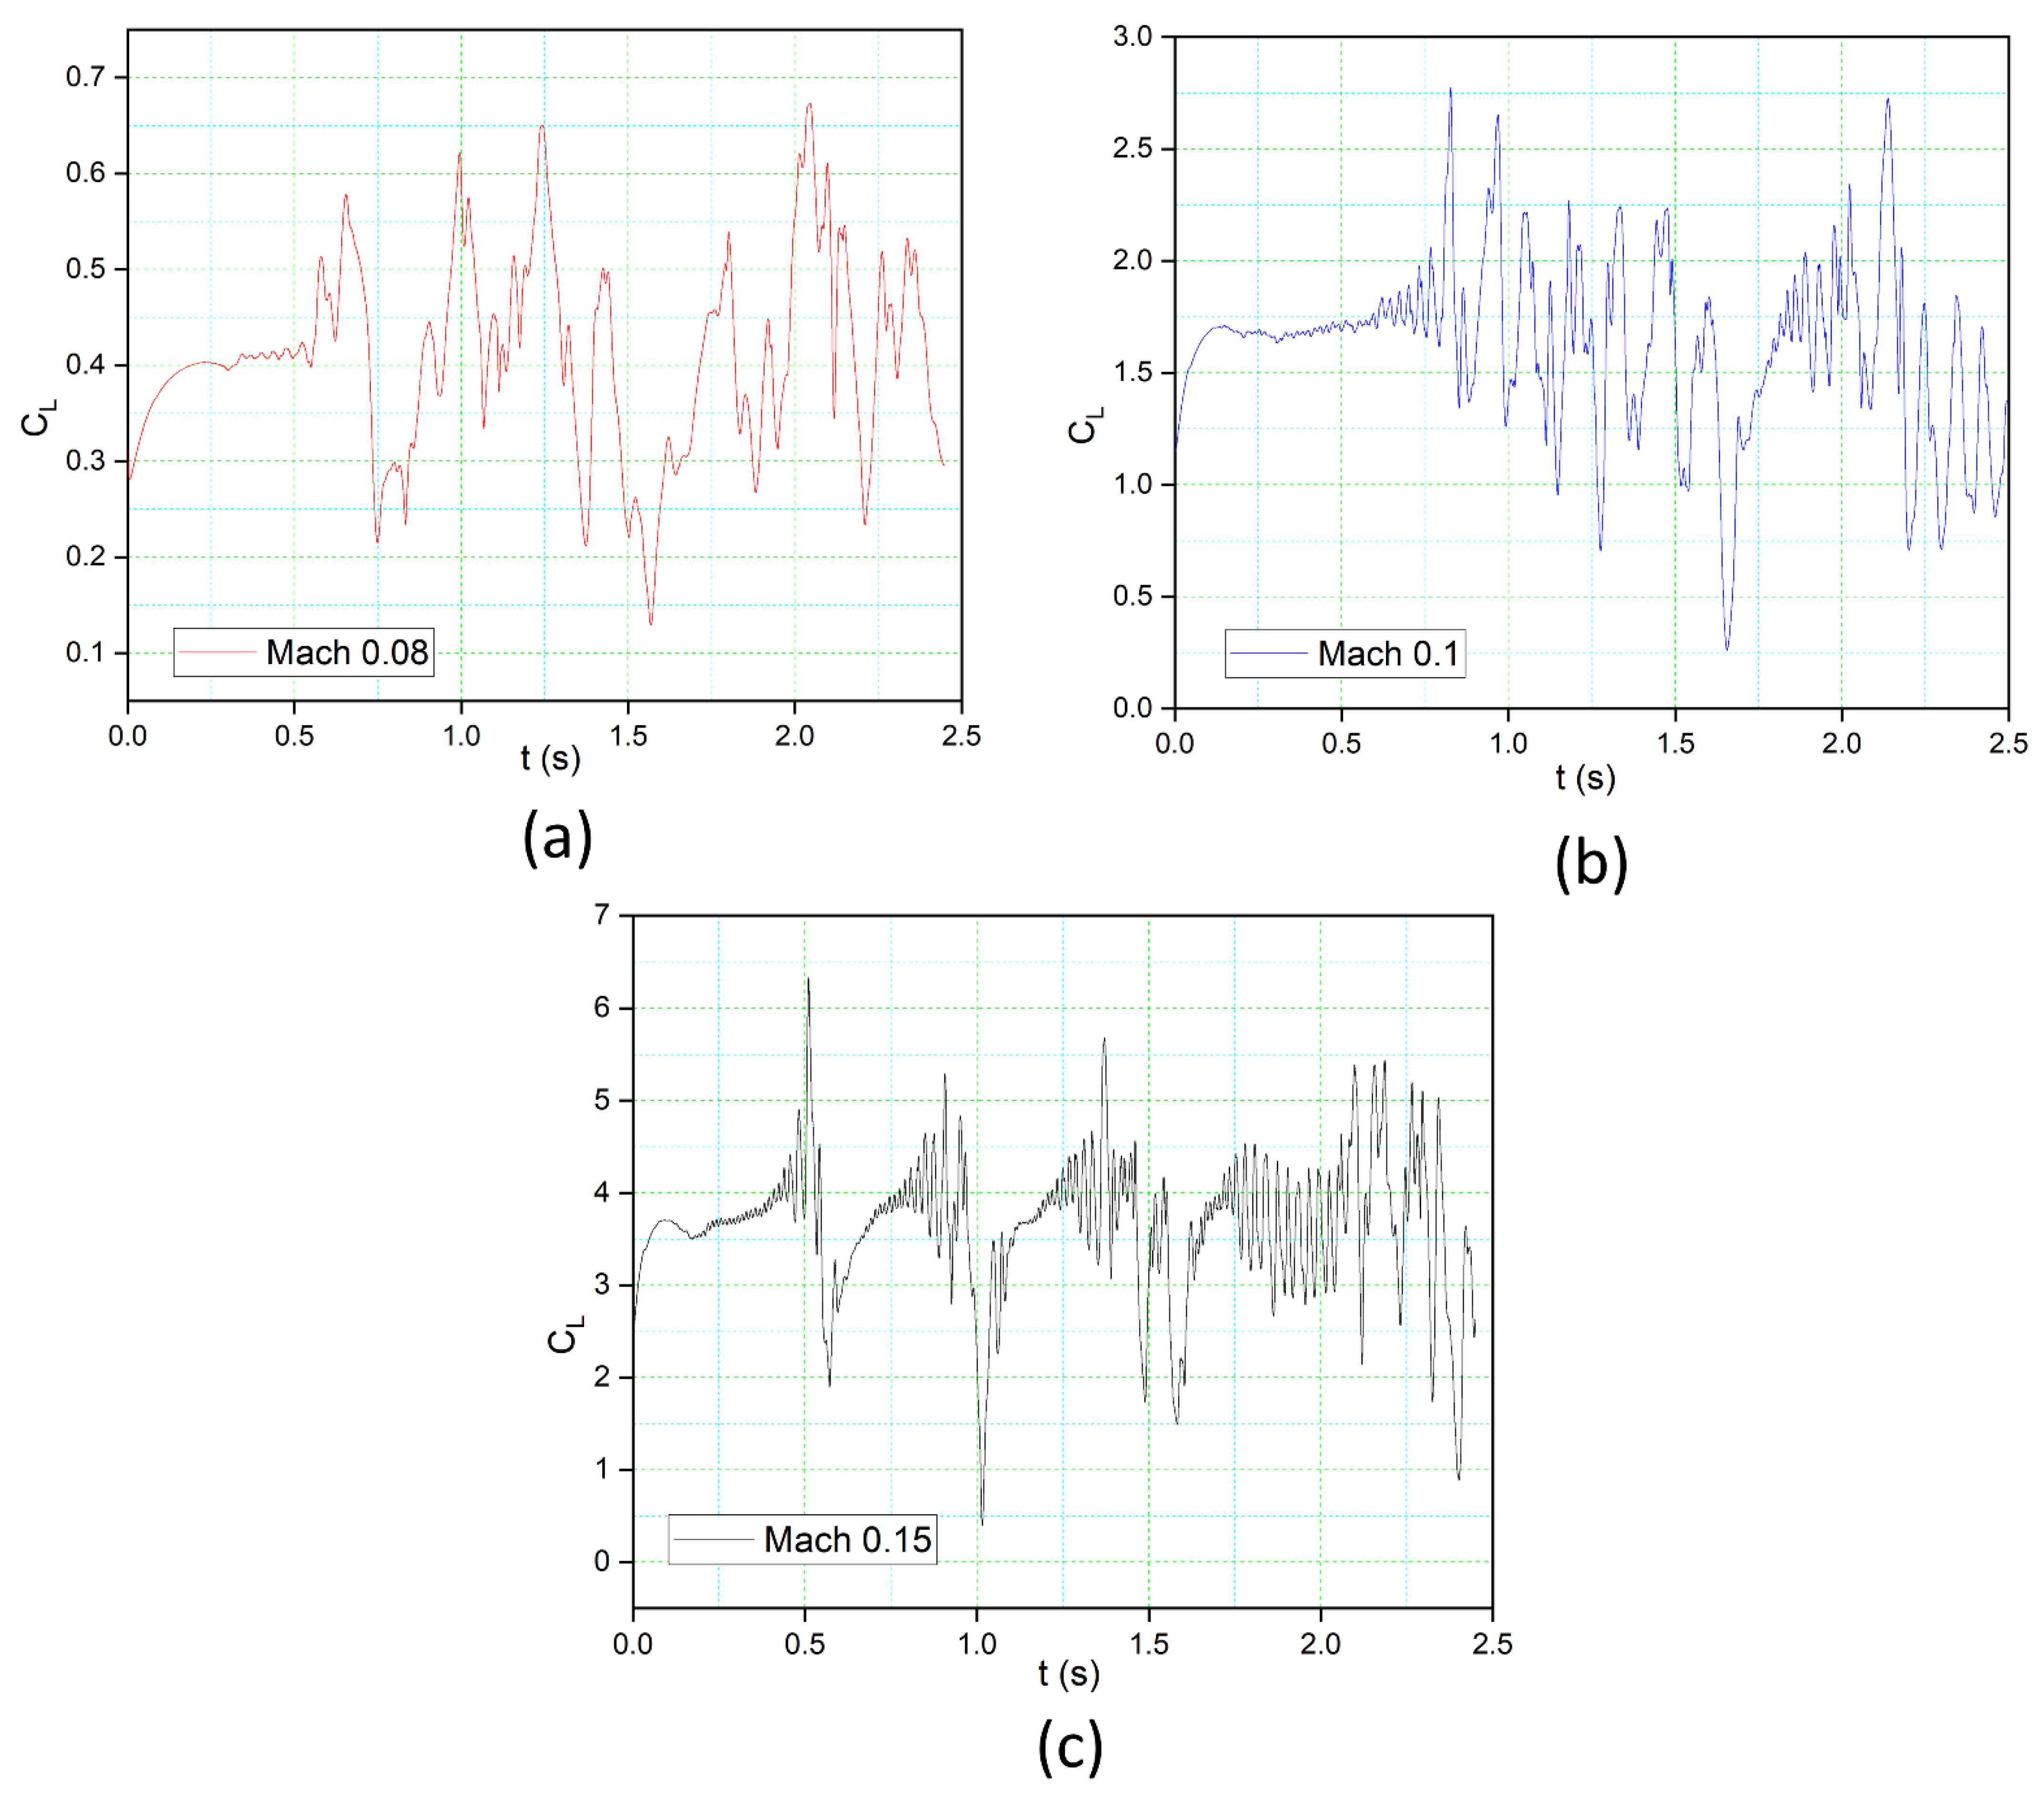
3.2. Unsteady Aerodynamic Results

The unsteady aerodynamic predictions may be more realistic than the steady morphed leading edge because the sudden changes in the flow behaviour of an airfoil can be obtained while the leading edge deflects downwards. Instantaneous aerodynamic coefficients and pressure distribution results can reveal the flow separation process and how the Laminar Separation Bubble (L.S.B.) moves over the airfoil during the morphing. This study used the methodology mentioned in Section 2.2. The turbulence model selection, the grid convergence for the mesh topology, and the grid size were all considered elements of the validation process.

Effects of Deflection on Morphing Leading Edge Aerodynamic

The effects of the leading-edge deflection at different angles of attack and time steps on the aerodynamics of the morphing airfoil are discussed. The impact of varying deflection rates (time steps) is analyzed until it reaches maximum deflection. The pressure contour with streamlines of the leading-edge morphing airfoil is shown in Figure 10. The pressure distribution shows the areas of low- and high pressure near the drooped leading edge. The flow around the leading edge shows the stagnation point that separates the flow between the upper and lower surfaces.
The Variable Morphing Leading-Edge (VMLE) of an airfoil is investigated at different angles of attack. The unsteady analysis of the morphing airfoil is performed by deflecting the airfoil’s leading edge downwards with time at a morphing frequency of 2 Hz to provide further insights into the time-dependent lift and drag forces at different time steps. This study includes only the downward deflection of the leading edge. As mentioned in Section 2.2.3., UDF was used to morph the leading edge during the different time steps of the flow.
The steady aerodynamic analysis of the reference airfoil at 0° angle of attack is shown in Figure 11, with no flow separation over the airfoil surface. The reference airfoil was then subjected to transient analysis using the downward deflection of the airfoil’s leading edge. The flow analysis is shown at different time steps. At t = 1.54 s, the leading-edge (L.E.) deflection rate did not cause any noticeable change in the flow behavior, as indicated by the corresponding pressure distribution. When the L.E. deflection increases at t = 1.635 s, no primary vortices are observed, and a slight pressure fluctuation is also noticed. Finally, at t = 1.74 s, the morphing ended, and the pressure distribution remained the same.
The steady aerodynamic analysis of the reference airfoil at a 6° angle of attack is shown in Figure 12, where no flow separation was found over the airfoil surface. The downward deflection of the airfoil’s leading-edge initiates at t = 1.50 s using the UDF, as mentioned in Section 2.2.3. The flow behaviour is shown at different time steps. At t = 1.54 s, the rate of leading-edge deflection did not cause any noticeable change in the flow behaviour, which can also be seen from the corresponding pressure distribution. Similarly, no flow separations were observed at the other time steps. Figure 12 shows that the leading-edge pressure reaches a peak value of Cp = −1.6 at t = 1.74 s.
The large separation region at an attack angle of 18° for the baseline airfoil is in Figure 13. However, the droop nose leading edge airfoil at different leading-edge deflections shows that there is no significant flow separation or vortex and that the attached flow state is kept well within the large portion of the drooped airfoil. The flow streamlines indicate that a flow separation area is developed at the end of the trailing edge, and the corresponding pressure coefficients suggest that the flow remains attached to the airfoil surface. The leading-edge suction values reach a peak of Cp = −7.5 at t = 1.74 s.
Figure 14 depicts the flow separation area for the reference airfoil at an angle of attack of 22°. The trailing edge is not crucial in the initial vortex formation, especially at high angles of attack. However, it can improve the overall circulation around the airfoil by continuously shedding counter-rotating vorticity into the wake. This increased circulation causes more vorticity accumulation near the leading edge, thus forming stronger vortices.
On the other hand, the droop nose deflection of the leading edge shows the trailing edge vortices at different stages; the influence of the trailing-edge flow may increase significantly when the primary vortex from the leading edge approaches the trailing edge. The development of primary and secondary leading-edge vortices is seen at t = 1.54 s; when the airfoil continues to droop at t = 1.635 s, the vortices start to reduce, and the flow begins to re-attach on the airfoil. The leading-edge deflection continues to increase until it reaches its maximum at t = 1.74 s. At the same time, the flow keeps re-attaching to the airfoil, and the trailing edge separation area remains small. However, it is essential to note that the flow separation area of the morphing airfoil remains much smaller than that of the reference airfoil. Therefore, the flow separation can be controlled using the variable morphing leading edge.
Figure 15 compares the reference airfoil with the drooped morphing airfoil at an angle of attack of 24°. The flow remains fully separated on the reference airfoil, depicting the stall. For the VMLE morphing airfoil at t = 1.54 s, the vortices are majorly formed over the airfoil, and they continue to be seen at t = 1.635 s, where the flow separation area is smaller as compared to that of the reference airfoil. However, the flow separation reduces, and the flow is re-attached to the airfoil. Thus, it is found that the flow separation can be controlled using the variable morphing leading edge.
The understanding of the role of vorticity in the shear layer that forms at the interface between the outer flow and a separated flow zone close to the suction surface of the airfoil is desired to improve the flow separation prediction capabilities. Figure 16 shows the vorticity contours along with the flow development over a baseline airfoil (left) and a variable morphing edge airfoil (right) for different angles of attack and time steps during the morphing motion. At an 18° angle of attack and t = 1.635 s, the separation is found at the trailing edge area of the airfoil. As the airfoil morphs, the vortex is smaller at t = 1.74 s. The reversed flow spreads from the trailing edge towards the leading edge for an airfoil at a 22° angle of attack and t = 1.635. The morphing continues till t = 1.74, and a considerable decrease in the vorticity magnitude can be seen. The same trend is found for the airfoil at a 24° angle of attack. This illustrates the gradual attachment of the boundary layer, with the separation point migrating from the leading edge to the trailing edge. The variable morphing leading edge action thus appears to dramatically improve the airfoil performance during the downstroke.
With increasing Mach number, the mechanism of vortices shedding changes, as seen in Figure 17a–c, respectively. In these cases, the leading-edge morphing starts at t = 1.5 s, reaches maximum deflection at t = 1.74 s, and returns to its original position at t = 2 s. At Mach number = 0.08, the leading-edge vortices are shifted towards the trailing edge but continue to fluctuate during the leading-edge morphing. As the Mach number increases to 0.1, the lift coefficient increases accordingly, and the flow re-attaches with the airfoil during t = 1.6 s to 1.74 s and attains the smooth lift coefficient distribution. At Mach number = 0.15, the flow structures become more coherent along with the peaks in the lift coefficients. With an increasing Reynolds number, leading-edge deflection has a more significant effect on the leading-edge separation.

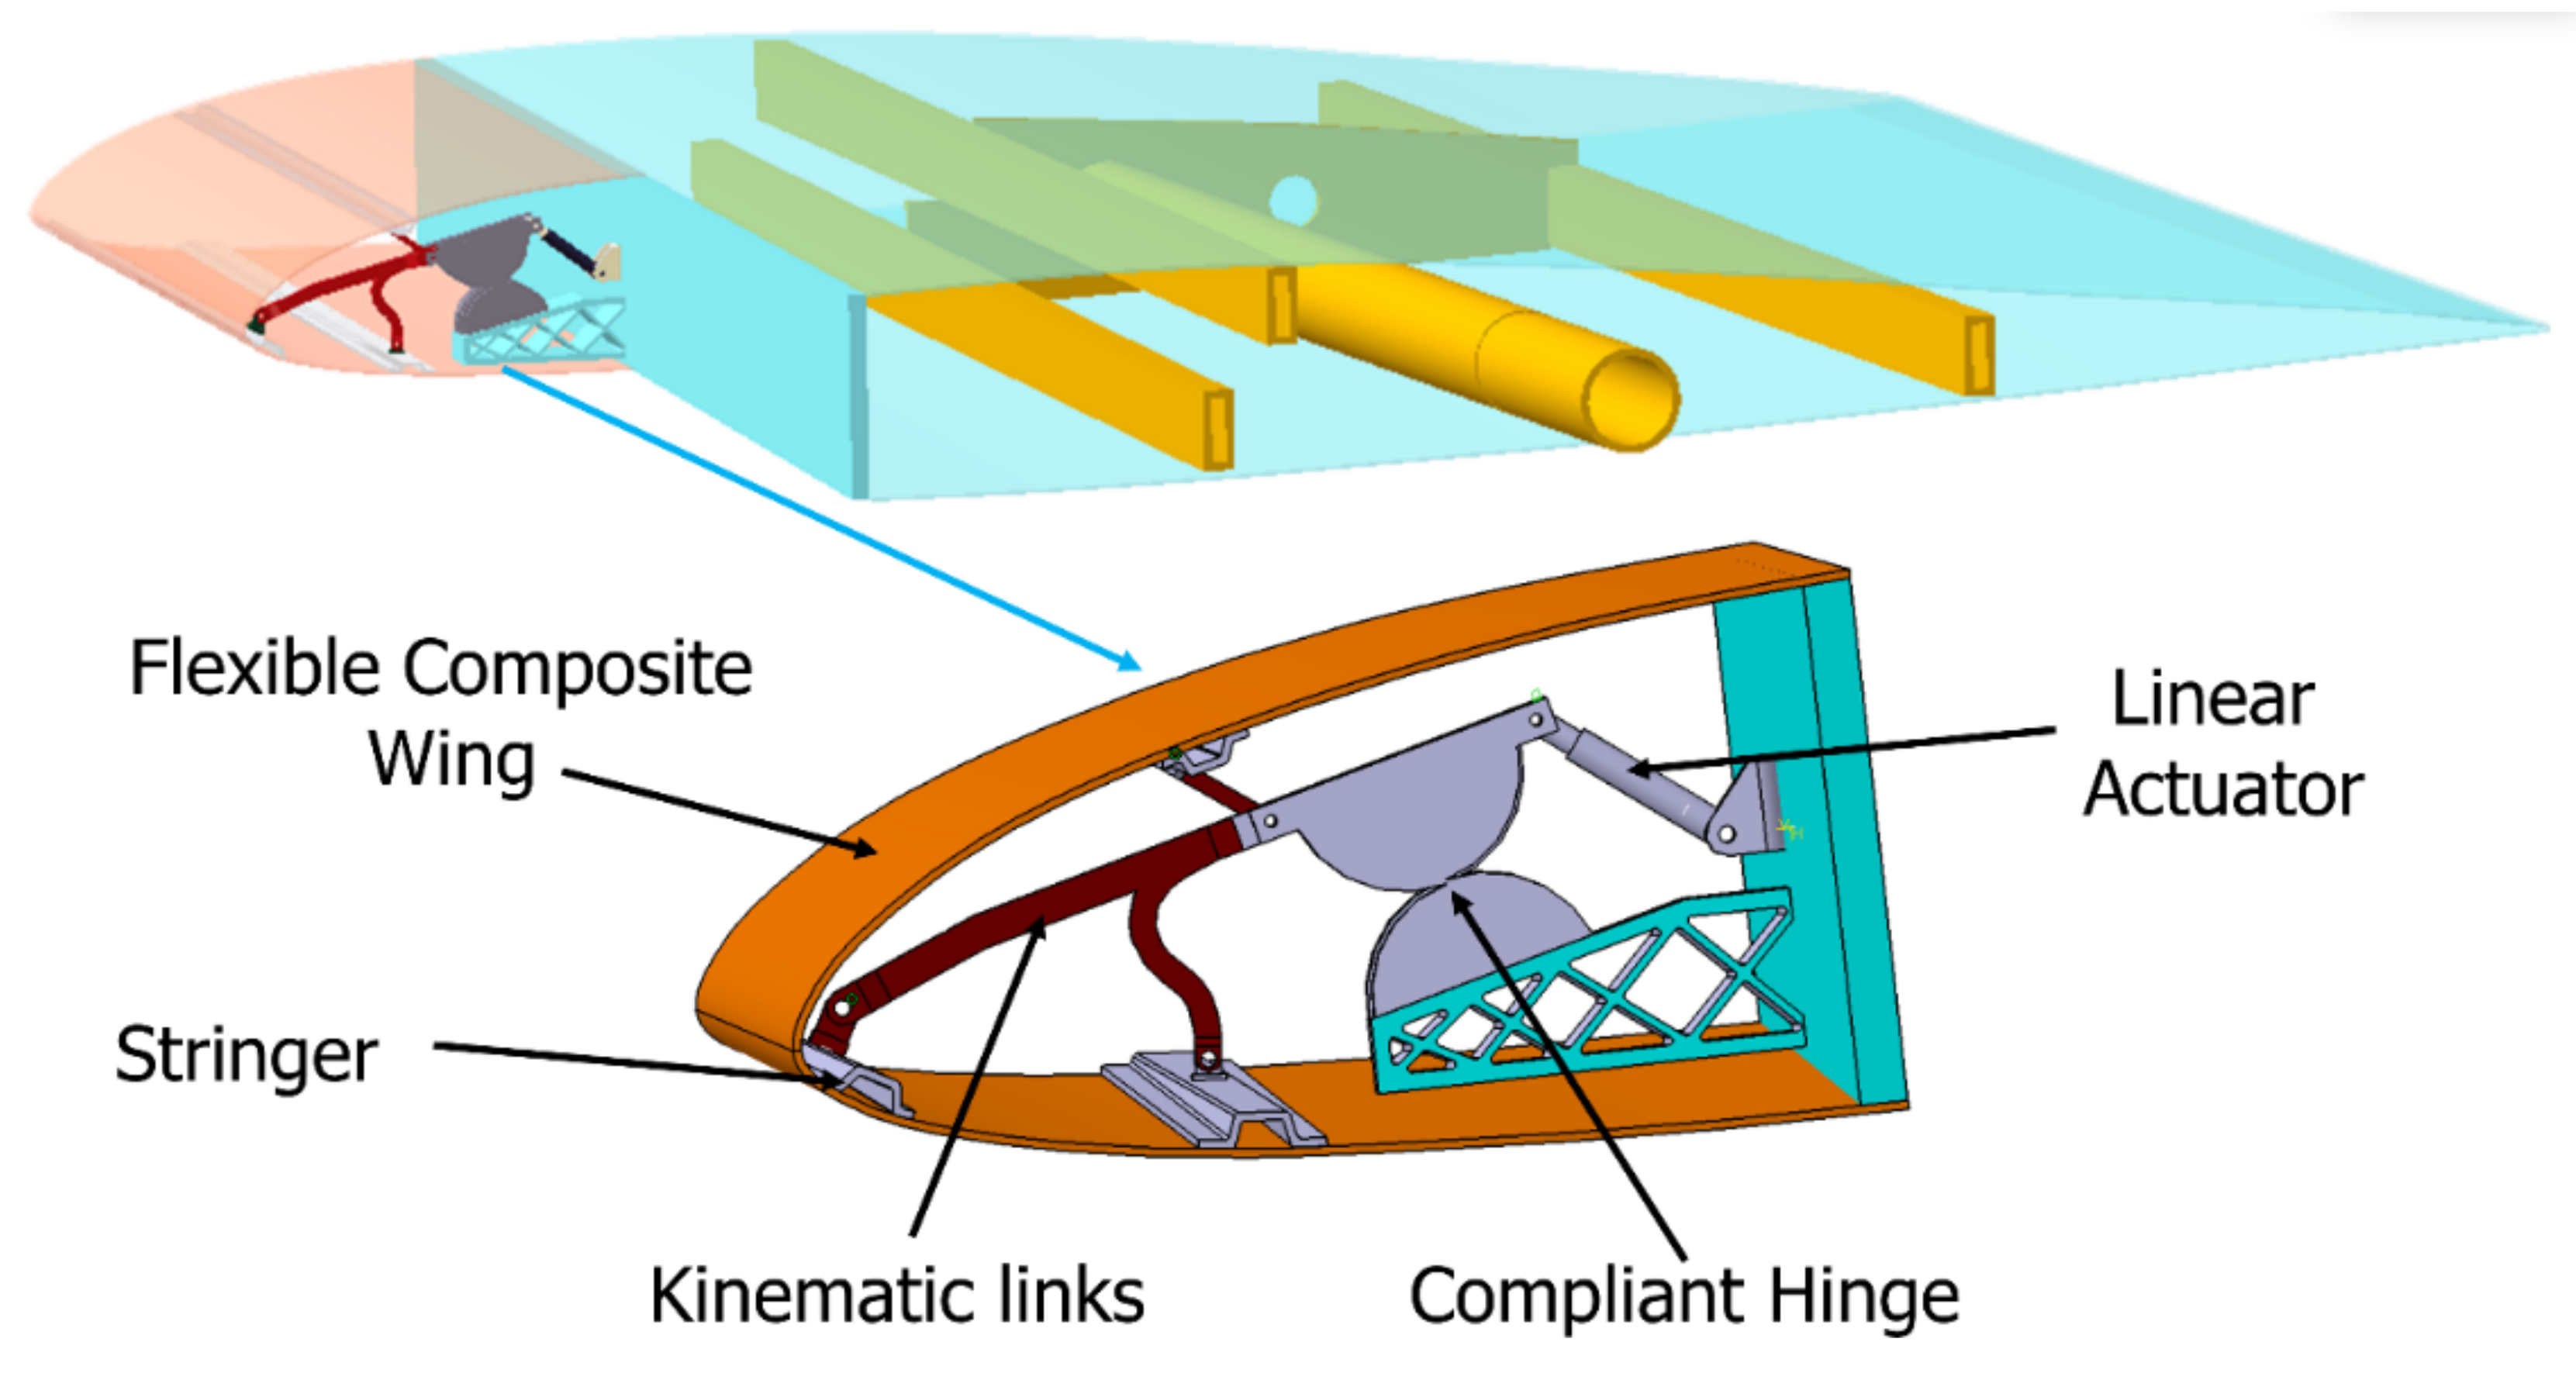
3.3. Preliminary Morphing Leading Edge Design

Numerous techniques involve reducing the weight, maximizing the lift effectiveness, and maximizing the buckling factor of an aircraft wing subject to aeroelastic and structural restrictions [52], and studies for morphing skins have been developed, most of them are explained in [53,54,55]. The UAS-S45 wing considered in this study has a span of 5.867 m and a mean chord of 0.53 m. A reference section of the wing with a span of 0.7 m was selected for the structural analysis in this paper, as shown in Figure 18.

3.3.1. Key Material Properties

The data manuals describe that the UAS-S45 wing is manufactured from S-glass, Kevlar, and carbon fibers. Due to the flexible nature of a morphing leading edge, carbon fiber and S-glass were selected to simulate its behaviour under the same conditions. The specifications of the materials used for UAV manufacturing and the mechanical properties are given in Table 2.

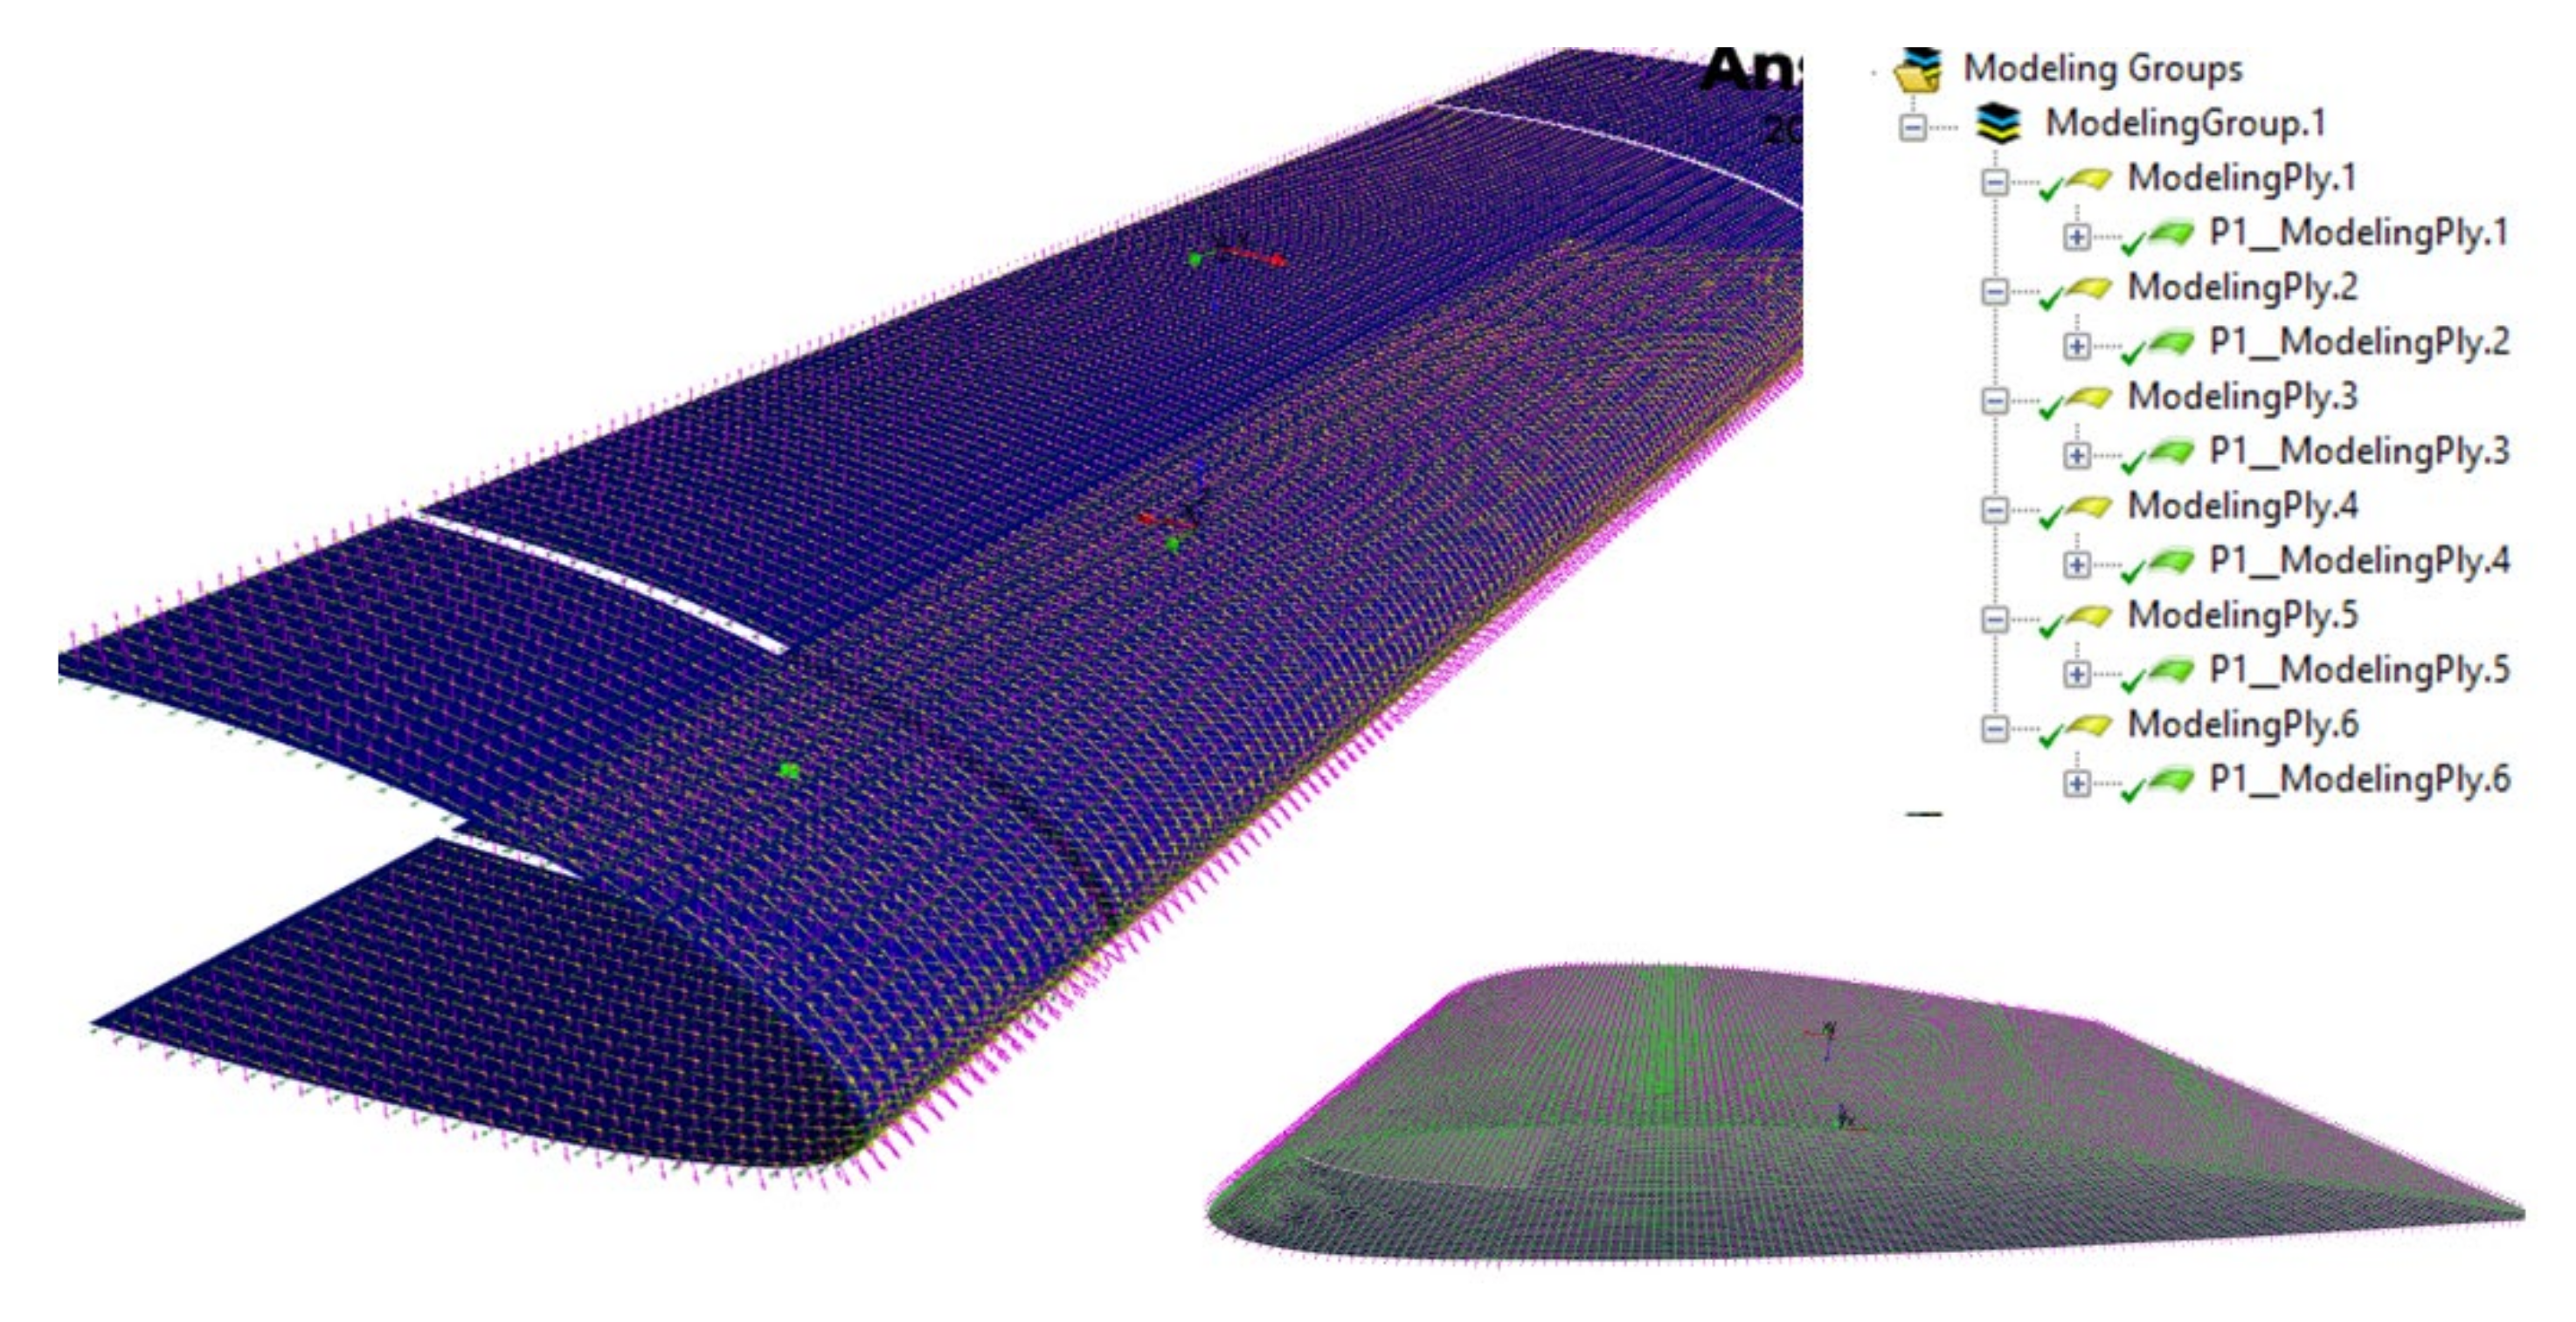
3.3.2. Composite Material Modeling

Defining the mechanical properties of primary materials, such as the fabrics and ply type (s), including their failure criteria, is essential for composite materials modeling. The representation and ply layering in the laminate is shown by including the wing structure model shell elements. In the A.C.P. (Ansys Composite Pre-Post) module, the wing model is assigned the fabrics that can be designed along with other composite layers combined to form the completed laminated composite materials. By creating the composite fabric according to its thickness, a laminate is prepared by orienting all fabrics according to their assigned direction of 0/90/±45/90/0. One of the most challenging aspects during design configuration is the combination of various materials with different plies and orientations.
Three stringers reinforced the morphing wing skin on both the upper and lower skin panels to avoid deformations in areas far from the actuation mechanisms, which are oriented along the wingspan. The skin was made of two layers of fiberglass/epoxy and four layers of carbon fiber/epoxy laminate arranged in a symmetrical layup [0/90/±45/90/0] s 1.2 mm thick. The updated laminate in terms of the material layup and the orientation choices is shown in Figure 19.
The accurate mechanical representation of a composite layup through simulation studies is a requirement for the design modeling process and manufacturing. Therefore it is essential to integrate the numerical approach to the composite aspect of A.C.P. and the F.E. analysis of static structural analysis. In this study, the composite skin analysis considering the sensitivity analysis of different composite parameters such as the number of plies, fiber orientation, ply thickness, etc., can be done during the F.E. investigation. The integration of F.E. static structural and A.C.P. together was systematically linked by conveying the generated shell element model from A.C.P. (Pre-Processing) to the static structural model to push the analysis further and assess the composite Design in A.C.P. (Post-Processing). Hence, the results of the FE-ACP computational study analysis in the static structural analysis were evaluated from a composite point of view.

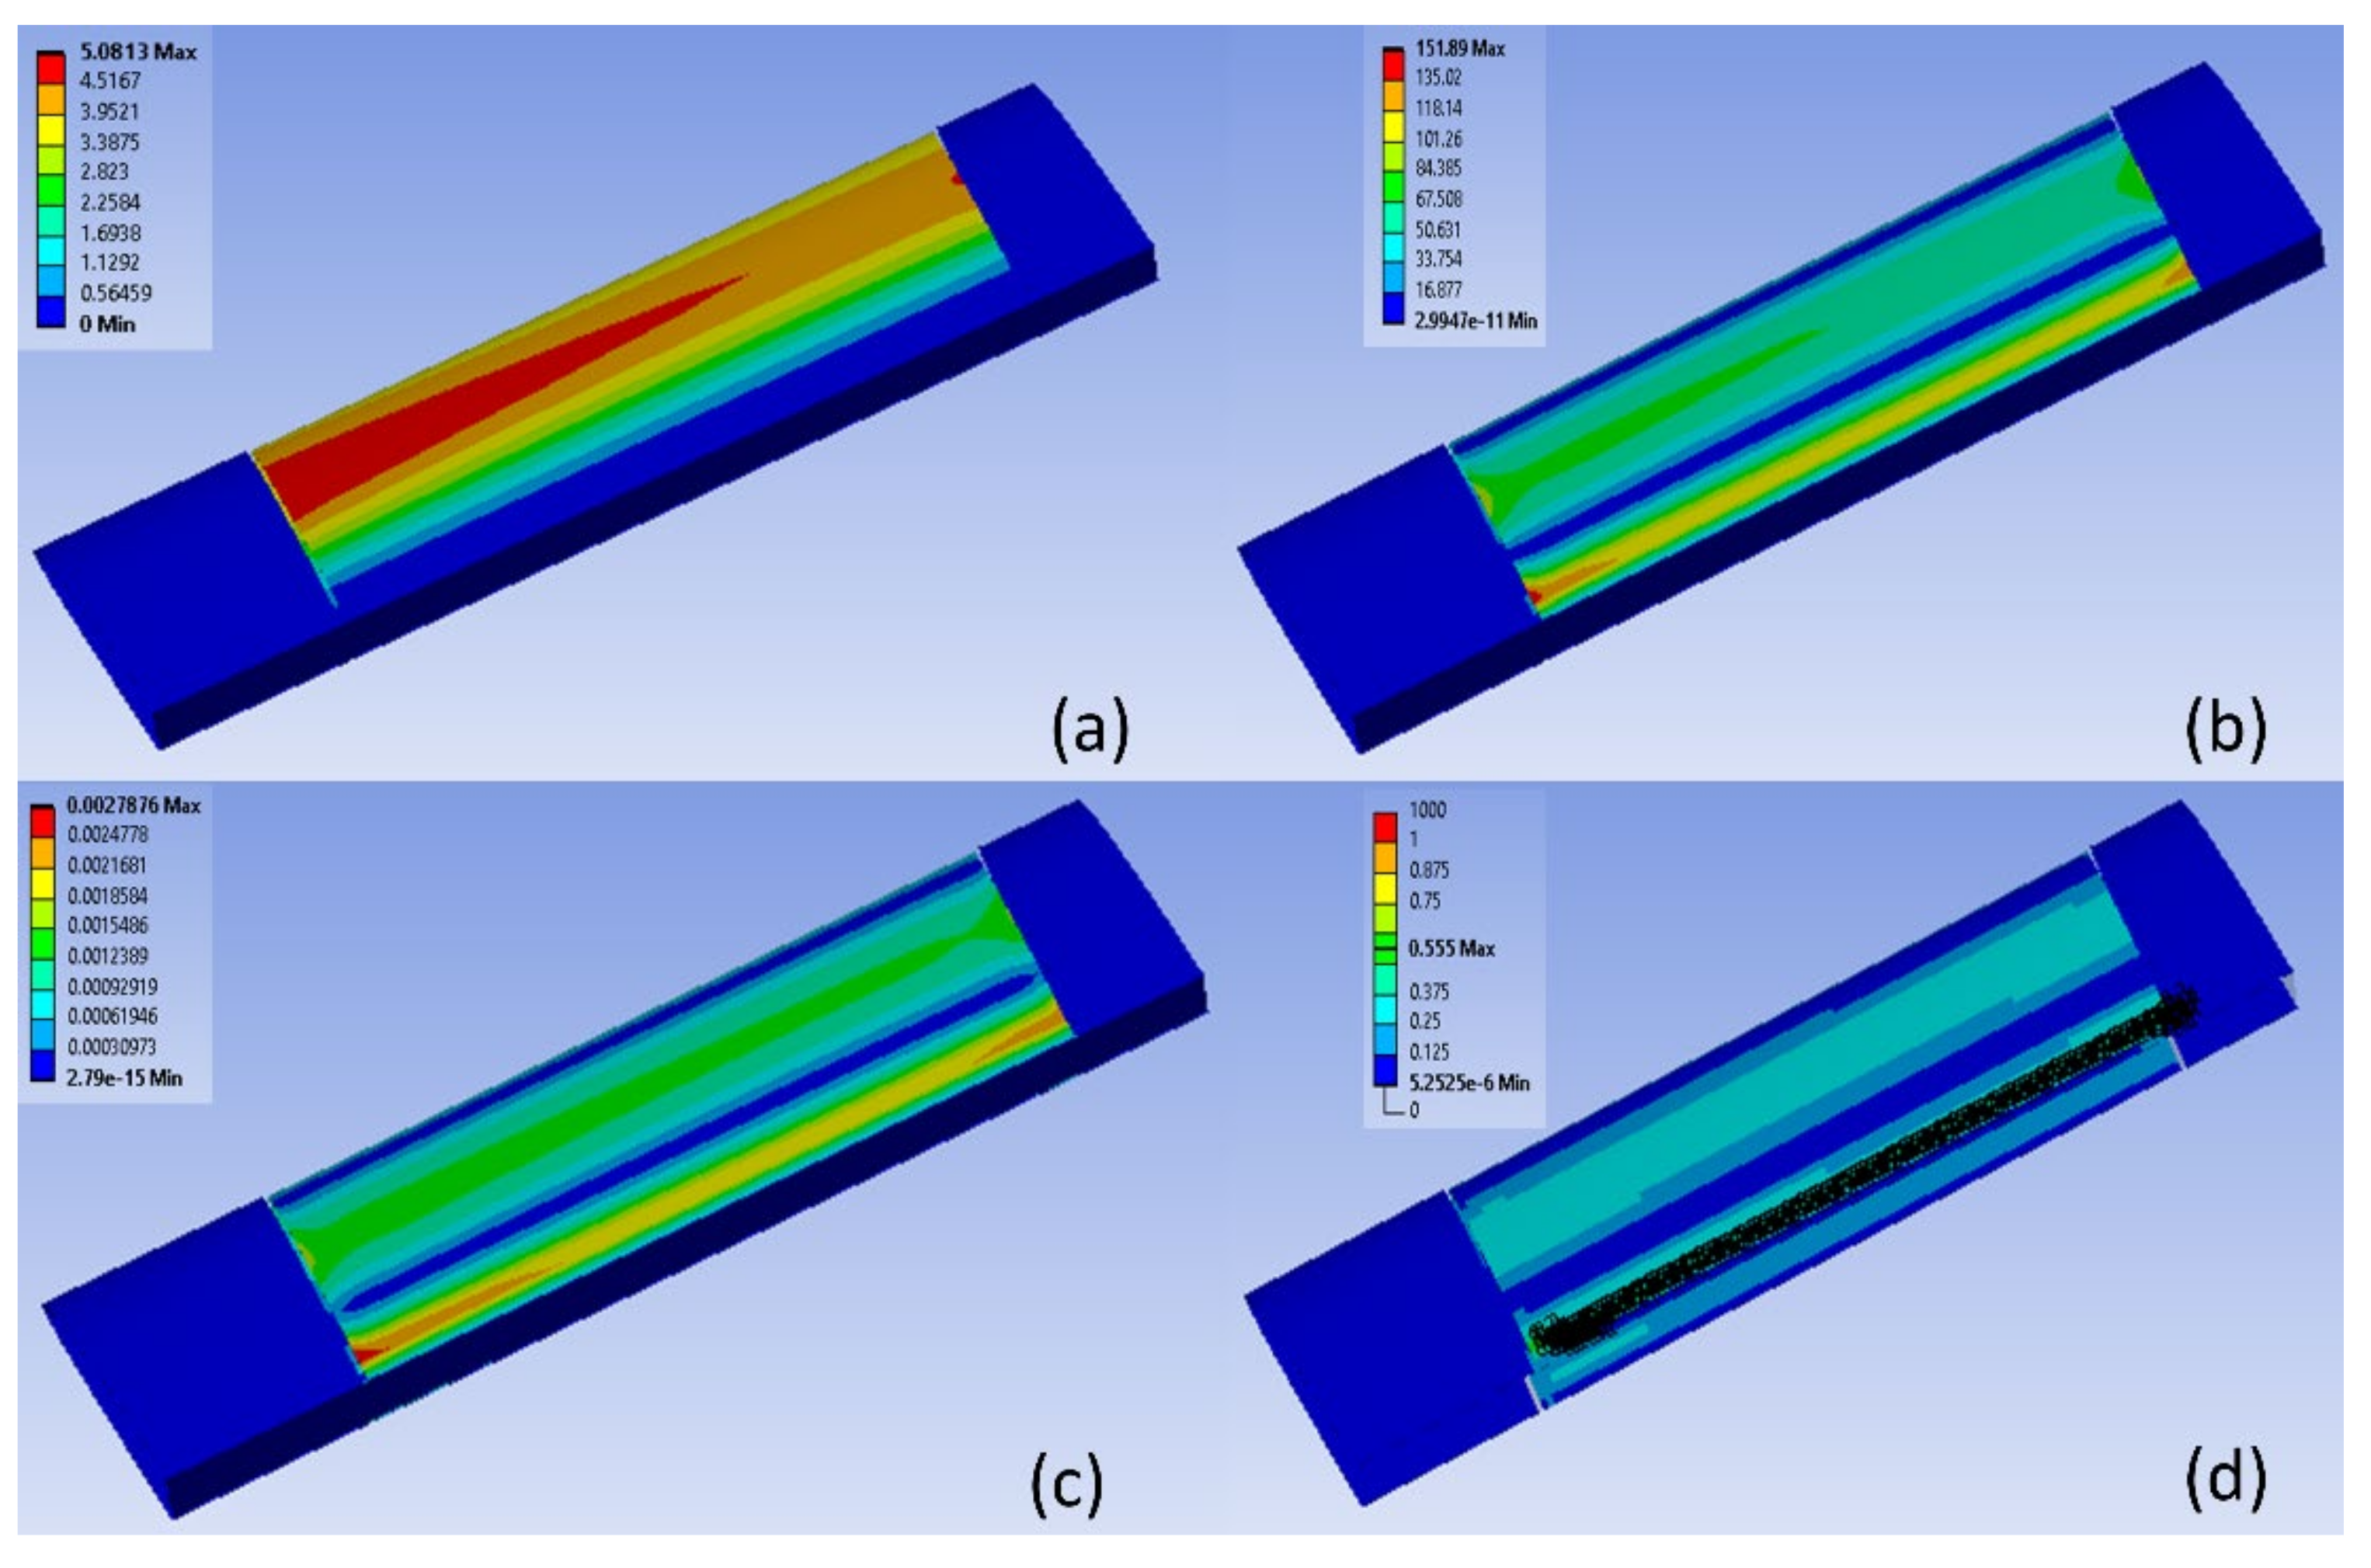
3.3.3. Static Structural Analysis

Static Structural Analysis was the next step, in which the deformations and stresses were analyzed. Figure 20a shows the total deformation contour in the structure due to the generated residual stresses. It revealed that the deformation occurred at a maximum of 5.09 mm for the layup. The red color indicates the critical values, whereas the dark blue indicates the safest ones. Figure 20b shows the maximum stress that could be generated in the structure, 151.89 MPa. Similarly, Figure 20c shows the equivalent strain.
Fiber breakage, matrix cracking, and fiber pull-out are non-catastrophic failure modes in composites that can cause localized damage [56]. Failures can occur at once or develop over time, making it challenging to observe composite failure. It is worth noting that Von Mises failure criteria can’t be used for composite materials analysis because it is appropriate for only isotropic materials. Instead, Tsai-Hill, Tsai-Wu, or Tresca-based failure criteria must be used to obtain more realistic results. The materials consist of fibers and a matrix, each with different failure mechanisms. Failure is also influenced by the interface between the fibers and the resin, the ply stacking sequence, environmental conditions, etc. As a result, predicting failure in composites is a challenging task.
Inverse Reserve factor (I.R.F.) indicates failure margin, and higher I.R.F. values imply a “positive” margin to failure, whereas the lower values show a “negative margin.” For example, I.R.F. non-critical values are 0 to1 while critical values are >1. Subsequently, the Inverse Reserve Factor (I.R.F.), used as a composite failure tool in this study, is shown in Figure 20d. For this model, the maximum value of I.R.F. found was 0.555. The failure load and mode prediction will also be analyzed using failure indicators such as the Maximum Stress and Tsai–Wu failure criterion.

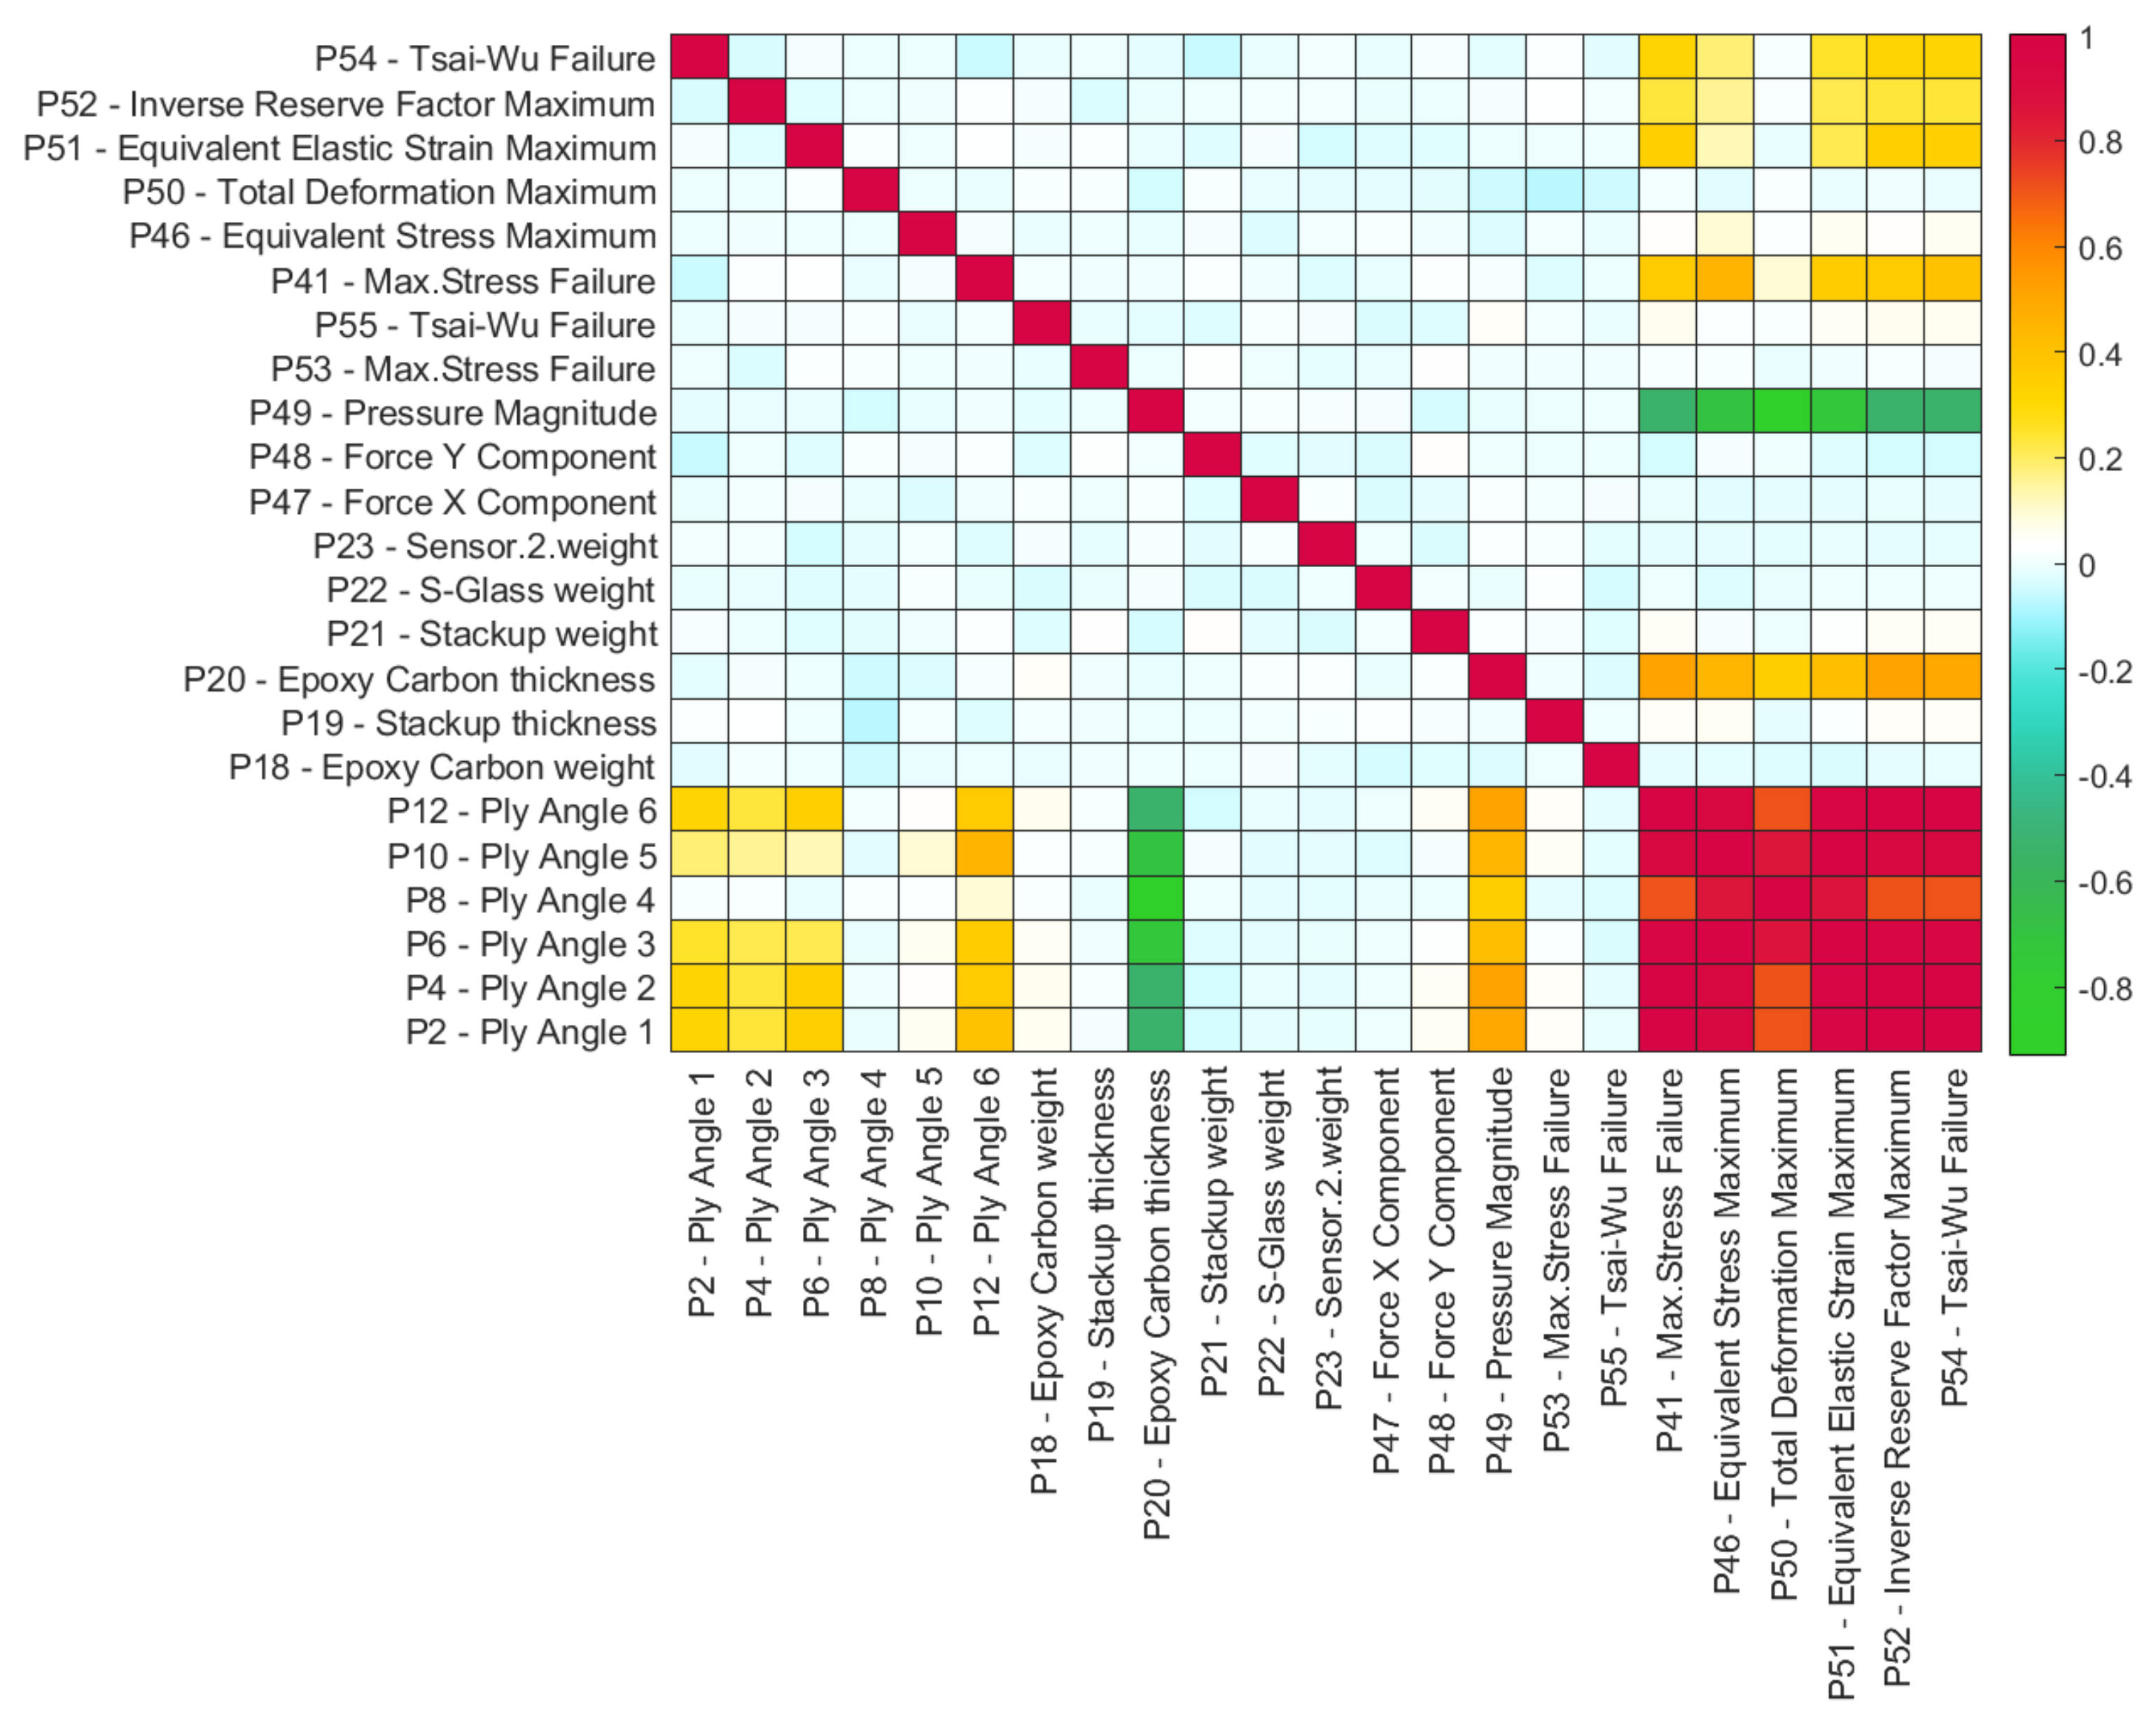
3.3.4. Preliminary Optimization Approach

In statistics, correlation or dependency illustrates the relationship between two or more variables. Correlation measures the degree of a linear relationship between two variables. The correlation coefficients commonly range from −1 to 1. For uncorrelated variables, the correlation coefficient is close to 0. Strongly correlated variables have a coefficient close to −1 or 1. The correlation coefficient remains positive if one variable increases with the other but increasing one variable while decreasing another result in a negative correlation coefficient. The correlation coefficient can anticipate the essential parameters that influence a model and are employed in practice for future model investigations.
The methods for calculating correlation coefficients are numerous, and several approaches can be found in the literature [57,58]. The Spearman correlation approach was utilized to discover the most correlated parameters in the morphing leading-edge wing model analysis. The correlation coefficient and variables can be analyzed in the Correlation and Determination matrices. The main parameters of a correlation study are given in Table 3.
The sample size (N) significantly impacts the correlation; choosing a suitable sample size that provides a thorough correlation through convergence is essential. Based on the many cases analyzed, a sample size of 150 was implemented in this study.
The correlation and the determination matrices are presented in Figure 21 and Figure 22, respectively. Their elements are employed as design factors for two failure criteria, the maximum stress, and Tsai-Wu. The matrices have their most significant values near −1 and 1. The most relevant parameters have strong correlation coefficients, as their weight increases with sample size. The failure criteria have a strong linear association. The coefficients are dispersed throughout the matrix, indicating that a thorough matrix was supplied to identify essential parameters. These matrix results show that pressure magnitudes, ply angles, and ply thicknesses all impact the model and its Design.
Figure 21 shows a positive correlation between the Max-Stress failure criterion and the ply thickness and a positive coefficient of 0.4947 between the Tsai-Wu failure criterion and the pressure magnitude. Therefore, this study found the most vital connections between ply angles, ply thickness, and the failure criterion. This agrees with the composite Design and dimensioning practice where plies orientation is crucial to obtain the desired structural properties.
In addition, the maximum stress failure criterion significantly correlates with the pressure parameter (0.5149). Therefore, the failure mode at maximum stress is primarily related to the ply angles and thickness.
The sensitivity diagrams for the maximum stress and Tsai-Wu failures are shown in Figure 23 and Figure 24, respectively. They indicate that the pressure, the ply angle, and the fiber thickness are the parameters that have the most substantial influence on the model’s performance.

4. Conclusions

A Droop Nose Leading Edge Morphing airfoil, designed for the UAS-S45, is presented in this paper. Both aerodynamic and structural optimization was performed on the MLE airfoil. The impact of the optimization method selection for aerodynamic optimization was investigated by comparing three different optimization algorithms’ results. The fitness function is the lift-to-drag ratio (L/D), which must be maximized. In addition, three other Mach numbers were used in the optimization process: 0.08, 0.1, and 0.15, as well as the flight conditions of cruise and take-off. All these optimization algorithms consistently provided almost identical results, with lift-to-drag ratio changes of less than 0.03 % and airfoil geometries and pressure distributions that were very close to each other.
In addition, unsteady variable leading-edge morphing with a dynamic meshing scheme was performed to determine the flow behaviour of near-stall flow and use downward leading-edge deflection as a control mechanism. The numerical results showed that the variable morphing leading edge with continuous downward deflection of the leading edge increased the stall angle of attack. The variable morphing leading edge airfoil effectively reduces the flow separation and trailing edge vortices and decreases the static and dynamic stall over an airfoil. It is worth noting that a large separation region was found at an angle of attack of 18° for the reference airfoil. However, the variable morphing leading edge airfoil at different deflections showed no significant flow separation or vortex. The flow remained attached over a large part of the morphing airfoil.
A preliminary study of the Design and analysis of a morphing leading-edge structure for the UAS-S45 wing integrated with a set of internal actuation mechanisms was provided. The sensitive analysis is an effective solution to apply design optimization methods, such as “correlation,” to design the morphing leading edge. In addition, the parameters affecting the wing model were explored to enhance further optimization studies and predict future failures for all wing models. The wing model input parameters included the composite material qualities, ply angles, and the ply stacking sequences. With these settings, the A.C.P. process in Ansys software has defined, applied, and calculated each finite element’s failure criteria. The correlation and determination matrices were then computed using the parameter sets results by identifying the parameters with the highest correlation coefficients. These findings will be used to adapt the composite morphing leading edge for target droop nose optimization and, consequently, to design a demonstrator.
Future work will study the variable morphing leading edge at different frequencies and amplitudes. The interaction of leading-edge vortices with the trailing-edge vortices of the morphing airfoil will be highlighted by combining the oscillating airfoil with its morphing deflection. In addition, near-stall angles of attack should be explored at various frequencies to understand unsteady flow physics better and investigate options for delaying stall. This study will help to develop an improved optimization model for variable morphing leading edge that will employ an objective to delay the dynamic stall.

Author Contributions

Conceptualization; methodology, M.B.; software, M.B., S.L.-M. and N.Z.; validation, M.B.; investigation, M.B., S.L.-M. and N.Z.; writing—original draft preparation, M.B.; writing—review and editing, R.M.B.; visualization, M.B., S.L.-M., N.Z. and R.M.B.; supervision, R.M.B., T.W. and A.C.; funding acquisition, R.M.B. All authors have read and agreed to the published version of the manuscript.

Funding

This research received no external funding.

Data Availability Statement

The data presented in this study are available on request from the corresponding author.

Acknowledgments

Special thanks to the Natural Sciences and Engineering Research Council of Canada (NSERC) for the funding of Canada Research Chair Tier 1 in Aircraft Modelling and Simulation Technologies. We would also like to thank Odette Lacasse for her support at the ETS and Hydra Technologies’ team members Carlos Ruiz, Eduardo Yakin, and Alvaro Gutierrez Prado in Mexico.

Conflicts of Interest

The authors declare no conflict of interest.

Appendix A

Figure A1. Cp distribution versus the chord obtained for the UAS-S45 optimized airfoil for M = 0.08.
Designs 06 00102 g0a1
Figure A2. Cp distribution versus the chord obtained for the UAS-S45 optimized airfoil for M = 0.1.
Designs 06 00102 g0a2
Figure A3. Cp distribution versus the chord obtained for the UAS-S45 optimized airfoil for M = 0.15.
Designs 06 00102 g0a3

References

  1. Overton, J. Fact Sheet|The Growth in Greenhouse Gas Emissions from Commercial Aviation, Part 1 of a Series on Airlines and Climate Change; Environmental and Energy Study Institute: Washington, DC, USA, 2019. [Google Scholar]
  2. Botez, R. Morphing wing, UAV and aircraft multidisciplinary studies at the Laboratory of Applied Research in Active Controls, Avionics and AeroServoElasticity LARCASE. Aerosp. Lab 2018, 14, 1–11. [Google Scholar]
  3. Hamy, A.; Murrieta-Mendoza, A.; Botez, R. Flight trajectory optimization to reduce fuel burn and polluting emissions using a performance database and ant colony optimization algorithm. In Proceedings of the AEGATS ‘16 Advanced Aircraft Efficiency in a Global Air Transport System, Paris, France, 12–14 April 2016. [Google Scholar]
  4. Ameduri, S.; Concilio, A. Morphing wings review: Aims, challenges, and current open issues of a technology. Proc. Inst. Mech. Eng. Part C J. Mech. Eng. Sci. 2020, 0954406220944423. [Google Scholar] [CrossRef]
  5. Botez, R.M.; Molaret, P.; Laurendeau, E. Laminar flow control on a research wing project presentation covering a three year period. In Proceedings of the Canadian Aeronautics and Space Institute Annual General Meeting, Toronto, ON, Canada, 25–26 April 2007. [Google Scholar]
  6. Peter, F.; Lammering, T.; Risse, K.; Franz, K.; Stumpf, E. Economic assessment of morphing leading edge systems in conceptual aircraft design. In Proceedings of the 51st AIAA Aerospace Sciences Meeting including the New Horizons Forum and Aerospace Exposition, Grapevine, TX, USA, 7–10 January 2013; p. 145. [Google Scholar]
  7. Li, D.; Zhao, S.; Da Ronch, A.; Xiang, J.; Drofelnik, J.; Li, Y.; Zhang, L.; Wu, Y.; Kintscher, M.; Monner, H.P. A review of modelling and analysis of morphing wings. Prog. Aerosp. Sci. 2018, 100, 46–62. [Google Scholar] [CrossRef] [Green Version]
  8. Kintscher, M.; Wiedemann, M.; Monner, H.P.; Heintze, O.; Kühn, T. Design of a smart leading edge device for low speed wind tunnel tests in the European project SADE. Int. J. Struct. Integr. 2011, 2, 383–405. [Google Scholar] [CrossRef]
  9. Carossa, G.M.; Ricci, S.; De Gaspari, A.; Liauzun, C.; Dumont, A.; Steinbuch, M. Adaptive Trailing Edge: Specifications, Aerodynamics, and Exploitation. In Smart Intelligent Aircraft Structures (SARISTU); Springer: Berlin/Heidelberg, Germany, 2016; pp. 143–158. [Google Scholar]
  10. Botez, R.M. Overview of Morphing Aircraft and Unmanned Aerial Systems Methodologies and Results–Application on the Cessna Citation X, CRJ-700, UAS-S4 and UAS-S45. In Proceedings of the AIAA SCITECH 2022 Forum, San Deigo, CA, USA, 3–7 January 2022; p. 1038. [Google Scholar]
  11. Noviello, M.C.; Dimino, I.; Amoroso, F.; Pecora, R. Aeroelastic Assessments and Functional Hazard Analysis of a Regional Aircraft Equipped with Morphing Winglets. Aerospace 2019, 6, 104. [Google Scholar] [CrossRef] [Green Version]
  12. Concilio, A.; Dimino, I.; Pecora, R. SARISTU: Adaptive Trailing Edge Device (ATED) design process review. Chin. J. Aeronaut. 2021, 34, 187–210. [Google Scholar] [CrossRef]
  13. Liauzun, C.; Le Bihan, D.; David, J.-M.; Joly, D.; Paluch, B. Study of morphing winglet concepts aimed at improving load control and the aeroelastic behavior of civil transport aircraft. Aerosp. Lab 2018, 14, 1–15. [Google Scholar]
  14. Carrier, G.; Atinault, O.; Dequand, S.; Hantrais-Gervois, J.; Liauzun, C.; Paluch, B.; Rodde, A.; Toussaint, C. Investigation of a strut-braced wing configuration for future commercial transport. In Proceedings of the 28th Congress of the International Council of the Aeronautical Sciences, Brisbane, Australia, 23–28 September 2012. [Google Scholar]
  15. Smith, J.W. Variable-Camber Systems Integration and Operational Performance of the AFTI/F-111 Mission Adaptive Wing; National Aeronautics and Space Administration—NASA, Office of Management: Washington, DC, USA, 1992; Volume 4370.
  16. De Gaspari, A.; Moens, F. Aerodynamic shape design and validation of an advanced high-lift device for a regional aircraft with morphing droop nose. Int. J. Aerosp. Eng. 2019, 2019, 7982168. [Google Scholar] [CrossRef] [Green Version]
  17. Moens, F. Augmented aircraft performance with the use of morphing technology for a turboprop regional aircraft wing. Biomimetics 2019, 4, 64. [Google Scholar] [CrossRef] [Green Version]
  18. Arena, M.; Concilio, A.; Pecora, R. Aero-servo-elastic design of a morphing wing trailing edge system for enhanced cruise performance. Aerosp. Sci. Technol. 2019, 86, 215–235. [Google Scholar] [CrossRef]
  19. Bashir, M.; Longtin-Martel, S.; Botez, R.M.; Wong, T. Aerodynamic Design Optimization of a Morphing Leading Edge and Trailing Edge Airfoil—Application on the UAS-S45. Appl. Sci. 2021, 11, 1664. [Google Scholar] [CrossRef]
  20. Sugar Gabor, O.; Simon, A.; Koreanschi, A.; Botez, R. Application of a morphing wing technology on hydra technologies unmanned aerial system UAS-S4. In Proceedings of the ASME International Mechanical Engineering Congress and Exposition, Montreal, QC, Canada, 14–20 November 2014; p. V001T001A037. [Google Scholar]
  21. Sugar Gabor, O.; Simon, A.; Koreanschi, A.; Botez, R.M. Aerodynamic performance improvement of the UAS-S4 Éhecatl morphing airfoil using novel optimization techniques. Proc. Inst. Mech. Eng. Part G J. Aerosp. Eng. 2016, 230, 1164–1180. [Google Scholar] [CrossRef]
  22. Bashir, M.; Longtin Martel, S.; Botez, R.M.; Wong, T. Aerodynamic Design and Performance Optimization of Camber Adaptive Winglet for the UAS-S45. In Proceedings of the AIAA SCITECH 2022 Forum, San Deigo, CA, USA, 3–7 January 2022; p. 1041. [Google Scholar]
  23. Monner, H.; Kintscher, M.; Lorkowski, T.; Storm, S. Design of a smart droop nose as leading edge high lift system for transportation aircrafts. In Proceedings of the 50th AIAA/ASME/ASCE/AHS/ASC Structures, Structural Dynamics and Materials Conference 17th AIAA/ASME/AHS Adaptive Structures Conference 11th AIAA No, Palm Springs, CA, USA, 4–7 May 2009; p. 2128. [Google Scholar]
  24. Pecora, R. Morphing wing flaps for large civil aircraft: Evolution of a smart technology across the Clean Sky program. Chin. J. Aeronaut. 2021, 34, 13–28. [Google Scholar] [CrossRef]
  25. Dimino, I.; Pecora, R.; Arena, M. Aircraft morphing systems: Elasticity of selected components and modelling issues. In Proceedings of the Active and Passive Smart Structures and Integrated Systems IX, Online, 27 April–8 May 2020; p. 113760M. [Google Scholar]
  26. Botez, R.; Koreanschi, A.; Gabor, O.; Tondji, Y.; Guezguez, M.; Kammegne, J.; Grigorie, L.; Sandu, D.; Mebarki, Y.; Mamou, M. Numerical and experimental transition results evaluation for a morphing wing and aileron system. Aeronaut. J. 2018, 122, 747–784. [Google Scholar] [CrossRef]
  27. Communier, D.; Botez, R.M.; Wong, T. Design and validation of a new morphing camber system by testing in the price—Païdoussis subsonic wind tunnel. Aerospace 2020, 7, 23. [Google Scholar] [CrossRef] [Green Version]
  28. Elelwi, M.; Kuitche, M.; Botez, R.; Dao, T. Comparison and analyses of a variable span-morphing of the tapered wing with a varying sweep angle. Aeronaut. J. 2020, 124, 1146–1169. [Google Scholar] [CrossRef]
  29. Khan, S.; Grigorie, T.; Botez, R.; Mamou, M.; Mébarki, Y. Novel morphing wing actuator control-based Particle Swarm Optimisation. Aeronaut. J. 2020, 124, 55–75. [Google Scholar] [CrossRef]
  30. Communier, D.; Botez, R.; Wong, T. Experimental validation of a new morphing trailing edge system using Price–Païdoussis wind tunnel tests. Chin. J. Aeronaut. 2019, 32, 1353–1366. [Google Scholar] [CrossRef]
  31. Gamboa, P.; Vale, J.; Lau, F.; Suleman, A. Optimization of a morphing wing based on coupled aerodynamic and structural constraints. AIAA J. 2009, 47, 2087–2104. [Google Scholar] [CrossRef]
  32. Tianyuan, H.; Xiongqing, Y. Aerodynamic/stealthy/structural multidisciplinary design optimization of unmanned combat air vehicle. Chinese J. Aeronaut. 2009, 22, 380–386. [Google Scholar] [CrossRef] [Green Version]
  33. Koreanschi, A.; Sugar Gabor, O.; Acotto, J.; Botez, R.M.; Mamou, M.; Mebarki, Y. A genetic algorithm optimization method for a morphing wing tip demonstrator validated using infra red experimental data. In Proceedings of the 34th AIAA applied aerodynamics conference, Washington, DC, USA, 13–17 June 2016; p. 4037. [Google Scholar]
  34. Koreanschi, A.; Sugar-Gabor, O.; Botez, R.M. Drag optimisation of a wing equipped with a morphing upper surface. Aeronaut. J. 2016, 120, 473. [Google Scholar] [CrossRef]
  35. Grigorie, T.L.; Botez, R.M.; Popov, A.V.; Mamou, M.; Mébarki, Y. A hybrid fuzzy logic proportional-integral-derivative and conventional on-off controller for morphing wing actuation using shape memory alloy Part 1: Morphing system mechanisms and controller architecture design. Aeronaut. J. 2012, 116, 433–449. [Google Scholar] [CrossRef]
  36. Popov, A.V.; Grigorie, T.L.; Botez, R.M.; Mébarki, Y.; Mamou, M. Modeling and testing of a morphing wing in open-loop architecture. J. Aircr. 2010, 47, 917–923. [Google Scholar] [CrossRef] [Green Version]
  37. Skinner, S.N.; Zare-Behtash, H. State-of-the-art in aerodynamic shape optimisation methods. Appl. Soft Comput. 2018, 62, 933–962. [Google Scholar] [CrossRef]
  38. Hicken, J.E. Efficient Algorithms for Future Aircraft Design: Contributions to Aerodynamic Shape Optimization; University of Toronto: Toronto, ON, Canada, 2009. [Google Scholar]
  39. Nonut, A.; Kanokmedhakul, Y.; Bureerat, S.; Kumar, S.; Tejani, G.G.; Artrit, P.; Yıldız, A.R.; Pholdee, N. A small fixed-wing UAV system identification using metaheuristics. Cogent Eng. 2022, 9, 2114196. [Google Scholar] [CrossRef]
  40. Champasak, P.; Panagant, N.; Pholdee, N.; Vio, G.A.; Bureerat, S.; Yildiz, B.S.; Yıldız, A.R. Aircraft conceptual design using metaheuristic-based reliability optimisation. Aerosp. Sci. Technol. 2022, 129, 107803. [Google Scholar] [CrossRef]
  41. Koreanschi, A.; Sugar Gabor, O.; Acotto, J.; Brianchon, G.; Portier, G.; Botez, R.M.; Mamou, M.; Mebarki, Y. Optimization and Design of an aircraft’s morphing wing-tip demonstrator for drag reduction at low speed, Part I–Aerodynamic optimization using genetic, bee colony and gradient descent algorithms. Chin. J. Aeronaut. 2017, 30, 149–163. [Google Scholar] [CrossRef]
  42. Tian, X.; Li, J. A novel improved fruit fly optimization algorithm for aerodynamic shape design optimization. Knowl. -Based Syst. 2019, 179, 77–91. [Google Scholar] [CrossRef]
  43. Shmilovich, A.; Yadlin, Y. Flow control techniques for transport aircraft. AIAA J. 2011, 49, 489–502. [Google Scholar] [CrossRef] [Green Version]
  44. Stanewsky, E. Adaptive wing and flow control technology. Prog. Aerosp. Sci. 2001, 37, 583–667. [Google Scholar] [CrossRef]
  45. Sankar, L.N.; Sahin, M.; Gopal, N. Dynamic Stall Characteristics of Drooped Leading Edge Airfoils; NASA Report, Document ID: 20010004630; National Aeronautics and Space Administration—NASA: Washington, DC, USA, 2000.
  46. Sahin, M.; Sankar, L.N.; Chandrasekhara, M.; Tung, C. Dynamic stall alleviation using a deformable leading edge concept—A numerical study. J. Aircr. 2003, 40, 77–85. [Google Scholar] [CrossRef] [Green Version]
  47. Martin, P.; McAlister, K.; Chandrasekhara, M.; Geissler, W. Dynamic Stall Measurements and Computations for a VR-12 Airfoil with a Variable Droop Leading Edge; National Aeronautics and Space Administration—NASA: Washington, DC, USA, 2003.
  48. Perry, M.; Mueller, T. Leading-and trailing-Edge flaps on a low Reynolds number airfoil. J. Aircr. 1987, 24, 653–659. [Google Scholar] [CrossRef]
  49. Lee, B.-S.; Ye, K.; Joo, W.; Lee, D.-H. Passive control of dynamic stall via nose droop with Gurney flap. In Proceedings of the 43rd AIAA Aerospace Sciences Meeting and Exhibit, Reno, NV, USA, 10–13 January 2005; p. 1364. [Google Scholar]
  50. Chandrasekhara, M.; Martin, P.B.; Tung, C. Compressible dynamic stall control using a variable droop leading edge airfoil. J. Aircr. 2004, 41, 862–869. [Google Scholar] [CrossRef]
  51. Bashir, M.; Longtin-Martel, S.; Botez, R.M.; Wong, T. Optimization and Design of a Flexible Droop-Nose Leading-Edge Morphing Wing Based on a Novel Black Widow Optimization Algorithm—Part I. Designs 2022, 6, 10. [Google Scholar] [CrossRef]
  52. Winyangkul, S.; Wansaseub, K.; Sleesongsom, S.; Panagant, N.; Kumar, S.; Bureerat, S.; Pholdee, N. Ground Structures-Based Topology Optimization of a Morphing Wing Using a Metaheuristic Algorithm. Metals 2021, 11, 1311. [Google Scholar] [CrossRef]
  53. Thill, C.; Etches, J.; Bond, I.; Potter, K.; Weaver, P. Morphing skins. Aeronaut. J. 2008, 112, 117–139. [Google Scholar] [CrossRef]
  54. Murugan, S.; Friswell, M. Morphing wing flexible skins with curvilinear fiber composites. Compos. Struct. 2013, 99, 69–75. [Google Scholar] [CrossRef]
  55. Chillara, V.; Dapino, M. Review of morphing laminated composites. Appl. Mech. Rev. 2020, 72, 010801. [Google Scholar] [CrossRef]
  56. Cantwell, W.J.; Morton, J. The impact resistance of composite materials—A review. Composites 1991, 22, 347–362. [Google Scholar] [CrossRef]
  57. Wilcox, R.R.; Muska, J. Comparing correlation coefficients. Commun. Stat.-Simul. Comput. 2002, 31, 49–59. [Google Scholar] [CrossRef]
  58. Gideon, R.A. The correlation coefficients. J. Mod. Appl. Stat. Methods 2007, 6, 16. [Google Scholar] [CrossRef]
Figure 1. Flow chart for the airfoil shape optimization.
Designs 06 00102 g001
Figure 2. Variable morphing leading edge airfoil at different deflection angles.
Designs 06 00102 g002
Figure 3. Computational region and boundary conditions.
Designs 06 00102 g003
Figure 4. A dynamic mesh model of the variable morphing leading edge airfoil.
Designs 06 00102 g004
Figure 5. Cp distribution versus chord length using the PSO algorithm for the (a) angle of attack of 2° and (b) of 6°, compared to the reference airfoil.
Designs 06 00102 g005
Figure 6. Cp distribution versus chord length using the GA algorithm for the (a) angle of attack of 2° and (b) of 6°, compared to the reference airfoil.
Designs 06 00102 g006
Figure 7. Cp distribution versus chord length using the BWO algorithm for the (a) angle of attack of 2° and (b) of 6°, compared to the reference airfoil.
Designs 06 00102 g007
Figure 8. Comparison of CL/CD for the reference and optimized airfoils at different angles of attack and Mach numbers 0.08, 0.10, and 0.15. The lift-to-drag ratios at these three Mach numbers show that the best improvements in efficiency are obtained at angles of attack of 4 to 6°.
Designs 06 00102 g008
Figure 9. Evaluation of the cost for the B.W.O., the PSO, and the G.A. algorithms, (a) cruise condition and (b) climb condition.
Designs 06 00102 g009
Figure 10. Pressure contour with streamlines of the morphing leading-edge airfoil.
Designs 06 00102 g010
Figure 11. Streamline velocity contours at different time steps in a variable morphing leading edge and the Cp distribution at 0° angle of attack.
Designs 06 00102 g011
Figure 12. Streamline velocity contours at different time steps on a variable morphing leading edge and the Cp distribution at a 6° angle of attack.
Designs 06 00102 g012
Figure 13. Streamline velocity contours at different time steps on a variable morphing leading edge and the Cp distribution at an angle of attack of 18°.
Designs 06 00102 g013
Figure 14. Streamline velocity contours at different time steps on a variable morphing leading edge and the Cp distribution at 22° angle of attack.
Designs 06 00102 g014
Figure 15. Streamlined velocity contours at time step of t = 0.53 s on a variable morphing leading edge and the Cp distribution at 24° angle of attack.
Designs 06 00102 g015
Figure 16. Vorticity contours with flow streamlines at different time steps and angles of attack (18°, 22°, and 24°).
Designs 06 00102 g016
Figure 17. Aerodynamic lift coefficients for the morphing airfoil with time (s) at three different Mach numbers of (a) 0.08, (b) 0.1, and (c) 0.15.
Designs 06 00102 g017
Figure 18. L.E. geometry at the reference section.
Designs 06 00102 g018
Figure 19. Modeling of the assigned laminated composite material components with the orientation direction.
Designs 06 00102 g019
Figure 20. Leading Edge with glass fiber nose layup [0/90/±45/90/0]: (a) deformation, (b) equivalent stress, (c) equivalent strain, (d) Inverse Reserve Factor.
Designs 06 00102 g020
Figure 21. Parametric correlation matrix.
Designs 06 00102 g021
Figure 22. Parametric determination matrix.
Designs 06 00102 g022
Figure 23. Sensitivities of max stress failure.
Designs 06 00102 g023
Figure 24. Sensitivities of Tsai-Wu failure.
Designs 06 00102 g024
Table 1. Parameters of three different optimization algorithms.
Black Widow
Optimization Algorithm
Genetic AlgorithmParticle Swarm Optimization
Spider Size40Population Size40Swarm Size40
Generations50Generations50Iterations50
Reproduction rate0.6Crossover0.7Cognitive factor (C1)1.2
Cannibalism rate0.44Mutation0.3Social factor (C2)1.2
Mutation rate0.4
Table 2. Mechanical properties of Carbon/Epoxy S-Glass/Epoxy.
Material PropertiesCarbon/EpoxyS-Glass/Epoxy
Young s   Modulus   X   direction   MPa 59,16050,000
Young s   Modulus   Y   direction   MPa 59,1608000
Young s   Modulus   Z   direction   MPa 75008000
Shear   Modulus   X . Y .   MPa 17,5005000
Shear   Modulus   Y . Z .   MPa 27003846.1
Poisson s   Ratio   XY 0.0040.3
Poisson s   Ratio   YZ 0.30.4
Table 3. Correlation Parameters.
Thickness
P20Material thickness (ply thickness)
P19Material thickness (Stack thickness)
Geometry
P2Ply Angle 1
P4Ply Angle 2
P6Ply Angle 3
P8Ply Angle 4
P10Ply Angle 5
P12Ply Angle 6
P18Epoxy Carbon Weight
P19Stack Thickness
P21Stackup Weight
Loads
P47Force X Component
P48Force Y Component
P49Pressure Magnitude
Failure criteria
P53Max. Stress Failure
P55Tsai-Wu Failure
Publisher’s Note: MDPI stays neutral with regard to jurisdictional claims in published maps and institutional affiliations.

