Article

Influence of Color on Loudness Perception of Household Appliances: Case of a Coffee Maker

by
Nikolaos M. Papadakis
1,2,
Andreas Zantzas
2,
Konstantinos Lafazanis
2 and
Georgios E. Stavroulakis
1,*
1
Institute of Computational Mechanics and Optimization (Co.Mec.O), School of Production Engineering and Management, Technical University of Crete, 73100 Chania, Greece
2
Department of Music Technology and Acoustics, Hellenic Mediterranean University, 74100 Rethymno, Greece
*
Author to whom correspondence should be addressed.
Designs 2022, 6(6), 101; https://doi.org/10.3390/designs6060101
Submission received: 11 September 2022 / Revised: 17 October 2022 / Accepted: 24 October 2022 / Published: 27 October 2022

Abstract

:
Previous studies have investigated the effect of color on the assessment of loudness in various cases, such as cars, trains, and concert halls. This study sets out to explore the influence of color on the loudness perception of household appliances, in particular in the case of coffee makers. To this end, images of a coffee maker colored in black, red, dark green, light blue, light green, and white were displayed to participants during a magnitude estimation task. In a repeated measures design, the sound of a coffee maker was used synchronously as a stimulus presented in different sound levels (74, 78, 82, and 86 dB LAeq). The sample of participants was selected to be gender balanced and unfamiliar with similar experiments. Statistical analysis suggested that the color of the visual stimulus had no influence on loudness judgments. However, a gender-based statistically significant influence regarding the color of the coffee maker on loudness evaluation was found for females. An interpretation of the results is attempted in the discussion. The results of this study suggest that since there is the possibility of gender differences in the assessment of loudness for household appliances, special care should be taken in similar studies to account for these effects. Finally, these gender differences could possibly be utilized for product sound design and product marketing where the appropriate use of color has been found to be effective.

1. Introduction

Loudness has been defined as the auditory sensation in terms of which sounds can be ordered on a scale extending from soft to loud [1] or otherwise the subjective intensity of a sound [2]. The study of loudness falls within the field of psychoacoustics and employs methods of psychophysics. The accurate estimation of loudness is important in many fields, such as environmental noise [3], product sound design [4], sound-quality engineering [5], and soundscapes [6]. The perception of loudness is mainly related to sound pressure level (SPL). However, loudness also changes with other physical properties of sound (e.g., frequency, bandwidth, duration, spectral complexity of a sound, the presence of other sounds, etc.) [7]. Although loudness mainly depends on the physical properties of the sound, studies have shown that loudness judgments may also be influenced by non-acoustical factors such as multisensory interactions, changes in memory, the manner in which sounds are presented and how they are measured, cognitive factors, the psychological and physical state of the listener, and cross-cultural differences [7,8,9,10].
Studies on the multisensory interactions of loudness have mainly focused on audio–visual interactions, with fewer studies on other areas, e.g., loudness and the sense of touch [11] and loudness in the presence of vibrotactile stimulation [12]. Audio–visual studies have shown that loudness ratings of white noise depend on the type of picture shown simultaneously with the noise [13]; the loudness of sounds presented at the same sound pressure level can be judged to be different depending on the picture presented with the sound [14], and low-level noise bursts are rated louder when they are heard in the presence of lights than in their absence [15]. Studies focused on more specific stimuli have shown that the visibility or visual characteristics of noise barriers can affect their perceived loudness [16,17], visual information can affect the perceived road traffic noise [18], the visibility (distance) of a chiller can influence its perceived loudness [19], and visual information can affect the perceived loudness in an auditorium [20] and also the perceived loudness of vehicles [21,22,23].
An important aspect of audio–visual interactions regarding loudness is the influence of color. Various studies have investigated the effect of color in cases such as pink noise [24], trains [25,26,27], cars [28,29], acoustic halls [30], radios [31,32], absolute thresholds of hearing [33], uniform exciting noise (UEN) [32,33], synthetic vowels [34], and noise annoyance evaluations [35]. In a study by Kim et al. [24], the auditory component of the stimulus was a wide range of pink noise, and the visual component used ten chromatic colors and two achromatic colors. The results showed that when the color was close to red or white, the noise was perceived as significantly louder and noisier, and when the color was close to green or blue, the noise was perceived as significantly softer and quieter. In a study by Menzel et al. [28], still images of red or dark green vehicles seem to elicit higher loudness ratings compared to light-green or blue vehicles. Similar tendencies were observed in a study with Japanese subjects [29]. A study by Patsouras et al. [25] focused on the impact of different colors of trains on their perceived loudness and found that a red-colored train resulted in higher estimation, while a green-colored train seemed to reduce the perceived loudness. However, in a follow-up study by Parizet and Koehl [26], no influence of train color on loudness evaluation could be found. Regarding the influence of colors on the loudness perception of radios, it was found that crying colors [31] generally cause an overestimation of loudness compared to an average rating. In a study regarding acoustic hall colors, the results show that color has little or no effect on loudness (and reverberance) compared to changing the gain (or reverberation time). However, color does affect visual and auditory preference, and these are positively correlated and mutually influential [30].
Interpretations of the results and the effect of color in the perception of loudness can be placed into three categories according to studies: the associations of colors with specific object characteristics, associations with visual features of colors, and the importance of the context of the measurements. Regarding the associations of colors with specific object characteristics, in one of the aforementioned studies [28], it was assumed that certain colors, such as bright red, are traditionally associated with premium sports cars and could thus cause subjects to assume the vehicle possesses a powerful and, therefore, loud engine, which, in turn, could lead to higher loudness ratings. In a study [36] involving images of small and large trucks combined with truck sounds of different levels, the subjects were asked to rate the loudest. It was found that a sound associated with pictures of big trucks frequently was judged as being louder. In another study comparing luxury and sports vehicles [21], the results indicated that frequent drivers perceived that the sound associated with luxury vehicles was louder than that associated with sporty vehicles. On the other hand, infrequent drivers perceived almost no difference between the loudness of the two vehicle types.
Several studies have associated visual features of colors, such as luminance, hue, and saturation to loudness [24,31,34,37]. In a study [31], crying colors (colors that stand out) generally caused an overestimation of loudness. In another study [24], the chroma of the color was manipulated while the hue and value were kept constant. The results revealed that the loudness of the noise increased when the chroma of the color was higher and decreased when the chroma was lower. In a study by Anikin and Johansson [34], the loudness and pitch of acoustic stimuli were associated with both the luminance and saturation of the presented colors. In a related study, the color red was found to have high loadings on the powerful factor [29]. The collective associations of loudness with visual features such as luminance, hue, and saturation can be found in [34].
Regarding the importance of the context of measurements, a study by Menzel et al. [33] used methods that require subjects to concentrate on the auditory stimulus (Békésy-tracking, loudness matching). In both cases, no influence of color on either absolute threshold or loudness perception measured via adjustment could be found. A review [38] presented how loudness assessments depend on what the listener focuses on when estimating loudness. The study concluded that according to the instructions listeners are provided with and to the quantity and quality of the information provided about the sound source, loudness might relate to the strength of the sound emitted by the source (the distal stimulus) or received by the ears (the proximal stimulus). These two percepts do not depend on the physical attributes of the sound in the same way, and the listener’s focus might vary from one listener to another in the same experiment. These observations could thus account for results in the literature according to which some parameters (sound pressure level, source position, monaural vs. binaural listening…) have a weaker effect on the loudness of sounds whose source is identifiable by the listener and when individual differences are observed.
The main aim of this study is to investigate the effect of color on the perception of loudness in the case of household appliances, in particular, the case of a coffee maker. As a secondary aim, this study investigated if there are gender-based differences in the effect of color on the perception of loudness in the case of household appliances since it has been found that female subjects are more strongly influenced in their loudness judgments by simultaneously presented color patches [31]. In general, there are gender-based differences in the perception of color [39,40,41], color preference [42], and gender-based differences that exist in the retina [43].
This paper has been organized as follows: Section 2 presents the methodology employed. Section 3 includes the findings of the research, while Section 4 analyses the data, addresses the research questions, and identifies the limitations and areas for further research. Finally, Section 5 provides a brief summary and contextualizes the study.

2. Methods

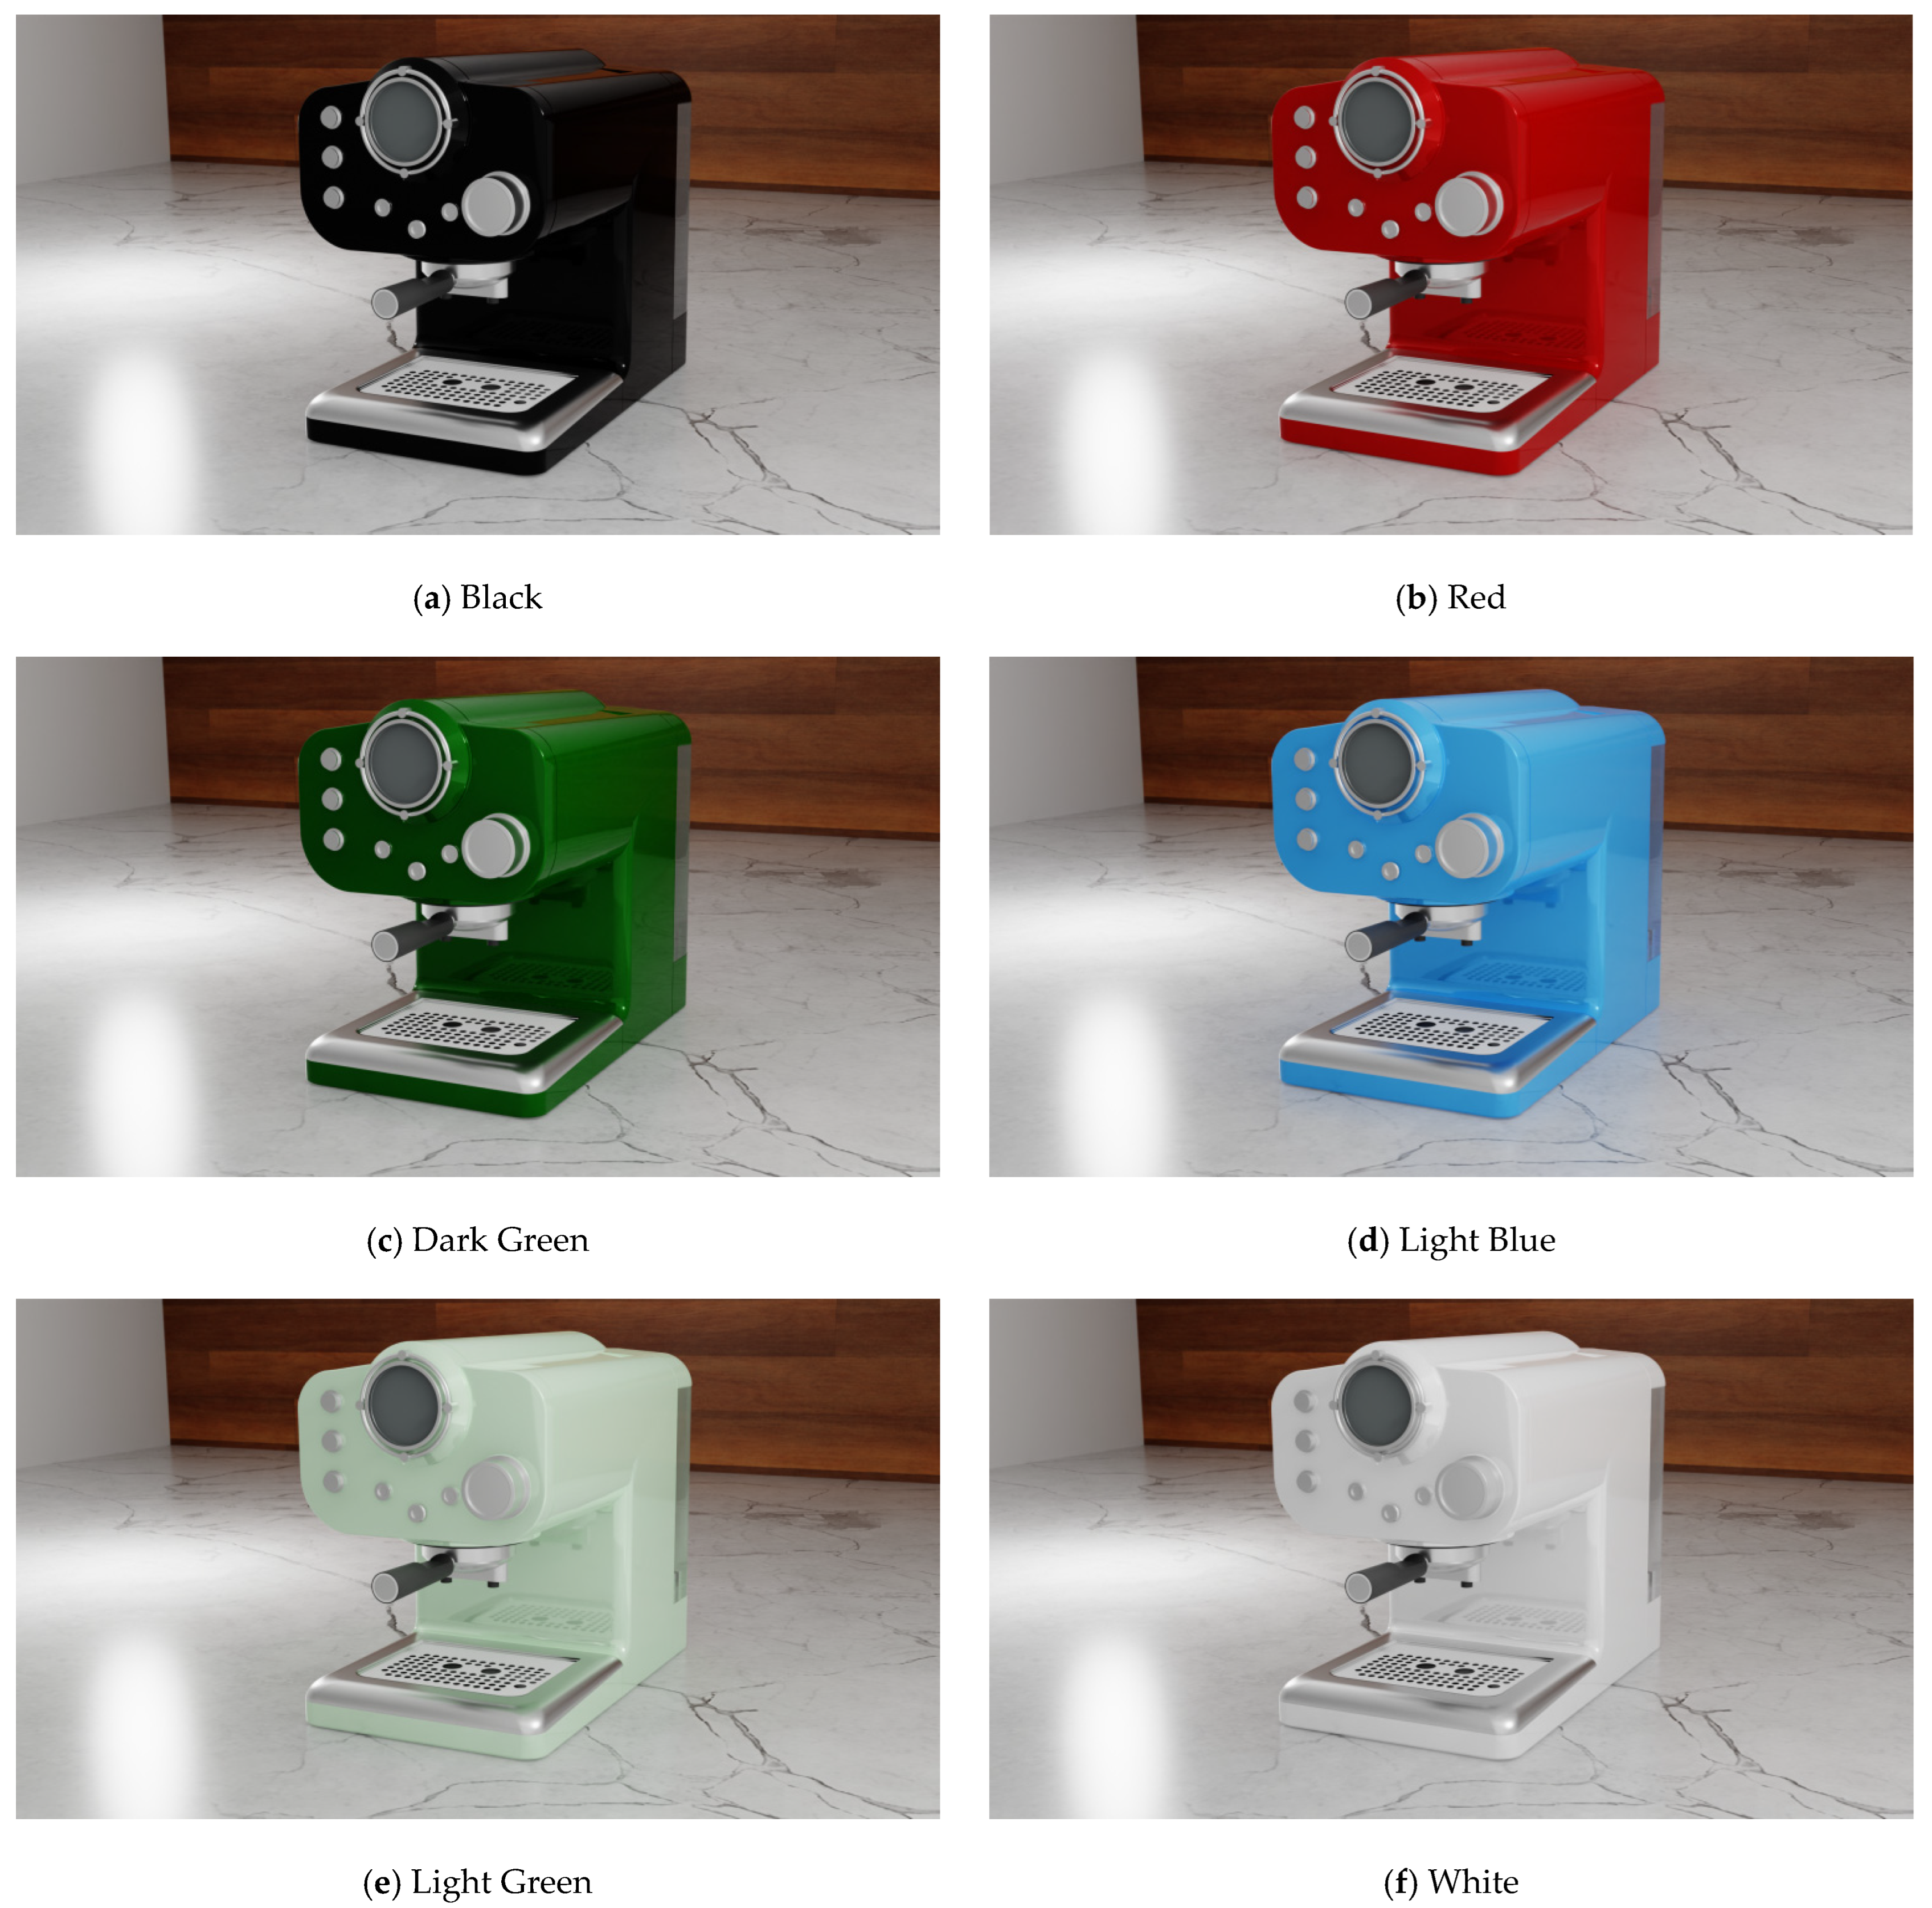
2.1. Auditory and Visual Stimuli

The sound of a coffee maker unit was used as an auditory stimulus and was recorded 0.7 m away from the source at a height of 1.2 m. The signal was recorded in the vicinity of a similar environment presented in Figure 1 using a portable recording device, Sound Devices 722 (Sound Devices, Reedsburg, WI, USA). The recordings were performed in an uncompressed PCM (pulse-code modulation) format with a 96 KHz sample rate and a 24-bit depth and saved in waveform audio file format (*.wav). The same files were used for audio reproduction avoiding any other audio file conversion [44]. The dynamic range was adjusted during recording in order to obtain as low a background noise as possible. The sound had a steady-state nature, so a measurement time of 60 s was sufficient for our purpose of extracting a sample for the experiment. The reason for selecting this sound excerpt was to achieve a stationary noise reasonably representative of the sound source under normal working conditions. To avoid clicks, Gaussian shaping with 10 ms rise and fall time was applied to the beginning and end of the sound. The sound was always the same during the experiment, but the sound level varied, as in similar studies [45]. Only the sound level was modified, which had an equal impact on all frequencies of sound. The sound levels were chosen to represent typical levels for the A-weighted equivalent sound pressure level, LAeq, measured at the same distance from the source.
The images were created with Blender 2.93 software (Blender Foundation, Amsterdam, The Netherlands) [46]. All of the picture elements were three-dimensional. The coffee machine was designed to look similar to commercially available coffee machines but not identical to them. The scene of the image was designed to resemble a probable location assumed to be representative of plausible contexts where the investigated sound source is most likely to be experienced. Various options were considered for the final selection of the colors. The colors selected in previous relevant studies were taken into account [26,28]. In [28], the selected colors were dark green, light green, red, and blue, while in [26], they were red, blue, white, and green. For this study, a combination of the above options was chosen. Six colors were assigned to the model under the same neutral lighting and rendering condition. The colors are black, red, dark green, light blue, light green, and white. The light-green color that was used in this study can also be found and referred to by the name light-rose green, and the light-blue color by the name crystal blue [47]. In this research, for simplicity, we used the names light green and light blue, respectively. The colors and their color values in the RGB (red, green, blue), HEX (hexadecimal), and RGBA (red, green, blue, alpha) color space that is used in Blender are presented in Table 1. The RGB color model is an additive color model in which the red, green, and blue primary colors of light are added together in various ways to reproduce a broad array of colors, an idea based on the trichromatism of the receptors of our vision system, the cones L, M, and S. The name of the model comes from the initials of the three additive primary colors, red, green, and blue. Whereas RGB is a combination of three colors (Red, Green, and Blue), RGBA is the same as RGB with the extension of alpha (alpha = transparency), and HEX uses hexadecimal values to represent the colors.

2.2. Participants

In total, 24 persons participated in the listening tests. They comprised 12 male participants (Mage = 29.0 years, SDage = 4.4 years) and 12 female participants (Mage = 27.5 years, SDage = 5.9 years). A gender-balanced representation was desirable, as previous studies found that there is a gender difference in the estimation of loudness [31]. In order to achieve a homogenous group, a qualified majority of participants were university students, self-reporting normal hearing and vision. The participants were not reimbursed for their time and took part voluntarily. Informed consent was obtained from all participants before the experiment.

2.3. Experimental Design and Procedure

2.3.1. Experimental Room

The experiment was conducted in university facilities. The test room was measured to be sound-proof [48], utilizing an appropriate excitation signal [49]. Additionally, after the measurements, the room was found to have a sufficiently low reverberation time [50,51]. The room was equipped with two loudspeakers (Adam Audio, A7Χ) that produced the experimental sounds and one large computer display (Dell U2719D Monitor 27″) in which the visual stimuli of the experiment were presented. The middle point of the display was 1.2 m from the floor. The conditions were similar to [45]. The loudspeakers were initially calibrated in the listening position with a 01dB-Steel SdB02 sound level meter (01 dB-Stell, Limonest, France). Throughout the experiments, there was a second sound level meter, Extech 407740 (Extech, Nashua, NH, USA), to frequently monitor the sound level meters. The participants were seated in the middle of the test room behind a desk 0.70 m away from the display, as in similar studies [28,32,33]. The lighting level was low during the experiment, and the lighting was directed so that there were no reflections on the display. The participants were instructed to keep their eyes focused on the image throughout the experiment.
Figure 1. Visual stimuli of the 6 color settings of the coffee maker (top to bottom: (a) black, (b) red, (c) dark green, (d) light blue, (e) light green, (f) white). (For specific interpretations of the colors in this figure, the reader is referred to Table 1).
Designs 06 00101 g001

2.3.2. Experimental Design

For this research, the method of free magnitude estimation [52] was applied, as has been used in many similar studies [25,26,28,32]. The method is a type of unbounded, continuous scaling procedure where the listener is presented with a series of stimulus levels in random order and is asked to respond with a number that matches its loudness [7]. A method based on the principle of line length was also considered since it has been found to have similar results with magnitude estimation [53]. However, it was not used since it was only applied partly in one of the aforementioned studies [32]. Categorical methods [1] were not considered since, unlike the magnitude estimation scale, they are not effective in producing responses that are approximately proportional to loudness [52,54].
For this study, a repeated-measures design was used; that is, each participant was exposed to all conditions acting as his/her own control. To minimize memory effects during the loudness judgments, four different sound levels were applied, similar to [26,28]. Therefore, two independent variables were manipulated: the sound level (4 levels: 74, 78, 82, and 86 dB LAeq) and the different colors of the coffee maker (6 levels: black, red, dark green, light blue, light green, and white). The dependent variable was the loudness of the coffee maker.
In the listening tests, written instructions with appropriate adaptation were provided to the participants, which informed that they were about to rate the perceived loudness of sounds accompanying the images of coffee makers [55]. The participants were told they would be presented with scenes of a coffee maker together with the sound of the coffee maker. This information was provided to remove any ambiguity of the sound. The participants were instructed to rate the loudness of the scenery as a whole by tapping an appropriate number on the keyboard and then pressing ‘Enter’. They were told to do so by giving arbitrary positive numbers that correspond to perceived loudness. The participants were tested individually.
At the beginning of each session, a short training sequence was inserted consisting of four randomly chosen stimulus combinations. After the practice sequence, the participants were informed that they would be presented with 72 ratings. In each session, all possible combinations of auditory and visual stimuli were presented three times in random order. Each sound–image combination was presented for 4 s, similar to [28], before a black screen appeared, enabling the participants to rate the stimuli. There was no time limit when providing a response. This resulted in 72 loudness ratings per subject per session. The whole experiment lasted approximately 15 min. After the experiment, the participants were informed about the nature of the study and were allowed to ask questions. The study was approved by the Committee on Ethics and Deontology of Research (C.E.D.R), Technical University of Crete, Greece (Project identification code: Protocol number 37/5.5.2022).

3. Results

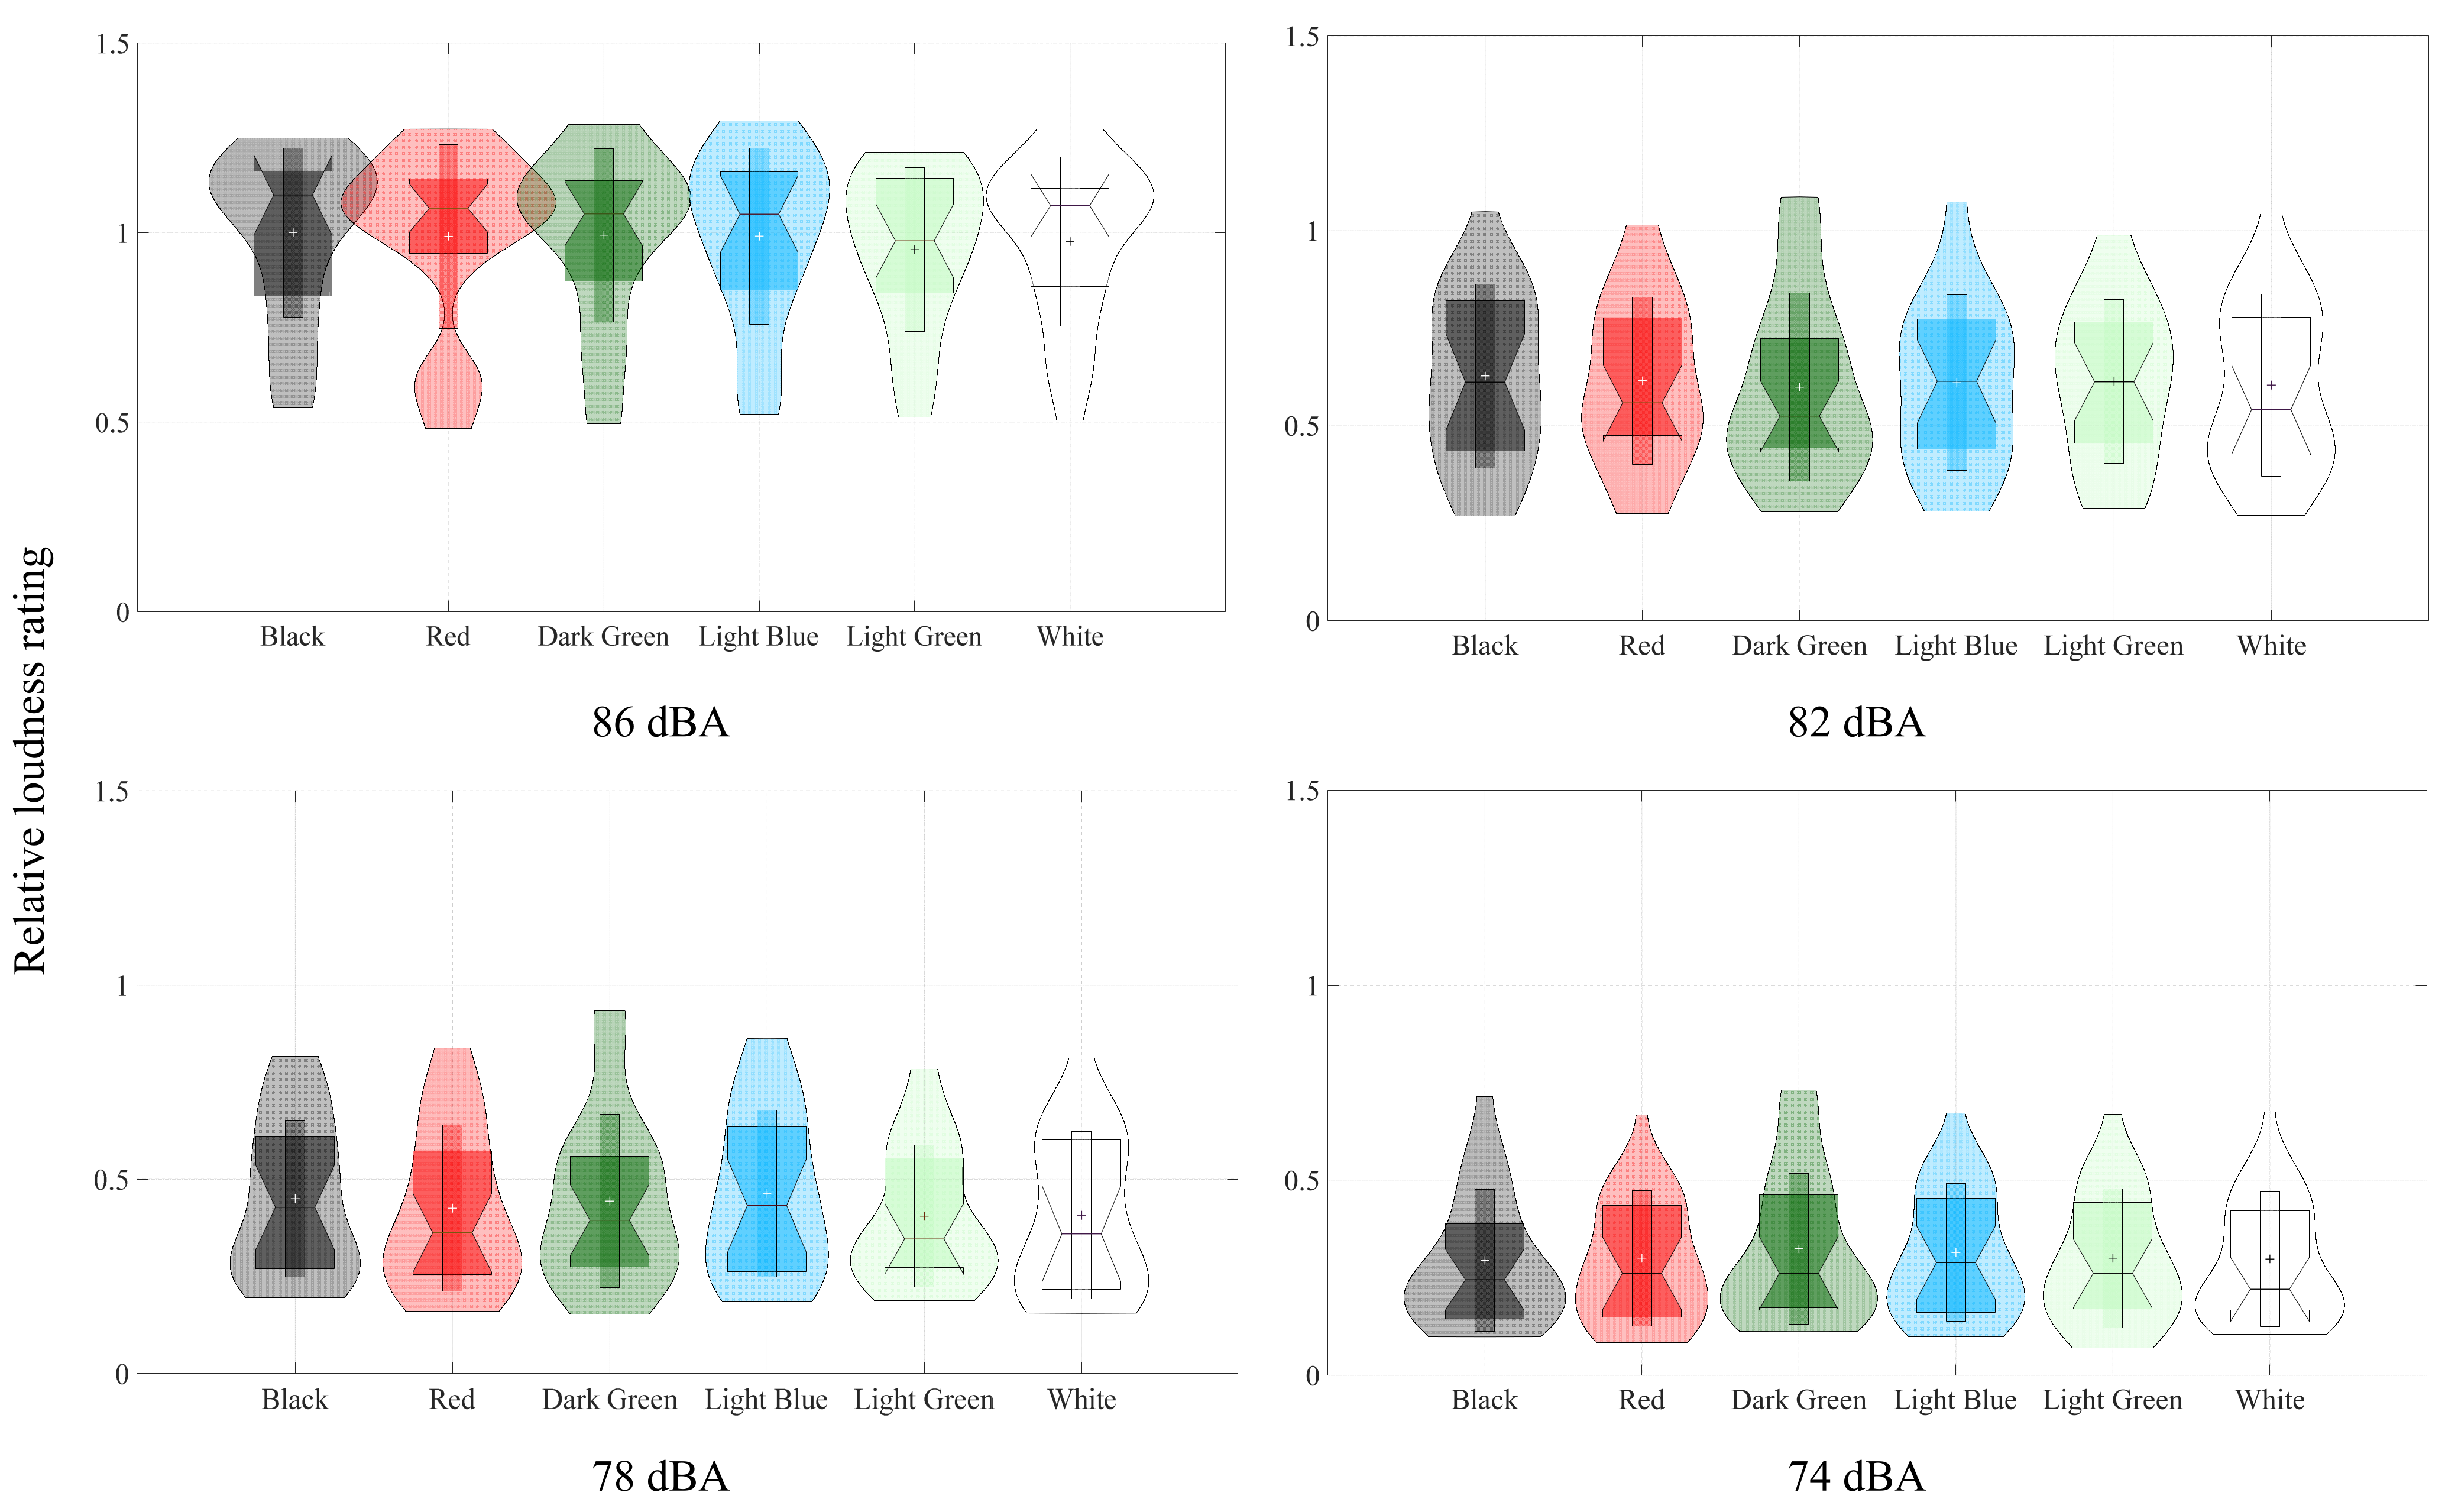
3.1. General Results

In order to directly evaluate and present the influence of the color, the relative loudness ratings were calculated using the ratios between the geometric means obtained for a given color and one of the black colors for 86 dBA, which was found to be the highest, were computed. These relative loudness ratings are presented in Figure 2 and Figure 3. The same concept of relative loudness ratings has been used in similar studies [25,28,29]. Geometric means have also been used in similar studies [26] and in fields other than acoustics for magnitude estimates [56]. As stated by Marks and Florentine [57]: ‘distributions of magnitude estimations typically are highly skewed and often log normal, leading many investigators, appropriately, to use geometric averages (for loudness measurements)’.
The mean, standard deviation, median, notch, and violin plots are presented in Figure 2. The notches on the sides of a box plot can be interpreted as a comparison interval around the median values. The height of the notch is the median +/− 1.57 × IQR/sqrt(n) where IQR is the interquartile range defined by the 25th and 75th percentiles, and n is the number of data points. An estimate of the probability density is displayed symmetrically on both sides of the boxplot. This marks the edges of the violin shape. The density traces surround the boxplot and convey a better idea of the magnitude of the density over the range of the data. The probability density function was estimated using kernel density estimation (Parzen [58]).
For some graphs (e.g., Figure 2, Black 86 dBA), the upper notch (upper bound of the 95% confidence interval of the median) has a higher value than the third quartile. The distance between the notches and the median is proportional to the inverse of the square root of the sample size (1/sqrt(n)). This phenomenon can sometimes occur when the sample size is small.
As a second step, the influence of the two independent variables was investigated using an analysis of variance (ANOVA). The geometric means of the three evaluations provided by subjects were used, and ANOVA (repeated measures) was conducted using the set of data thus obtained. It appeared that the only significant factor was level (F(3, 69) = 218.668, p < 0.001). Color was not significant (F(5, 115) = 1.669, p = 0.148), nor the interaction between the factors (F(15, 345) = 0.877, p = 0.591). An ANOVA table is presented in Table 2.

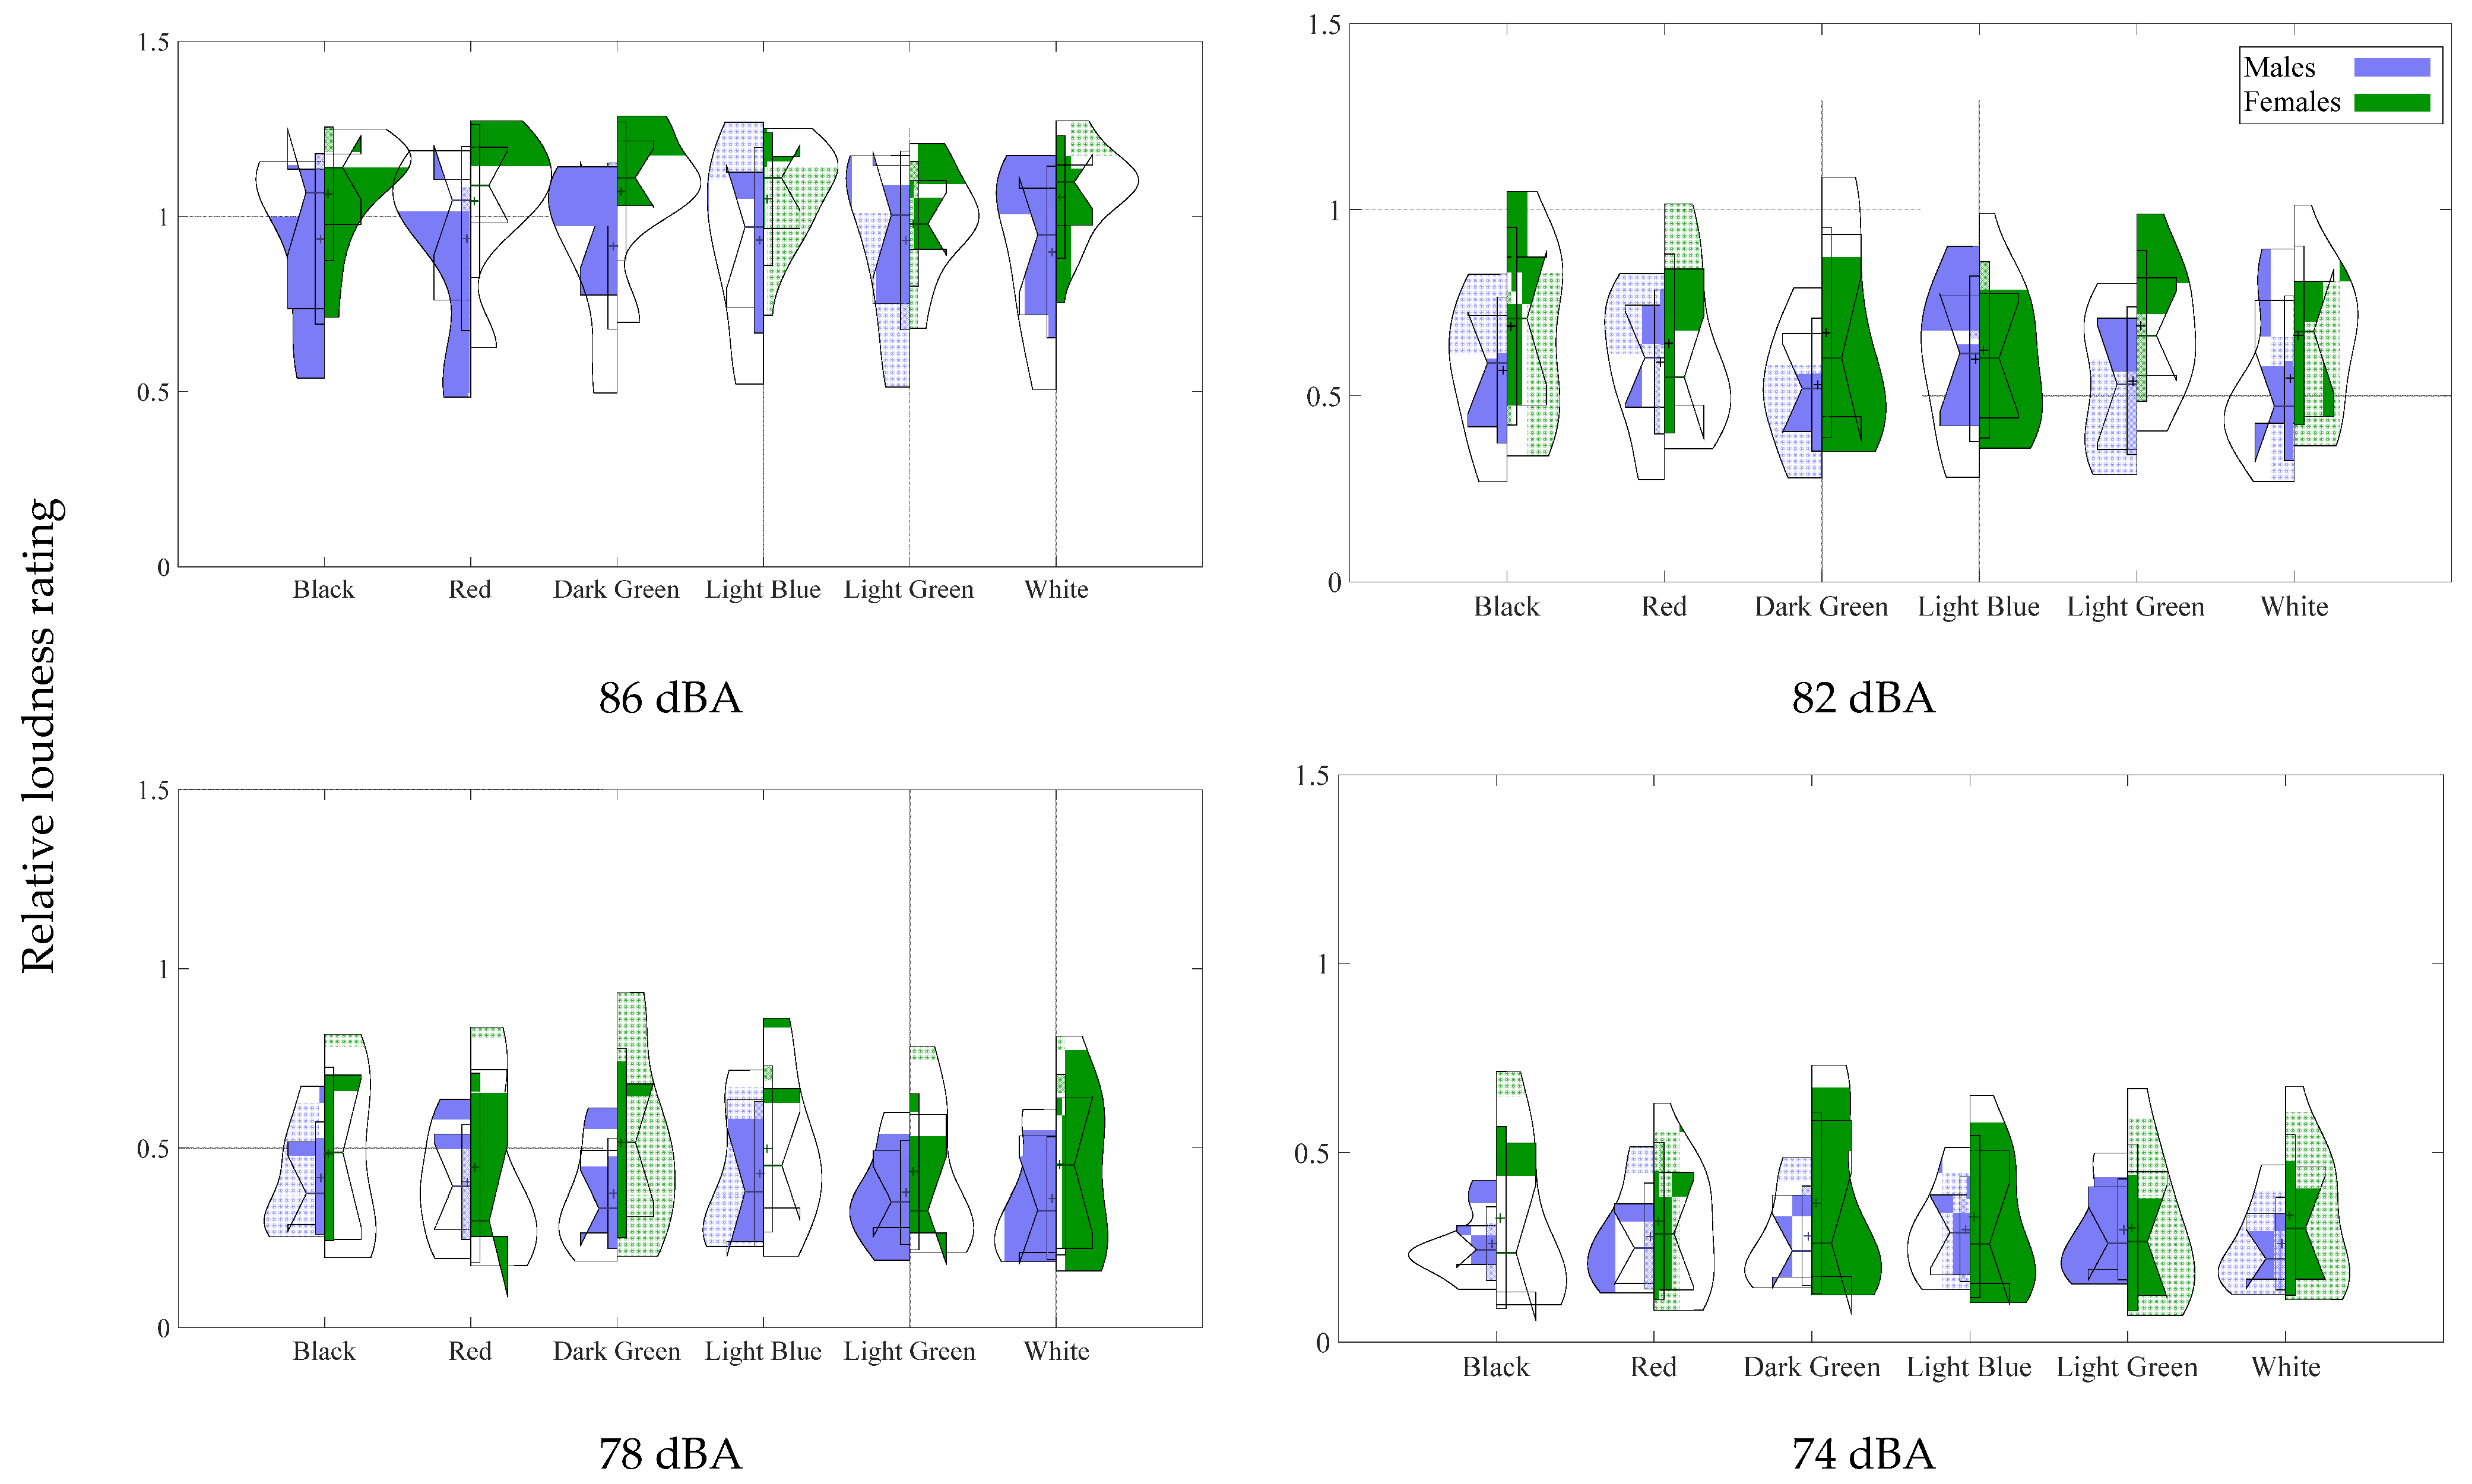
3.2. Results per Gender

Additionally, as stated in the introduction, gender-based differences in the effect of color on the perception of loudness were also investigated. Similar to the previous section (Section 3.1), the ratios between the geometric means obtained for a given color and the one of the black color for 86 dBA that was found to be the highest were used. For each gender, the mean, standard deviation, median, notch, and violin plots are presented in Figure 3. The results are presented per gender for comparison purposes. Violin plots, boxplots, and notches were calculated and plotted similarly to Section 3.1.
As a second step, the influence of the two independent variables and the effect on gender were investigated using an analysis of variance (ANOVA). The geometric mean of the three evaluations provided by a subject was used, and the ANOVA (repeated measures) was conducted using the set of data obtained (Table 3). It appears that there was a significant interaction between color and gender (F(5, 110) = 0.021, p = 0.009). The interaction between level and gender and the interaction between color, level, and gender failed to reach statistical significance. An additional ANOVA (repeated measures) conducted using the set of data for the female subjects revealed that color was a significant factor (F(5, 55) = 3.23, p = 0.012). The same ANOVA (repeated measures) conducted using the set of data for the male subjects revealed that color was not a significant factor (F(5, 55) = 2.011, p = 0.091).
Since the ANOVA resulted in significance, the Scheffé and Tukey post-hoc analyses were used to identify which pairs of means contributed to the significant F value. As can be seen in Table 4, the differences between these pairwise comparisons and the corrected p-values show that the effect is been driven by the differences between black and light green, t(11) = 4.001, pTukey = 0.019, pScheffé = 0.050 and between dark green and light green, t(11) = 4.428, pTukey = 0.010, pScheffé = 0.028.

4. Discussion

4.1. Discussion of General Results

The aim of this research was to investigate the effect of color on the perception of loudness in the case of household appliances. As presented in the introduction, the noise created by household appliances [59,60] is not the only factor that affects their perceived loudness, and additionally, a number of studies have shown that the modulation of the auditory cues elicited by our interaction with different products can dramatically change the way they are perceived [4]. However, the results of this study show that the loudness of the product investigated, while positively affected by sound levels, is not appreciably affected by its color. The ANOVA analysis of the data revealed a p-value of 0.148, thus indicating no statistical significance.
This shows that the findings of some previous studies relating the color of vehicles to loudness, e.g., [25,28,29], may not translate to the context of household appliances. The same result was found in a similar study that failed to relate the color of an acoustic hall to its perceived loudness [30]. Additionally, in a study by Parizet and Koehl [26], no influence of train color on loudness evaluation could be found.
Three different approaches to interpreting the difference in the evaluation of loudness found in the literature were presented in the introduction: the associations of colors with specific object characteristics, the context of the measurements, and the association with the visual features of the colors. Regarding the first approach, unlike other studies in which the color was associated with the object characteristics (e.g., bright red with premium sports cars [28]), in the case of this study, there is no obvious corresponding correlation. Additionally, the size of the household appliance was the same for each color variation (e.g., sound associated with pictures of big trucks was judged as being louder [36]). Therefore, it can be assumed that this did not affect the outcome of this study. However, it is possible that this factor could possibly have an effect on the case of other household appliances. We hope that our research will serve as a base for future studies on this matter.
Concerning the effect of the context of measurements, this research used the method of magnitude estimation, similar to other studies in which the influence of color was observed [25,28,29]. Additionally, the participants were selected to be unfamiliar with such experiments. As stated in a similar study: ‘Some subjects were very used to sound experiments. Such people may have paid their whole attention to the sound, without taking images into account’ [26]. Additionally, as mentioned in the methodology, the participants were asked to focus on the screen where the visual stimuli were presented. Therefore, it can be assumed that this factor probably also did not have an effect on the outcome of this study.
Finally, regarding the association with the visual features of the colors, as presented in the introduction, there is evidence that the red/loud combination can raise physiological arousal and induce the perception of excitement [61]. Such a feeling of excitement may contribute to an overestimation of loudness. Colors such as red or pink seem to cause an increase in loudness, while grey or pale green were observed to decrease loudness [32]. A gender effect was found in the results, which will be further discussed in the next section (Section 4.2).

4.2. Discussion of Results per Gender

The secondary aim of this research was to investigate if there are gender-based differences in the effect of color on the perception of loudness in the case of household appliances. The results of this study show that there was a significant interaction between color and gender. The ANOVA analysis of the data revealed a p-value of 0.009, thus indicating statistical significance. Additionally, the post-hoc analysis revealed that the pairs of the means that contributed to the significant F value were between black and light green and between dark green and light green.
As presented in the previous section, from the three different approaches for interpreting the difference in the evaluation of loudness found in the literature, only the association with the visual features of the colors played a probable role in this result. As mentioned before, the red/loud combination can raise physiological arousal and induce the perception of excitement [61], and colors such as red or pink seem to cause an increase in loudness, while grey or pale green were observed to decrease loudness [32]. As presented in the introduction, several studies have associated the visual features of colors such as luminance, hue, and saturation to loudness [24,31,34,37]. Regarding this research, it is possible that the differences found between couples (black and light green and between dark green and light green) are justified by the differences between them in those visual features.
It was mentioned in the introduction that female subjects are more strongly influenced in their loudness judgments by simultaneously presented color patches [31] and that there are gender-based differences in the perception of colors [39,40,41] and color preference [42]. In general, sex differences have been found in the auditory system [62] in various regions such primary auditory cortex (PAC) [63] and in the peripheral auditory system as well as in higher-level cognitive processing [64]. Females, as a group, have greater hearing sensitivity, greater susceptibility to noise exposure at high frequencies, shorter latencies in their auditory brain-stem responses, more spontaneous otoacoustic emissions, and stronger click-evoked otoacoustic emissions than males as a group. Males are better at sound localization, detecting binaural beats, and detecting signals in complex masking tasks than females [62]. This sexual dichotomy seems consistent with the concept of evolutionary advantages in a hunter–gatherer society [65].
Perhaps more relevant to this research, in a study by Ruytjens et al. [63], while listening to an insignificant stimulus such as noise, males deactivated the prefrontal attention areas as compared to silence. Females, on the other hand, had no deactivation of the attention areas and had higher activation in the primary auditory cortex. Previously, a sex difference in the PAC was demonstrated while lip reading [66,67]. These studies showed only female activation in the PAC during lip reading because they associate the absence of speech sound with visual lip movements. Males, on the other hand, did not display activation in the PAC and focus on the present visual lip image itself. The current study shows that even simple sounds induce different activation patterns, especially in the PAC. Apparently, male and female brains handle an insignificant stimulus such as noise differently, and we speculate that this is due to the different engagement of the auditory–prefrontal attention network. In humans, the prefrontal cortex is engaged in diverse cognitive processes, including cognitive control, working memory, and attention [68].
Perhaps these differences in the perception of audio–visual stimuli have also played a role in the results of this research. Further investigations are definitely needed, using larger listener panels, before concluding that the color of the sound source can influence the loudness of the household appliance. However, since this study showed that there are gender-based differences in the effect of color on the perception of loudness in the case of household appliances, this could be useful for product sound design since, in general, the impact of color on marketing is important [69].

4.3. Limitations

There are several limitations to our research. It is likely that our experimental setup focused attention on the sound, amplifying the influence of sound stimuli over visual stimuli. In realistic surroundings, people may be less attentive to ambient noises, especially at lower sound levels. For example, members necessarily turn out to be fast aware of the sound in this sort of study. As presented in the introduction, regarding the importance of the context of the measurements [33], for methods that require subjects to concentrate on the auditory stimulus, no influence of color on either the absolute threshold or loudness perception measured via adjustment could be found. Thus, any input from the visual system, such as the color information, might be reduced in similar approaches in its importance in contrast to the acoustic stimulus. The effect of focus was observed in a similar study [45]: ‘The evidence on sound source visibility was also contradictory: the results depended on whether individuals were instructed to focus on the visual aspects of the landscape or on the sound’.
Although 3D technology is increasingly being used in research on audio–visual perception [70,71], the visual content was presented on a 2D display. A more immersive arrangement might have improved the experiment’s ecological validity. Static 2D images, on the other hand, may not necessarily be less reliable than dynamic virtual models. In a meta-analysis study [72], it was suggested that both types of simulation generate statistically equivalent results and that a choice of simulation media should be based on efficiency rather than concerns about validity. However, it can be stated that the more realistic the situation, the larger the possible loudness reduction induced by visual images for the same acoustic stimuli [27].
Finally, the absolute magnitude estimation shows at least some of the contextual effects in the judgment of loudness that are shown by other methods, such as category rating and ratio magnitude estimation [73]. For example, ratio magnitude estimation liekly enhances sequential (contextual) effects; that is, the way that stimuli and responses on trial n   affect responses on trial n + 1 (for a more thorough discussion of the sequential effects, see [7]). However, although they are useful for studying decisional processes, other methods, such as ratio magnitude estimation, are probably not methods of choice when the goal is to measure loudness in ways that minimize such sequential effects.

5. Conclusions

The present study investigated: (i) the influence of color on the loudness perception of household appliances, in particular in the case of coffee makers, and (ii) gender differences and individual differences in the influence of color on the loudness perception of household appliances.
Regarding the first aim of this research, the main results and conclusions are:
(1)
The results of this study show that the loudness of the household appliance investigated, while positively affected by sound levels, is not appreciably affected by its color. The ANOVA analysis of the data revealed a p-value of 0.148, thus indicating no statistical significance.
(2)
These results show that the findings of some previous studies relating the color of vehicles to loudness may not translate to the context of household appliances.
(3)
Three different approaches to interpreting possible differences in the evaluation of loudness were discussed: associations of colors with specific object characteristics, the context of the measurements, and the association with the visual features of the colors. A possible impact on this study may have been the latter factor; however, without causing a statistical significance in the total results.
Regarding the second aim of this research, the main results, conclusions, and implications are:
(1)
The results of this study show that there was a significant interaction between color and gender. The ANOVA (repeated measures) conducted revealed that color was a significant factor (p = 0.012) for female subjects.
(2)
The post-hoc analysis revealed that the pairs of means that contributed to the significant F value were between black and light green and between dark green and light green.
(3)
Similar studies on perceived loudness should take into account possible gender-based differences and effects.
(4)
Since this study showed that there are gender-based differences in the effect of color on the perception of loudness in the case of household appliances, this could possibly be utilized for product sound design and product marketing where the appropriate use of color has been found to be effective.

Author Contributions

Conceptualization, N.M.P.; methodology, N.M.P.; software, N.M.P., A.Z., K.L.; validation, N.M.P. and G.E.S.; formal analysis, N.M.P.; investigation, N.M.P., A.Z. and K.L.; resources, N.M.P., A.Z.; data curation, N.M.P., A.Z.; writing—original draft preparation, N.M.P.; writing—review and editing, G.E.S.; visualization, K.L.; supervision, N.M.P. and G.E.S.; project administration, N.M.P. All authors have read and agreed to the published version of the manuscript.

Funding

This research received no external funding.

Data Availability Statement

The data presented in this study are available on request from the corresponding author.

Acknowledgments

We would like to thank everyone that participated in the listening tests.

Conflicts of Interest

The authors declare no conflict of interest.

References

  1. ISO 16832:2006; Acoustics—Loudness Scaling by Means of Categories. ISO: Geneva, Switzerland, 2006.
  2. Scharf, B.; Carterette, E.; Friedman, M. Handbook of Perception; Academic Press: New York, NY, USA, 1978. [Google Scholar]
  3. Schomer, P.D.; Suzuki, Y.; Saito, F. Evaluation of loudness-level weightings for assessing the annoyance of environmental noise. J. Acoust. Soc. Am. 2001, 110, 2390–2397. [Google Scholar] [CrossRef]
  4. Spence, C.; Zampini, M. Auditory contributions to multisensory product perception. Acta Acust. United Acust. 2006, 92, 1009–1025. [Google Scholar]
  5. Gonzalez, A.; Ferrer, M.; De Diego, M.; Pinero, G.; Garcia-Bonito, J. Sound quality of low-frequency and car engine noises after active noise control. J. Sound Vib. 2003, 265, 663–679. [Google Scholar] [CrossRef]
  6. Li, H.; Lau, S.-K. A review of audio-visual interaction on soundscape assessment in urban built environments. Appl. Acoust. 2020, 166, 107372. [Google Scholar] [CrossRef]
  7. Florentine, M. Loudness. In Loudness; Springer: Berlin/Heidelberg, Germany, 2011; pp. 1–15. [Google Scholar]
  8. Blauert, J.; Jekosch, U. Sound-quality evaluation—A multi-layered problem. Acta Acust. United Acust. 1997, 83, 747–753. [Google Scholar]
  9. Asutay, E.; Västfjäll, D. Perception of loudness is influenced by emotion. PLoS ONE 2012, 7, e38660. [Google Scholar] [CrossRef] [Green Version]
  10. Siegel, E.H.; Stefanucci, J.K. A little bit louder now: Negative affect increases perceived loudness. Emotion 2011, 11, 1006. [Google Scholar] [CrossRef] [Green Version]
  11. Jousmäki, V.; Hari, R. Parchment-skin illusion: Sound-biased touch. Curr. Biol. 1998, 8, R190–R191. [Google Scholar] [CrossRef] [Green Version]
  12. Schürmann, M.; Caetano, G.; Jousmäki, V.; Hari, R. Hands help hearing: Facilitatory audiotactile interaction at low sound-intensity levels. J. Acoust. Soc. Am. 2004, 115, 830–832. [Google Scholar] [CrossRef] [Green Version]
  13. Suzuki, Y.; Abe, K.; Ozawa, K.; Sone, T. Factors for perceiving sound environments and the effects of visual and verbal information on these factors. Contrib. Psychol. Acoust. (A. Schick et al. Eds) BIS Oldenbg. 2000, 209–232. [Google Scholar]
  14. Böhm, M.; Patsouras, C.; Fastl, H. Beeinflussung des Lautheitsurteils durch schallfremde, stehende Bilder. In Proceedings of the Tagungsband Fortschritte der Akustik-DAGA# 2003, Aachen, Germany, 18–20 March 2003. [Google Scholar]
  15. Odgaard, E.C.; Arieh, Y.; Marks, L.E. Brighter noise: Sensory enhancement of perceived loudness by concurrent visual stimulation. Cogn. Affect. Behav. Neurosci. 2004, 4, 127–132. [Google Scholar] [CrossRef] [PubMed] [Green Version]
  16. Maffei, L.; Masullo, M.; Aletta, F.; Di Gabriele, M. The influence of visual characteristics of barriers on railway noise perception. Sci. Total Environ. 2013, 445, 41–47. [Google Scholar] [CrossRef] [PubMed]
  17. Aylor, D.E.; Marks, L.E. Perception of noise transmitted through barriers. J. Acoust. Soc. Am. 1976, 59, 397–400. [Google Scholar] [CrossRef]
  18. Tokunaga, Y.; Terashima, T.; Ishikawa, A. Influence of visual information on subjective evaluation of road traffic noise. In Proceedings of the INTER-NOISE and NOISE-CON Congress and Conference Proceedings, Fort Lauderdale, FL, USA, 8–10 September 2014; pp. 3607–3611. [Google Scholar]
  19. Aletta, F.; Masullo, M.; Maffei, L.; Kang, J. The effect of vision on the perception of the noise produced by a chiller in a common living environment. Noise Control Eng. J. 2016, 64, 363–378. [Google Scholar] [CrossRef]
  20. Tokunaga, Y.; Okuie, D.; Terashima, T. Influence of visual information on sound evaluation in auditorium. In Proceedings of the Meetings on Acoustics ICA2013, Montreal, QC, Canada, 2–7 June 2013; p. 040104. [Google Scholar]
  21. Yoshida, J.; Igata, T. Dependence of loudness evaluation by drivers on vehicle styling. J. Acoust. Soc. Am. 2012, 132, 3866–3873. [Google Scholar] [CrossRef]
  22. Yoshida, J.; Völk, F.; Fastl, H.; Rigoll, G. Influences of vehicle exterior images on sound quality ratings: German vs. Japanese drivers. In Proceedings of the 43rd International Congress on Noise Control Engineering, INTERNOISE 2014, Melbourne, Australia, 16–19 November 2014. [Google Scholar]
  23. Namba, S.; Kuwano, S.; Kinoshita, A.; Hayakawa, Y. Psychological evaluation of noise in passenger cars—The effect of visual monitoring and the measurement of habituation. J. Sound Vib. 1997, 205, 427–433. [Google Scholar] [CrossRef]
  24. Kim, K.H.; Gejima, A.; Iwamiya, S.-i.; Takada, M. The effect of chroma of color on perceived loudness caused by noise. In Proceedings of the 40th International Congress and Exposition on Noise Control Engineering 2011, INTER-NOISE 2011, Osaka, Japan, 4–7 September 2011; pp. 3151–3156. [Google Scholar]
  25. Patsouras, C.; Filippou, T.; Fastl, H. Influences of color on the loudness judgement. In Proceedings of the of 3rd EEA European Congress on Acoustics Forum Acusticum, Sevilla, Spain, 16–19 September 2002. [Google Scholar]
  26. Parizet, E.; Koehl, V. Influence of train colour on loudness judgments. Acta Acust. United Acust. 2011, 97, 347–349. [Google Scholar] [CrossRef] [Green Version]
  27. Fastl, H. Audio-visual interactions in loudness evaluation. In Proceedings of the 18th International Congress on Acoustics ICA 2004, Kyoto, Japan, 4–9 April 2004. [Google Scholar]
  28. Menzel, D.; Fastl, H.; Graf, R.; Hellbrück, J. Influence of vehicle color on loudness judgments. J. Acoust. Soc. Am. 2008, 123, 2477–2479. [Google Scholar] [CrossRef]
  29. Rader, T.; Morinaga, M.; Matsiu, T.; Fastl, H.; Kuwano, S.; Namba, S. Crosscultural effects in audio-visual interactions. In Proceedings of the Meeting of the Technical Committee on Noise and Vibration of the Acoustical Society of Japan, Tokyo, Japan, 18 June 2004. [Google Scholar]
  30. Chen, Y.; Cabrera, D. The effect of concert hall color on preference and auditory perception. Appl. Acoust. 2021, 171, 107544. [Google Scholar] [CrossRef]
  31. Menzel, D.; Dauenhauer, T.; Fastl, H. Crying Colours and their influence on loudness judgments. In Proceedings of the International Conference on Acoustics (NAG/Tagungsband Fortschritte der Akustik-DAGA 2009), Rotterdam, The Netherlands, 23–26 March 2009; pp. 1528–1531. [Google Scholar]
  32. Menzel, D.; Haufe, N.; Hugo Fastl, F. Colour-influences on loudness judgements. In Proceedings of the 20th International Congress on Acoustics, ICA (2010), Sydney, Australia, 23–27 August 2010. [Google Scholar]
  33. Menzel, D.; Faccinelli, E.; Fastl, H. Are absolute thresholds and loudness judgements influenced by different colours? In Proceedings of the Acoustics 08, Paris, France, 30 June–4 July 2008; pp. 1203–1208. [Google Scholar]
  34. Anikin, A.; Johansson, N. Implicit associations between individual properties of color and sound. Atten. Percept. Psychophys. 2019, 81, 764–777. [Google Scholar] [CrossRef]
  35. Kitapci, K.; Akbay, S. Audio-Visual Interactions and the Influence of Colour on Noise Annoyance Evaluations. Acoust. Aust. 2021, 49, 293–304. [Google Scholar] [CrossRef]
  36. Höger, R.; Greifenstein, P. Zum Einfluß der Größe von Lastkraftwagen auf deren wahrgenommene Lautheit. Z. Lärmbekämpfung 1988, 35, 128–131. [Google Scholar]
  37. Caivano, J.L. Color and sound: Physical and psychophysical relations. Color Res. Appl. 1994, 19, 126–133. [Google Scholar]
  38. Berthomieu, G.; Koehl, V.; Paquier, M. Does loudness relate to the strength of the sound produced by the source or received by the ears? A review of how focus affects loudness. Front. Psychol. 2021, 12, 13. [Google Scholar] [CrossRef]
  39. Abramov, I.; Gordon, J.; Feldman, O.; Chavarga, A. Sex and vision II: Color appearance of monochromatic lights. Biol. Sex Differ. 2012, 3, 1–15. [Google Scholar] [CrossRef]
  40. Rodríguez-Carmona, M.; Sharpe, L.T.; Harlow, J.A.; Barbur, J.L. Sex-related differences in chromatic sensitivity. Vis. Neurosci. 2008, 25, 433–440. [Google Scholar] [CrossRef]
  41. Vanston, J.E.; Strother, L. Sex differences in the human visual system. J. Neurosci. Res. 2017, 95, 617–625. [Google Scholar] [CrossRef]
  42. Ellis, L.; Ficek, C. Color preferences according to gender and sexual orientation. Personal. Individ. Differ. 2001, 31, 1375–1379. [Google Scholar] [CrossRef]
  43. Pardo, P.J.; Pérez, A.; Suero, M. An example of sex-linked color vision differences. Color Res. Appl. 2007, 32, 433–439. [Google Scholar] [CrossRef]
  44. Papadakis, N.M.; Aroni, I.; Stavroulakis, G.E. Effectiveness of MP3 Coding Depends on the Music Genre: Evaluation Using Semantic Differential Scales. Acoustics 2022, 4, 704–719. [Google Scholar] [CrossRef]
  45. Haapakangas, A.; Hongisto, V.; Oliva, D. Audio-visual interaction in perception of industrial plants—Effects of sound level and the degree of visual masking by vegetation. Appl. Acoust. 2020, 160, 107121. [Google Scholar] [CrossRef]
  46. Blender—A 3D Modelling and Rendering Package. Stichting Blender Foundation, Amsterdam. 2021. Available online: http://www.blender.org (accessed on 6 July 2022).
  47. Computerhope. Available online: https://www.computerhope.com/cgi-bin/htmlcolor.pl?c=DBF9DB (accessed on 29 April 2022).
  48. Papadakis, N.M.; Stavroulakis, G.E. Review of Acoustic Sources Alternatives to a Dodecahedron Speaker. Appl. Sci. 2019, 9, 3705. [Google Scholar] [CrossRef] [Green Version]
  49. Antoniadou, S.; Papadakis, N.M.; Stavroulakis, G.E. Measuring Acoustic Parameters with ESS and MLS: Effect of Artificially Varying Background Noises. In Proceedings of the Euronoise 2018, Crete, Greece, 27–31 May 2018. [Google Scholar]
  50. Papadakis, N.M.; Stavroulakis, G.E. Handclap for Acoustic Measurements: Optimal Application and Limitations. Acoustics 2020, 2, 224–245. [Google Scholar] [CrossRef]
  51. Papadakis, N.M.; Stavroulakis, G.E. Low Cost Omnidirectional Sound Source Utilizing a Common Directional Loudspeaker for Impulse Response Measurements. Appl. Sci. 2018, 8, 1703. [Google Scholar] [CrossRef] [Green Version]
  52. Stevens, S.S. The direct estimation of sensory magnitudes: Loudness. Am. J. Psychol. 1956, 69, 1–25. [Google Scholar] [CrossRef] [PubMed]
  53. Stevens, S.S.; Guirao, M. Subjective scaling of length and area and the matching of length to loudness and brightness. J. Exp. Psychol. 1963, 66, 177. [Google Scholar] [CrossRef] [PubMed]
  54. Hellman, R.P. Measurement by Magnitude Scaling: Implications for Intensity Coding. Ratio Scaling Psychol. Magnit. Honor Mem. SS Stevens 1991, 215. [Google Scholar]
  55. Papadakis, N.M.; Aletta, F.; Kang, J.; Oberman, T.; Mitchell, A.; Stavroulakis, G.E. Translation and Cross-Cultural Adaptation Methodology for Soundscape Attributes—A study with Independent Translation Groups from English to Greek. Appl. Acoust. 2022, 200, 109031. [Google Scholar] [CrossRef]
  56. Armstrong, L.; Marks, L.E. Haptic perception of linear extent. Percept. Psychophys. 1999, 61, 1211–1226. [Google Scholar] [CrossRef]
  57. Marks, L.E.; Florentine, M. Measurement of loudness, part I: Methods, problems, and pitfalls. In Loudness; Springer: Berlin/Heidelberg, Germany, 2011; pp. 17–56. [Google Scholar]
  58. Parzen, E. On estimation of a probability density function and mode. Ann. Math. Stat. 1962, 33, 1065–1076. [Google Scholar] [CrossRef]
  59. Jackson, G.; Leventhall, H. Household appliance noise. Appl. Acoust. 1975, 8, 101–118. [Google Scholar] [CrossRef]
  60. Maluski, S.; Churchill, C.; Cox, T.J. Sound quality testing and labelling of domestic appliances in the UK. In Proceedings of the Inter-Noise and Noise-Con Congress and Conference Proceedings, Prague, Czech Republic, 22–25 August 2004; pp. 2470–2477. [Google Scholar]
  61. Wolfson, S.; Case, G. The effects of sound and colour on responses to a computer game. Interact. Comput. 2000, 13, 183–192. [Google Scholar] [CrossRef]
  62. McFadden, D. Sex differences in the auditory system. Dev. Neuropsychol. 1998, 14, 261–298. [Google Scholar] [CrossRef]
  63. Ruytjens, L.; Georgiadis, J.R.; Holstege, G.; Wit, H.P.; Albers, F.W.; Willemsen, A. Functional sex differences in human primary auditory cortex. Eur. J. Nucl. Med. Mol. Imaging 2007, 34, 2073–2081. [Google Scholar] [CrossRef] [PubMed] [Green Version]
  64. Krizman, J.; Skoe, E.; Kraus, N. Sex differences in auditory subcortical function. Clin. Neurophysiol. 2012, 123, 590–597. [Google Scholar] [CrossRef] [PubMed] [Green Version]
  65. Kimura, D. Sex and Cognition; MIT Press: Cambridge, MA, USA, 2000. [Google Scholar]
  66. Ruytjens, L.; Albers, F.; Van Dijk, P.; Wit, H.; Willemsen, A. Activation in primary auditory cortex during silent lipreading is determined by sex. Audiol. Neurotol. 2007, 12, 371–377. [Google Scholar] [CrossRef]
  67. Ruytjens, L.; Albers, F.; Van Dijk, P.; Wit, H.; Willemsen, A. Neural responses to silent lipreading in normal hearing male and female subjects. Eur. J. Neurosci. 2006, 24, 1835–1844. [Google Scholar] [CrossRef]
  68. Miller, E.K.; Cohen, J.D. An integrative theory of prefrontal cortex function. Annu. Rev. Neurosci. 2001, 24, 167–202. [Google Scholar] [CrossRef] [Green Version]
  69. Singh, S. Impact of color on marketing. Manag. Decis. 2006, 44, 783–789. [Google Scholar] [CrossRef]
  70. Sanchez, G.M.E.; Van Renterghem, T.; Sun, K.; De Coensel, B.; Botteldooren, D. Using Virtual Reality for assessing the role of noise in the audio-visual design of an urban public space. Landsc. Urban Plan. 2017, 167, 98–107. [Google Scholar] [CrossRef] [Green Version]
  71. Ruotolo, F.; Maffei, L.; Di Gabriele, M.; Iachini, T.; Masullo, M.; Ruggiero, G.; Senese, V.P. Immersive virtual reality and environmental noise assessment: An innovative audio–visual approach. Environ. Impact Assess. Rev. 2013, 41, 10–20. [Google Scholar] [CrossRef]
  72. Stamps, A.E., III. Use of static and dynamic media to simulate environments: A meta-analysis. Percept. Mot. Ski. 2010, 111, 355–364. [Google Scholar] [CrossRef] [PubMed]
  73. Ward, L.M. Remembrance of sounds past: Memory and psychophysical scaling. J. Exp. Psychol. Hum. Percept. Perform. 1987, 13, 216. [Google Scholar] [CrossRef] [PubMed]
Figure 2. Relative loudness ratings (ref: black color 86dBA results), grouped by level and presented per color of the visual stimuli. Boxplots (median: horizontal black line, lower limit: first quartile, upper limit: third quartile, notch inf.: median − 1.57 × IQR/sqrt(n), notch sup: median + 1.57 × IQR/sqrt(n)), violin plots (upper limit: 99th percentile, lower limit: 1st percentile), mean: cross, upper, and lower limits: standard deviation.
Designs 06 00101 g002
Figure 3. Relative loudness ratings (ref: black color 86dBA results), grouped by level and presented per gender and per color of the visual stimuli. Boxplots (median: horizontal black line, lower limit: first quartile, upper limit: third quartile, notch inf.: median − 1.57 × IQR/sqrt(n), notch sup: median + 1.57 × IQR/sqrt(n)), violin plots (upper limit: 99th percentile, lower limit: 1st percentile), mean: cross, upper, and lower limits: standard deviation.
Designs 06 00101 g003
Table 1. Colors that were used for the coffee maker 3D model.
ColorRGBHEXRGBA (Blender)
Black(0, 0, 0)000000(0, 0, 0, 1)
Red(179, 0, 0)B30000(0.451, 0, 0, 1)
Dark Green(0, 100, 0)006400(0, 0.127, 0, 1)
Light Blue(92, 179, 255)5CB3FF(0.107, 0.451, 1, 1)
Light Green(219, 249, 219)DBF9DB(0.708, 0.947, 0.708, 1)
White(255, 255, 255)FFFFFF(1, 1, 1, 1)
Table 2. ANOVA table (Within Subjects Effects).
Sum of SquaresdfMean SquareFp
Color0.060550.012111.6690.148
Residual0.83431150.00725
Level37.6833312.56109218.668<0.001
Residual3.9636690.05744
Color * dB0.0663150.004420.8770.591
Residual1.73813450.00504
Table 3. ANOVA table (Within Subjects Effects).
Sum of SquaresdfMean SquareFp
Color0.060550.012111.8310.113
Color * Gender0.106950.021393.2350.009
Residual0.72731100.00661
Level37.6833312.56109214.051<0.001
Level * Gender0.090630.030180.5140.674
Residual3.8731660.05868
Color * dB0.0663150.004420.8810.586
Color * dB * Gender0.0834150.005561.1090.347
Residual1.65473300.00501
Table 4. Post Hoc Comparisons—Color.
ComparisonMean DifferenceSEdFtpTukeypScheffé
ColorColor
redblack−0.028400.0142511.0−1.99250.4030.576
dgreen−0.043130.0162111.0−2.66040.1610.292
blue−0.013080.0209511.0−0.62420.9870.994
lgreen0.011520.0127211.00.90560.9370.971
white−0.014300.0140711.0−1.01650.9030.953
blackdgreen−0.014730.0047811.0−3.07880.0850.175
blue0.015330.0211211.00.72580.9740.989
lgreen0.039920.0099811.04.00100.0190.050
white0.014100.0143811.00.98070.9150.959
dgreenblue0.030060.0227611.01.32030.7690.873
lgreen0.054650.0123411.04.42750.0100.028
white0.028830.0162011.01.77910.5140.679
bluelgreen0.024600.0156611.01.57070.6310.775
white−0.001230.0127811.0−0.09591.0001.000
lgreenwhite−0.025820.0122011.0−2.11700.3450.516
Publisher’s Note: MDPI stays neutral with regard to jurisdictional claims in published maps and institutional affiliations.

