Article

Two-Scale Topology Optimization with Isotropic and Orthotropic Microstructures

1
Department of Mechanical and Industrial Engineering, University of Illinois at Chicago, Chicago, IL 60607, USA
2
Department of Mechanical Engineering, Santa Clara University, Santa Clara, CA 95053, USA
*
Author to whom correspondence should be addressed.
These authors contributed equally to this work.
Designs 2022, 6(5), 73; https://doi.org/10.3390/designs6050073
Submission received: 27 July 2022 / Revised: 22 August 2022 / Accepted: 24 August 2022 / Published: 27 August 2022

Abstract

:
Advances in additive manufacturing enable the fabrication of complex structures with intricate geometric details, which bring opportunities for high-resolution structure design and transform the potential of functional product development. However, the increasingly delicate designs bring computational challenges for structural optimization paradigms, such as topology optimization (TO), since the design dimensionality increases with the resolutions. Two-scale TO paves an avenue for high-resolution structural design to alleviate this challenge. This paper investigates the efficacy of introducing function-based microstructures into the two-scale TO. Both isotropic and orthotropic microstructure are considered to develop this TO framework. Implicit functions are exploited to model the two classes of cellular materials, including triply periodic minimal surfaces (TPMS) and Fourier series-based functions (FSF). The elasticity tensor of microstructures is computed with numerical homogenization. Then, a two-scale TO paradigm is formulated, and a gradient-based algorithm is proposed to simultaneously optimize the micro-scale structures and macro-scale material properties. Several engineering benchmark cases are tested with the proposed method, and experimental results reveal that using proposed microstructures leads to, at most, a 36 % decrease in the compliance of optimal structures. The proposed framework provides achievable directionality and broader design flexibility for high-resolution product development.

1. Introduction

Topology optimization (TO) is a well-established computational method for the structure design problem. Since TO can find the optimal material distributions within given boundary conditions [1,2], it has been widely used in different applications for designing complex and lightweight structures [3,4,5]. In recent decades, breakthroughs in additive manufacturing (AM) technologies enable the fabrication of intricate and high-resolution designs from TO [6]. For example, ref. [7] explored the smooth self-supporting topologies in additive manufacturing using the level-set method. However, the fine-detailed structure design will increase the number of discretized elements in TO, which is a computational challenge. One possible solution to address this issue is to optimize the design domain with multi-scale structures [8]. Multi-scale topology optimization consists of two design problems—a macroscopic design and a microscopic design. In the macroscopic problem, the objective is to distribute materials in the macroscale. To achieve desired material properties, the microscopic problem tends to find the optimal architecture in a spatially variant fashion [9]. The two problems in both scales can be carried out sequentially [10] or simultaneously [11]. The micro-scale cellular materials are commonly used in the multi-scale TO paradigm. The porous architecture makes the structure lightweight and more resistant to crack propagation compared to traditional materials [12,13]. The truss, plate, and shell-based cellular materials are widely used among cellular materials. However, these microstructures suffer from stress localization at the junctions of beams or plates, leading to early failure and poor recoverability [14,15,16].
Smooth architectures such as those based on triply-periodic minimal surfaces (TPMS) [17] address the prior issue by exploiting a locally area-minimized geometry [18]. These microstructures usually have a mean curvature approximately equal to zero everywhere on the surface [19]. TPMS-like microstructures are periodic in three different directions. They have similar mechanical properties in ( x , y , z ) directions in a Cartesian coordinate system, which can be considered isotropic microstructures. Ref. [20] calculated the gyroid structure’s mechanical properties, of all TPMS structures, by analyzing a unit cell lattice and applying the finite element method. However, TMPS-like structures also share common limitations in the fabrication of architectures: the mechanical properties of these structures are highly sensitive to symmetry-breaking imperfections, and defects [9,21].
There has also been increasing interest in orthotropic microstructure design [9,21], with an intuition that orthotropic microstructures allow for manipulating the material orientation to generate structures with superior properties (e.g., stiffer in the direction of maximum stress). Previous works [22,23] have shown that optimal orientations of orthotropic materials tend to align with the principal stress or strain directions in the compliance minimization problem. The use of orthotropic microstructures has two major benefits. First, it will expand the range of available properties for metamaterials (e.g., Poisson’s ratio, Young’s modulus). Second, it will concentrate the stiffness of the microstructure in the desired direction (e.g., maximum principal stress) according to predefined boundary conditions. As well as the advantages of orthotropic microstructures, designing spatially varying microstructures manifesting expected properties is critical to the multi-scale TO. Many works [21,24,25] have tried to optimize the material anisotropy by tuning the microstructural architecture. Ref. [26] developed an orthotropic topology optimization method for lightweight composite structures. Ref. [27] have introduced a topology optimization method that can handle structures made by orthotropic materials. However, the structures designed in these works were either from a simple strut-based design domain (rectangular or cubical cells with beams at the edges) [24] which limits the microstructural and orthotropic tunability or is from a physical process, such as phase-separation [21], which requires considerable computational effort to generate the microstructure with expected properties.
This paper investigates the influence of function-based microstructures with isotropic and orthotropic mechanical properties on a parameterized-based two-scale TO framework. A function-based (FRep) method is introduced for microstructure modeling. FRep-based modeling is simple to implement. Specifically, Fourier series-based function (FSF) [28,29,30] and triply periodic minimal surface-based (TPMS), are exploited in this paper.
Homogenization is the key to approximating the effective mechanical properties of microstructures [31,32,33]. Similar to previous works [34,35], numerical homogenization is utilized to estimate the effective elasticity tensor of the microstructures. Lower computation cost and faster convergence can be enabled by precomputing the material property gamut in a two-scale framework optimization process [36,37,38]. The effective properties of the FSF-based and TPMS-based cellular material are calculated using asymptotic homogenization. Next, the density of microstructures is directly incorporated as the function of microstructures’ design parameters into the topology optimization problem. Thus, the micro-scale structures are presented over the entire density range. To this end, the main contribution of this work are summarized as follows:
Scaling laws of the relative density and elastic tensor of FSF and TPMS microstructures are derived, which approximates the mechanical properties of the microstructures based on their relative densities with high accuracy;
A high-quality connection between adjacent unit cells with different densities is ensured by utilizing a smoothing operator;
Set of benchmark cases in mega-voxel are used for validating the results and demonstrating its versatility to various design problems of practical interest;
Up to 36 % decrease in structural compliance by utilizing orthotropic microstructures instead of isotropic ones is achieved, and up to 50 % increase in structure stiffness compared to SIMP and other multi-scale TO methods.
The remainder of this paper is organized as follows. Section 2 presents the overview of developing parameterized microstructures and merging them with a two-scale TO framework. The two-scale TO problem formulation and the optimization algorithm is introduced in Section 3. Section 4 discusses the experimental results of several benchmark cases study for the proposed framework. Finally, Section 5 concludes the paper and discusses the limitations and future work.

2. Overview

The overview of the proposed parameterized microstructure-based two-scale TO problem is illustrated in Figure 1. Our methodology mainly includes three modules. First, different implicit functions are introduced to generate a unique cellular material family. How different volume fractions and mechanical properties can be developed by changing the level-set parameter of each function are also explained. The second step is to calculate the effective properties of the cellular structure using the asymptotic homogenization approach. After defining the two-scale topology optimization problem, benchmark case studies with both isotropic and orthotropic cellular materials as the microstructure are solved, and the difference between the optimized topologies and the resulting structural performance is investigated.

2.1. Mathematical Representation

The surface layer of cellular materials can be expressed by an implicit function consisting of trigonometric terms and the level-surface value. The general level surface can be represented as:
F : R 3 R { ( x , y , z ) R 3 F ( x , y , z ) t = 0 } ,
where F ( x , y , z ) is an implicit function that dictates the level surface’s shape, t is the level parameter. Changing the level parameter t would create distinct members (with different volumes) of a given family of level surfaces. There is no intersecting or folding in the geometry created by the trigonometric function. This is one of the benefits these surfaces are appealing to be employed as the micro-structures in the TO problem. In this paper, implicit function-based approximations of triply periodic minimal surface (TPMS) [17,39] are used to generate four distinct types of isotropic cellular materials, and Fourier series-based non-periodic functions [29] are used to generate three types of orthotropic cellular materials. Therefore, there are seven cellular material types to investigate the differences between orthotropic cellular materials compared with isotropic cellular materials. These seven different level surface families can be categorized to: (1) isotropic cellular materials, which are the gyroid ( F G ), diamond ( F D ), primitive ( F P ), and I-WP ( F W ) [40]; and (2) orthotropic cellular materials ( F 1 , F 2 , F 3 ). The functions for modeling isotropic materials are taken from [17], while the three Fourier series-based functions are detailed as follows:
F 1 = c o s [ 2 π l ( x + y z ) ] + c o s [ 2 π l ( x + y + z ) ] + c o s [ 2 π l ( x + y z ) ] F 2 = c o s [ 2 π l ( x + y z ) ] + c o s [ 2 π l ( x y + z ) ] + s i n [ 2 π l ( x + y + z ) ] F 3 = s i n [ 2 π l ( x + y 2 z ) ] + s i n [ 2 π 0.5 l ( x y + z ) ] + s i n [ 2 x + y + z ) ] ,
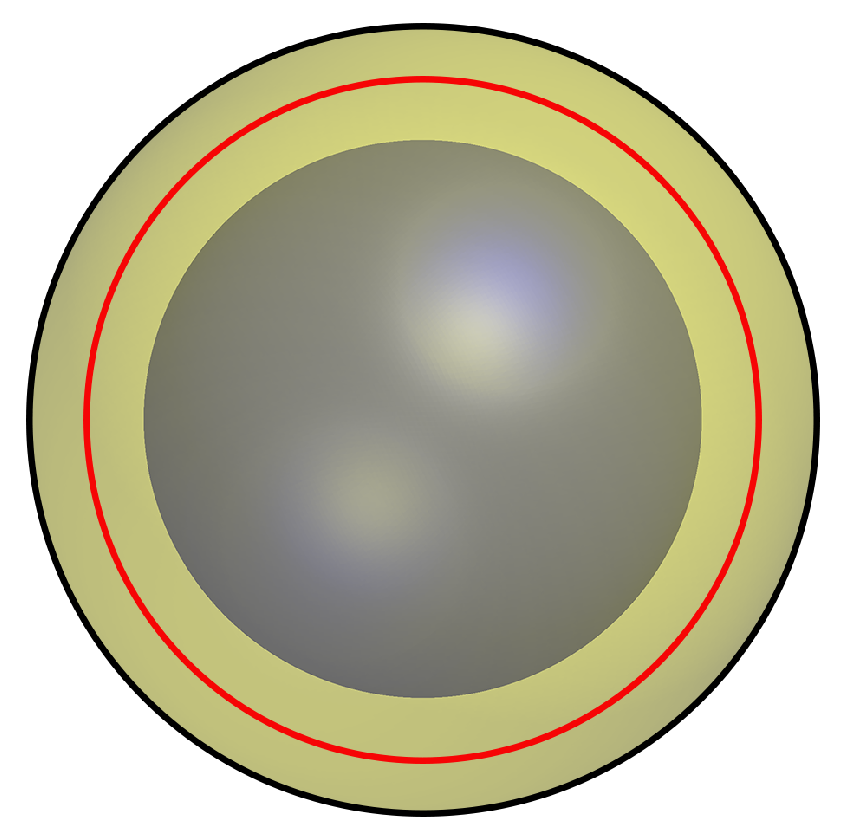
where l is the microstructure dimension [29]. An implicit surface with t = 0 can be used as the base surface by setting t = ± a ; two surfaces are generated on both sides of the base surface with equal offsets, which divide the space into three subspaces (illustrated as in Figure 2). The volume trapped between two offset surfaces is the target structure. It can be seen from Figure 2 that with adjusting parameter t, the offset surface’s distance and the size of the trapped sub-volume (target volume) can be changed. So the structure’s volume fraction (or the relative density) can be controlled by parameter t.
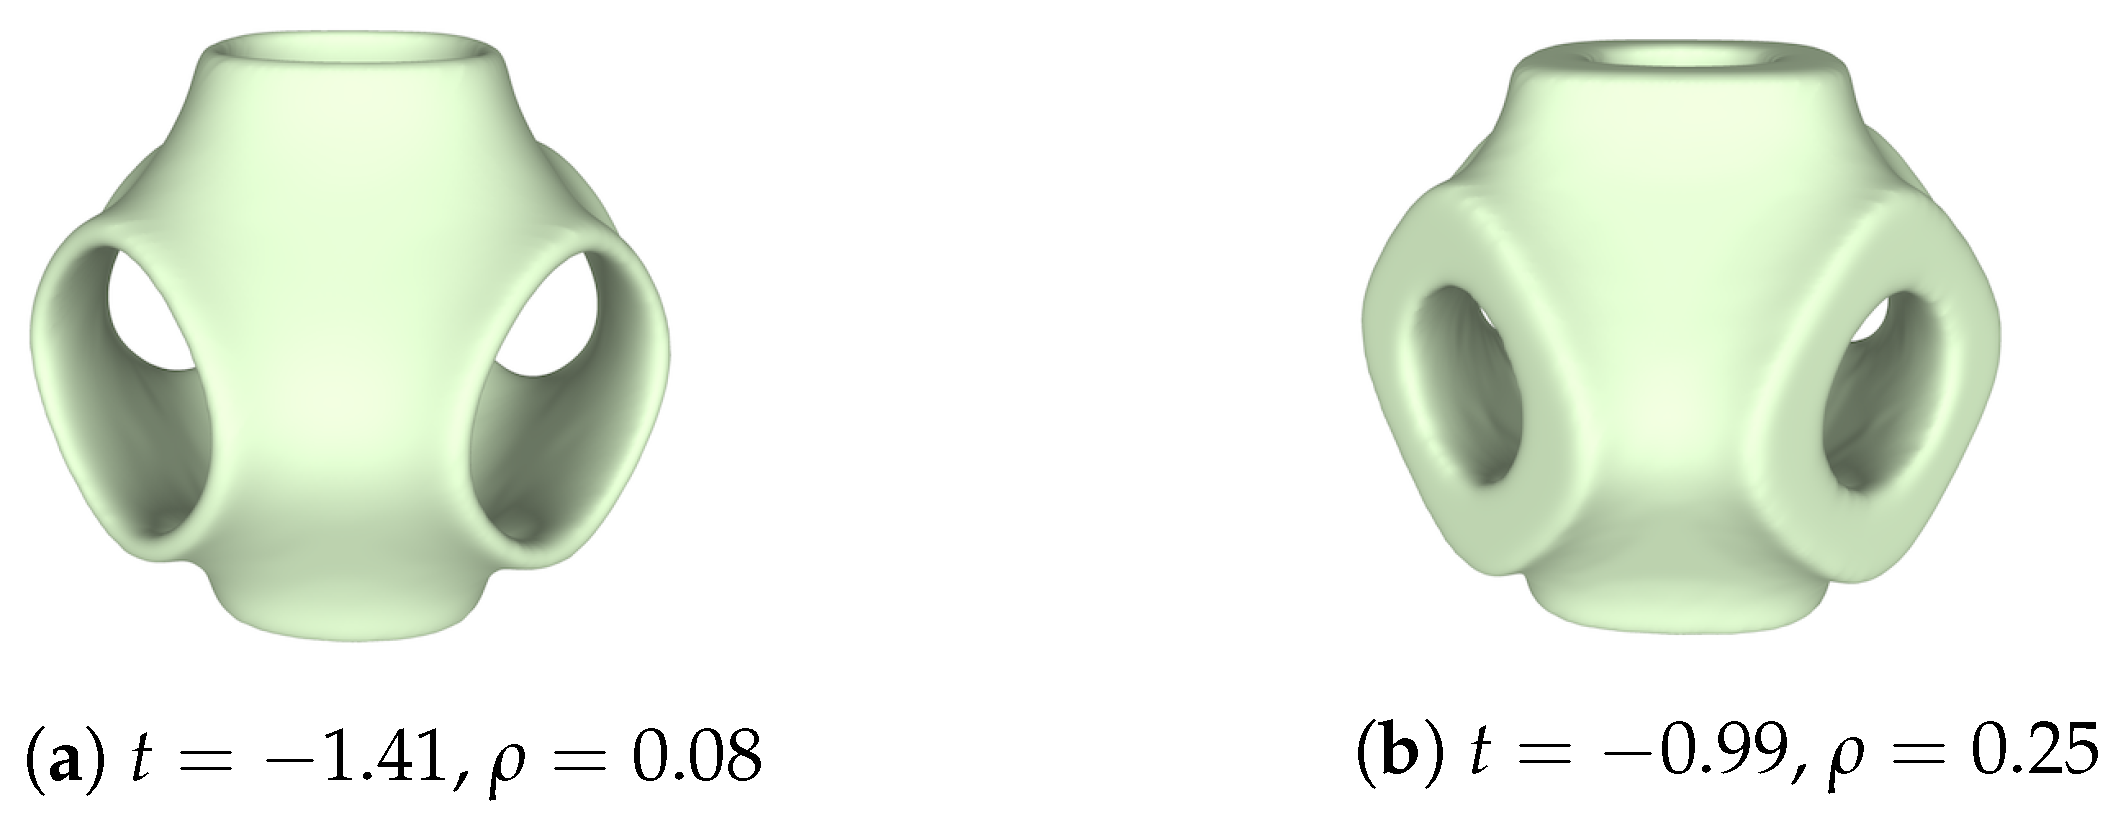
Since the relative density represents the volume fraction of the solid phase, which is essential for exhibiting the structure’s mechanical properties (e.g., the elastic modulus), it is critical to find the relation between the parameter t and relative density. In [39], a fitting method has been utilized to acquire such a relation, i.e., scaling laws of the relative density of G-, D-, P-, and W-based cellular structure. An illustrative example of P-type microstructure is presented in Figure 3. In this work, the same philosophy is applied to establish the scaling laws of the relative density for FSF microstructures. Specifically, by generating different cellular materials with various densities (i.e., volume fraction), a database storing structures’ densities and the corresponding t values is created. Twenty sample points are considered for each one of the families with relative densities equally spaced ρ [ ρ m i n , 1 ] . ρ m i n is the minimum volume fraction of the microstructure, and it is determined such that there be no isolated material in the unit cell. Each one of the microstructure families has its own distinct ρ m i n since they have different geometries. The database is used to establish a mapping between t and the cellular material’s density ρ F S F by fitting a nonlinear regression model solved by the Levenberg–Marquardt algorithm for orthotropic cellular materials. Equation (Section 2.1) reveals the mappings between t and ρ for three FSF cellular materials. In this equation ρ is the volume fraction of the trapped volume between t = [ 0 , T ] surfaces.
ρ F 1 = 0.221 × t + 0.376 , 1.000 t 3.41
ρ F 2 = 0.286 × t + 0.211 , 0.220 t 3.23
ρ F 3 = 0.223 × t + 0.429 , 1.225 t 3.3 .

2.2. Homogenized Model of Microstructure

A numerical homogenization method is utilized to calculate the effective properties of microstructures, such as the elasticity tensor. Keen readers are referred to [41,42] for a detailed explanation of the theory behind homogenization. All the procedure of the homogenization method comes to solving the elasticity Equation (4). In the equation, E i j p q is the stiffness tensor, ν is the virtual displacement field, χ k l is the displacement field which this equation solves for, ε p q 0 ( k l ) is the prescribed macroscopic displacement, and Ω is the microscopic unit cell volume.
Ω E i j p q ε i j ( ν ) ε p q ( χ k l ) d Ω = Ω E i j p q ε i j ( ν ) ε p q 0 ( k l ) d Ω ν Ω
Equation (4) is discretized and solved using finite element analysis (FEA). This procedure is also referred to as the numerical homogenization method. Because of the irregular geometry of the microstructures studied in this paper, it is necessary to conduct the mesh dependency [43] for the FEA performed in the homogenization method.
The mesh dependency study is conducted for all TPMS-based and FSF-based microstructures to ensure that the results from the homogenization study solved by the FEA method are not dependent on the mesh size selected in the FE solver. Two different studies were conducted. In the first study, the volume fraction for the microstructures is set to v f = 0.4 , and it is conducted on all cellular structures type Figure 4a. The second study was conducted on one sample from each family with different volume fractions to show that the homogenization results are reliable for the whole range of volume fractions considered for the microstructures Figure 4b. In Figure 4, N e l m is the number of elements in the mesh, C 1111 is the elasticity tensor element value calculated by the FEA with different mesh sizes, and C 1111 is the elasticity tensor element value calculated by the FEA with the maximum number of 1.8 million elements. It can be seen from Figure 4 that after a particular resolution ( N e l m > 10 5 ), the homogenization results are independent of the mesh size.

2.2.1. Scaling Laws of the Elasticity Tensors

The cellular structure’s elastic tensor depends on its relative density [44], which is known as the “scaling law.” Inspired by the tensor scaling laws of TPMS in [39], the relationship between the elastic tensors and their relative density of the FSF-based cellular materials are modeled by doing non-linear fitting in this work. For a generalization purposes, the cellular materials are categorized into two types: (1) isotropic; and (2) orthotropic.

2.2.2. Isotropic Cellular Materials

Isotropic microstructures like the TPMS-based cellular materials belong to cubic symmetric geometry (identical properties along three axes). Therefore, only C 1111 , C 1122 , C 1212 are needed to compute the elasticity tensor:
C ( ρ ) = C 1111 C 1122 C 1122 0 0 0 C 1122 C 1111 C 1122 0 0 0 C 1122 C 1122 C 1111 0 0 0 0 0 0 C 1212 0 0 0 0 0 0 c 1212 0 0 0 0 0 0 C 1212 .
For TPMS-based isotropic cellular materials, the tensor scaling law is as follows [39]:
C 1111 = C 1111 ( a 1 e a 2 ρ e a 1 )
C 1122 = C 1122 ( a 1 e a 2 ρ e a 1 )
C 1212 = C 1212 ( a 1 e a 2 ρ e a 1 ) ,
where C i j k l are the corresponding elastic constants of the constituent material, ρ e is the element density, a 1 and a 2 are the constant values that the homogenization results can determine.

2.2.3. Orthotropic Cellular Materials

The orthotropic microstructure contains nine independent elements in its elasticity tensor, as shown in Equation (7).
C ( ρ ) = C 1111 C 1122 C 1133 0 0 0 C 1122 C 2222 C 2233 0 0 0 C 1133 C 1122 C 3333 0 0 0 0 0 0 C 2323 0 0 0 0 0 0 c 3131 0 0 0 0 0 0 C 1212 .
It is reported that an exponential function can identify the relationship between constants of the elastic tensors and the relative density well and provides the best combination between accuracy and compactness of the scaling law [39]. Therefore, the following relation is exploited to model the tensor scaling law of orthotropic microstructures in this work:
C i j k l / C i j k l = b 1 i j k l ρ e b 2 i j k l + b 3 i j k l ,
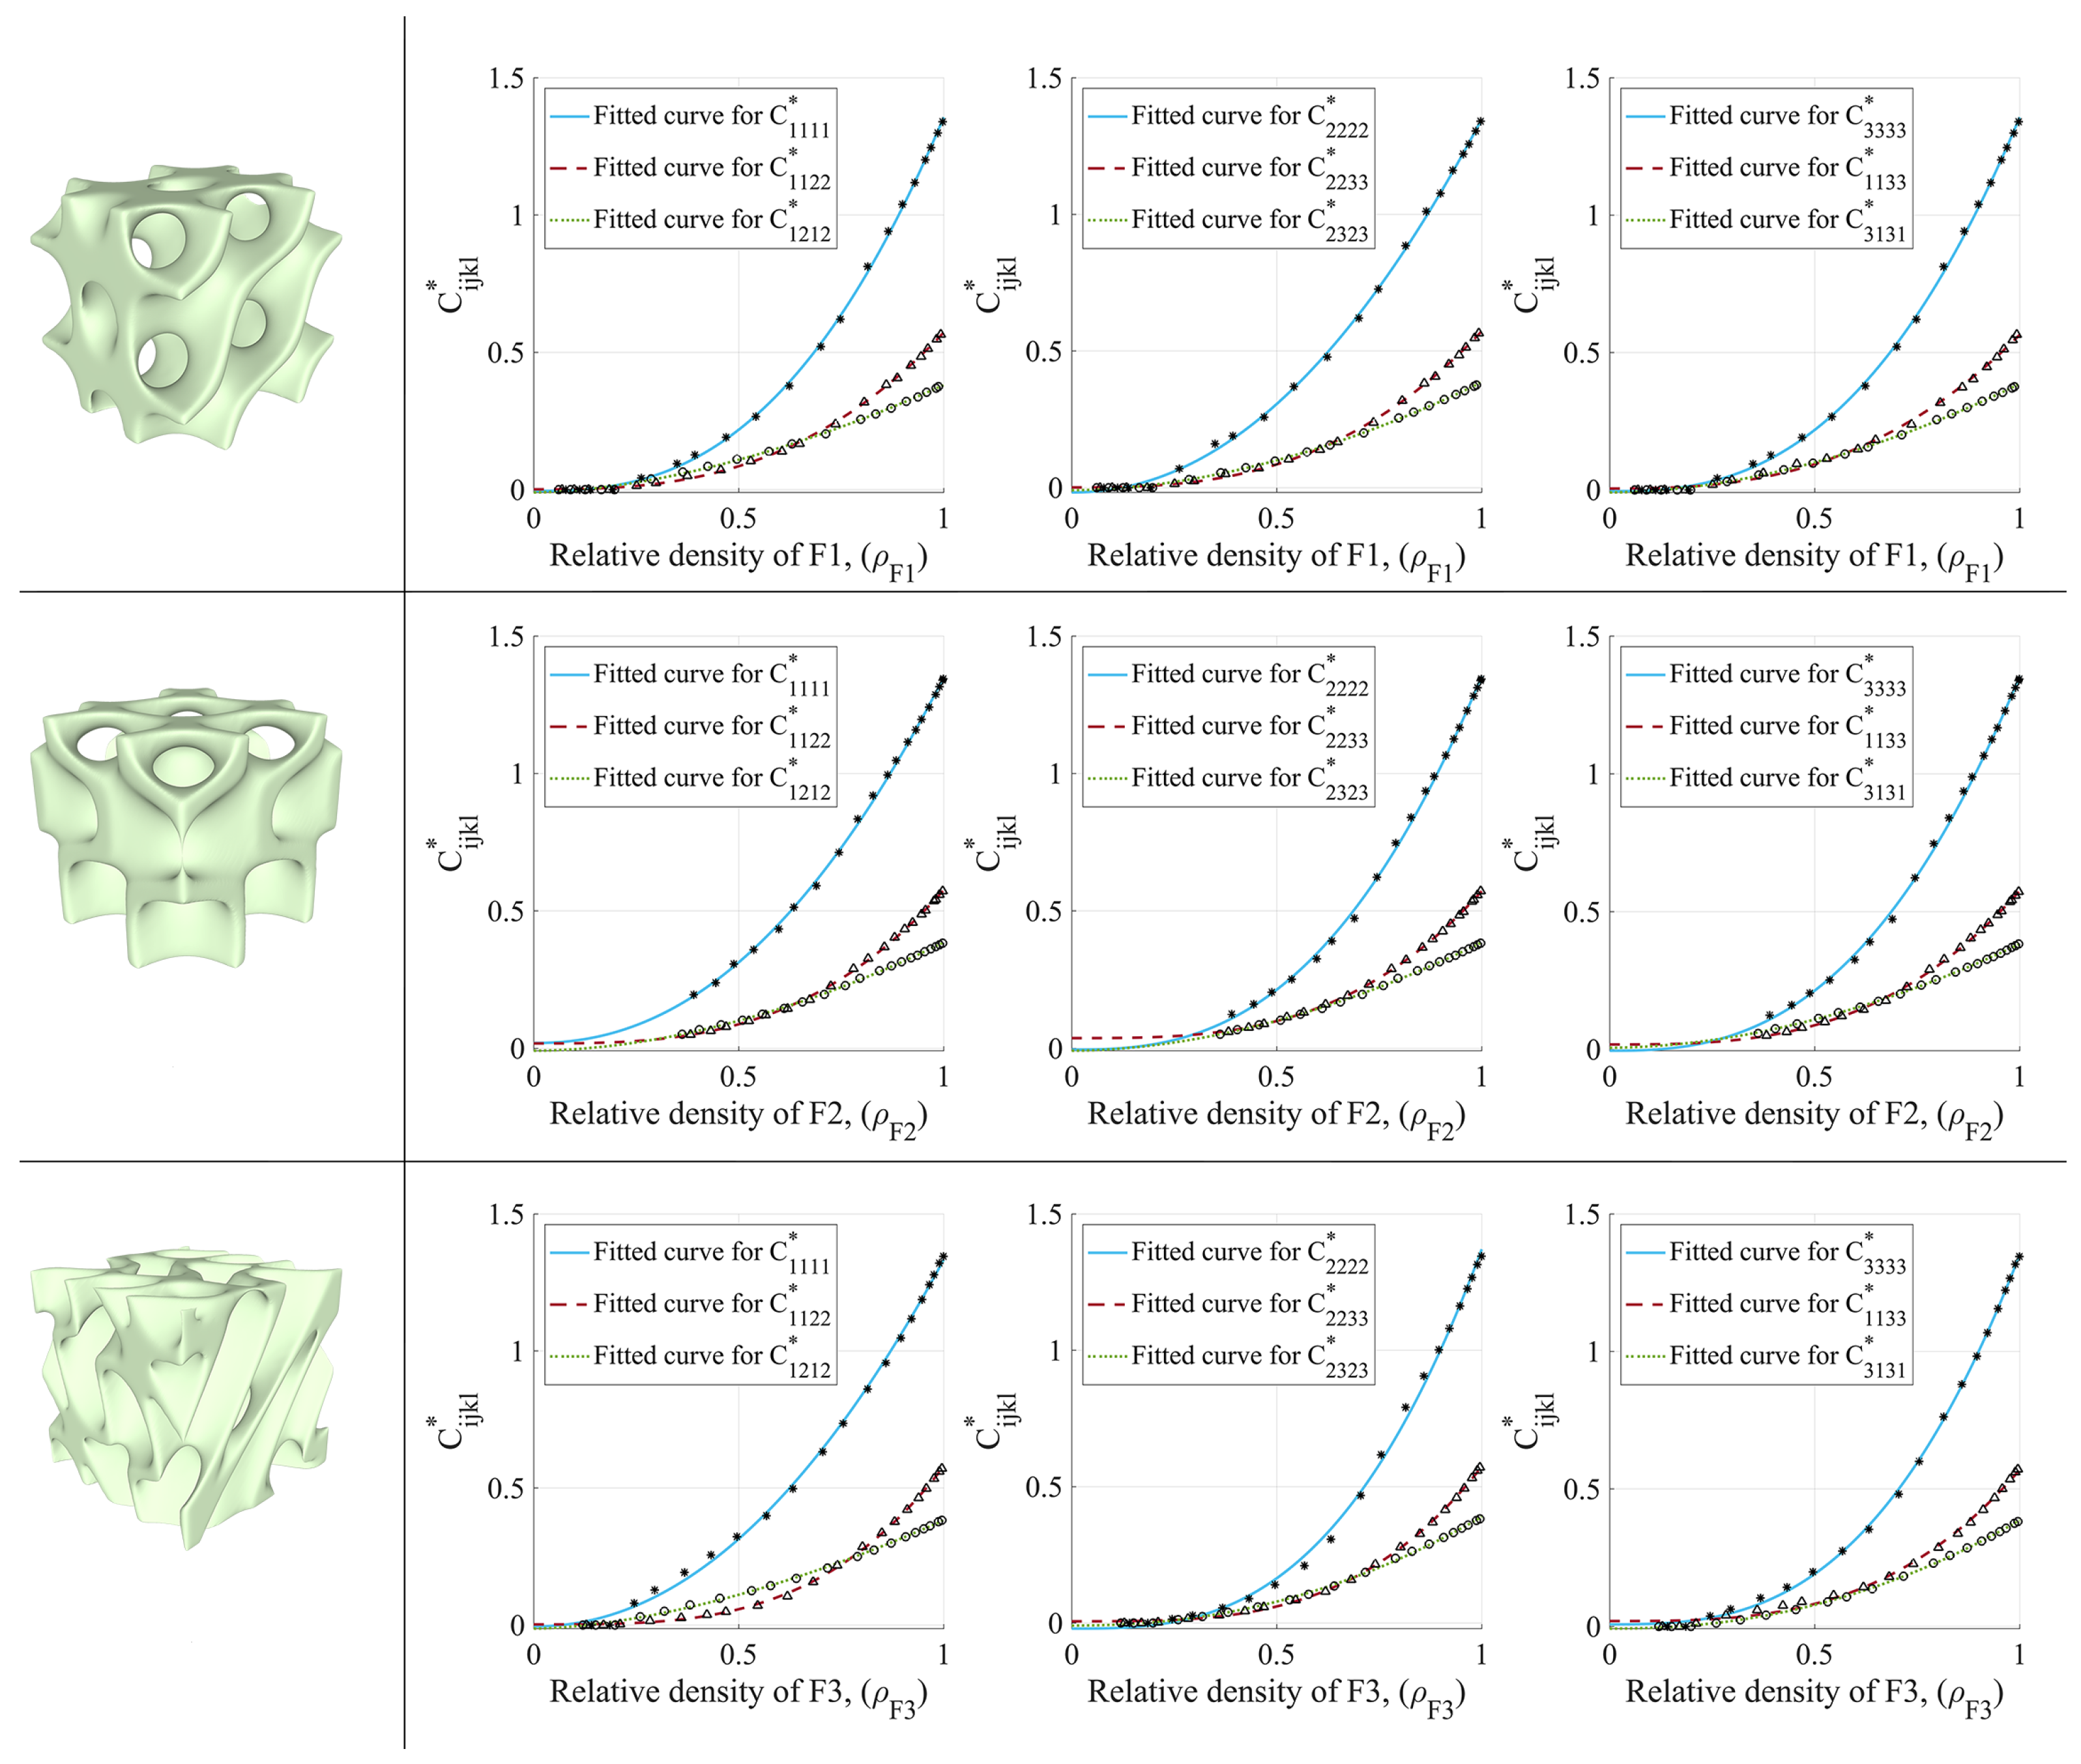
where C i j k l is the elasticity tensor elements of homogenized materials, and C i j k l is the elasticity tensor elements of the solid, ρ e is the voxel density, b 1 i j k l , b 2 i j k l , and b 1 i j k l are constants corresponding to the { i j k l } -element of the elasticity tensor and are unique for each type of the three orthotropic cellular materials used in this paper.
To acquire the constants in Equation (8), a series of samples were collected to fit these constants’ values. The collected samples and the fitted scaling law are presented in Figure 5. There are 20 sample points for each one of the families with relative densities equally spaced ρ [ 0 , 0.05 , 0.10 , , 0.95 , 1 ] . The results show that F 2 and F 3 cellular materials have a relatively lower pressure resistance in e 1 direction than F 1 and stronger shear resistance in the same direction. In the e 2 direction, F 1 shows noticeable pressure and shear resistance compared to the other two. In the e 3 direction, all three have strong shear and weak pressure resistance. It concludes that when there are significant shear stresses in the structure, either F 2 , F 3 or 90 rotated F 3 along e 3 should be considered for the TO problem. Based on the fitting results, the elastic tensor scaling laws for the constants of FSF-based cellular materials are presented in Table 1.

3. Two-Scale Topology Optimization

The modeled microstructures can be encapsulated into the TO framework for structural optimization with the homogenized effective mechanical elasticity tensors. Thus, this section establishes a two-scale TO framework with isotropic/orthotropic microstructures for structural optimization problems. The details of the problem formulation and optimization method are introduced in the following sections.

3.1. Optimization Problem Formulation

The objective of TO is to find an optimal solution for retaining materials within a prescribed design domain to achieve the expected structural performance. In this work, we mainly focus on the structure’s compliance minimization problem—i.e., we aim at maximizing the structure stiffness by finding the optimal distribution of the cellular material. It should be noted that the proposed framework is not limited to compliance optimization problems. The objective function can be formulated to adapt to application-dependent functionality requirements.
In the developed two-scale TO framework, the design space is discretized into a voxel grid of hexahedral elements, where each element is to be filled with a cellular structure. At the same time, each cellular structure family can be adjusted by its relative density (volume fraction), which dictates the mechanical properties of the element. The density of the cellular structure is the design variable to be optimized. In typical density-based topology optimizations, the volume fraction of the elements is formulated as the design variable. In the optimization process, the optimal mechanical properties for each element need to be mapped into a relative density field. All of these operations may lead to modifying the optimized properties of the element. After solving the TO and having the density field of the optimized structure, a mapping process is used to map a cellular structure to the optimized density value for each element as the microstructure of the two-scale TO. The optimization problem could be written as:
m i n ρ : J ( ρ ) = U T ( ρ ) K ( ρ ) U ( ρ )
subject to : ρ e v e V f
KU = F
ρ e [ ρ ̲ e , 1 ] , e .
The objective of the two-scale TO is to minimize the structure’s compliance J (i.e., work under an external force), where U denotes the nodal displacement vector and can be calculated by solving the equilibrium equation. The global stiffness matrix K can be assembled from elementary stiffness matrices. The Volume fraction V f controls the amount of material used in the final design. F indicates the external force applied to the design domain, which in our problem is constant in magnitude and direction. The first constraint (9b) is the volume constraint, which limits the summation of the element volume fractions to a given value. The second constraint (9c) is the equilibrium equation, this constraint is used to calculate the displacement vector U = K 1 F . The last constraint (9d), which is imposed on the element e volume fraction ρ e , confirms the connectivity between the cellular materials. The lower bound ρ ̲ e is to ensure an acceptable interface connection between adjacent elements. The lower bound ρ ̲ e should be predetermined for each one of the elements families separately, while the upper bound ρ ¯ e = 1 for all families. Small-level parameters would result in cellular materials with no material distributed at the voxel surfaces. A proper interval is needed for the design parameter of the elements to maintain the connectivity between the elements. Imposing a lower bound ρ ̲ e is necessary to ensure that the microstructure complies with the homogenization theory hypothesis and confirm that the elements have an acceptable interface connection. For a proper connection between two neighboring microstructures, as shown in Figure 6a,b, the percentage of the surface overlap ( S i n t / S ) should be larger than 6.4 % for each side. In Figure 6, S is the area of the microstructure surface, and S i n t is the area of the surface overlap at the interface of two microstructures.

3.2. Elementary Stiffness Matrices

As mentioned, the displacement vector in the objective function (9a) is unknown, and the equilibrium Equation needs to be solved to find it.
K ( ρ ) U = F ,
where K is the global stiffness matrix, which is the result of assembling all the elementary stiffness matrices of the microstructures. Using the potential energy approach [45], the elementary stiffness matrix of a microstructure can be derived:
k e = Ω e B T C e ( ρ e ) B d Ω e ,
where k e gives the element’s e stiffness matrix, B is the displacement differentiation matrix [46], C e is the elementary elasticity tensor, and Ω e and u e are the element e volume and nodal displacement vector, respectively. Each element’s elasticity tensor can be computed by the element’s density, Young’s modulus, and Poisson’s ratio of the solid material using the scaling law and the fitted curves Equation (8).

3.3. Optimization Algorithm

This work proposes a gradient-based algorithm to solve the formulated optimization problem in Equation (9). Specifically, the procedure of the proposed algorithm is as follows: first, by using the initial data, the elementary stiffness matrix is calculated for each element, and the results are used to assemble the global stiffness matrix. Second, the displacement vector can be computed by solving the equilibrium equation once obtaining the global stiffness matrix. Next, the compliance and the total volume derivatives with respect to the design variable ρ e can be computed as:
J ρ e = u e T k e ρ e u e = u e T Ω e B T C e ρ e B d Ω e u e ,
and
V ρ e = i ρ i ρ e = 1 .
The above two derivatives Equations (12) and (13) are calculated as a means to update the design variables. Then the procedure to update the design variables is to evaluate the impact of each element’s volume change on the change in the objective function (i.e., compliance) [47]. This impact is proportional to the sensitivity of the compliance to the change in the volume of a voxel, which can be calculated with:
g e = J / ρ e V / ρ e ,
where g e is sensitivity of element e. According to Equation (14), a small value of g e means that the volume fraction of that element can be lowered without significantly affecting the whole structure’s stiffness. On the contrary, if an element has a relatively large sensitivity value, a volume fraction increment will result in a noticeable increase in the structure’s stiffness. The last step of the algorithm is to define stopping criteria. One approach is to update the design variables until the change in the objective function gets less than a predetermined threshold. An alternative criterion is to fix the number of iterations. After the stop criteria are reached, the optimal volume fractions will be procured. The pseudo-code of the proposed algorithm is summarized as in Algorithm 1.
Algorithm 1: Pseudo-code of the proposed optimization algorithm
1 
Define the boundary conditions ( Γ s , Γ U );
2 
Determine the microstructure type: isotropic ( P , G , D , W ) or orthotropic ( F 1 , F 2 , F 3 );
3 
Discretize the design domain Ω , and initialize the design variable ρ 0 = v f ; k = 0 ; set K , ϵ
4 
while k K or ϵ < 0.01 do
5 
| .
6 
end
7 
Compute elasticity tensor C p c m H ( t e ) of microstructure with homogenization;
8 
Calculate global stiffness matrix: K p c m = e = 1 n V e B T C p c m H B d V e ;
9 
Find the displacements U k by solving the equilibrium equation: U k = K p c m 1 F ;
10 
Compute the objective function C k ( ρ k , U k ) , and sensitivities ( C k ρ );
11 
ρ k + 1 = ρ k C k ρ ;
12 
ϵ = C k C k 1 ;
13 
k = k + 1 ; Result: Return the optimal design variables ρ
14 
.

3.4. Post Processing

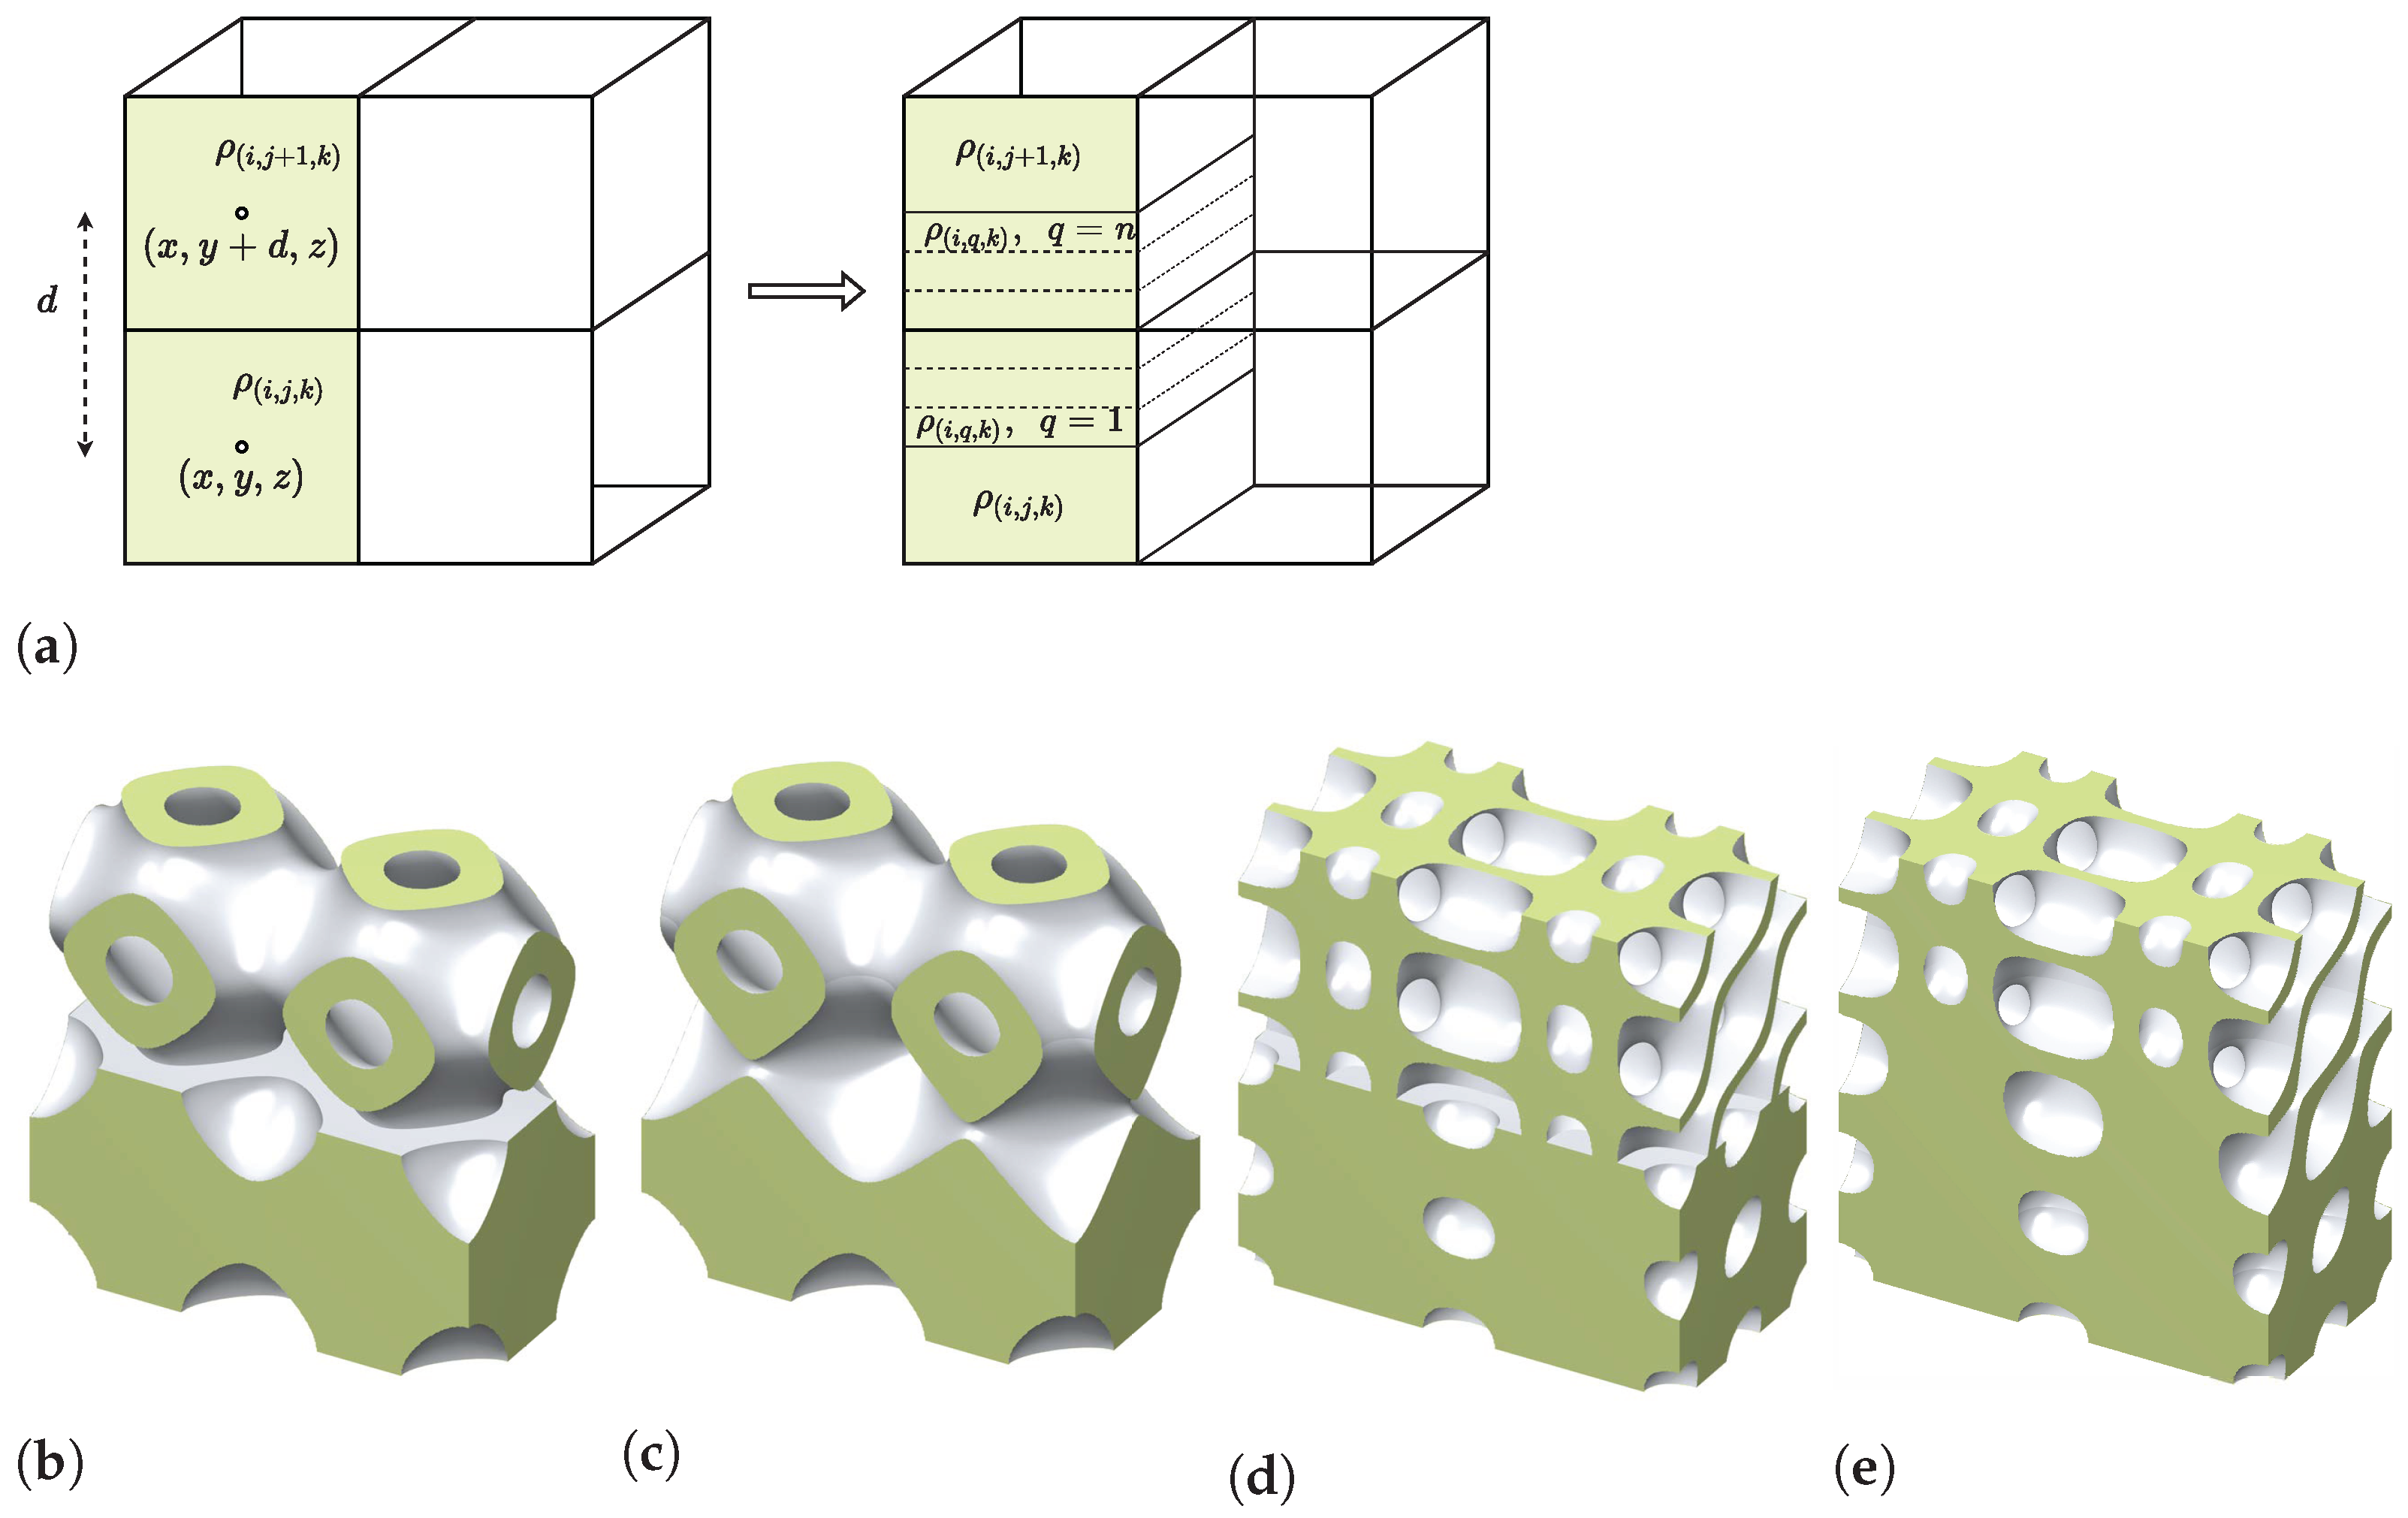
In the layout of the optimized structure, low-density microstructures might be placed adjacent to high-density microstructures. This configuration may lead to geometry frustration problems. For example, in Figure 7b,d, the sudden change in the topology of the neighboring microstructures can be seen; the sharp transition could cause stress concentration and consequently weaken the structure’s stiffness. An interpolating operator is applied on all microstructures along three dimensions to have a smooth surface transaction between microstructures and avoid these problems. To explain how this operator works, an example in the y direction is illustrated in Figure 7a—consider two microstructures with their middle points located at ( x , y , z ) and ( x , y + d , z ) , where d is the distance between center of two adjacent microstructures and their relative densities are ρ ( i , j , k ) and ρ ( i , j + 1 , k ) . To have a smooth connection rather than a sudden change in microstructures’ topology, this distance is divided into n sections; each positioned at ( x , y + ( i / n ) d , z ) with a relative density of ρ ( i , q , k ) , q { 1 , 2 , . . . , n } . Linear interpolation is used to calculate these densities:
ρ ( i , q , k ) = ρ ( i , j + 1 , k ) ( ρ ( i , j + 1 , k ) ρ ( i , j , k ) ) × ( 1 q n ) .
Figure 7c,e demonstrates the smooth transition of adjacent microstructures after applying the smoothing operator. When n is large enough (e.g., n 20 ), after applying this operator, the sudden change in neighboring microstructures’ topology will be eliminated (Figure 7c,e), and the whole structure will appear as a single object.

Minimum Feature Size

Since linear interpolation is used for the post-processing, increasing n will improve the smooth transition, but practically it can not be larger than the resolution of a single microstructure which depends on the size of the microstructure and the 3D printer resolution. Table 2 summarizes the maximum possible resolution for different SLA printers based on their resolution and the microstructure size.

4. Numerical Results

This section considers several benchmark cases to study the effect of parameterized function-based isotropic and orthotropic microstructures on the two-scale TO output structure’s stiffness. Comparative studies were conducted to demonstrate the performance of the proposed framework with function-based microstructures. First, the orthotropic microstructures were compared with isotropic ones. Then the proposed framework was applied to different standard structure design problems. Lastly, two illustrative applications of the proposed method are presented.

4.1. Benchmark Problems

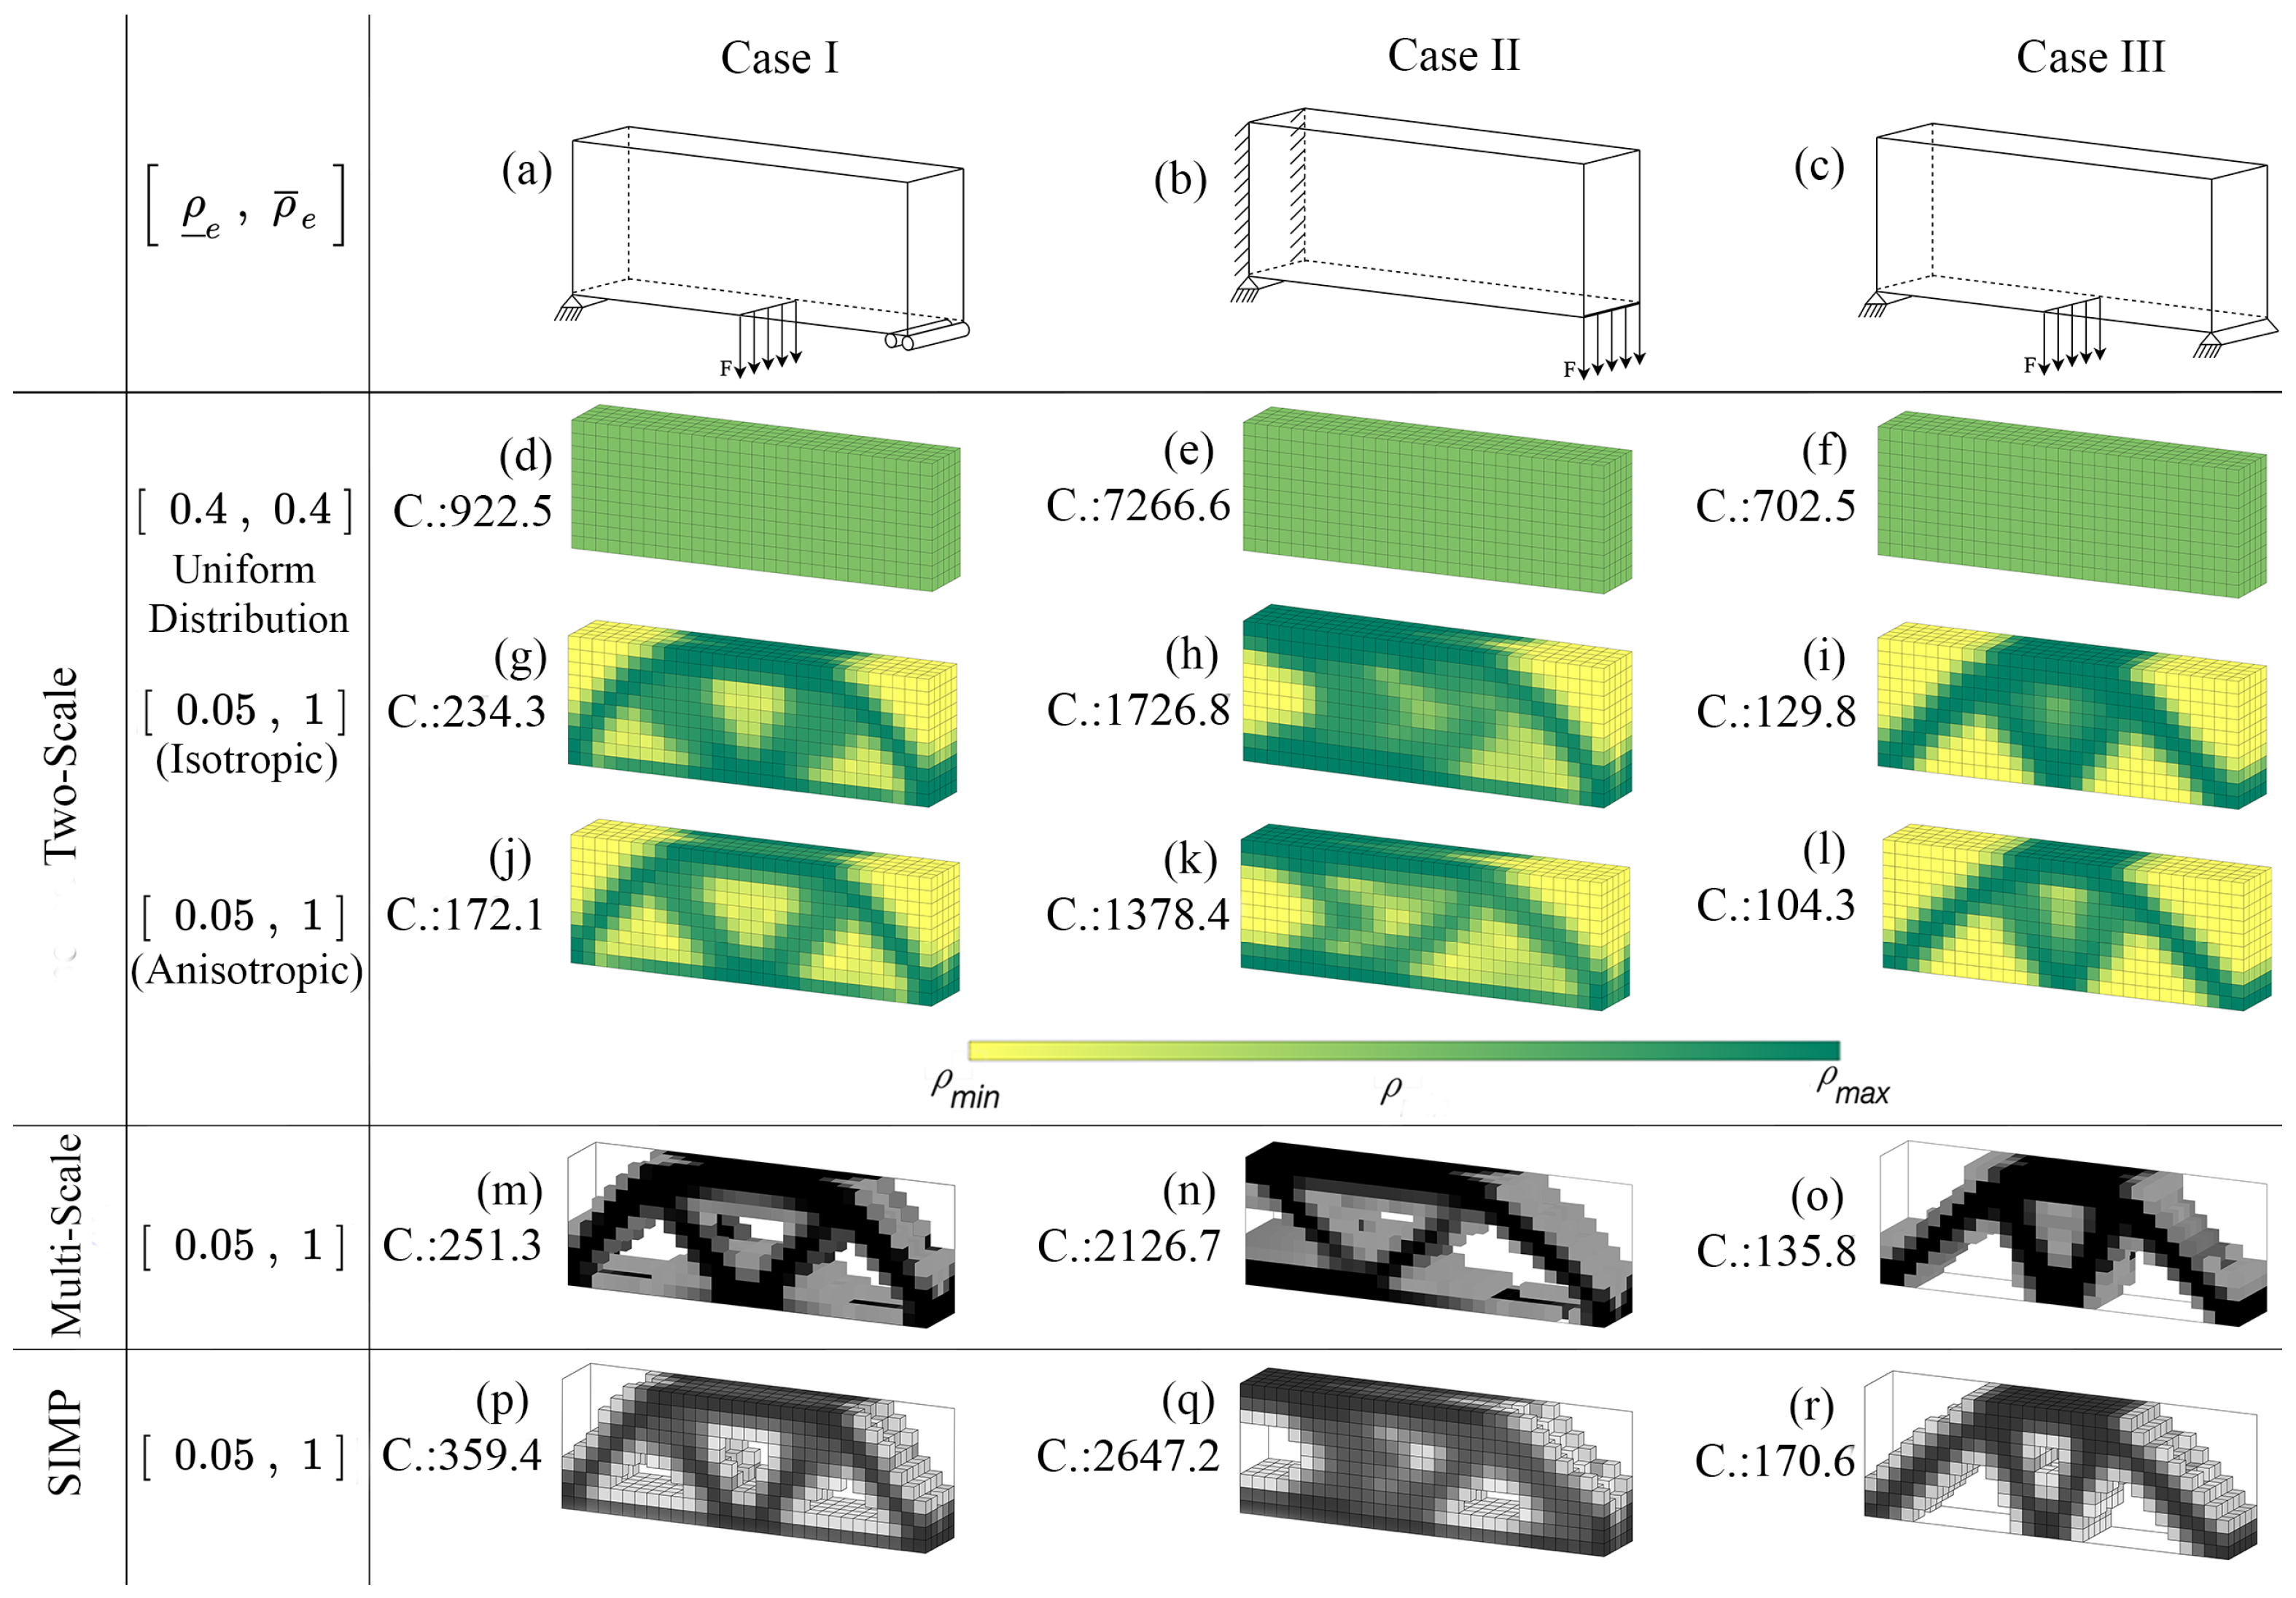
In order to test the impact of using function-based cellular materials in TO, four benchmark design problems were investigated in this work. For simplicity, they are named Cases I, II, III, and IV here. The details of each problem are as follows:
  • Case I: This problem is a bending beam with a rectangular cross-section, bottom left edge hinged, roller support for the bottom-right edge, and a uniform load applied to the bottom middle of the beam. The graphic illustration of the boundary condition is presented in Figure 8a;
  • Case II: The second problem is a classic cantilever beam problem. In which the beam has a rectangular cross-section, left face fixed, and a uniform load applied to the bottom-right edge of the beam as shown in Figure 8b;
  • Case III: This case is an alternative version of the bending beam, and the problem has been configured as follows: both the bottom-left and the bottom-right edge of the beam are hinged, and a uniform load is applied to the bottom middle of the beam shown in Figure 8c;
  • Case IV: The fourth problem is an L-shaped structure, clamped from the top surface of the structure, and a uniform downward load is acting on the right top edge of the structure, as shown in Figure 8d.
In the first three cases, the beam had dimensions of 30 cm × 10 cm × 5 cm , and the load magnitude was 200 N / cm . For Case IV, the L-shaped structure dimensions are detailed in Figure 8d. For the four cases, the objective was to minimize the structure’s compliance, and the base material properties were E = 1 GPa (Young’s modulus) and ν = 0.3 (Poisson’s ratio). They were also subjected to the constraint of maximum volume fraction V f of 40 % .

4.2. Isotropic versus Orthotropic Cellular Materials

Compared to isotropic cellular materials, orthotropic ones have more flexibility for implementing direction-dependent mechanical properties. Thus, orthotropic microstructures can significantly enhance the design space and achievable directionality. In this section, a comparison experiment between isotropic and orthotropic cellular materials is conducted to reveal the superiority of orthotropic microstructures. For demonstration purposes, Case I is studied here. In this benchmark problem, the design domain was discretized into 30 × 10 × 5 uniform voxel grid, and each voxel was filled once with isotropic and then again with orthotropic microstructures. As a conceptual demonstration, the proposed two-scale TO problem used F P and F 1 for isotropic and orthotropic cellular structures. Figure 9 presents the optimized density distribution of two types of cellular materials with the proposed TO framework. It can be seen that the selected cellular material in Figure 9 has orthotropic properties. While in Figure 9b, the cellular material used is isotropic, and it has similar properties along the three axes of the Cartesian coordinate system.

Directional Tunability

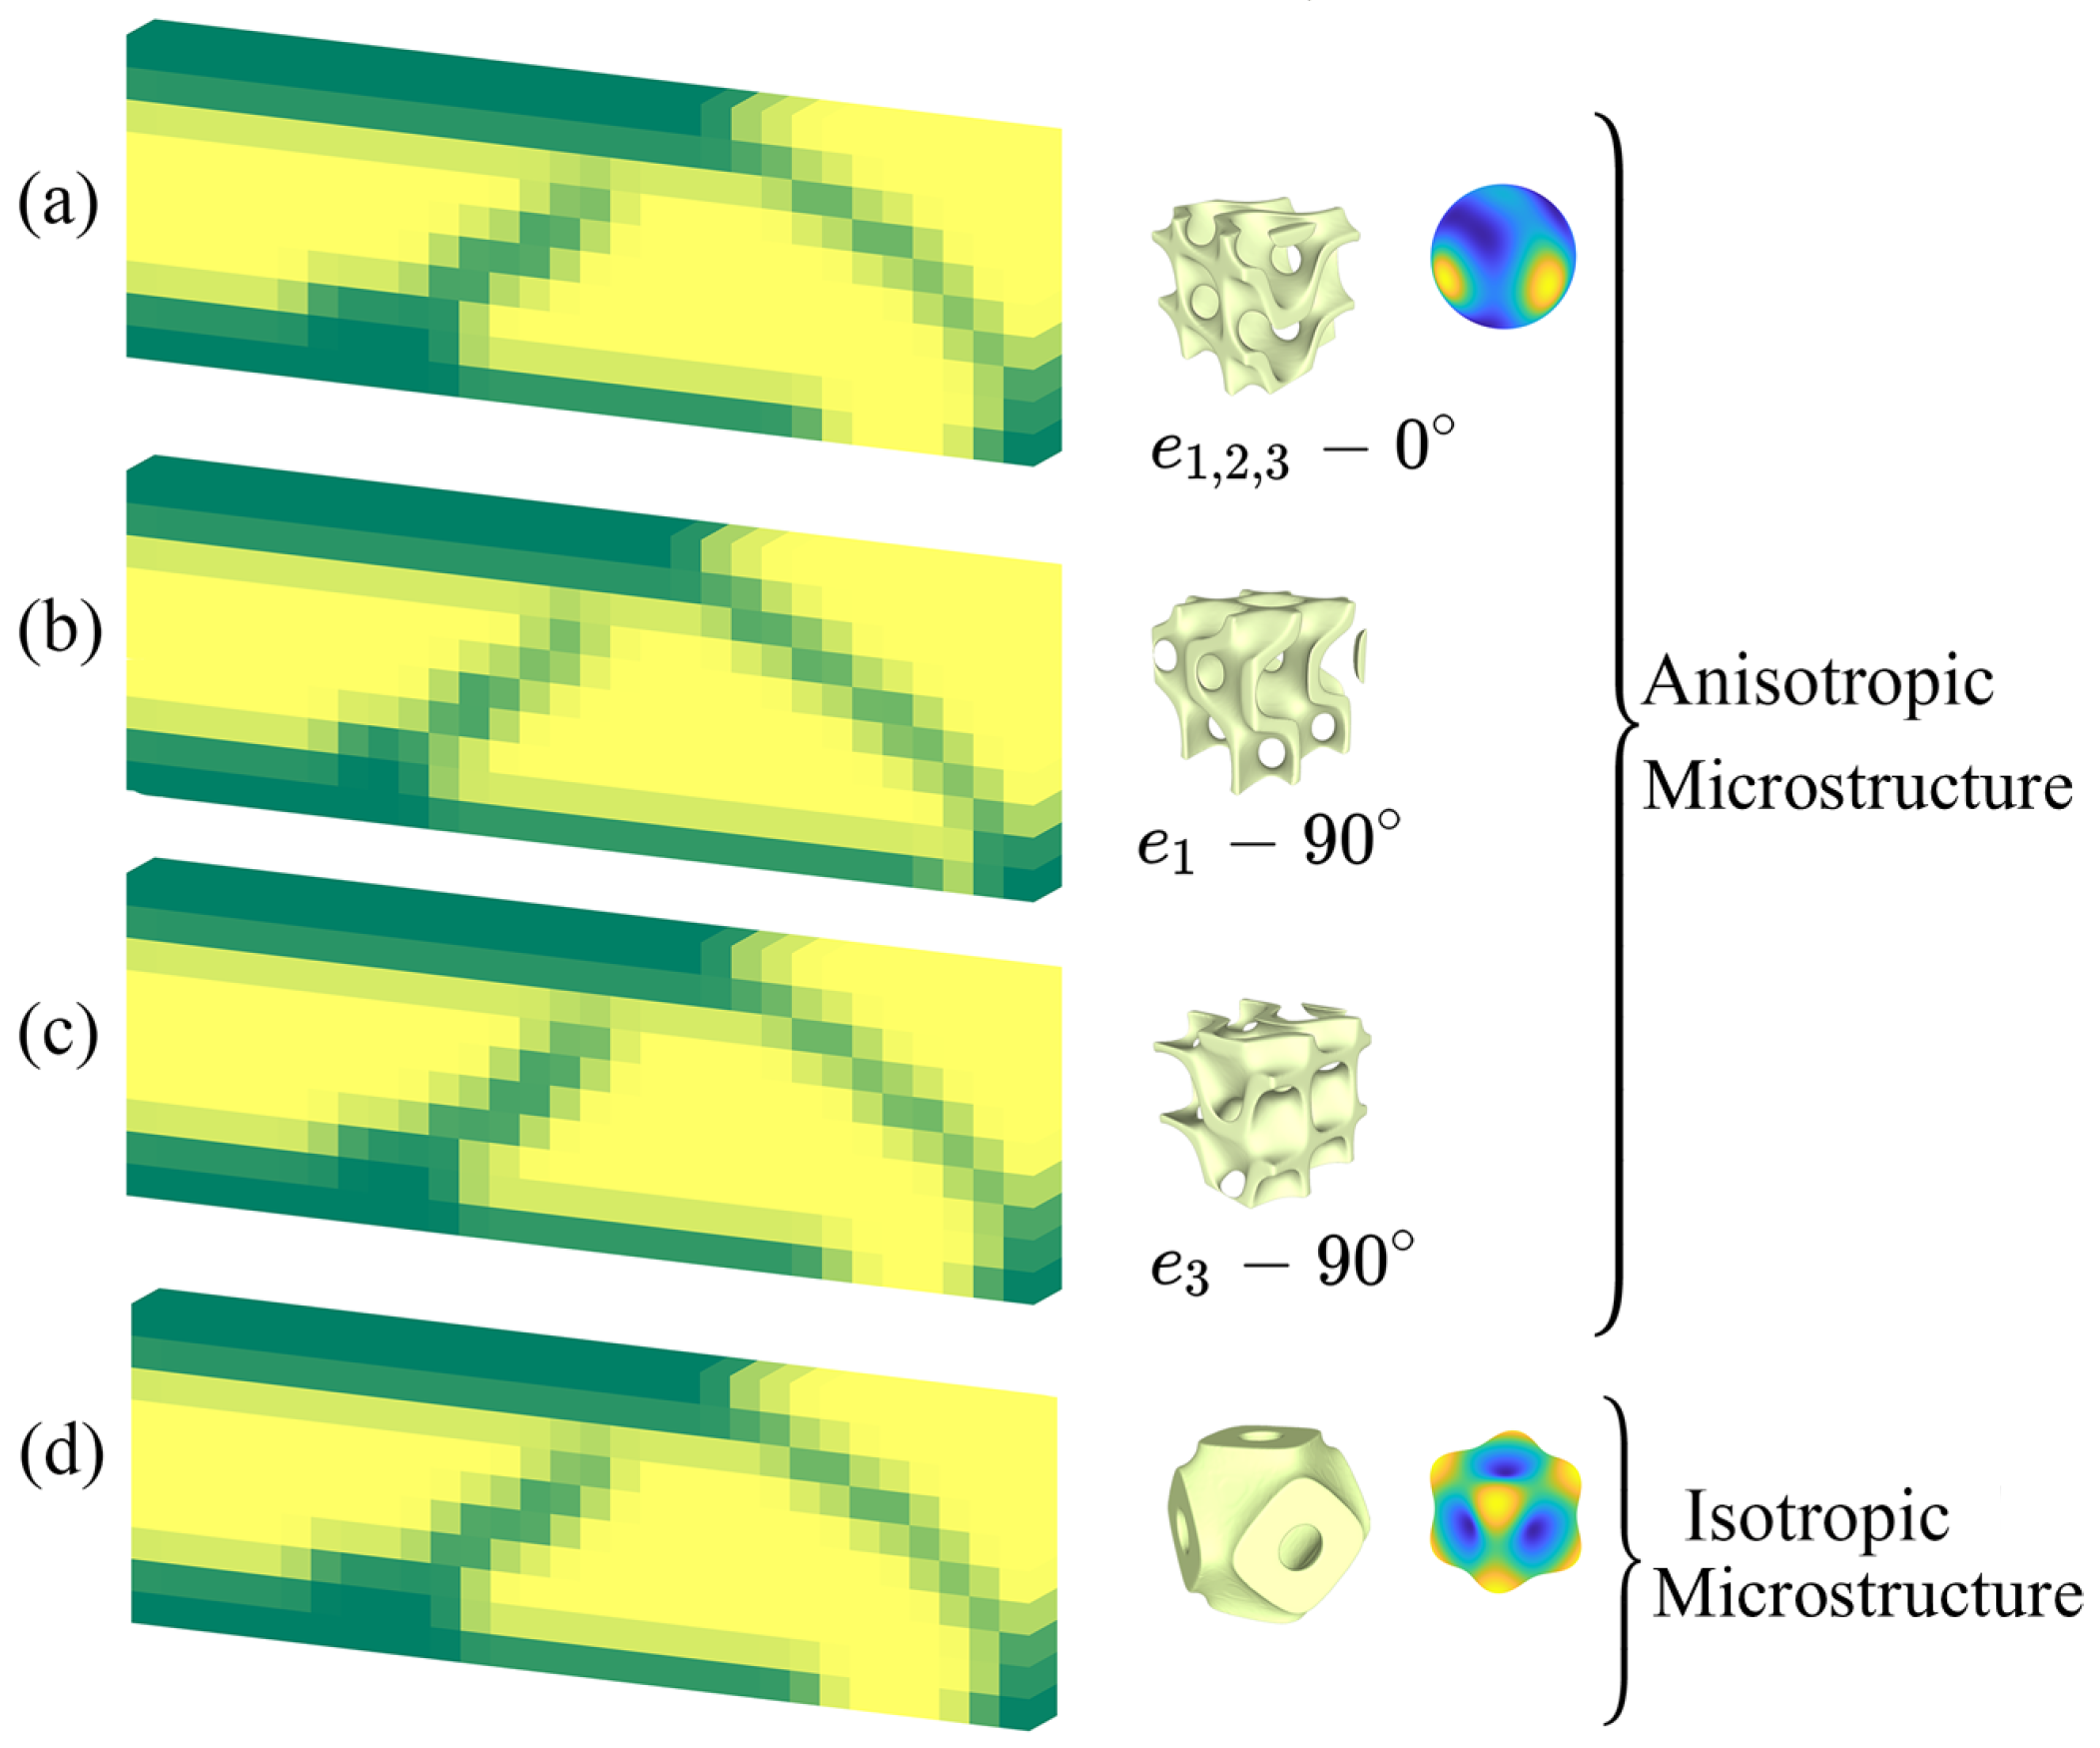
To further verify the design flexibility and structural performance by using the orthotropic cellular materials, the infilling orientation of the microstructure is considered here. Specifically, a rotation with different angles was performed on the cellular materials, and the resulting structural compliance was estimated. Here, the orthotropic cellular material was rotated with 0 , 90 about the x-axis, and 90 about the z-axis. These three orientations were randomly selected for the sake of the study (the rotational angle will be considered as the design parameter in future studies). Then, these three structures were compared with the one filled with isotropic cellular material. The design configurations are illustrated in Figure 10. Moreover, the resulting mechanical performance (compliance) of these designs is shown in Table 3.
The proper selection of cellular material and rotation can result in a 28% drop in the structure’s compliance. Looking at the two other arrangements of the orthotropic cellular material ( 0 and z- 90 ), they have similar performances compared to isotropic cellular material. This indicates that they have similar stiffness characteristics in the direction of the principal stresses caused by the loading. However, by rotating the orthotropic material, the stiffer direction of the material aligns with the stresses’ direction and results in lower compliance, which reveals enhancement in structural integrity. Experimental results herein verify that the orthotropic microstructures have more design flexibility and achievable directionality than the isotropic ones within the proposed TO framework.

4.3. Performance Evaluation

This section provides comprehensive comparison studies to verify that orthotropic materials achieve better directional tunability. As a baseline, both the classical SIMP method [48] and state-of-art multi-scale method [25] (for simplicity, named “multi-scale” henceforth) are also applied to find the optimal structures for the four benchmark cases. First, these methods’ computational performance and then the optimal structures’ mechanical performance from different approaches are compared.

4.3.1. Computational Performance

The computational cost is one of the challenges for high-resolution structural optimization. Therefore, a TO method is usually expected to be computationally efficient to reach the optimal solution. To further examine the efficiency of the two-scale TO [49] in handling both isotropic and orthotropic cellular materials, its convergence time is compared with the multi-scale method. For demonstration purposes, Case I is used as an illustration study. For the settings of the SIMP method, the design domain was discretized by an 8-node hexahedral element mesh using a uniform grid. The penalization parameter was set to p = 3 . The same number of elements were used for all three methods to compare fairly. The design volume was constrained to last for 40 % of the design domain volume in all methods. The convergence criteria for the optimization problem was either 200 iterations or the difference between two consecutive iteration compliances smaller than 0.01 , which happens first. For the two-scale TO, F 2 cellular material was considered with [ 0.05 , 1 ] as the lower and upper limits for elements density, and for multi-Scale, i s o setting [25] was used. To further test the proposed method’s performance, various elements in the micro-scale were used in the two-scale method. All experiments were implemented on a PC with a 2.4 GHz 8-Core Intel i9 CPU, 32GB RAM, and an 8 GB graphic card within the environment of MATLAB R2020b. The comparison results are listed in Table 4. The two-scale method has the lowest convergence time (273% faster than the multi-scale method), while the achieved compliance is smaller than the other method. Furthermore, the convergence time does not change when varying the number of micro-scale elements. This is mainly because a parameterized cellular structure is used in the two-scale method, which does not increase the computational time with the increasing micro-scale elements. Experimental results reveal that the two-scale method is robust, using either isotropic or orthotropic cellular material as the microstructure.

4.3.2. Structural Performance

The structural performance was studied using different TO methods in this section to investigate the mechanical properties of the optimized structures.

4.3.3. Level Parameter Effect

In the two-scale TO framework, different cellular material families would affect the mechanical performance of the final structure. To investigate the difference between having an isotropic cellular material and an orthotropic cellular material as the microstructure in the TO framework, the same TO problem was solved twice, first with isotropic materials and then with orthotropic ones. Cases I-III are studied here. The three cases’ boundary conditions, force magnitudes, positions, directions, and beam dimensions remained the same. A 30 × 10 × 5 uniform voxel grid was used to discretize the design domain. For the cellular material, F p was used as the isotropic material and F 1 as the orthotropic cellular material. A minimum volume fraction ρ m i n = 0.05 was used to meet the voxels’ connectivity constraint for both cellular materials. Microstructures with different mechanical properties were contemplated for the three cases, and the final optimized structures for three benchmark cases are presented as in Figure 11.
Figure 11d–f shows the results for the three TO problems with an isotropic cellular material with ρ m i n = ρ m a x = 0.4 (uniform density distribution). Considering the given volume constraint, a uniform distribution of the voxel with ( ρ = 0.4 ) through the design domain is sensible. In Figure 11g–i, isotropic cellular material was used in the TO framework and the bounds for the elements’ volume fraction are [ 0.05 , 0.1 ] , and in Figure 11j–l, orthotropic cellular material has been used with the same bounds for the elements’ volume fraction ( [ 0.05 , 1 ] ) . Comparing the compliance for the structures in Figure 11d,g, it is evident that the two-scale topologically optimized structure with isotropic material has 75 % less compliance than the uniform structure. It reveals that by increasing the maximum allowable volume fraction ( ρ m a x ) for each voxel, the TO will converge to a stiffer design, reducing compliance. From Figure 11g,j, it can be observed that by switching to orthotropic cellular materials, the structure compliance has decreased by 26 % . It indicates that the superiority of orthotropic microstructures is a valid hypothesis, and stiffer optimized structures with the same volume fraction constraints can be achieved using orthotropic cellular materials instead of isotropic cellular materials.

4.3.4. Comparison with Multi-Scale and SIMP

To see the structure performance of the two-scale TO with orthotropic cellular materials, the optimal compliance of this method is compared with SIMP, and multi-scale [25] methods. Both isotropic and orthotropic microstructures are used in the two-scale TO framework. Different TO methods are applied to the four benchmark cases, and the optimized structure’s compliance is presented in Table 5. As can be seen, the obtained compliance of the two-scale TO method with isotropic cellular material is smaller but close to the SIMP and multi-scale methods. The optimal structures of the three TO methods are shown in Figure 11m–r. The cantilever beam Figure 11n of multi-scale has the greatest compliance value C = 2126.7 . The force’s line of action is twice further from the support point, which results in a longer moment arm and yields a larger moment. As the end of the cantilever beam is free to move in the direction of the applied force and, as explained, the force produces a larger moment, displacements in the structure would be higher, which means larger compliance is expected with the same magnitude of the applied force. Between the two bending beams, the one with the roller supports anticipates having larger compliance since the right end of the beam is free to move horizontally, resulting in the increment of structural displacements. It can be seen from Figure 11m,r that both multi-scale and SIMP methods have larger compliance in Cases I and III. Compared to the multi-scale and SIMP methods, the two-scale method using proposed function-based microstructures achieves a noticeable drop in compliance using isotropic cellular material, and the compliance is reduced even more by using orthotropic cellular material as revealed in Table 5. For the bending beam Figure 11a (Case I), 26 % drop in compliance is achieved by switching to orthotropic cellular material in the two-scale TO framework. For the cantilever beam in Figure 11b (Case II), there is a 20 % decrease in compliance compared to the two-scale with isotropic cellular material; for the bending beam with two hinged edges in Figure 11c (Case III), the decrease is 19 % .
From Table 5, we can also observe that the compliance of optimal structures with orthotropic microstructure is lower than the isotropic one in the four benchmark cases. This further verifies the conclusion in Section 4.2, i.e., the orthotropic microstructure has a wider design space and can achieve higher structural stiffness than the isotropic one with the same settings. The optimal structure obtained by the proposed framework with isotropic and orthotropic microstructures for Case IV is presented in Figure 12. The L-shape structure has been set up in a particular way that the stress state of the structure is as close as possible to the plane stress. The results show that orthotropic cellular material F 1 has handled the stress distribution much better than the isotropic cellular material F p .
The above experimental results show that using orthotropic cellular materials as the microstructure in the configuration of the TO problem opens an avenue for high-resolution structure design. The structures optimized by the orthotropic cellular materials have better performance (i.e., lower compliance) than structures optimized by conventional materials or purely isotropic cellular materials. Having access to choose between materials with isotropic/orthotropic mechanical properties in optimizing a structure enables designers and engineers to create relatively light but stiff structures that were impossible to manufacture with conventional materials.

4.3.5. Homogenization Result versus Full-Scale FEA Simulation

In this section, FEA results are used for full-scale structures to validate the result of asymptotic homogenization and illustrate that employing orthotropic microstructures in the two-scale TO framework effectively reduces compliance. The full-scale structures are imported to FEBio software [50] as VTK files generated in MATLAB. Since the structures are voxelized, the VTK files can be treated as mesh files and each voxel as an 8-noded hexahedral element. The base material is defined as an "isotropic elastic" material with its young’s modulus set to (E = 3.5 × 10 6 ) and Poisson’s ratio to ( ν = 0.3 ). Each microstructure is discretized into 15 sections in each dimension, resulting in a total of 15 × 15 × 15 voxels. For the first three study cases, the design domain is discretized into 30 × 1 × 10 microstructures, and for Case IV there are 27 × 1 × 27 microstructures in the design domain.
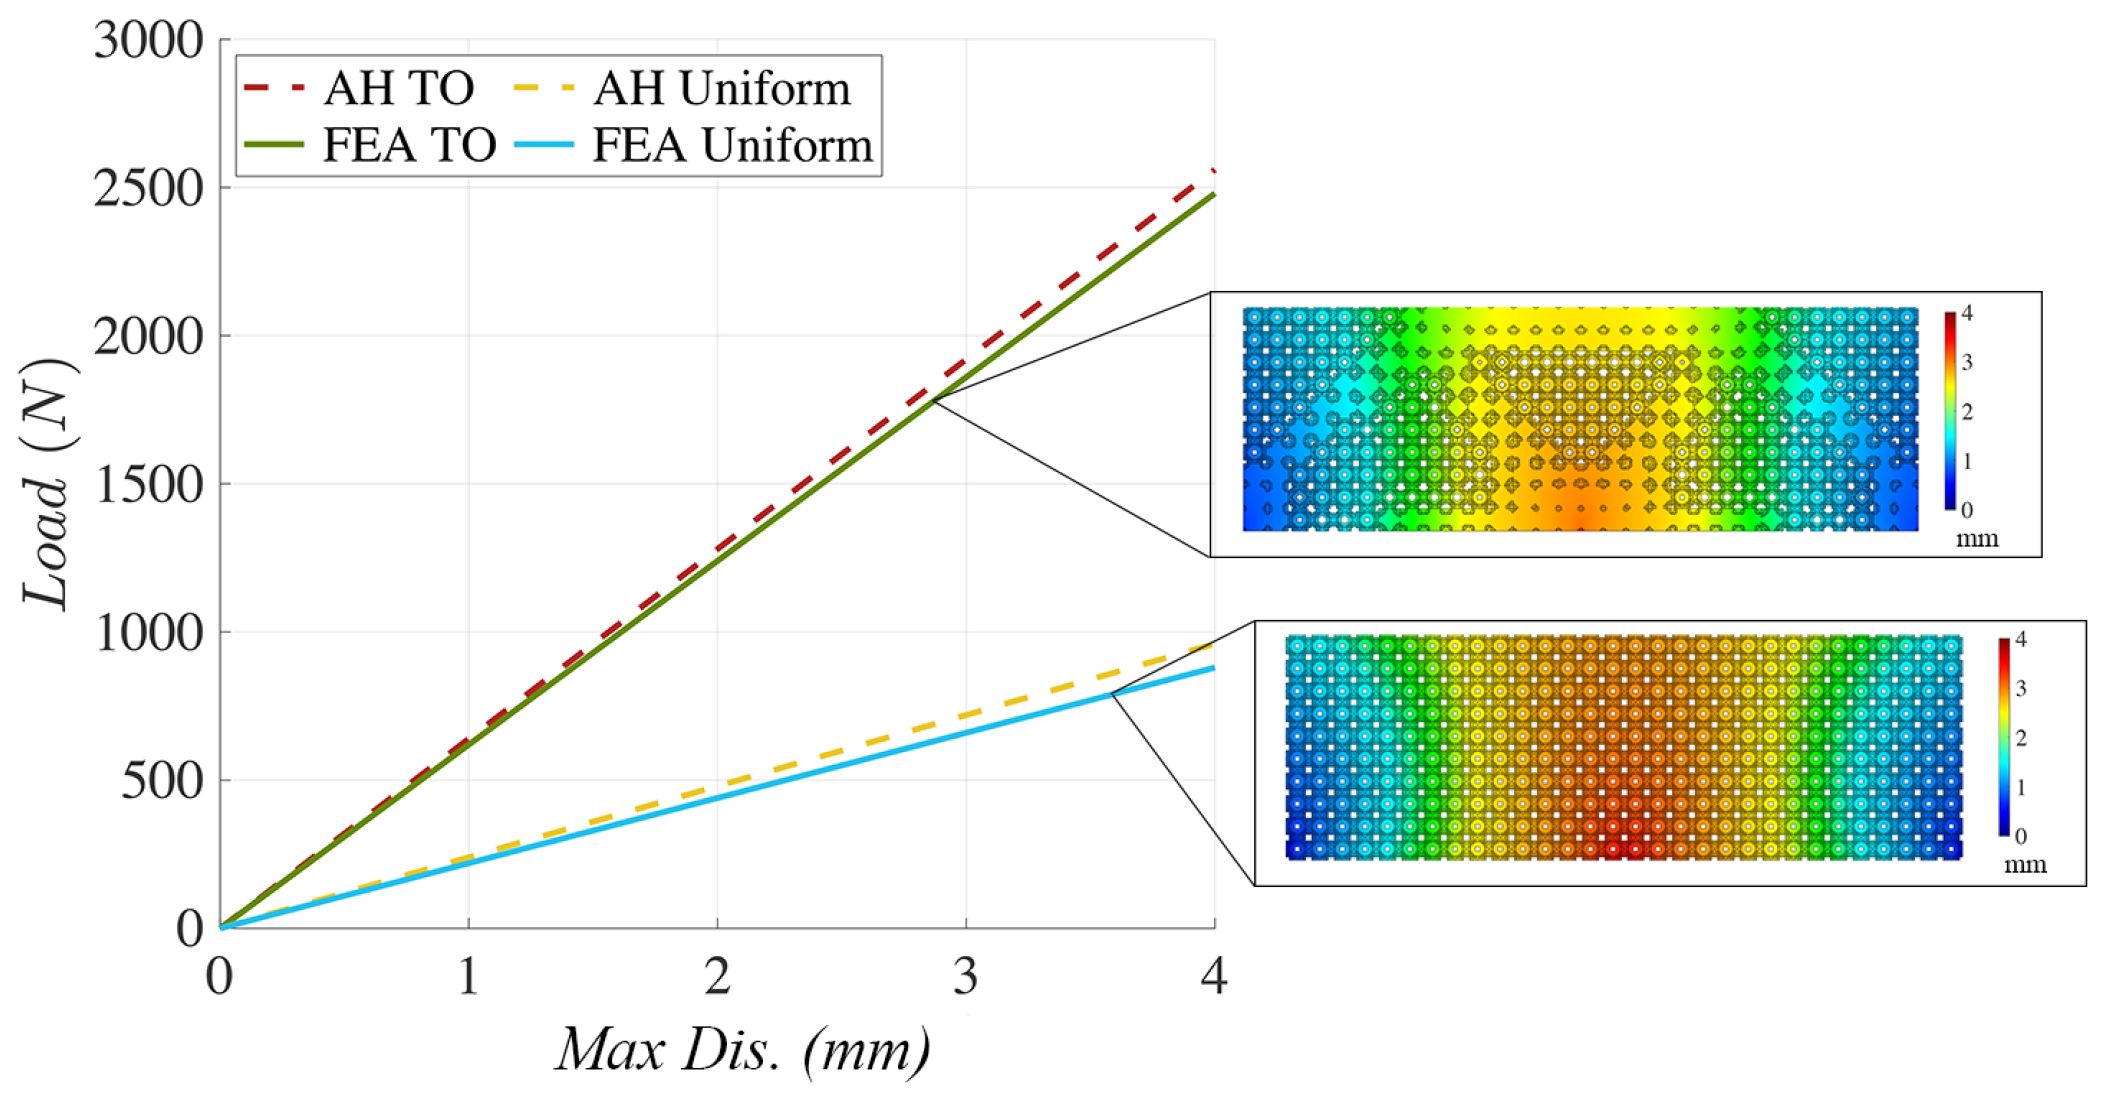
Figure 13 plots the maximum displacement of the optimized and uniform structure under different load magnitudes, F p microstructure has been used in constructing the structures used to plot this figure. The optimized structure results from Two-scale TO, and the uniform structure is the uniform distribution of the F p microstructure throughout the entire design domain. The uniform and optimized structures’ volume fraction is set to ( ν f = 0.4 ). The results from AH are reasonably close to the FEA results, which shows that the predicted mechanical properties for the microstructures using AH are almost identical to the FEA outcomes.
The FEA results for all four studied cases are plotted in Figure 14 with F 1 cellular material for the TO microstructure. The FEA results show that the maximum displacement belongs to Case IV structures, which have the maximum compliance based on the TO results. On the contrary, Case III shows the smallest maximum displacement in FEA simulations and has the smallest compliance.

4.4. Applications

The previous sections show that adopting orthotropic cellular materials in the two-scale TO method achieves a better performance in reducing compliance than conventional TO methods and can handle high-resolution structure designs. To assure that orthotropic cellular materials can also be associated with complex geometries (with various boundary conditions and loading). Here, two complex geometries are selected: the Stanford bunny and the armadillo models. As a conceptual demonstration, both examples are subjected to minimum compliance with the boundary conditions and loading shown in Figure 15 and Figure 16. To avoid having any trimmed meshes in the FEA, only inside of the geometry is discretized with an offset of three microstructures from the boundary, and the offset region of the geometry which has not been discretized with hexahedral meshes is shown in gray color as shown in Figure 15b and Figure 16b.
The bunny model resolution is 38 × 47 × 47 at the macro-scale with 50 × 50 × 50 micro-scale voxels, which means the final design will end up with more than 1 billion voxels. The armadillo has 42 × 46 × 55 elements in the macro-scale and the same micro-scale size as the bunny model, leading to more than 1.5 billion voxels in the final design. Each structure’s voxels are void if they lay outside the model. The convergence time of the two models is presented in Table 6, and the final optimized porous structures of the two models are shown in Figure 15 and Figure 16, respectively. It can be seen from Table 6 that the proposed framework can achieve a high-resolution, lightweight, and high-stiffness design for complex geometries in a decent time. This reveals the potential of the proposed framework in high-resolution and lightweight structure design problems.
To further compare the effect of the anisotropy of used material in topology optimization, the rise in compliance of the structure is plotted while removing material from the design domain for Case I. Stress distribution in Case I is plane-stress ( σ z 0 ), and F 1 microstructure is selected because of its maximum Young’s modulus direction, which is in the same plane. As shown in Figure 17, the structure’s compliance rises with reducing the structure’s weight by removing material as is expected. Compared to the rise in compliance when isotropic material has been used (orange line), orthotropic microstructures (blue line) have a minor compliance increase with the same weight drop as isotropic material. These results further explain that the orthotropic microstructures can enlarge the design space and enhance the mechanical performance of the designing structure.

5. Discussions

Recent developments in additive manufacturing made it possible to fabricate cellular materials with complex geometric features, which were almost impossible to manufacture with traditional manufacturing processes. More than ever, researchers are focused on combining the design process of various types of microstructures with topology optimization. However, no fully developed algorithm integrates the highly anisotropic microstructures with the TO framework. The current manuscript could be the first step in creating such a framework.
A directional tunability study is conducted to further investigate this theory that including anisotropic (orthotropic) microstructures in the TO framework would improve the final design performance. Although this study is limited to only 90 rotations and needs major improvements in future work, it shows that including microstructures with anisotropic mechanical behavior is advantageous. It can be concluded that if the anisotropic cellular material is aligned in the right direction (stiffer in the direction of the largest normal stress), it will result in a much stiffer final optimized structure.

6. Conclusions

This paper explores the influence of function-based cellular materials with isotropic and orthotropic mechanical properties on parameter-based two-scale topology optimization. A gradient-based algorithm is used to solve the optimization problem efficiently by integrating the two-scale optimization problem and parameterized microstructures with a full-density range. A validity interval and density interpolation strategy have been applied to enhance the interface connectivity between the micro-scale elements.
Experimental results demonstrate the computational efficiency and superior structural and mechanical properties of the orthotropic cellular materials. It is also shown that design flexibility and achievable directionality of micro-scale elements can be increased with orthotropic cellular materials in the TO framework.
Other design parameters (e.g., rotation angles) can also be introduced to the two-scale TO framework for further research directions. As most of these parameterized cellular materials are non-isotropic materials, the microstructures’ arrangement could significantly influence the whole structure’s integrity. Optimizing the angles of the cellular material calls for new constraints to prevent material interference and poor connection at adjacent voxels’ interfaces. Those constraints are also worth investigating in future work.

Author Contributions

Investigation, S.R., J.W. and J.H.; programming, S.R.; writing original draft, S.R.; writing, review and editing, J.H. All authors have read and agreed to the published version of the manuscript.

Funding

This research received no external funding.

Institutional Review Board Statement

Not applicable.

Informed Consent Statement

Not applicable.

Data Availability Statement

The code and data for replication in the paper can be provided upon request.

Acknowledgments

This paper acknowledges the support of the Illinois Innovation Network.

Conflicts of Interest

The authors declare no conflict of interest.

References

  1. Sigmund, O. A 99 line topology optimization code written in Matlab. Struct. Multidiscip. Optim. 2001, 21, 120–127. [Google Scholar] [CrossRef]
  2. Sigmund, O.; Maute, K. Topology optimization approaches. Struct. Multidiscip. Optim. 2013, 48, 1031–1055. [Google Scholar] [CrossRef]
  3. Sigmund, O. Topology optimization: A tool for the tailoring of structures and materials. Philos. Trans. R. Soc. Lond. Ser. A Math. Phys. Eng. Sci. 2000, 358, 211–227. [Google Scholar] [CrossRef]
  4. Sigmund, O.; Torquato, S. Design of smart composite materials using topology optimization. Smart Mater. Struct. 1999, 8, 365. [Google Scholar] [CrossRef]
  5. Zhu, J.H.; Zhang, W.H.; Xia, L. Topology optimization in aircraft and aerospace structures design. Arch. Comput. Methods Eng. 2016, 23, 595–622. [Google Scholar] [CrossRef]
  6. Fernández, E.; Ayas, C.; Langelaar, M.; Duysinx, P. Topology optimisation for large-scale additive manufacturing: Generating designs tailored to the deposition nozzle size. Virtual Phys. Prototyp. 2021, 16, 196–220. [Google Scholar] [CrossRef]
  7. Fu, Y.F.; Rolfe, B.; Chiu, L.N.; Wang, Y.; Huang, X.; Ghabraie, K. Parametric studies and manufacturability experiments on smooth self-supporting topologies. Virtual Phys. Prototyp. 2020, 15, 22–34. [Google Scholar] [CrossRef]
  8. Wu, J.; Sigmund, O.; Groen, J.P. Topology optimization of multi-scale structures: A review. Struct. Multidiscip. Optim. 2021, 197–224. [Google Scholar] [CrossRef]
  9. Zheng, L.; Kumar, S.; Kochmann, D.M. Data-driven topology optimization of spinodoid metamaterials with seamlessly tunable anisotropy. Comput. Methods Appl. Mech. Eng. 2021, 383, 113894. [Google Scholar] [CrossRef]
  10. Schury, F.; Stingl, M.; Wein, F. Efficient two-scale optimization of manufacturable graded structures. SIAM J. Sci. Comput. 2012, 34, B711–B733. [Google Scholar] [CrossRef]
  11. Xia, L.; Breitkopf, P. Concurrent topology optimization design of material and structure within FE2 nonlinear multiscale analysis framework. Comput. Methods Appl. Mech. Eng. 2014, 278, 524–542. [Google Scholar] [CrossRef]
  12. Hassani, B.; Hinton, E. A review of homogenization and topology opimization II—Analytical and numerical solution of homogenization equations. Comput. Struct. 1998, 69, 719–738. [Google Scholar] [CrossRef]
  13. Andrews, E.; Gibson, L.J. The influence of cracks, notches and holes on the tensile strength of cellular solids. Acta Mater. 2001, 49, 2975–2979. [Google Scholar] [CrossRef]
  14. Portela, C.M.; Greer, J.R.; Kochmann, D.M. Impact of node geometry on the effective stiffness of non-slender three-dimensional truss lattice architectures. Extrem. Mech. Lett. 2018, 22, 138–148. [Google Scholar] [CrossRef]
  15. Mateos, A.J.; Huang, W.; Zhang, Y.W.; Greer, J.R. Discrete-continuum duality of architected materials: Failure, flaws, and fracture. Adv. Funct. Mater. 2019, 29, 1806772. [Google Scholar] [CrossRef]
  16. Latture, R.M.; Rodriguez, R.X.; Holmes, L.R., Jr.; Zok, F.W. Effects of nodal fillets and external boundaries on compressive response of an octet truss. Acta Mater. 2018, 149, 78–87. [Google Scholar] [CrossRef]
  17. Gandy, P.J.; Bardhan, S.; Mackay, A.L.; Klinowski, J. Nodal surface approximations to the P, G, D and I-WP triply periodic minimal surfaces. Chem. Phys. Lett. 2001, 336, 187–195. [Google Scholar] [CrossRef]
  18. Meeks, W., III; Pérez, J. The classical theory of minimal surfaces. Bull. Am. Math. Soc. 2011, 48, 325–407. [Google Scholar] [CrossRef]
  19. Hsieh, M.T.; Endo, B.; Zhang, Y.; Bauer, J.; Valdevit, L. The mechanical response of cellular materials with spinodal topologies. J. Mech. Phys. Solids 2019, 125, 401–419. [Google Scholar] [CrossRef]
  20. Khaderi, S.; Deshpande, V.; Fleck, N. The stiffness and strength of the gyroid lattice. Int. J. Solids Struct. 2014, 51, 3866–3877. [Google Scholar] [CrossRef] [Green Version]
  21. Kumar, S.; Tan, S.; Zheng, L.; Kochmann, D.M. Inverse-designed spinodoid metamaterials. npj Comput. Mater. 2020, 6, 1–10. [Google Scholar] [CrossRef]
  22. Gibiansky, L.; Cherkaev, A.V. Microstructures of composites of extremal rigidity and exact bounds on the associated energy density. In Topics in the Mathematical Modelling of Composite Materials; Birkhäuser: Cham, Switzerland, 2018; pp. 273–317. [Google Scholar]
  23. Groen, J.P.; Wu, J.; Sigmund, O. Homogenization-based stiffness optimization and projection of 2D coated structures with orthotropic infill. Comput. Methods Appl. Mech. Eng. 2019, 349, 722–742. [Google Scholar] [CrossRef]
  24. Wu, J.; Wang, W.; Gao, X. Design and optimization of conforming lattice structures. IEEE Trans. Vis. Comput. Graph. 2019, 27, 43–56. [Google Scholar] [CrossRef] [PubMed]
  25. Watts, S.; Arrighi, W.; Kudo, J.; Tortorelli, D.A.; White, D.A. Simple, accurate surrogate models of the elastic response of three-dimensional open truss micro-architectures with applications to multiscale topology design. Struct. Multidiscip. Optim. 2019, 60, 1887–1920. [Google Scholar] [CrossRef]
  26. Zhou, Y.; Nomura, T.; Zhao, E.; Zhang, W.; Saitou, K. Large-Scale Three-Dimensional Anisotropic Topology Optimization of Variable-Axial Composite Structures. In Proceedings of the International Design Engineering Technical Conferences and Computers and Information in Engineering Conference, American Society of Mechanical Engineers, Virtual, Online, 17–19 August 2020; Volume 84003, p. V11AT11A055. [Google Scholar]
  27. Mirzendehdel, A.M.; Rankouhi, B.; Suresh, K. Strength-based topology optimization for anisotropic parts. Addit. Manuf. 2018, 19, 104–113. [Google Scholar] [CrossRef]
  28. Wang, J.; Rai, R.; Armstrong, J.N. Investigation of compressive deformation behaviors of cubic periodic cellular structural cubes through 3D printed parts and FE simulations. Rapid Prototyp. J. 2019, 26, 459–472. [Google Scholar] [CrossRef]
  29. Wang, J.; Callanan, J.; Ogunbodede, O.; Rai, R. Hierarchical combinatorial design and optimization of non-periodic metamaterial structures. Addit. Manuf. 2021, 37, 101710. [Google Scholar] [CrossRef]
  30. Wang, J.; Huang, J. Functionally Graded Non-Periodic Cellular Structure Design and Optimization. J. Comput. Inf. Sci. Eng. 2022, 22, 031006. [Google Scholar] [CrossRef]
  31. Allaire, G.; Cavallina, L.; Miyake, N.; Oka, T.; Yachimura, T. The homogenization method for topology optimization of structures: Old and new. Interdiscip. Inf. Sci. 2019, 25, 75–146. [Google Scholar] [CrossRef]
  32. Li, K.; Zhan, J.; Yang, T.; To, A.C.; Tan, S.; Tang, Q.; Cao, H.; Murr, L.E. Homogenization timing effect on microstructure and precipitation strengthening of 17–4PH stainless steel fabricated by laser powder bed fusion. Addit. Manuf. 2022, 52, 102672. [Google Scholar] [CrossRef]
  33. Ntintakis, I.; Stavroulakis, G.E. Infill Microstructures for Additive Manufacturing. Appl. Sci. 2022, 12, 7386. [Google Scholar] [CrossRef]
  34. Park, S.I.; Rosen, D.W. Homogenization of mechanical properties for material extrusion periodic lattice structures considering joint stiffening effects. J. Mech. Des. 2018, 140, 111414. [Google Scholar] [CrossRef]
  35. Bendsøe, M.P.; Kikuchi, N. Generating optimal topologies in structural design using a homogenization method. Comput. Methods Appl. Mech. Eng. 1988, 71, 197–224. [Google Scholar] [CrossRef]
  36. Zhu, B.; Skouras, M.; Chen, D.; Matusik, W. Two-scale topology optimization with microstructures. AACM Trans. Graph. (TOG) 2017, 36, 1. [Google Scholar] [CrossRef]
  37. Chen, W.; Tong, L.; Liu, S. Concurrent topology design of structure and material using a two-scale topology optimization. Comput. Struct. 2017, 178, 119–128. [Google Scholar] [CrossRef]
  38. Wu, J.; Wang, C.C.; Zhang, X.; Westermann, R. Self-supporting rhombic infill structures for additive manufacturing. Comput. Aided Des. 2016, 80, 32–42. [Google Scholar] [CrossRef]
  39. Li, D.; Dai, N.; Tang, Y.; Dong, G.; Zhao, Y.F. Design and optimization of graded cellular structures with triply periodic level surface-based topological shapes. J. Mech. Des. 2019, 141, 071402. [Google Scholar] [CrossRef]
  40. Von Schnering, H.; Nesper, R. Nodal surfaces of Fourier series: Fundamental invariants of structured matter. Z. für Phys. B Condens. Matter 1991, 83, 407–412. [Google Scholar] [CrossRef]
  41. Engquist, B.; Souganidis, P.E. Asymptotic and numerical homogenization. Acta Numerica 2008, 17, 147–190. [Google Scholar] [CrossRef]
  42. Sánchez-Palencia, E. Non-homogeneous media and vibration theory. Lect. Notes Phys. 1980, 127. [Google Scholar]
  43. Lopes, B.; Arruda, M.; Almeida-Fernandes, L.; Castro, L.; Silvestre, N.; Correia, J. Assessment of mesh dependency in the numerical simulation of compact tension tests for orthotropic materials. Compos. Part C: Open Access 2020, 1, 100006. [Google Scholar] [CrossRef]
  44. Ashby, M.F. The properties of foams and lattices. Philos. Trans. R. Soc. A: Mathematical. Phys. Eng. Sci. 2006, 364, 15–30. [Google Scholar] [CrossRef] [PubMed]
  45. Chandrupatla, T.R.; Belegundu, A.D.; Ramesh, T.; Ray, C. Introduction to Finite Elements in Engineering; Cambridge University Press: Cambridge, UK, 2002; Volume 10. [Google Scholar]
  46. Shiakolas, P.; Nambiar, R.; Lawrence, K.; Rogers, W. Closed-form stiffness matrices for the linear strain and quadratic strain tetrahedron finite elements. Comput. Struct. 1992, 45, 237–242. [Google Scholar] [CrossRef]
  47. Wu, J.; Dick, C.; Westermann, R. A system for high-resolution topology optimization. IEEE Trans. Vis. Comput. Graph. 2015, 22, 1195–1208. [Google Scholar] [CrossRef] [PubMed]
  48. Bruns, T. A reevaluation of the SIMP method with filtering and an alternative formulation for solid–void topology optimization. Struct. Multidiscip. Optim. 2005, 30, 428–436. [Google Scholar] [CrossRef]
  49. Rastegarzadeh, S.; Wang, J.; Huang, J. Two-Scale Topology Optimization with Parameterized Cellular Structures. In Proceedings of the International Design Engineering Technical Conferences and Computers and Information in Engineering Conference, American Society of Mechanical Engineers, Virtual, Online, 17–19 August 2020; Volume 84003, p. V002T02A046. [Google Scholar]
  50. Maas, S.A.; Ellis, B.J.; Ateshian, G.A.; Weiss, J.A. FEBio: Finite elements for biomechanics. J. Biomech. Eng. 2012, 134, 011005. [Google Scholar] [CrossRef] [Green Version]
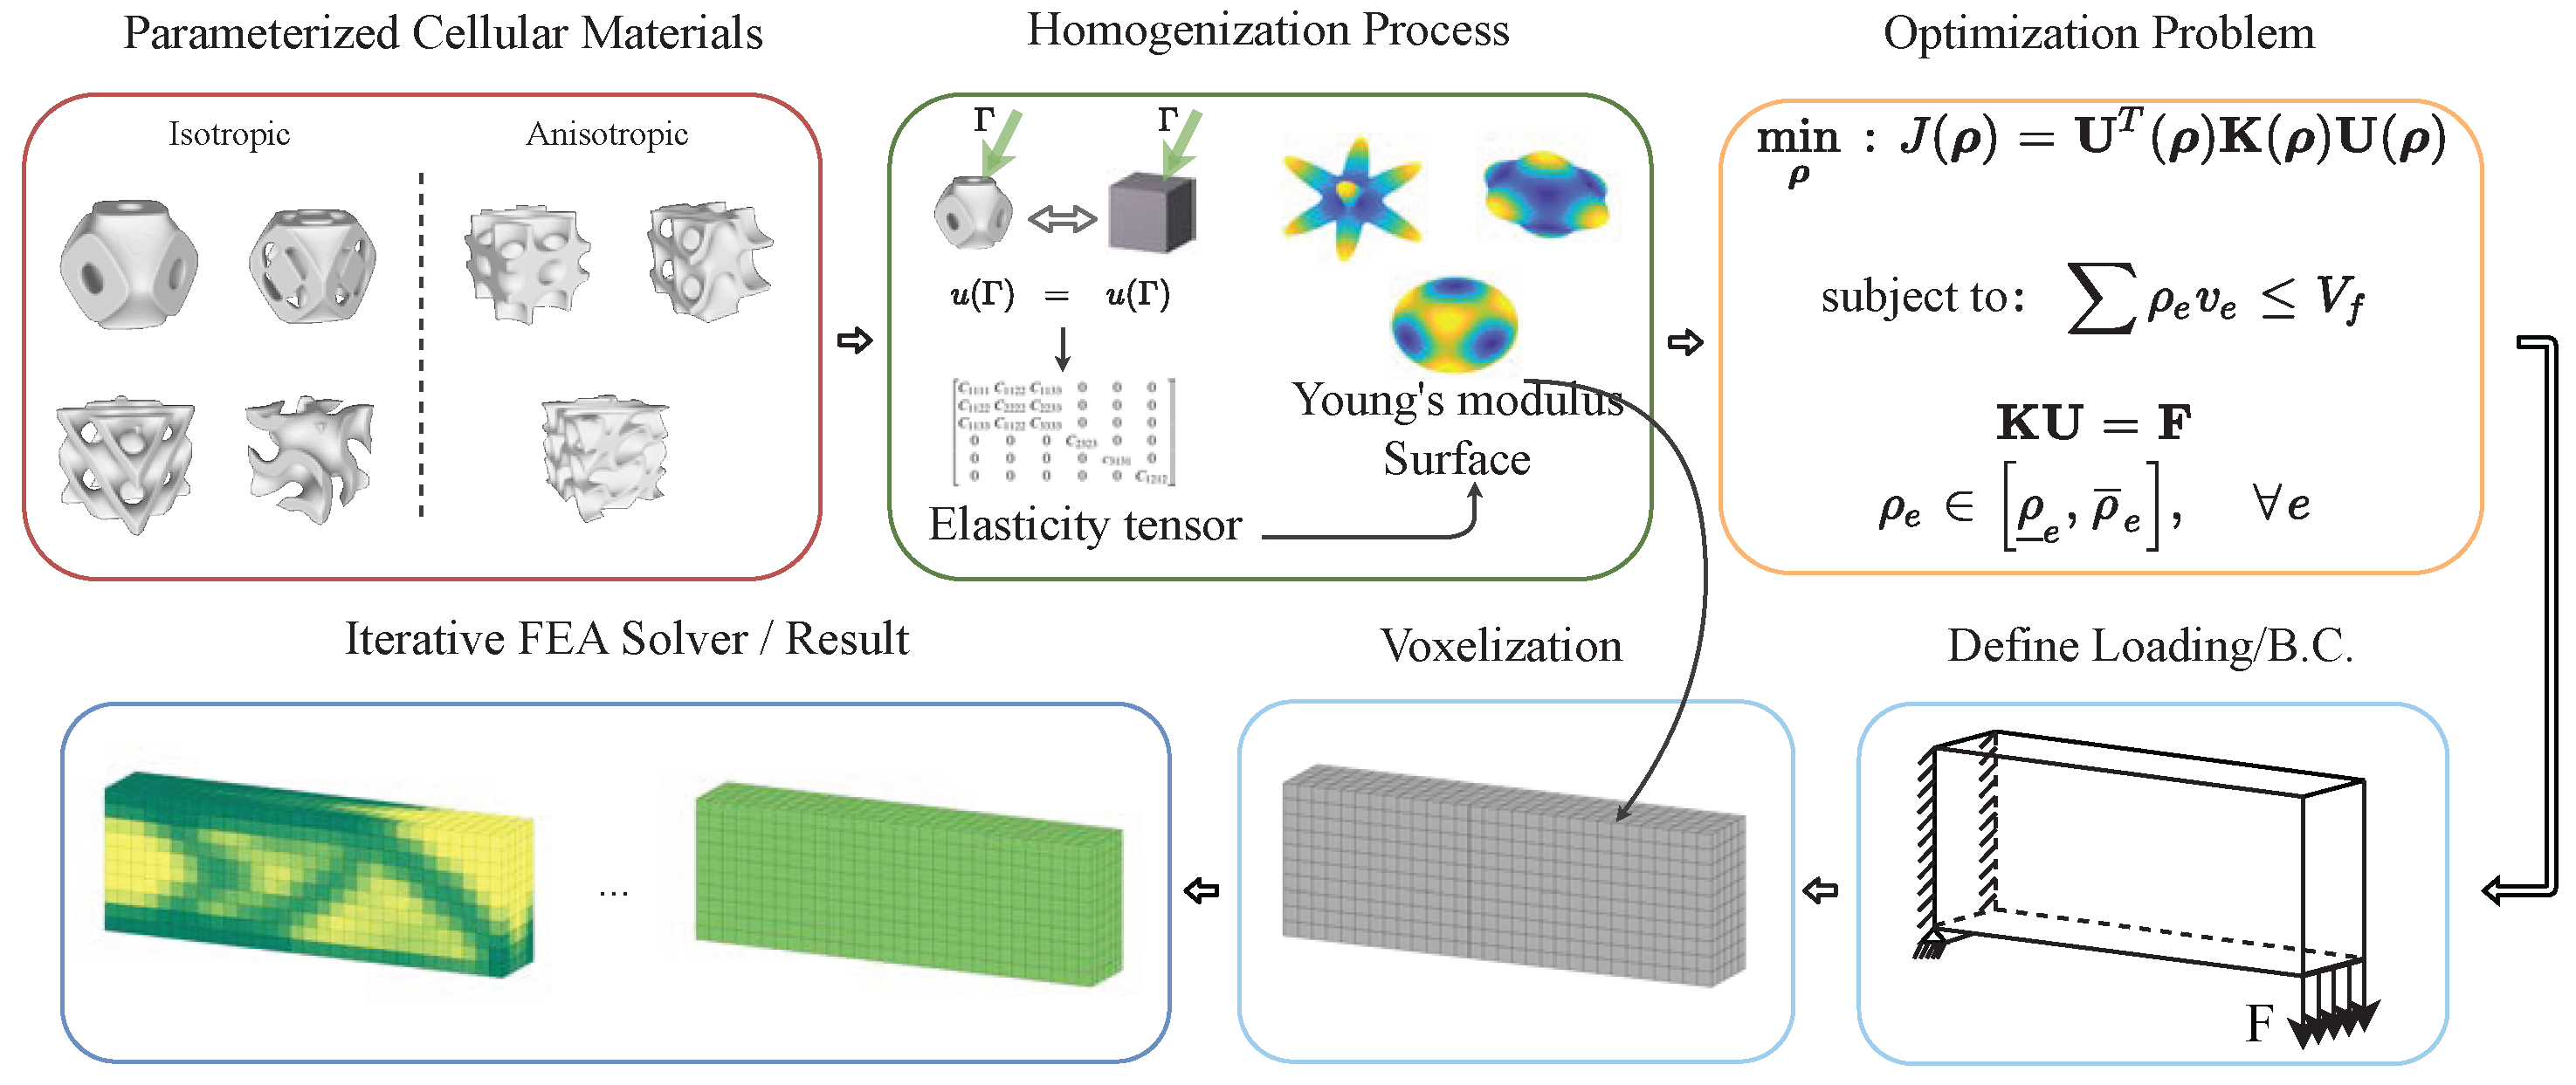
Figure 1. Flowchart of structural design optimization with isotropic/orthotropic microstructures.
Designs 06 00073 g001
Figure 2. The red surface corresponds to the base surface ( t = 0 ), and the black and grey color has been assigned to surfaces with ( t = + a ) and ( t = a ) offsets, respectively. The yellow sphere shell is the volume trapped between t = [ a , + a ] .
Designs 06 00073 g002
Figure 3. Primitive cellular structure scaling laws [39]: ρ F P = 0.058 × t 2 + 0.269 × t + 0.575 , 1.513 t 3.12 . The material volume can be adjusted by changing the level parameter t.
Designs 06 00073 g003
Figure 4. Convergence and mesh independence. (a) Density filter with linear interpolation in y-directions; (b) F P before applying density filter.
Designs 06 00073 g004
Figure 5. Elasticity tensor scaling laws for three orthotropic cellular materials, each orthotropic material has nine independent elements in its elasticity tensor. Each row belongs to one of the cellular materials shown in the left columns.
Designs 06 00073 g005
Figure 6. The overlap at the surface interface of two neighboring microstructures. (a,b) the surface area of two random neighboring microstructure at their interface plane, (c) overlaying of the two surfaces, (d) Intersection surface of two surfaces.
Designs 06 00073 g006
Figure 7. Interface smoothing of adjacent microstructures with variant design-parameter ( ρ e ). (a) Density filter with linear interpolation in y-directions. (b) F P before smoothing. (c) F P after smoothing. (d) F 1 before smoothing. (e) F 1 after smoothing.
Designs 06 00073 g007
Figure 8. Four structure design benchmark testing problems.
Designs 06 00073 g008
Figure 9. Density distribution of (a) orthotropic cellular material, and (b) isotropic cellular material in benchmark Case I. Right column represents the effective Young’s modulus surface for each one of the microstructures.
Designs 06 00073 g009
Figure 10. Rotating orthotropic cellular material compared with isotropic material.
Designs 06 00073 g010
Figure 11. Final optimized structures and their compliance values with different microstructures properties and comparison results with other TO methods: (ac): three benchmark problems ( F = 1 in all three cases); (dl): optimal structure of the two-scale TO method [49] with isotropic and orthotropic microstructures; (mr): optimal structures using multi-scale [25] and SIMP methods, respectively.
Designs 06 00073 g011
Figure 12. Optimal results of Case IV (L-shape Structure) with two different cellular material architectures: (a) Boundary condition and loading, (b) Optimized structure (compliance = 840 ) with orthotropic cellular material F 1 , (c) Optimum structure (compliance =1130) with isotropic cellular material F W .
Designs 06 00073 g012
Figure 13. Max-Displacement/Load plot comparison between asymptotic homogenization and finite element analysis results for both optimized and uniform structure.
Designs 06 00073 g013
Figure 14. FEA simulation results with F 1 microstructure ( F = 3 K N ).
Designs 06 00073 g014
Figure 15. Stanford bunny model: (a) boundary condition and loading, (b) optimization result using isotropic ( F D ) cellular material.
Designs 06 00073 g015
Figure 16. Armadillo model: (a) boundary condition and loading, (b) optimization result using orthotropic ( F 3 ) cellular materials.
Designs 06 00073 g016
Figure 17. The change of structural compliance with the reduce of the structure’s weight using isotropic and orthotropic cellular materials.
Designs 06 00073 g017
Table 1. Scaling law constants for orthotropic cellular materials.
F 1 F 2 F 3
b 1 b 2 b 3 b 1 b 2 b 3 b 1 b 2 b 3
C 1111 / C 1111 1.3611 2.6083 0.0049 1.3299 2.1798 0.0196 1.3385 2.0672 0.0052
C 2222 / C 2222 1.3658 2.0782 0.0170 1.3593 2.6396 0.0044 1.3908 2.9141 0.0204
C 3333 / C 3333 1.3612 2.6076 0.0049 1.3593 2.6396 0.0044 1.3443 2.8745 0.0078
C 2323 / C 2323 0.3952 1.8548 0.0090 0.3940 1.8536 0.0083 0.3985 2.1820 0.0092
C 3131 / C 3131 0.3952 1.8549 0.0090 0.3766 1.8777 0.0064 0.3942 2.1902 0.0077
C 1212 / C 1212 0.3911 1.7194 0.0099 0.3940 1.8537 0.0083 0.3952 1.6769 0.0129
C 2233 / C 2233 0.5712 2.7624 0.0012 0.5578 2.9993 0.0182 0.5764 3.3822 0.0025
C 1133 / C 1133 0.5596 2.6526 0.0049 0.5578 2.9993 0.0182 0.5503 3.1364 0.0197
C 1122 / C 1122 0.5712 2.7623 0.0012 0.5350 3.1039 0.0375 0.5672 3.3762 0.0062
Table 2. Minimum microstructure feature size based on the printer resolution.
Printer xy - Res. (mm)Max. Res.n-RangeFeature Size (mm)
ANYCUBIC
(Photon Mono X)
5.0 100 [ 20 , 100 ] 0.05
150 [ 20 , 150 ] 7.5
200 [ 20 , 200 ] 10.0
Creality
(Halot-One Plus)
0.04 100 [ 20 , 100 ] 4.0
150 [ 20 , 150 ] 6.0
200 [ 20 , 200 ] 8.0
Table 3. Improvement in the structure’s stiffness by rotating the microstructures.
Orthotropic ( F 2 )Isotropic ( F P )
Rotation 0 x- 90 z- 90 0
Comp.1884144117931844
Imp. 2.2 % 28 % 2.76 % -
Table 4. Convergence time comparison of different topology optimization methods. Best results are specified by bold font.
Two-ScaleMulti-Scale [25]
No. of Elements (Total) 5 × 10 6 1.2 × 10 7 1.9 × 10 8 1.2 × 10 7
No. of Elements (Micro) 15 3 20 3 50 3 20 3
No. of Elements (Macro)1500150015001500
Compliance 147.9 141.2 134.5 189.7
Time to Converge (s)141140141386
Table 5. Structural performance comparison of different TO methods on four benchmark cases.
Case ICase IICase IIICase IV
No. of Elements (Total) 1.2 × 10 7 1.2 × 10 7 1.2 × 10 7 9.1 × 10 8
SIMP Compliance359.42647.2170.62204.4
multi-scale [25] Compliance251.32126.7135.82017.9
Two-Scale (isotropic F P ) Compliance234.31726.8129.81895.1
Two-Scale (orthotropic F 1 ) Compliance172.11378.4104.31623.4
Improvement to SIMP 52 % 48 % 39 % 26 %
Table 6. Resolution and convergence time of the proposed framework in two applications.
BunnyArmadillo
No. of Elements (Total) 1.05 × 10 10 1.32 × 10 10
No. of Elements (Micro) 50 3 50 3
No. of Elements (Macro)83,942106,260
Time to Converge (min)4464
Publisher’s Note: MDPI stays neutral with regard to jurisdictional claims in published maps and institutional affiliations.