Physiological, Psychological and Performance-Related Changes Following Physique Competition: A Case-Series


Abstract
1. Introduction
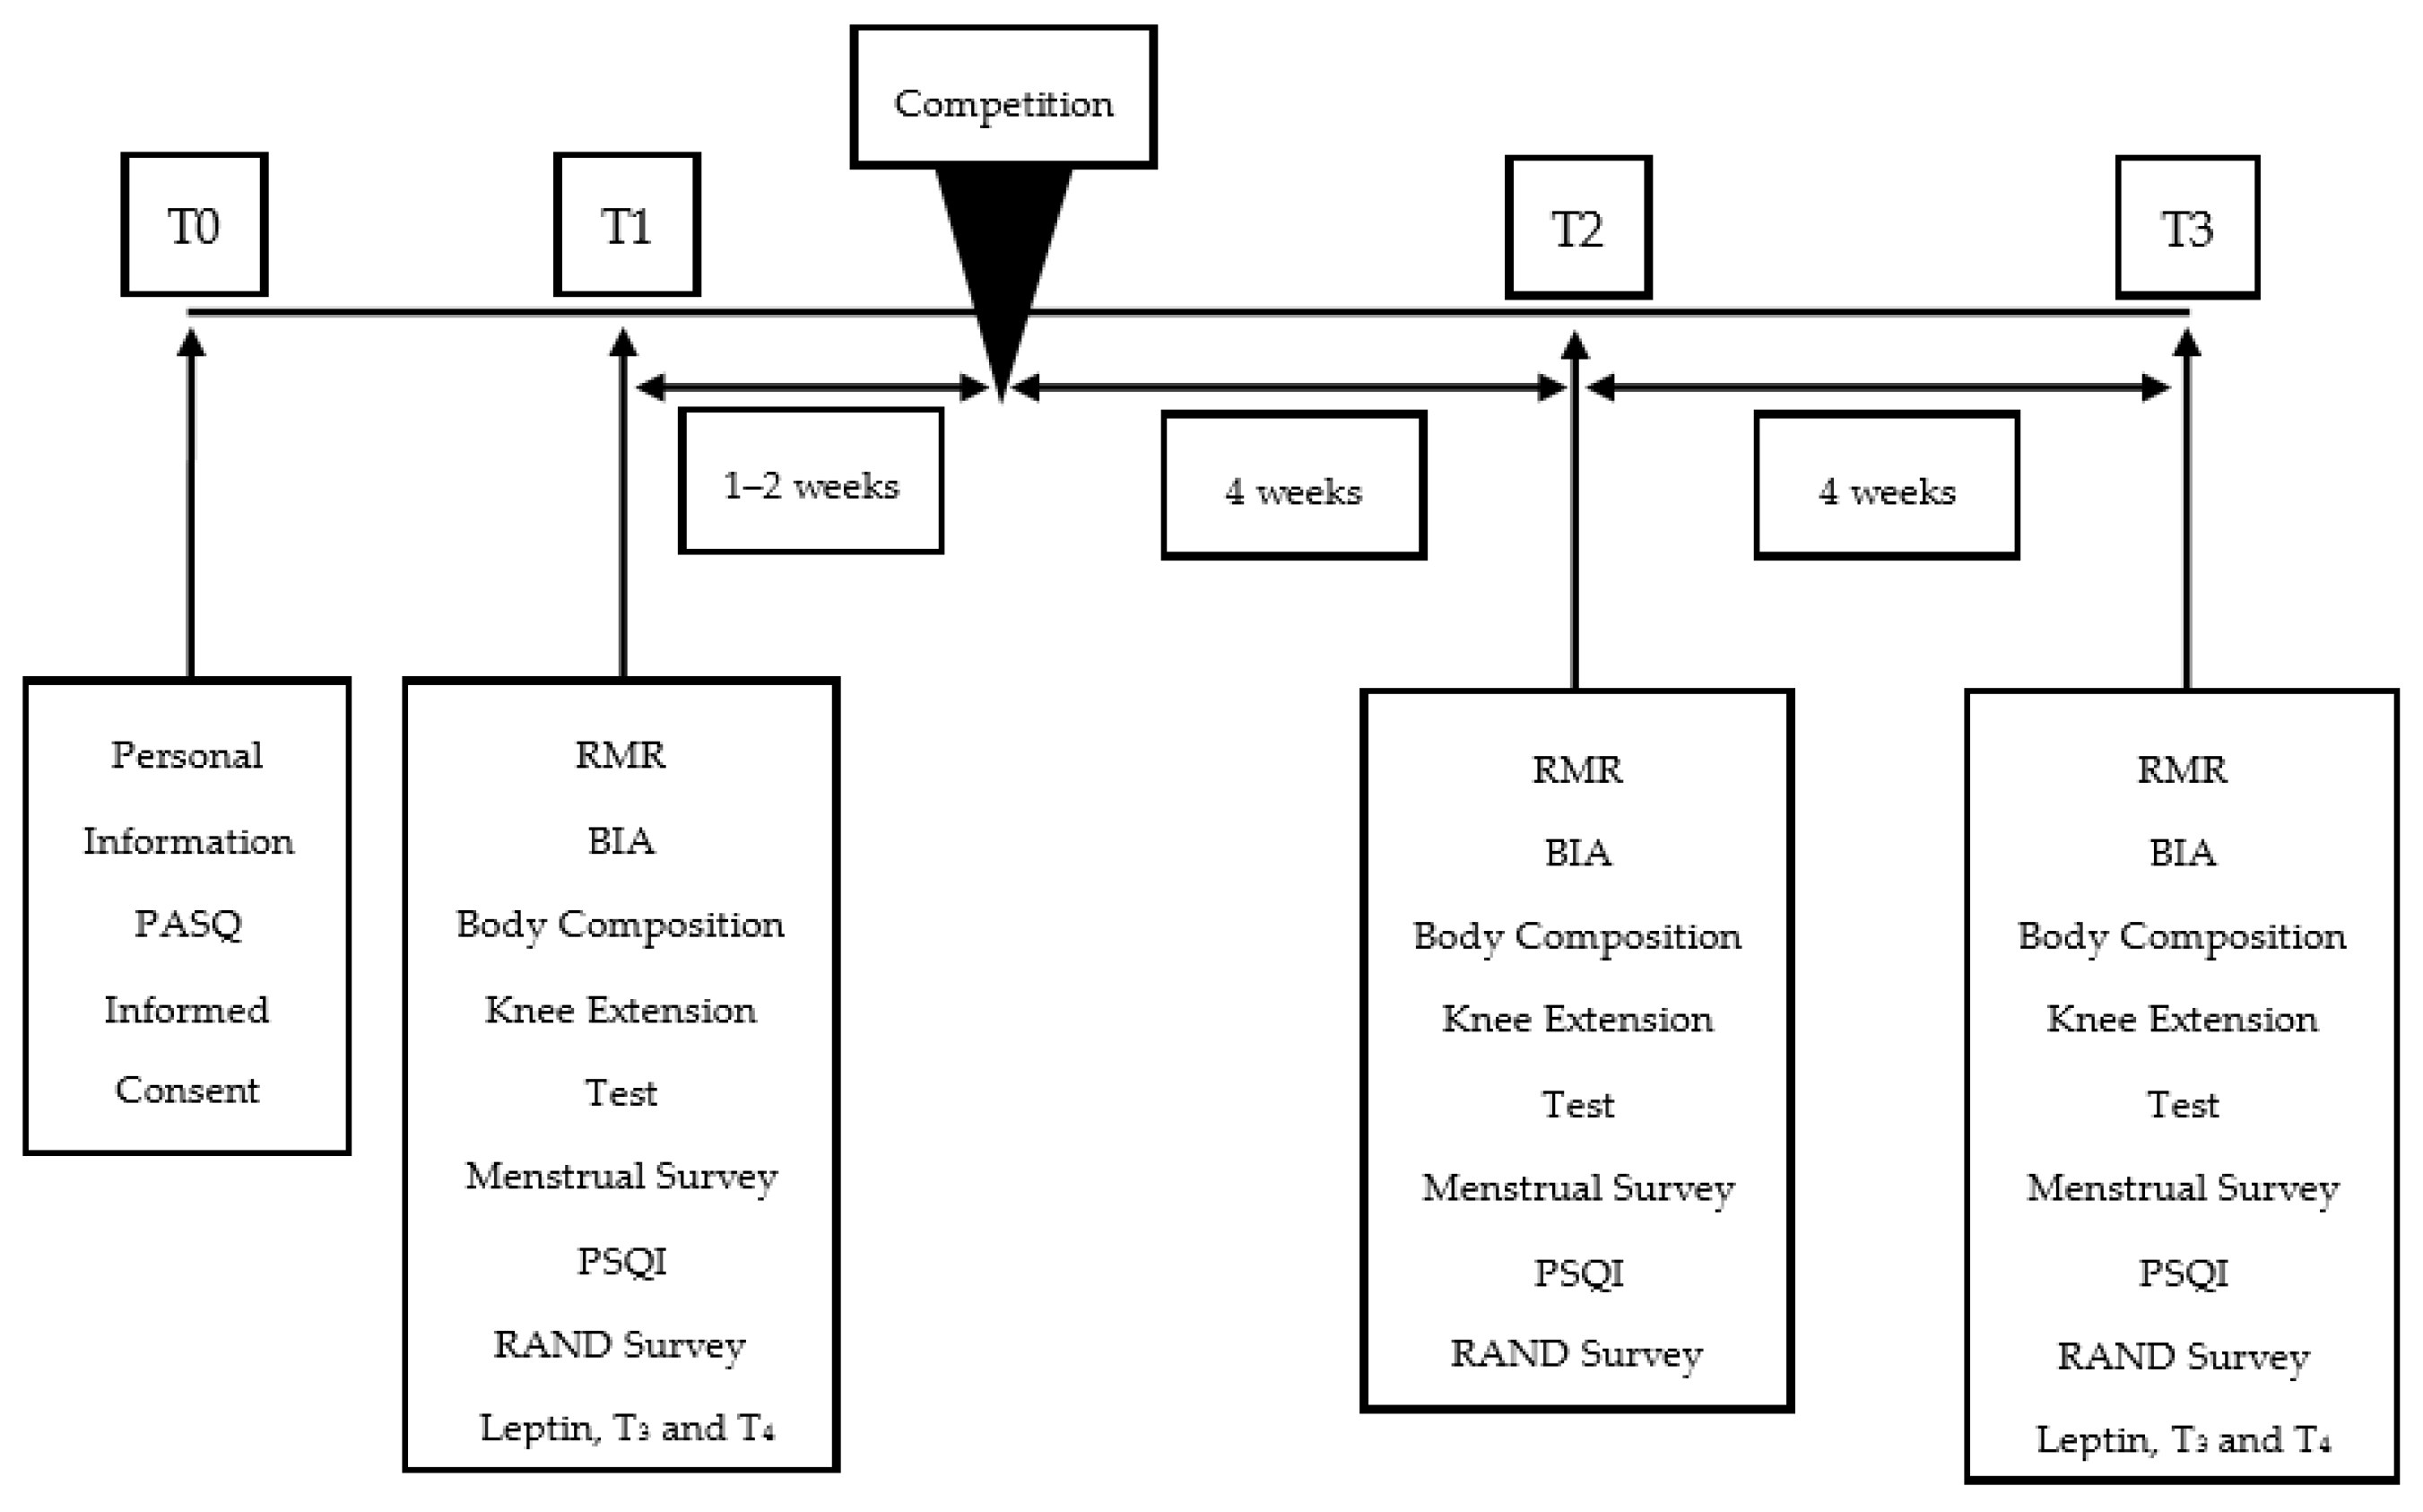
2. Materials and Methods
2.1. Competitor Assessment
2.2. Body Weight and Body Water Assessment
2.3. Assessment of Body Composition
2.4. Assessment of Sleep, Quality of Life Measures and Menstrual Cycle
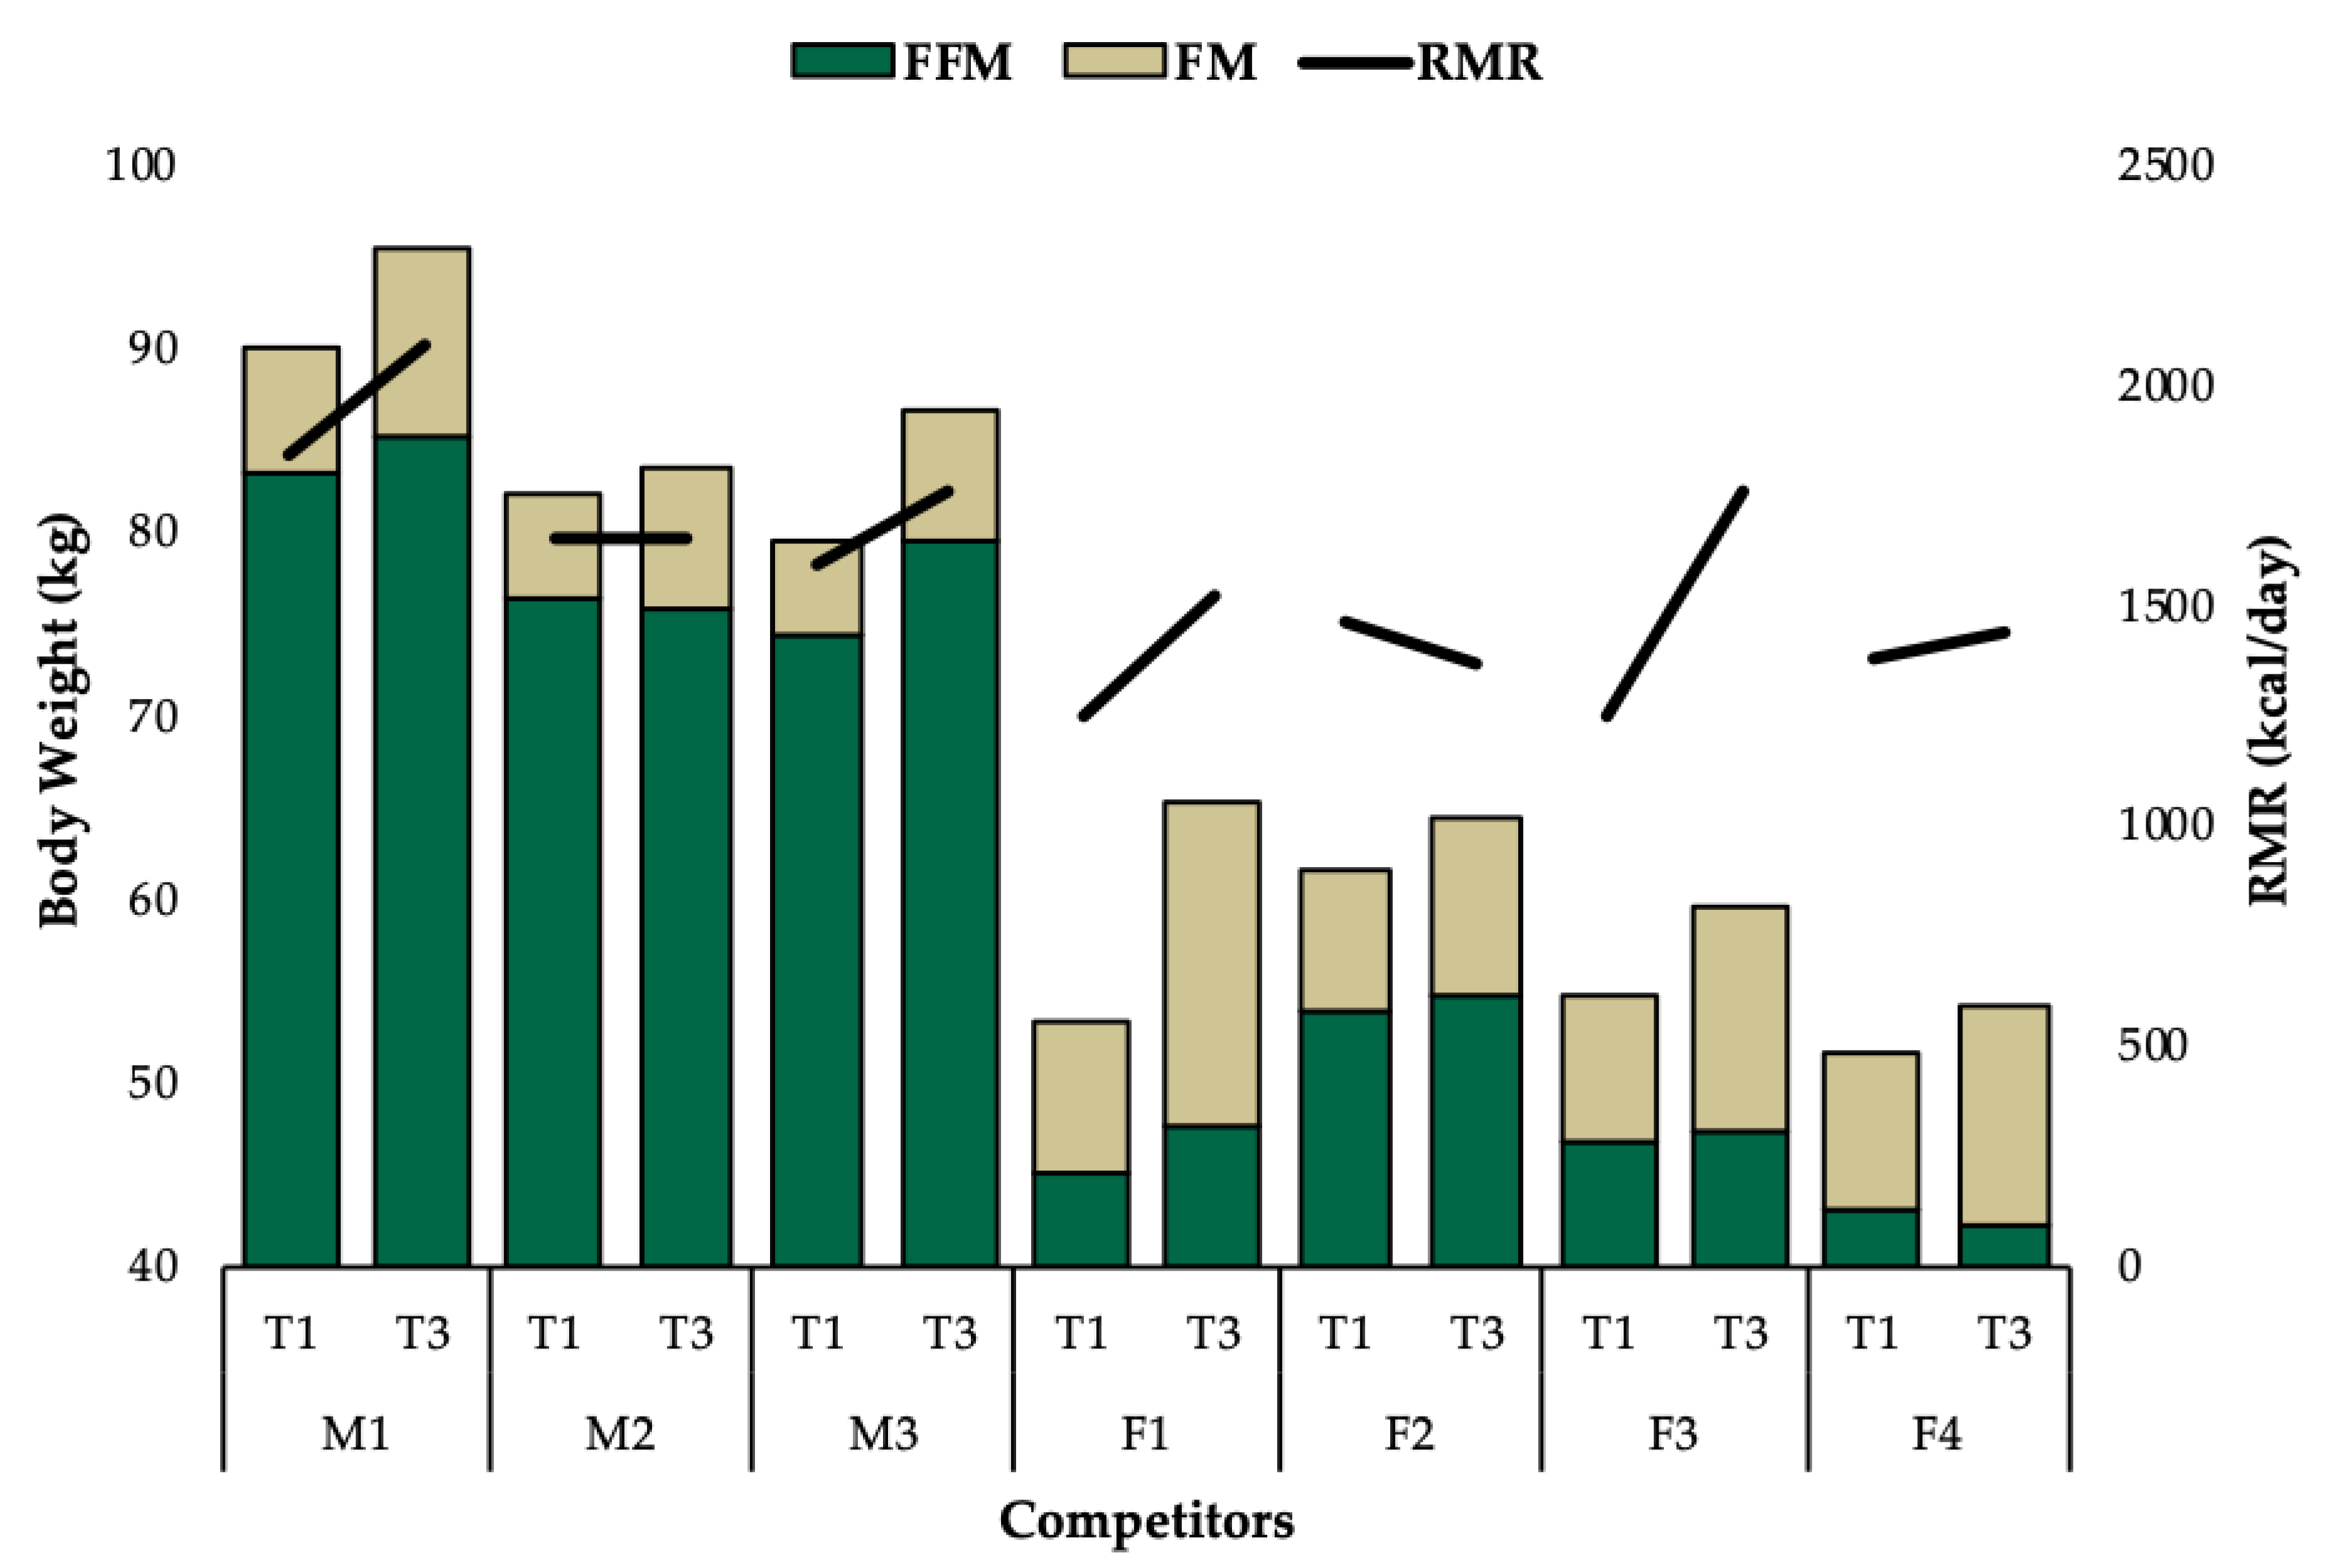
2.5. Assessment of Metabolic Rate
2.6. Assessment of Knee Extension Performance
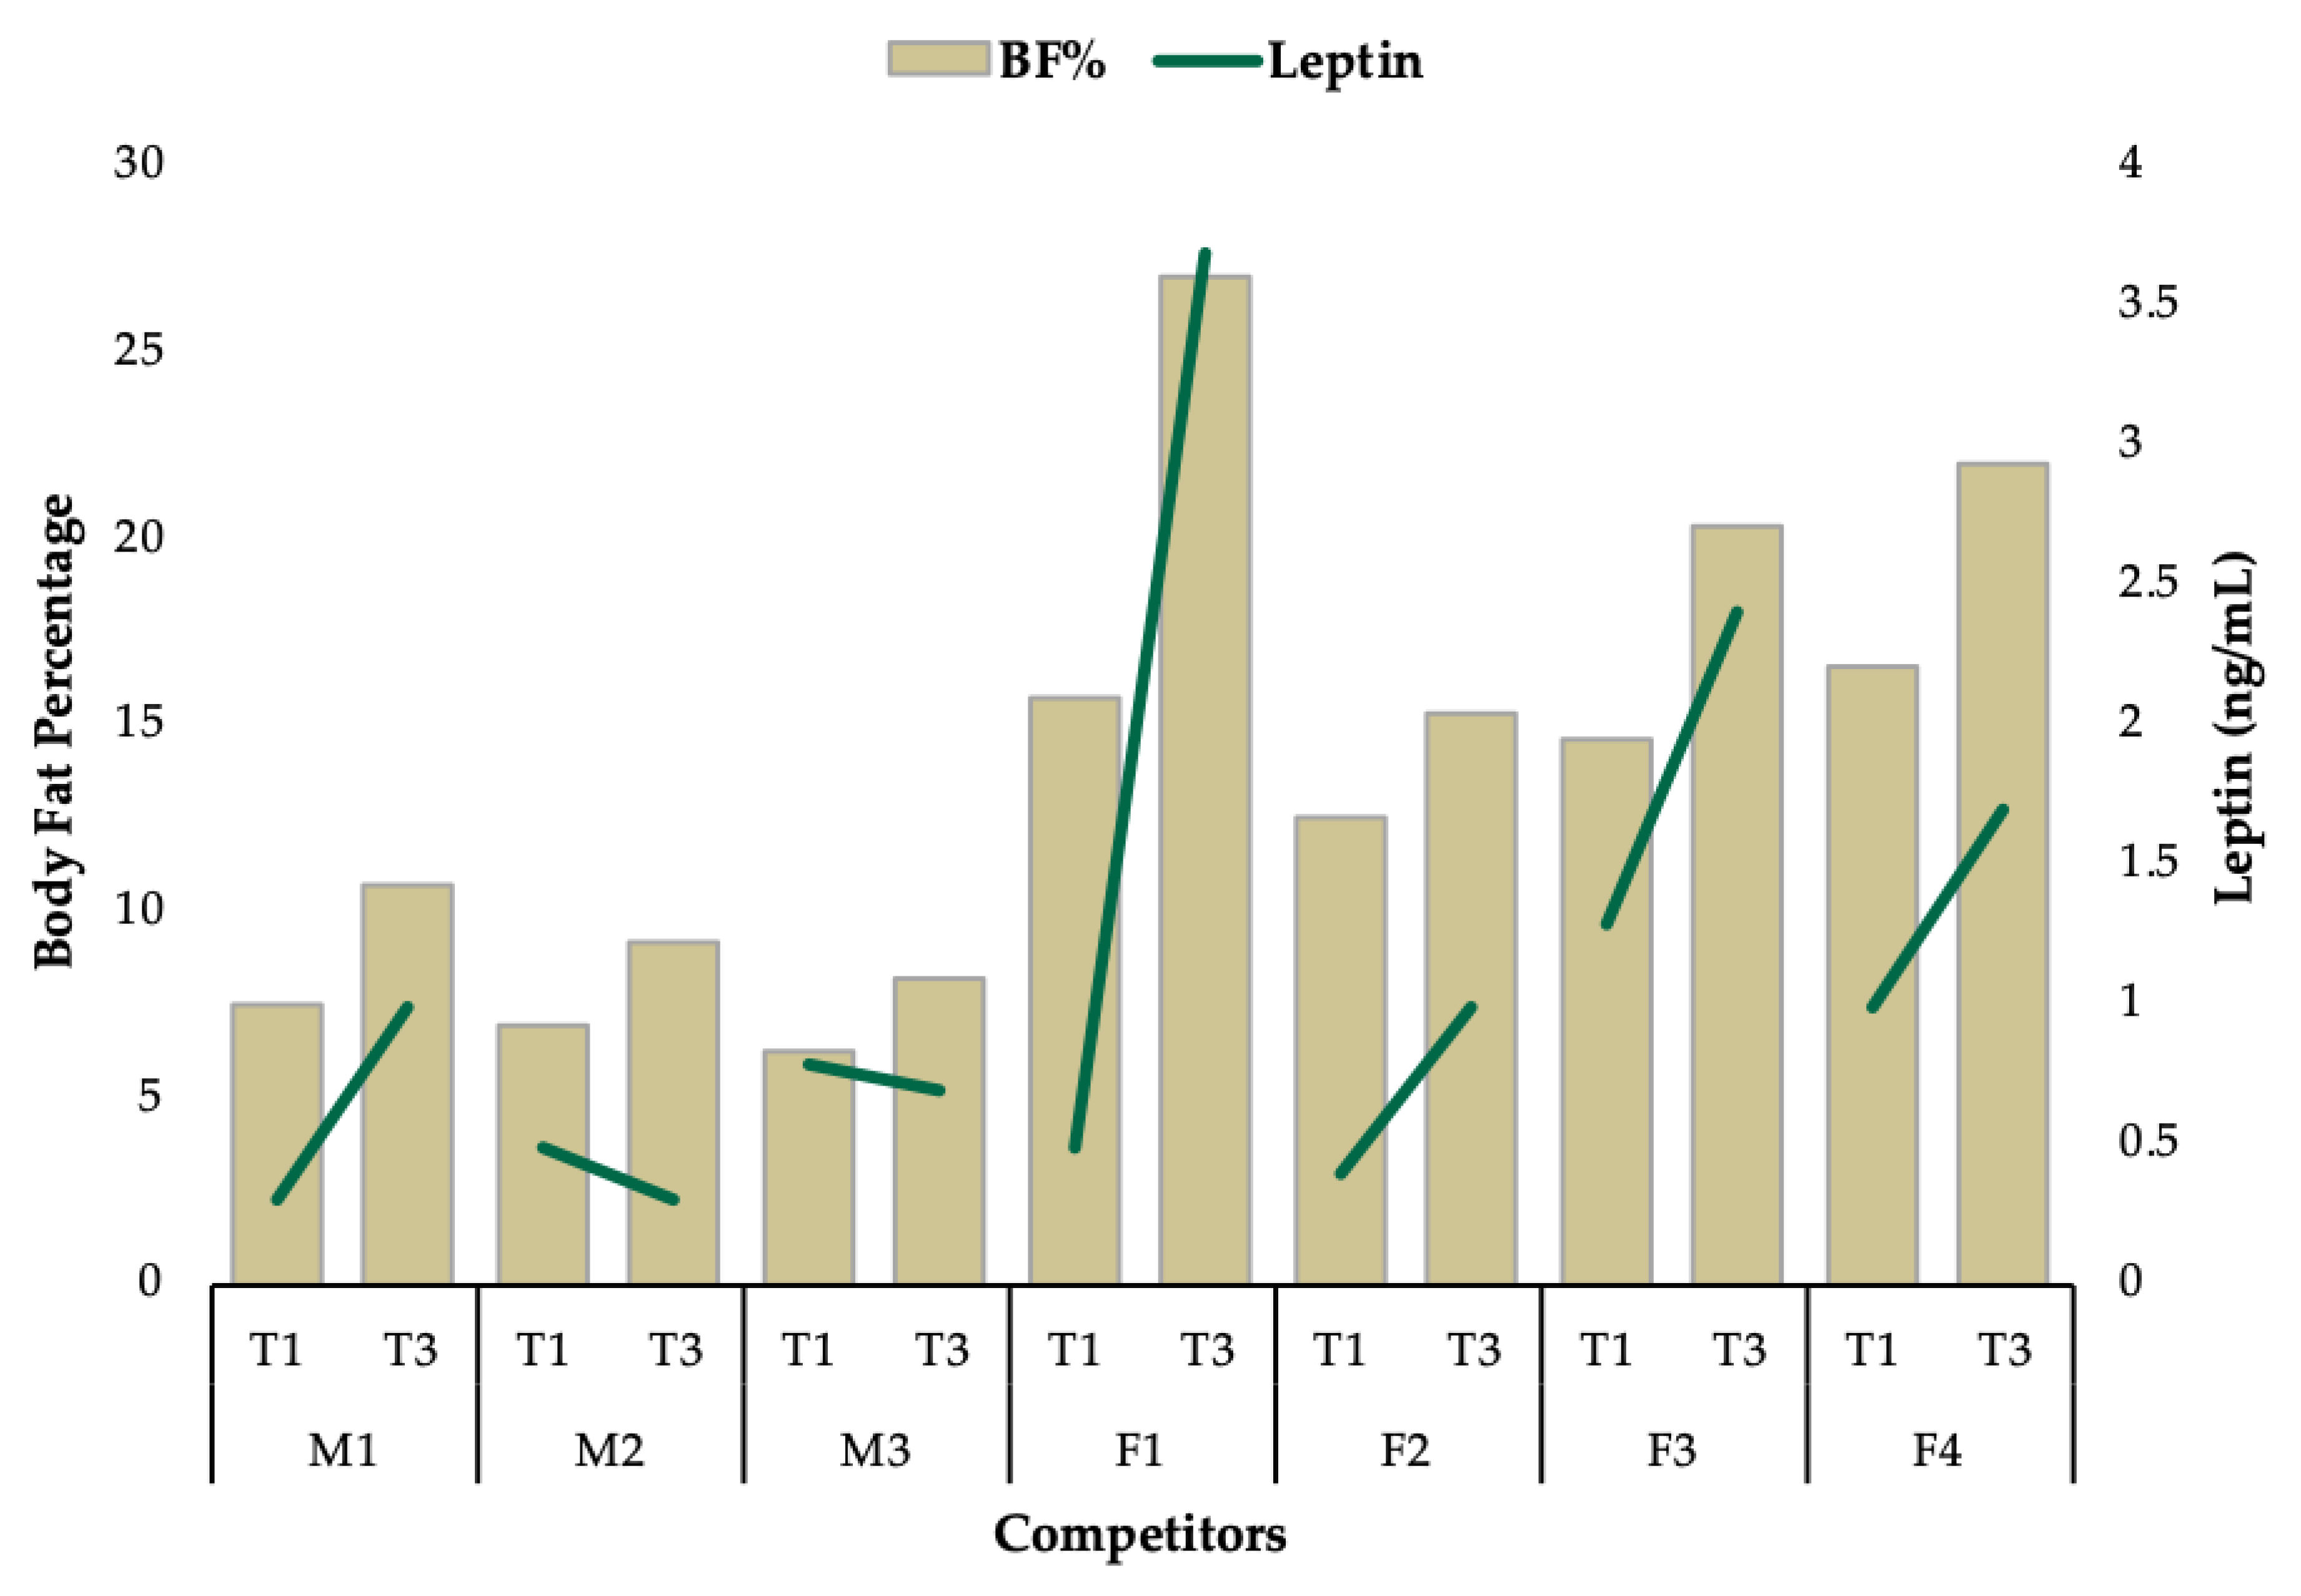
2.7. Assessment of Blood Hormones
2.8. Nutritional Approach
2.9. Statistical Analysis
3. Results
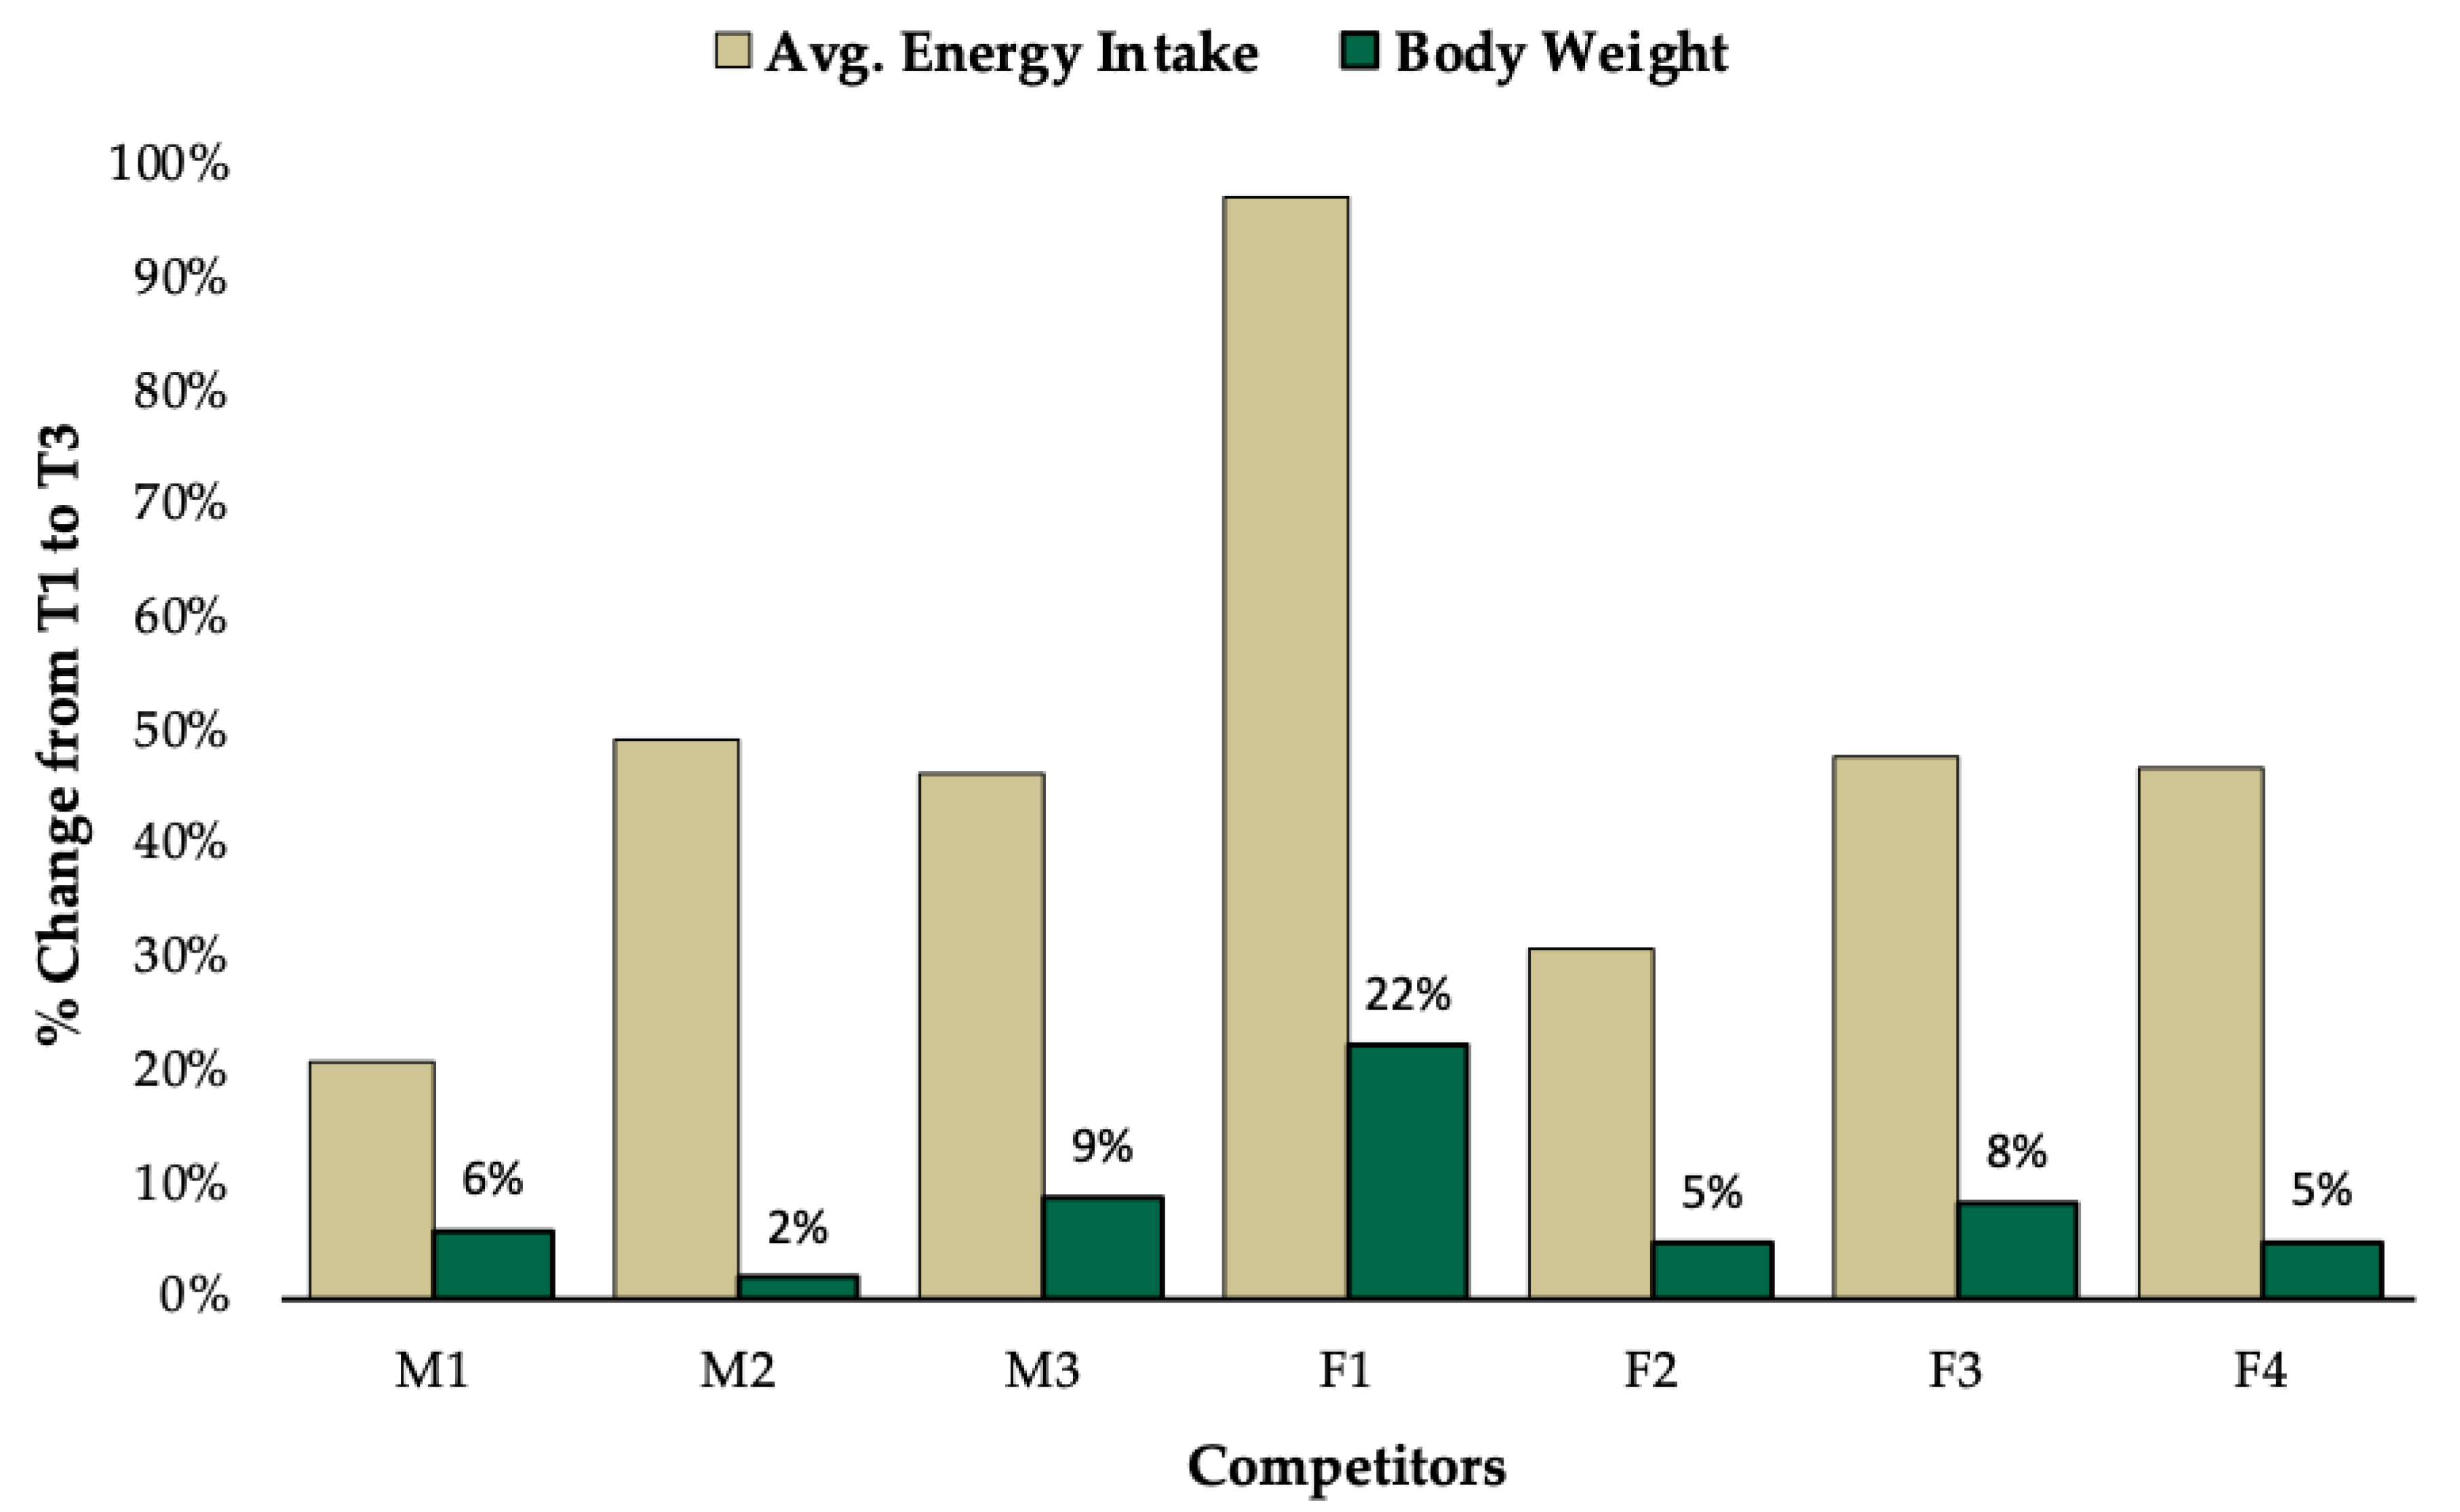
3.1. Group Level Observations
3.2. Individual Data
4. Discussion
5. Conclusions
Author Contributions
Funding
Acknowledgments
Conflicts of Interest
Appendix A

| Time Point | ||||
|---|---|---|---|---|
| T1 | T3 | T1–T3 Change | ||
| Male 1 | ||||
| Diet Composition | Carbohydrate (g/day) | 270 | 355 | 85 |
| Carbohydrate (g/kg/day) | 3.0 | 3.7 | 0.7 | |
| Protein (g/day) | 247 | 220 | −27 | |
| Protein (g/kg/day) | 2.7 | 2.3 | −0.4 | |
| Fat (g/day) | 50 | 83 | 33 | |
| Fat (g/kg/day) | 0.6 | 0.9 | 0.3 | |
| Total Calories (kcal/day) | 2518 | 3047 | 529 | |
| Total Calories (kcal/kg/day) | 90.2 | 31.9 | −58.3 | |
| Male 2 | ||||
| Diet Composition | Carbohydrate (g/day) | 191 | 381 | 190 |
| Carbohydrate (g/kg/day) | 2.3 | 4.5 | 2.2 | |
| Protein (g/day) | 235 | 215 | −20 | |
| Protein (g/kg/day) | 2.9 | 2.6 | −0.3 | |
| Fat (g/day) | 44.0 | 82.0 | 38.0 | |
| Fat (g/kg/day) | 0.5 | 1.0 | 0.4 | |
| Total Calories (kcal/day) | 2095 | 3128 | 1033 | |
| Total Calories (kcal/kg/day) | 25.5 | 37.3 | 11.9 | |
| Male 3 | ||||
| Diet Composition | Carbohydrate (g/day) | 186 | 320 | 134 |
| Carbohydrate (g/kg/day) | 2.3 | 3.7 | 1.4 | |
| Protein (g/day) | 224 | 291 | 67 | |
| Protein (g/kg/day) | 2.8 | 3.4 | 0.5 | |
| Fat (g/day) | 50 | 69 | 19 | |
| Fat (g/kg/day) | 0.6 | 0.8 | 0.2 | |
| Total Calories (kcal/day) | 2081 | 3052 | 971 | |
| Total Calories (kcal/kg/day) | 26.1 | 35.2 | 9.0 | |
| Female 1 | ||||
| Diet Composition | Carbohydrate (g/day) | 73 | 254 | 181 |
| Carbohydrate (g/kg/day) | 1.4 | 3.9 | 2.5 | |
| Protein (g/day) | 131 | 131 | 0 | |
| Protein (g/kg/day) | 2.4 | 2.0 | −0.4 | |
| Fat (g/day) | 39 | 87 | 48 | |
| Fat (g/kg/day) | 0.7 | 1.3 | 0.6 | |
| Total Calories (kcal/day) | 1163 | 2295 | 1132 | |
| Total Calories (kcal/kg/day) | 21.7 | 35.0 | 13.3 | |
| Female 2 | ||||
| Diet Composition | Carbohydrate (g/day) | 96 | 147 | 51 |
| Carbohydrate (g/kg/day) | 1.6 | 2.3 | 0.7 | |
| Protein (g/day) | 148 | 153 | 5 | |
| Protein (g/kg/day) | 2.4 | 2.4 | 0.0 | |
| Fat (g/day) | 33 | 53 | 20 | |
| Fat (g/kg/day) | 0.5 | 0.8 | 0.3 | |
| Total Calories (kcal/day) | 1273 | 1671 | 398 | |
| Total Calories (kcal/kg/day) | 20.6 | 25.8 | 5.2 | |
| Female 3 | ||||
| Diet Composition | Carbohydrate (g/day) | 76 | 172 | 96 |
| Carbohydrate (g/kg/day) | 1.4 | 2.9 | 1.5 | |
| Protein (g/day) | 127 | 144 | 17 | |
| Protein (g/kg/day) | 2.3 | 2.4 | 0.1 | |
| Fat (g/day) | 40 | 53 | 13 | |
| Fat (g/kg/day) | 0.7 | 0.9 | 0.2 | |
| Total Calories (kcal/day) | 1173 | 1739 | 566 | |
| Total Calories (kcal/kg/day) | 21.3 | 29.1 | 7.8 | |
| Female 4 | ||||
| Diet Composition | Carbohydrate (g/day) | 45 | 95 | 50 |
| Carbohydrate (g/kg/day) | 0.9 | 1.7 | 0.9 | |
| Protein (g/day) | 135 | 135 | 0 | |
| Protein (g/kg/day) | 2.6 | 2.5 | −0.1 | |
| Fat (g/day) | 26 | 53 | 27 | |
| Fat (g/kg/day) | 0.5 | 1.0 | 0.5 | |
| Total Calories (kcal/day) | 951 | 1396 | 445 | |
| Total Calories (kcal/kg/day) | 18.4 | 25.6 | 7.3 | |
| T1 | T2 | T3 | T1–T3 Change | ||
|---|---|---|---|---|---|
| Male 1 | |||||
| PSQI | Global Score | 3 | 3 | 3 | 0 |
| RAND 36-Item Health Survey 1.0 | Energy/fatigue | 60 | 60 | 90 | 30 |
| Emotional Well-Being | 96 | 84 | 88 | −8 | |
| Social Functioning | 75 | 100 | 100 | 25 | |
| Male 2 | |||||
| PSQI | Global Score | 4 | 9 | 6 | 2 |
| RAND 36-Item Health Survey 1.0 | Energy/fatigue | 55 | 75 | 65 | 10 |
| Emotional Well-Being | 76 | 100 | 92 | 16 | |
| Social Functioning | 100 | 87.5 | 50 | −50 | |
| Male 3 | |||||
| PSQI | Global Score | 6 | 3 | 2 | −4 |
| RAND 36-Item Health Survey 1.0 | Energy/fatigue | 65 | 75 | 85 | 20 |
| Emotional Well-Being | 92 | 92 | 92 | 0 | |
| Social Functioning | 100 | 100 | 100 | 0 | |
| Female 1 | |||||
| PSQI | Global Score | 9 | 5 | 6 | −3 |
| RAND 36-Item Health Survey 1.0 | Energy/fatigue | 30 | 75 | 65 | 35 |
| Emotional Well-Being | 84 | 92 | 92 | 8 | |
| Social Functioning | 87.5 | 100 | 100 | 12.5 | |
| Female 2 | |||||
| PSQI | Global Score | 9 | 9 | 4 | −5 |
| RAND 36-Item Health Survey 1.0 | Energy/fatigue | 55 | 60 | 80 | 25 |
| Emotional Well-Being | 84 | 60 | 80 | −4 | |
| Social Functioning | 50 | 62.5 | 100 | 50 | |
| Female 3 | |||||
| PSQI | Global Score | 16 | 7 | 6 | −10 |
| RAND 36-Item Health Survey 1.0 | Energy/fatigue | 10 | 30 | 65 | 55 |
| Emotional Well-Being | 48 | 56 | 68 | 20 | |
| Social Functioning | 12.5 | 75 | 100 | 87.5 | |
| Female 4 | |||||
| PSQI | Global Score | 8 | 4 | 5 | −3 |
| RAND 36-Item Health Survey 1.0 | Energy/fatigue | 45 | 70 | 70 | 25 |
| Emotional Well-Being | 64 | 80 | 80 | 16 | |
| Social Functioning | 62.5 | 100 | 87.5 | 25 |
References
- Helms, E.R.; Zinn, C.; Rowlands, D.S.; Brown, S.R. A systematic review of dietary protein during caloric restriction in resistance trained lean athletes: A case for higher intakes. Int. J. Sport Nutr. Exerc. Metab. 2014, 24, 127–138. [Google Scholar] [CrossRef] [PubMed]
- Rossow, L.M.; Fukuda, D.H.; Fahs, C.A.; Loenneke, J.P.; Stout, J.R. Natural bodybuilding competition preparation and recovery: A 12-month case study. Int. J. Sports Physiol. Perform. 2013, 8, 582–592. [Google Scholar] [CrossRef] [PubMed]
- Pardue, A.; Trexler, E.T.; Sprod, L.K. Case Study: Unfavorable But Transient Physiological Changes During Contest Preparation in a Drug-Free Male Bodybuilder. Int. J. Sport Nutr. Exerc. Metab. 2017, 27, 550–559. [Google Scholar] [CrossRef] [PubMed]
- Maestu, J.; Eliakim, A.; Jurimae, J.; Valter, I.; Jurimae, T. Anabolic and catabolic hormones and energy balance of the male bodybuilders during the preparation for the competition. J. Strength Cond. Res. 2010, 24, 1074–1081. [Google Scholar] [CrossRef]
- Hulmi, J.J.; Isola, V.; Suonpaa, M.; Jarvinen, N.J.; Kokkonen, M.; Wennerstrom, A.; Nyman, K.; Perola, M.; Ahtiainen, J.P.; Hakkinen, K. The Effects of Intensive Weight Reduction on Body Composition and Serum Hormones in Female Fitness Competitors. Front. Physiol. 2016, 7, 689. [Google Scholar] [CrossRef]
- Robinson, S.L.; Lambeth-Mansell, A.; Gillibrand, G.; Smith-Ryan, A.; Bannock, L. A nutrition and conditioning intervention for natural bodybuilding contest preparation: Case study. J. Int. Soc. Sports Nutr. 2015, 12, 20. [Google Scholar] [CrossRef]
- Kistler, B.M.; Fitschen, P.J.; Ranadive, S.M.; Fernhall, B.; Wilund, K.R. Case study: Natural bodybuilding contest preparation. Int. J. Sport Nutr. Exerc. Metab. 2014, 24, 694–700. [Google Scholar] [CrossRef]
- Tinsley, G.M.; Trexler, E.T.; Smith-Ryan, A.E.; Paoli, A.; Graybeal, A.J.; Campbell, B.I.; Schoenfeld, B.J. Changes in Body Composition and Neuromuscular Performance Through Preparation, 2 Competitions, and a Recovery Period in an Experienced Female Physique Athlete. J. Strength Cond. Res. 2019, 33, 1823–1839. [Google Scholar] [CrossRef]
- Trexler, E.T.; Smith-Ryan, A.E.; Norton, L.E. Metabolic adaptation to weight loss: Implications for the athlete. J. Int. Soc. Sports Nutr. 2014, 11, 7. [Google Scholar] [CrossRef]
- Rosenbaum, M.; Hirsch, J.; Murphy, E.; Leibel, R.L. Effects of changes in body weight on carbohydrate metabolism, catecholamine excretion, and thyroid function. Am. J. Clin. Nutr. 2000, 71, 1421–1432. [Google Scholar] [CrossRef]
- Trexler, E.T.; Hirsch, K.R.; Campbell, B.I.; Smith-Ryan, A.E. Physiological Changes Following Competition in Male and Female Physique Athletes: A Pilot Study. Int. J. Sport Nutr. Exerc. Metab. 2017, 27, 458–466. [Google Scholar] [CrossRef] [PubMed]
- Halliday, T.M.; Loenneke, J.P.; Davy, B.M. Dietary Intake, Body Composition, and Menstrual Cycle Changes during Competition Preparation and Recovery in a Drug-Free Figure Competitor: A Case Study. Nutrients 2016, 8, 740. [Google Scholar] [CrossRef] [PubMed]
- Spendlove, J.; Mitchell, L.; Gifford, J.; Hackett, D.; Slater, G.; Cobley, S.; O’Connor, H. Dietary Intake of Competitive Bodybuilders. Sports Med. 2015, 45, 1041–1063. [Google Scholar] [CrossRef] [PubMed]
- Fagerberg, P. Negative Consequences of Low Energy Availability in Natural Male Bodybuilding: A Review. Int. J. Sport Nutr. Exerc. Metab. 2018, 28, 385–402. [Google Scholar] [CrossRef]
- Loucks, A.B.; Thuma, J.R. Luteinizing hormone pulsatility is disrupted at a threshold of energy availability in regularly menstruating women. J. Clin. Endocrinol. Metab. 2003, 88, 297–311. [Google Scholar] [CrossRef]
- Mountjoy, M.; Sundgot-Borgen, J.; Burke, L.; Ackerman, K.E.; Blauwet, C.; Constantini, N.; Lebrun, C.; Lundy, B.; Melin, A.; Meyer, N.; et al. International Olympic Committee (IOC) Consensus Statement on Relative Energy Deficiency in Sport (RED-S): 2018 Update. Int. J. Sport Nutr. Exerc. Metab. 2018, 28, 316–331. [Google Scholar] [CrossRef]
- Meeusen, R.; Duclos, M.; Foster, C.; Fry, A.; Gleeson, M.; Nieman, D.; Raglin, J.; Rietjens, G.; Steinacker, J.; Urhausen, A. Prevention, diagnosis, and treatment of the overtraining syndrome: Joint consensus statement of the European College of Sport Science and the American College of Sports Medicine. Med. Sci. Sports Exerc. 2013, 45, 186–205. [Google Scholar] [CrossRef]
- Grandou, C.; Wallace, L.; Impellizzeri, F.M.; Allen, N.G.; Coutts, A.J. Overtraining in Resistance Exercise: An Exploratory Systematic Review and Methodological Appraisal of the Literature. Sports Med. 2020, 50, 815–828. [Google Scholar] [CrossRef]
- Rohrig, B.J.; Pettitt, R.W.; Pettitt, C.D.; Kanzenbach, T.L. Psychophysiological Tracking of a Female Physique Competitor through Competition Preparation. Int. J. Exerc. Sci. 2017, 10, 301–311. [Google Scholar]
- Petrizzo, J.; DiMenna, F.J.; Martins, K.; Wygand, J.; Otto, R.M. Case Study: The Effect of 32 Weeks of Figure-Contest Preparation on a Self-Proclaimed Drug-Free Female’s Lean Body and Bone Mass. Int. J. Sport Nutr. Exerc. Metab. 2017, 27, 543–549. [Google Scholar] [CrossRef]
- Gwazdauskas, S.G. “Female Natural Bodybuilding Competition Preparation: A 6-Week Case Study”. Georgia Southern, 2016. Available online: http://digitalcommons.georgiasouthern.edu/etd/1463 (accessed on 11 June 2018).
- Mitchell, L.; Slater, G.; Hackett, D.; Johnson, N.; O’Connor, H. Physiological implications of preparing for a natural male bodybuilding competition. Eur. J. Sport Sci. 2018, 18, 619–629. [Google Scholar] [CrossRef] [PubMed]
- Pescatello, L.S.; Riebe, D.; Thompson, P.D. ACSM’s Guidelines for Exercise Testing and Prescription; Lippincott Williams & Wilkins: Philadelphia, PA, USA, 2014. [Google Scholar]
- Jackson, A.S.; Pollock, M.L.; Ward, A. Generalized equations for predicting body density of women. Med. Sci. Sports Exerc. 1980, 12, 175–181. [Google Scholar] [CrossRef] [PubMed]
- Buysse, D.J.; Reynolds, C.F., 3rd; Monk, T.H.; Berman, S.R.; Kupfer, D.J. The Pittsburgh Sleep Quality Index: A new instrument for psychiatric practice and research. Psychiatry Res 1989, 28, 193–213. [Google Scholar] [CrossRef]
- Horner, N.K.; Lampe, J.W.; Patterson, R.E.; Neuhouser, M.L.; Beresford, S.A.; Prentice, R.L. Indirect calorimetry protocol development for measuring resting metabolic rate as a component of total energy expenditure in free-living postmenopausal women. J. Nutr. 2001, 131, 2215–2218. [Google Scholar] [CrossRef] [PubMed][Green Version]
- Harris, J.A.; Benedict, F.G. A Biometric Study of Human Basal Metabolism. Proc. Natl. Acad. Sci. USA 1918, 4, 370–373. [Google Scholar] [CrossRef] [PubMed]
- Koehler, K.; Williams, N.I.; Mallinson, R.J.; Southmayd, E.A.; Allaway, H.C.; De Souza, M.J. Low resting metabolic rate in exercise-associated amenorrhea is not due to a reduced proportion of highly active metabolic tissue compartments. Am. J. Physiol. Endocrinol. Metab. 2016, 311, E480–E487. [Google Scholar] [CrossRef] [PubMed]
- Bader, N.; Bosy-Westphal, A.; Dilba, B.; Müller, M.J. Intra-and interindividual variability of resting energy expenditure in healthy male subjects–biological and methodological variability of resting energy expenditure. Bri. J. Nutri. 2005, 94, 843–849. [Google Scholar] [CrossRef]
- Kim, B. Thyroid hormone as a determinant of energy expenditure and the basal metabolic rate. Thyroid 2008, 18, 141–144. [Google Scholar] [CrossRef]
- Kolaczynski, J.W.; Ohannesian, J.P.; Considine, R.V.; Marco, C.C.; Caro, J.F. Response of leptin to short-term and prolonged overfeeding in humans. J. Clin. Endocrinol. Metab. 1996, 81, 4162–4165. [Google Scholar]
- Margetic, S.; Gazzola, C.; Pegg, G.; Hill, R. Leptin: A review of its peripheral actions and interactions. Int. J. Obesit. 2002, 26, 1407–1433. [Google Scholar] [CrossRef]
- Reidy, S.P.; Weber, J.-M. Leptin: An essential regulator of lipid metabolism. Mol. Integrat. Physiol. 2000, 125, 285–298. [Google Scholar] [CrossRef]
- Dulloo, A.G.; Jacquet, J.; Montani, J.P.; Schutz, Y. How dieting makes the lean fatter: From a perspective of body composition autoregulation through adipostats and proteinstats awaiting discovery. Obes. Rev. 2015, 16, 25–35. [Google Scholar] [CrossRef] [PubMed]
- Walberg-Rankin, J.; Edmonds, C.E.; Gwazdauskas, F.C. Diet and weight changes of female bodybuilders before and after competition. Int. J. Sport Nutr. 1993, 3, 87–102. [Google Scholar] [CrossRef] [PubMed]
- Lamar-Hildebrand, N.; Saldanha, L.; Endres, J. Dietary and exercise practices of college-aged female bodybuilders. J. Am. Diet Assoc. 1989, 89, 1308–1310. [Google Scholar] [PubMed]
- Chan, J.L.; Matarese, G.; Shetty, G.K.; Raciti, P.; Kelesidis, I.; Aufiero, D.; De Rosa, V.; Perna, F.; Fontana, S.; Mantzoros, C.S. Differential regulation of metabolic, neuroendocrine, and immune function by leptin in humans. Proc. Natl. Acad. Sci. USA 2006, 103, 8481–8486. [Google Scholar] [CrossRef] [PubMed]
- Johannsen, D.L.; Marlatt, K.L.; Conley, K.E.; Smith, S.R.; Ravussin, E. Metabolic adaptation is not observed after 8 weeks of overfeeding but energy expenditure variability is associated with weight recovery. Am. J. Clin. Nut. 2019, 110, 805–813. [Google Scholar] [CrossRef] [PubMed]
- Iraki, J.; Fitschen, P.; Espinar, S.; Helms, E. Nutrition recommendations for bodybuilders in the off-season: A narrative review. Sports 2019, 7, 154. [Google Scholar] [CrossRef]
- Helms, E.R.; Prnjak, K.; Linardon, J. Towards a Sustainable Nutrition Paradigm in Physique Sport: A Narrative Review. Sports (Basel) 2019, 7, 172. [Google Scholar] [CrossRef]


| Competitor | Age | Height (cm) | Class | Contest Prep Duration (wk) 1 | Precontest Prep Bodyweight (kg) 1 |
|---|---|---|---|---|---|
| M1 | 42 | 191 | Physique | 20 | 102 |
| M2 | 29 | 182 | Physique | 12 | 94 |
| M3 | 32 | 173 | Bodybuilding | 39 | 94 |
| F1 | 30 | 161 | Figure | 20 | 65 |
| F2 | 29 | 170 | Figure | 17 | 70 |
| F3 | 23 | 157 | Bikini | 12 | 57 |
| F4 | 35 | 157 | Bikini | 25 | 57 |
| T1 | T2 | T3 | T1–T3 Change | ||
|---|---|---|---|---|---|
| Male 1 | |||||
| Body Composition | Body Weight (kg) | 90.2 | 93.4 | 95.6 | 5.4 |
| Fat-Free Mass (kg) | 83.4 | 84.8 | 85.4 | 2 | |
| Fat Mass (kg) | 6.8 | 8.6 | 10.3 | 3.5 | |
| Total Body Water (kg) | 60.8 | 62.7 | 61.6 | 0.8 | |
| Dry Fat-Free Mass (kg) | 22.6 | 22.1 | 23.8 | 1.2 | |
| Resting Metabolic Rate | REE (kcal/day) | 1852 | 2013 | 2102 | 250 |
| RQ (a.u.) | 0.79 | 0.91 | 1.03 | 0.24 | |
| Predicted (kcal/day) | 1978 | 2021 | 2053 | 75 | |
| Blood Hormones | Leptin (ng/mL) | 0.3 | - | 1 | 0.7 |
| Free triiodothyronine (T3)(pg/mL) | 2.7 | - | 2.7 | 0 | |
| Free thyroxine (T4)(ng/dL) | 1.1 | - | 1.1 | 0 | |
| Male 2 | |||||
| Body Composition | Body Weight (kg) | 82.3 | 82.3 | 83.8 | 1.5 |
| Fat-Free Mass (kg) | 76.5 | 75.4 | 76.1 | −0.4 | |
| Fat Mass (kg) | 5.7 | 6.9 | 7.7 | 2 | |
| Total Body Water (kg) | 55.1 | 54.9 | 55.3 | 0.2 | |
| Dry Fat-Free Mass (kg) | 21.4 | 20.5 | 20.8 | −0.6 | |
| Resting Metabolic Rate | REE (kcal/day) | 1660 | 1686 | 1667 | 7 |
| RQ (a.u.) | 0.79 | 0.81 | 0.84 | 0.05 | |
| Predicted (kcal/day) | 1912 | 1912 | 1932 | 20 | |
| Blood Hormones | Leptin (ng/mL) | 0.5 | - | 0.3 | −0.2 |
| Free triiodothyronine (T3)(pg/mL) | 1.8 | - | 1.8 | 0 | |
| Free thyroxine (T4)(ng/dL) | 0.9 | - | 0.9 | 0 | |
| Male 3 | |||||
| Body Composition | Body Weight (kg) | 79.6 | 84.3 | 86.8 | 7.2 |
| Fat-Free Mass (kg) | 74.6 | 77.9 | 79.6 | 5 | |
| Fat Mass (kg) | 5.1 | 6.4 | 7.1 | 2 | |
| Total Body Water (kg) | 54.6 | 57.2 | 56.6 | 2 | |
| Dry Fat-Free Mass (kg) | 20 | 20.7 | 23 | 3 | |
| Resting Metabolic Rate | REE (kcal/day) | 1601 | 1831 | 1765 | 164 |
| RQ (a.u.) | 0.83 | 0.87 | 0.91 | 0.08 | |
| Predicted (kcal/day) | 1811 | 1875 | 1909 | 98 | |
| Blood Hormones | Leptin (ng/mL) | 0.8 | - | 0.7 | −0.1 |
| Free triiodothyronine (T3)(pg/mL) | 1.9 | - | 2.4 | 0.5 | |
| Free thyroxine (T4)(ng/dL) | 0.8 | - | 1 | 0.2 | |
| Female 1 | |||||
| Body Composition | Body Weight (kg) | 53.6 | 64.7 | 65.6 | 12 |
| Fat-Free Mass (kg) | 45.1 | 49.7 | 47.8 | 2.7 | |
| Fat Mass (kg) | 8.5 | 15 | 17.8 | 9.3 | |
| Total Body Water (kg) | 34.4 | 37.5 | 35.3 | 0.9 | |
| Dry Fat-Free Mass (kg) | 10.7 | 12.2 | 12.5 | 1.8 | |
| Resting Metabolic Rate | REE (kcal/day) | 1264 | 1628 | 1536 | 272 |
| RQ (a.u.) | 0.74 | 0.86 | 0.85 | 0.11 | |
| Predicted (kcal/day) | 1325 | 1431 | 1440 | 115 | |
| Blood Hormones | Leptin (ng/mL) | 0.5 | - | 3.7 | 3.2 |
| Free triiodothyronine (T3)(pg/mL) | 1.6 | - | 2.9 | 1.3 | |
| Free thyroxine (T4)(ng/dL) | 0.8 | - | 0.9 | 0.1 | |
| Female 2 | |||||
| Body Composition | Body Weight (kg) | 61.8 | 63.3 | 64.8 | 3 |
| Fat-Free Mass (kg) | 54 | 53.8 | 54.9 | 0.9 | |
| Fat Mass (kg) | 7.7 | 9.5 | 9.9 | 2.2 | |
| Total Body Water (kg) | 42 | 42.4 | 43.9 | 1.9 | |
| Dry Fat-Free Mass (kg) | 12 | 11.4 | 11 | −1 | |
| Resting Metabolic Rate | REE (kcal/day) | 1471 | 1424 | 1381 | −90 |
| RQ (a.u.) | 0.76 | 0.83 | 0.8 | 0.04 | |
| Predicted (kcal/day) | 1426 | 1441 | 1455 | 29 | |
| Blood Hormones | Leptin (ng/mL) | 0.4 | - | 1 | 0.6 |
| Free triiodothyronine (T3)(pg/mL) | 1.5 | - | 2.4 | 0.9 | |
| Free thyroxine (T4)(ng/dL) | 0.8 | - | 1.1 | 0.3 | |
| Female 3 | |||||
| Body Composition | Body Weight (kg) | 55.1 | 57.5 | 59.7 | 4.6 |
| Fat-Free Mass (kg) | 47 | 46.5 | 47.5 | 0.5 | |
| Fat Mass (kg) | 8 | 11 | 12.2 | 4.2 | |
| Total Body Water (kg) | 33.8 | 33.6 | 33.6 | −0.2 | |
| Dry Fat-Free Mass (kg) | 13.2 | 12.9 | 13.9 | 0.7 | |
| Resting Metabolic Rate | REE (kcal/day) | 1259 | 1486 | 1769 | 510 |
| RQ (a.u.) | 0.84 | 0.85 | 0.91 | 0.07 | |
| Predicted (kcal/day) | 1366 | 1390 | 1411 | 45 | |
| Blood Hormones | Leptin (ng/mL) | 1.3 | - | 2.4 | 1.1 |
| Free triiodothyronine (T3)(pg/mL) | 2.8 | - | 3 | 0.2 | |
| Free thyroxine (T4)(ng/dL) | 1 | - | 1.1 | 0.1 | |
| Female 4 | |||||
| Body Composition | Body Weight (kg) | 51.8 | 54.1 | 54.5 | 2.7 |
| Fat-Free Mass (kg) | 43.2 | 42.5 | 42.5 | −0.7 | |
| Fat Mass (kg) | 8.6 | 11.6 | 12 | 3.4 | |
| Total Body Water (kg) | 31.9 | 32.4 | 31.7 | −0.2 | |
| Dry Fat-Free Mass (kg) | 11.3 | 10.1 | 10.8 | −0.5 | |
| Resting Metabolic Rate | REE (kcal/day) | 1393 | 1482 | 1447 | 54 |
| RQ (a.u.) | 0.82 | 0.86 | 0.8 | −0.02 | |
| Predicted (kcal/day) | 1279 | 1301 | 1305 | 26 | |
| Blood Hormones | Leptin (ng/mL) | 1 | - | 1 | 0 |
| Free triiodothyronine (T3)(pg/mL) | 2.5 | - | 3 | 0.5 | |
| Free thyroxine (T4)(ng/dL) | 1 | - | 1.1 | 0.1 |
© 2020 by the authors. Licensee MDPI, Basel, Switzerland. This article is an open access article distributed under the terms and conditions of the Creative Commons Attribution (CC BY) license (http://creativecommons.org/licenses/by/4.0/).
Share and Cite
Longstrom, J.M.; Colenso-Semple, L.M.; Waddell, B.J.; Mastrofini, G.; Trexler, E.T.; Campbell, B.I. Physiological, Psychological and Performance-Related Changes Following Physique Competition: A Case-Series. J. Funct. Morphol. Kinesiol. 2020, 5, 27. https://doi.org/10.3390/jfmk5020027
Longstrom JM, Colenso-Semple LM, Waddell BJ, Mastrofini G, Trexler ET, Campbell BI. Physiological, Psychological and Performance-Related Changes Following Physique Competition: A Case-Series. Journal of Functional Morphology and Kinesiology. 2020; 5(2):27. https://doi.org/10.3390/jfmk5020027
Chicago/Turabian StyleLongstrom, Jaymes M., Lauren M. Colenso-Semple, Brian J. Waddell, Gianna Mastrofini, Eric T. Trexler, and Bill I. Campbell. 2020. "Physiological, Psychological and Performance-Related Changes Following Physique Competition: A Case-Series" Journal of Functional Morphology and Kinesiology 5, no. 2: 27. https://doi.org/10.3390/jfmk5020027
APA StyleLongstrom, J. M., Colenso-Semple, L. M., Waddell, B. J., Mastrofini, G., Trexler, E. T., & Campbell, B. I. (2020). Physiological, Psychological and Performance-Related Changes Following Physique Competition: A Case-Series. Journal of Functional Morphology and Kinesiology, 5(2), 27. https://doi.org/10.3390/jfmk5020027