Abstract
Cardiorespiratory fitness (CRF) is an important indicator of adolescent cardiovascular well-being and future cardiometabolic health but not always feasible to measure. The purpose of this study was to estimate the concurrent validity of the non-exercise test (NET) for adolescents against the Progressive Aerobic Capacity Endurance Run (PACER®) and direct measures of VO2max as well as to examine the concurrent validity of the PACER® with a portable metabolic system (K4b2™). Forty-six adolescents (12–17 years) completed the NET prior to performing the PACER® while wearing the K4b2™. The obtained VO2max values were compared using linear regression, intra-class correlation (ICC), and Bland–Altman plots, and α was set at 0.05. The VO2max acquired directly from the K4b2™ was significantly correlated to the VO2max indirectly estimated from the NET (r = 0.73, p < 0.001, r2 = 0.53, ICC = 0.67). PACER® results were significantly related to the VO2max estimates from the NET (r = 0.81, p < 0.001, r2 = 0.65, ICC = 0.72). Direct measures from the K4b2™ were significantly correlated to the VO2max estimates from the PACER® (r = 0.87, p < 0.001, r2 = 0.75, ICC = 0.93). The NET is a valid measure of CRF in adolescents and can be used when an exercise test is not feasible.
1. Introduction
Low cardiorespiratory fitness (CRF) levels in adolescents have been linked to insulin resistance as well as cardiovascular and cardiometabolic risk factors [1,2,3,4,5]. Higher levels of CRF in adolescents have also been linked to improved academic outcomes and an improved ability to regulate attention and behavior [6,7]. There is a strong positive relationship between CRF and cognitive performance, with multiple studies showing that adolescents with higher levels of CRF outperformed their peers with lower levels of CRF in cognitive tests involving working memory, cognitive flexibility, and inhibition, which is the ability to ignore extraneous environmental information [8,9,10]. The improved cognitive ability is thought to be due to the increased volume in different regions of the brain such as the hippocampus and basal ganglia found in adolescents with higher levels of CRF [8,11]. Moreover, higher CRF has been shown to be an excellent predictor of physical activity level during adulthood [12,13]. Since CRF is an important health predictor in adolescents, it should be regularly assessed in both healthcare and school settings.
Maximal oxygen uptake (VO2max), expressed as mL/kg/min of oxygen, is the gold standard measure of CRF and can be measured both directly and indirectly [14,15]. A direct measure of VO2max is obtained by ventilatory gas analysis during a graded exercise test at maximum exertion and is the most precise measure of VO2max [14]. An indirect measure estimates VO2max from a maximal or submaximal exercise test and is usually estimated from total time, total work, or heart rate [15]. Especially in school settings, VO2max is often indirectly measured and estimated using a field test. While there are a few different options when it comes to field tests to indirectly measure VO2max, the 20-m multistage shuttle run test (20MSR) is the most frequently used test, as it has shown moderate to high criterion validity compared to direct measures of VO2max and is a more practical test compared to longer duration endurance tests, such as the 6-min endurance run [16,17]. The Progressive Aerobic Cardiovascular Endurance Run (PACER®) is part of the FitnessGram® tests administered to adolescents in schools [18]. The PACER® is a 20MSR meant to mimic a maximal exertion exercise test with workloads increasing every stage until the participant reaches volitional exhaustion. The standardized procedure of the PACER® has participants run between two markers placed 20 m apart while keeping pace to a prerecorded audio cadence that increases every minute. The test is terminated if a participant fails to reach a marker for the second time or if the participant can no longer continue. This field test has been shown to be both reliable (intra-class correlation (ICC): 0.77–0.93) and valid (r: 0.62–0.83) [16,19,20], when compared to directly measured VO2max during a treadmill maximal exercise test.
It is not always possible to directly assess VO2max in all settings, such as schools, gyms, or even in a clinical setting. Ventilatory gas analysis is time-consuming and requires expensive equipment that prevents the mass screening which would be required in a school setting or in the daily caseload and time restraints of a healthcare professional. The non-exercise test (NET) is a paper-based questionnaire used to estimate VO2max from different variables including sex, age, body mass index (BMI), resting heart rate, and self-reported habitual physical activity levels [21,22]. Use of this questionnaire allows for both quick and widespread CRF screening without any health risk to the participants. The NET has been shown to be valid within the adult population [21], but to the best of our knowledge, has not been tested within the adolescent population. Therefore, the purpose of this study was to estimate the concurrent validity of the NET for adolescents against the PACER® test and objective measures of VO2max as well as to examine the concurrent validity of the VO2max estimated by the PACER® with the VO2max obtained from the Cosmed K4b2™ portable metabolic system (Cosmed K4b2, Cosmed, Rome, Italy) during the PACER® test.
2. Materials and Methods
2.1. Subjects
Adolescents aged 12–17 years were recruited by email, education support groups, co-operatives, and word of mouth. Parents were asked if their child had any physical or mental limitations that would prevent them from safely and accurately completing the test and if any were noted, the child was excluded. Institutional review board approval (Protocol #19736 on 19 January 2017) from Texas Woman’s University in Houston, TX, parental informed consent, and minor assent were secured prior to any subject enrollment or data collection.
2.2. Procedures
Height and weight were assessed barefoot with light clothing using a medical-grade stadiometer calibrated prior to its use. Pubertal level was assessed using the pubertal developmental scale.
Prior to participating in the PACER and being fitted with the K4b2™, participants were given the NET questionnaire previously validated in adults by Jurca et al. [21]. As required by the NET, each participant was asked to choose the physical activity level which best described their daily level of activity, as listed in Table 1. Participant BMI was calculated based on their weight and height measurement. Resting heart rate (RHR) was measured with the SantaMedical SM150BL finger pulse oximeter (SantaMedical, Tustin, CA, USA) as the final measurement after sitting for at least five minutes.

Table 1.
Physical Activity Levels for NET.
The K4b2™ portable metabolic system was used to directly measure VO2max during the PACER®. The K4b2™ has demonstrated high test–retest reliability (ICC = 0.70–0.90) [23] and has shown to be valid in VO2 measurement when compared to a traditional stationary gas exchange system (r: 0.93–0.97) [24]. The K4b2™ was calibrated according to manufacturer’s recommendations using known gases and room air sampling. After calibration, participants were fitted with a mask and connected to the K4b2™ prior to initiating the PACER®.
After donning the K4b2™, adolescents were allowed to wear and familiarize themselves with the device for 5 min. Participants completed the 20-m PACER® individually as per the standardized instructions. Two pieces of tape were placed 20 m apart, denoting the crossing lines for the PACER®, and the FitnessGram® cadence soundtrack was played at a volume loud enough for the participant to hear. Participants were instructed to begin running when they heard the first beep on the soundtrack. For the lap to be valid, each participant was required to clear at least one foot over the line prior to the next beep. The test was terminated following the second miss or if the participant desired to stop. All raters were trained and followed the standardized test procedures. Once the PACER® had been terminated, total laps were recorded, the K4b2™ data was saved, and the mask was doffed.
VO2max with the K4b2™ system was determined in the same manner used by Silva et al. [25]. Respiratory variables were recorded breath-by-breath and averaged over a 10-s period. VO2max was determined when a plateau in the VO2 curve was detected and if the plateau was absent the VO2peak was taken instead. VO2max with the PACER® was calculated using the quadratic model established by Mahar, Guerieri, Hanna, and Kemble [26]: VO2max = 41.76799 + (0.49261 × laps) − (0.00290 x laps2) − (0.61613 × BMI) + (0.34787 × sex × age), where sex is 0 for males and 1 for females.
2.3. Statistical Analyses
The Shapiro–Wilk test, Levene’s test, and box plots were utilized to screen all data for normality assumptions, homoscedasticity, and outliers, respectively. Linear regressions with Pearson correlations were performed on the VO2max estimates acquired from the PACER® and the NET, and the VO2max acquired from the K4b2™ system. Intra-class correlations (ICCs), standard error of estimate (SEE), paired sample t-tests, and Bland–Altman plots were performed to assess agreement and differences between the measures of VO2max. All statistical analyses were conducted with IBM SPSS software for Windows (v. 25.0; IBM Corp., Armonk, NY, USA).
3. Results
Forty-six adolescents (male: 24; female: 22) were recruited. All data met all assumptions for normality, homoscedasticity, and outlier assumptions. Sex specific demographic and anthropometric characteristics are listed in Table 2.

Table 2.
Demographic and anthropometric characteristics.
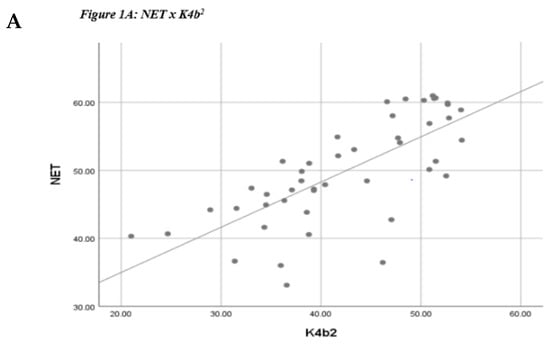
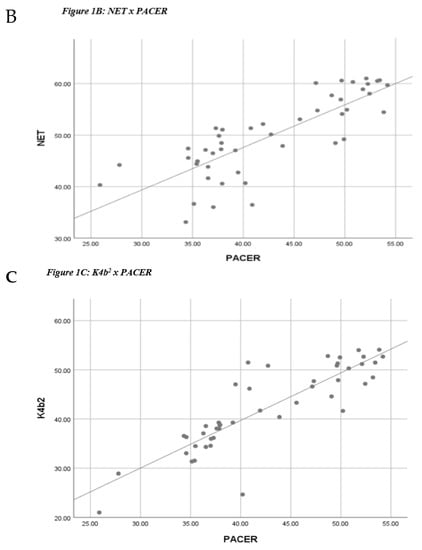
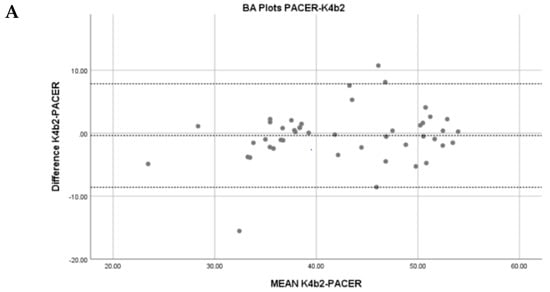
Pearson correlation coefficients as well as ICC and SEE values are listed in Table 3. Scatterplots depicting the correlations are listed in Figure 1. All assessment methods demonstrated moderate to strong statistically significant correlations and levels of agreement as defined by Portney and Watkins [27] for correlations and Koo and Lee [28] for ICC.

Table 3.
Correlation matrix between oxygen consumption estimates per test for both sexes combined.


Figure 1.
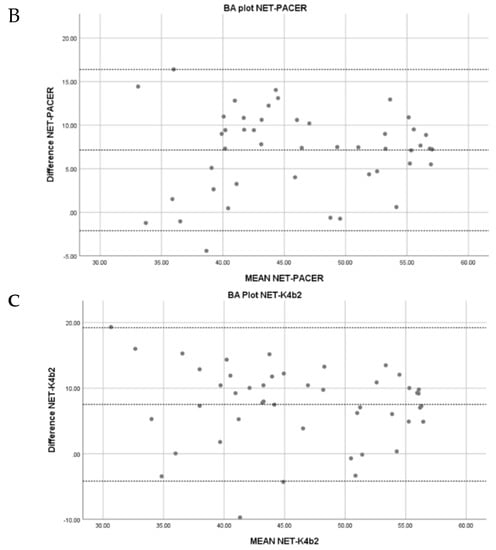
Simple scatterplots. (A) NET & K4b2: r = 0.73; (B) NET & PACER®: r = 0.81; (C) K4b2 & PACER®: r = 0.87; Bland–Altman plots (Figure 2) and paired sample t-tests demonstrated acceptable limits of agreement and no significant difference for K4b2™ and PACER® measures of VO2max (Figure 2A) (mean difference = −0.37, t(45) = −0.61, p = 0.55) but showed that the NET VO2max estimates tend to be overestimated, seen by the upward shift of the mean difference line away from zero, and significantly different in the NET − PACER® (Figure 2B) (mean difference = 7.14, t(45) = 10.26, p < 0.001) and the NET − K4b2™ (Figure 2C) (mean difference = 7.52, t(45) = 8.54, p < 0.001) plots.
4. Discussion
The aim of this study was to estimate the concurrent validity of the NET for adolescents against the PACER® and objective measures of VO2max as well as to examine the concurrent validity of the VO2max estimation by the PACER® with the VO2max from the K4b2™ portable metabolic system during the PACER® test. Past studies have shown that the NET is a valid measure of CRF in adult populations [21,22], and our results show that the NET is a valid predictor of VO2max in the adolescent population. This is important, as it offers a quick, easy, inexpensive, and risk-free method of assessing CRF in adolescents. To our knowledge, this is the first report to measure CRF in adolescents without requiring any form of exertion from the participant, which allows for widespread use among large groups and offers a feasible tool for CRF measurement in healthcare settings.
The PACER® test has been validated several times [16,19,20], and our results comparing it to the direct measure of VO2max from the K4b2™ (r = 0.87) align with past results (r = 0.62–0.83) acquired directly from treadmill maximal exercise tests [16,19,20]. Our study offers a different perspective, as most studies compare the PACER® estimate to a traditional treadmill maximal exercise test, but our research compared the estimate to the direct measure of VO2max acquired at the same time the participant was performing the PACER®. This further strengthens the validity of the PACER® as an indirect measure of VO2max and shows that the PACER® protocol is a valid substitute for a maximally graded exercise test.
In practice, the NET could offer schools a quick and inexpensive tool to assess CRF more frequently than the PACER® test allows, providing valuable information to implement changes in physical education. At the clinical level, the NET can be implemented into healthcare settings as a snapshot of current CRF and can be used as a tool to assess risk for cardiovascular and cardiometabolic disease [1,2,3,4,5]. For efficient use in either setting, the NET results can be analyzed similar to the PACER®, which groups students based on having sufficient or insufficient CRF into the healthy fitness zone (HFZ), the needs improvement zone (NIZ), or the health risk zone (HRZ) [18]. Based on our results, the group values for the zones could be adjusted with the linear regression equation: PACER® = 10.92 + 0.96(NET). For example, a 10-year-old male with a NET score of 46.82–49.42 would fall into the NIZ, a score of ≤46.81 would put him in the HRZ, and a score ≥49.43 would place him into the HFZ. This would allow for a quick assessment to deduce whether an adolescent patient is at risk and requires intervention.
As seen with the Bland–Altman plots and t-tests, the NET VO2max estimates were generally much higher and were significantly different than the values acquired directly through the K4b2™ or estimated through the PACER®. This could be due to the fact the descriptions of the physical activity levels were intended for adults, so it may not have been directly relatable to adolescents. Also, the added weight of the K4b2™ unit, weighing roughly 1 kg, plus the addition of the mask could have resulted in a decreased outcome during the PACER® test. While the NET measures of VO2max were significantly higher, the moderately strong levels of agreement show that the NET is valid and by using the CRF grouping suggested above, as is used by the PACER®, the NET overestimation is inconsequential.
Limitations of this study include a small sample of females and males, thus limiting the ability to fully explore sexes separately, and the running of the PACER® test individually instead of in groups, as is the norm in schools, thus potentially affecting participants’ motivation to maximally exert themselves. Regardless of the limitations of this study, there are several strengths in our design and findings, including validating the NET against two different validated measures of VO2max and testing a representative sample of adolescents. Future studies on using the NET for adolescents could examine a larger sample size, perhaps in public schools, to compare against the PACER® or investigate the NET’s sensitivity to change in an adolescent’s CRF. Future studies need to also assess the reliability of the NET in adolescents, so it can be established as a tool to measure CRF over time.
5. Conclusions
This article gives researchers, clinicians, and coaches a simple, quick, and inexpensive tool to indirectly estimate VO2max in the adolescent population as opposed to a time-consuming and exhausting exercise test. This article also strengthens the evidence for use of the PACER® test as an indirect measure of VO2max, as it provided ventilatory gas analysis during the test itself, showing that the PACER® is a valid graded maximal exertion exercise test, as direct measures of VO2max acquired during performing the PACER® were in agreement with PACER® estimates based on regression equations established against the more traditional treadmill VO2max tests.
Author Contributions
Conceptualization: A.O., L.K., P.M.; Methodology: A.O.; Formal Analysis: P.M.; Investigation: P.M., M.C., A.B., A.F. L.K., A.O., W.B.; Resources: L.K., A.O., W.B.; Data Curation: P.M., M.C.; Writing—Original Draft Preparation: P.M.; Writing—Review and Editing: P.M., A.O., L.K.; Supervision: A.O., L.K., W.B.
Funding
This study was funded by the Texas Physical Therapy Foundation. The results of this study are presented clearly, honestly, and without fabrication, falsification, or inappropriate data manipulation. The results from this study do not constitute endorsement by the Texas Physical Therapy Association.
Conflicts of Interest
The authors have no conflict of interest to disclose.
References
- Parrett, A.L.; Valentine, R.J.; Arngrimsson, S.A.; Castelli, D.M.; Evans, E.M. Adiposity and aerobic fitness are associated with metabolic disease risk in children. Appl. Physiol. Nutr. Metab. 2011, 36, 72–79. [Google Scholar] [CrossRef] [PubMed]
- Lukacs, A.; Varga, B.; Kiss-Toth, E.; Soos, A.; Barkai, L. Factors influencing the diabetes-specific health-related quality of life in children and adolescents with type 1 diabetes mellitus. J. Child Heal. Care 2014, 18, 253–260. [Google Scholar] [CrossRef] [PubMed]
- Twisk, J.W.R.; Kemper, H.C.G.; Mechelen, W. Van Tracking of activity and fitness and the relationship with cardiovascular disease risk factors. Med. Sci. Sport. Exerc. 2000, 1455–1461. [Google Scholar] [CrossRef]
- Houston, E.L.; Baker, J.S.; Buchan, D.S.; Stratton, G.; Fairclough, S.J.; Foweather, L.; Gobbi, R.; Graves, L.E.F.; Hopkins, N.; Boddy, L.M. Cardiorespiratory fitness predicts clustered cardiometabolic risk in 10–11.9-year-olds. Eur. J. Pediatr. 2013, 172, 913–918. [Google Scholar] [CrossRef] [PubMed][Green Version]
- Bailey, D.P.; Boddy, L.M.; Savory, L.A.; Denton, S.J.; Kerr, C.J. Associations between cardiorespiratory fitness, physical activity and clustered cardiometabolic risk in children and adolescents: The HAPPY study. Eur. J. Pediatr. 2012, 171, 1317–1323. [Google Scholar] [CrossRef] [PubMed]
- Chaddock, L.; Hillman, C.H.; Pontifex, M.B.; Johnson, C.R.; Raine, L.B.; Kramer, A.F. Childhood aerobic fitness predicts cognitive performance one year later. J. Sports Sci. 2012, 30, 421–430. [Google Scholar] [CrossRef] [PubMed]
- Haapala, E.A. Cardiorespiratory Fitness and Motor Skills in Relation to Cognition and Academic Performance in Children – A Review by. J. Hum. Kinet. 2013, 36, 55–68. [Google Scholar] [CrossRef]
- Chaddock, L.; Erickson, K.I.; Prakash, R.S.; Vanpatter, M.; Voss, M.W.; Pontifex, M.B.; Raine, L.B.; Hillman, C.H.; Kramer, A.F. Basal ganglia volume is associated with aerobic fitness in preadolescent children. Dev. Neurosci. 2010, 32, 249–256. [Google Scholar] [CrossRef]
- Hillman, C.H.; Erickson, K.I.; Kramer, A.F. Be smart, exercise your heart: exercise effects on brain and cognition. Nat. Rev. Neurosci. 2008, 9, 58–65. [Google Scholar] [CrossRef]
- Pontifex, M.B.; Raine, L.B.; Johnson, C.R.; Chaddock, L.; Voss, M.W.; Cohen, N.; Kramer, A.F.; Hillman, C.H. Cardiorespiratory Fitness and the Flexible Modulation of Cognitive Control in Preadolescent Children. J. Cogn. Neurosci. 2010, 23, 1332–1345. [Google Scholar] [CrossRef]
- Chaddock, L.; Erickson, K.I.; Prakash, R.S.; Kim, J.S.; Voss, M.W.; VanPatter, M.; Pontifex, M.B.; Raine, L.B.; Konkel, A.; Hillman, C.H.; et al. A neuroimaging investigation of the association between aerobic fitness, hippocampal volume, and memory performance in preadolescent children. Brain Res. 2014, 1358, 172–183. [Google Scholar] [CrossRef] [PubMed]
- Huotari, P.; Nupponen, H.; Mikkelsson, L.; Laakso, L.; Kujala, U. Adolescent physical fitness and activity as predictors of adulthood activity. J. Sports Sci. 2011, 29, 1135–1141. [Google Scholar] [CrossRef] [PubMed]
- Jose, K.A.; Blizzard, L.; Dwyer, T.; Mckercher, C.; Venn, A.J. Childhood and adolescent predictors of leisure time physical activity during the transition from adolescence to adulthood: A population based cohort study. Int. J. Behav. Nutr. Phys. Act. 2011, 8, 1–9. [Google Scholar] [CrossRef] [PubMed]
- Davis, J. Direct determination of aerobic power. In Physiological Assessment of Human Fitness; Human Kinetics: Champaign, IL, USA, 1995; pp. 9–17. [Google Scholar]
- Ward, A.; Ebbeling, C.; Ahlquist, L. Indirect methods for estimation of aerobic power. In Physiological Assessment of Human Fitness; Human Kinetics: Champaign, IL, USA, 1995; pp. 37–56. [Google Scholar]
- Van Mechelen, W.; Hlobil, H.; Kemper, H.C.G. Validation of two running tests as estimates of maximal aerobic power in children. Eur. J. Appl. Physiol. 1986, 55, 503–506. [Google Scholar] [CrossRef]
- Mayorga-Vega, D.; Aguilar-Soto, P.; Viciana, J. Criterion-related validity of the 20-m shuttle run test for estimating cardiorespiratory fitness: A meta-analysis. J. Sport. Sci. Med. 2015, 14, 536–547. [Google Scholar]
- Meredith, M.; Welk, G. FITNESSGRAM®/ACTIVITYGRAM® Test Administration Manual, 4th ed.; Human Kinetics: Champaign, IL, USA, 2013; Available online: www.cooperinstitute.org/vault/2440/web/files/662.pdf (accessed on 31 December 2017).
- Kabiri, L.S.; Mitchell, K.; Brewer, W.; Ortiz, A. Muscular and Cardiorespiratory Fitness in Homeschool versus Public School Children Running. Pediatr. Exerc. Sci. 2017, 29, 371–376. [Google Scholar] [CrossRef] [PubMed]
- Mahar, M.T.; Welk, G.J.; Rowe, D.A.; Crotts, D.J.; Mciver, K.L. Development and Validation of a Regres- sion Model to Estimate VO2peak From PACER 20-m Shuttle Run Performance. J. Phys. Act. Health 2006, 3, 34–46. [Google Scholar] [CrossRef]
- Jurca, R.; Jackson, A.S.; Lamonte, M.J.; Morrow, J.R., Jr.; Blair, S.N.; Wareham, N.J.; Haskell, W.L.; Van Mechelen, W.; Church, T.S.; Jakicic, J.M. Assessing Cardiorespiratory Fitness Without Performing Exercise Testing. Am. J. Prev. Med. 2005, 29, 185–193. [Google Scholar] [CrossRef]
- Jackson, A.S.; Sui, X.; Connor, D.P.O.; Church, T.S.; Lee, D.; Artero, E.G.; Blair, S.N. Longitudinal Cardiorespiratory Fitness Alogrithms for Clinical Settings. Am. J. Prev. Med. 2012, 43, 512–519. [Google Scholar] [CrossRef]
- Duffield, R.; Dawson, B.; Pinnington, H.; Wong, P. Accuracy and reliabillity of a Cosmed K4b 2 portable gas aScience, Exercisenalysis system. J. Sci. Med. Sport 2004, 7, 11–22. [Google Scholar] [CrossRef]
- Schrack, J.A.; Simonsick, E.M.; Ferrucci, L. Comparison of the Cosmed K4b2 Portable Metabolic System in Measuring Steady-State Walking Energy Expenditure. PLoS ONE 2010, 5, 2–6. [Google Scholar] [CrossRef] [PubMed]
- Silva, G.; Oliveira, N.L.; Aires, L.; Mota, J.; Oliveira, J.; Ribeiro, J.C. Calculation and validation of models for estimating VO2max from the 20-m shuttle run test in children and adolescents Gustavo. Arch. Exerc. Heal. Dis. 2012, 2, 145–152. [Google Scholar] [CrossRef]
- Mahar, M.T.; Guerieri, A.M.; Hanna, M.S.; Kemble, C.D. Estimation of Aerobic Fitness from 20-m Multistage Shuttle Run Test Performance. Am. J. Prev. Med. 2011, 41, S117–S123. [Google Scholar] [CrossRef] [PubMed]
- Portney, L.G.; Watkins, M.P. Foundations of Clinical Research: Applications to Practice, 3rd ed.; F.A. Davis Company: Philadelphia, PA, USA, 2015; p. 525. [Google Scholar]
- Koo, T.K.; Li, M.Y. A Guideline of Selecting and Reporting Intraclass Correlation Coefficients for Reliability Research. J. Chiropr. Med. 2016, 15, 155–163. [Google Scholar] [CrossRef] [PubMed]
© 2019 by the authors. Licensee MDPI, Basel, Switzerland. This article is an open access article distributed under the terms and conditions of the Creative Commons Attribution (CC BY) license (http://creativecommons.org/licenses/by/4.0/).

