Article

The Operation of a Three-Bladed Horizontal Axis Wind Turbine under Hailstorm Conditions—A Computational Study Focused on Aerodynamic Performance

Fluid Mechanics Laboratory (FML), Mechanical Engineering and Aeronautics Department, University of Patras, GR-26500 Patras, Greece
*
Author to whom correspondence should be addressed.
Inventions 2022, 7(1), 2; https://doi.org/10.3390/inventions7010002
Submission received: 16 November 2021 / Revised: 5 December 2021 / Accepted: 17 December 2021 / Published: 21 December 2021
(This article belongs to the Collection Feature Innovation Papers)

Abstract

:
The aim of this study is the aerodynamic degradation of a three-bladed Horizontal Axis Wind Turbine (HAWT) under the influence of a hailstorm. The importance and originality of this study are that it explores the aerodynamic performance of an optimum wind turbine blade during a hailstorm, when hailstones and raindrops are present. The commercial Computational Fluid Dynamics (CFD) code ANSYS Fluent 16.0 was utilized for the simulation. The first step was the calculation of the optimum blade geometry characteristics for a three-bladed rotor, i.e., twist and chord length along the blade, by a user-friendly application. Afterwards, the three-dimensional blade and the flow field domain were designed and meshed appropriately. The rotary motion of the blades was accomplished by the application of the Moving Reference Frame Model and the simulation of hailstorm conditions by the Discrete Phase Model. The SST k–ω turbulence model was also added. The produced power of the wind turbine, operating in various environmental conditions, was estimated and discussed. Contours of pressure, hailstone and raindrop concentration and erosion rate, on both sides of the blade, are presented. Moreover, contours of velocity at various cross sections parallel to the rotor are demonstrated, to understand the effect of hailstorms on the wake behavior. The results suggest that the aerodynamic performance of a HAWT degrades due to impact and breakup of the particles on the blade.

1. Introduction

In present times, global energy demand is affected by the COVID-19 pandemic and it is predicted to increase by 4.6% in 2021, mainly in developing economies and emerging markets [1]. The contribution of Renewable Energy Sources (RES) on the electricity generation is expected to grow by 8% in 2021 and at least by 6% in 2022 [2]. Wind power and solar energy are going to contribute most to electricity generation among the others RES, since they are expected to increase 20 times until 2050.
Wind turbines are used in order to harvest wind energy. Among numerous types of wind turbines, Horizontal Axis Wind Turbines (HAWTs) are prevalent, as they achieve higher power coefficients. Despite the COVID-19 pandemic, a new record in new wind power installation was reached, equal to 93 GW [3].
The most critical components of a wind turbine are the blades, since their geometry is responsible for the aerodynamic performance of the wind turbine. The operation of wind turbines in open environments can cause aerodynamic performance degradation and increased need for maintenance during service life, since they are regularly subjected either to hazardous weather conditions, such as rainfalls and hailstorms, or to atmospheric particles and sand [4,5].
Currently, the advances in computing power have a positive effect on the wind energy industry, since parametric computational studies aiming on performance improvement can be accomplished in a shorter period of time and with lower cost than experimental studies. The obtained results from Computational Fluid Dynamic (CFD) codes have the advantage that they provide information in the whole flow field. A major part of these investigations is focusing on the flow field over complex terrain, in order to select the optimal location for wind turbine installation in a wind farm [6,7,8,9]. The flow field is more complicated when the wake development downwind of the wind turbines is considered. Several studies have investigated computationally the flow field into a wind farm, by simulating the wake effects [10,11,12].
A series of recent studies have indicated that coupling various numerical methods in the wind energy sector results in improved accuracy [13,14,15,16]. The actual flow field over a complex terrain, extending from several m to several km, can be estimated accurately by the RIAM-COMPACT numerical model, which is based on the large-eddy simulation (LES) [17]. The wind turbine wake flow can be estimated by a particle tracking model, which shows enhanced accuracy compared to the previous proposed linear model and, at the same time, the optimum wind turbines layout in a wind park can be attained [18].
Much of the current literature on the wind turbine industry pays particular attention to the numerical estimation of wind turbine performance, according to its blade geometry. Thumthae and Chitsomboon [19] studied, numerically, the dependency of angle of attack on HAWT power output for untwisted blades and found out that the most advantageous angles of attack are the angles that produce the highest lift. In a follow-up study, Rajakumar and Ravindran [20] reached the same conclusion after they examined the optimum geometry of a twisted blade, constructed by NACA 4410 and NACA 2415 airfoils. A year later, Kim et al. [21] developed an application which optimized the shape of the blades and investigated the aerodynamic efficiency of large scale HAWTs. They concluded that after the optimization the performance of the HAWT was increased.
In general, HAWT aerodynamic performance depends on the airfoil profile that is used for the construction of the blades, which means that assumptions about the aerodynamic performance of a HAWT operating in dusty or rainy environments can be made if the aerodynamic performance of an airfoil in such environments is examined. Much of the literature since the mid-1980s emphasizes the aerodynamic behavior of airplanes in rain [22,23,24,25]. Advances in computational fluid dynamics as well as the renewable energy transition have led to a renewed interest in the aerodynamic performance of wind turbine airfoils under the presence of particles [26,27,28] or raindrops [29,30]. A more detailed study about the aerodynamic degradation of a three-bladed HAWT with an optimized blade constructed by NACA 4418 airfoil was published recently [31]. It was found that the rainfall adversely effects the aerodynamic performance of a HAWT and the degradation increases with heavier rain and larger raindrops.
The annual energy output from a wind turbine can be reduced by between 2 and 25%—depending on environmental conditions, extent of erosion and operation costs of the wind park [32,33]—due to erosion resulting from particle impact on the wind turbine blades. The erosion results in greater surface roughness and studies about the role of surface roughness on the HAWT power output were reviewed [34]. Moreover, published studies describing the role in energy loss of blade erosion due to raindrops were also reviewed [35] and it was concluded that the challenge now is to analyze in detail the blade surface in the wind park, in order to monitor the degradation rates in real time and in real environment conditions.
In addition to rainy and dusty environments, HAWTs operate in hailstorms as well. The aerodynamic behavior of NACA 0012 [36] and S809 [37] airfoils operating under hailstorm conditions was studied computationally. This study provides an exciting opportunity to advance our knowledge of the flow field over a three-bladed HAWT rotor, as well as the flow characteristics on an optimized blade, constructed by S809 airfoil and operating under hailstorm conditions at two different air velocities, equal to 10 m·s−1 and 15 m·s−1.
The present research explores, for the first time, the effects of hailstorm conditions on the flow field over a wind turbine rotor. Most studies in the field of wind energy have only focused on power degradation and erosion of blades due to rain or hailstones. Such approaches, however, have failed to address information about the entire flow field over the HAWT rotor. Previous studies of multiphase flows have focused on two-phase flows over a HAWT blade, such as dust and rain, and have not dealt with the computational study of hailstorm conditions, which is a three-phase flow.
The importance and originality of this study are that it explores not only the power output of a HAWT operating under these conditions, but it also gives information about the entire flow field, i.e., regions on the blade which are subjected to erosion, as well as information about the wake development downwind of the HAWT rotor. The findings should make an important contribution to the field of HAWT rotor aerodynamics under hazardous conditions. The numerical work presented here provides one of the first investigations into the entire flow field over a HAWT, when raindrops and hailstones prevail.
This study provides an exciting opportunity to advance our knowledge of the flow field over a three-bladed HAWT rotor, as well as the flow characteristics on an optimized blade, constructed by S809 airfoil and operating in hailstorm conditions and at two different air velocities. The findings from the present study contribute in several ways to our understanding of the effects of hailstorm on aerodynamic behavior of a three-bladed HAWT and provide a basis for recommendations for wind turbine blade designs, for HAWTs placed in regions with frequent hailstorms.

2. Computational Methodology

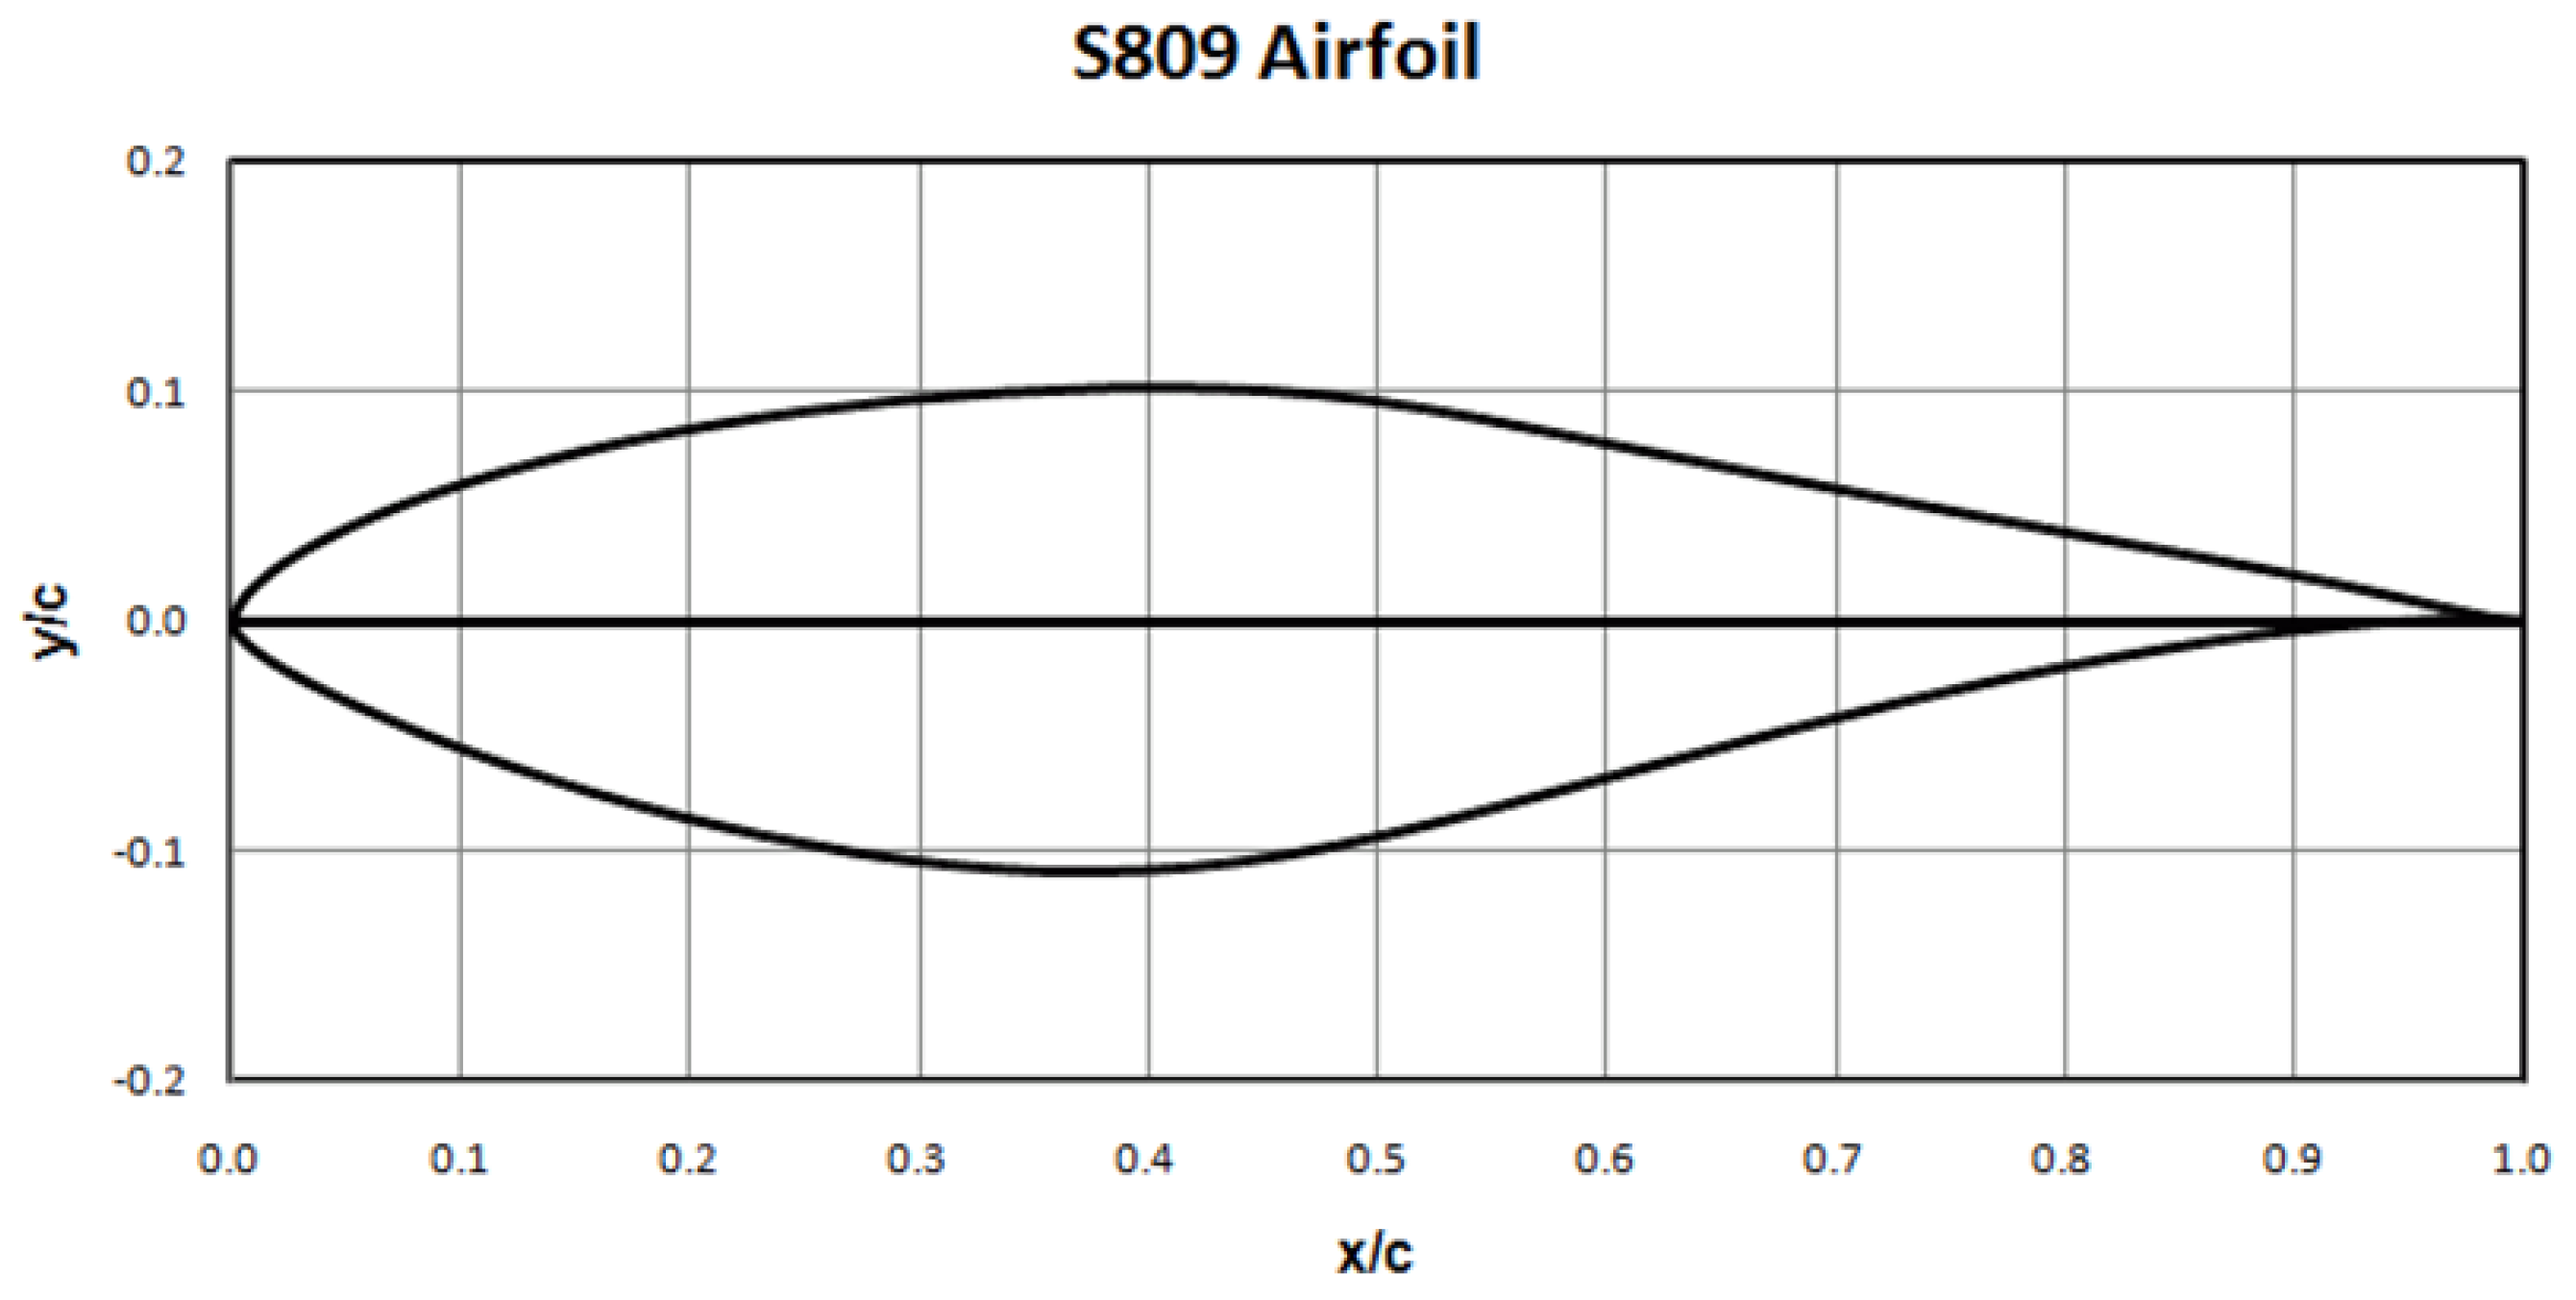
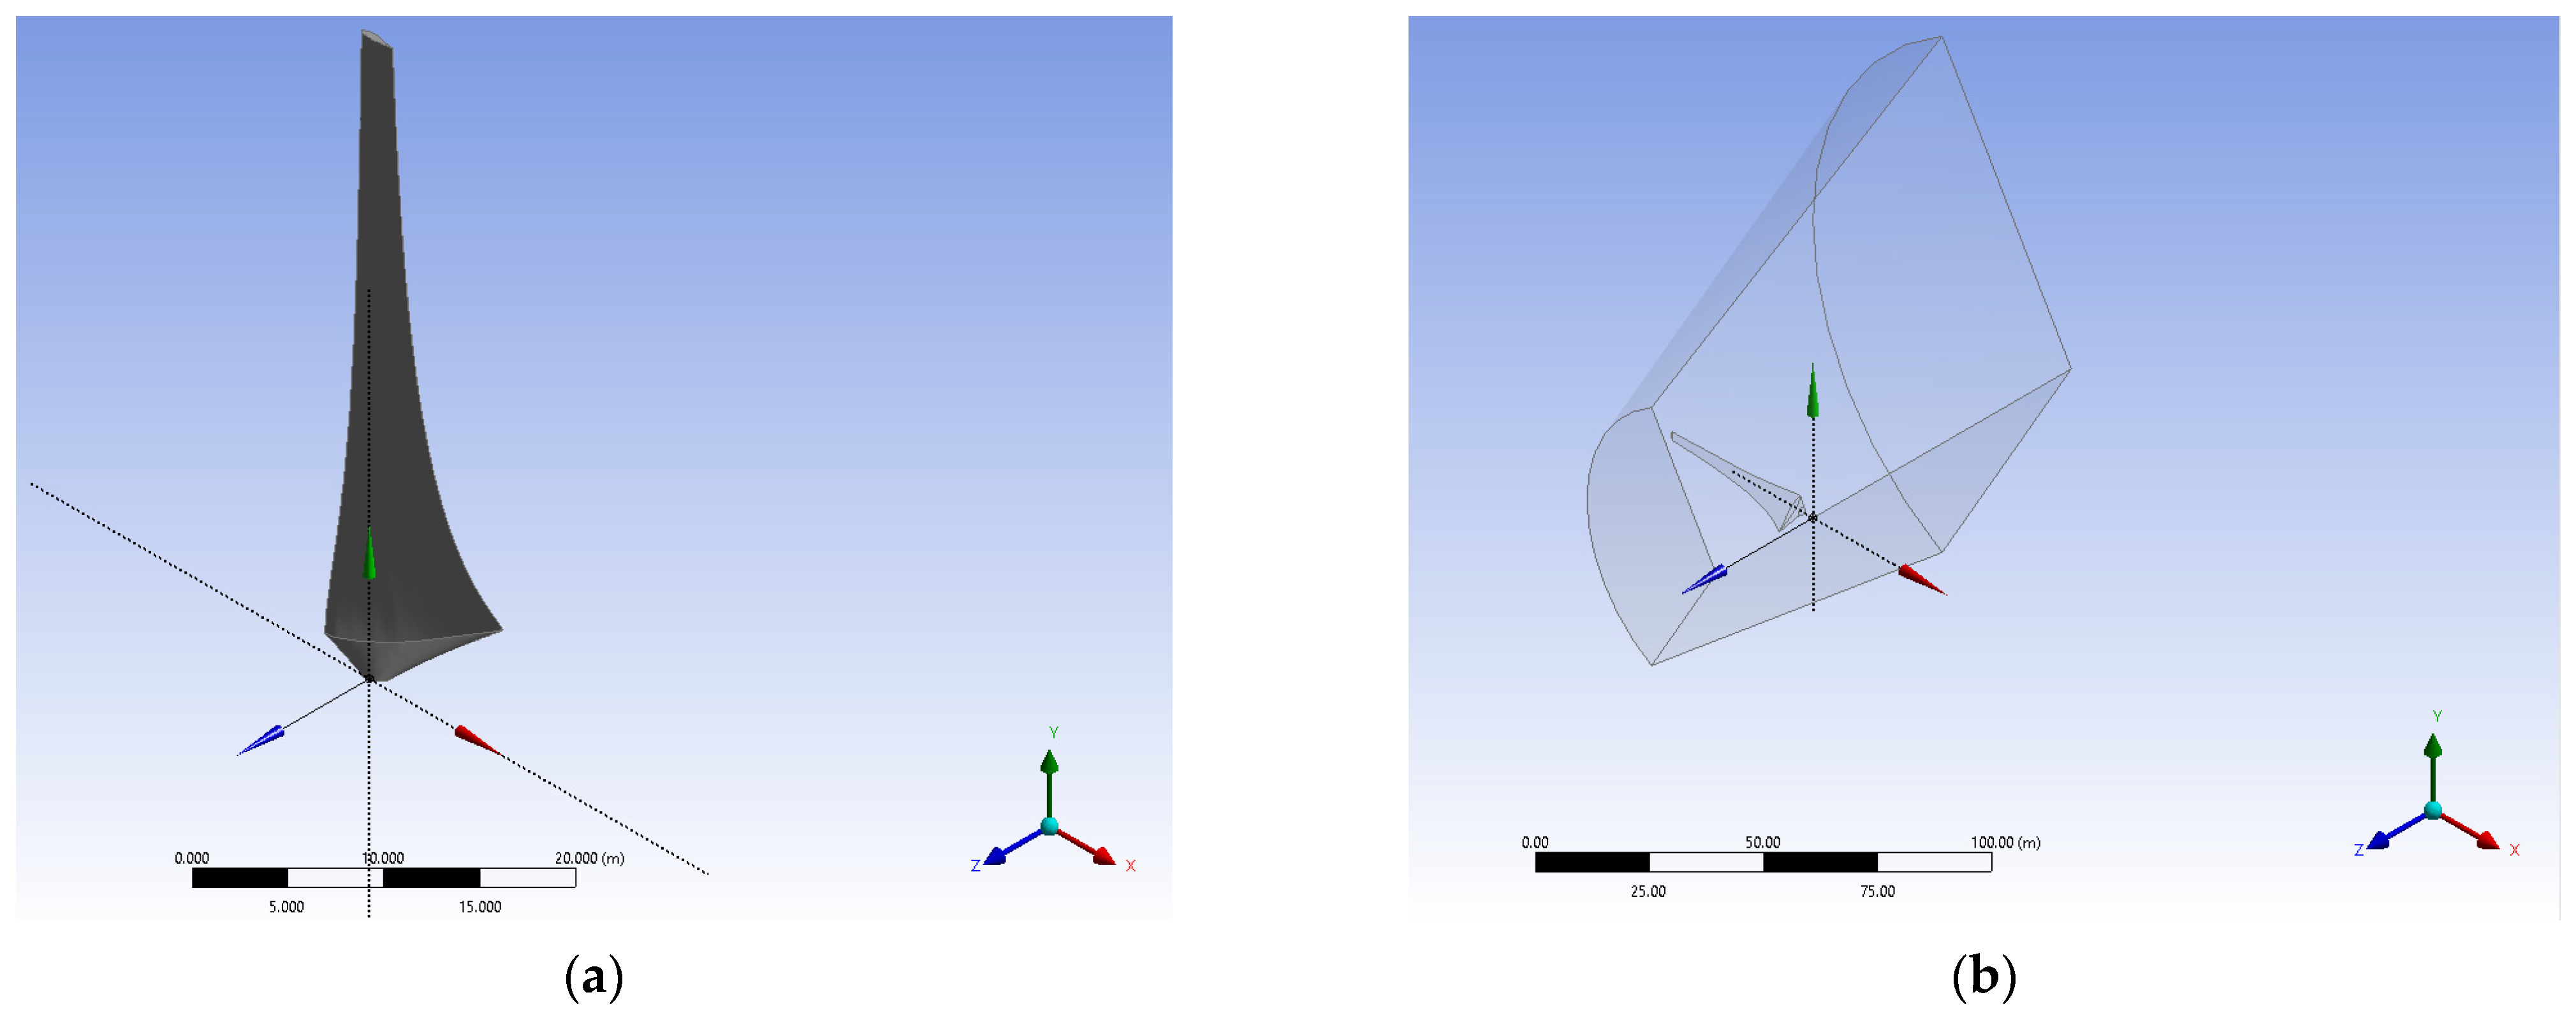
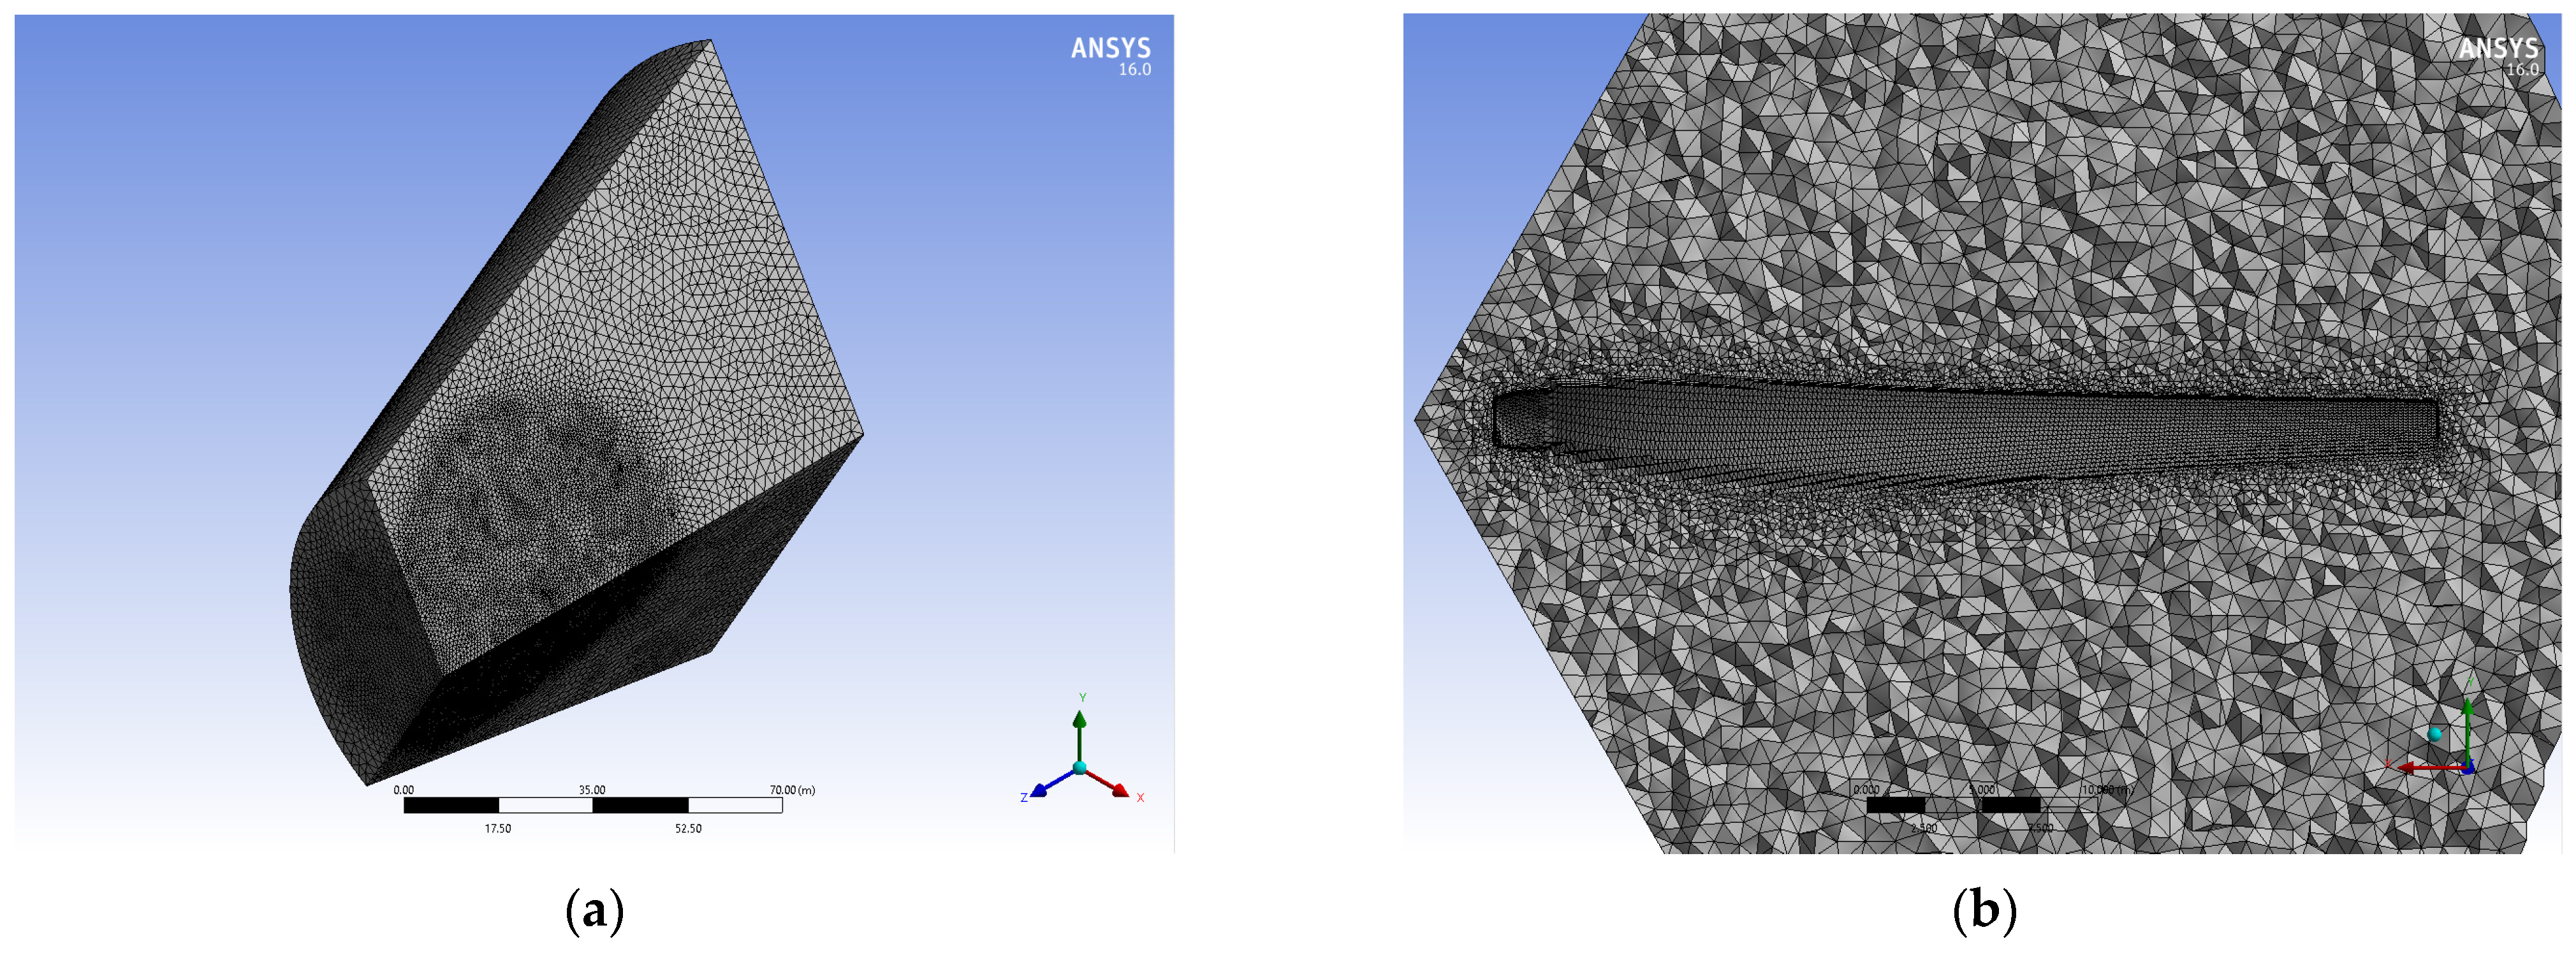
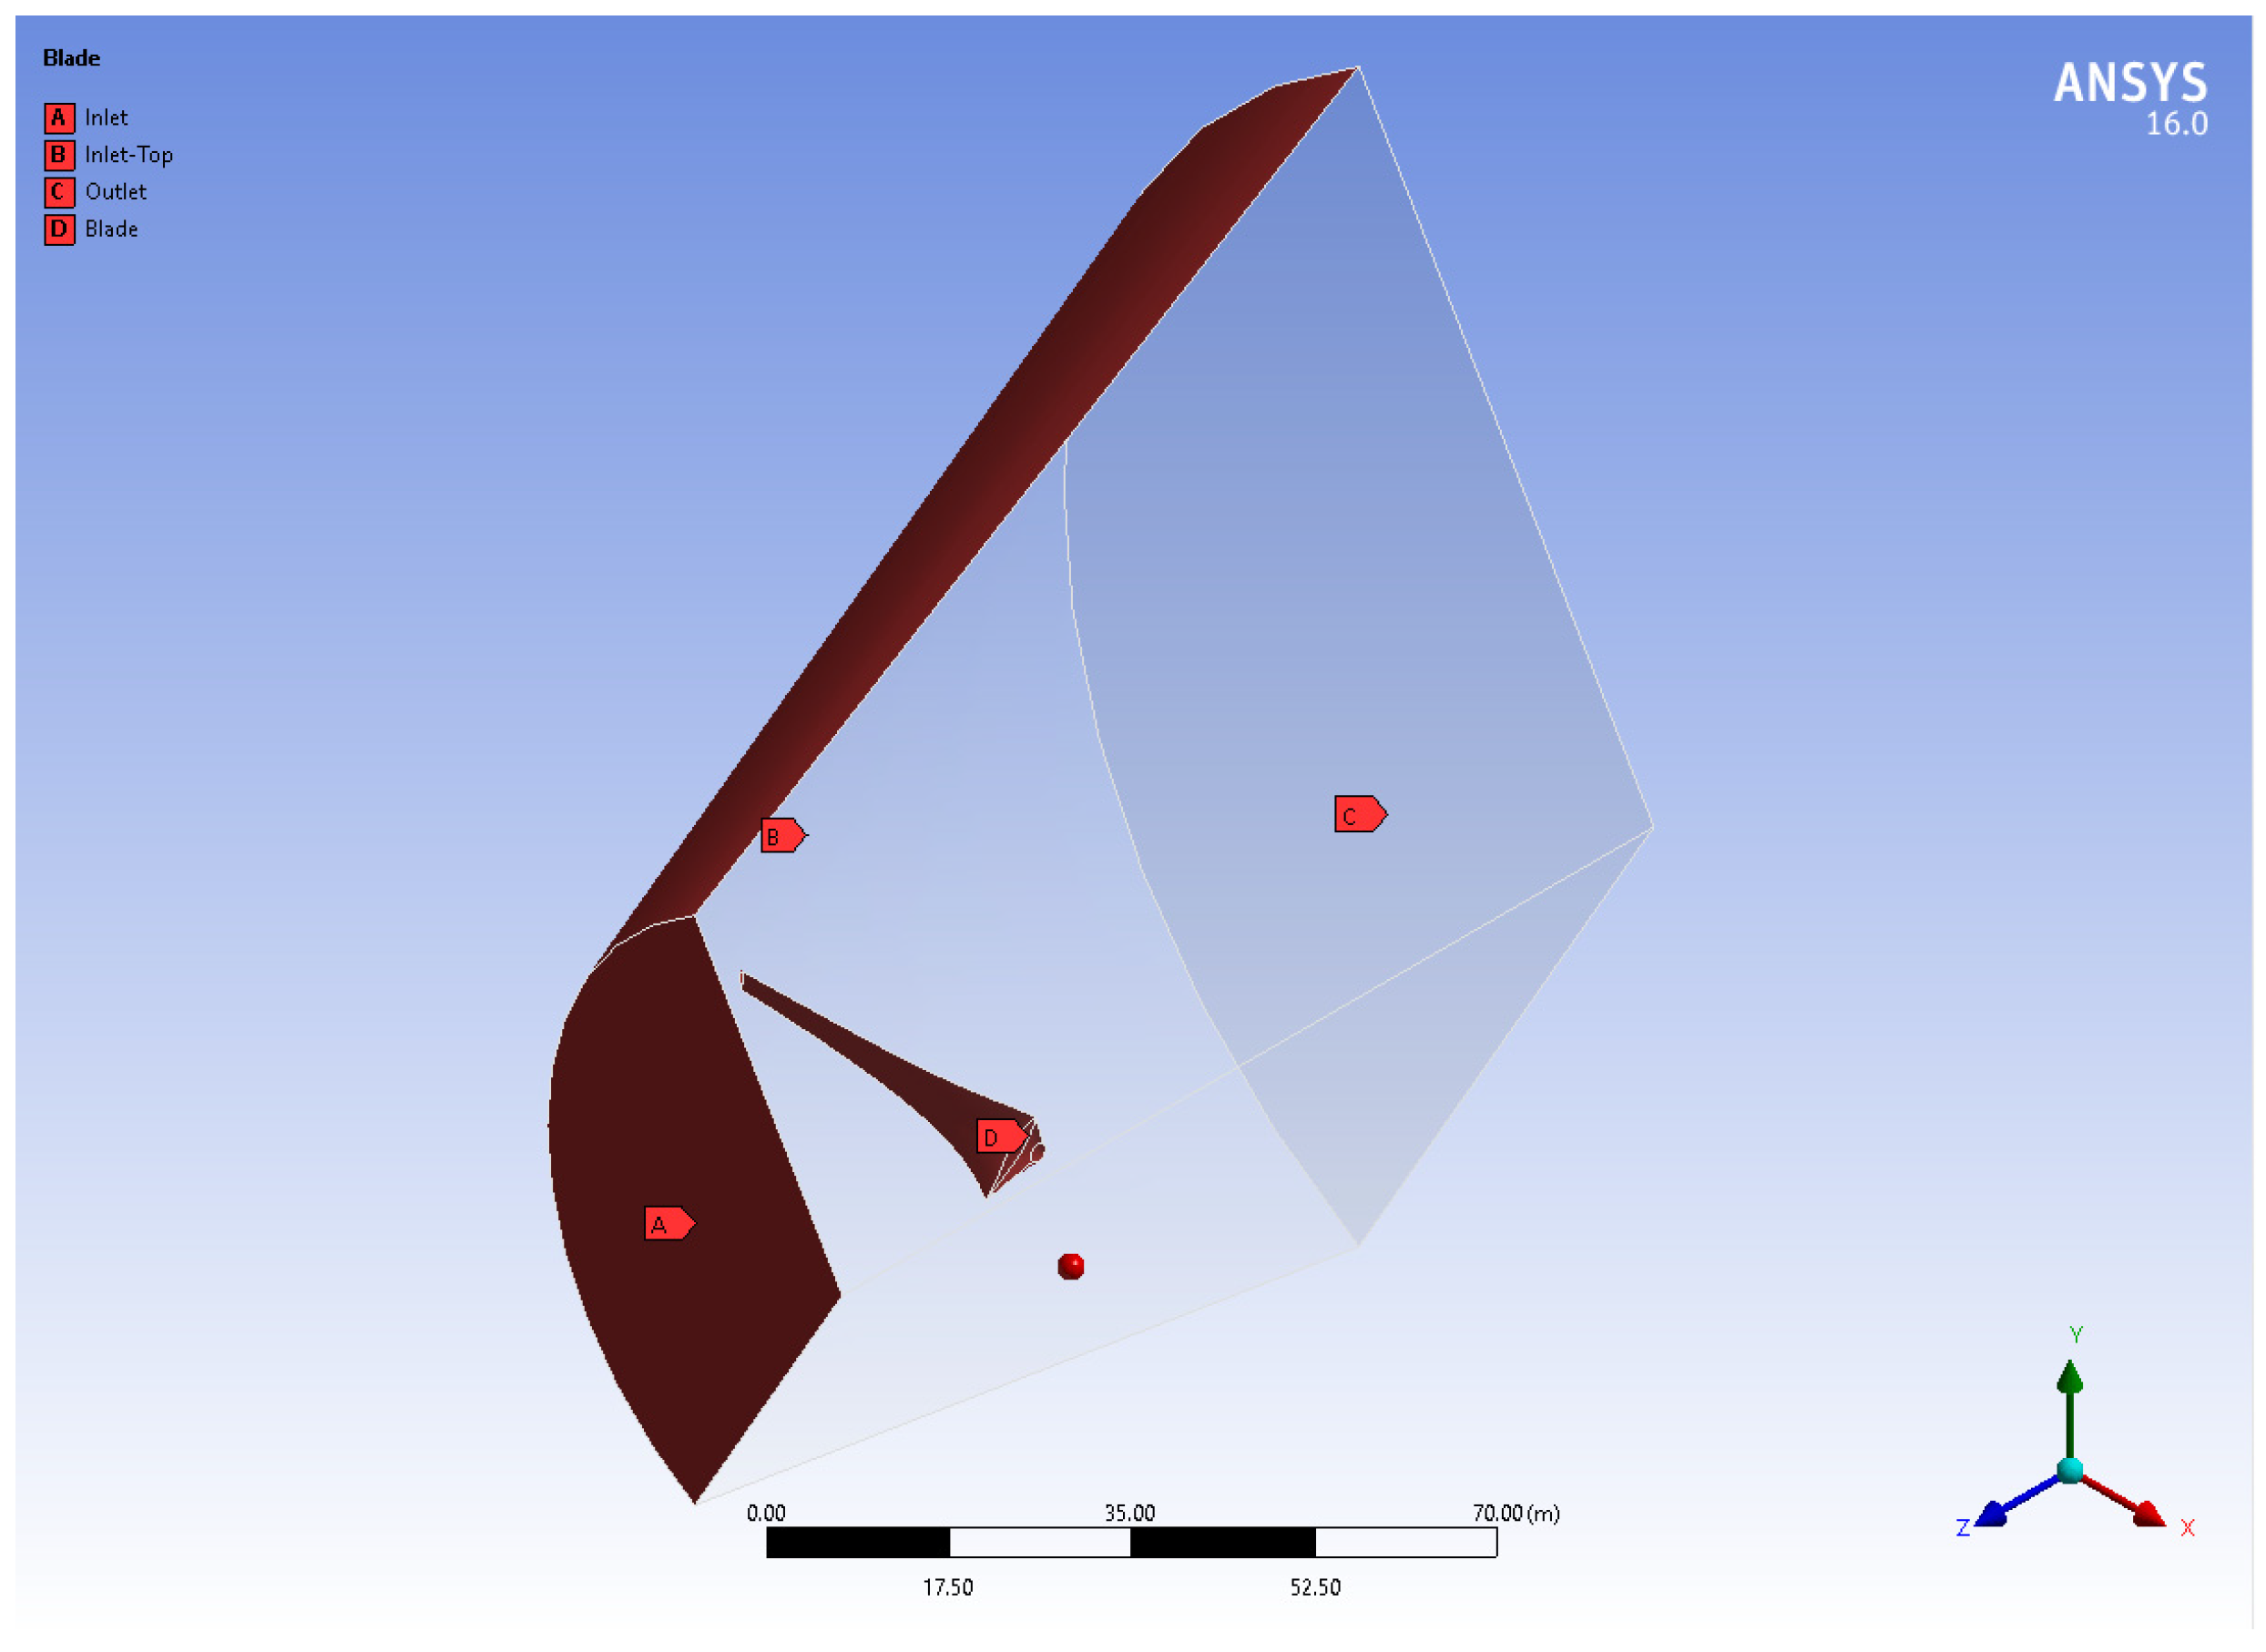
2.1. Blade Geometry, Computational Mesh and Boundary Conditions

The first step in the construction of three-dimensional geometry is to determine the optimal geometry of the three-bladed wind turbine blade using the NREL S809 airfoil, which is widely used in the construction of HAWTs blades. The S809 airfoil is a 21% thickness at 39.5% chord airfoil, which is specially designed for HAWT applications, studied theoretically and validated experimentally in the Delft University of Technology by Somers [38]. The main characteristics of S809 airfoil are that it achieves relative lower maximum lift and lower drag than other airfoils, and at the same time it is insensitive to leading-edge roughness. Figure 1 shows the S809 airfoil and its coordinates in graphical representation [39].
In order to find the optimal geometry, the TTBEM application [40] was used, in which the desired characteristics of the wind turbine rotor were introduced, such as the length of the blade, which was chosen to be equal to 40 m, the number of blades and the airfoil from which they are constructed, the Tip Speed Ratio (TSR) which was set equal to 6, and the air velocity and density.
Subsequently, the Qblade [41] application was used to construct the blade, which was eventually introduced into the ANSYS 16.0 DesignModeler [42], where the appropriate computational domain around the blade was designed. Only one of the blades was designed and analyzed, while the remaining two blades were included to the simulation by using periodic boundary conditions, with a periodicity of 120° (Figure 2). HAWT tower, as well as hub are not included in the simulation procedure since their effect on the aerodynamic performance of the rotor is negligible.
The computational domain, in other words, the region around the blade geometry where the solution of the flow field is essential, is horizontally positioned and is one third of a truncated cone, with its front size positioned 0.75 times the blade length upstream and two times the blade length downstream of the blade. The radius of the front side of the truncated cone is set equal to the blade length and the radius of the lateral side is two times the blade length.
The grid created in three dimensions is hybrid, specifically structured near the surface of the blade and unstructured in the domain around it and it is demonstrated in Figure 3. The grid thickens near the blade for better approximation of the flow field, where more intense changes in flow occur due to the twist and the curvature of the blade. A grid independence study was then conducted, and it was found that the most suitable grid consists of approximately 1,400,000 tetrahedral and hexahedral cells, since the calculated power output of the HAWT with this grid was found to have the smallest difference with the power calculated by the TTBEM application [40]. The boundary conditions of the problem were then defined. In particular, the front and the upper side of the computational domain are set as velocity inlet and the lateral side as pressure outlet (Figure 4).

2.2. Simulation Procedure

The simulated air velocities were set equal to 10 m·s−1 and 15 m·s−1, which are typical air velocities for HAWTs’ operation. Two different air velocities were studied in order to show the dependence of air velocity on the performance of HAWTs under hailstorm conditions. Firstly, simulations of airflow over the blade were conducted and then of hailstorm conditions, so as to be able to compare not only the power output but the whole flow field as well.
The SST k-ω turbulence model [43] was selected for the simulations, as it is the most suitable for such problems due to its ability to precisely predict adverse pressure gradient flows. The solution of the flow equations governing the rotation of the HAWT rotor in ANSYS Fluent 16.0 [42] is performed on a moving reference system, in relation to which the flow is considered stable over time. This is achieved by defining specific air zones as moving parts, while activating the Moving Reference Frame Model (MRF). The terms of acceleration, resulting from the conversion of the inertial reference system to rotating, are included in the equations of motion.
Hailstorm simulation was accomplished by the Discrete Phase Model (DPM). Usually, hailstorms occur simultaneously with rainfall; thus, hailstones and raindrops, considered spherical particles, are dispersed in the air, which is the continuous medium. For the computational study, the diameter of both particles was considered 0.5 mm, with average mass flow rates W ¯ r a i n = 2.16 g·m−3 and W ¯ h a i l = 1.24 g·m−3, respectively, as obtained from the experimental measurements by Federer and Waldvogel [44]. The raindrops are considered to be water and the hailstones ice, since the majority of them are ice, so their density was set equal to the ice density, i.e., 0.9 kg·m−3. The orbit of each particle is calculated by integrating the equation of its inertia with the forces that affect it.
In an effort to decrease both computational time and memory, the hailstones and raindrops are injected in the flow from a rectangular area, placed in the minimum distance upstream from the blade, where the flow is still undisturbed. The particles are introduced with initial velocity in the horizontal axis equal to the air velocity and in the vertical axis equal to the free fall velocity, which is calculated by Markowitz’s [45] empirical equation for raindrops:
W w a t e r = 9.58 [ 1 e x p ( d 1.147 1.77 ) ] ,
and by Douglas [46] equation for hailstones:
W h a i l = 5.12 d ,
where d is the diameter of raindrops and hailstones in mm, respectively. It is worth noting that the raindrops are broken down into smaller ones as they impact the blade by the help of the Taylor Analogy Breakup (TAB) model [47].

3. Results

The operation of the HAWT blade was studied initially under airflow and then under hailstorm conditions, in order to estimate the power output degradation under these conditions. Since the validation of the current model is unfeasible due to the lack of corresponding experimental data, the obtained results about power output were compared with the power output of commercial HAWTs of the same rotor dimensions and at air velocity equal to 10 m·s−1 [48] (Table 1).
Table 2 shows the calculated power of the three-bladed HAWT in MW, as estimated by the TTBEM application [40] and ANSYS Fluent 16.0 [42] for airflow. This shows that the estimated value deviation for each air velocity is negligible and that, with increasing air velocity, the power increases rapidly. Table 3 demonstrates the calculated power output of the three-bladed HAWT under hailstorm conditions and its percentage degradation. This shows that as the air velocity increases, the percentage change in power decreases, as hailstones and droplets are more easily carried away by the air.

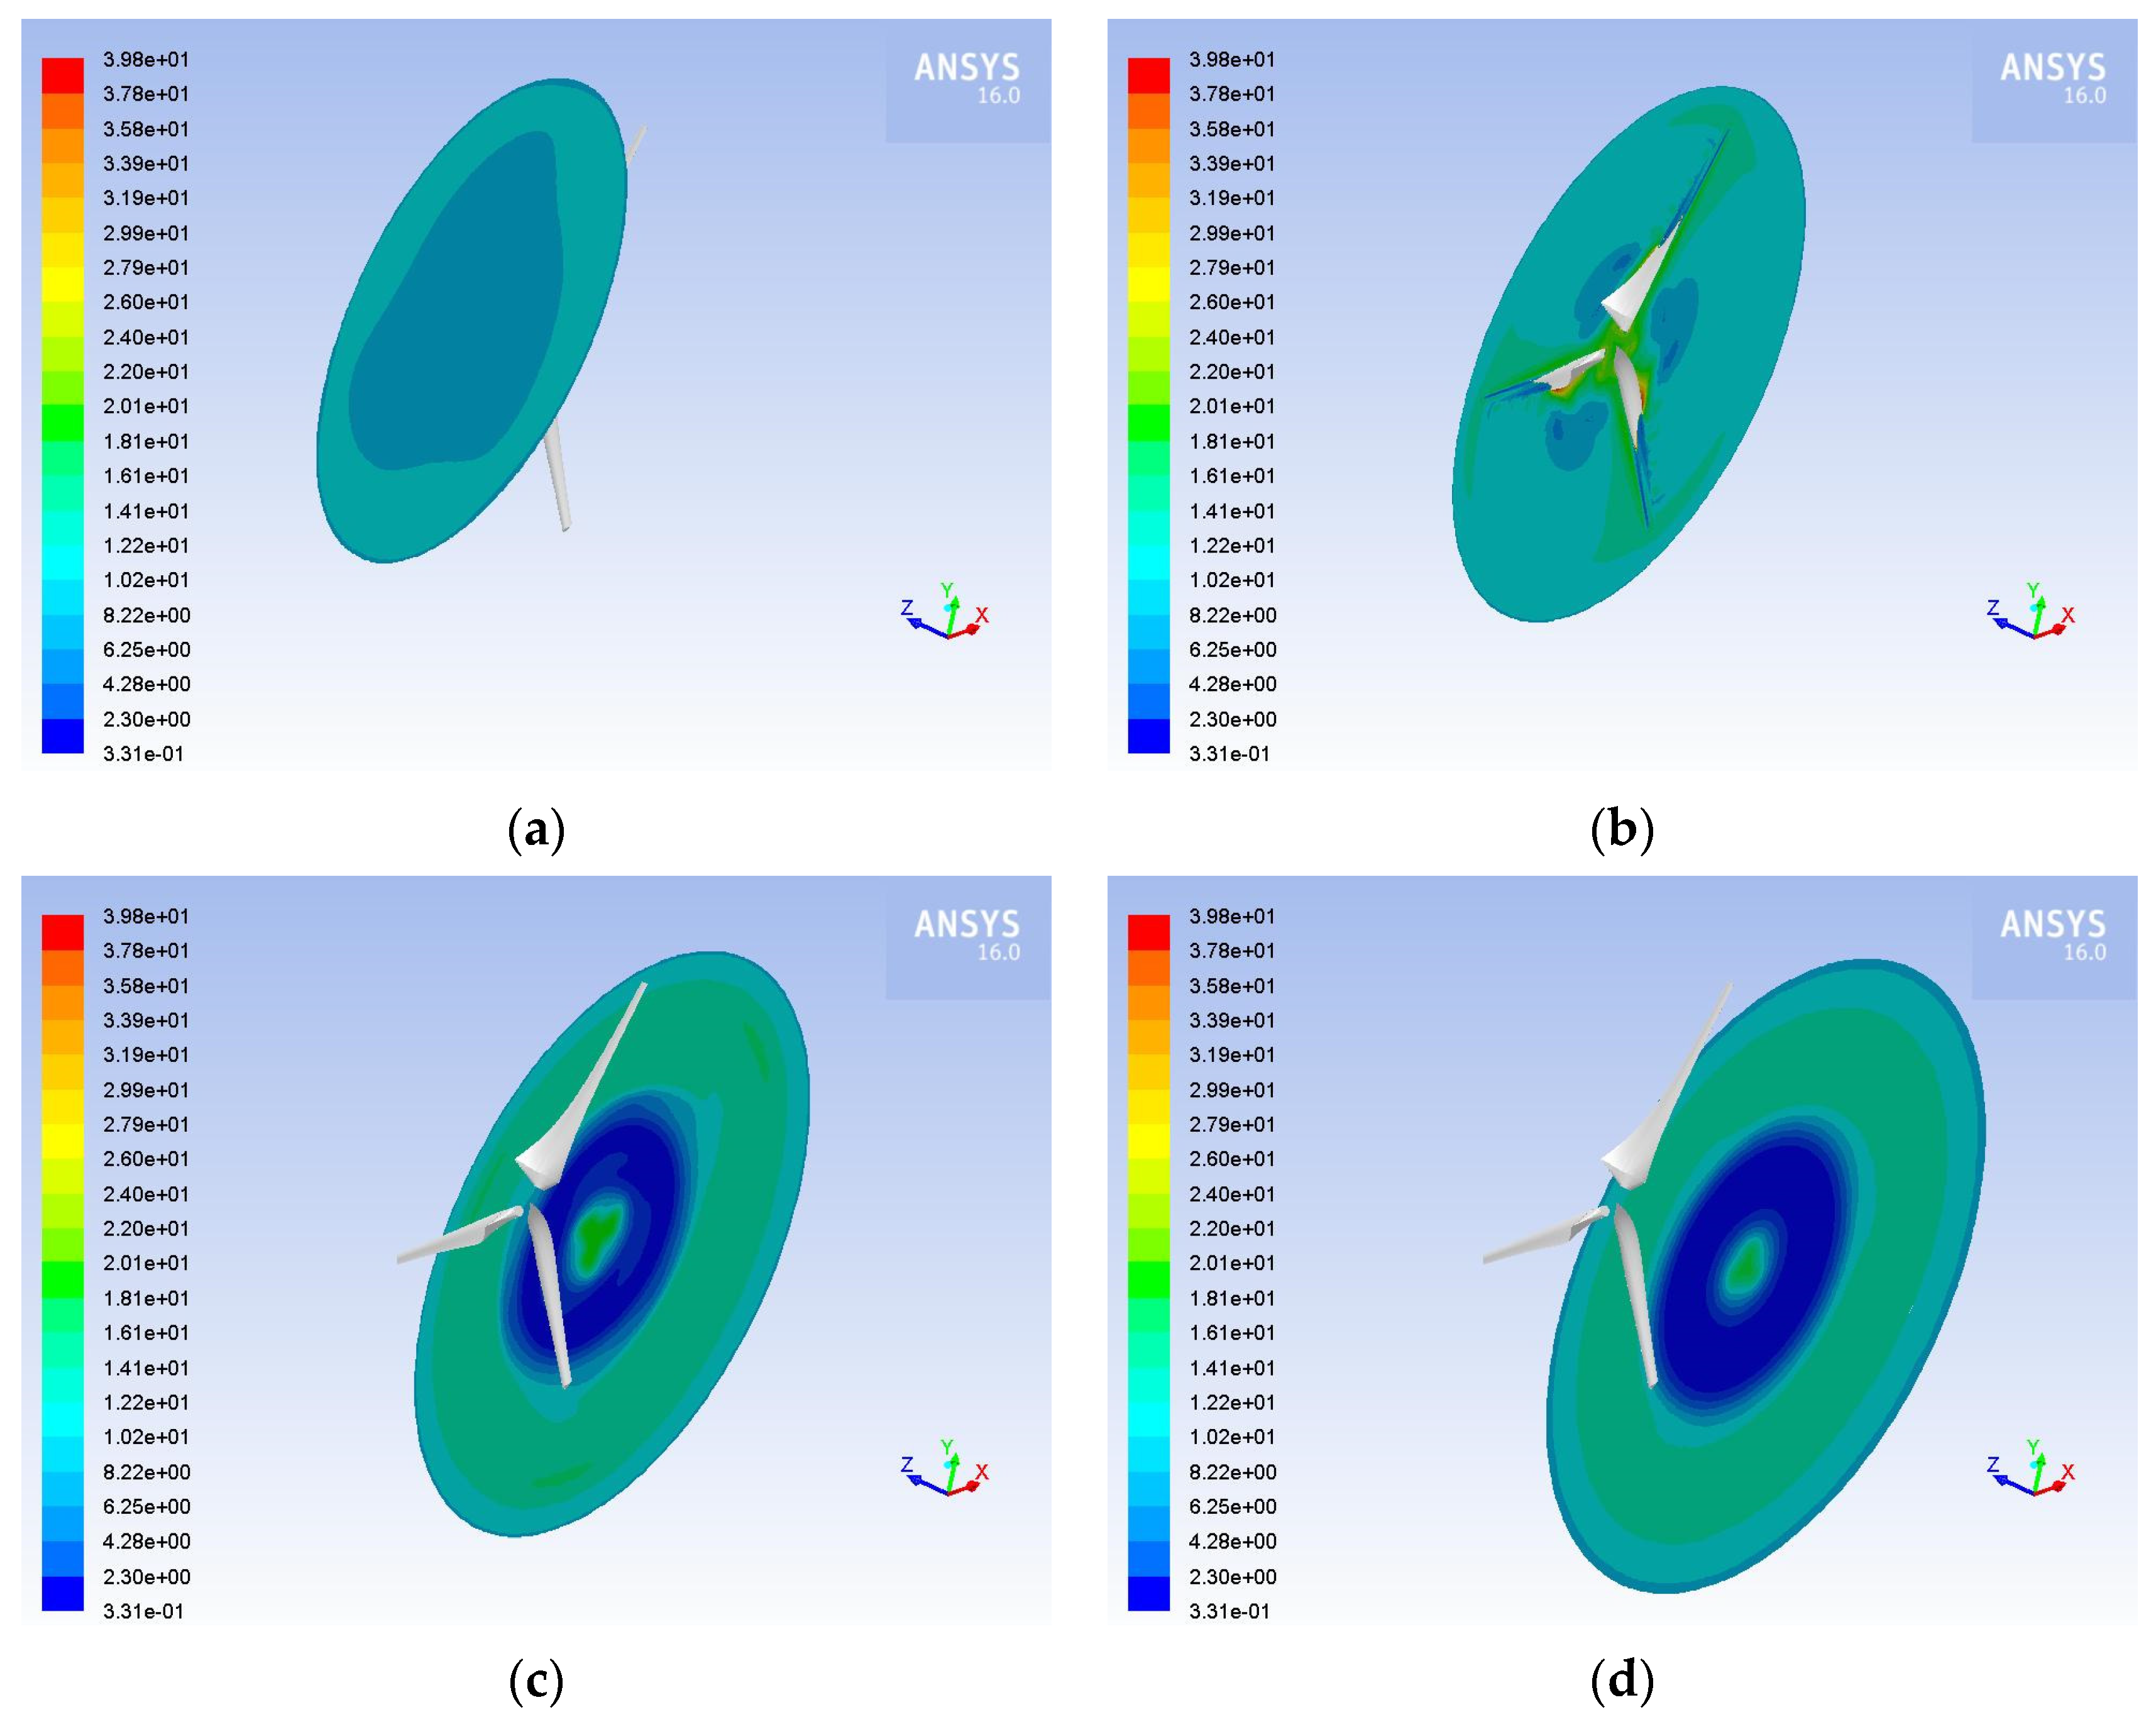
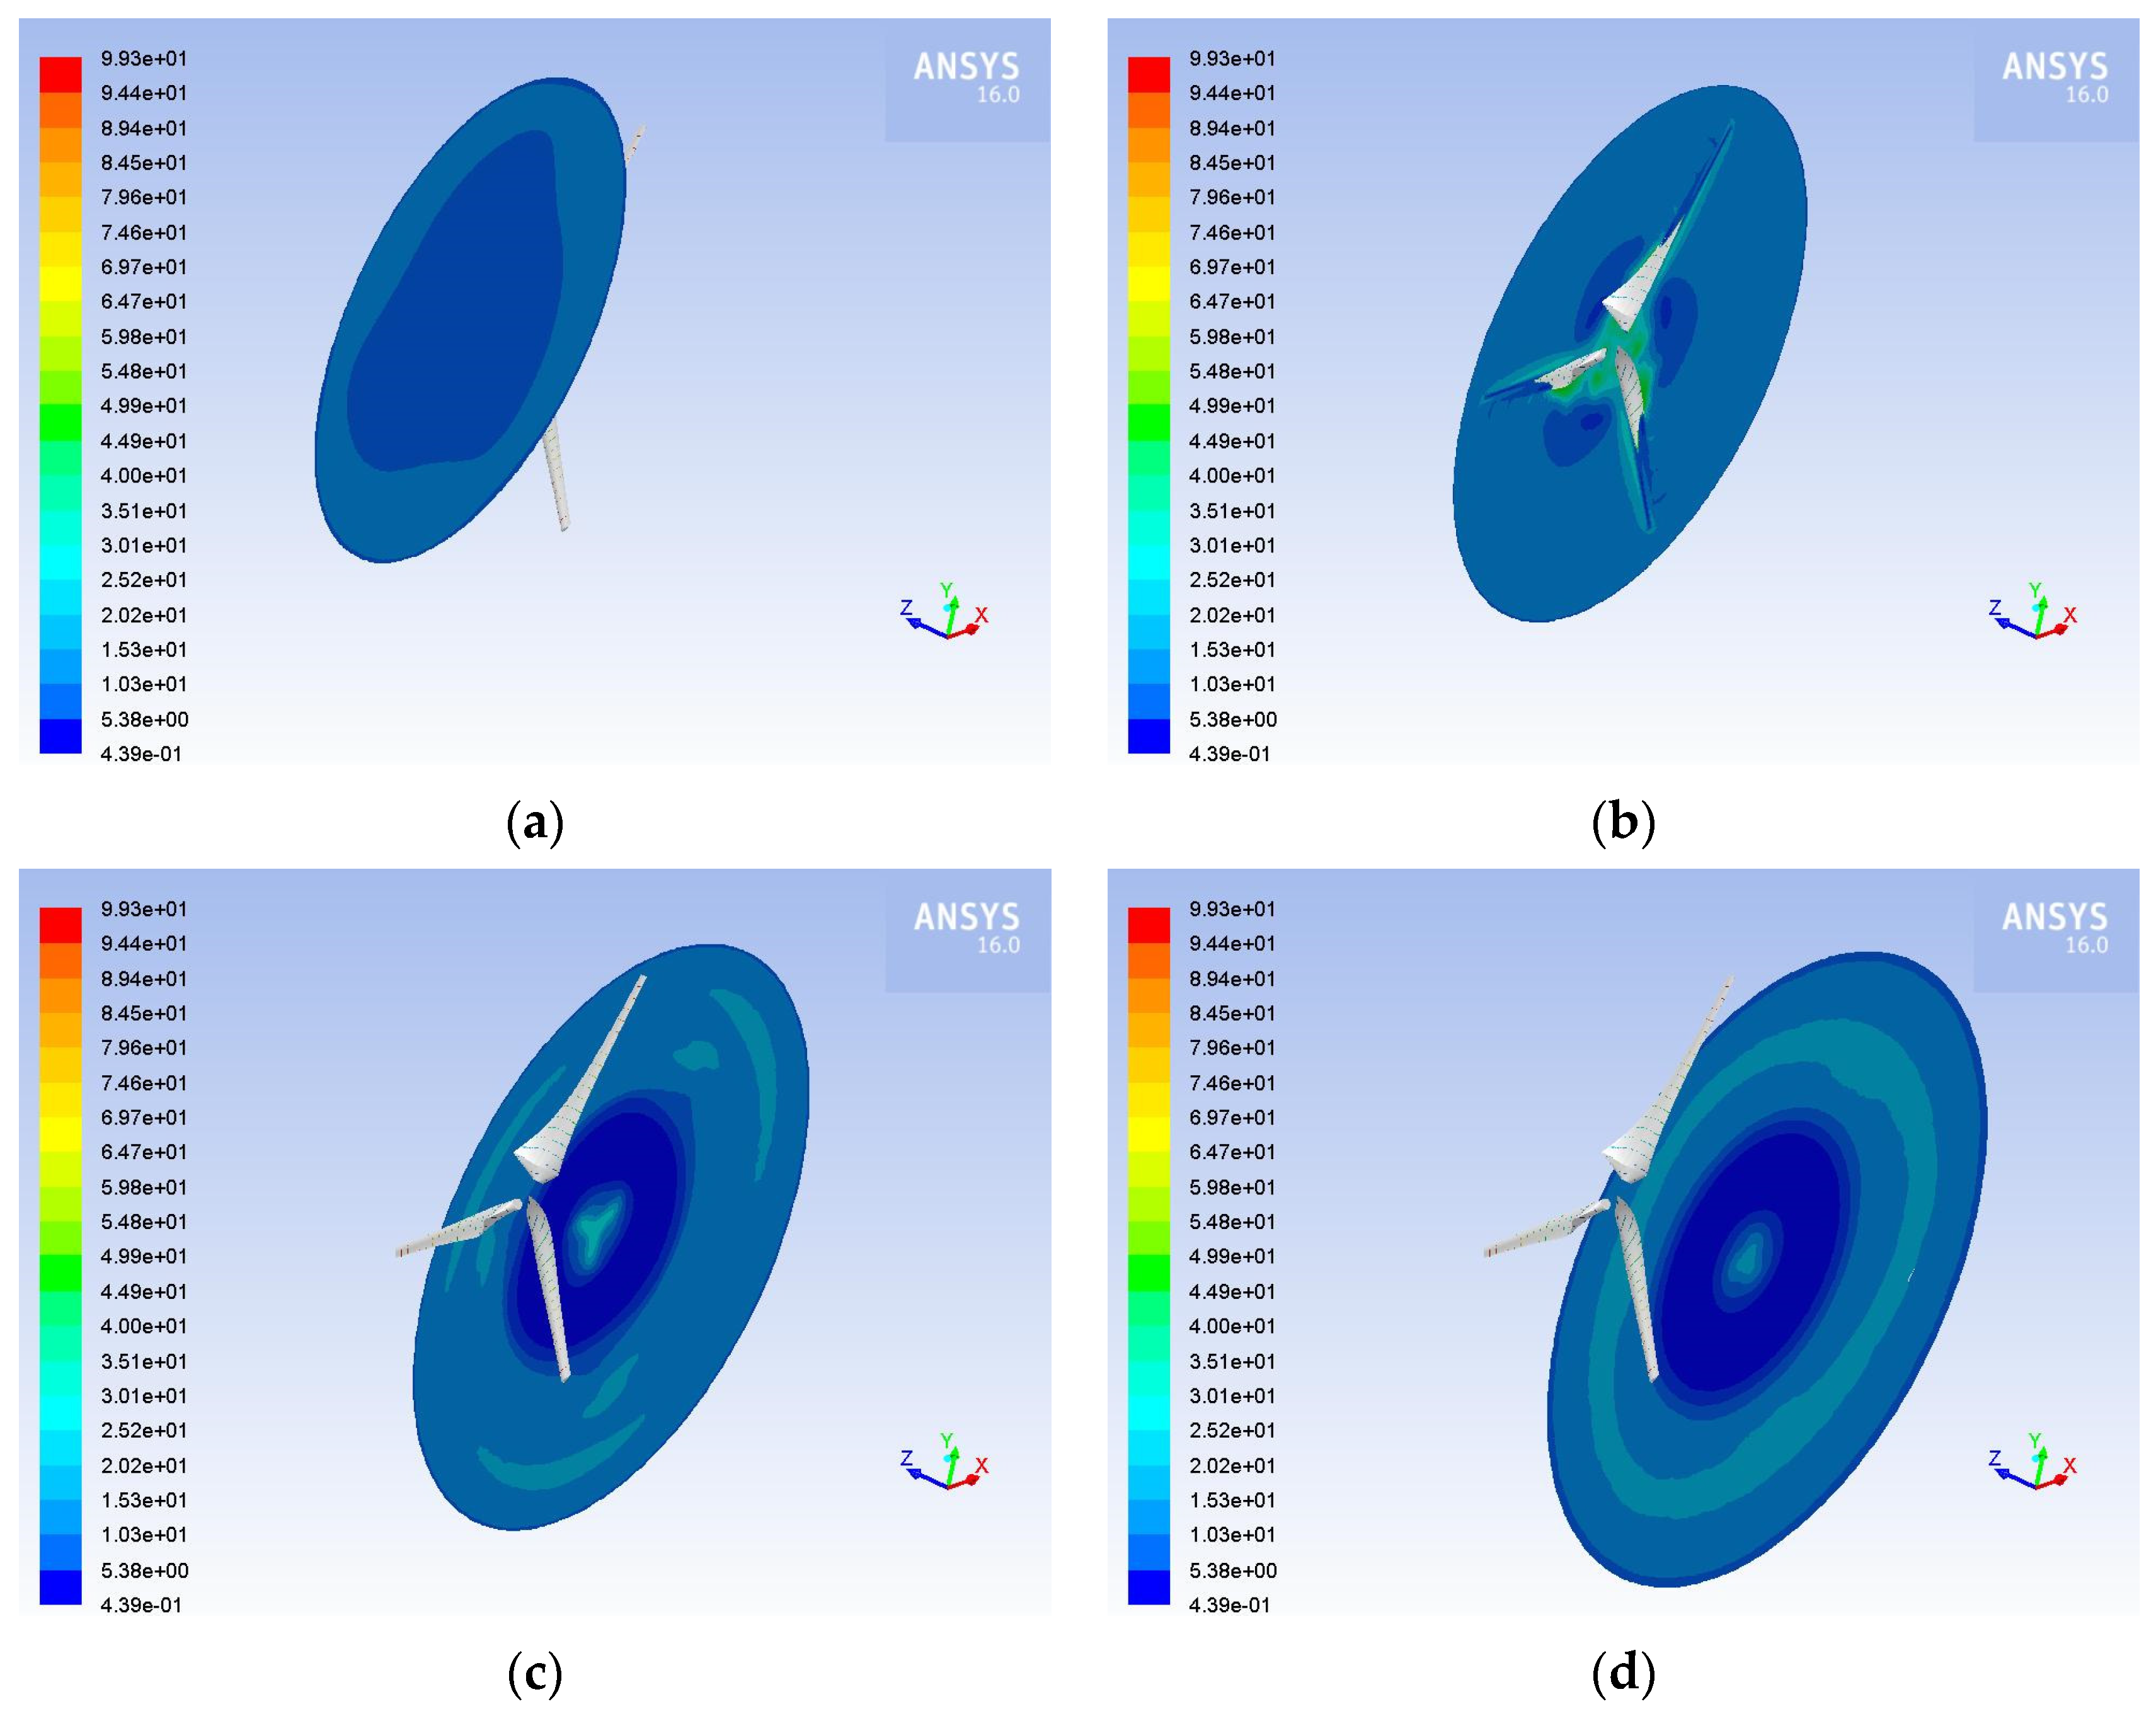
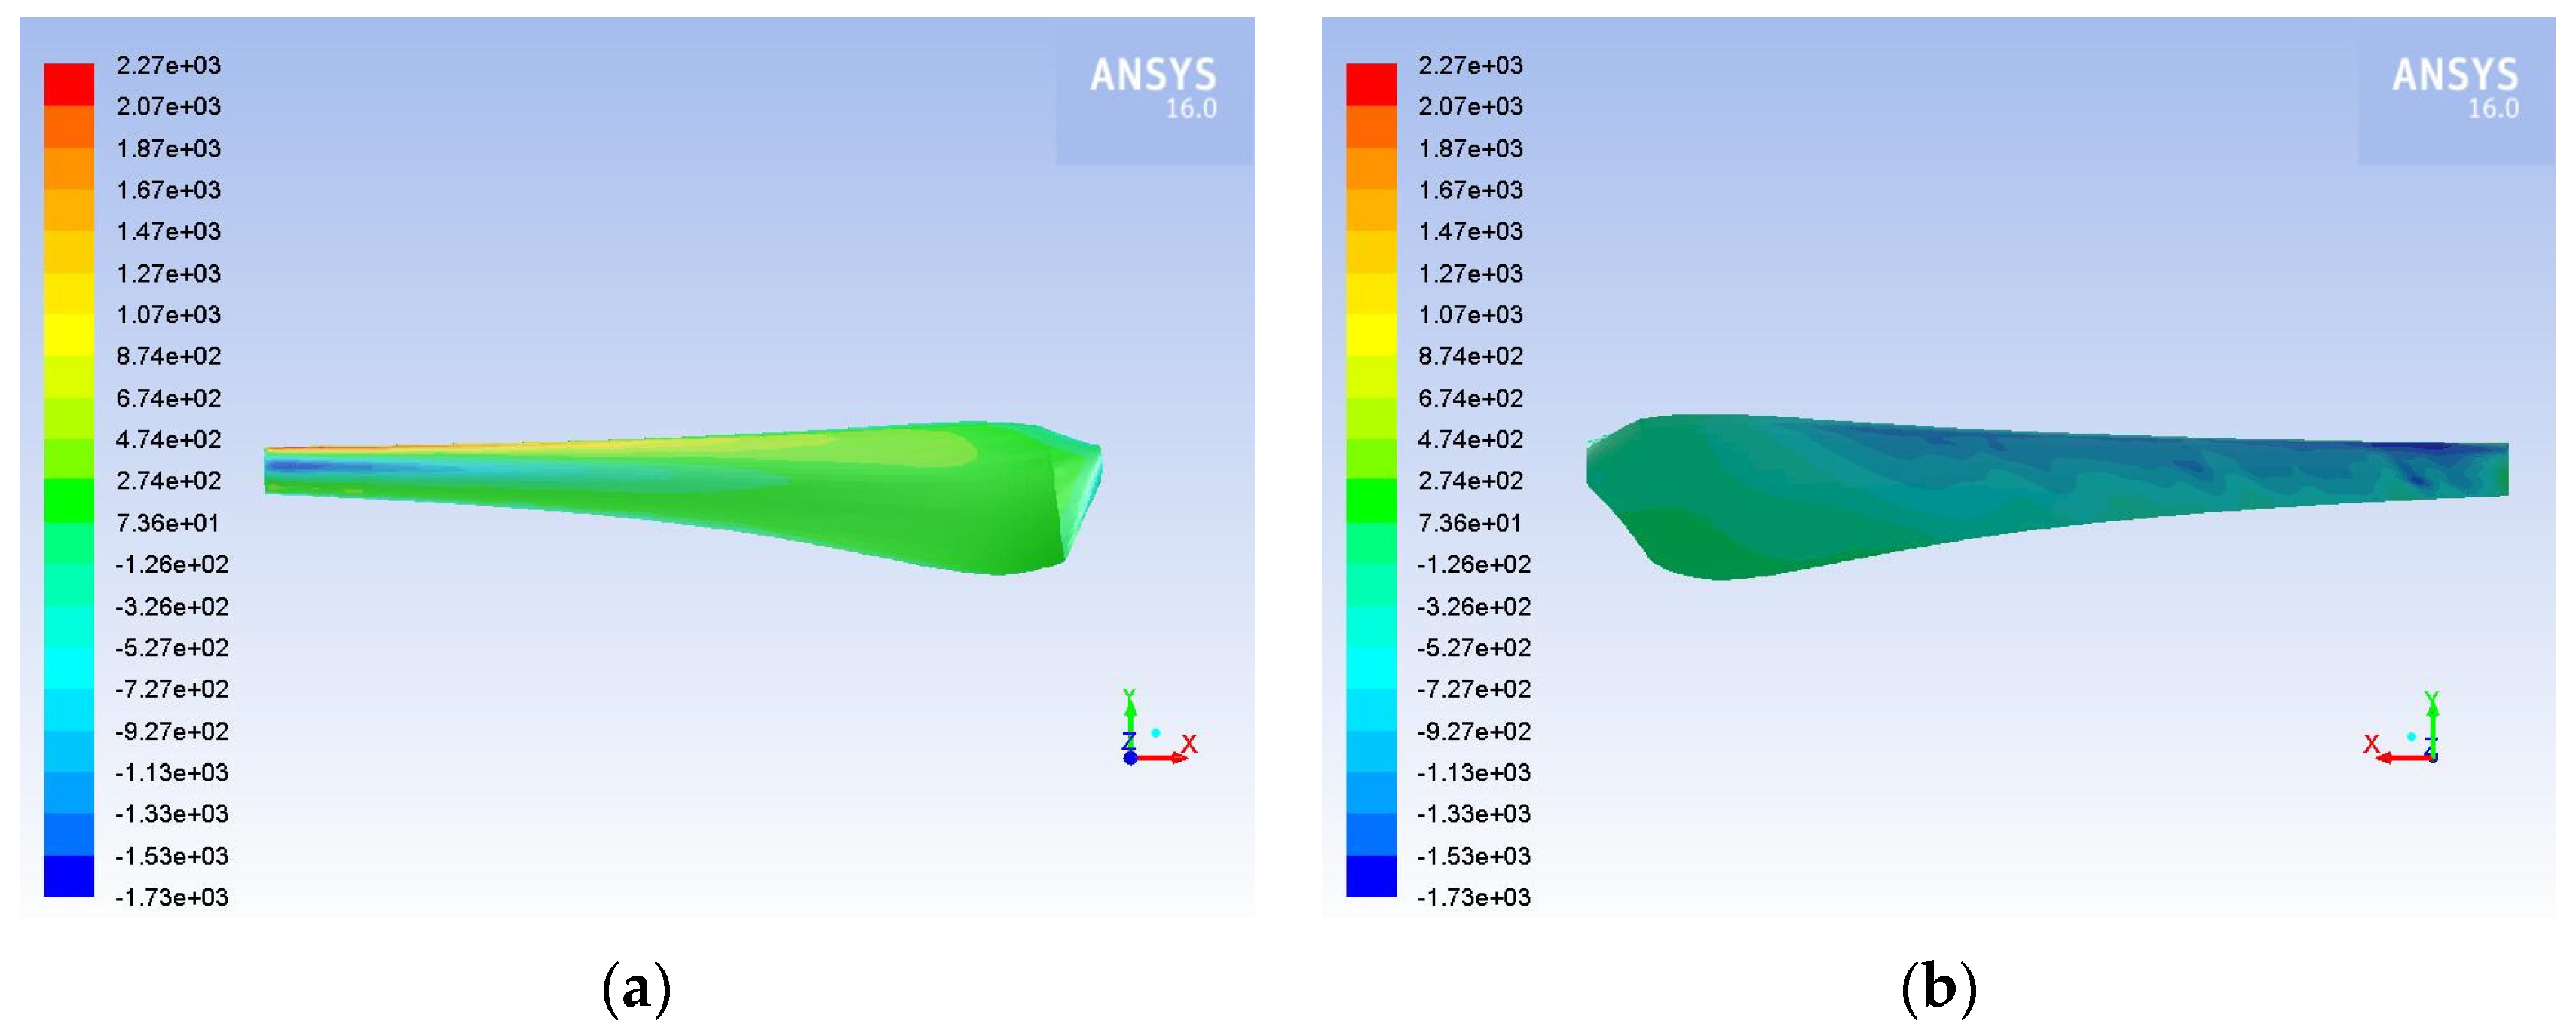
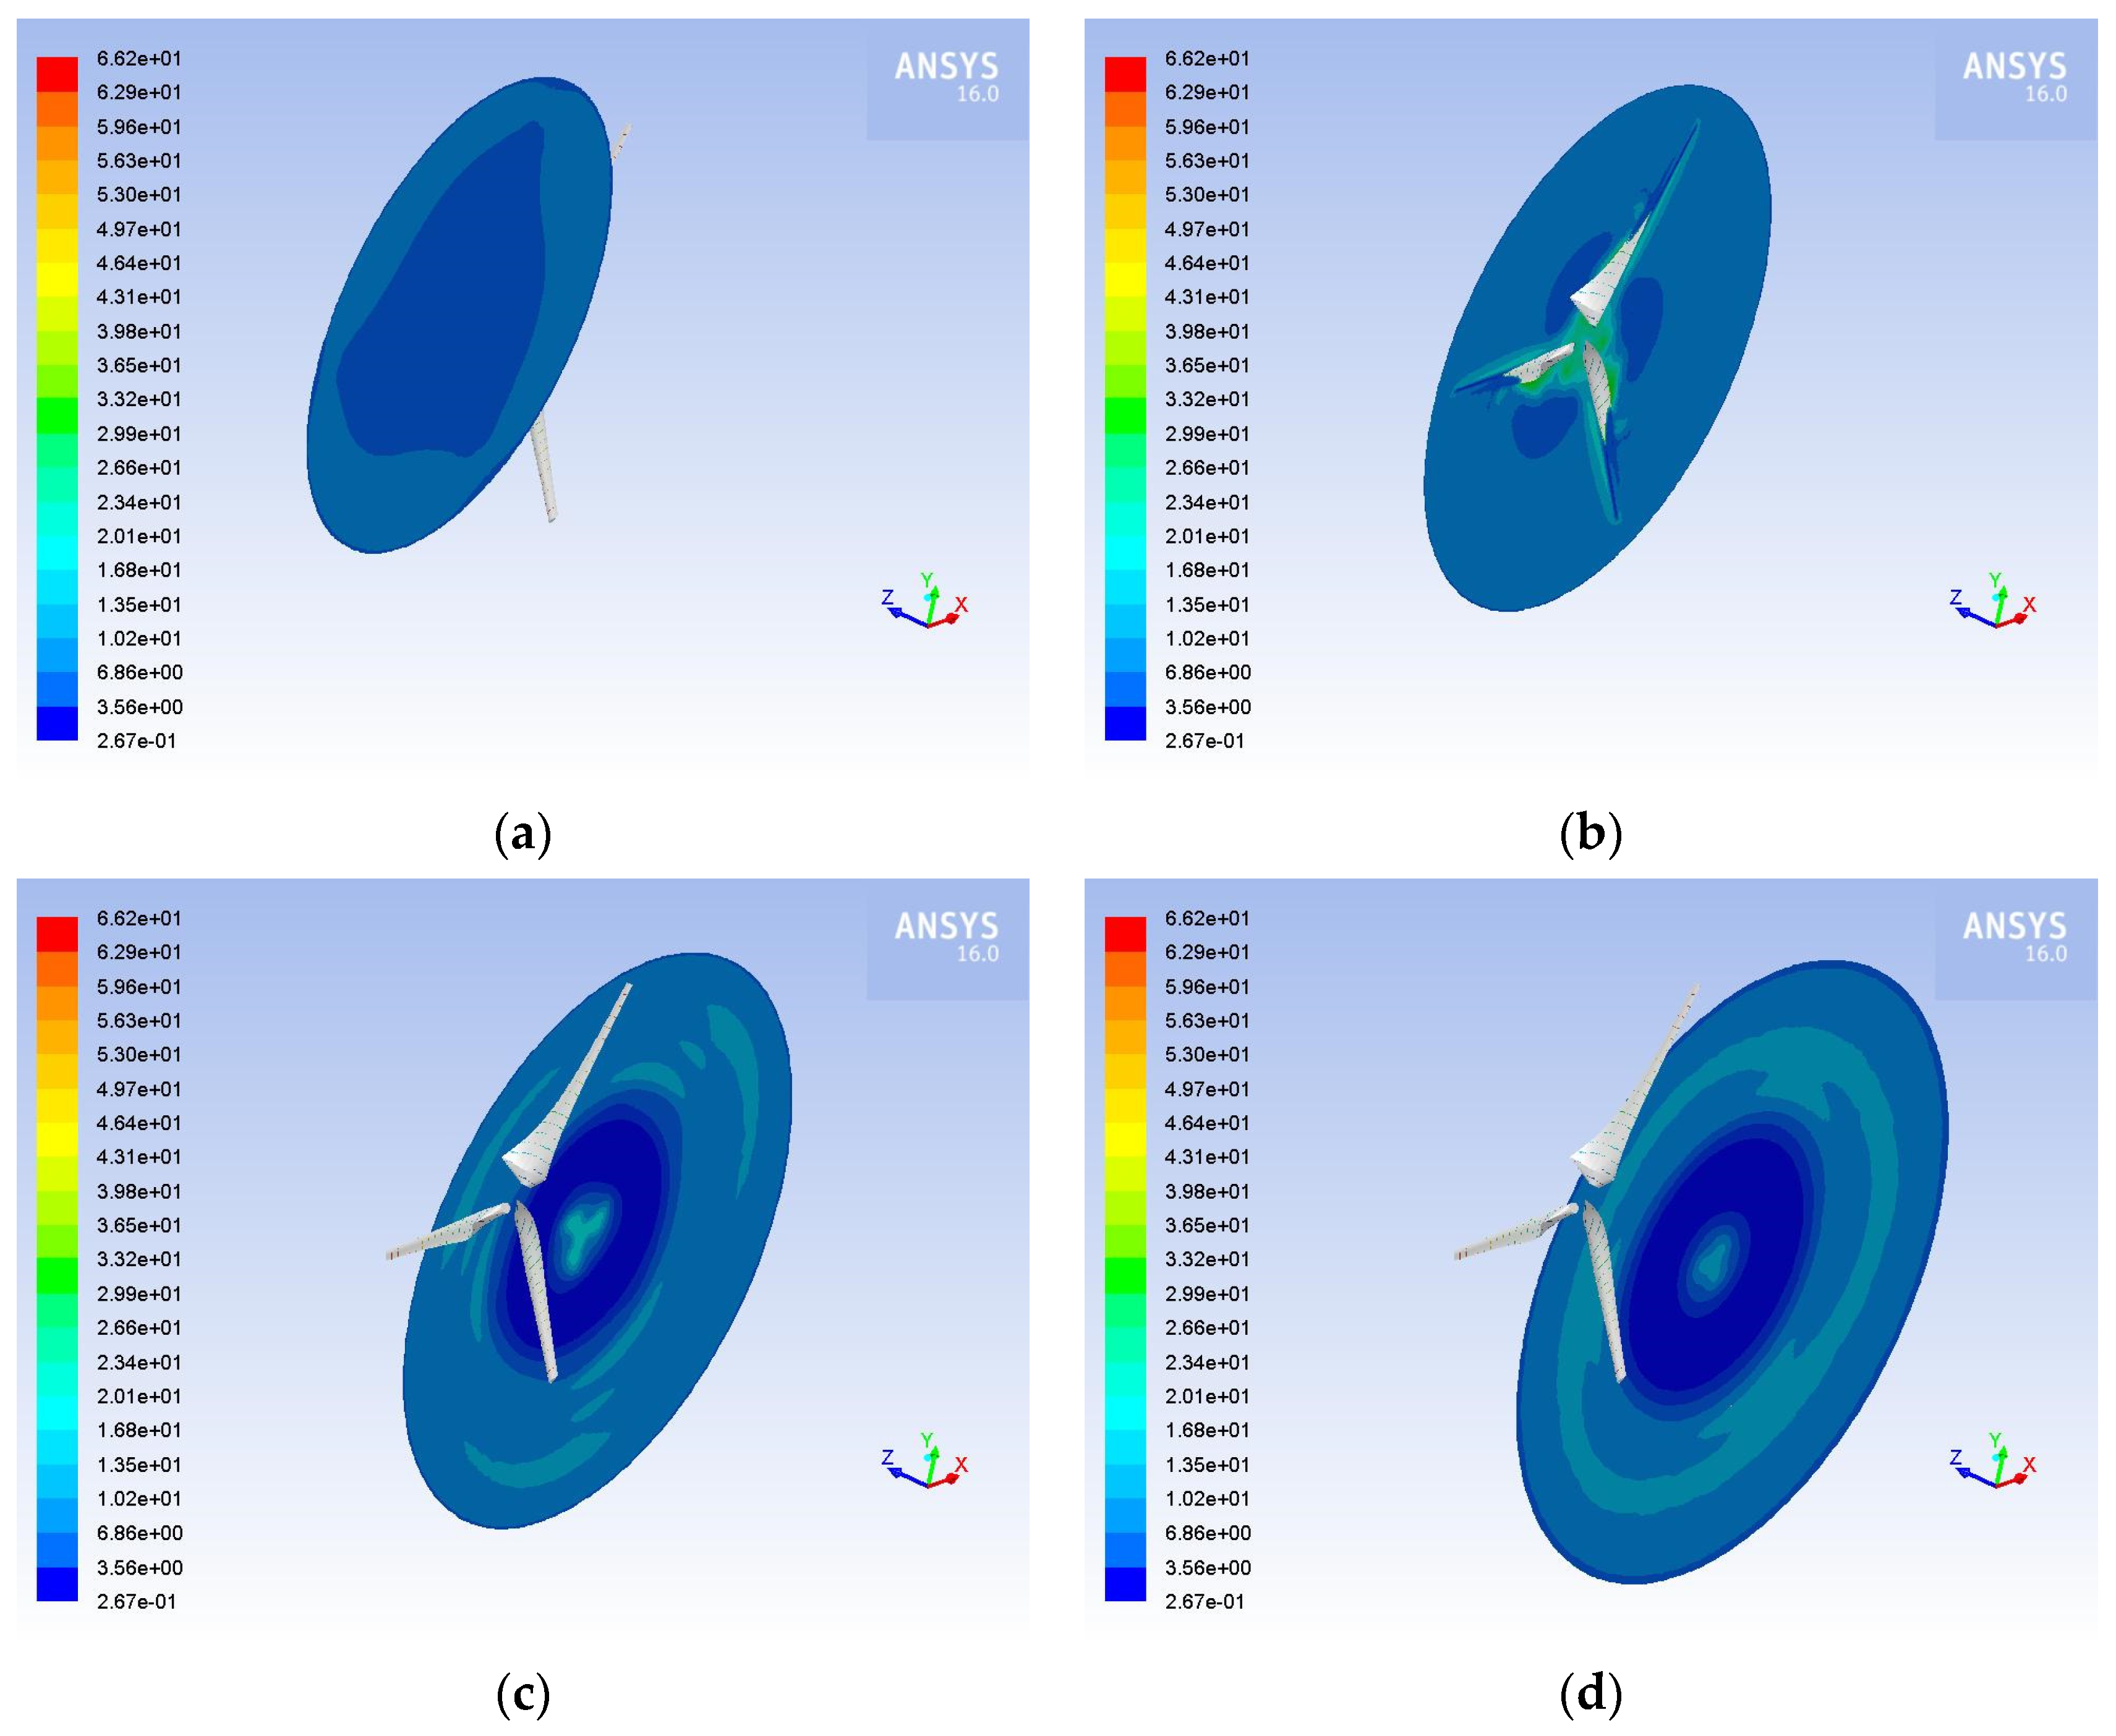
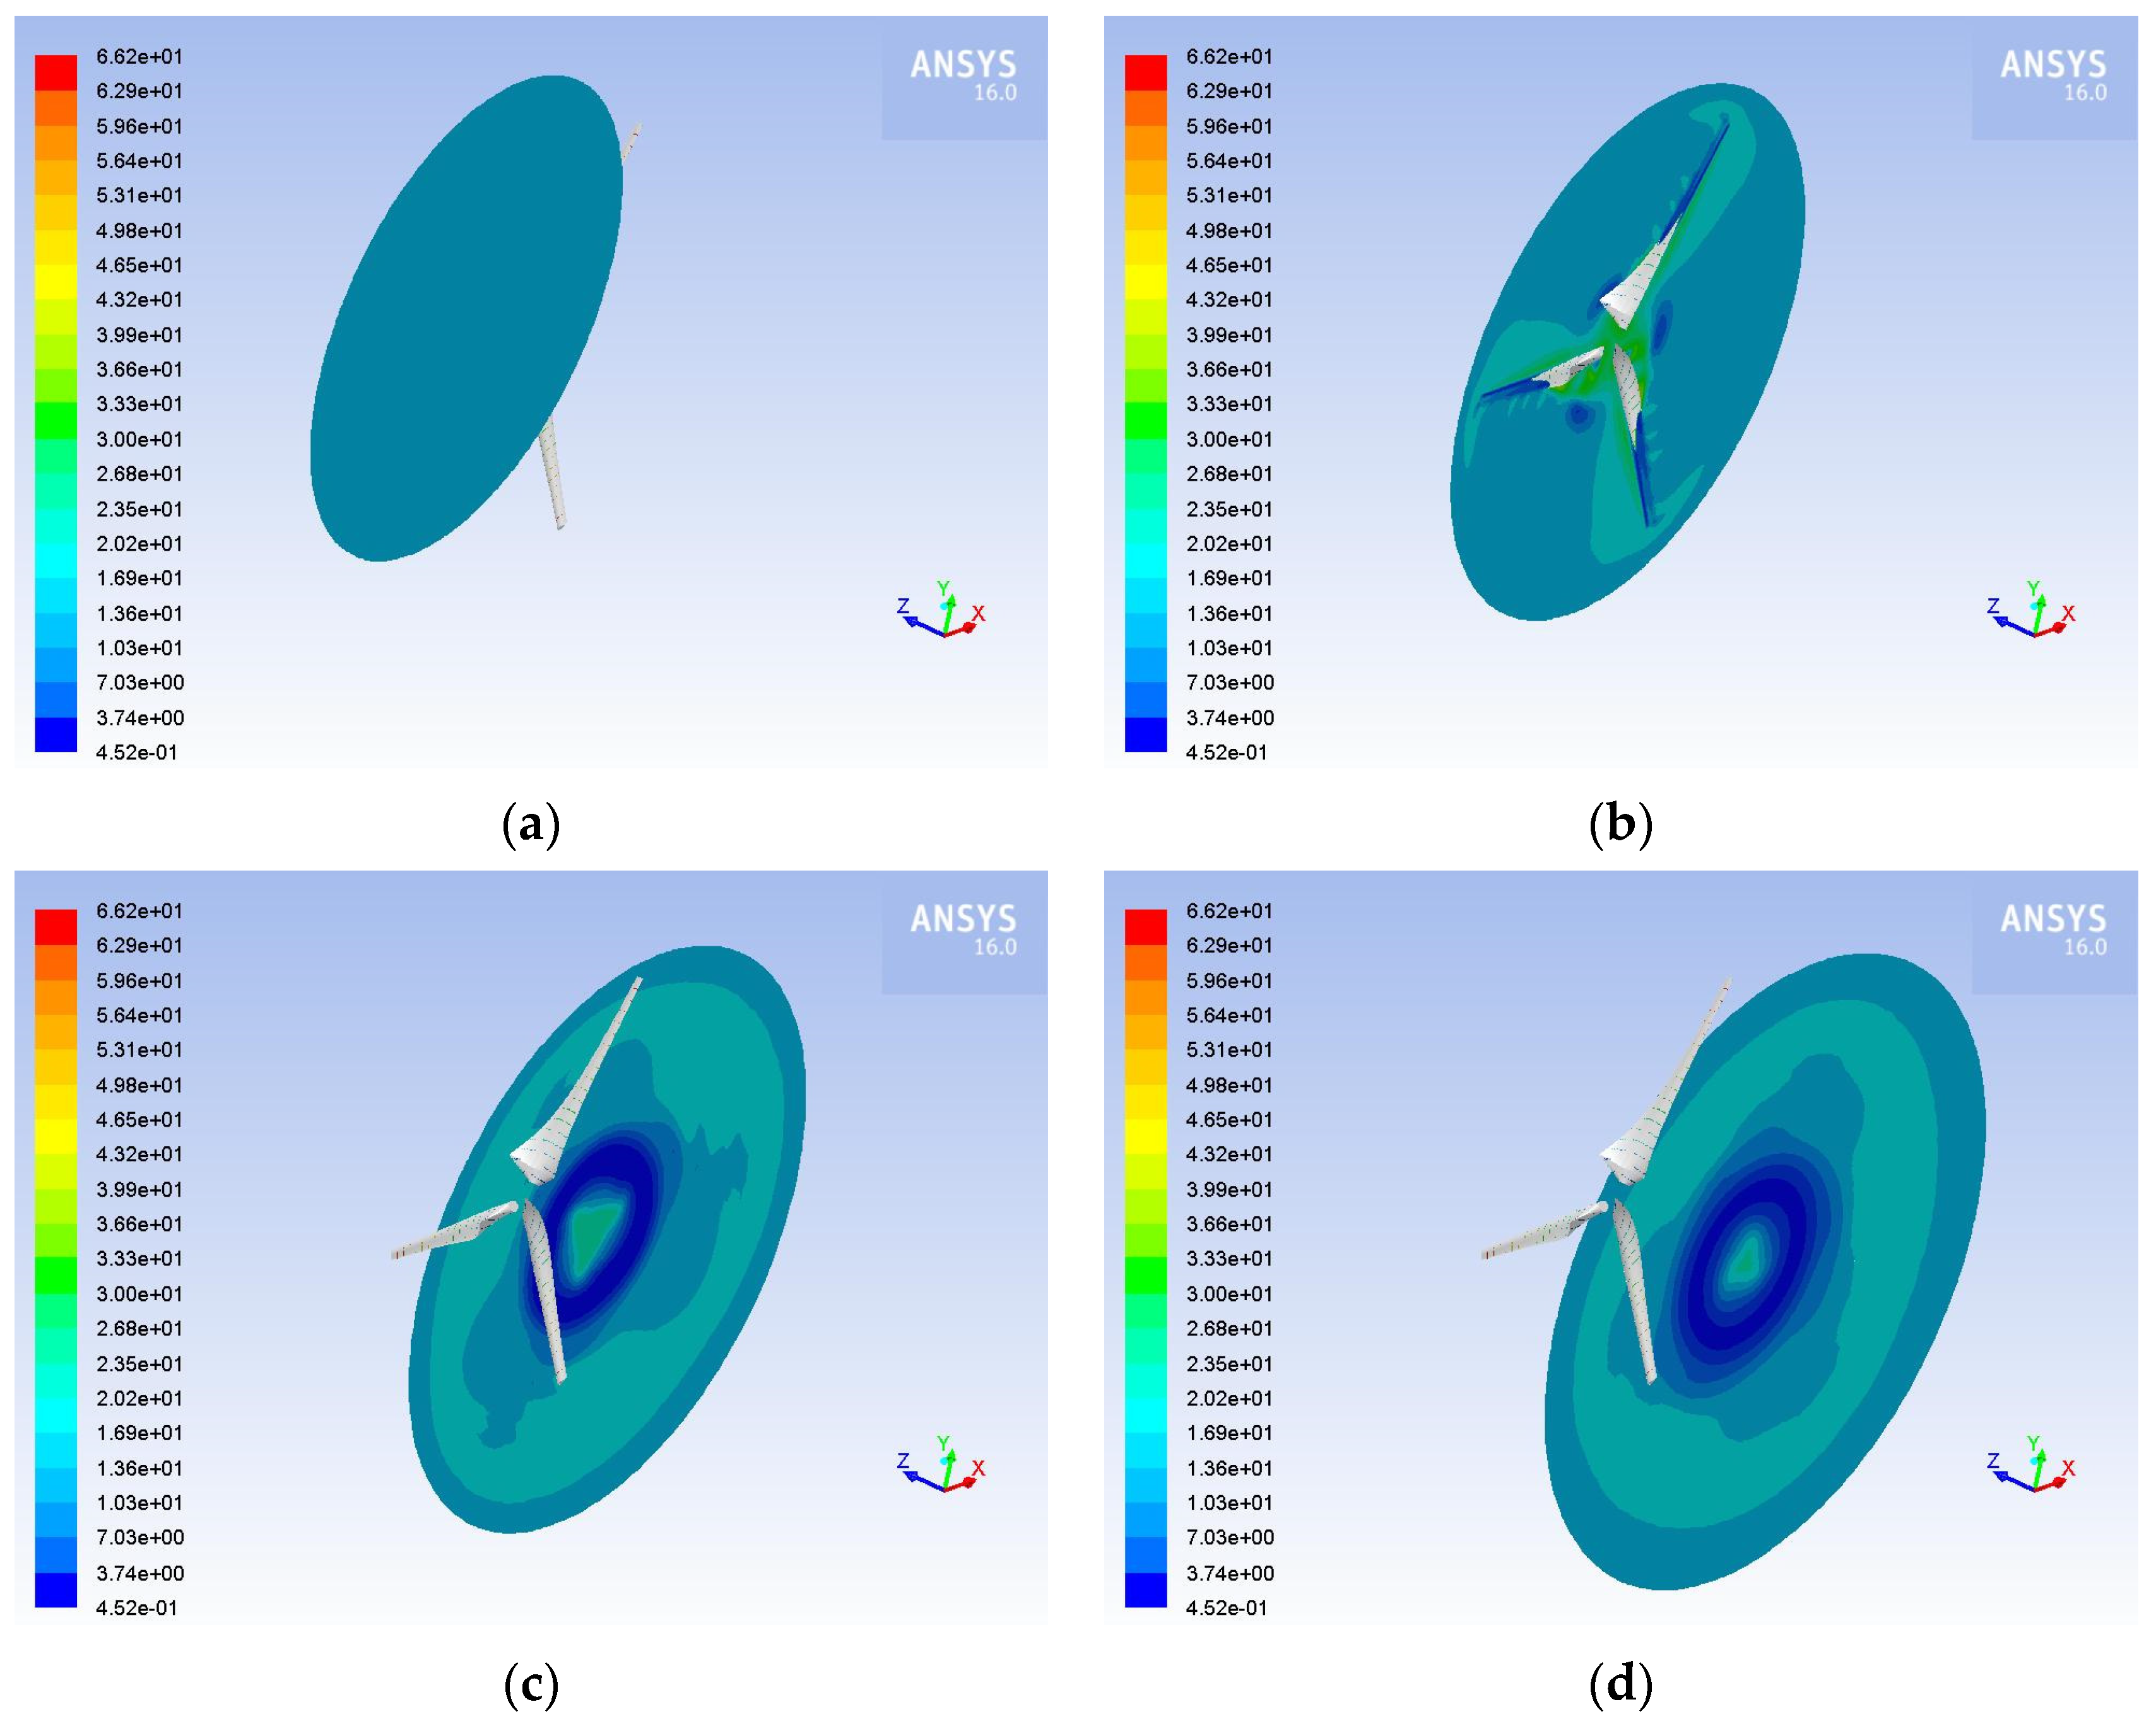
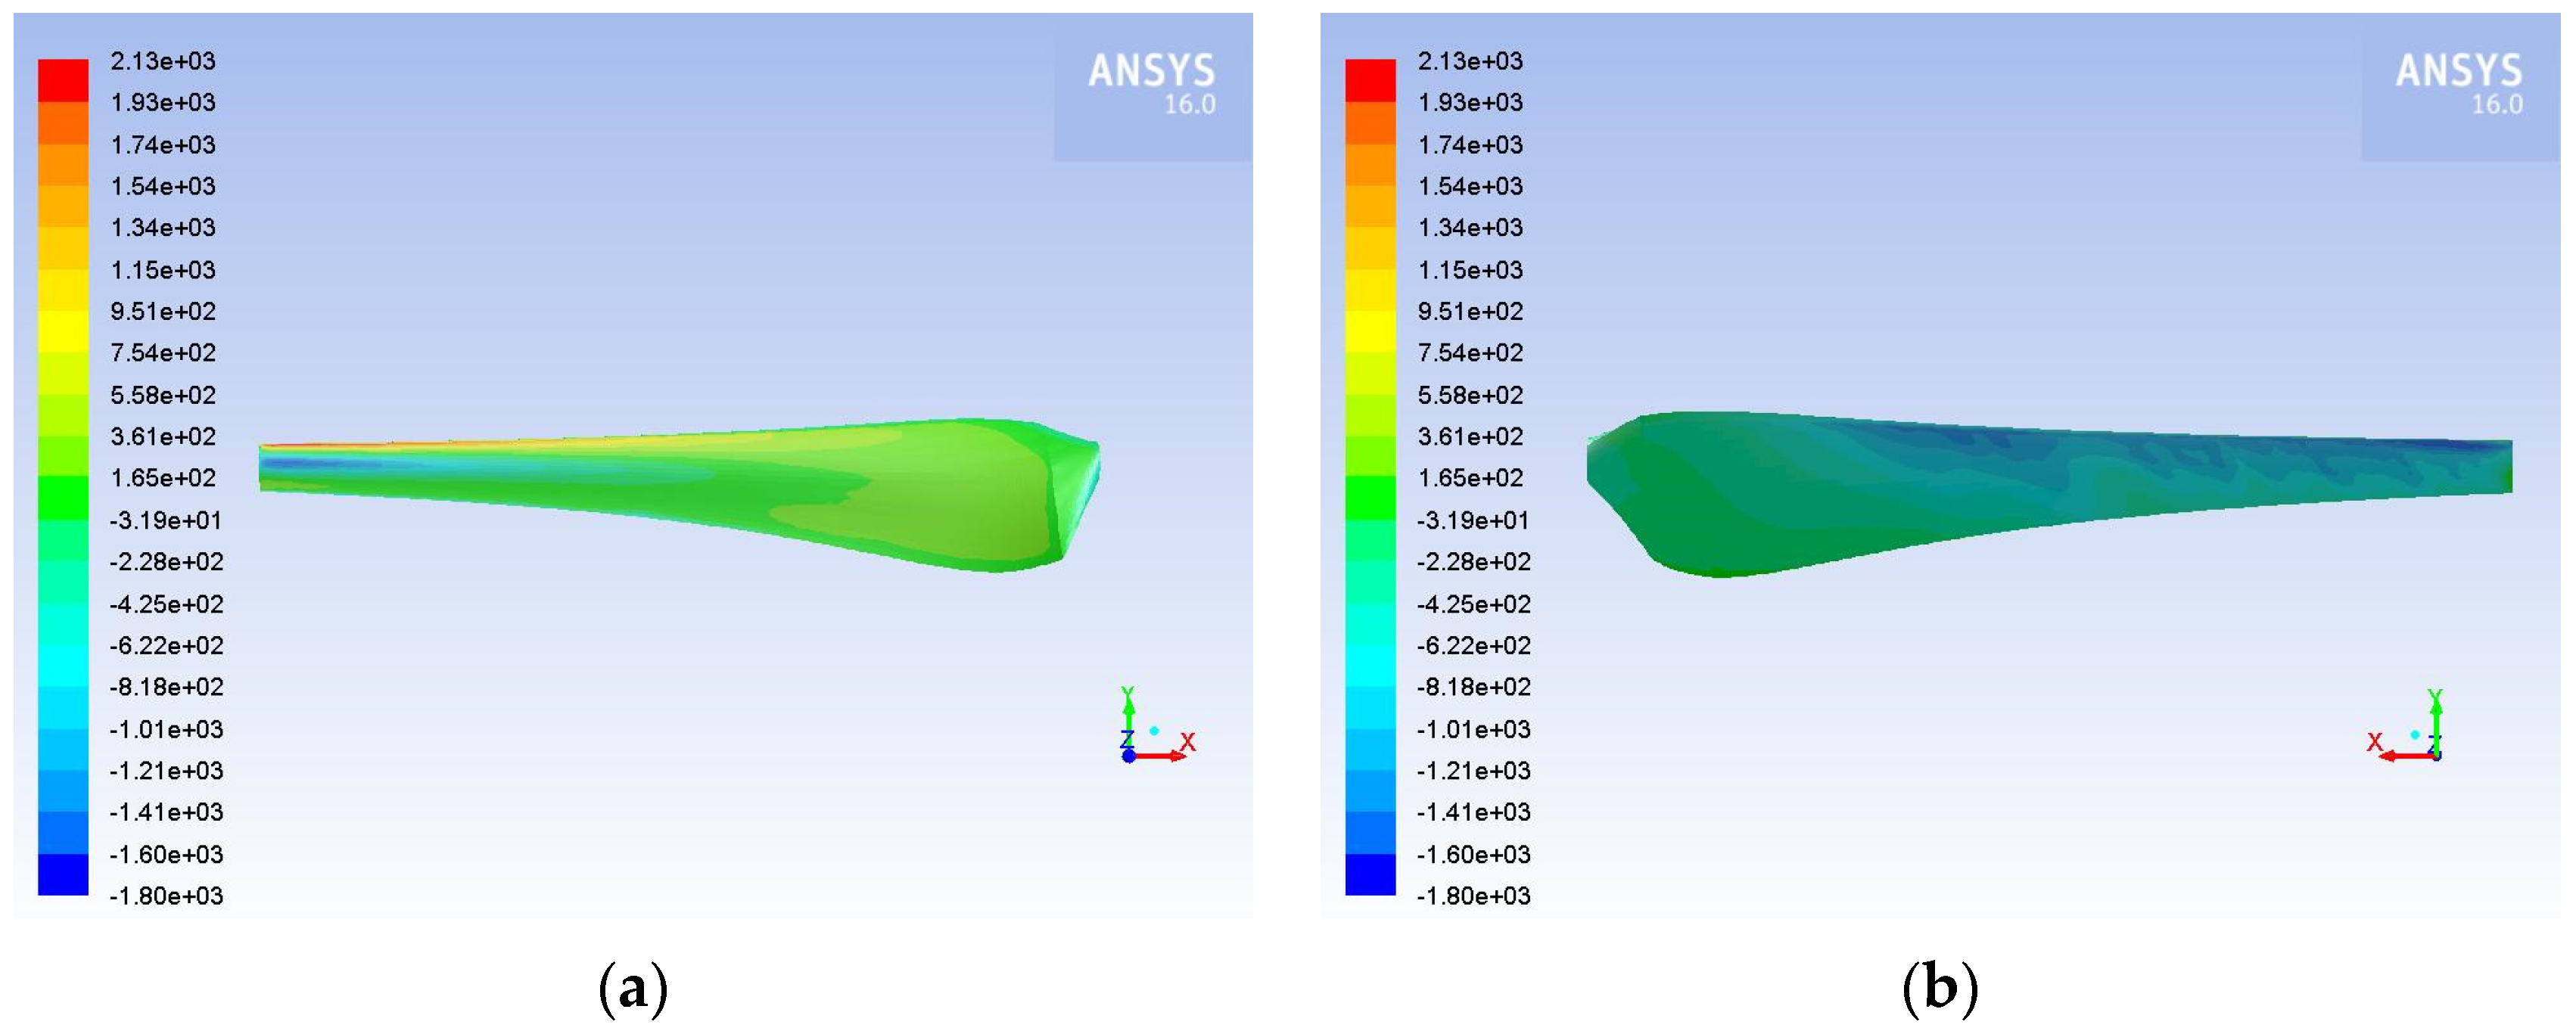
3.1. Results of Airflow over HAWT Blade

The visualized results of the airflow over the three-bladed HAWT blade are presented in this section. More specifically, the contours of velocity at various cross sections near the blade for air velocities of 10 m·s−1 and 15 m·s−1 are presented in Figure 5 and Figure 6, respectively. It is observed that as the air approaches the rotor, its speed decreases. When air impacts the rotor, its speed increases in the areas around the blades, and especially in the areas close to the rotor hub, while between the blades the air velocity appears to decrease. Rings of different velocities are created in the areas of the wake, the diameter of which increases with the distance from the rotor, and the wake weakens with the increase of the distance from the rotor. As the air velocity increases (Figure 6), the minimum and maximum values obtained by the velocity are higher, while the shape of the velocity distribution remains the same. In addition, the wake appears to weaken at a faster rate as the air velocity increases.
Figure 7 and Figure 8 show the static pressure distribution on the blade of the HAWT for airflow and air velocity equal to 10 m·s−1 and 15 m·s−1, respectively. For both air velocities the pressure distribution exhibits similar behavior, with the only difference being the range of values received by the pressure with increasing air velocity. More specifically, the highest values of pressure are located on the lower surface of the blade, i.e., the pressure side, and near the leading edge, and the maximum value appears close to the tip and decreases towards the hub. At the upper surface of the blade, i.e., the suction side, the static pressure receives lower values than at the pressure side, thus lift is generated.

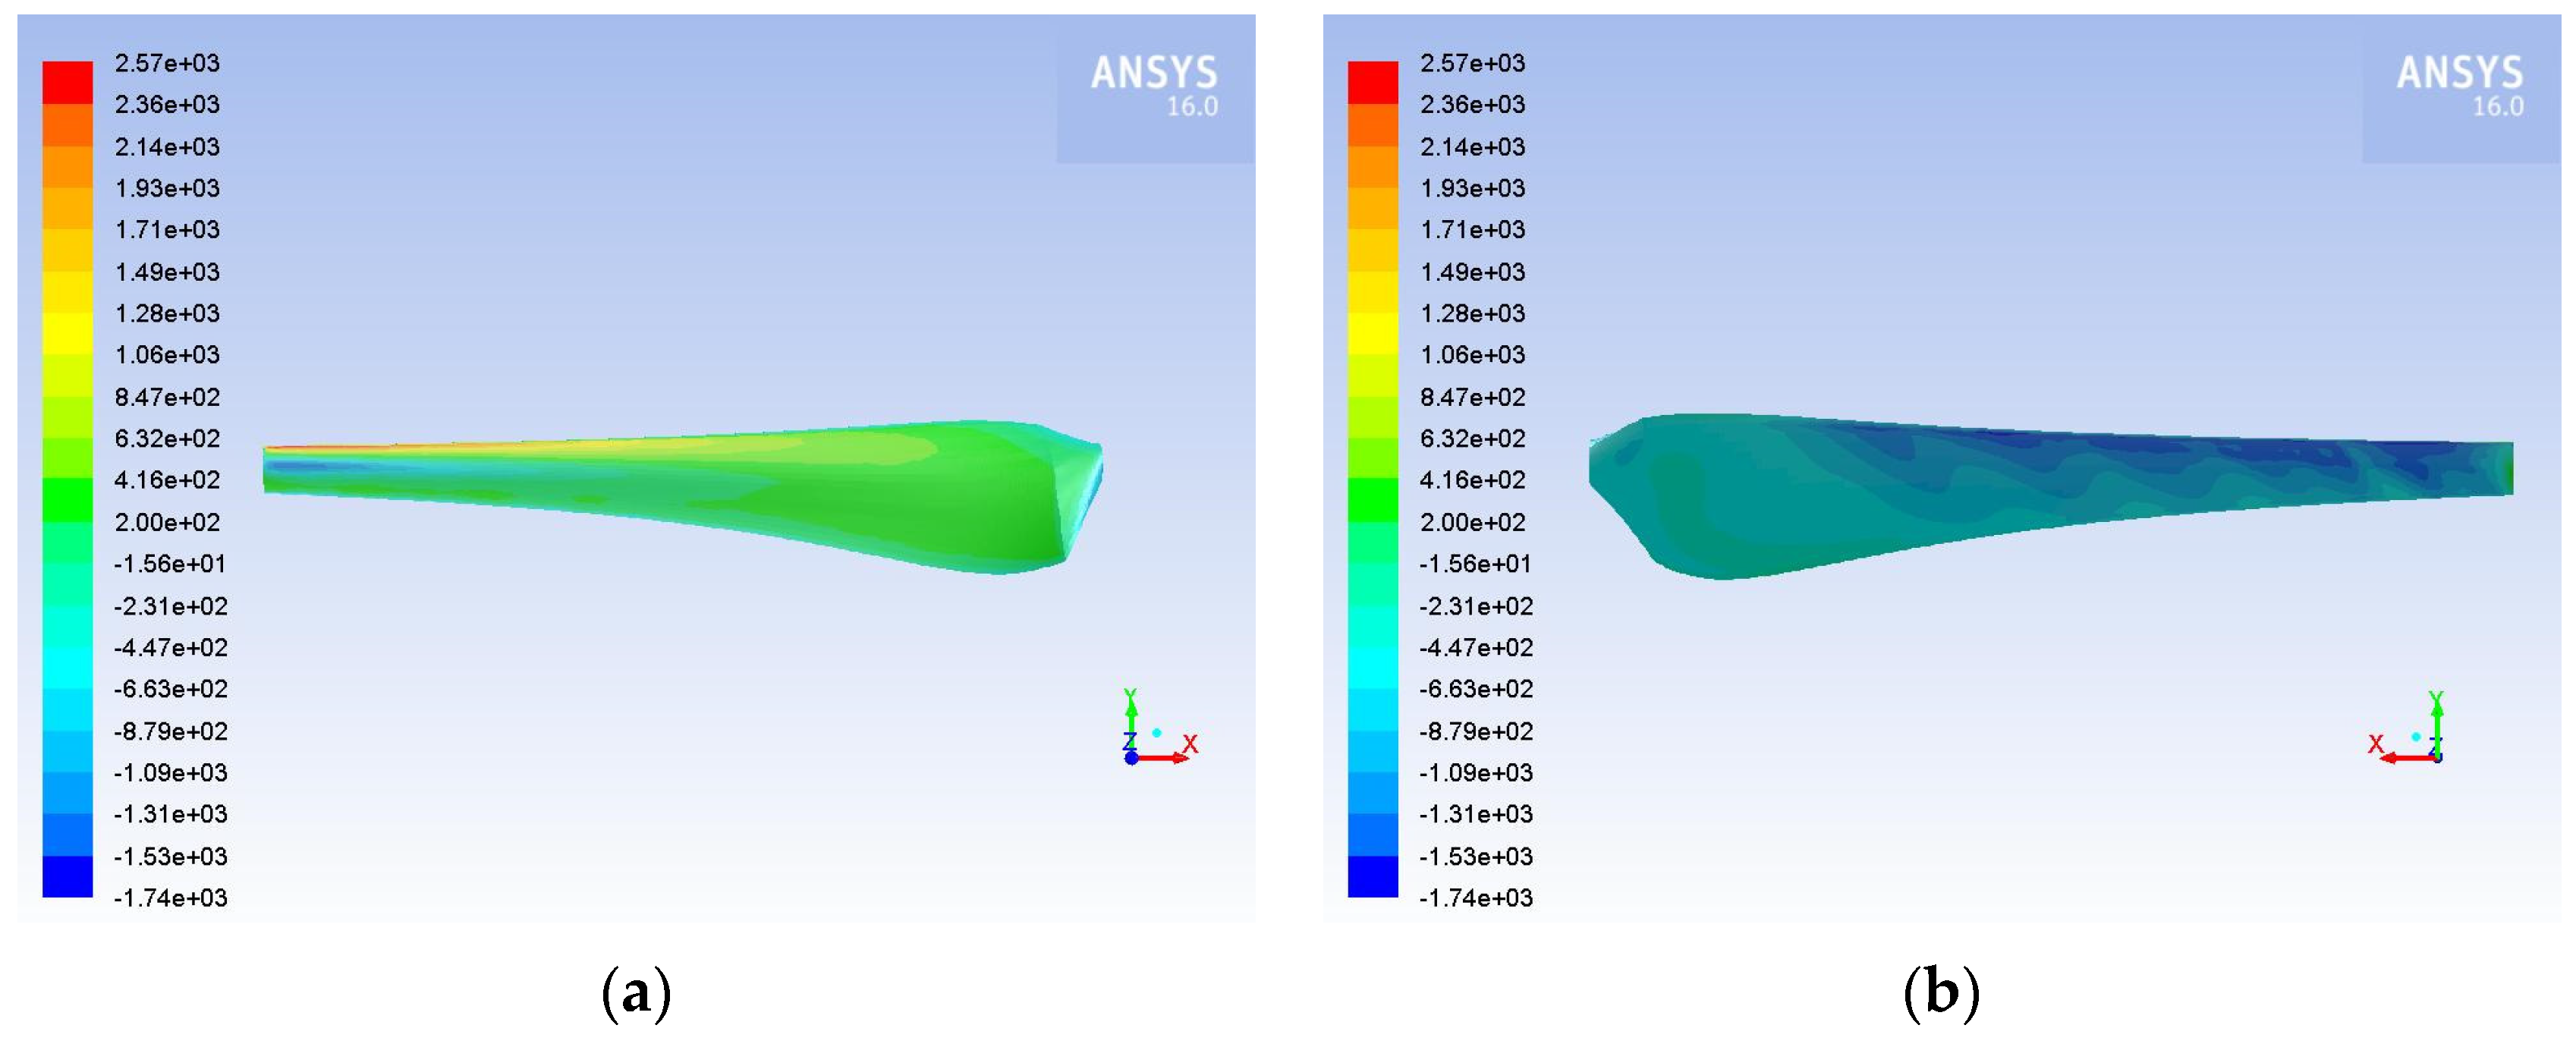
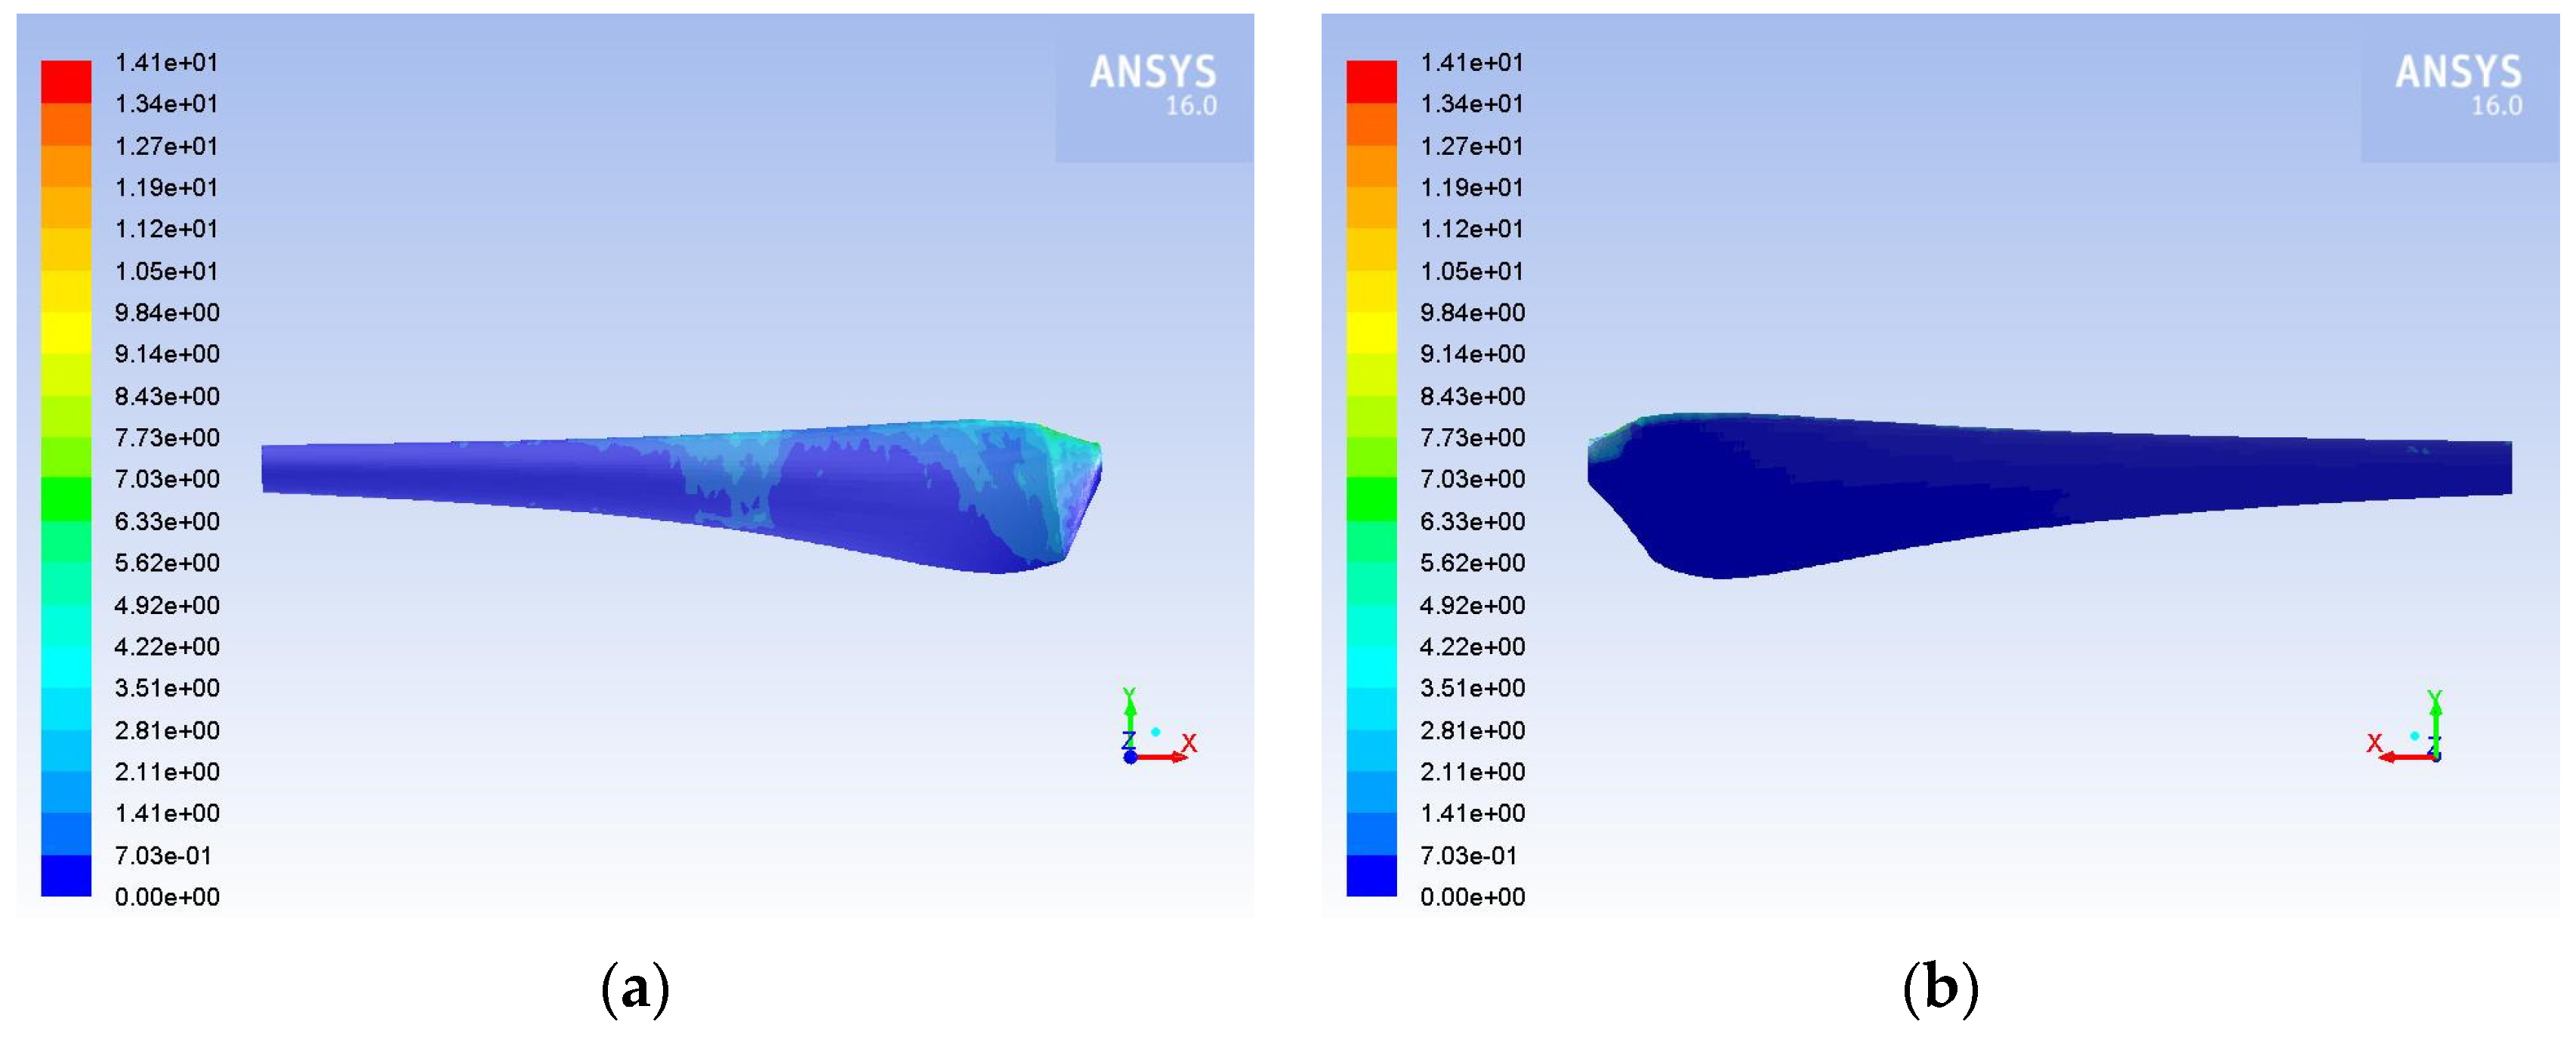
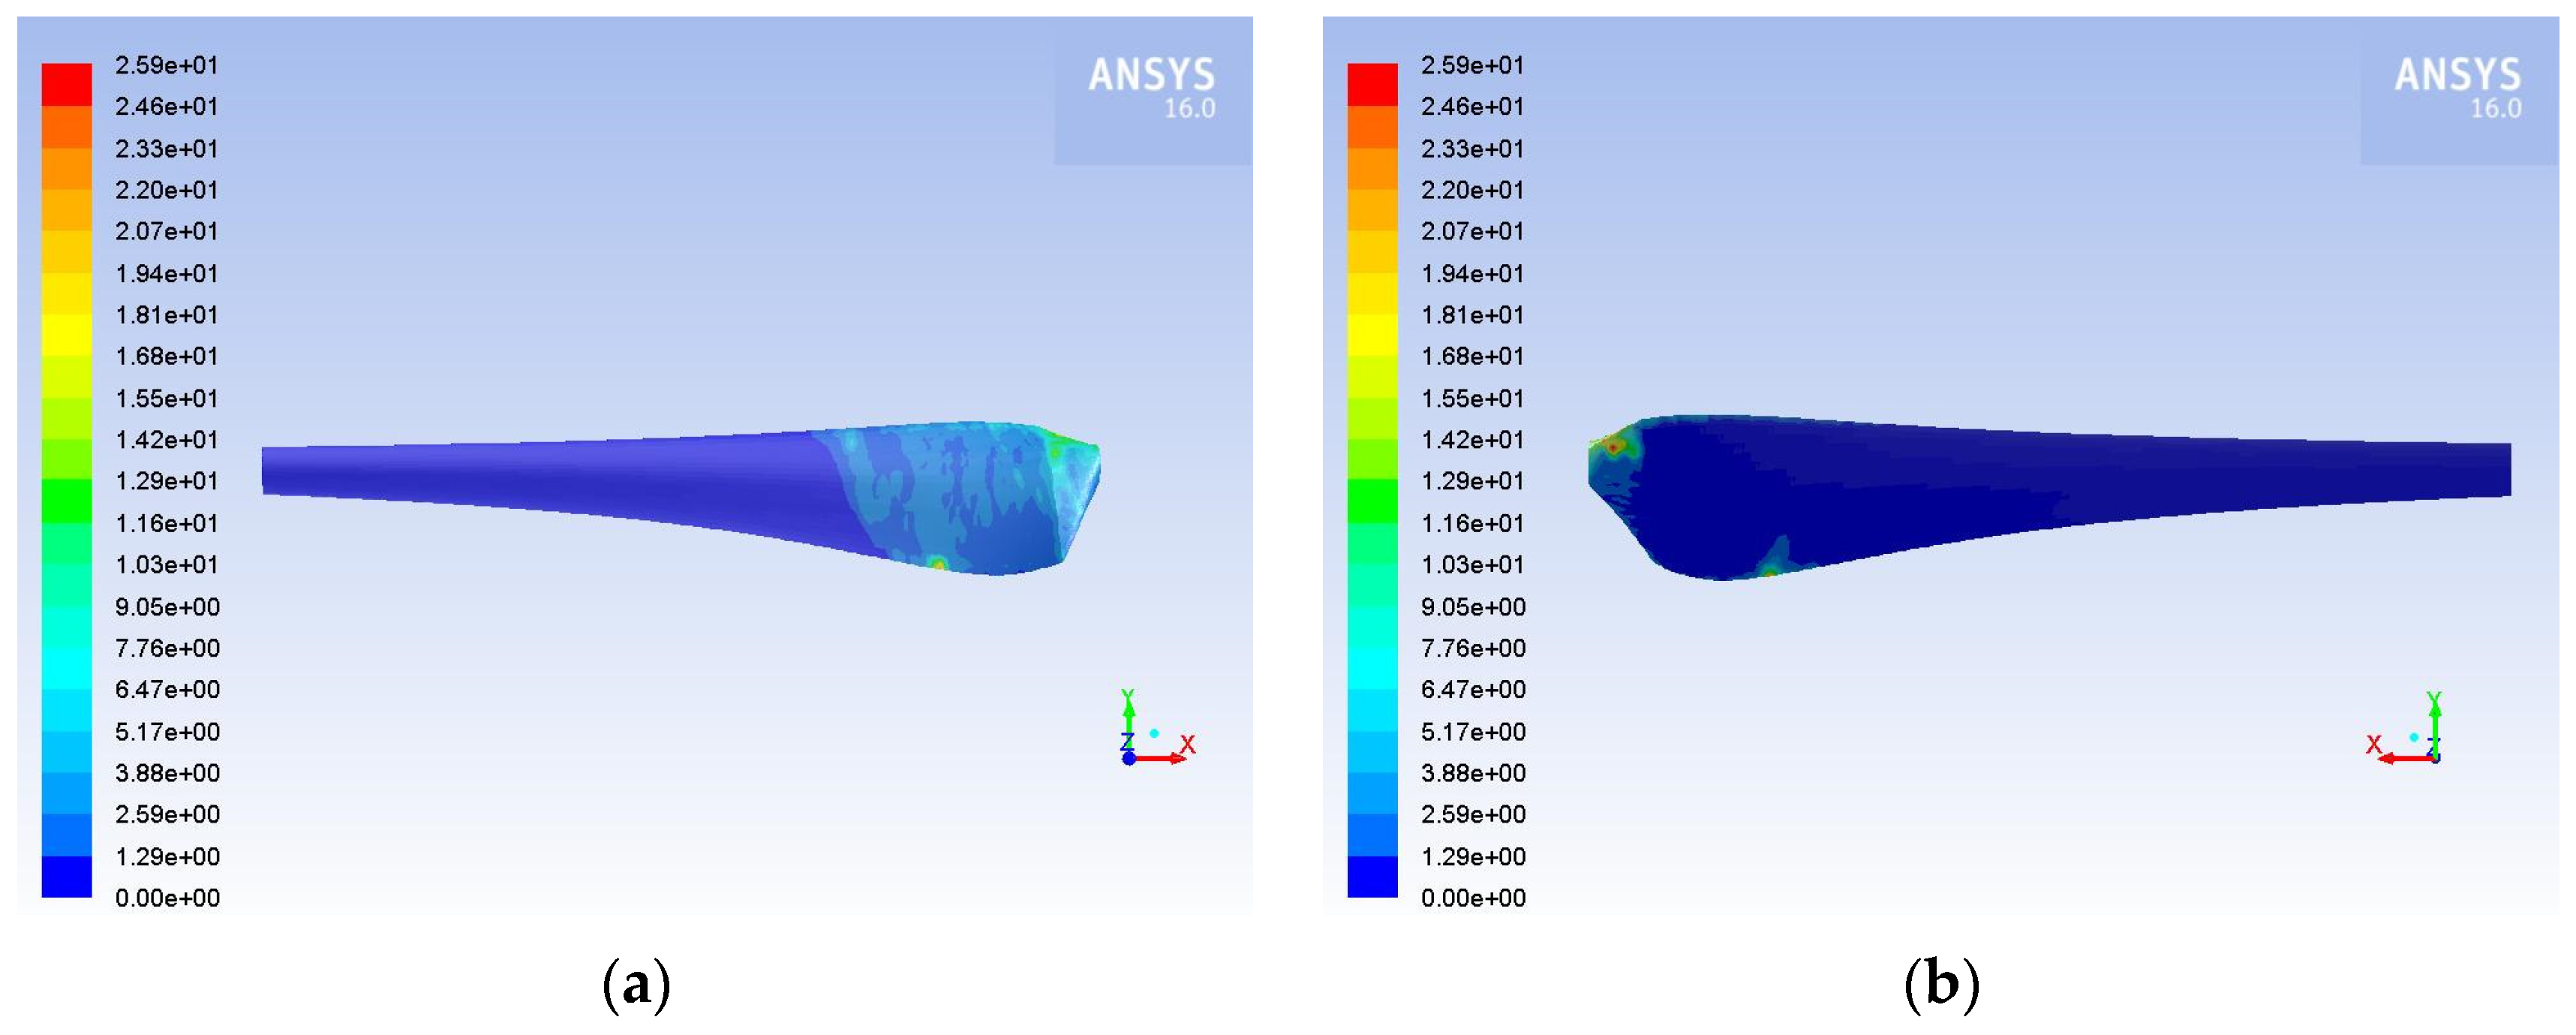
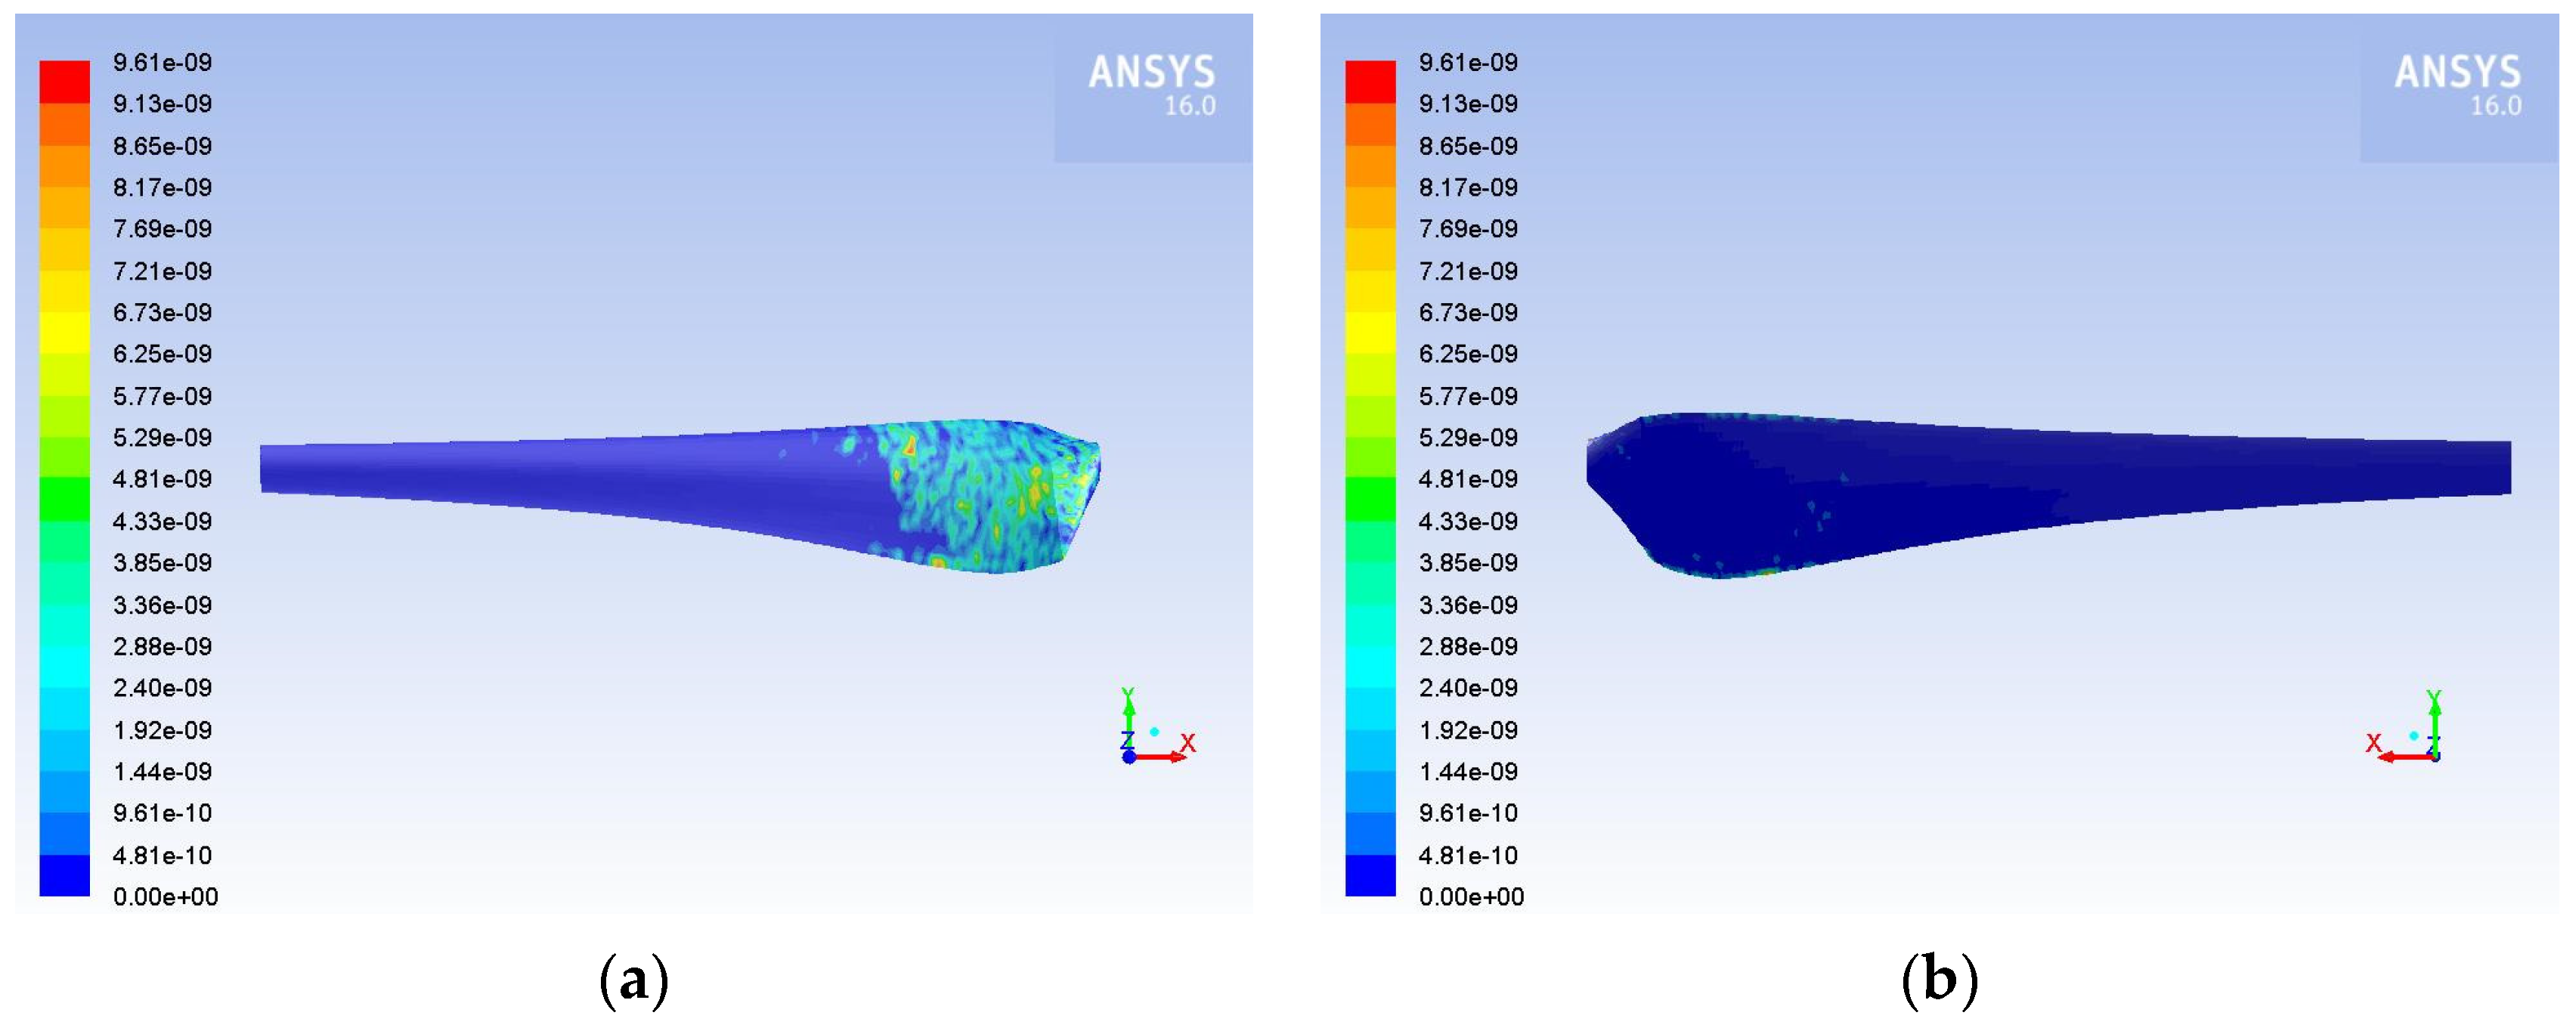
3.2. Results of Hailstorm Conditions over HAWT Blade

The results of hailstorm conditions over the three-bladed HAWT blade are demonstrated in this section. Figure 9 and Figure 10 show the contours of velocity at various positions near the wind turbine rotor for hailstorm conditions, for air velocities of 10 m·s−1 and 15 m·s−1, respectively. From these figures it is observed that for hailstorm conditions, the velocity distributions are similar to those of the airflow, although the velocity values are increased.
On Figure 11 and Figure 12 the contours of static pressure on both sides of the HAWT blade are demonstrated, for hailstorms and for air velocities of 10 m·s−1 and 15 m·s−1, respectively. The static pressure distribution on the blade is similar to the corresponding results for airflow, with the only difference being the range of values, which is limited compared to the airflow results, but the range increases with increasing air velocity.
Figure 13 illustrates the concentration of hailstones and raindrops on the blade, and it is apparent that the concentration of the particles is increased on the pressure side of the blade, mainly on the midsection of the blade, closer to the hub. As the air velocity and the distance from the hub increases (Figure 14), the relative velocity on the blade increases as well and, as a result, the raindrops and hailstones are carried away from the flow more easily from these regions. They are concentrated nearer to the hub and on the suction side of the blade, where the relative velocity is lower. In addition, at higher air velocity a greater amount of particles appears to adhere to the blade. The particle concentration on the HAWT blade results in an increase in the weight of the blade and an increase in its roughness, which leads to a reduced efficiency of the wind turbine. Figure 15 shows the erosion rate on the blade surface, and it reveals that areas with a higher particle concentration are more exposed to erosion. Therefore, the utilization is recommended of either a more durable material or of special coatings during the blade construction in these areas for HAWTs that are designed to operate in areas with frequent hailstorms and high wind speeds.

4. Conclusions

This project is the first comprehensive investigation of the aerodynamic behavior of a three-bladed HAWT with blades constructed with NREL S809 airfoil, operating during a hailstorm. This study has found that, generally, hailstorm conditions have a negative effect on aerodynamic behavior, which leads to less power produced by a wind turbine. The power of the wind turbine was found to decrease by 6.4% and 3.0% for air velocity of 10 m·s−1 and 15 m·s−1, respectively.
Rings of different speeds and diameters formed in the areas of the wake, and the wake seemed to weaken more rapidly (i) in hailstorm conditions, (ii) as the air velocity increased and (iii) as it moved away from the rotor. Moreover, from the presentation of static pressure distributions in hailstorm conditions, it was found that the range of the obtained values was limited, which, however, increased with the increase of the air velocity. Furthermore, it came out that the particles were more concentrated on the pressure side of the blade and mainly on 50% of the blade, close to the hub. As the air velocity increased, the particles moved closer to the hub, and began to appear on the upper surface of the blade due to their forced movement from the increased rotational speed. Finally, the areas on the blade where particles are concentrated appeared to be more exposed to erosion.
These findings contribute in several ways to our understanding of the effects of hailstorms on aerodynamic behavior of a three-bladed HAWT and provide a basis for recommendations for wind turbine blade designs for HAWTs placed in regions with frequent hailstorms.

Author Contributions

Conceptualization, D.D. and E.D.; methodology, D.D.; numerical simulations, D.D.; formal analysis, D.D.; writing—original draft preparation, E.D.; writing—review and editing, D.D.; supervision, D.P.M. All authors have read and agreed to the published version of the manuscript.

Funding

This research received no external funding.

Institutional Review Board Statement

Not applicable.

Informed Consent Statement

Not applicable.

Conflicts of Interest

The authors declare no conflict of interest.

References

  1. IEA. Global Energy Review 2021; IEA: Paris, France, 2021. [Google Scholar]
  2. IEA. Electricity Market Report—July 2021; IEA: Paris, France, 2021. [Google Scholar]
  3. Global Wind Energy Council. Global Wind Report 2021; GWEC: Brussels, Belgium, 25 March 2021. [Google Scholar]
  4. Du, Y.; Zhou, S.; Jing, X.; Peng, Y. Damage detection techniques for wind turbine blades: A review. Mech. Syst. Signal Process. 2020, 141, 106445. [Google Scholar] [CrossRef]
  5. Mishnaevsky, L.; Branner, K.; Petersen, H.; Beauson, J.; McGugan, M.; Sørensen, B. Materials for Wind Turbine Blades: An Overview. Materials 2017, 10, 1285. [Google Scholar] [CrossRef] [Green Version]
  6. Saavedra-Moreno, B.; Salcedo-Sanz, S.; Paniagua-Tineo, A.; Prieto, L.; Portilla-Figueras, A. Seeding evolutionary algorithms with heuristics for optimal wind turbines positioning in wind farms. Renew. Energy 2011, 36, 2838–2844. [Google Scholar] [CrossRef]
  7. Tang, X.-Y.; Zhao, S.; Fan, B.; Peinke, J. Micro-scale wind resource assessment in complex terrain based on CFD coupled measurement from multiple masts. Appl. Energy 2019, 238, 806–815. [Google Scholar] [CrossRef]
  8. Sharma, P.K.; Warudkar, V.; Ahmed, S. Application of a new method to develop a CFD model to analyze wind characteristics for a complex terrain. Sustain. Energy Technol. Assess. 2020, 37, 100580. [Google Scholar] [CrossRef]
  9. Radünz, W.C.; Mattuella, J.M.L.; Petry, A.P. Wind resource mapping and energy estimation in complex terrain: A framework based on field observations and computational fluid dynamics. Renew. Energy 2020, 152, 494–515. [Google Scholar] [CrossRef]
  10. Makridis, A.; Chick, J. Validation of a CFD model of wind turbine wakes with terrain effects. J. Wind Eng. Ind. Aerodyn. 2013, 123, 12–29. [Google Scholar] [CrossRef]
  11. Antonini, E.G.; Romero, D.A.; Amon, C.H. Optimal design of wind farms in complex terrains using computational fluid dynamics and adjoint methods. Appl. Energy 2020, 261, 114426. [Google Scholar] [CrossRef]
  12. Tian, W.; Zheng, K.; Hu, H. Investigation of the wake propagation behind wind turbines over hilly terrain with different slope gradients. J. Wind Eng. Ind. Aerodyn. 2021, 215, 104683. [Google Scholar] [CrossRef]
  13. Miller, A.; Chang, B.; Issa, R.; Chen, G. Review of computer-aided numerical simulation in wind energy. Renew. Sustain. Energy Rev. 2013, 25, 122–134. [Google Scholar] [CrossRef] [Green Version]
  14. Ayotte, K. Computational modelling for wind energy assessment. J. Wind Eng. Ind. Aerodyn. 2008, 96, 1571–1590. [Google Scholar] [CrossRef]
  15. Zajaczkowski, F.J.; Haupt, S.E.; Schmehl, K.J. A preliminary study of assimilating numerical weather prediction data into computational fluid dynamics models for wind prediction. J. Wind Eng. Ind. Aerodyn. 2011, 99, 320–329. [Google Scholar] [CrossRef]
  16. Liu, Y.; Warner, T.; Liu, Y.; Vincent, C.; Wu, W.; Mahoney, B.; Swerdlin, S.; Parks, K.; Boehnert, J. Simultaneous nested modeling from the synoptic scale to the LES scale for wind energy applications. J. Wind Eng. Ind. Aerodyn. 2011, 99, 308–319. [Google Scholar] [CrossRef] [Green Version]
  17. Uchida, T.; Ohya, Y. Micro-siting technique for wind turbine generators by using large-eddy simulation. J. Wind Eng. Ind. Aerodyn. 2008, 96, 2121–2138. [Google Scholar] [CrossRef]
  18. Song, M.; Chen, K.; He, Z.; Zhang, X. Wake flow model of wind turbine using particle simulation. Renew. Energy 2012, 41, 185–190. [Google Scholar] [CrossRef]
  19. Thumthae, C.; Chitsomboon, T. Optimal angle of attack for untwisted blade wind turbine. Renew. Energy 2009, 34, 1279–1284. [Google Scholar] [CrossRef]
  20. Rajakumar, S.; Ravindran, D. Iterative approach for optimising coefficient of power, coefficient of lift and drag of wind turbine rotor. Renew. Energy 2012, 38, 83–93. [Google Scholar] [CrossRef]
  21. Kim, B.; Kim, W.; Lee, S.; Bae, S.; Lee, Y. Development and verification of a performance based optimal design software for wind turbine blades. Renew. Energy 2013, 54, 166–172. [Google Scholar] [CrossRef]
  22. Bilanin, A. Scaling Laws for Testing of High Lift Airfoils under Heavy Rainfall. In Proceedings of the AIAA 23rd Aerospace Science Meeting, Reno, NV, USA, 14–17 January 1985. [Google Scholar] [CrossRef]
  23. Dunham, R.; Bezos, G.; Gentry, G.; Melson, E. Two-dimensional wind tunnel tests of a transport-type airfoil in a water spray. In Proceedings of the AIAA 23rd Aerospace Science Meeting, Reno, NV, USA, 14–17 January 1985. [Google Scholar] [CrossRef]
  24. Hastings, E.; Manuel, G. Scale—Model Tests of Airfoils in Simulated Heavy Rain. J. Aircr. 1985, 22, 536–540. [Google Scholar] [CrossRef]
  25. Thompson, B.; Jang, J. Aerodynamic Efficiency of Wings in Rain. J. Aircr. 1996, 33, 1047–1053. [Google Scholar] [CrossRef]
  26. Douvi, D.; Margaris, D.; Davaris, A. Aerodynamic performance of a NREL S809 airfoil in an air-sand particle two-phase flow. Computation 2017, 5, 13. [Google Scholar] [CrossRef]
  27. Zidane, I.; Saqr, K.; Swadener, G.; Ma, X.; Shehadeh, M. Computational fluid dynamics study of dusty air flow over NACA 63,415 airfoil for wind turbine applications. J. Teknol. 2017, 79, 11877. [Google Scholar] [CrossRef] [Green Version]
  28. Douvi, D.; Douvi, E.; Margaris, D. Computational Study of NACA 0012 Airfoil in Air-Sand Particle Two-Phase Flow at Reynolds Number of Re = 1.76 × 10⁶. Int. J. New Technol. Res. (IJNTR) 2019, 5, 101–108. [Google Scholar] [CrossRef]
  29. Douvi, E.; Margaris, D. Aerodynamic performance investigation under the influence of heavy rain of a NACA 0012 airfoil for wind turbine applications. Int. Rev. Mech. Eng. (IREME) 2012, 6, 1228–1235. [Google Scholar] [CrossRef]
  30. Douvi, E.; Margaris, D.; Lazaropoulos, S.; Svanas, S. Low Reynolds Number Investigation of the Flow over a NACA 0012 airfoil at Different Rainfall Rates. Int. Rev. Mech. Eng. (IREME) 2013, 7, 625–632. [Google Scholar] [CrossRef]
  31. Douvi, E.; Douvi, D.; Pylarinos, D.; Margaris, D. Effect of Rain on the Aerodynamic Performance of a Horizontal Axis Wind Turbine—A Computational Study. Int. J. Energetica (IJECA) 2021, 6, 35–43. [Google Scholar] [CrossRef]
  32. Woobeom, H.; Jonghwa, K.; Bumsuk, K. Effects of contamination and erosion at the leading edge of blade tip airfoils on the annual energy production of wind turbines. Renew. Energy 2018, 115, 817–823. [Google Scholar] [CrossRef]
  33. Sapre Sareen, C.A.; Selig, M. Effects of leading edge erosion on wind turbine blade performance. Wind Energy 2014, 17, 1531–1542. [Google Scholar] [CrossRef]
  34. Zidane, I.; Saqr, K.; Swadener, G.; Ma, X.; Shehadeh, M. On the role of surface roughness in the aerodynamic performance and energy conversion of horizontal wind turbine blades: A review. Int. J. Energy Res. 2016, 40, 2054–2077. [Google Scholar] [CrossRef]
  35. Pugh, K.; Nash, J.; Reaburn, G.; Stack, M. On analytical tools for assessing the raindrop erosion of wind turbine blades. Renew. Sustain. Energy Rev. 2021, 137, 110611. [Google Scholar] [CrossRef]
  36. Douvi, D.; Douvi, E.; Plessas, D.; Margaris, D. Numerical Simulation of NACA 0012 Airfoil Operating under Hailstorm Conditions. Int. J. New Technol. Res. (IJNTR) 2021, 7, 73–80. [Google Scholar] [CrossRef]
  37. Douvi, D.; Georgakopoulos, A.; Lekkas, D.; Douvi, E.; Margaris, D. Aerodynamic Degradation of a Three Bladed Horizontal Axis Wind Turbine Operating During a Hailstorm. In Proceedings of the 8th International Conference on Experiments/Process/System Modeling/Simulation/Optimization (8th IC-EPSMSO), Athens, Greece, 3–6 July 2019. [Google Scholar]
  38. Somers, D.M. Design and Experimental Results for the S809 Airfoil; National Renewable Energy Laboratory: Golden, CO, USA, 1997. [Google Scholar] [CrossRef] [Green Version]
  39. Jonkman, B. NREL—National Renewable Energy Laboratory. 3 October 2014. Available online: https://wind.nrel.gov/airfoils/shapes/s809_shape.html (accessed on 30 November 2021).
  40. Douvi, E.; Margaris, D. Hydrodynamic analysis of a horizontal axis tidal turbine, based on the blade element momentum theory. In Proceedings of the 7th International Conference on Experiments/Process/System Modeling/Simulation/Optimization (7th IC-EpsMsO 2017), Athens, Greece, 5–8 July 2017. [Google Scholar]
  41. Marten, D.; Wendler, J.; Pechlivanoglou, G.; Nayeri, C.; Paschereit, C. QBlade: An Open Source Tool for Design and Simulation of Horizontal and Vertical Axis Wind Turbines. Int. J. Emerg. Technol. Adv. Eng. 2013, 3, 264–269. [Google Scholar]
  42. ANSYS®. Academic Research, Release 16.0; ANSYS, Inc.: Canonsburg, PA, USA, 2015. [Google Scholar]
  43. Menter, F. Two-Equation Eddy-Viscosity Turbulence Models for Engineering Applications. AIAA J. 1994, 32, 1598–1605. [Google Scholar] [CrossRef] [Green Version]
  44. Federer, B.; Waldvogel, A. Hail and Raindrop Size Distributions from a Swiss Multicell Storm. J. Appl. Meteorol. 1975, 91–97. [Google Scholar] [CrossRef] [Green Version]
  45. Markowitz, A. Raindrop Size Distribution Expression. J. Appl. Meteorol. 1976, 15, 1029–1031. [Google Scholar] [CrossRef] [Green Version]
  46. Douglas, R. Hail size distributions. In Proceedings of the 11th Weather Radar Conference, Boulder, CO, USA, 14–18 September 1964. [Google Scholar]
  47. Taylor, G. The Shape and Acceleration of a Drop in a High-Speed Air Stream. In Technical Report; Batchelor, Cambridge University Press: Cambridge, UK, 1963. [Google Scholar]
  48. Bauer, L.; Matysik, S. Wind Turbines Database-Wind-Turbine-Models.com. Available online: https://en.wind-turbine-models.com/ (accessed on 25 September 2021).
Figure 1. The S809 airfoil and its coordinates in graphical representation [39].
Inventions 07 00002 g001
Figure 2. (a) Optimum blade constructed with the NREL S809 airfoil; (b) Computational domain over the blade.
Inventions 07 00002 g002
Figure 3. (a) Hybrid mesh and (b) detail of the mesh around the blade.
Inventions 07 00002 g003
Figure 4. Computational domain and boundary conditions.
Inventions 07 00002 g004
Figure 5. Contours of velocity at (a) −15 m; (b) 0 m; (c) 15 m; (d) 30 m from the three-bladed HAWT rotor for airflow and air velocity equal to 10 m·s−1.
Inventions 07 00002 g005
Figure 6. Contours of velocity at (a) −15 m; (b) 0 m; (c) 15 m; (d) 30 m from the three-bladed HAWT rotor for airflow and air velocity equal to 15 m·s−1.
Inventions 07 00002 g006
Figure 7. Contours of pressure on (a) the pressure; (b) the suction side of the blade for airflow and air velocity equal to 10 m·s−1.
Inventions 07 00002 g007
Figure 8. Contours of pressure on (a) the pressure; (b) the suction side of the blade for airflow and air velocity equal to 15 m·s−1.
Inventions 07 00002 g008
Figure 9. Contours of velocity at (a) −15 m; (b) 0 m; (c) 15 m; (d) 30 m from the three-bladed HAWT rotor for hailstorm conditions and air velocity equal to 10 m·s−1.
Inventions 07 00002 g009
Figure 10. Contours of velocity at (a) −15 m; (b) 0 m; (c) 15 m; (d) 30 m from the three-bladed HAWT rotor for hailstorm conditions and air velocity equal to 15 m·s−1.
Inventions 07 00002 g010
Figure 11. Contours of pressure on (a) the pressure; (b) the suction side of the blade for hailstorm conditions and air velocity equal to 10 m·s−1.
Inventions 07 00002 g011
Figure 12. Contours of pressure on (a) the pressure; (b) the suction side of the blade for hailstorm conditions and air velocity equal to 15 m·s−1.
Inventions 07 00002 g012
Figure 13. Concentration of particles on (a) the pressure; (b) the suction side of the blade for hailstorm conditions and air velocity equal to 10 m·s−1.
Inventions 07 00002 g013
Figure 14. Concentration of particles on (a) the pressure; (b) the suction side of the blade for hailstorm conditions and air velocity equal to 15 m·s−1.
Inventions 07 00002 g014
Figure 15. Erosion rate on (a) the pressure; (b) the suction side of the blade for hailstorm conditions and air velocity equal to 15 m·s−1.
Inventions 07 00002 g015
Table 1. Power output of present HAWT and commercial HAWTs of same rotor dimensions and at air velocity equal to 10 m·s−1 [48].
HAWT ModelHAWT Power Output in MW
Present modelTTBEM [40]1.660
ANSYS Fluent 16.0 [42]1.632
AMSC, wt1650df [48]1.650
NEG Micon, NM 82/1650 [48]1.650
United Energies, UE 1.65 [48]1.650
Vestas, V82-1.65 [48]1.650
GE General Electric, GE 1.6-82.5 [48]1.600
Table 2. Power output of a three-bladed HAWT with blades constructed by NREL S809 airfoil in airflow, calculated by TTBEM application [40] and ANSYS Fluent 16.0 [42].
Air Velocity (m·s−1)HAWT Power Output in MW
TTBEM [40]ANSYS Fluent 16.0 [42]Error (%)
101.6601.6321.7
155.6035.5191.5
Table 3. Power output of a three-bladed HAWT with blades constructed by NREL S809 airfoil in airflow and hailstorm conditions, calculated by ANSYS Fluent 16.0 [42] and its percentage degradation.
Air velocity (m·s−1)HAWT Power Output in MW
AirflowHailstorm ConditionsDegradation (%)
101.6321.530−6.40
155.5193.860−3.00
Publisher’s Note: MDPI stays neutral with regard to jurisdictional claims in published maps and institutional affiliations.

