Article

Radio Wave Attenuation Measurement System Based on RSSI for Precision Agriculture: Application to Tomato Greenhouses

by
Dora Cama-Pinto
1,*,
Juan Antonio Holgado-Terriza
2,
Miguel Damas-Hermoso
1,
Francisco Gómez-Mula
1 and
Alejandro Cama-Pinto
3,*
1
Department of Computer Architecture and Technology, University of Granada, 18071 Granada, Spain
2
Department of Software Engineering, University of Granada, 18071 Granada, Spain
3
Department of Computer Science and Electronics, Universidad de la Costa, Barranquilla 080002, Colombia
*
Authors to whom correspondence should be addressed.
Inventions 2021, 6(4), 66; https://doi.org/10.3390/inventions6040066
Submission received: 8 September 2021 / Revised: 4 October 2021 / Accepted: 8 October 2021 / Published: 12 October 2021
(This article belongs to the Special Issue Low-Cost Inventions and Patents)

Abstract

:
Precision agriculture and smart farming are concepts that are acquiring an important boom due to their relationship with the Internet of Things (IoT), especially in the search for new mechanisms and procedures that allow for sustainable and efficient agriculture to meet future demand from an increasing population. Both concepts require the deployment of sensor networks that monitor agricultural variables for the integration of spatial and temporal agricultural data. This paper presents a system that has been developed to measure the attenuation of radio waves in the 2.4 GHz free band (ISM- Industrial, Scientific and Medical) when propagating inside a tomato greenhouse based on the received signal strength indicator (RSSI), and a procedure for using the system to measure RSSI at different distances and heights. The system is based on Zolertia Re-Mote nodes with the Contiki operating system and a Raspberry Pi to record the data obtained. The receiver node records the RSSI at different locations in the greenhouse with the transmitter node and at different heights. In addition, a study of the radio wave attenuation was measured in a tomato greenhouse, and we publish the corresponding obtained dataset in order to share with the research community.

1. Introduction

Agriculture is a fundamental pillar in a country’s economy and society; therefore, increasing agricultural productivity through cutting-edge technology contributes to economic progress and the feeding of its inhabitants [1]. In this perspective, technological advancement in precision agriculture (PA) has been accelerated by the Internet of Things (IoT), wireless sensor networks (WSN), and even 5G networks [2,3], because almost all techniques used in PA have sensing technology as a common factor [4,5]. PA produces more food with limited resources such as water and soil [6,7,8], effectively increasing the quality and yield of crops [9], a remarkable fact considering the Food and Agriculture Organization of the United Nations (FAO) states that the human population level on a global scale will increase from eight billion inhabitants in 2025 to nine billion, six hundred million in 2050 [10].
In a PA scenario, wireless sensor networks (WSNs) serve as a local crop monitoring system that allows for making the right decisions in a controlled production system affected by climate change [11,12,13,14]. Sensor values in agricultural fields are adjusted and set according to the specific requirements of each type of plant, e.g., in an appropriate range to provide continuous information on the field conditions of the temperature, wind, light, soil moisture, nutrients, and illuminance variables [15,16,17].
On the other hand, with WSN being a distributed system, it is usually composed of small-sized embedded devices [18] called nodes or motes, which communicate wirelessly in a network. Each node has four subsystems described in Figure 1. The first detects the environment by means of its sensors that measure physical data and translate them into analogue signals that are then converted into digital signals. The second is the processing subsystem which contains the microcontroller that performs calculations on the digital data collected through the ADC. The third is the communication subsystem that is in charge of exchanging the information between the different sensor nodes by means of its transceivers [3]. Radio modules operating according to the IEEE 802.15.14 standard typically use radio frequency transceivers in the 2.4 GHz band (2400–2483.5 MHz) [19], as it is freely available worldwide and the most widely used among radio modules from manufacturers using WLAN [20,21,22], PAN wireless communication standards such as IEEE 802.15.1 (Bluetooth), IEEE 802.15.4 used in WSN (wireless sensor network), and IEEE 802.11 (WiFi). Finally, the fourth subsystem is the power subsystem, with a design based on energy saving, which is relevant as sensors have to operate on an extremely limited energy budget [10,23].
Wireless data transmission is one of the main features of IoT which enables information collection on a wide spectrum of physical parameters in agriculture thanks to its self-organization, low cost, low power consumption, wide coverage area, and deployment in complex and changing environments over areas with problematic power supply among its other characteristics [24]. This facilitates making farming practices more productive, sustainable and environmentally friendly [25,26,27].
In this work we are interested in the development of a new measurement system that facilitates the registration of the RSSI (received signal strength indicator) of radio waves in the 2.4 GHz band that propagate in greenhouse crops for carrying out specific studies of radio wave attenuation to validate the developed system, in our case for tomato greenhouses. Other works have developed a similar RSSI measurement system design but specifically to find the positioning of nodes inside a greenhouse [28,29,30]. However, our measurement system is prepared especially for measuring the radio wave attenuation inside greenhouses.
Some parts of this work were presented previously in [31]. However, this work includes not only the novel RSSI measurement system, but also the procedure to be used for measuring the radio wave attenuation in greenhouses.
In next sections, we present how the radio wave attenuation measurement system based on RSSI was developed, detailing its configuration, assembly and deployment on greenhouses. The article is divided into six sections. Section 2 describes the architecture, hardware, and software of the developed measurement and recording system. Section 3 details how the system was deployed during field tests and the steps followed to perform the measurements. Section 4 describes details of the registered dataset obtained in specific tomato greenhouses. Section 5 discusses the results obtained, and Section 6 presents the conclusions of our work.

2. Radio Wave Attenuation Measurement System in a Greenhouse
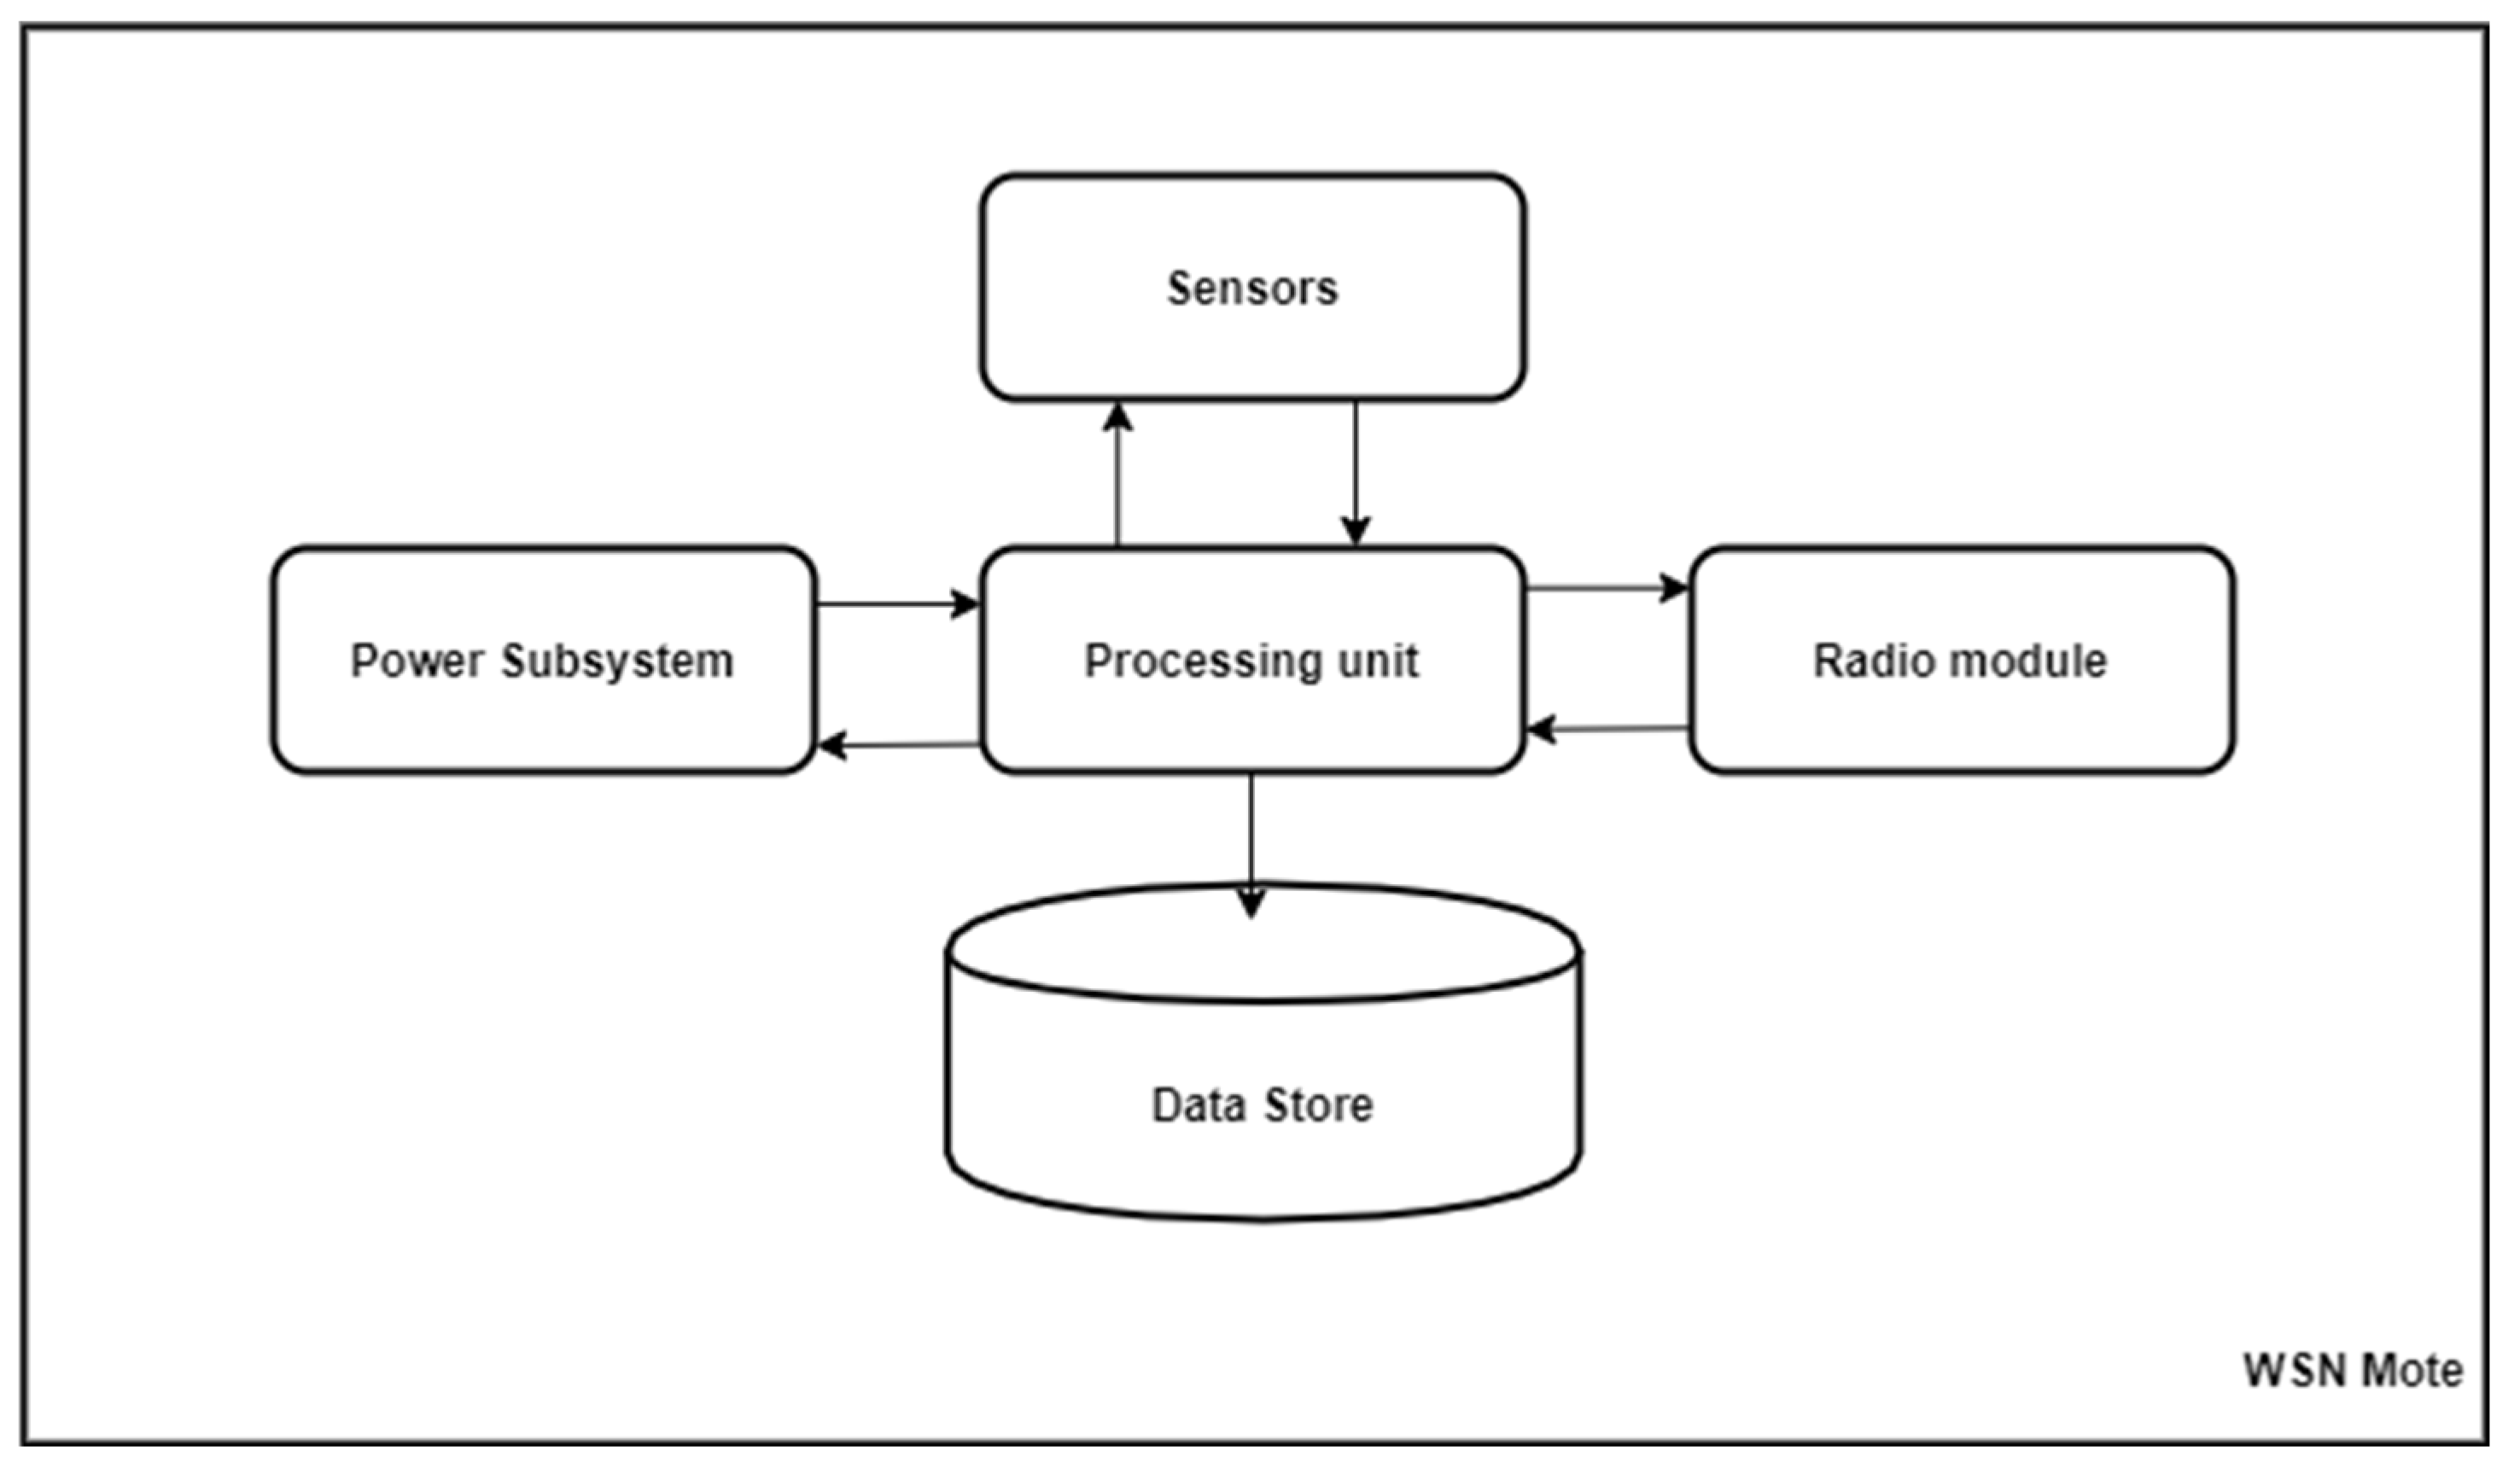
Part of the agricultural industry is based on greenhouse production systems, originally implemented in northern latitudes or geographic areas with a cold climate, so that the harvesting season would be prolonged over the year. In that sense, because the greenhouse plantations are located in well-defined indoor areas, WSNs are easier to implement than in outdoor crops in the field. The amount of transmitted data for WSNs used in agriculture is usually small, as the record of each monitored sample is taken at a considerably spaced time because its values change at a slow rate. Still, constant data transmission is necessary while minimizing the number of IoT devices deployed in the field, in order to reduce the cost of implementation and deployment of the nodes in the crop area, while ensuring the performance of the system [32]. One way to reduce the number of nodes in the WSN is to deploy them at the maximum distance from each other. However, the maximum spacing of the nodes varies in relation to the type of crop monitored [33]. Therefore, it is taken into account that crop growth can affect the propagation of electromagnetic signals, the deployment of WSN nodes and topology control [12], because the wireless signal, in addition to losing power with increasing distance between nodes, suffers from multipath fading due to reflection, diffraction and scattering when the radio signal propagates through the environment between the transmitter and receiver due to the presence of the leafy branches, leaves, and fruits of crops [9,34]. At this point, there is a clear interest of the scientific community in propagation studies and planning in the deployment of WSNs using different radio wave frequencies in different densities of food crops, and developing propagation models to establish the loss in the signal path [35,36,37].
In the case of our developed measurement system, this allows measurements of the received signal strength level (RSSI) inside a farm, and in particular in a greenhouse at different distances and height between the transmitter and the receiver. Also, this system contributes to precision agriculture by determining the maximum communication distance between two wireless nodes, to efficiently plan the number of nodes in the WSN and their coverage area in sensor/actuator deployment within an agricultural field. There are other studies on this subject, which also employ wireless sensor networks, and use mobile devices based on Arduino boards and Xbee radio modules [38,39,40]. In our case, for the RSSI measurement of radio waves, we use a board that has an integrated radio module in the 2.4 GHz ISM band [41]. On the other hand, we include data logging in the system itself so that it is autonomous, and can operate 24 h for two weeks without interruption. The main benefit of the developed system is its portability, ease of installation in an agricultural environment, and sufficient autonomy time for continuous monitoring. The system is also capable of operating in the 868/915 MHz band, although no tests were carried out on this band in this study. If the working environment inside a greenhouse is difficult for the farmer because it is a closed environment, usually with higher temperature and humidity levels than outside, it is even more difficult for someone who is not involved in these tasks, such as a researcher who performs radio wave measurements for hours inside a greenhouse. In this sense, the main difference of our proposed system concerning similar solutions is its ease of implementation, verified in our field tests, and its ability to store data that can then be used to evaluate the attenuation behavior of radio waves in a crop with the possibility of generating new models from the values taken. The greater the amount of data collected, the greater the accuracy of the results obtained in the analysis, so our system can record RSSI for a full day unattended.

2.1. Architecture

The architecture of the system is composed of two stations, the receiving station which records the RSSI of the signal sent from the transmitting station. The receiving station is composed of the Re-Mote node which is connected and powered through its USB port connected to a Raspberry Pi embedded system, and the latter to a 220 V power socket inside the greenhouse. The system is autonomous, but for monitoring purposes, it is connected sporadically to a laptop with a UTP cable to the RJ45 port of the Raspberry Pi. The transmitter station is made up of the Re-Mote node, which is powered by a rechargeable 3.7 V lithium-ion battery with a nominal capacity of 6600 mAh that gives it autonomy in its operation. These elements are housed in a PVC enclosure with an IP65 protection rating, prepared to keep out dust and water jets.
Figure 2 shows schematically the arrangement of the two stations in the crop. Each station is placed on a mast supported by a 17 kg base for stability. Acrylic plates that carry the PVC boxes are attached to the masts. The PVC box at the transmitter station houses the Re-Mote node and a battery that powers it, giving it autonomy. On the receiver side, the PVC box houses the Re-Mote node intercommunicated and powered by its USB connection to the Raspberry Pi, which is the data logging unit, with its charger plugged into a 220 V socket.

2.2. System Hardware

The measuring and recording system consists of the following hardware components:
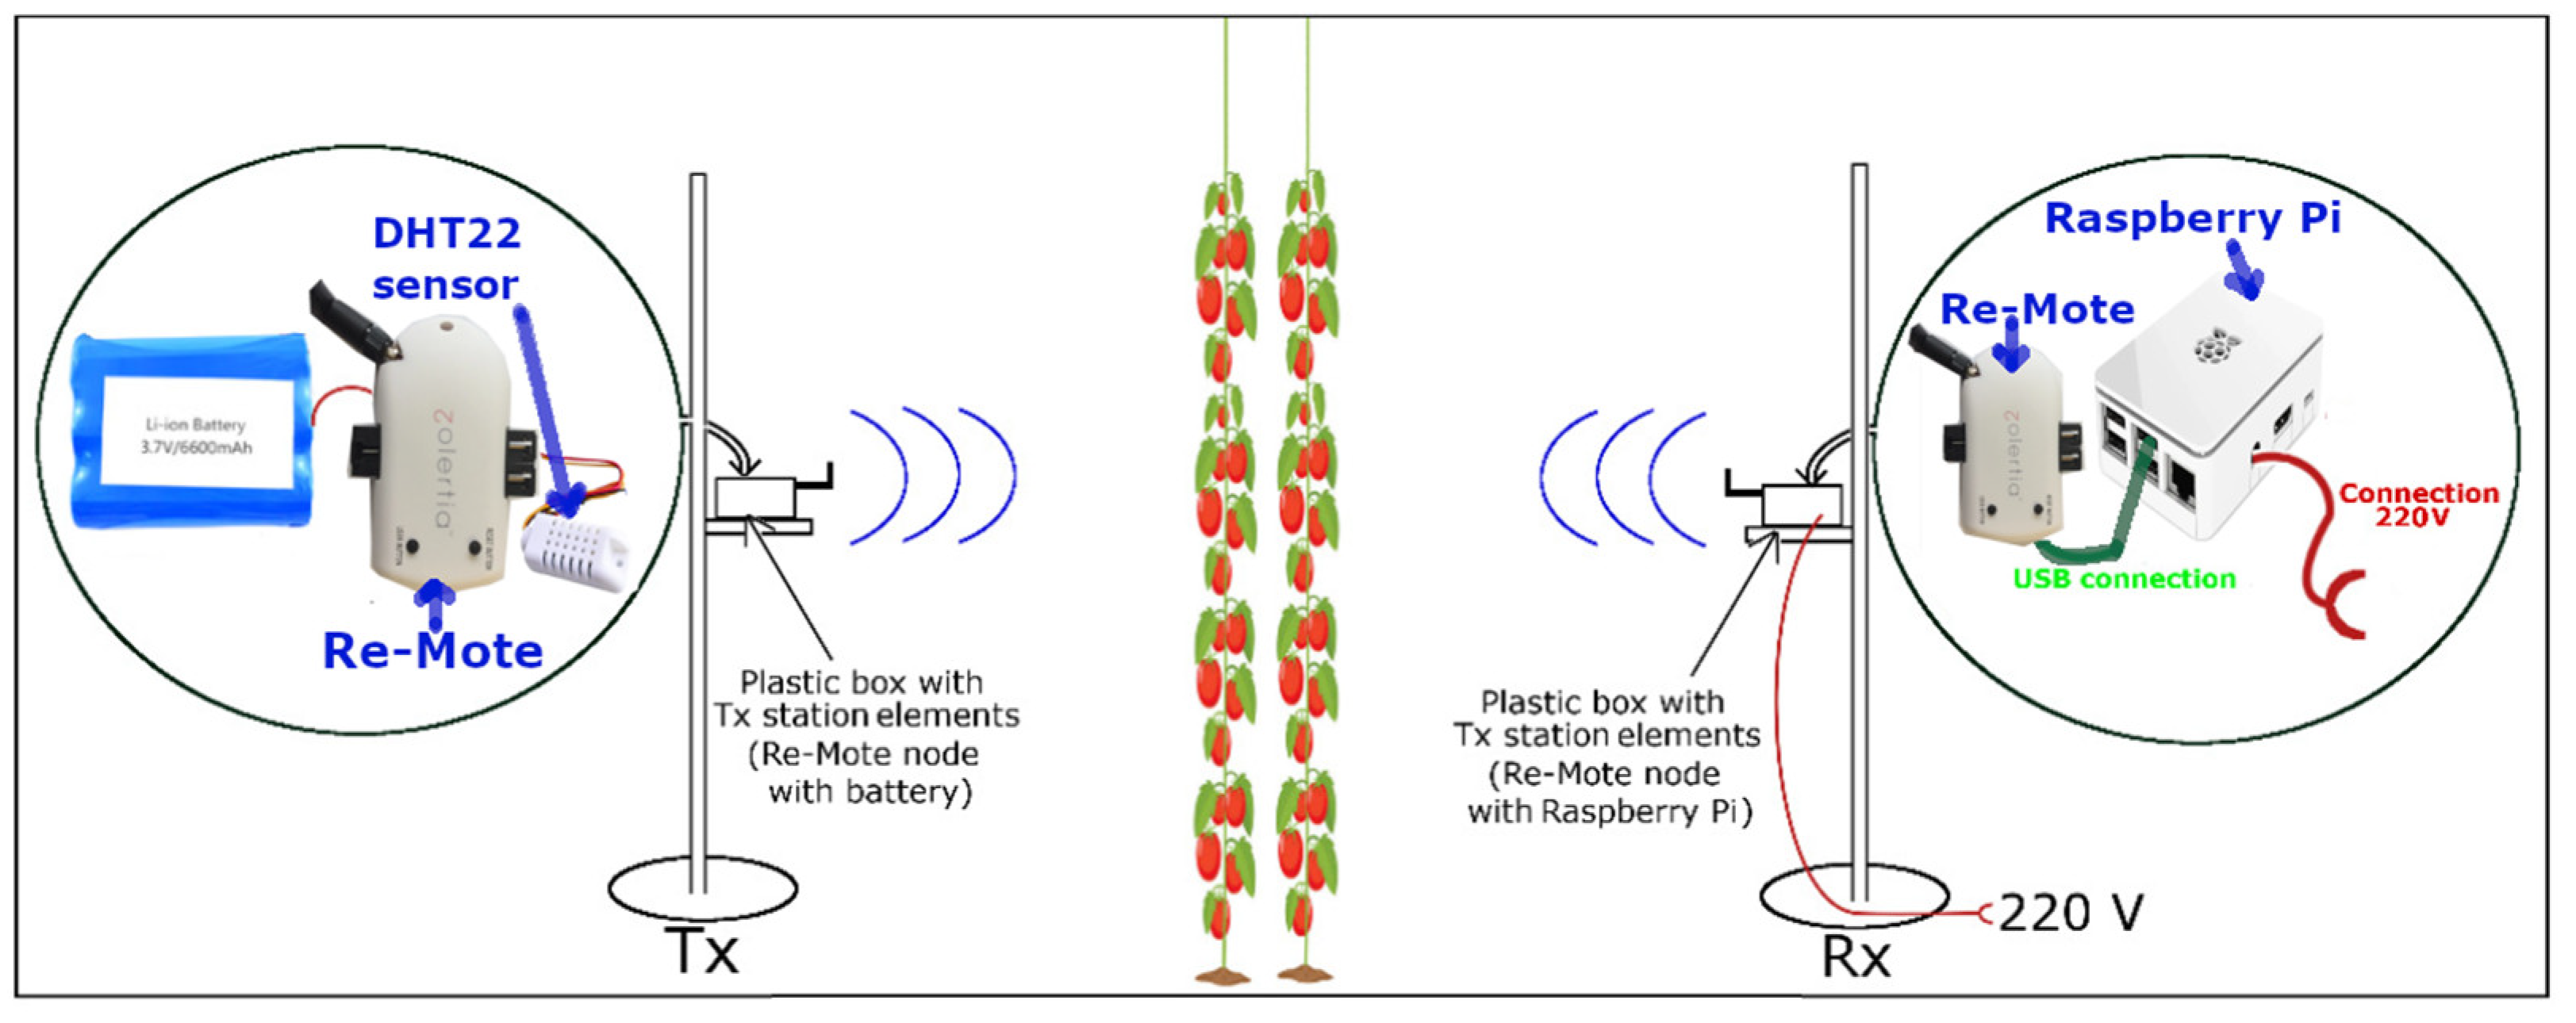
  • Re-Mote nodes. Zolertia’s Re-Mote motes have radio transceiver modules capable of acting as a Tx transmitter and Rx receiver node. It was chosen because its board is an IoT platform with extensive Contiki OS software support, including 6LoWPAN, RPL and other widely used IoT protocols. It integrates Texas Instruments’ CC2538 System-on-Chip (SoC) chip for low-power, short-range communication in the 2.4 GHz band, with a current consumption of 24 mA when transmitting, 20 mA when receiving, and 1.3 uA in the sleep state [42,43,44]. On the other hand, the EIRP (equivalent radiated isotropic radiated power) of the Tx node was −29 dBm in the tests and 5 dBi gain antennas were used for both motes. The re-receive sensitivity at the Re-Mote nodes was −97 dBm.
  • Raspberry Pi. A Raspberry Pi was selected as a server that stores the measurement data on an SD memory stick in CSV format (Figure 2). It is co-connected and powered to the Rx-mote through its USB port [45].
  • Lithium-ion battery. The lithium-ion battery was connected to the 3.7 V Tx transmitter to maintain the transmitter’s autonomy.
  • Humidity and temperature sensor. In addition, the DHT22 sensor was connected to the transmitter module to transmit temperature and humidity data, which are traditionally used to monitor and supervise the environmental conditions of the crop in a greenhouse.

2.3. System Software

For the proper functioning of the system, it is necessary to develop the appropriate software infrastructure in order to minimize energy consumption. The software developed in each case is specified below.
  • Re-Mote nodes. The Contiki operating system, developed in 2002 by Adam Dunkels, was installed and configured as an open source runtime environment for low-power, memory-limited wireless sensor nodes [46]. It is lightweight, making it ideal for IoT. Its applications are developed with the C programming language. It has a built-in TCP/IP implementation for embedded devices, officially supporting various device platforms that make up wireless sensor networks, including the Re-Mote board [47,48,49]. Only Contiki’s power-saving module (power-mgmt.h) was used in the transmitter node, because during the test phase this station is the one that is far away from the receiver node and does not have an electrical outlet, instead being powered by its own battery. The receiving node was powered by the Raspberry Pi, which in turn was connected to a power socket at one end of the greenhouse. For radio communication, we employed the Rime stack (rime.h), which provides a set of basic communication primitives for best-effort single-hop network broadcasting (“unicast”) and reliable multi-hop “multi-hop unicast” [50].
  • The program developed in C for the transmitter station sends frames of temperature and humidity data obtained from the DHT22 sensor periodically on a variable timer, while remaining suspended the rest of the time. This reduces power consumption, extending the transmitter’s autonomy. On the other hand, the receiving station, powered by the Raspberry Pi and the greenhouse socket, measures the RSSI and obtains the data frame sent by the transmitter node.
  • Raspberry Pi. The Raspbian distribution based on Debian was installed and several scripts were developed in the Python language that established serial communication with the Zolertia devices and generated.csv files with the data they receive, storing them in the SD memory of the Raspberry Pi. It also has a clock module with a CR2032 battery so that the date and time are not decalibrated when it is turned off, recording it with each RSSI record.

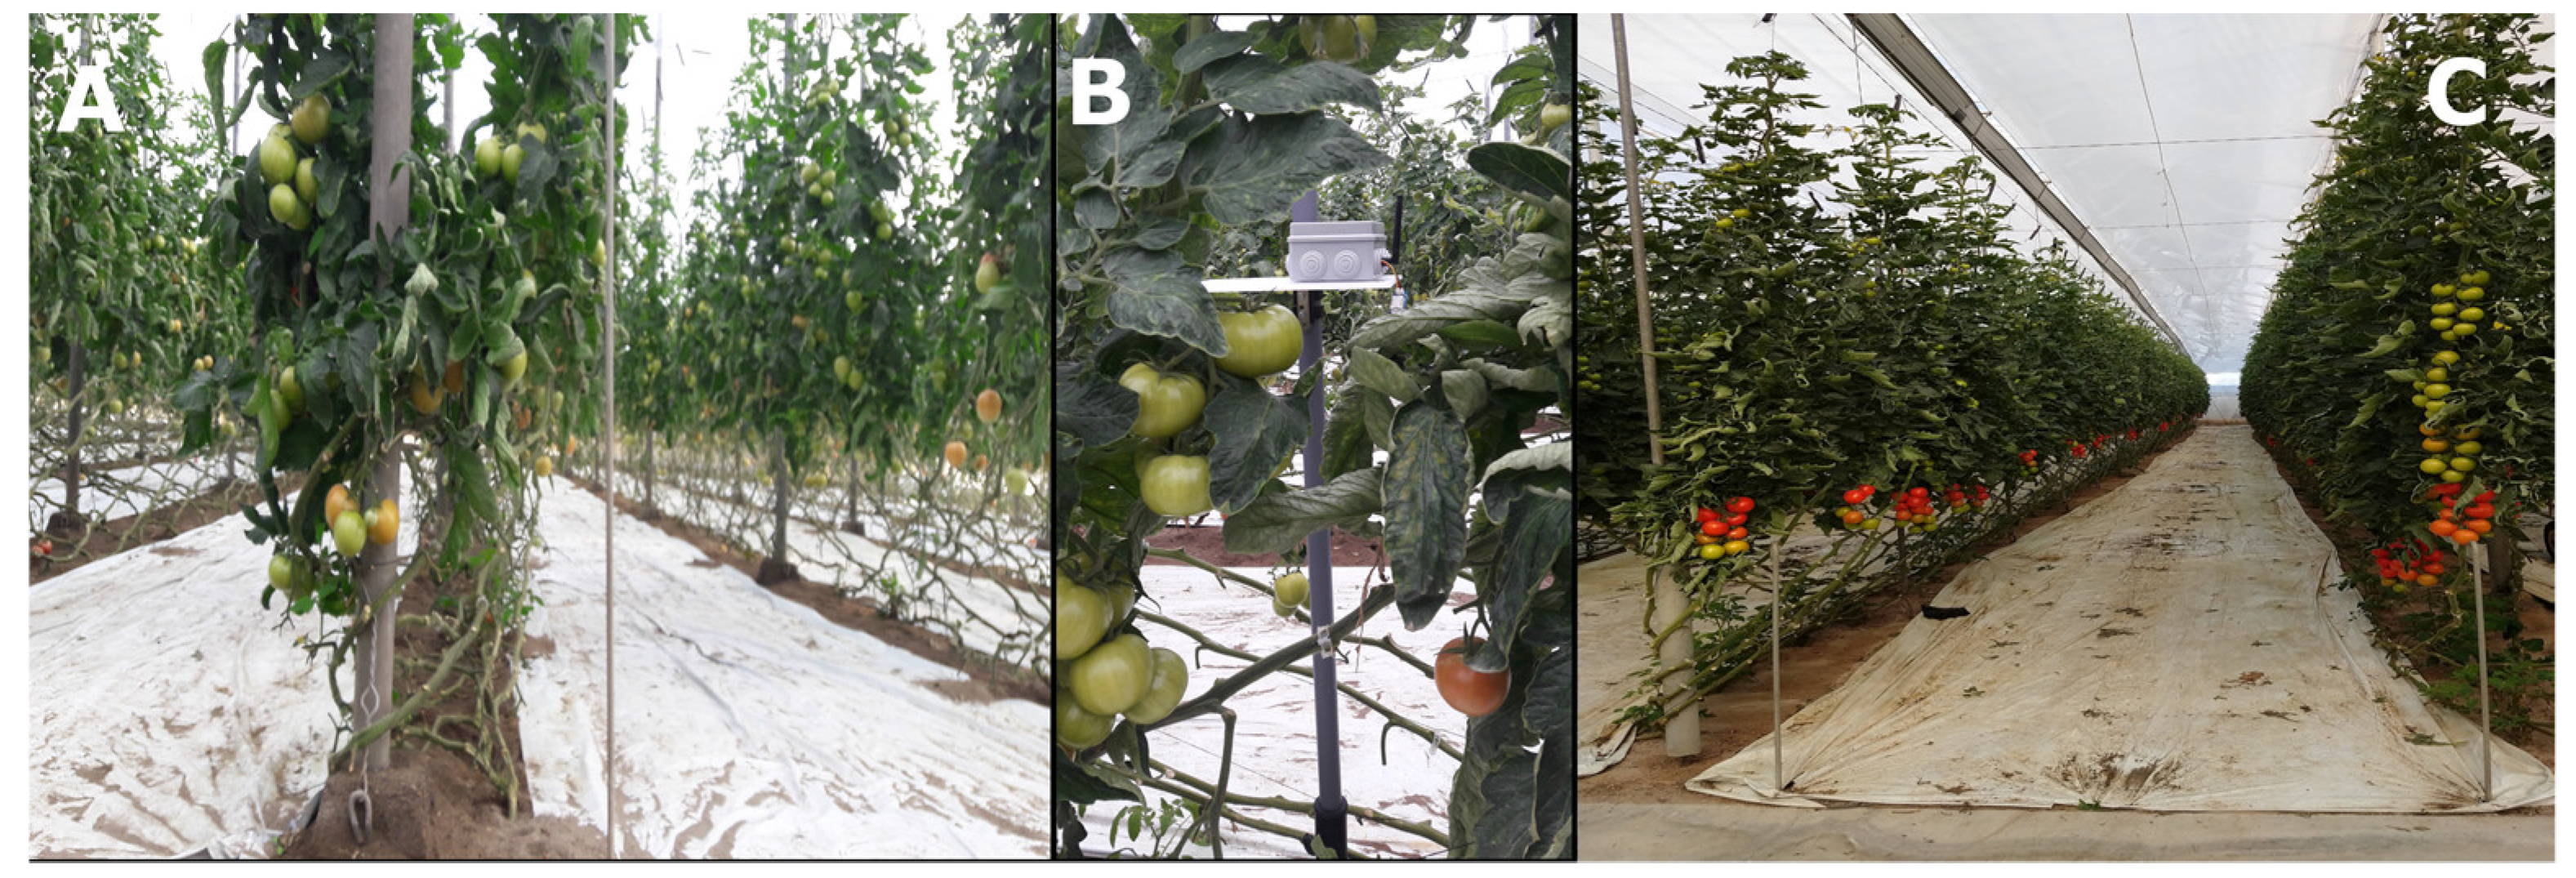
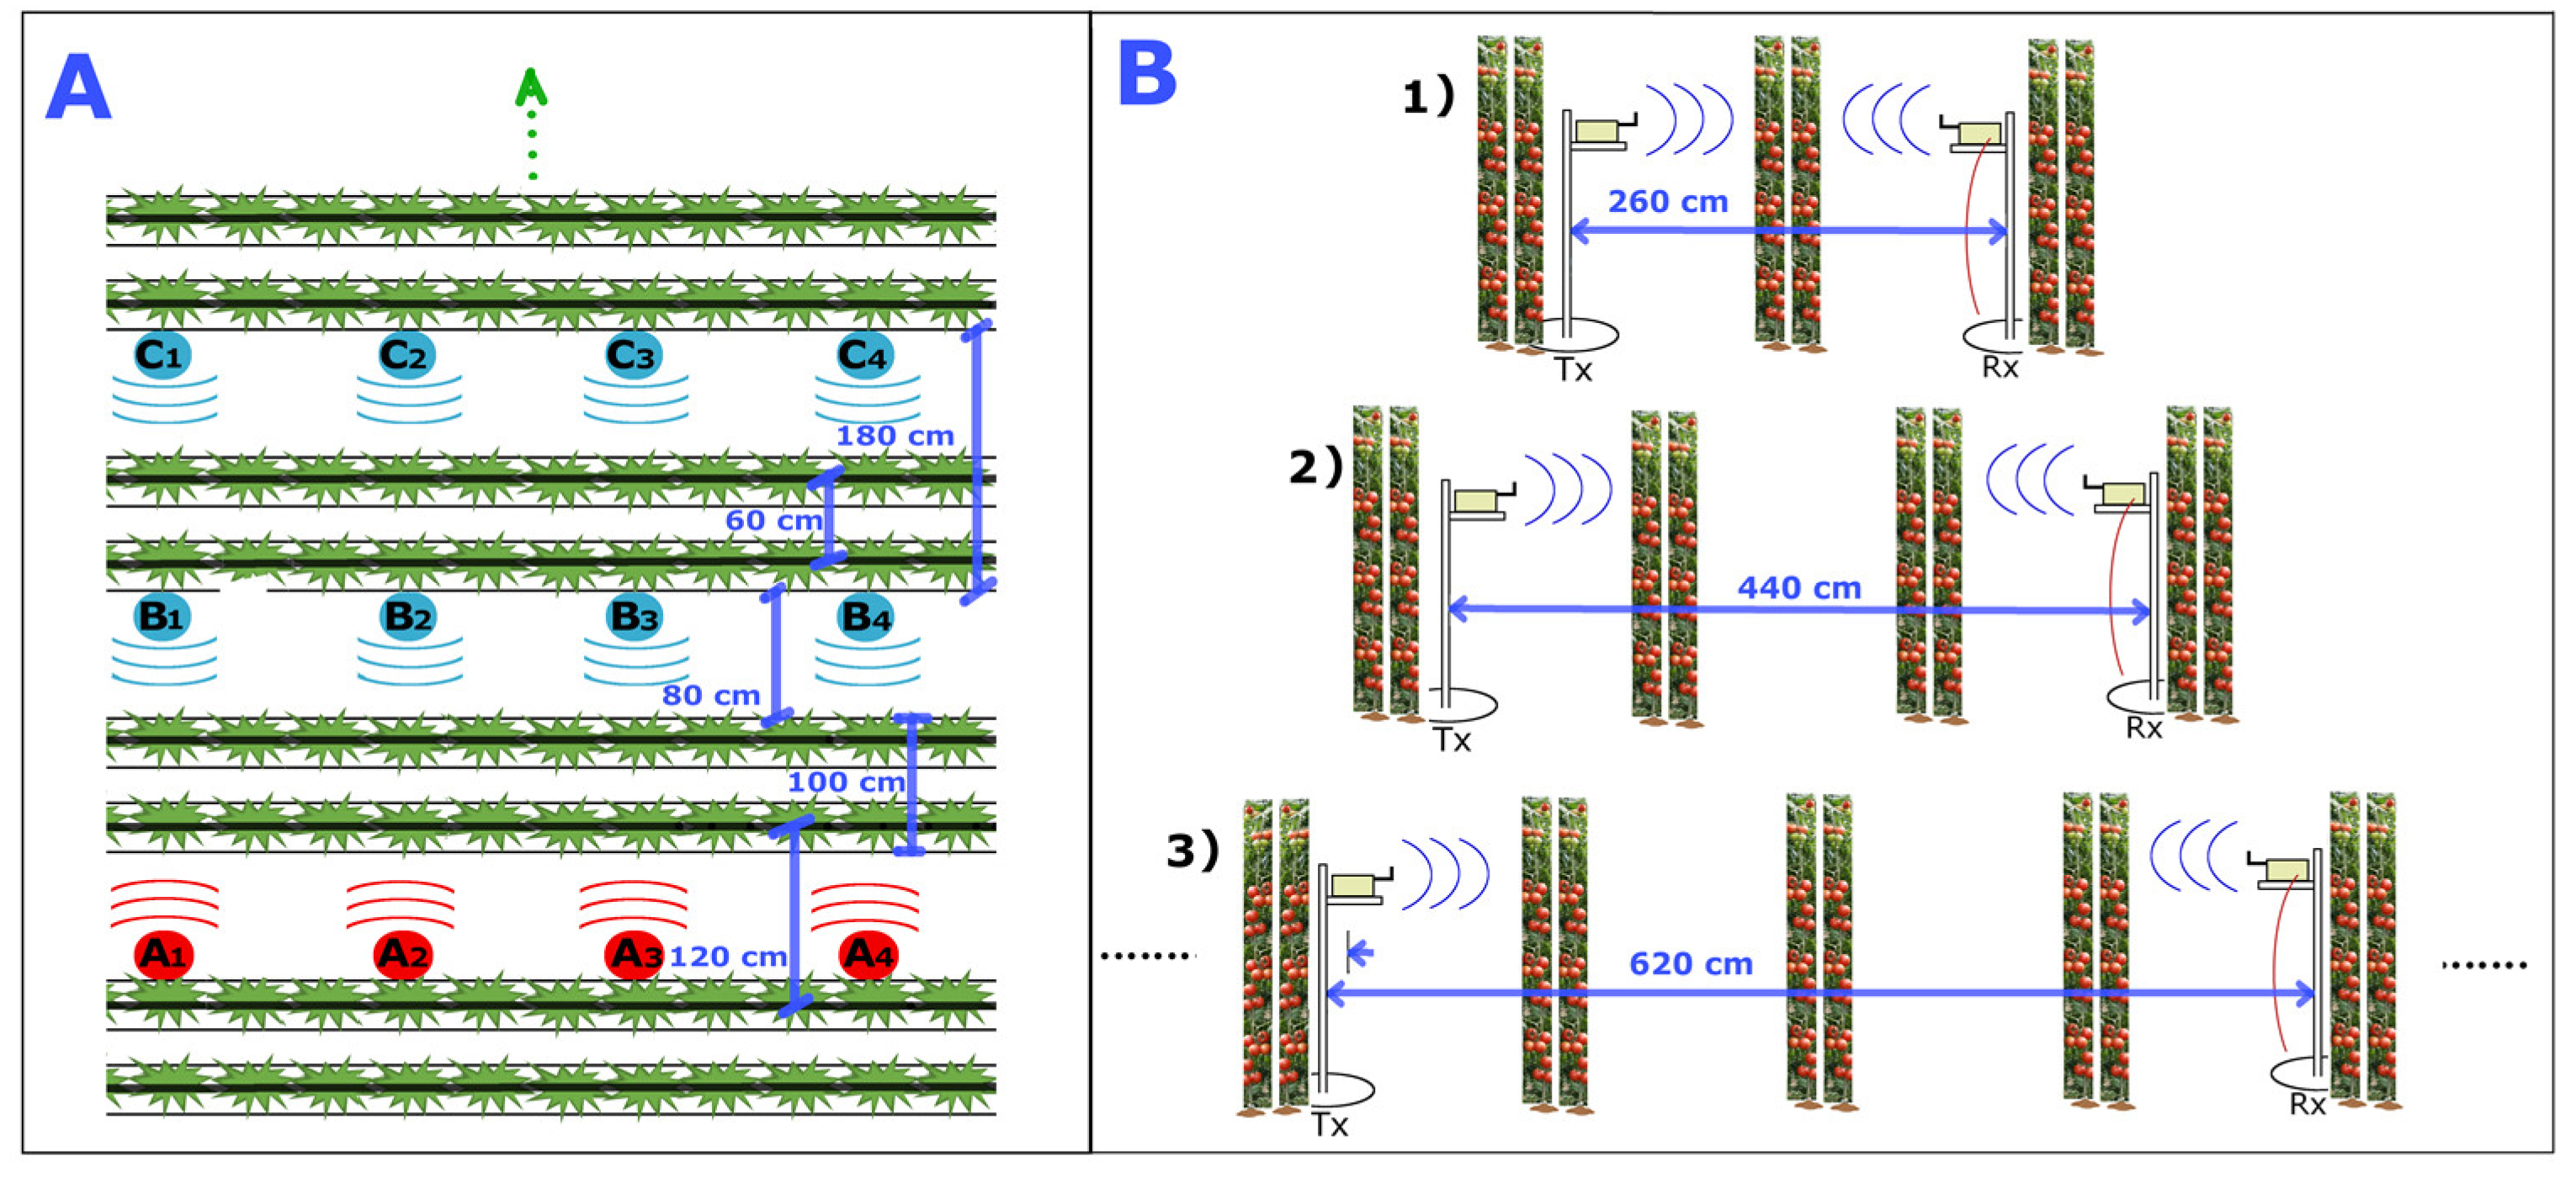
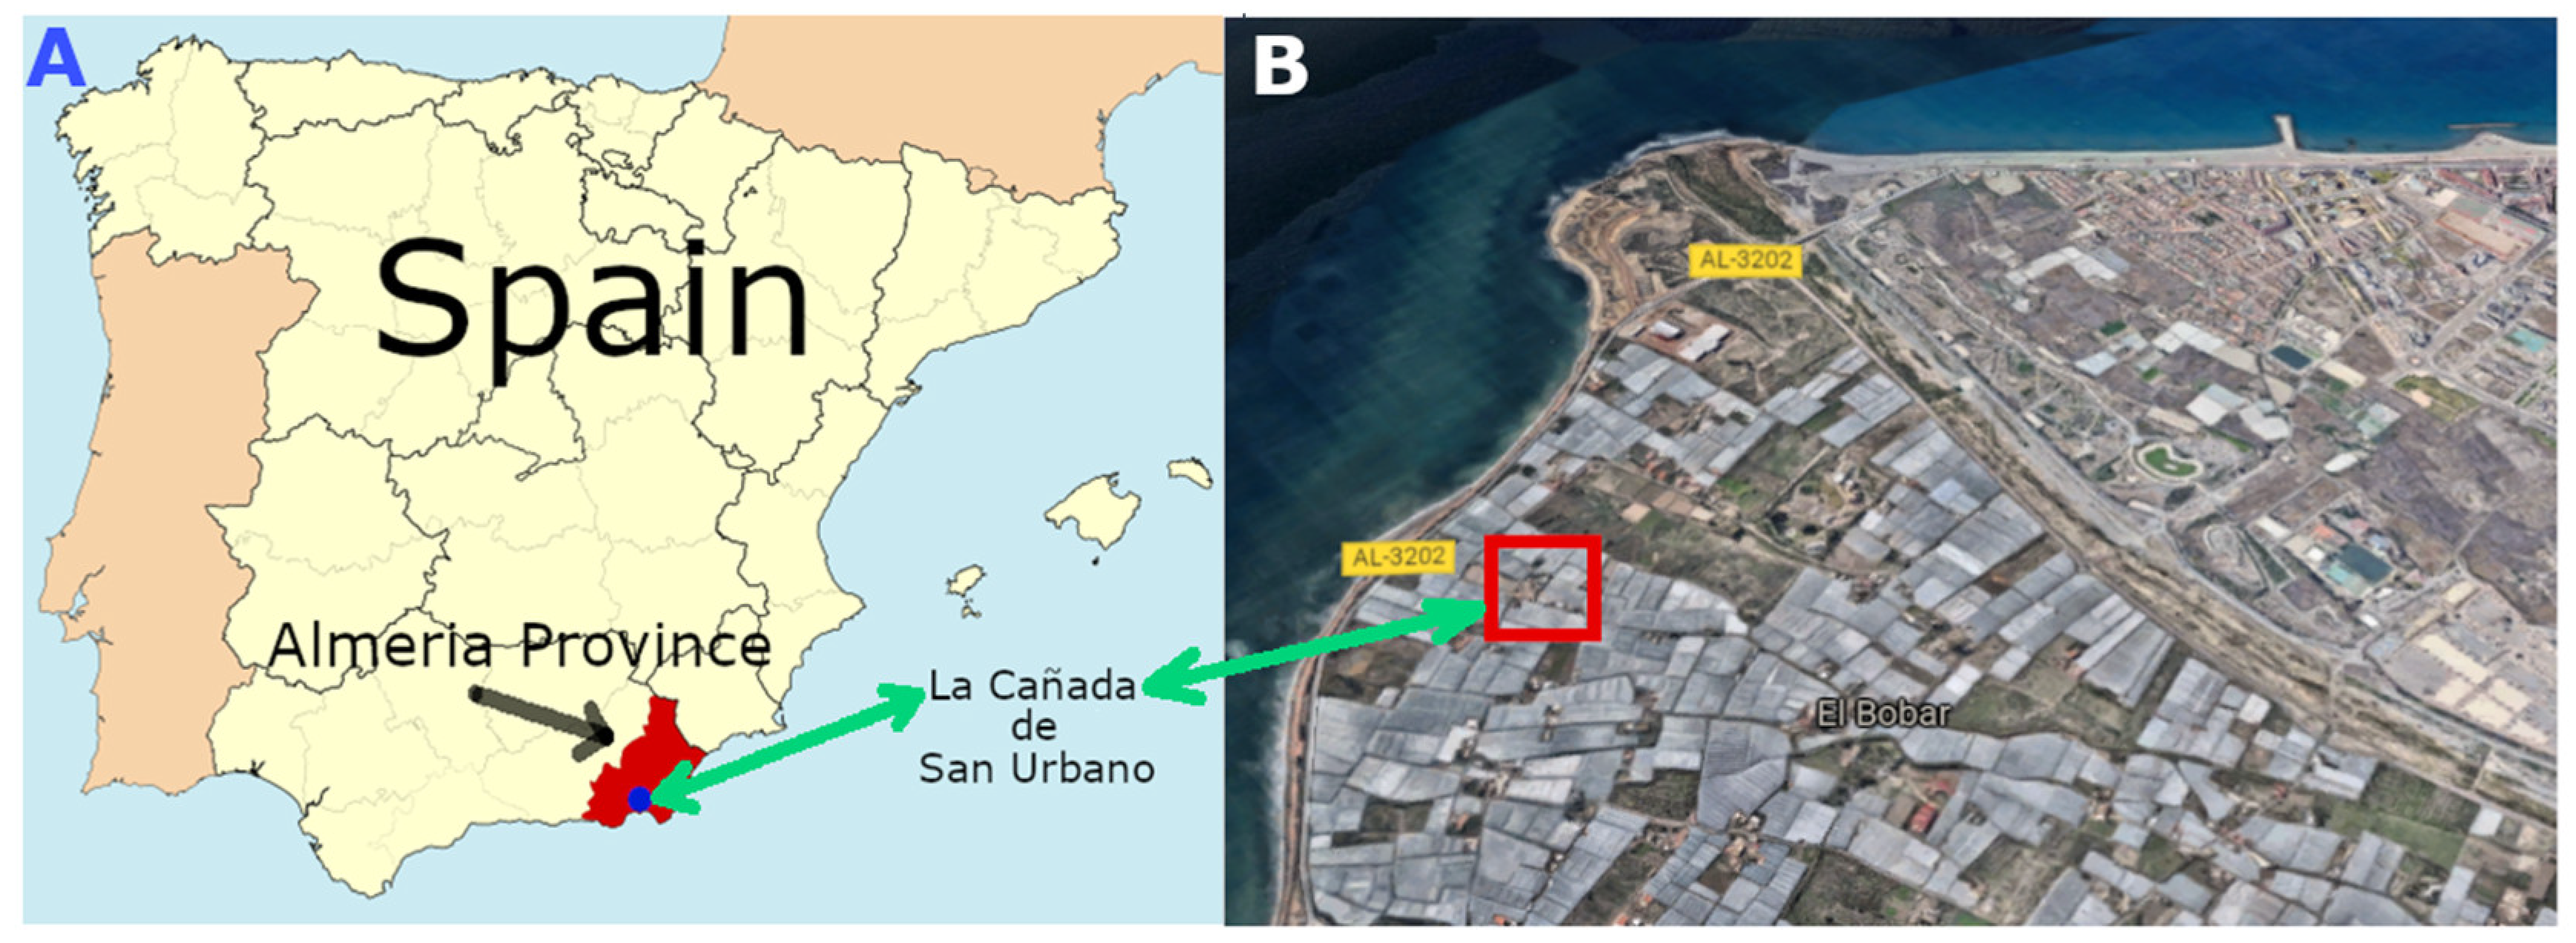
3. Deployment and Commissioning in a Tomato Greenhouse

This section details how the system was deployed, and how the experiments were designed in a tomato greenhouse located in the province of Almeria, Autonomous Community of Andalusia-Spain. This product, in addition to its nutritional value, is in high demand in the European Community markets.

3.1. Deployment of the System

The Tx and Rx (Figure 2) nodes were placed at different distances inside the greenhouse and at different heights with the help of masts. The station was placed on a 17 kg mast base for stability (Figure 3B). Both stations were installed at the same height, and the height was varied throughout the measurements. In general, the tomato plants were aligned in a wall and equidistant from each other, separated by a space or lane where the farmers walk, as seen in Figure 3A,C.

3.2. Conducting Experiments

For the experiments, values were recorded every 10 s for 10 min at each position. The height of the nodes was the same for the Tx and Rx node at each stage of the measurement. In addition to the RSSI recording and analysis tests, monitoring functions for agricultural and environmental variables can also be performed by plugging analogue and digital sensors, e.g., humidity or temperature, into the Re-Mote.

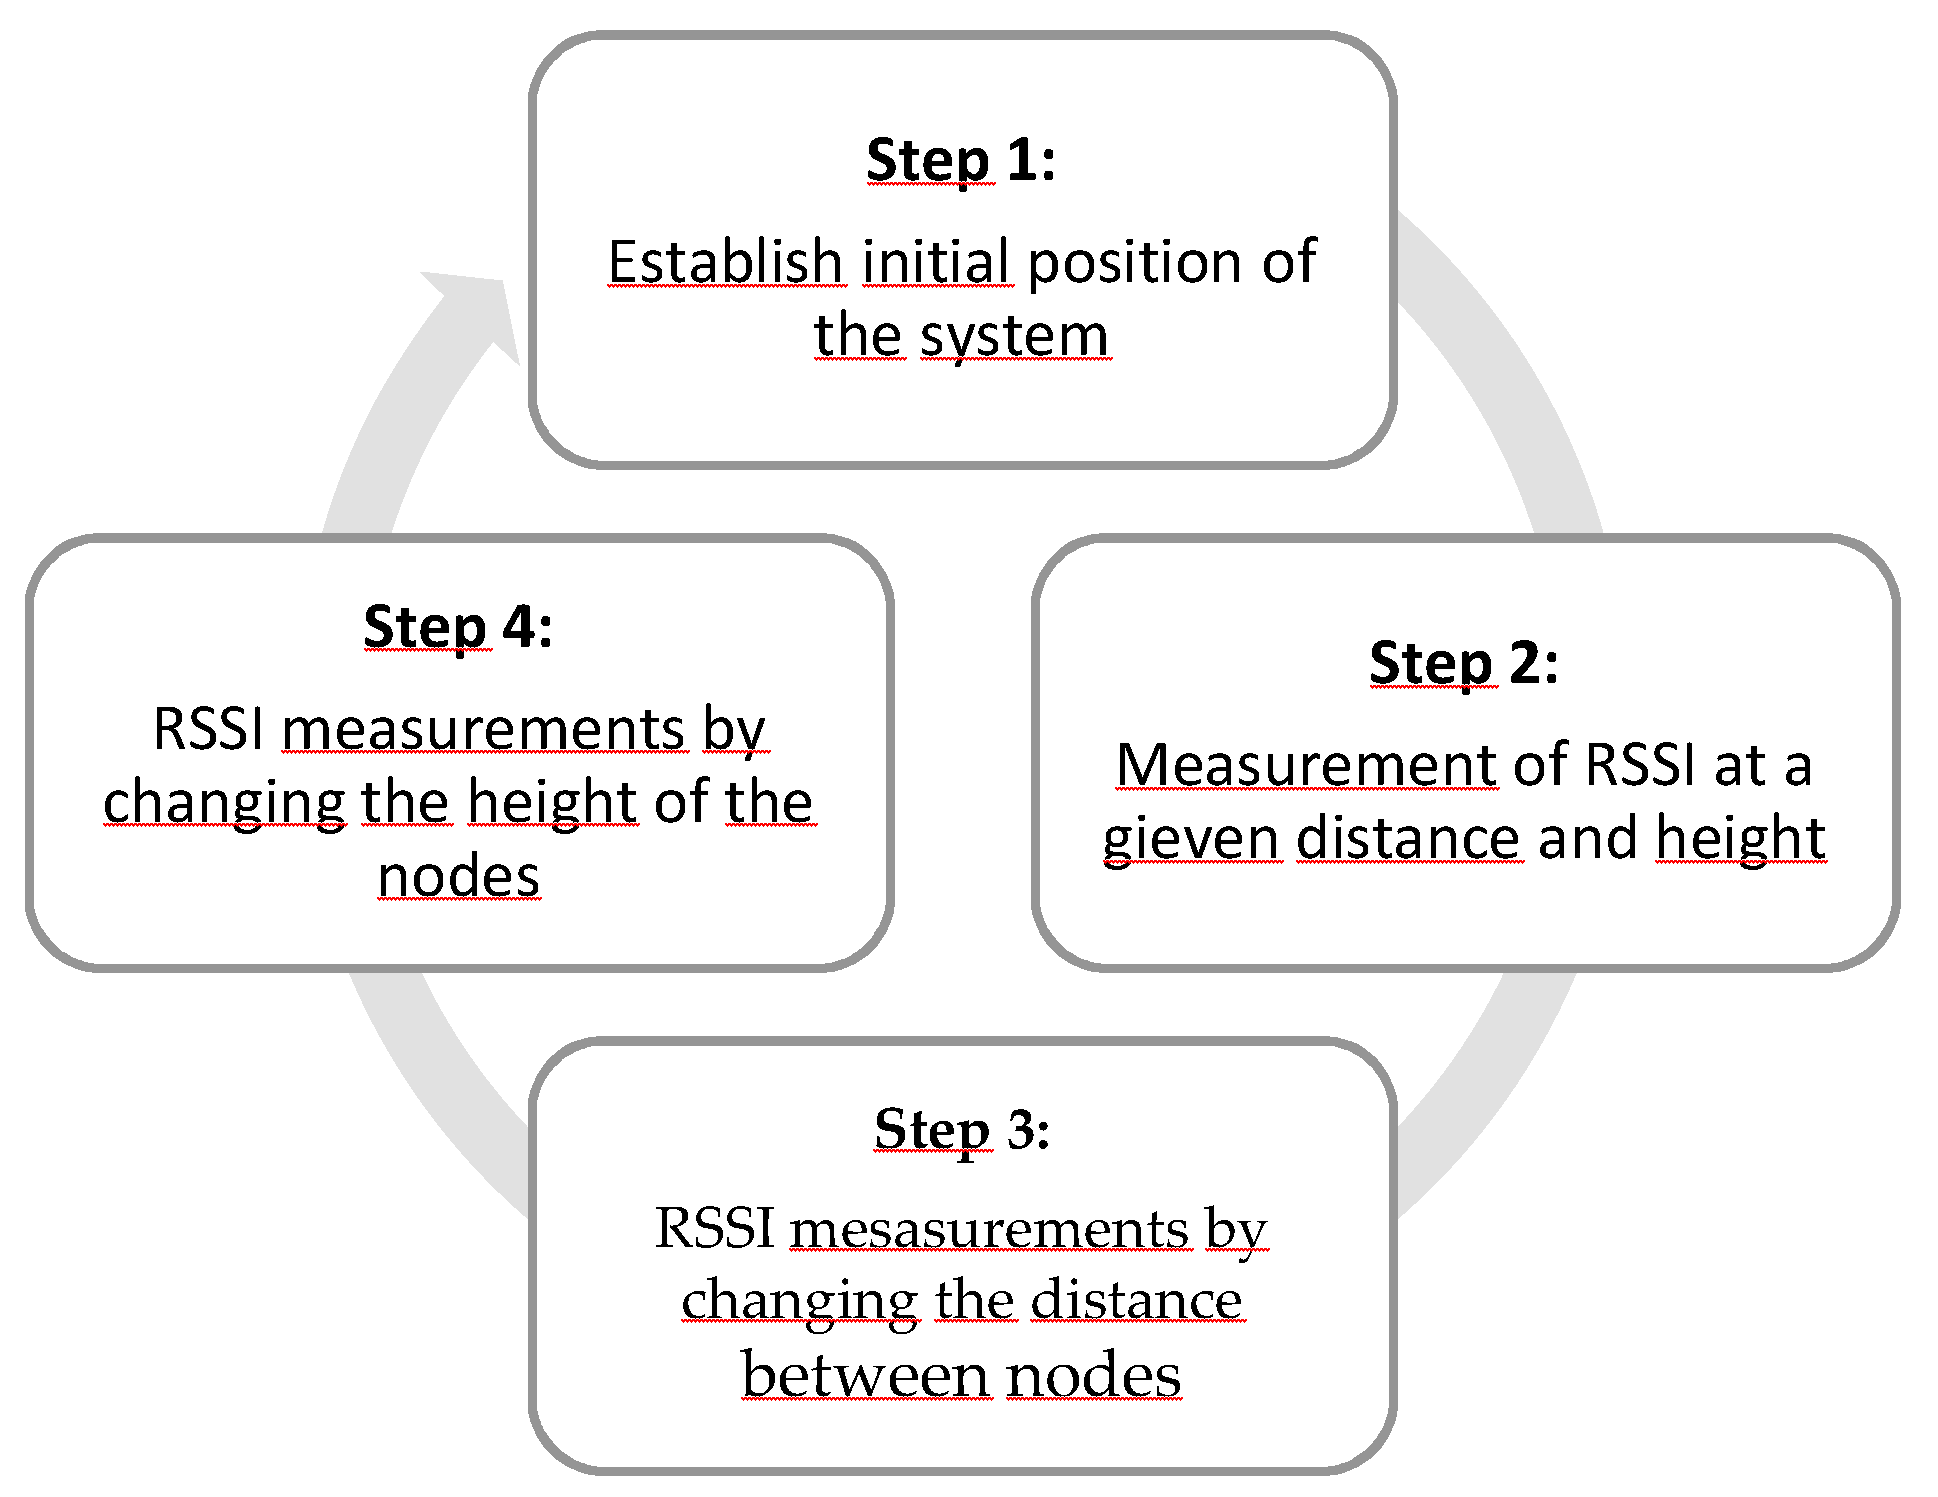
3.3. Measurement Procedure

With the proposed system, different types of studies can be carried out to identify radio wave propagation patterns in orchards [51], mango [52], and tomato greenhouses. In these studies, we should place the receiver and transmitter node at different distances and heights. The RSSI values recorded can be taken at different stages of the crop, from planting to harvesting if it is desired to analyze the data and/or build a model relating radio wave attenuation to the growth stages of the plantation. Alternatively, the analysis or model generation can be developed from the recorded data, when the data are taken in the extreme case, i.e., near harvest time, when the canopy thickness is at its maximum.
In our case we follow the following steps to carry out a study of radio wave attenuation based on RSSI, and is summarized in Figure 4:
Step 1: Initial position of the system. The position of the receiving station is fixed, as it is powered by a 220 V electrical current from a socket in the greenhouse. In any study with the system, the receiving station depicted as Rx is the reference node where the RSSI is to be measured. For instance, in Figure 5A the positions of the receiving nodes are shown in red (A1, A2, A3, A4) at one end of the greenhouse during the measurement of RSSI.
Step 2: RSSI Measurement at a specific distance and height. In this case, the transmitting station depicted as Tx is placed at a specific position with respect to the Rx node. According to the Figure 5A, the RX node was fixed initially at the position A1 while the Tx node was placed at position B1 with a specific distance of 260 cm. This distance depends on the row of plants and the spacing between the rails in the greenhouse. In this case, there is only one row of spacing plants between them. In addition to the distance, both nodes must also be situated at the same height, as shown in Figure 5B.
Once the distance and height are fixed for both nodes, the receiver node can perform the RSSI measurements and collect at the same time the temperature and humidity measured by transmitter node to be transmitted later to receiver node. These measurements can be performed at a customizable rate and can be stored as a data frame.
Subsequently, both stations are moved to the right (for instance, A2 and B2 in Figure 5) maintaining the same height and distance between them. New RSSI measurements were performed by Rx node at a constant rate, generating a new data frame. The process (node movement and measurement) was reiterated until the locations A4 and B4 were reached. The repeated measurements at the same distance and height in different positions guarantee that the measurement of RSII values take into account the fluctuations that occurred by the presence of the leafy branches, leaves, and fruits of crops.
A data collection of all these measurements at different positions (A1, A2, A3, A4) is then stored in the Raspberry PI of the Rx node.
Step 3: RSSI Measurements: changing the distance. In this case, the two stations are moved away from each other, changing the distance between them. For instance, in Figure 5B we can see that after the RSSI measurement in position B, we can move the Tx station to position C 440 cm away, which corresponds to the distance between two rows of plants between the transmitting and receiving station. The Tx station was placed at positions C1, C2, C3, C4, and the RSSI was measured and recorded with the Rx station at positions A1, A2, A3, A4 respectively. On the other hand, we can see in Figure 5B that the height was the same during the RSSI measurements.
Step 4: RSSI Measurements: changing the height. In this case the two stations changed their heights to a new value at the same time, and then the measurement procedure at different distances was repeated again. After the Tx station reaches the opposite end of the greenhouse, the procedure is repeated by changing the height of both nodes to a new height, e.g., 50 cm above the ground. The steps are then repeated starting from step 1.

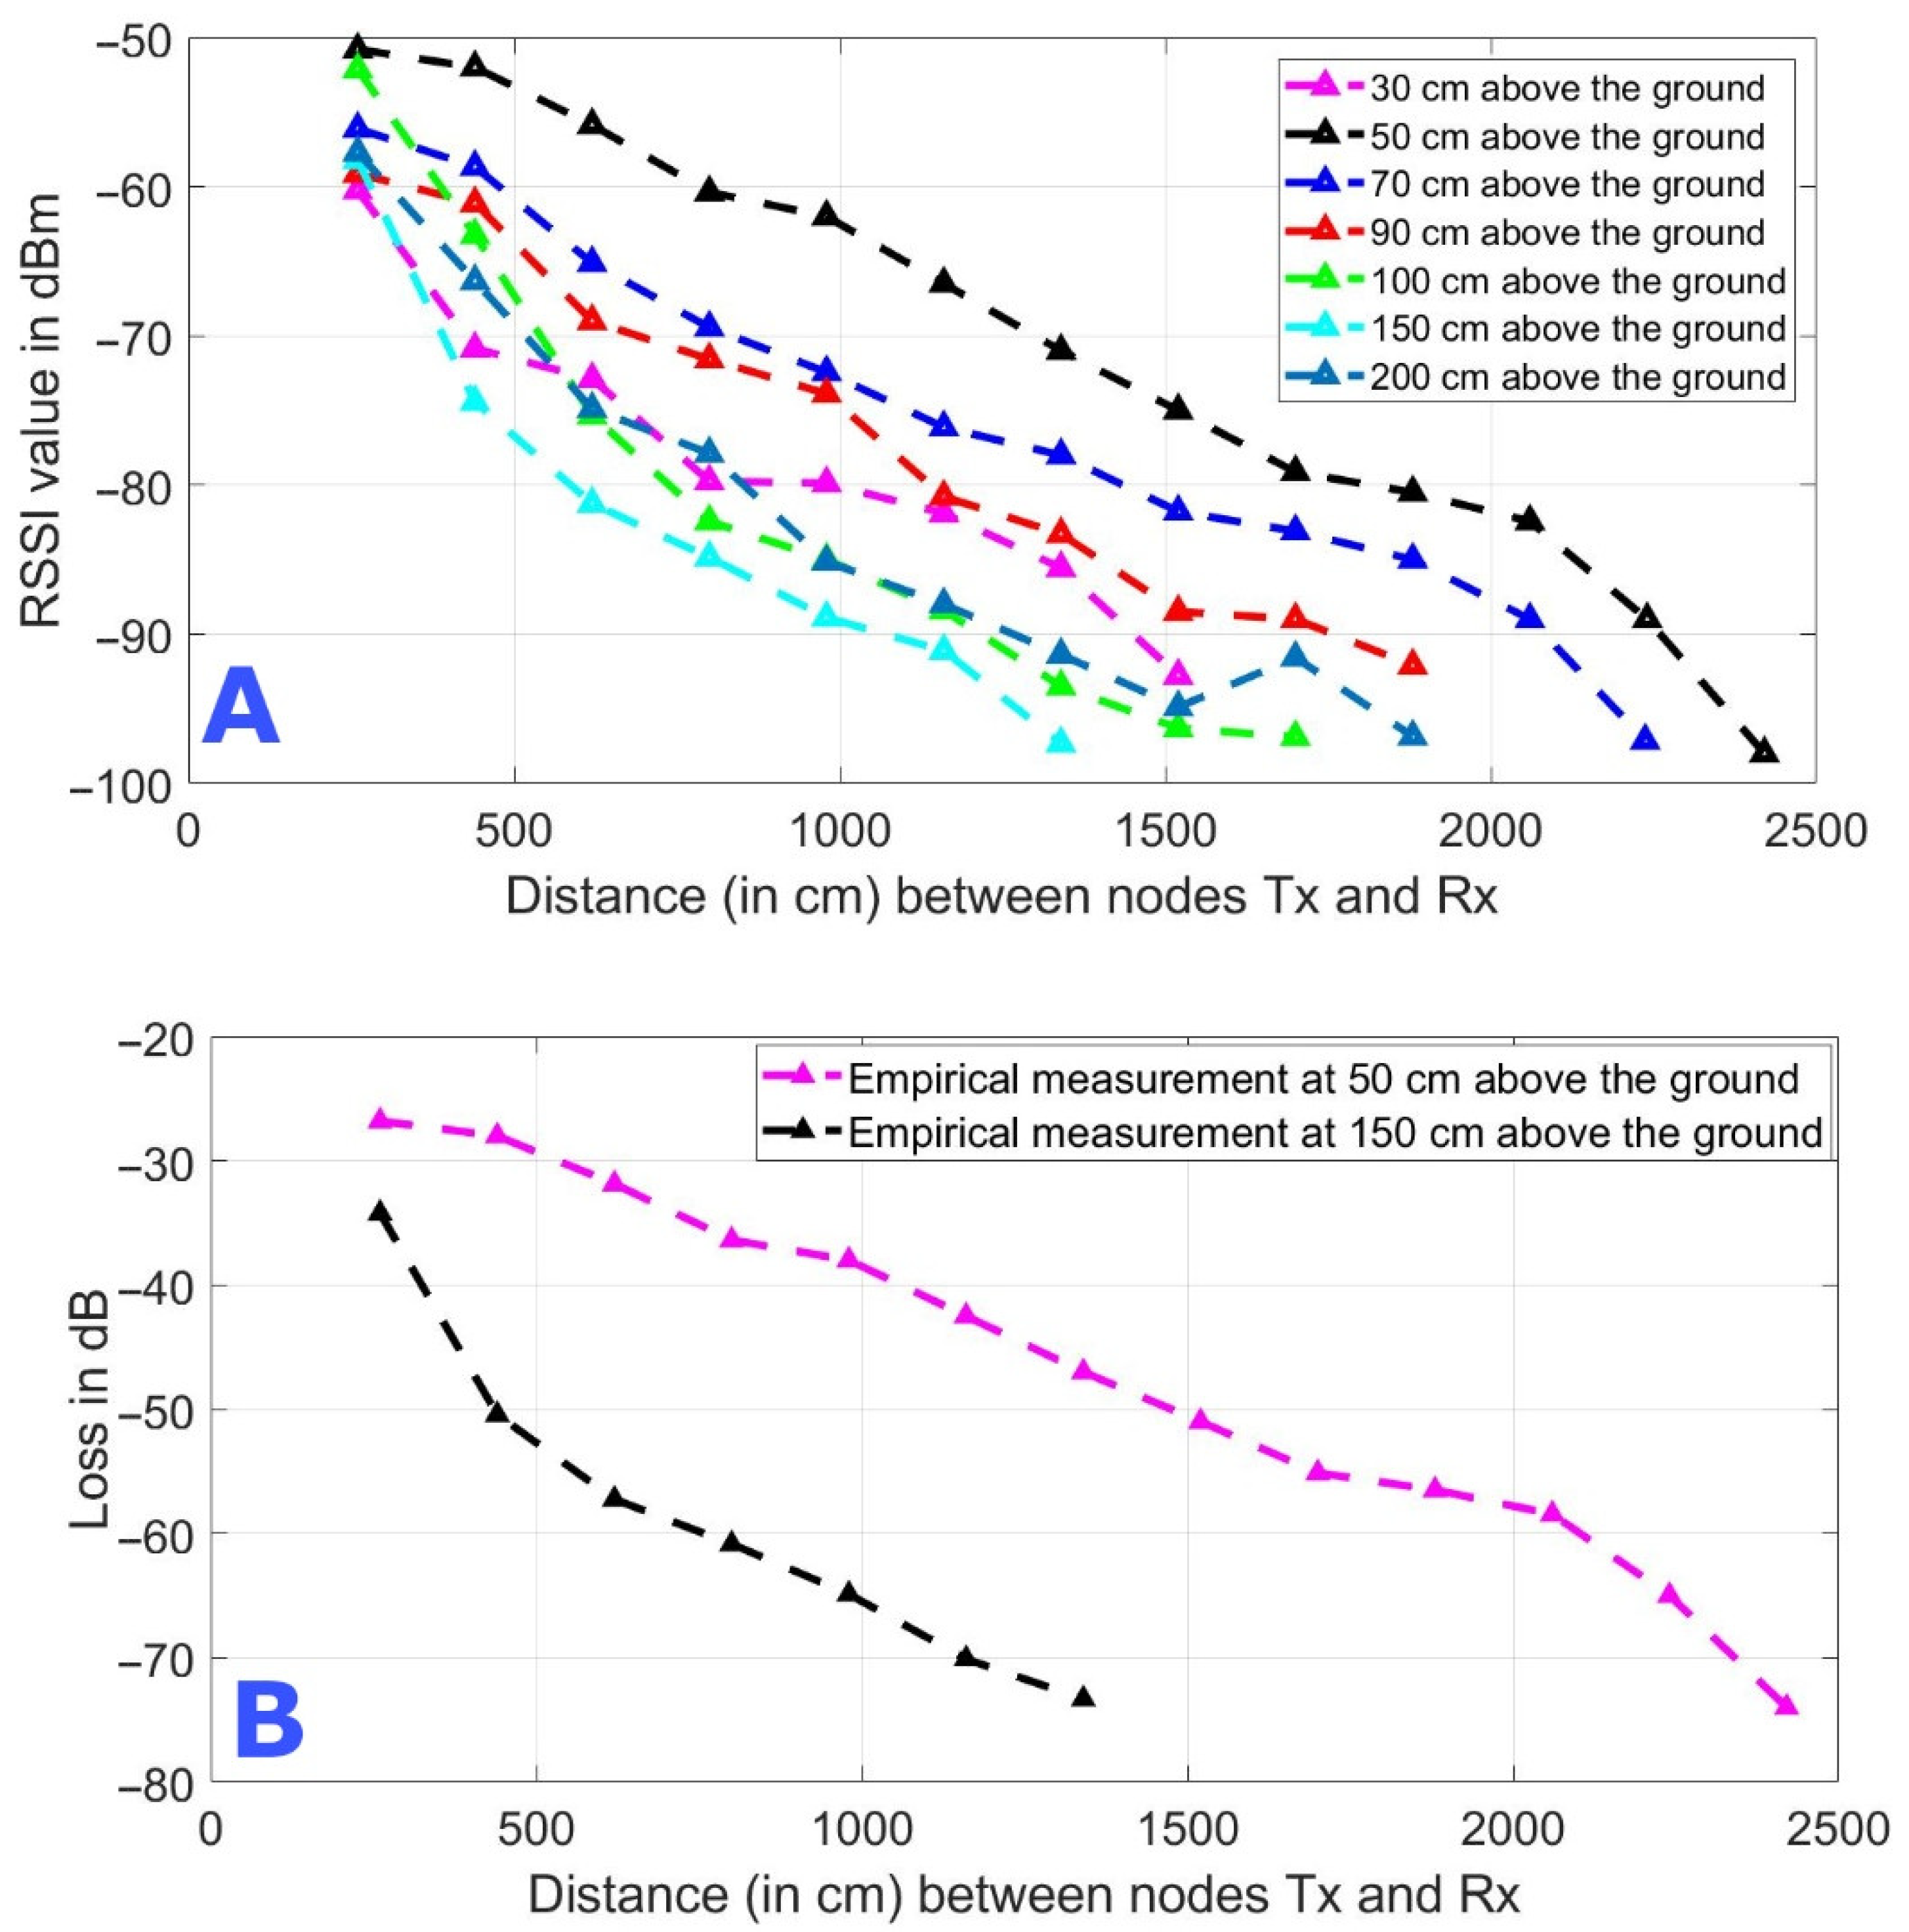
4. Radio Wave Attenuation Dataset in Tomato Greenhouse

In order to validate the measurement system as well as the measurement procedure, a study was performed of radio wave attenuation based on RSSI in tomato greenhouses, specifically in a greenhouse at the Cañada de San Urbano in Almeria (Spain). It is an intensive farming area at the south of Spain, with many greenhouses providing fruit and vegetables to Europe. Figure 6A shows the location on a map of Spain, and Figure 6B shows a satellite image of the greenhouse in Almeria.
In this case, the RSSI measurements were obtained by the receiver node at different distances (260, 440, 620, 800, 980, 1160, 1340, 1520, 1700, 1880, 2060, 2240, and 2420 cm) with different heights (30, 50, 70, 90, 100, 150, and 200 cm). Initially, the receiver node placed at 5 cm from transmitter node reported an RSSI value of −24 dBm (best signal strength); this was the RSSI reference value used to determine the radio wave attenuation when the receiver was moved away from the transmitter node.
A recording of all measurements was saved on a dataset. The RSSI measurements at a specific position (for example A1) corresponding to a data frame were taken every 10 s and stored in CSV format inside the SD memory of the Raspberry Pi. The data frames of different positions at the same distance and height are stored in the same file. Each data frame included values of the RSSI in dBm, the ambient temperature and humidity, and the timestamp including date and time.
The file names indicate first the height of the node antennas, then the distance between the nodes. For example, the file “50–1880 csv” includes the record of the measurements with the antennas of the nodes at 50 cm and a distance of 1880 cm between them. In each file there are 4 segments corresponding to the change of positions of the nodes Tx and Rx, e.g., A1 with B1, A2 with B2, A3 with B3, and A4 with B4, as shown in Figure 5. This dataset can be found at the following link [53]. Table 1 is an example detailing the organization of the values. The first column indicates the sample number, then the temperature value in degrees Celsius, the relative humidity, the RSSI in dBm, the date, and the time the sample was collected.
In our measurement, the power-saving module “power-mgmt.h” was used on the Zolertia Re-Mote nodes, which caused the battery to go from 3.7 V (Tx node) to 2.8 V in about 60 h of use, as measurements were taken every 10 s. Below 2.8 V, it is advisable not to make measurements because the values recorded by the sensors may contain spurious errors.

5. Discussion

From the measurements carried out at different distances and heights, we can analyze the average value of the RSSI measurements and study how the radio wave signals at 2400 MHz attenuate as they pass through the rows of tomato plants (Figure 7). In Figure 7A, we observe that at 50 cm above the ground the maximum distance between the communication of the two Tx and Rx nodes is 2420 cm, and the minimum distance of coverage between them (1340 cm) is reached when the nodes are placed 150 cm above the ground. The values were recorded at the receiver node until they approached −100 dBm, because the receiver sensitivity is −97 dBm. However, for the purpose of wireless link stability, it is suggested to have a margin between the power detected by the receiver and the receiver sensitivity equal to or greater than 10 dB [54]. On the other hand, our system based on Re-Mote nodes is more compact than other, larger systems with a non-integrated transceiver, and the developed system has a unit price of approximately 130 euros, much lower than other options on the market.
Figure 7B shows the radio wave attenuation curves between the Tx and Rx nodes at 50 and 150 cm from the ground. For example, the average RSSI value at 260 cm distance between the two nodes and 150 cm from the ground is −58.22 dBm (See Figure 7A). Thus, the path attenuation is obtained with the following calculation: EIRP + Path_attenuation + Gain_RX= −58.22 dBm.
Therefore,
Path_attenuation = −58.22 dBm + 29 dBm − 5 dBi
Path_attenuation = −34.22 dB

6. Conclusions and Future Work

The results obtained serve to improve the wireless coverage planning of radio waves operating in the 2.4 GHz frequency band inside a greenhouse in order to determine the best location and height of the Tx and Rx nodes with respect to the ground in a one-hop communication between them, as well as to minimize their number in the deployment.
The collected measurements establish that the maximum one-hop distance between Tx and Rx within a tomato greenhouse is recorded when the antenna is located 50 cm above the ground, while the lowest coverage occurs when the antenna nodes are 150 cm above the ground. Furthermore, during the field-testing stage, our system proved to be efficient, and it is planned that in the future it will be used to determine attenuation curves from the measurement and recording of RSSI in other greenhouses of different crops in the 868/915 and 2400 MHz bands. A dataset of the radio wave attenuation can be registered in tomato greenhouse and can be found at the following link [52]. Likewise, for ease of deployment and use by actors in agricultural production, the authors are planning to design an integrated hardware and software solution based on our system.

Author Contributions

Conceptualization, M.D.-H., J.A.H.-T., F.G.-M., D.C.-P. and A.C.-P. data curation, D.C.-P. and J.A.H.-T. formal analysis, D.C.-P., M.D.-H., J.A.H.-T., F.G.-M. and A.C.-P. funding acquisition, D.C.-P. and A.C.-P. investigation, D.C.-P., M.D.-H., J.A.H.-T., F.G.-M. and A.C.-P. methodology, D.C.-P., M.D.-H., J.A.H.-T. and A.C.-P. project administration, D.C.-P., M.D.-H. and A.C.-P. resources, D.C.-P. software, D.C.-P. and A.C.-P. supervision, M.D.-H. and F.G.-M. validation, M.D.-H. and A.C.-P. writing—original draft, D.C.-P. and A.C.-P. writing—review and editing, D.C.-P. and A.C.-P. All authors have read and agreed to the published version of the manuscript.

Funding

This research received fund by the Ibero-American Postgraduate University Association (AUIP).

Data Availability Statement

http://data.mendeley.com/datasets/nhk3gs7gmm/1 (accessed on 8 September 2021).

Conflicts of Interest

The authors declare no conflict of interest.

References

  1. Rangwani, D.; Sadhukhan, D.; Ray, S.; Khan, M.K.; Dasgupta, M. An improved privacy preserving remote user authentication scheme for agricultural wireless sensor network. Trans. Emerg. Telecommun. Technol. 2021, 32, e4218. [Google Scholar] [CrossRef]
  2. Cama-Pinto, D.; Damas, M.; Holgado-Terriza, J.; Gómez-Mula, F.; Calderin-Curtidor, A.; Martínez-Lao, J.; Cama-Pinto, A. 5G Mobile Phone Network Introduction in Colombia. Electronics 2021, 10, 922. [Google Scholar] [CrossRef]
  3. Mentsiev, A.U.; Gatina, F.F. Data analysis and digitalisation in the agricultural industry. IOP Conf. Series Earth Environ. Sci. 2021, 677, 32101. [Google Scholar] [CrossRef]
  4. Azman, A.S.; Lee, M.Y.; Subramaniam, S.K.; Feroz, F.S. Novel Wireless Sensor Network Routing Protocol Performance Evaluation using Diverse Packet Size for Agriculture Application. Int. J. Integr. Eng. 2021, 13, 16–28. [Google Scholar] [CrossRef]
  5. Vanishree, K.; Nagaraja, G.S. Emerging Line of Research Approach in Precision Agriculture: An Insight Study. Int. J. Adv. Comput. Sci. Appl. 2021, 12. [Google Scholar] [CrossRef]
  6. Peng, Y.; Xiao, Y.; Fu, Z.; Dong, Y.; Zheng, Y.; Yan, H.; Li, X. Precision irrigation perspectives on the sustainable water-saving of field crop production in China: Water demand prediction and irrigation scheme optimization. J. Clean. Prod. 2019, 230, 365–377. [Google Scholar] [CrossRef]
  7. Caicedo-Ortiz, J.G.; De-La-Hoz-Franco, E.; Ortega, R.M.; Piñeres-Espitia, G.; Combita-Niño, H.; Estévez, F.; Cama-Pinto, A. Monitoring system for agronomic variables based in WSN technology on cassava crops. Comput. Electron. Agric. 2018, 145, 275–281. [Google Scholar] [CrossRef]
  8. Caicedo Ortiz, J.G.; Acosta Coll, M.A.; Cama-Pinto, A. WSN deployment model for measuring climate variables that cause strong precipitation. Prospectiva 2015, 13, 106–115. [Google Scholar] [CrossRef] [Green Version]
  9. Miao, Y.; Zhao, C.; Wu, H. Non-uniform clustering routing protocol of wheat farmland based on effective energy consumption. Int. J. Agric. Biol. Eng. 2021, 14, 142–150. [Google Scholar] [CrossRef]
  10. Razafimandimby, C.; Loscri, V.; Vegni, A.M.; Neri, A. Efficient Bayesian Communication Approach for Smart Agriculture Applications. In Proceedings of the 2017 IEEE 86th Vehicular Technology Conference (VTC-Fall), Toronto, ON, Canada, 24–27 September 2017; Institute of Electrical and Electronics Engineers (IEEE): New York, NY, USA, 2017; pp. 1–5. [Google Scholar]
  11. Salim, C.; Mitton, N. K-predictions based data reduction approach in WSN for smart agriculture. Computing 2020, 103, 509–532. [Google Scholar] [CrossRef]
  12. Wu, H.; Miao, Y.; Li, F.; Zhu, L. Empirical Modeling and Evaluation of Multi-Path Radio Channels on Wheat Farmland Based on Communication Quality. Trans. ASABE 2016, 59, 759–767. [Google Scholar] [CrossRef]
  13. Cama-Pinto, A.; Gil Montoya, F.; Gómez-López, J.; García-Cruz, A.; Manzano-Agugliaro, F. Wireless surveillance sytem for greenhouse crops. DYNA 2014, 81, 164. [Google Scholar] [CrossRef]
  14. Montoya, F.G.; Gomez, J.; Manzano-Agugliaro, F.; Cama, A.; García-Cruz, A.; De La Cruz, J.L. 6LoWSoft: A software suite for the design of outdoor environmental measurements. J. Food Agric. Environ. 2013, 11, 2584–2586. [Google Scholar]
  15. Hsiao, S.-J.; Sung, W.-T. A Study on Using a Wireless Sensor Network to Design a Plant Monitoring System. Intell. Autom. Soft Comput. 2021, 27, 359–377. [Google Scholar] [CrossRef]
  16. Xuanrong, P.; Tingdong, Y.; Yuesheng, W. Research and design of precision irrigation system based on artificial neural network. In Proceedings of the 2018 Chinese Control and Decision Conference (CCDC), Shenyang, China, 9–11 June 2018; Institute of Electrical and Electronics Engineers (IEEE): New York, NY, USA, 2018; pp. 3865–3870. [Google Scholar]
  17. Zapata-Sierra, A.J.; Cama-Pinto, A.; Montoya, F.G.; Alcayde, A.; Manzano-Agugliaro, F. Wind missing data arrangement using wavelet based techniques for getting maximum likelihood. Energy Convers. Manag. 2019, 185, 552–561. [Google Scholar] [CrossRef]
  18. Zhang, H.; Li, H. Node Localization Technology of Wireless Sensor Network Based on RSSI Algorithm. Int. J. Online Eng. 2016, 12, 51–57. [Google Scholar] [CrossRef] [Green Version]
  19. Azmi, N.; Kamarudin, L.; Zakaria, A.; Ndzi, D.; Rahiman, M.; Zakaria, S.; Mohamed, L. RF-Based Moisture Content Determination in Rice Using Machine Learning Techniques. Sensors 2021, 21, 1875. [Google Scholar] [CrossRef]
  20. Piñeres-Espitia, G.; Cama-Pinto, A.; De La Rosa Morrón, D.; Estevez, F.; Cama-Pinto, D. Design of a low cost weather station for detecting environmental changes. Espacios 2017, 38, 13. [Google Scholar]
  21. Foerster, A.; Udugama, A.; Görg, C.; Kuladinithi, K.; Timm-Giel, A.; Cama-Pinto, A. A Novel Data Dissemination Model for Organic Data Flows. In Proceedings of the International Conference on Mobile Network and Management, Santander, Spain, 16–18 September 2015; Springer: Berlin/Heidelberg, Germany, 2015; pp. 239–252. [Google Scholar]
  22. Cama-Pinto, A.; Gil Montoya, F.; Gómez, J.; De La Cruz, J.L.; Manzano-Agugliaro, F. Integration of communication technologies in sensor networks to monitor the Amazon environment. J. Clean. Prod. 2013, 59, 32–42. [Google Scholar] [CrossRef]
  23. Farooqui, N.A.; Tyagi, A. Data Mining and Fusion Techniques for Wireless Intelligent Sensor Networks. In Handbook of Wireless Sensor Networks: Issues and Challenges in Current Scenario’s; Springer: Berlin/Heidelberg, Germany, 2020; pp. 592–615. [Google Scholar]
  24. Montoya, F.G.; Gómez, J.; Cama, A.; Zapata-Sierra, A.; Martínez, F.; De La Cruz, J.L.; Manzano-Agugliaro, F. A monitoring system for intensive agriculture based on mesh networks and the android system. Comput. Electron. Agric. 2013, 99, 14–20. [Google Scholar] [CrossRef]
  25. Maiolo, L.; Polese, D. Advances in sensing technologies for smart monitoring in precise agriculture. In Proceedings of the SENSORNETS 2021—Proceedings of the 10th International Conference on Sensor Networks, Vienna, Austria, 9–10 February 2021; pp. 151–158. [Google Scholar]
  26. Sathish, C.; Srinivasan, K. An artificial bee colony algorithm for efficient optimized data aggregation to agricultural IoT devices application. J. Appl. Sci. Eng. 2021, 24, 927–936. [Google Scholar] [CrossRef]
  27. Saiz-Rubio, V.; Rovira-Más, F. From Smart Farming towards Agriculture 5.0: A Review on Crop Data Management. Agronomy 2020, 10, 207. [Google Scholar] [CrossRef] [Green Version]
  28. Subashini, M.M.; Das, S.; Heble, S.; Raj, U.; Karthik, R. Internet of Things based wireless plant sensor for smart farming. Indones. J. Electr. Eng. Comput. Sci. 2018, 10, 456–468. [Google Scholar] [CrossRef]
  29. Abouzar, P.; Michelson, D.G.; Hamdi, M. RSSI-Based Distributed Self-Localization for Wireless Sensor Networks Used in Precision Agriculture. IEEE Trans. Wirel. Commun. 2016, 15, 6638–6650. [Google Scholar] [CrossRef] [Green Version]
  30. Xu, L. Design of a RSSI Location System for Greenhouse Environment. Int. J. Distrib. Sens. Netw. 2015, 11, 525861. [Google Scholar] [CrossRef] [Green Version]
  31. Cama-Pinto, D.; Damas, M.; Holgado-Terriza, J.A.; Gomez-Mula, F.; Cama-Pinto, A. Desarrollo de un sistema para medición y registro de RSSI en invernaderos. Av. En Arquit. Y Tecnol. De Comput. Actas De Las Jorn. SARTECO 2019, 649–654. [Google Scholar] [CrossRef]
  32. Li, T.; Zhang, M.; Ji, Y.H.; Sha, S.; Jiang, Y.Q.; Li, M.Z. Management of CO2 in a tomato greenhouse using WSN and BPNN techniques. Int. J. Agric. Biol. Eng. 2015, 8, 43–51. [Google Scholar] [CrossRef]
  33. García, L.; Parra, L.; Jimenez, J.; Parra, M.; Lloret, J.; Mauri, P.; Lorenz, P. Deployment Strategies of Soil Monitoring WSN for Precision Agriculture Irrigation Scheduling in Rural Areas. Sensors 2021, 21, 1693. [Google Scholar] [CrossRef]
  34. Aung, S.M.Y.; Pattanaik, K.K. Path Loss Measurement for Wireless Communication in Industrial Environments. In Proceedings of the 2020 International Conference on Computer Science, Engineering and Applications (ICCSEA), Gunupur, India, 13–14 March 2020; Institute of Electrical and Electronics Engineers (IEEE): New York, NY, USA, 2020; pp. 1–5. [Google Scholar]
  35. Navarro, A.; Guevara, D.; Florez, G.A. An Adjusted Propagation Model for Wireless Sensor Networks in Corn Fields. In Proceedings of the 2020 XXXIIIrd General Assembly and Scientific Symposium of the International Union of Radio Science, Rome, Italy, 29 August–5 September 2020; Institute of Electrical and Electronics Engineers (IEEE): New York, NY, USA, 2020. [Google Scholar]
  36. Pal, P.; Sharma, R.P.; Tripathi, S.; Kumar, C.; Ramesh, D. 2.4 GHz RF Received Signal Strength Based Node Separation in WSN Monitoring Infrastructure for Millet and Rice Vegetation. IEEE Sens. J. 2021, 21, 18298–18306. [Google Scholar] [CrossRef]
  37. Wang, J.; Peng, Y.; Li, P. Propagation Characteristics of Radio Wave in Plastic Greenhouse. In Proceedings of the International Conference on Computer and Computing Technologies in Agriculture, Beijing, China, 27–30 September 2015; Springer: Berlin/Heidelberg, Germany, 2016; pp. 208–215. [Google Scholar]
  38. Widodo, S.; Pratama, E.A.; Pramono, S.; Basuki, S.B. Outdoor propagation modeling for wireless sensor networks 2.4 GHz. In Proceedings of the 2017 IEEE International Conference on Communication, Networks and Satellite (Comnetsat), Semarang, Indonesia, 5–7 October 2017; Institute of Electrical and Electronics Engineers (IEEE): New York, NY, USA, 2017; pp. 158–162. [Google Scholar]
  39. Cama-Pinto, A.; Espitia, G.D.P.; Caicedo, J.G.; Ramirez-Cerpa, E.; Betancur-Agudelo, L.; Gómez-Mula, F. Received strength signal intensity performance analysis in wireless sensor network using Arduino platform and XBee wireless modules. Int. J. Distrib. Sens. Netw. 2017, 13. [Google Scholar] [CrossRef] [Green Version]
  40. Shue, S.; Johnson, L.E.; Conrad, J.M. Utilization of XBee ZigBee modules and MATLAB for RSSI localization applications. In Proceedings of the SoutheastCon 2017, Concord, NC, USA, 30 March–2 April 2017; Institute of Electrical and Electronics Engineers (IEEE): New York, NY, USA, 2017. [Google Scholar]
  41. Cama-Pinto, D.; Damas, M.; Holgado-Terriza, J.A.; Gómez-Mula, F.; Cama-Pinto, A. Path Loss Determination Using Linear and Cubic Regression Inside a Classic Tomato Greenhouse. Int. J. Environ. Res. Public Health 2019, 16, 1744. [Google Scholar] [CrossRef] [PubMed] [Green Version]
  42. Van Herbruggen, B.; Jooris, B.; Rossey, J.; Ridolfi, M.; Macoir, N.; Van Den Brande, Q.; Lemey, S.; De Poorter, E. Wi-pos: A low-cost, open source ultra-wideband (UWB) hardware platform with long range sub-GHZ backbone. Sensors 2019, 19, 1548. [Google Scholar] [CrossRef] [Green Version]
  43. Bezunartea, M.; Wang, C.; Braeken, A.; Steenhaut, K. Multi-radio Solution for Improving Reliability in RPL. In Proceedings of the 2018 IEEE 29th Annual International Symposium on Personal, Indoor and Mobile Radio Communications (PIMRC), Bologna, Italy, 9–12 September 2018; Institute of Electrical and Electronics Engineers (IEEE): New York, NY, USA, 2018; pp. 129–134. [Google Scholar]
  44. Texas Instruments—Descripción CC2538. Available online: http://www.ti.com/product/CC2538/description (accessed on 21 July 2021).
  45. Gomez, J.; Villar, E.; Molero, G.; Cama, A. Evaluation of high performance clusters in private cloud computing environments. In Distributed Computing and Artificial Intelligence; Springer: Berlin/Heidelberg, Germany, 2012; pp. 305–312. [Google Scholar]
  46. ERCIM News. Contiki: Bringing IP to Sensor Networks. Available online: https://ercim-news.ercim.eu/en76/rd/contiki-bringing-ip-to-sensor-networks (accessed on 21 July 2021).
  47. Cama-Pinto, D.; Damas, M.; Holgado-Terriza, J.A.; Arrabal-Campos, F.M.; Gómez-Mula, F.; Martínez-Lao, J.A.M.; Cama-Pinto, A. Empirical Model of Radio Wave Propagation in the Presence of Vegetation inside Greenhouses Using Regularized Regressions. Sensors 2020, 20, 6621. [Google Scholar] [CrossRef] [PubMed]
  48. Staudemeyer, R.C.; Pöhls, H.C.; Wójcik, M. What it takes to boost Internet of Things privacy beyond encryption with unobservable communication: A survey and lessons learned from the first implementation of DC-net. J. Reliab. Intell. Environ. 2019, 5, 41–64. [Google Scholar] [CrossRef]
  49. Dunkels, A.; Gronvall, B.; Voigt, T. Contiki—A lightweight and flexible operating system for tiny networked sensors. In Proceedings of the 29th Annual IEEE International Conference on Local Computer Networks, Tampa, FL, USA, 16–18 November 2004; Institute of Electrical and Electronics Engineers (IEEE): New York, NY, USA, 2004. [Google Scholar]
  50. Dunkels, A.; Österlind, F.; He, Z. An adaptive communication architecture for wireless sensor networks. In Proceedings of the SenSys’07—Proceedings of the 5th ACM Conference on Embedded Networked Sensor Systems, Sydney, Australia, 6–9 November 2007; Machinery: New York, NY, USA, 2007; pp. 335–349. [Google Scholar]
  51. Vougioukas, S.; Anastassiu, H.; Regen, C.; Zude, M. Influence of foliage on radio path losses (PLs) for wireless sensor network (WSN) planning in orchards. Biosyst. Eng. 2013, 114, 454–465. [Google Scholar] [CrossRef]
  52. Raheemah, A.; Sabri, N.; Salim, M.S.; Ehkan, P.; Ahmad, R.B. New empirical path loss model for wireless sensor networks in mango greenhouses. Comput. Electron. Agric. 2016, 127, 553–560. [Google Scholar] [CrossRef]
  53. Cama-Pinto, D.; Holgado-Terriza, J.A.; Damas, M.; Gómez-Mula, F.; Cama-Pinto, A. Tomato Greenhouse Measurement of RSSI in Almeria Spain. Available online: https://data.mendeley.com/datasets/nhk3gs7gmm/1 (accessed on 8 September 2021).
  54. Zennaro, M.; Bagula, A.; Gascon, D.; Noveleta, A.B. Long distance wireless sensor networks: Simulation vs. reality. In Proceedings of the 4th ACM Workshop on Networked Systems for Developing Regions, NSDR’10, San Francisco, CA, USA, 15 June 2010. [Google Scholar]
Figure 1. Schematic of the four subsystems of each node.
Inventions 06 00066 g001
Figure 2. Wireless communication scheme of Tx and Rx stations in a tomato greenhouse. Tx station (left) powered by Lithium-ion 3.7 V-6600 mAh battery. Rx station (right) connected to a Raspberry Pi embedded computer.
Inventions 06 00066 g002
Figure 3. (A) Tomato crop side profile. (B) Location of transmitter node inside the greenhouse. (C) View of greenhouse passageway.
Inventions 06 00066 g003
Figure 4. Steps to carry out a radio attenuation study based on RSSI inside a greenhouse.
Inventions 06 00066 g004
Figure 5. (A) The figure on the left shows a planting frame inside the greenhouse where the transmitting node (light blue) changes the distance with respect to the receiving node (red). (B) On the right the figure shows that the height of both nodes was maintained constant while the distance between them changed.
Inventions 06 00066 g005
Figure 6. Location of the greenhouse in the Cañada de San Urbano in the province of Almeria. (A) On the map of Spain. (B) Satellite Image.
Inventions 06 00066 g006
Figure 7. (A) Signal power levels in dBm between the transmitter (Tx) and receiver (Rx) nodes at different heights and distances between them. (B) Path loss or attenuation measured in dB of the radio wave between the Tx and Rx node inside the tomato greenhouse at 50 cm and 150 cm above the ground [41].
Inventions 06 00066 g007
Table 1. Steps to carry out a radio attenuation study based on RSSI inside a greenhouse.
CycleTemperatureHumidityRSSIDateHour
11463−9325 March 201811:37:48
21463−9325 March 201811:37:58
31463−9325 March 201811:38:08
41463−9325 March 201811:38:18
51463−9325 March 201811:38:28
61463−9425 March 201811:38:38
71463−9425 March 201811:38:48
81463−9425 March 201811:38:58
91463−9425 March 201811:39:08
101463−9325 March 201811:39:18
111463−9325 March 201811:39:28
121463−9325 March 201811:39:38
131463−9325 March 201811:39:48
141463−9225 March 201811:39:58
151463−9125 March 201811:40:08
161463−9125 March 201811:40:18
171463−9125 March 201811:40:28
181463−9125 March 201811:40:38
191463−9125 March 201811:40:48
201463−9125 March 201811:40:58
211463−9125 March 201811:41:08
221463−9125 March 201811:41:18
231463−9125 March 201811:41:28
241463−9125 March 201811:41:38
251463−9125 March 201811:41:48
Publisher’s Note: MDPI stays neutral with regard to jurisdictional claims in published maps and institutional affiliations.

