Flywheel vs. Supercapacitor as Wayside Energy Storage for Electric Rail Transit Systems


Abstract
:
1. Introduction
2. Energy Storage Technologies
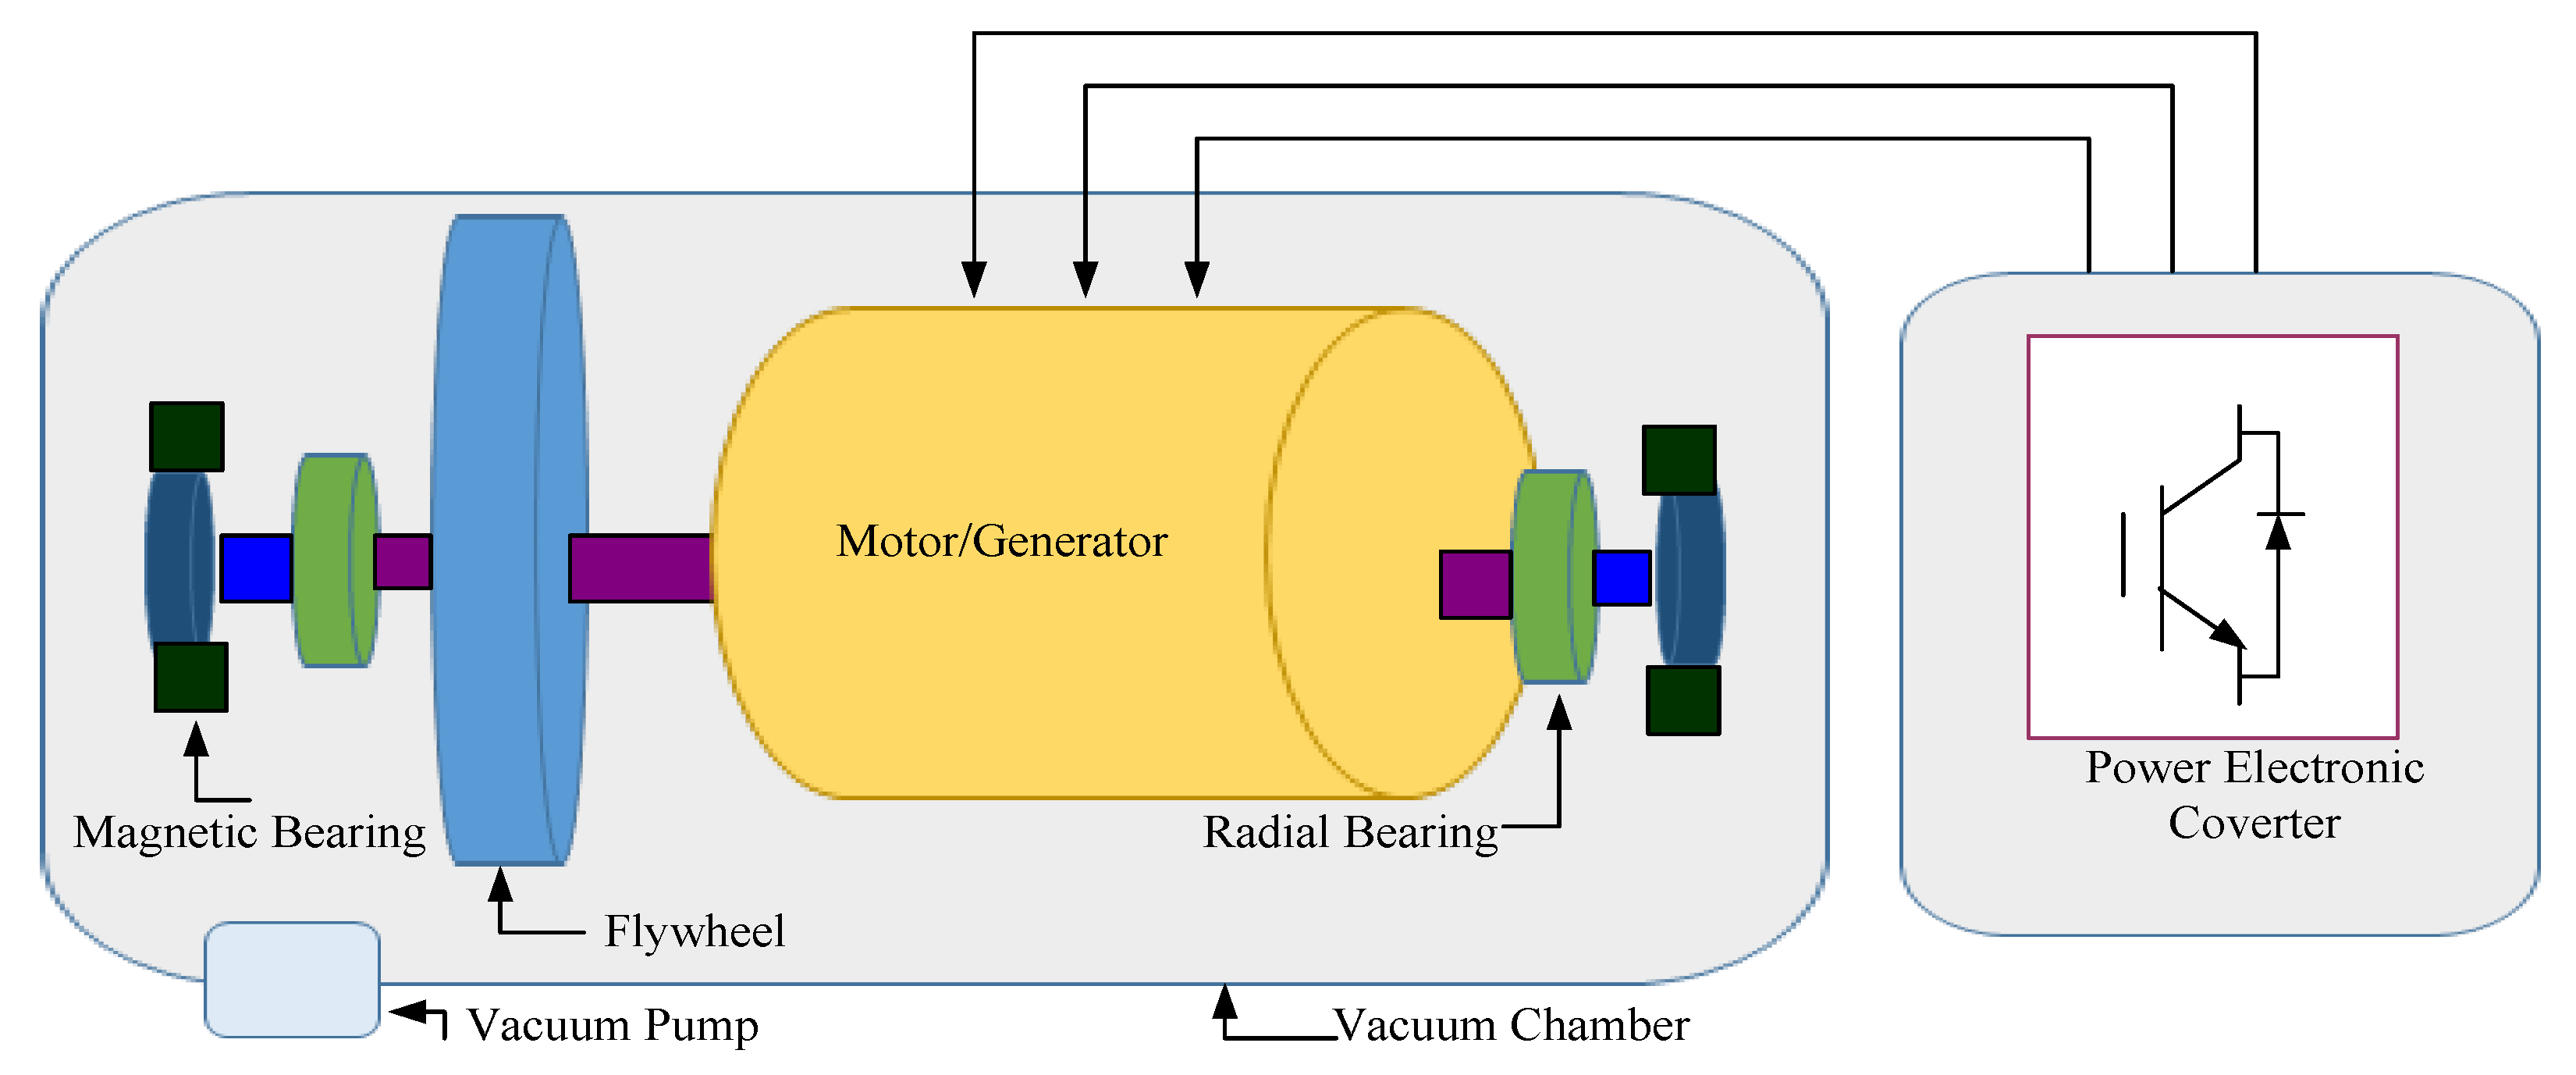
2.1. Flywheel
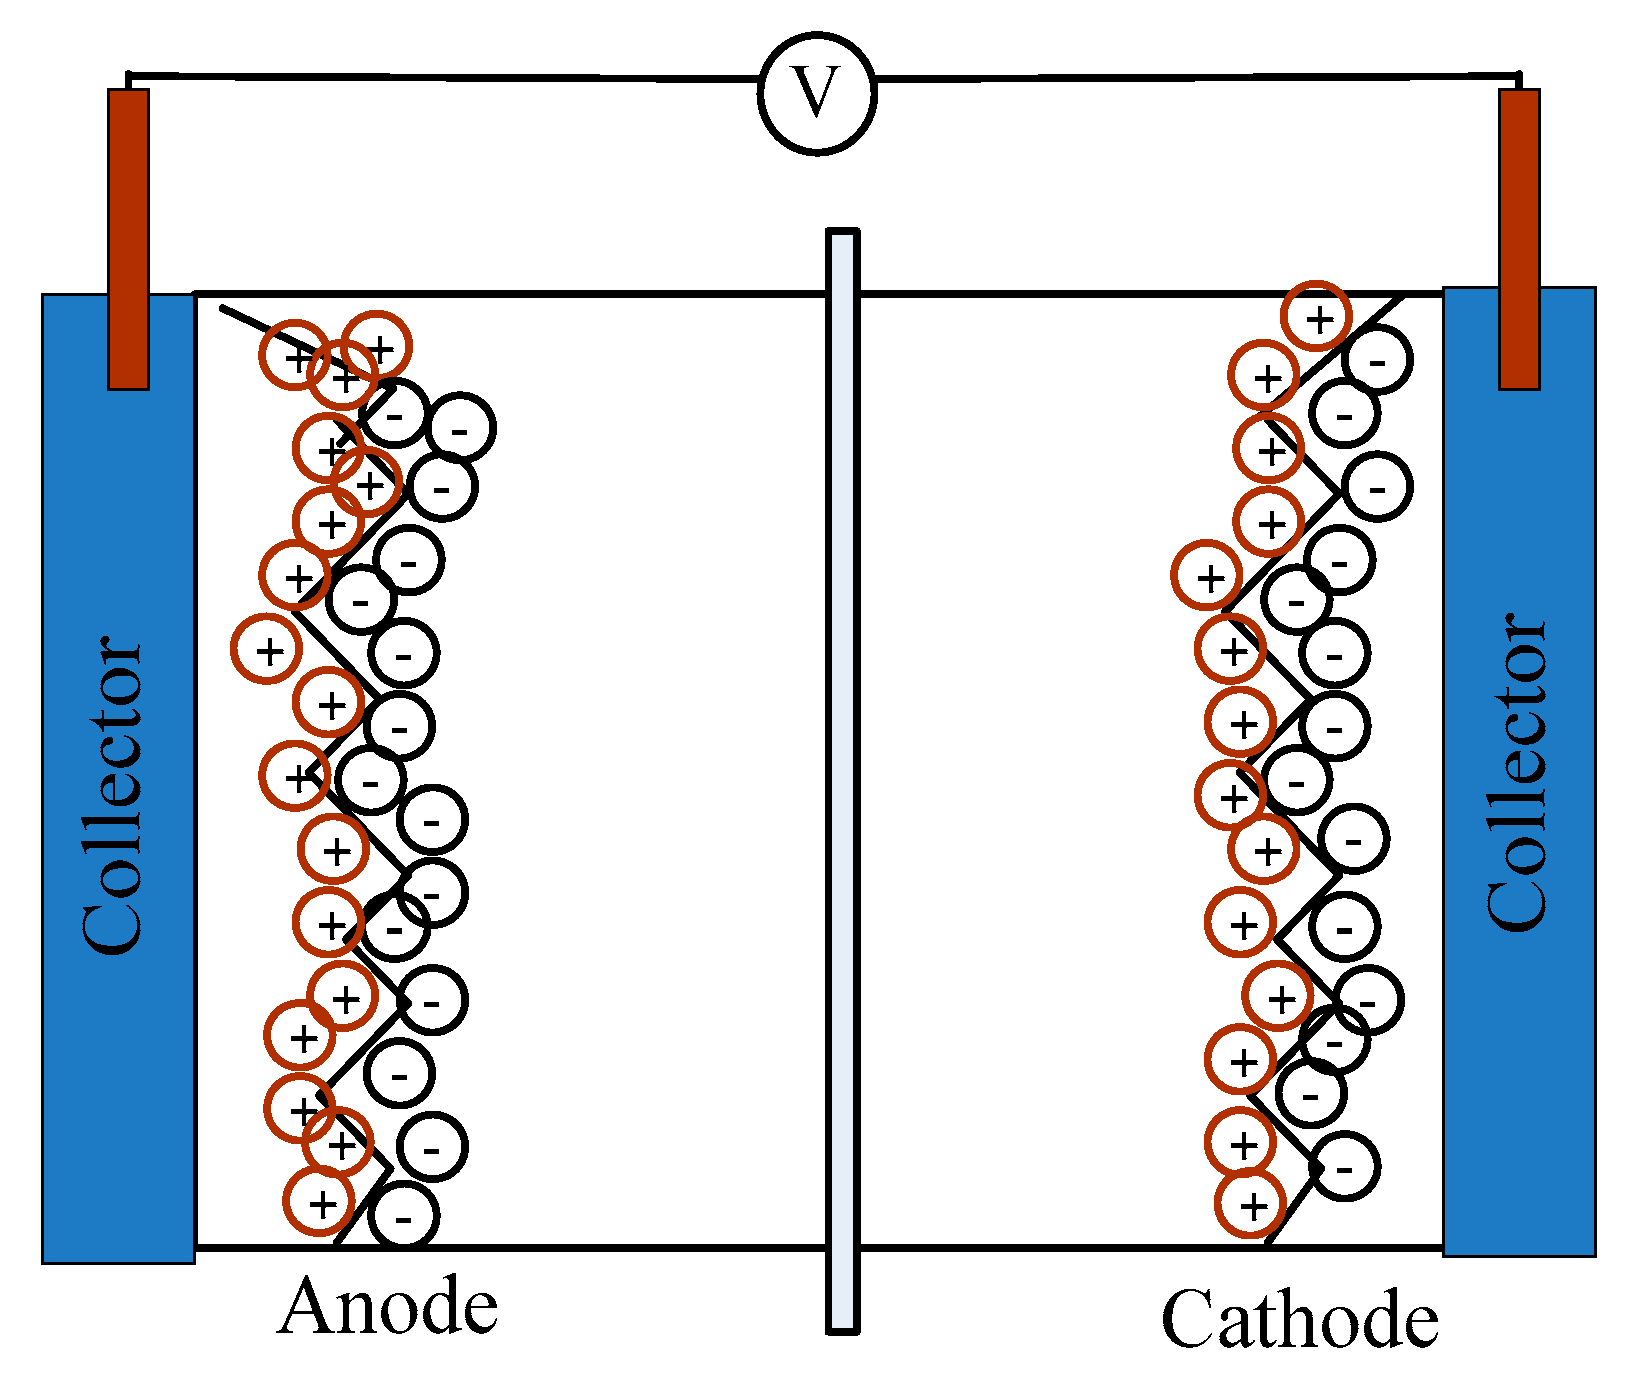
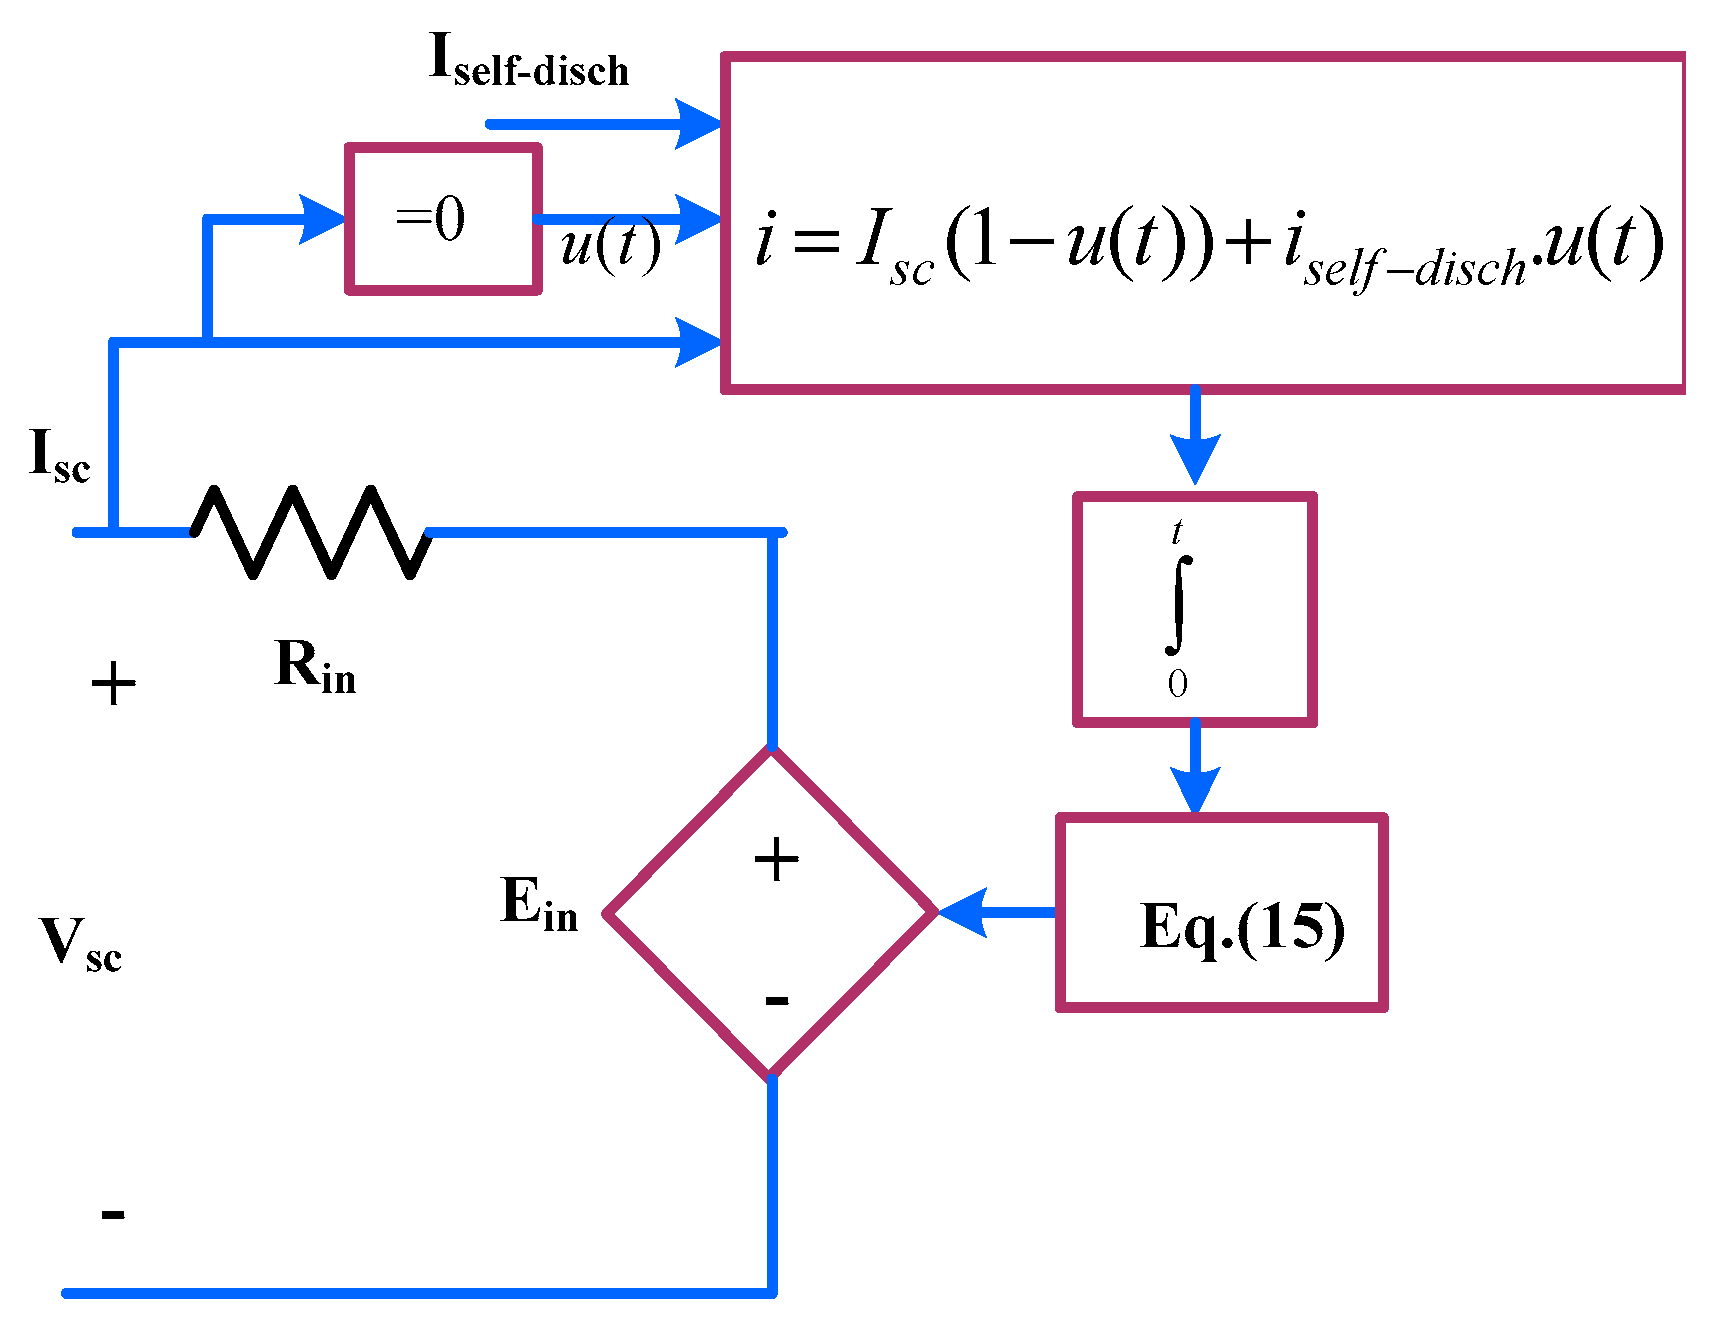
2.2. Supercapacitor
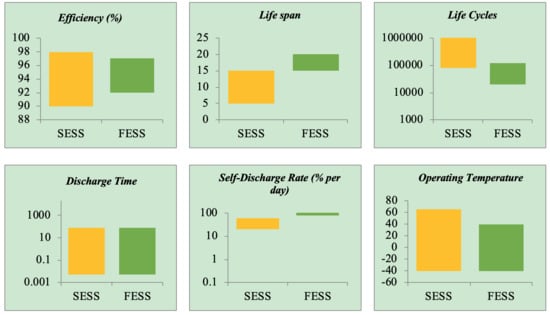
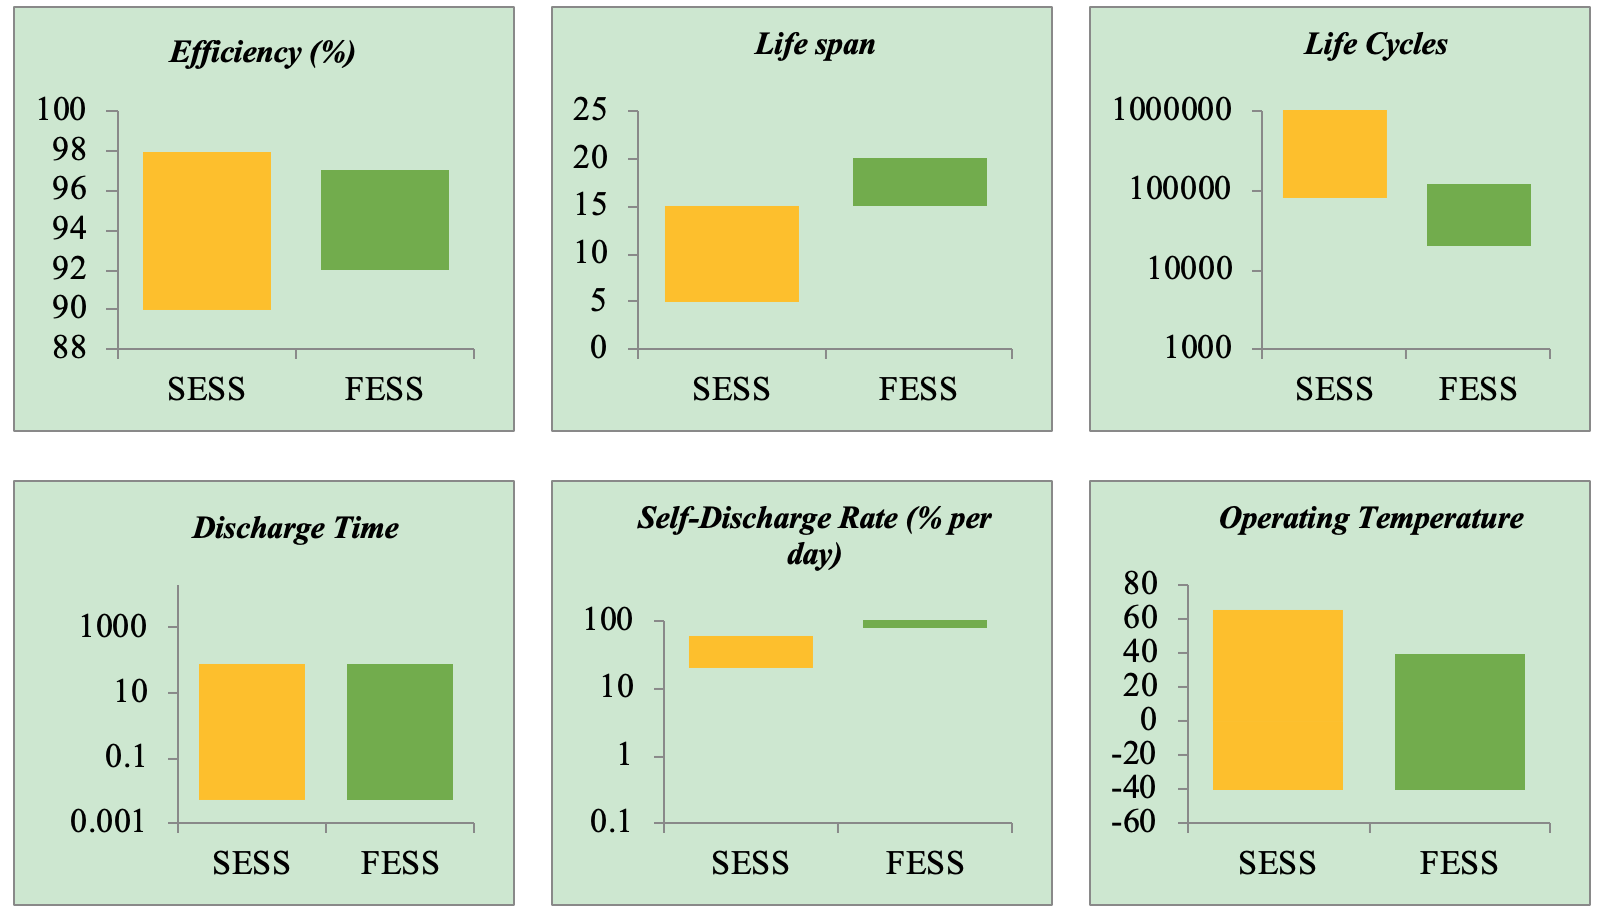
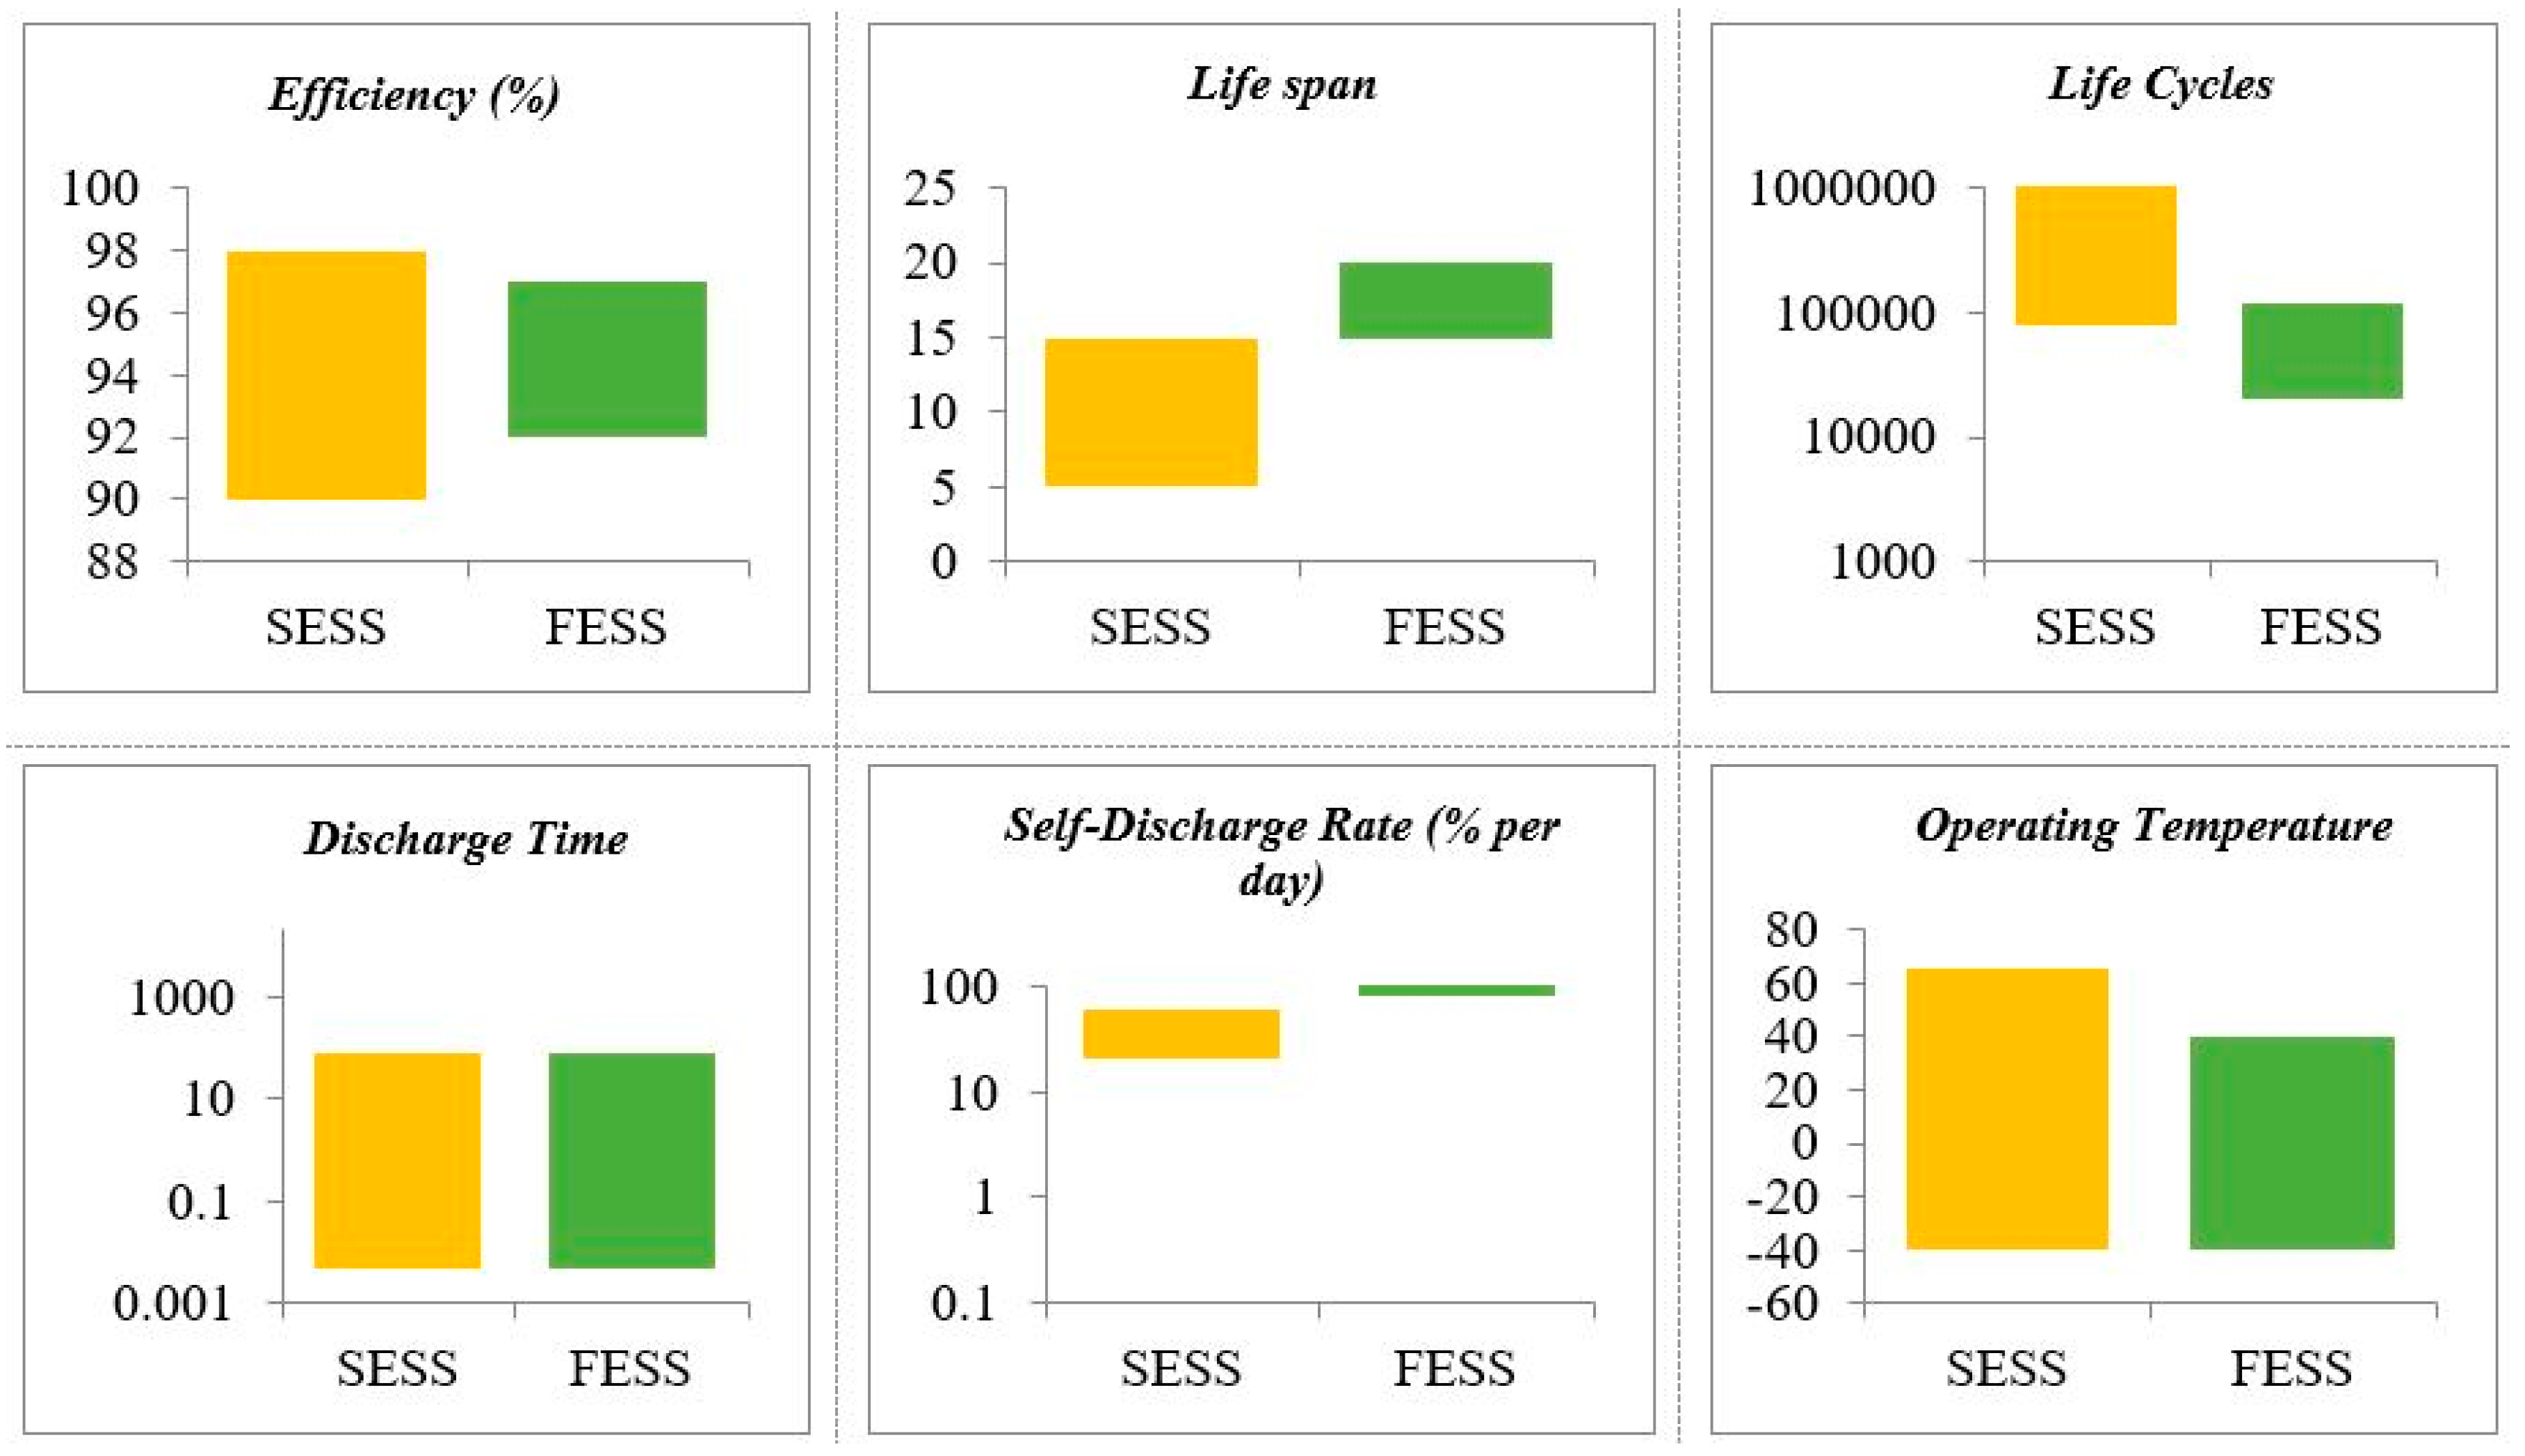
2.3. Characteristic Comparisons
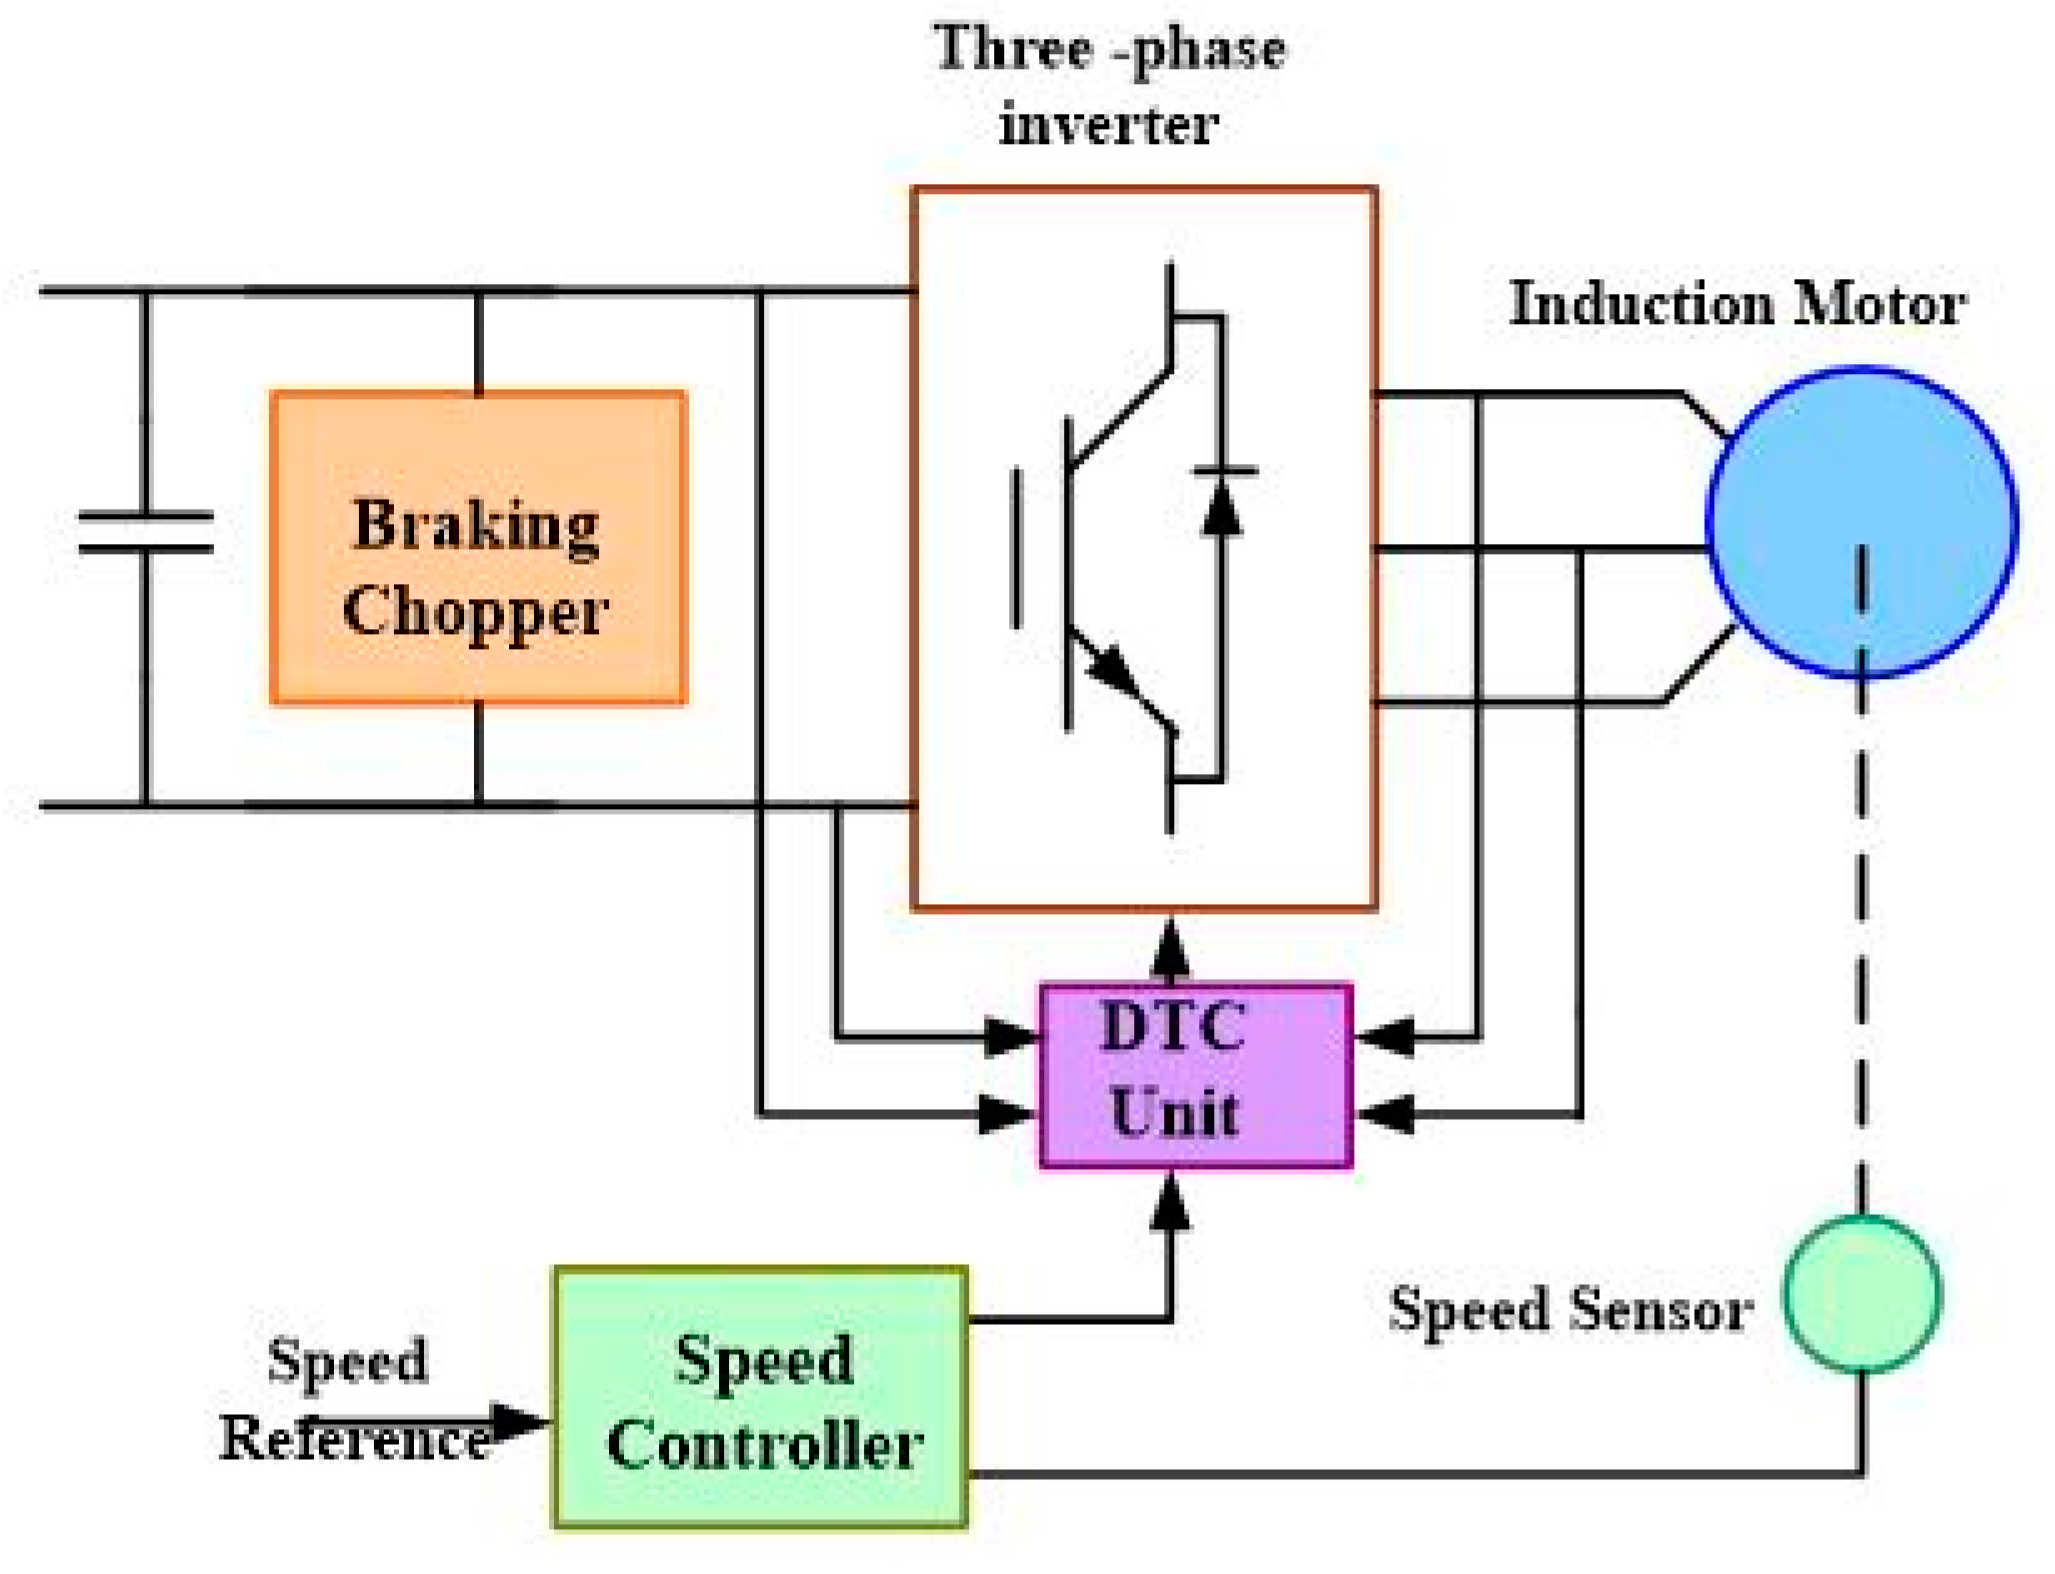
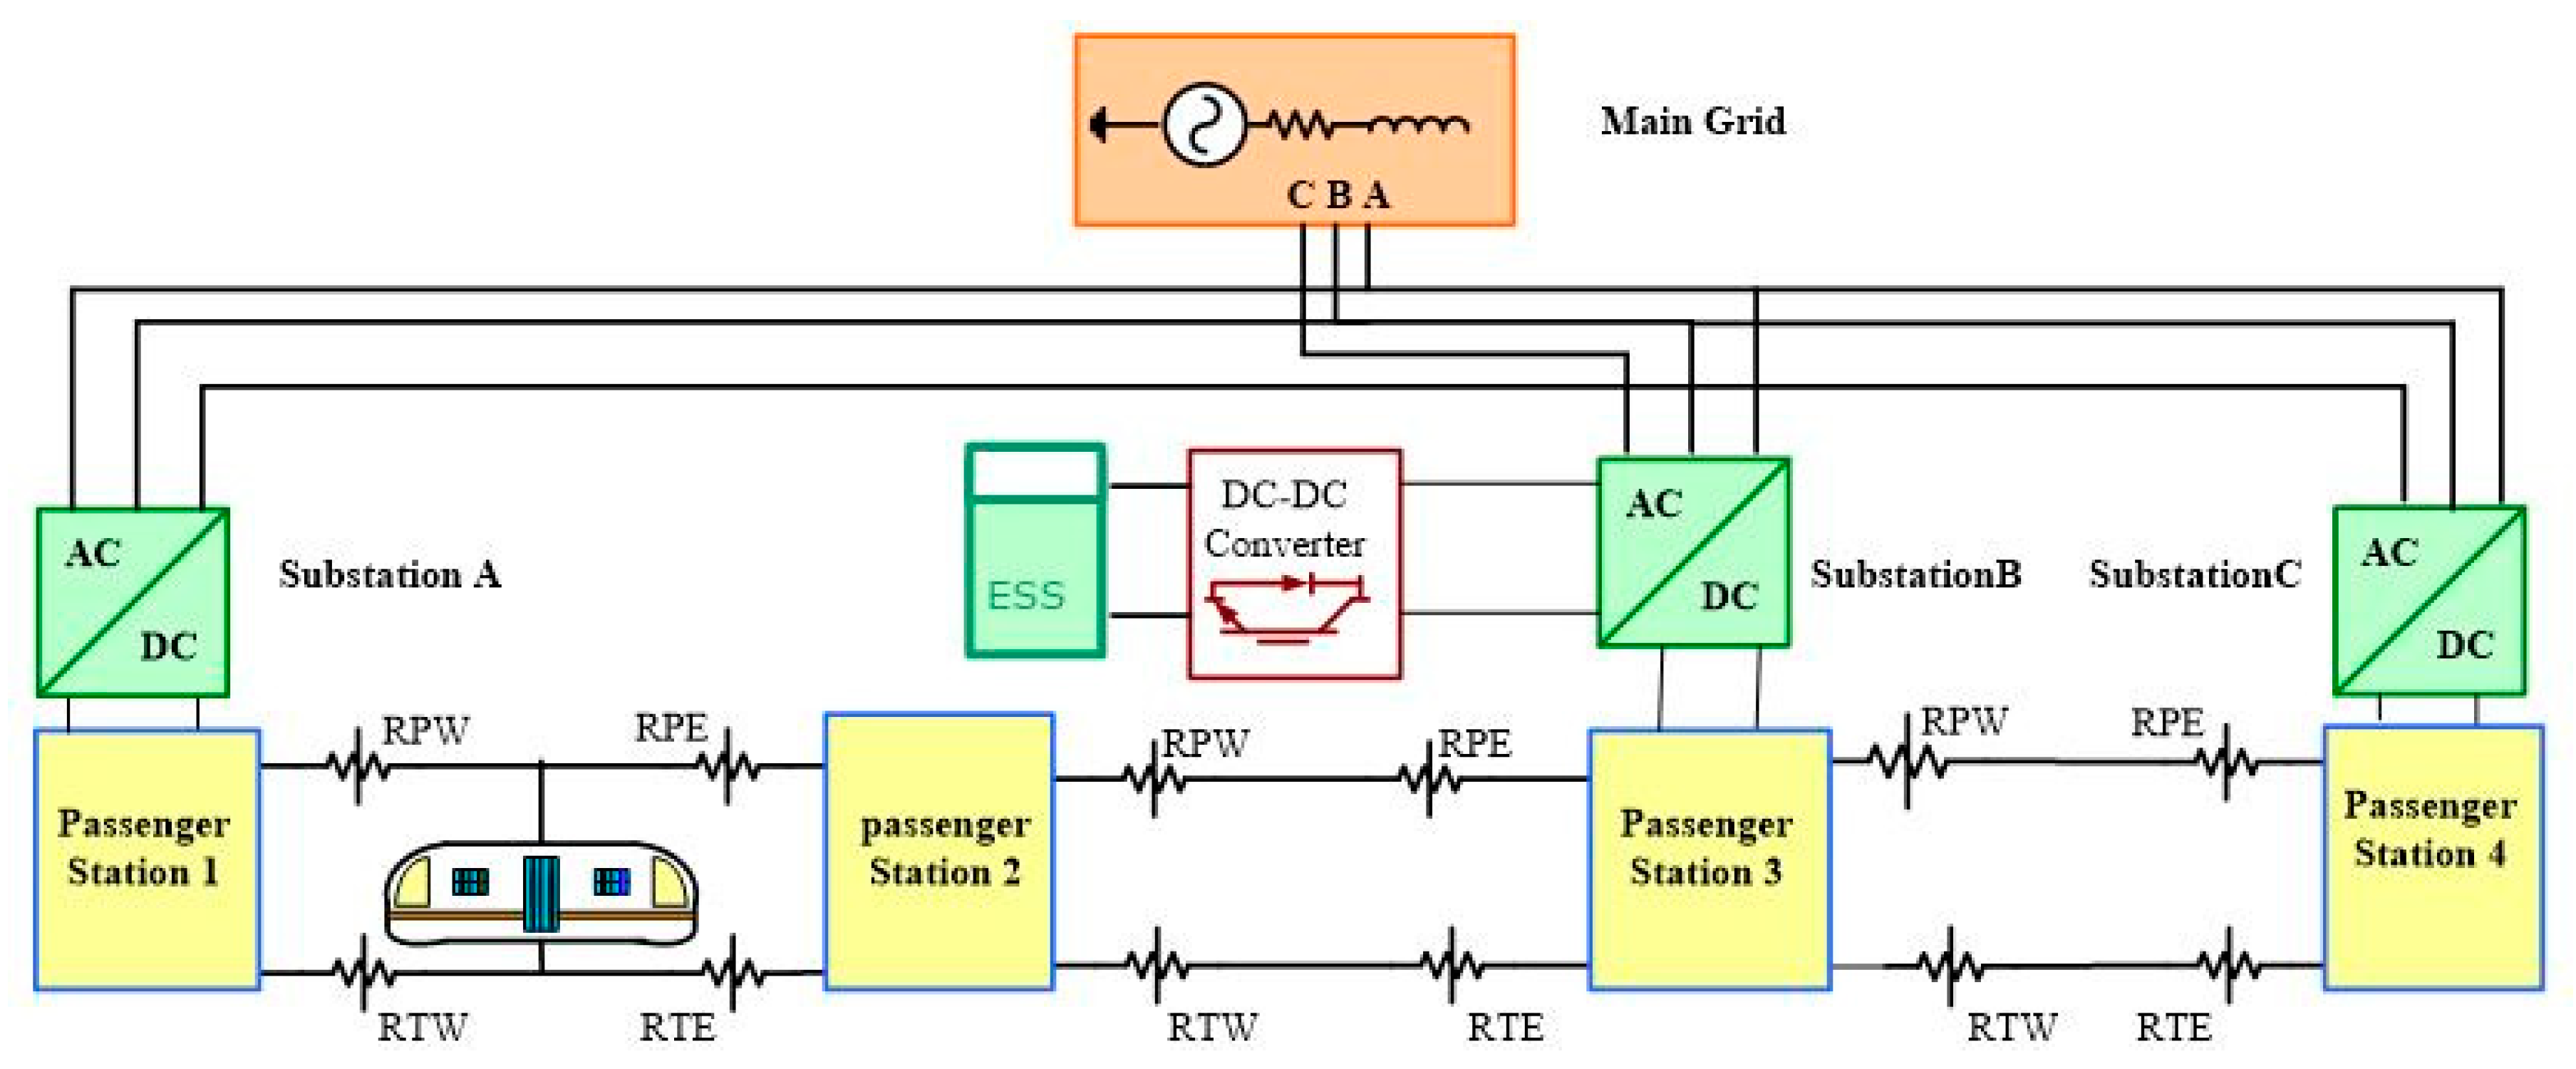
3. System under Study
4. Case Study
4.1. Peak Demand Reduction
4.2. Voltage Regulation
4.3. Cost Analysis
5. Conclusions
Author Contributions
Funding
Conflicts of Interest
References
- González-gil, A.; Palacin, R.; Batty, P.; Powell, J.P. Energy-efficient urban rail systems: Strategies for an optimal management of regenerative braking energy. Transp. Res. Arena 2014, 44, 374–388. [Google Scholar]
- Schroeder, M.P.; Yu, J.; Teumim, D. Guiding the Selection and Application of Wayside Energy Storage Technologies for Rail Transit and Electric Utilities; Transportation Cooperative Research Program (TCRP), The National Academic Press: Washington, DC, USA, 2010. [Google Scholar]
- Khodaparastan, M.; Mohamed, A.A.; Brandauer, W. Recuperation of Regenerative Braking Energy in Electric Rail Transit Systems. IEEE Trans. Intell. Transp. 2018, 20, 1–17. [Google Scholar] [CrossRef]
- Amiryar, M.; Pullen, K. A Review of Flywheel Energy Storage System Technologies and Their Applications. Appl. Sci. Artic. 2017, 7, 286. [Google Scholar] [CrossRef]
- Arani, A.K.; Karami, H.; Gharehpetian, G.B.; Hejazi, M.S.A. Review of flywheel energy storage systems structures and applications in power systems and microgrids. Renew. Sustain. Energy Rev. 2017, 69, 9–18. [Google Scholar] [CrossRef]
- Mousavi, S.M.G.; Faraji, F.; Majazi, A.; Al-haddad, K. A comprehensive review of Flywheel Energy Storage System technology. Renew. Sustain. Energy Rev. 2017, 67, 477–490. [Google Scholar] [CrossRef]
- Beacon Power. Carbon Fiber Flywheels. 2018. Available online: https://beaconpower.com/carbon-fiber-flywheels/ (accessed on 18 September 2019).
- VYCON. Vycon-The Proven Flywheel Energy Storage System for Rail. 2017. Available online: https://vyconenergy.com/2017/03/13/vycon-showcases-flywheel-energy-storage-system-for-metro-rail-power-regeneration-at-asia-pacific-rail-expo/ (accessed on 18 September 2019).
- Östergard, R. Flywheel Energy Storage a Conceptual Study Flywheel Energy Storage—A Conceptual Study; Uppsala Universitet: Uppsala, Sweden, 2011. [Google Scholar]
- EPRI. Handbook of Energy Storage for Transmission & Distribution Applications. 2003. Available online: https://www.sandia.gov/ess-ssl/publications/ESHB%201001834%20reduced%20size.pdf. (accessed on 18 September 2019).
- Liu, H.; Jiang, J. Flywheel energy storage—An upswing technology for energy sustainability. Energy Build. 2007, 39, 599–604. [Google Scholar] [CrossRef]
- Jackson, D. High-speed flywheels cut energy bill. Railw. Gaz. Int. 2001, 1, 7–9. [Google Scholar]
- Maxwell. Maxwell Ultracapacitor Saftey Data Sheet. 2015. Available online: https://www.maxwell.com/images/documents/Safety_Datasheet_3000389_EN_4.pdf. (accessed on 18 September 2019).
- Khodaparastan, M.; Mohamed, A. Modeling and Simulation of Regenerative Braking Energy in DC Electric Rail Systems. In Proceedings of the 2018 IEEE Transportation Electrification Conference and Expo (ITEC), Long Beach, CA, USA, 13–15 June 2018; pp. 1–6. [Google Scholar]
- Khodaparastan, M.; Dutta, O.; Saleh, M.; Mohamed, A. Modeling of DC Electric Rail Transit Systems with Wayside Energy Storage. IEEE Trans. Veh. Technol. 2018, 68, 1–9. [Google Scholar] [CrossRef]
- Khodaparastan, M.; Mohamed, A. A study on supercapacitor wayside connection for energy recuperation in electric rail systems. In Proceedings of the IEEE Power & Energy Society General Meeting, Chicago, IL, USA, 16–20 July 2017; pp. 1–5. [Google Scholar]
- Burke, A. Ultracapacitors: Why, how, and where is the technology. J. Power Sources 2000, 91, 37–50. [Google Scholar] [CrossRef]
- Halper, M.S.; Ellenbogen, J.C. Supercapacitors: A Brief Overview; MITRE Nanosyst. Gr.: McLean, VA, USA, 2006. [Google Scholar]
- Kötz, R.; Carlen, M.J.E.A. Principles and applications of electrochemical capacitors. Electrochim. Acta 2000, 45, 2483–2498. [Google Scholar] [CrossRef]
- Khodaparastan, M.; Mohamed, A. Supercapacitors for electric rail transit systems. In Proceedings of the 2017 6th International Conference on Renewable Energy Research and Applications, ICRERA, San Diego, CA, USA, 5–8 November 2017; pp. 896–901. [Google Scholar]
- Nasri, A.; Moghadam, M.F.; Mokhtari, H. Timetable optimization for maximum usage of regenerative energy of braking in electrical railway systems. In Proceedings of the SPEEDAM 2010, Pisa, Italy, 14–16 June 2010; pp. 1218–1221. [Google Scholar]
- Barrero, R.; Tackoen, X.; van Mierlo, J. Stationary or onboard energy storage systems for energy. Proc. Inst. Mech. Eng. Part F J. Rail Rapid Transit 2010, 224, 207–225. [Google Scholar] [CrossRef]
- Siemens, A.G. Increasing Energy Efficiency Optimized Traction Power Supply in Mass Transit Systems; Siemens 2011. Available online: https://kipdf.com/rail-electrification_5ac3f2361723dd3a8f78ae1c.html (accessed on 18 September 2019).
- Ciccarelli, F.; Di Noia, L.P.; Rizzo, R. Integration of Photovoltaic Plants and Supercapacitors in Tramway Power Systems. Energies 2018, 11, 410. [Google Scholar] [CrossRef]
- Chen, H.; Cong, T.N.; Yang, W.; Tan, C.; Li, Y.; Ding, Y. Progress in electrical energy storage system: A critical review. Prog. Nat. Sci. 2009, 19, 291–312. [Google Scholar] [CrossRef]
- Vazquez, S.; Lukic, S.M.; Galvan, E.; Franquelo, L.G.; Carrasco, J.M. Energy Storage Systems for Transport and Grid Applications. IEEE Trans. Ind. Electron. 2010, 57, 3881–3895. [Google Scholar] [CrossRef] [Green Version]
- Farhadi, M.; Mohammed, O. Energy Storage Technologies for High-Power Applications. IEEE Trans. Ind. Appl. 2016, 52, 1953–1962. [Google Scholar] [CrossRef]
- Erickson, R.W.; Maksimovic, D. Fundamentals of Power Electronics; Springer Science & Business Media: Berlin/Heidelberg, Germany, 2007. [Google Scholar]
- Maxwell. K2 Ultracapacitors—2. 7V Series Features and Benefits—Typical Characteristics; Maxwell, 2014. Available online: https://www.maxwell.com/images/documents/K2_2_85V_DS_3000619EN_3_.pdf (accessed on 18 September 2019).
- Khodaparastan, M.; Dutta, O.; Mohamed, A. Wayside Energy Storage System for Peak Demand Reduction in Electric Rail Systems. In Proceedings of the IEEE industrial application society annual meeting (IAS2018), Portland, OR, USA, 23–27 September 2018; pp. 1–5. [Google Scholar]
- Atlantique, E. London Underground Energy Recovery Trial Proves Successful; Railway Gazett, 2016. Available online: https://www.railwaygazette.com/london-underground-energy-recovery-trial-proves-successful/41430.article (accessed on 18 September 2019).
- Konishi, T.; Morimoto, H.; Aihara, T.; Tsutakawa, M. Fixed energy storage technology applied for DC electrified railway. IEEJ Trans. Electr. Electron. Eng. 2010, 5, 270–277. [Google Scholar] [CrossRef]
- Ibrahim, H.; Ilinca, A.; Perron, J. Energy storage systems—Characteristics and comparisons. Renew. Sustain. Energy Rev. 2008, 12, 1221–1250. [Google Scholar] [CrossRef]
- Kovaltchouk, T.; Multon, B.; Ahmed, H.B.; Aubry, J.; Venet, P. Enhanced Aging Model for Supercapacitors Taking into Account Power Cycling: Application to the Sizing of an Energy Storage System in a Direct Wave Energy Converter. IEEE Trans. Ind. Appl. 2015, 51, 2405–2414. [Google Scholar] [CrossRef]


| Location | Company | Size | Purpose | Results/Comment | Reference |
|---|---|---|---|---|---|
| Los Angeles Metro | VYCON | 2 MW, 8.33 kWh | Energy saving | The total weekly saving reported as 10.5 MWh (11.5%) | [13] |
| Hanover (Germany) | Pillar | 0.2 MW, 1.5 kWh | Energy saving | Tested in 2004 and showed energy saving of 462 kwh/year | [7,14] |
| London Underground | Urenco Power Technology | 3 units of 100 kW | Energy saving | This was a testing trial done in 2000 | [15] |
| Keihin Electric Railway (Japan) | - | 3 MW, 25 kWh | Voltage regulation | 12% energy saving was reported | [16] |
| Far Rockaway (NY) | Urenco Power Technology | 1 MW | Peak demand | Energy saving of 7–25% was reported | [7,14] |
| Location | Voltage | Purpose | Comment | Ref |
|---|---|---|---|---|
| Seibu | 1500 V | Energy Saving | - | [15] |
| Columbia | 1650 V | Energy Saving | Maxwell 125 V modules were used | [15] |
| Tehran | - | Energy Saving | 25% energy saving achieved | [21] |
| Brussels | 850 V | Energy Saving | 37% energy saving achieved | [22] |
| Toronto | 600 V | Energy Saving | Sitra SESS by simense was used | [23] |
| Madrid | 750 V | Voltage Improvement | Sitra SESS by simense was used | [23] |
| Beijing | 750 V | Energy Saving | Sitra SESS by simense was used | [23] |
| Naples | 750 V | Energy Saving | Integration of PV farm and SESS | [24] |
| Cases | kW/kg | MW/m3 | Wh/kg | kWh/m3 |
|---|---|---|---|---|
| Supercapacitor | 0.5–5 | 0.4–10 | 2.5–15 | 150–500 |
| Flywheel | 1–5 | 1–2.5 | 10–50 | 20–80 |
| Supercapacitor Cell | C = 3000 F, Vmax = 3, ESRDC = 0.27 mΩ | Flywheel Module | 125 kW, 750 Vdc |
|---|---|---|---|
| Configuration | 2 string*180 cells in series | Configuration | 3 modules in parallel |
| Max Voltage | 500 | Energy Storage | 1875 kW/sec |
| Stored Energy | 3.04 Wh | Speed | 10,000 to 20,000 rpm |
| Specific Power | 5.9 kW/kg | DC Current | 167 Adc |
| Imax Discharge | 500 A in 20 seconds | Recharge Time | 15 seconds |
| Cost Options | Supercapacitor ($) | Flywheel ($) |
|---|---|---|
| Initial | 433,258.10 | 117,180.00 |
| Energy Conversion System | 330,480.00 | 57,375.00 |
| Balance of Plant | 216,000.00 | 37,500.00 |
| Annual Operation and Maintenance Cost (O & M) | 23,137.16 | 5756.10 |
| Replacement (every 5 years) | 763,738.10 | - |
| Replacement (in 10 years) | 1,527,476.20 | - |
| O & M (in 10 years) | 231,371.60 | 57,560.00 |
| Total cost (in 10 years) | 2,738,585.90 | 384,365.00 |
| Cost Options | Supercapacitor ($) | Flywheel ($) |
|---|---|---|
| Initial | 1,949,658.00 | 937,440.00 |
| Energy Conversion System | 1,487,160.00 | 459,000.00 |
| Balance of Plant | 972,000.00 | 300,000.00 |
| Annual O & M | 133,860.36 | 55,228.80 |
| Replacement (every 5 years) | 3,436,818.00 | - |
| Replacement (in 10 years) | 6,873,636.00 | - |
| Maintenance (in 10 years) | 1,338,603.60 | 552,288.00 |
| Total cost (in 10 years) | 12,621,057.60 | 2,248,728.00 |
© 2019 by the authors. Licensee MDPI, Basel, Switzerland. This article is an open access article distributed under the terms and conditions of the Creative Commons Attribution (CC BY) license (http://creativecommons.org/licenses/by/4.0/).
Share and Cite
Khodaparastan, M.; Mohamed, A. Flywheel vs. Supercapacitor as Wayside Energy Storage for Electric Rail Transit Systems. Inventions 2019, 4, 62. https://doi.org/10.3390/inventions4040062
Khodaparastan M, Mohamed A. Flywheel vs. Supercapacitor as Wayside Energy Storage for Electric Rail Transit Systems. Inventions. 2019; 4(4):62. https://doi.org/10.3390/inventions4040062
Chicago/Turabian StyleKhodaparastan, Mahdiyeh, and Ahmed Mohamed. 2019. "Flywheel vs. Supercapacitor as Wayside Energy Storage for Electric Rail Transit Systems" Inventions 4, no. 4: 62. https://doi.org/10.3390/inventions4040062
APA StyleKhodaparastan, M., & Mohamed, A. (2019). Flywheel vs. Supercapacitor as Wayside Energy Storage for Electric Rail Transit Systems. Inventions, 4(4), 62. https://doi.org/10.3390/inventions4040062