Article

Development of a Low-Cost Measurement Platform for HF RFID Tag Antenna Performance Evaluation at 13.56 MHz


Department of Electrotechnics and Measurements, Faculty of Electrical Engineering, Technical University of Cluj-Napoca, 400114 Cluj-Napoca, Romania
*
Author to whom correspondence should be addressed.
Inventions 2026, 11(4), 72; https://doi.org/10.3390/inventions11040072
Submission received: 5 June 2026 / Revised: 10 July 2026 / Accepted: 14 July 2026 / Published: 21 July 2026
(This article belongs to the Special Issue 10th Anniversary of Inventions)

Abstract

High-frequency (HF) RFID systems operating at 13.56 MHz are widely used in applications such as near-field communication, contactless identification, and smart sensing. Their performance strongly depends on the inductive coupling between the reader and tag antennas, which is influenced by antenna geometry, relative position, orientation, and environmental conditions. This work investigates the antenna component of passive HF RFID tags, represented by planar spiral inductors, without integrating an RFID microchip, allowing the electromagnetic coupling to be analyzed independently of chip-specific effects. A low-cost automated measurement platform was developed to experimentally evaluate the influence of antenna geometry, distance, orientation, and temperature on inductively coupled HF RFID antennas. The platform combined an automated positioning system with a mobile application for remote operation, minimizing the influence of the operator during measurements. A second experimental setup was designed to investigate the effect of temperature on antenna performance. Experimental results show that rectangular spiral antennas generally provided stronger inductive coupling than the other geometries investigated. Furthermore, varying the receiving antenna orientation improved the coupling between rectangular and octagonal antennas under specific configurations. Temperature variations within the investigated range had only a minor influence on antenna performance. The proposed platform provides a low-cost, portable, and reproducible solution for the experimental characterization of HF RFID antennas operating at 13.56 MHz.

1. Introduction

RFID antennas are used in a lot of applications nowadays, in a frequency range spanning from a few kHz to 2.4 GHz, sometimes even 5 GHz. The applications are specific for each frequency; for example, at a frequency of 125 kHz, applications may include badges, animal identification, and car keys, while at 13.56 MHz, there are applications like NFC (near-field communication), biometric passports, and public transportation [1,2,3,4,5]. Due to their long range, the tag antennas operating in the frequency range of 860–960 MHz are used in logistics, supply chains, or vehicle control, while applications for a 2.4 GHz tag may include road toll systems, high speed vehicle identification, or intelligent transportation systems [6,7,8,9]. Figure 1 presents a diagram of the different frequency ranges used in RFID along with some examples of antennas.
Among the different RFID frequency bands, this study focuses on high-frequency (HF) RFID systems operating at 13.56 MHz. These systems are commonly used in applications such as NFC, contactless cards, and electronic identification documents.
The operating frequency of 13.56 MHz was selected because it represents the international ISM frequency allocated for HF RFID systems. Although the measurements were performed at 13.56 MHz, the conclusions regarding the influence of antenna geometry, alignment and positioning are generally applicable to other inductively coupled HF systems, while the absolute electrical values naturally vary with frequency.
Unlike the higher frequencies of RFID where the connection relies on electromagnetic wave propagation, HF RFID systems operate in the near field and are based on electromagnetic inductive coupling between the reader and tag antennas. Therefore, the analysis carried out in this paper specifically addresses inductively coupled HF RFID antennas, where small variations in alignment or positioning can significantly affect system performance.
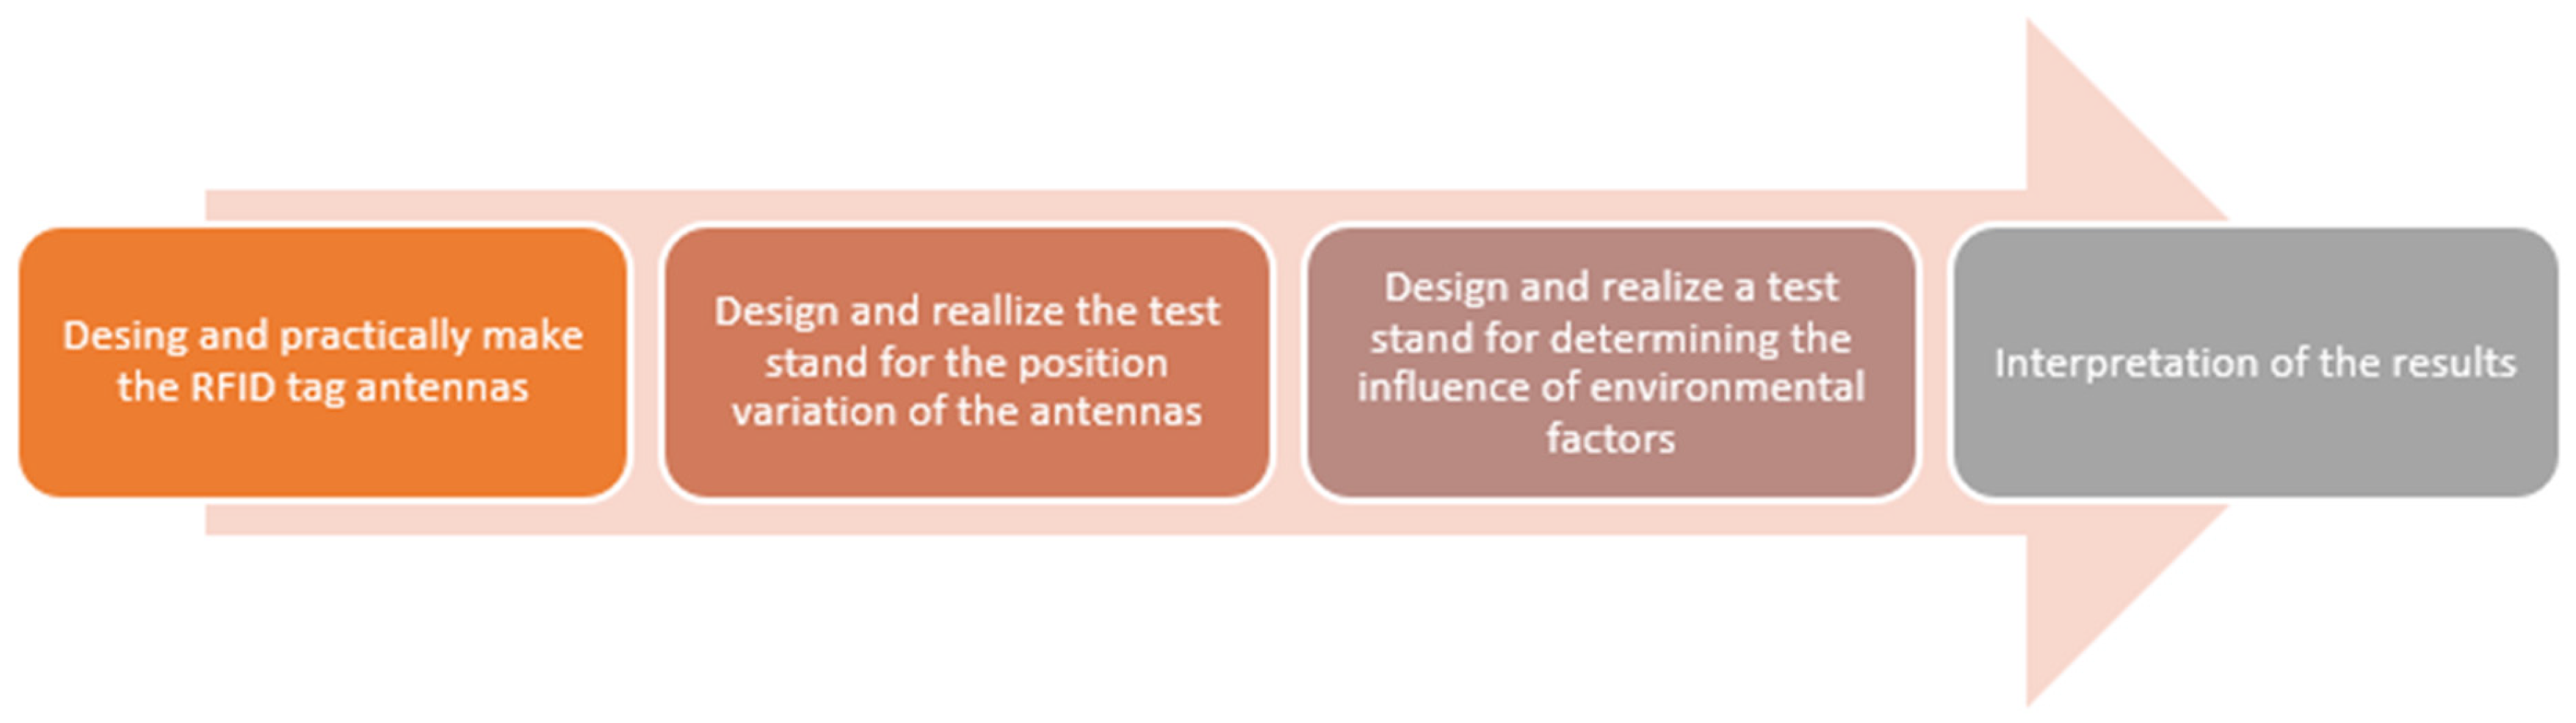
An RFID system typically involves two types of tags: a reader (active device) and a passive tag. In HF systems, the interaction is dominated by inductive coupling between the reader antenna and the tag antenna. The shape, orientation, and distance between them influence how they communicate and this is why the influence of these three factors was analyzed in the current study. The steps used in this study are described in Figure 2. In order to achieve this purpose, the first steps were to design, analyze through 3D numerical modelling, and construct a small antenna for us to test. The next step was to create a reliable low-cost experimental test stand, to enable us to determine the influence of distance and position on the antenna performance. Different shapes and types of antennas were designed, analyzed, and constructed to reach a conclusion about the interaction between them. Finally, the antennas were tested considering a small variation of temperature and implicitly, humidity, by designing another test setup, an enclosure where the antennas were inserted. Even though it is based on a certain type of antenna, this study can give users some insight about how much those antennas are influenced by the above-mentioned parameters, and which are the best conditions in which an antenna can function properly. The experimental stand created is a low-cost and easily movable test setup to encourage other scientists to create their own to design and experimentally test their products.
The measurement test setup for antennas involves positioning the transmitter and the receiver antennas next to each other, where the support for the antenna can change the azimuthal angle and the elevation of the tested antenna. Such tests are usually made in an anechoic chamber to prevent interference from external electromagnetic signals and to ensure a controlled measurement environment [10,11].
Due to the different applications of the antennas, many interpretations of this design are described in the specialized literature. In [12], the influence of the antenna on a tattooed antenna is discussed, and due to the small distance between the antennas when they interact, a vertically mobile test stand was constructed. In [13,14], portable rotary systems were constructed. In other studies [15,16], a robotic arm was used in order to modify the orientation of the tested antenna.
It is important to note that this study focuses on the antenna component of HF tag antennas rather than fully integrated tag antennas. The analyzed structures consisted of planar spiral coils, representing the inductive antenna part of a passive HF RFID tag. No RFID integrated circuit (chip) was included in the experimental structures. Therefore, the term RFID tag is used in this paper to refer to its antenna equivalent used for inductive coupling analysis. The objective was to evaluate the electromagnetic interaction between reader and tag antennas, independently of the modulation and chip-specific behavior.
Unlike full RFID tag performance evaluation, which involves chip sensitivity, modulation, and communication protocols, this study isolated the electromagnetic behavior of the antenna component.
The scientific contribution of this work consists of the development of a low-cost, portable and easily reproducible measurement platform dedicated specifically to HF RFID antennas operating at 13.56 MHz, the combination of distance, angular orientation, and environmental temperature investigations within two mobile platforms, the development of a wireless mobile application that allows remote control of the measurement process, eliminating the influence of the operator during measurements, and the comparative experimental characterization of four different planar spiral antenna geometries under identical operating conditions, providing an experimental methodology that can be reproduced by other laboratories without requiring expensive robotic equipment or an anechoic chamber.
In Section 2, a short presentation of the antennas to be tested is presented, while in Section 3, the test setup for the antenna position variation is presented along with the mobile application created to control it. In this section, the test setup for the temperature and humidity variation is illustrated. Section 4 presents a discussion regarding the results, while Section 5 presents the conclusions of the research process.

2. Materials and Methods

2.1. Design, Modeling and Practical Realization of the Antennas to Be Tested

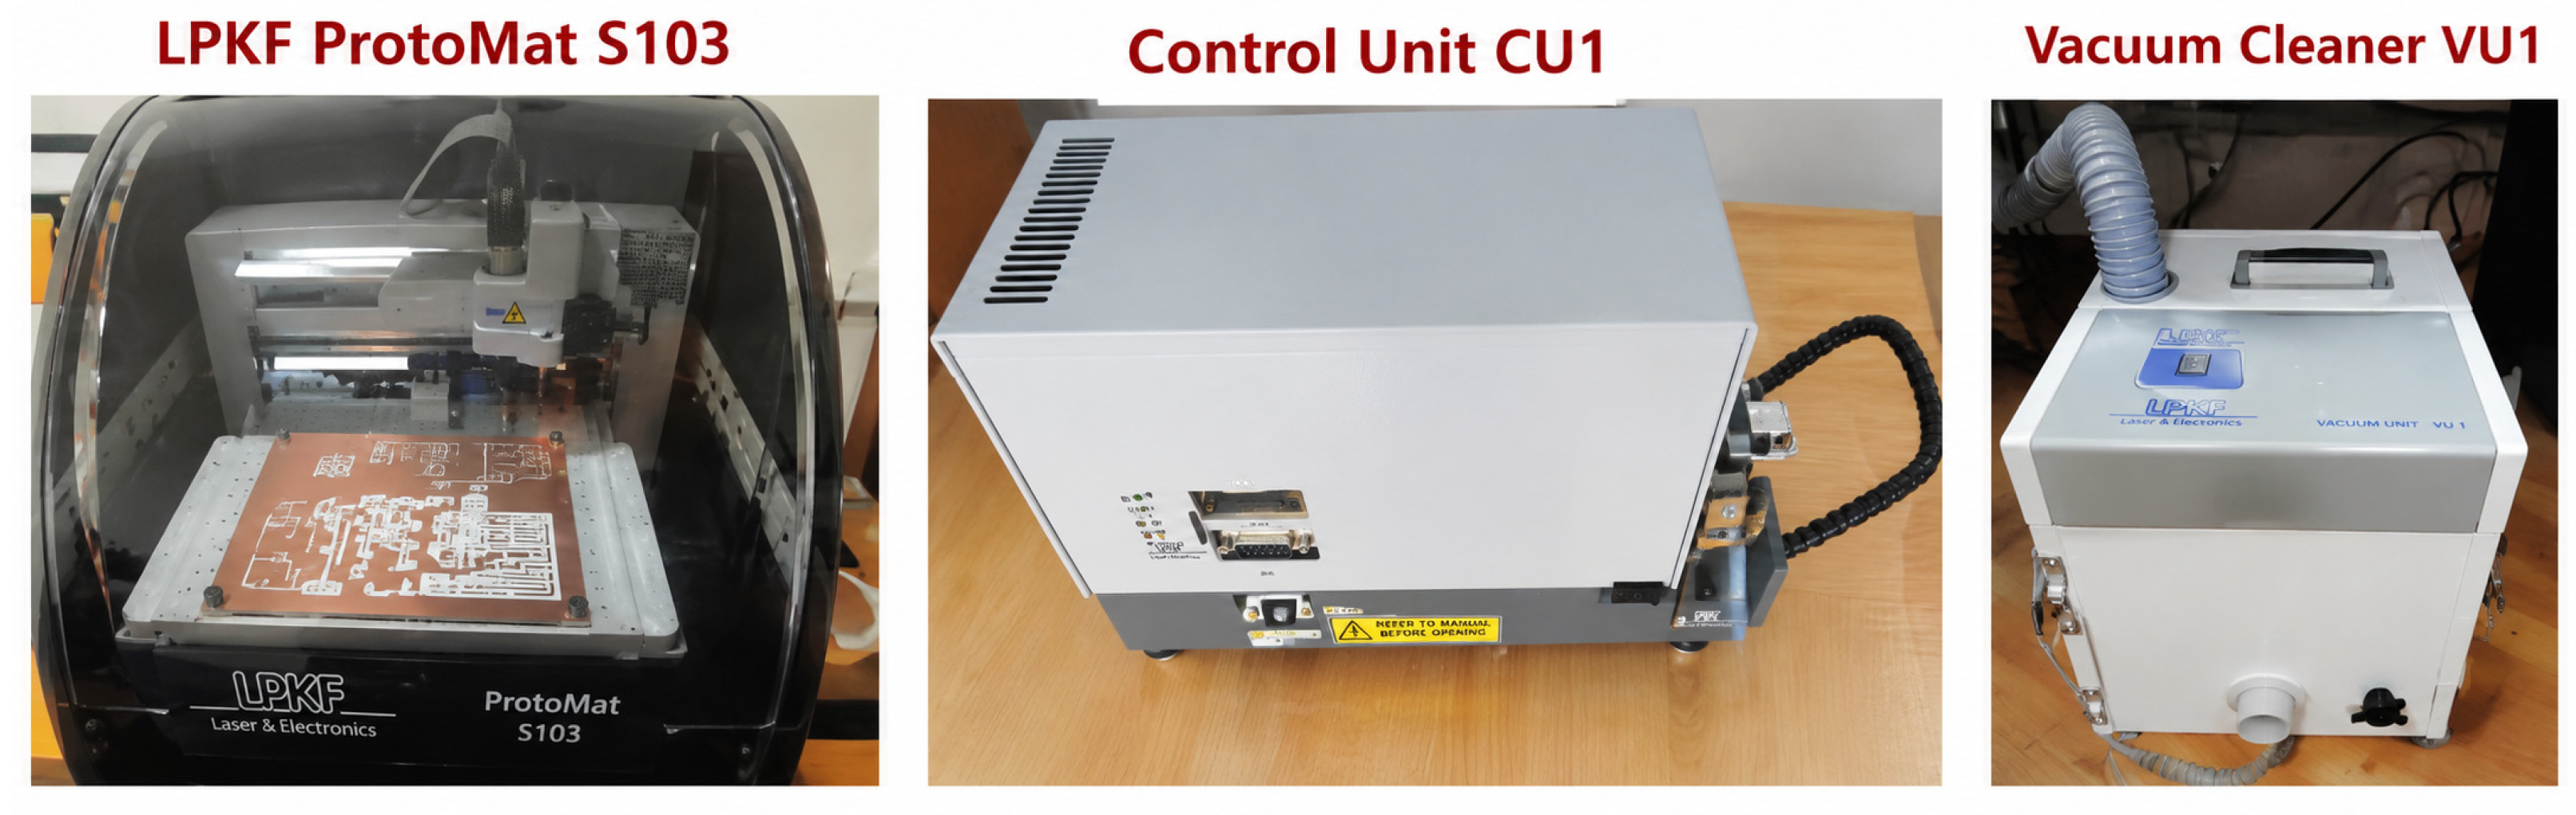
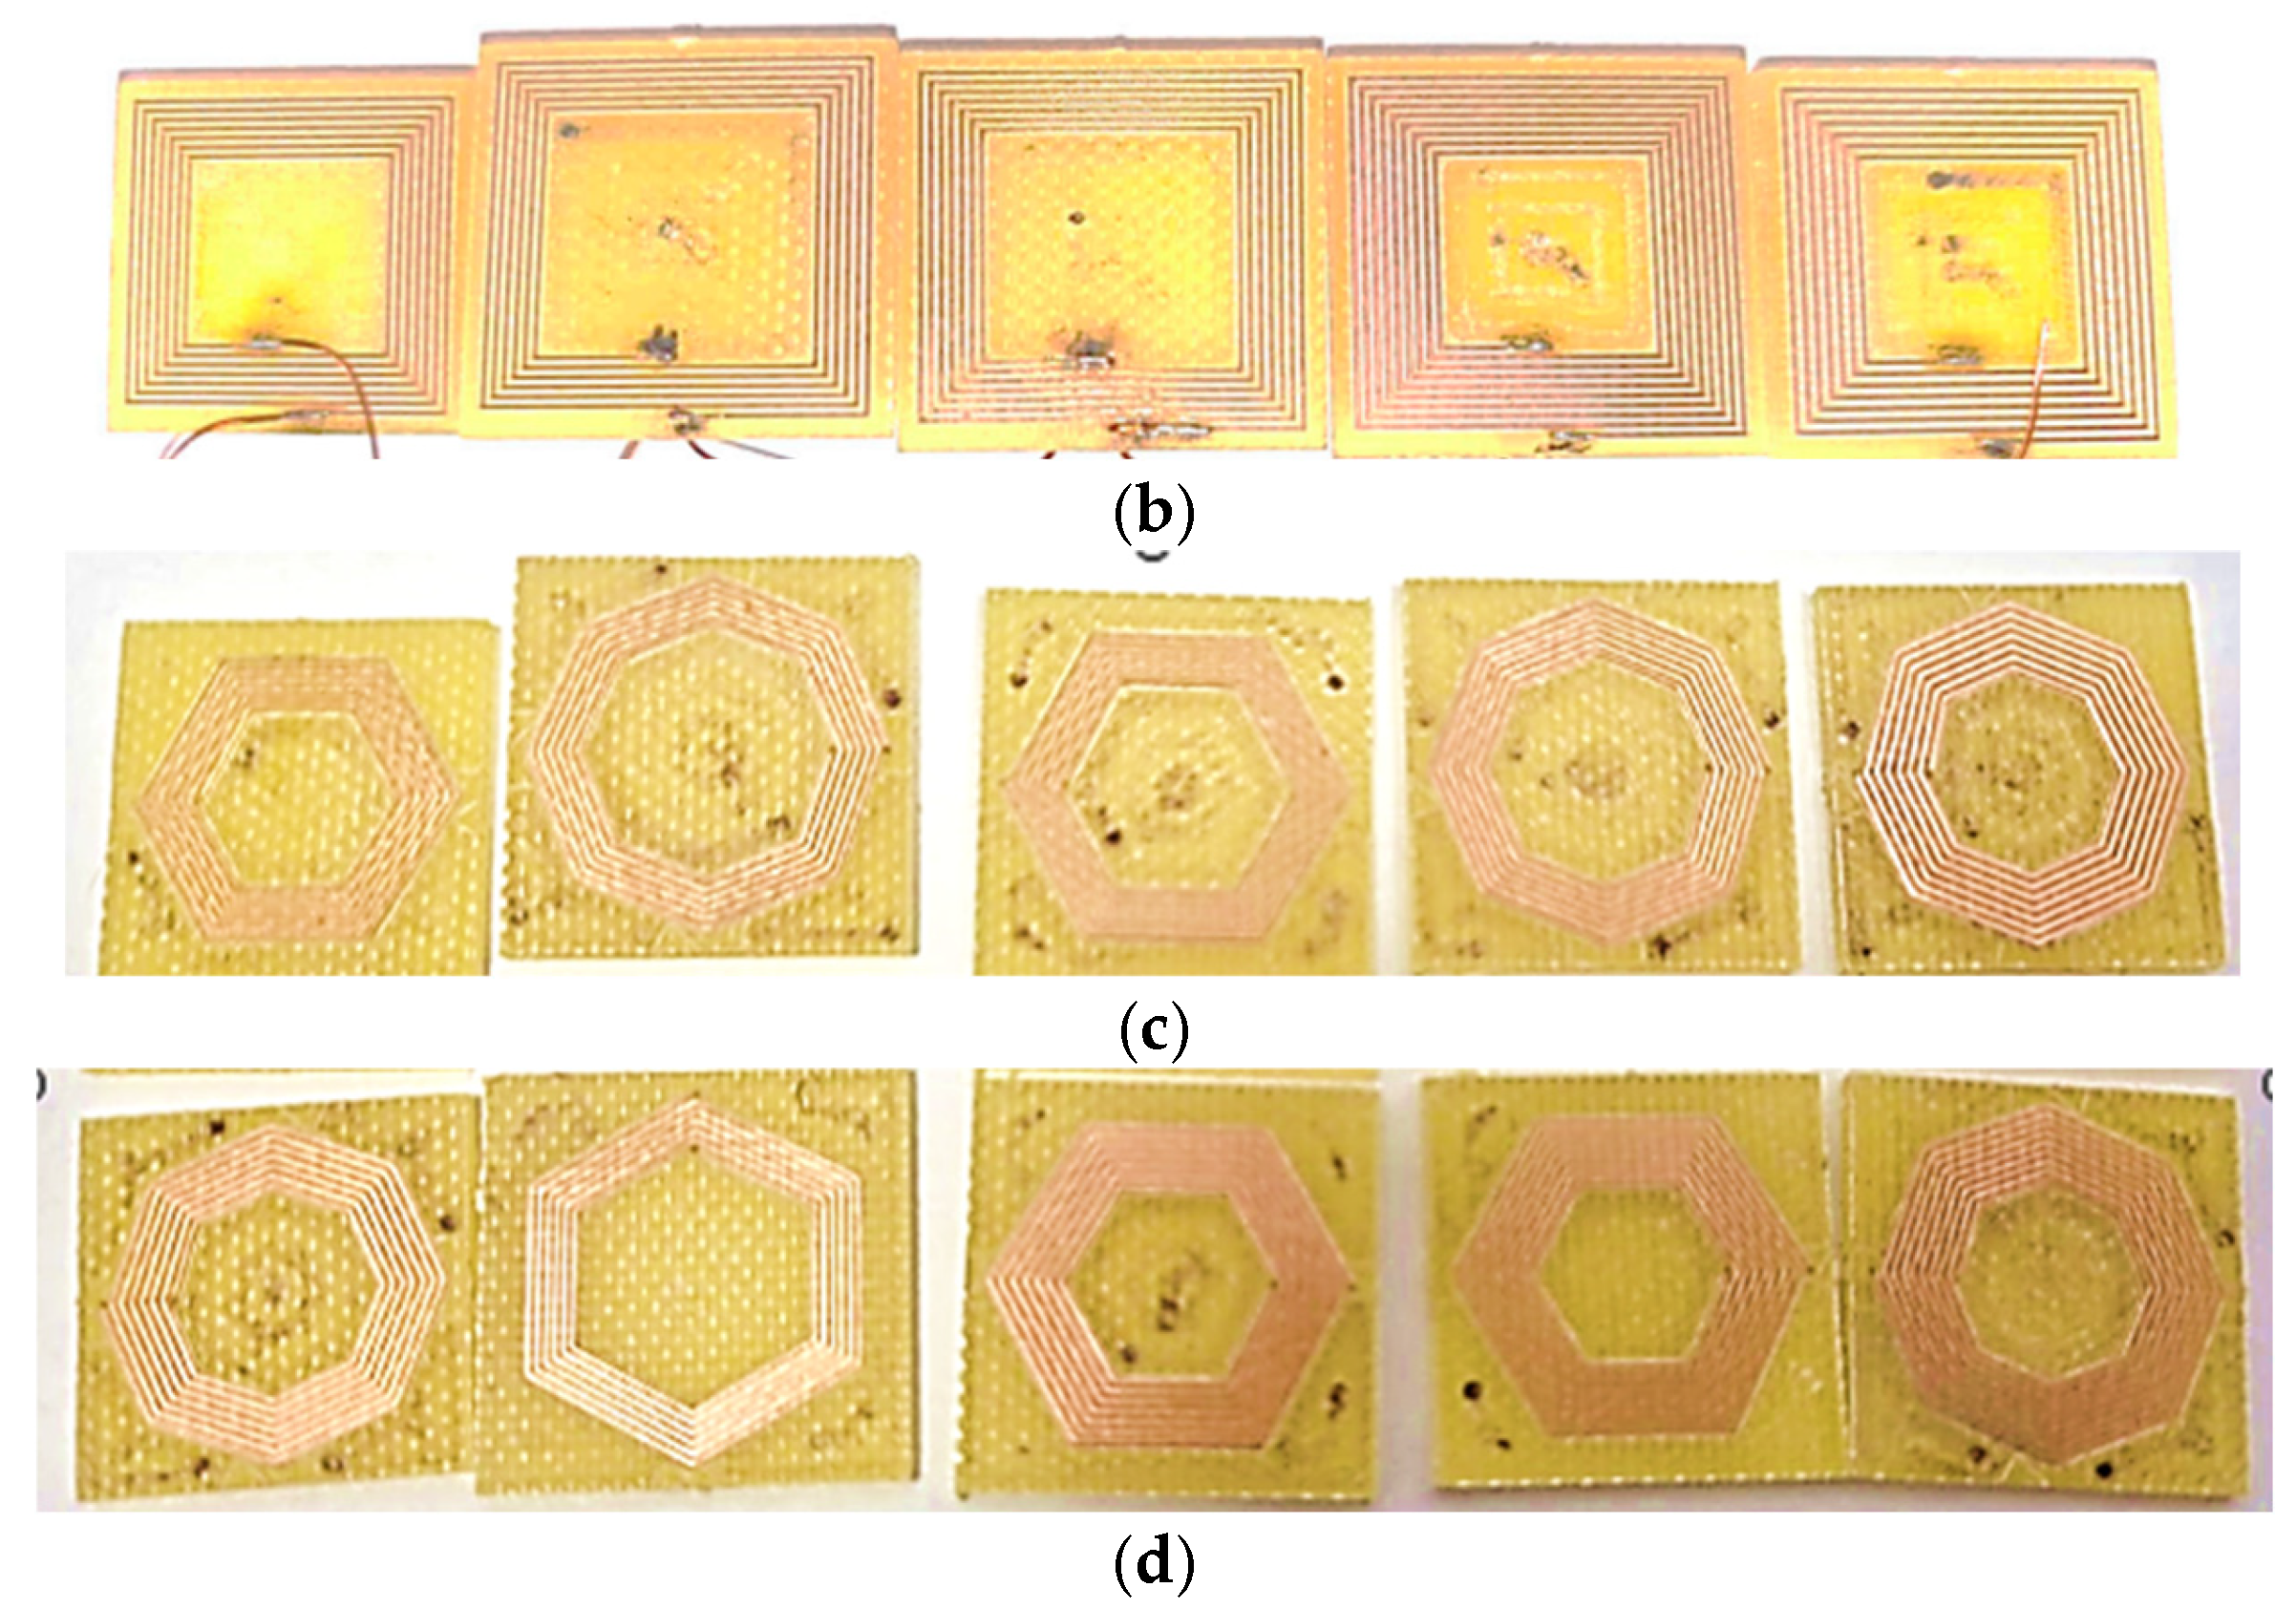
Spiral planar inductive antennas structures were considered as representative antenna elements of HF tag antennas. Four different shapes were considered, namely circular, rectangular, octagonal, and hexagonal. The tag antennas’ dimensions for outer diameter (De), distance between turns (s) and turn width (w) are presented in Table 1. All structures were made using the LPKF ProtoMat S103 plotter (LPKF Laser & Electronics SE, Garbsen, Germany) (Figure 3), by importing the geometry numerically modelled in the Ansys High Frequency Software Simulator (HFSS, LPKF CircuitPro PM 2.7) module into the plotter’s dedicated software, LPKF Circuit Pro [17,18].
Circular, rectangular, hexagonal, and octagonal geometries represent the most frequently encountered shapes in practical HF RFID antenna design.
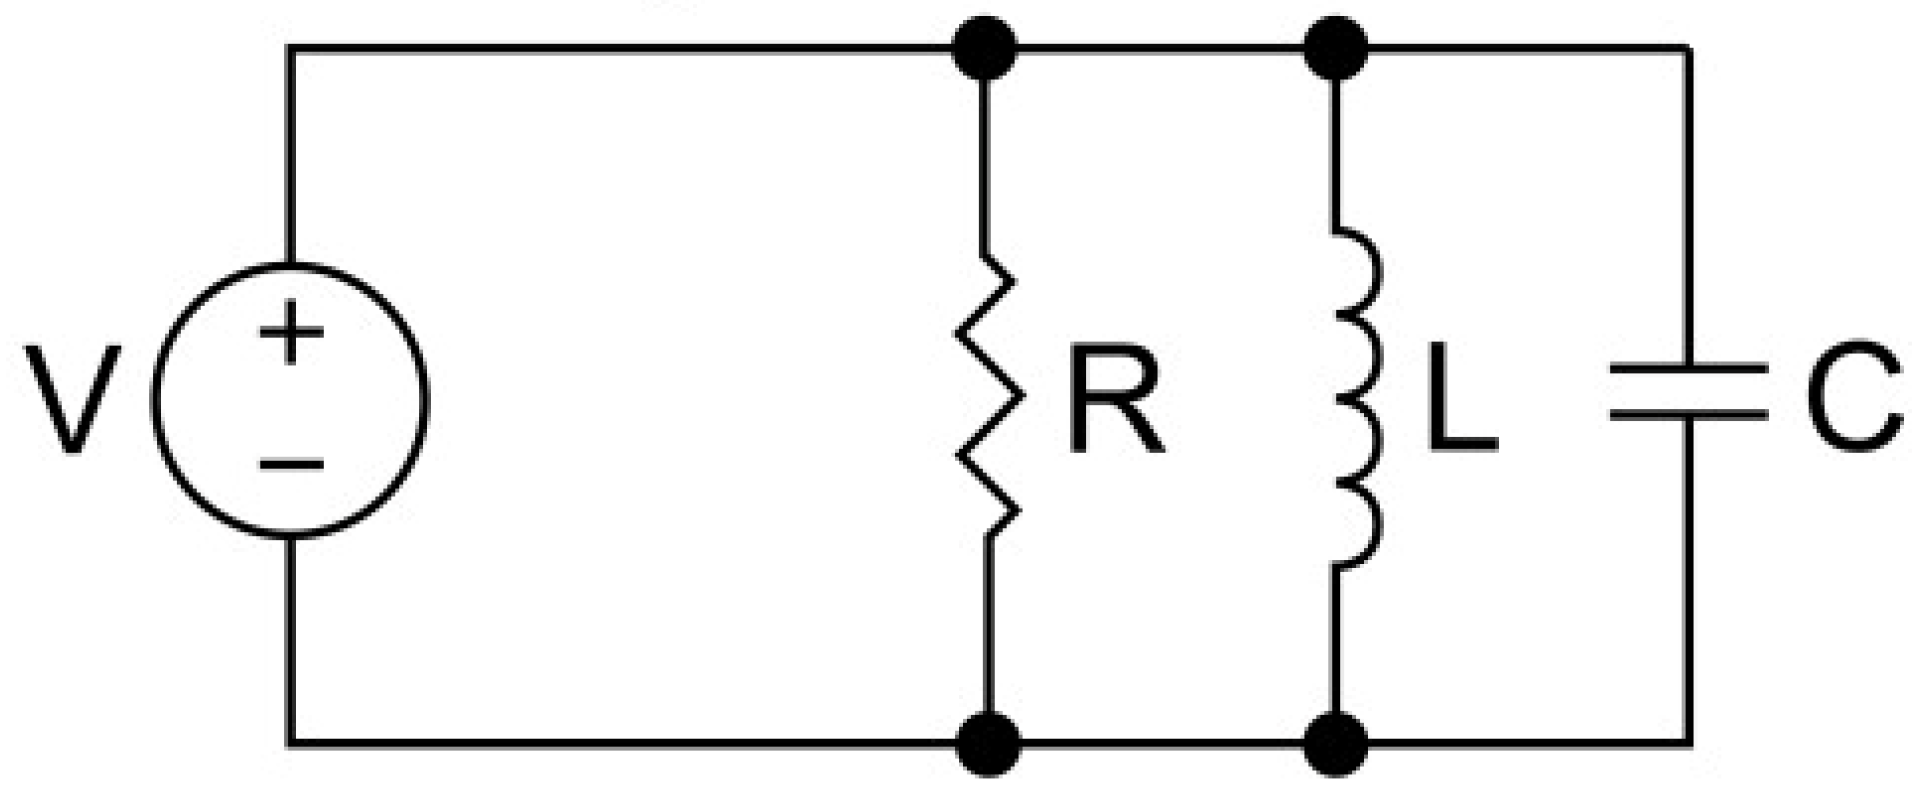
Based on the practical implementation shown in Figure 4, the analyzed structures were modeled using an equivalent parallel RLC circuit (Figure 5). The planar spiral coil represents the inductance (L), while a discrete capacitor (C) was connected across the coil terminals to tune the structure to the resonance frequency of 13.56 MHz. The resistive component (R) models the combined losses, including conductor resistance, connection losses, and additional resistive elements introduced for measurement purposes. All components were connected in parallel between the antenna terminals, which accurately reflects the behavior of HF RFID tag antennas operating in the near-field region under inductive coupling conditions.
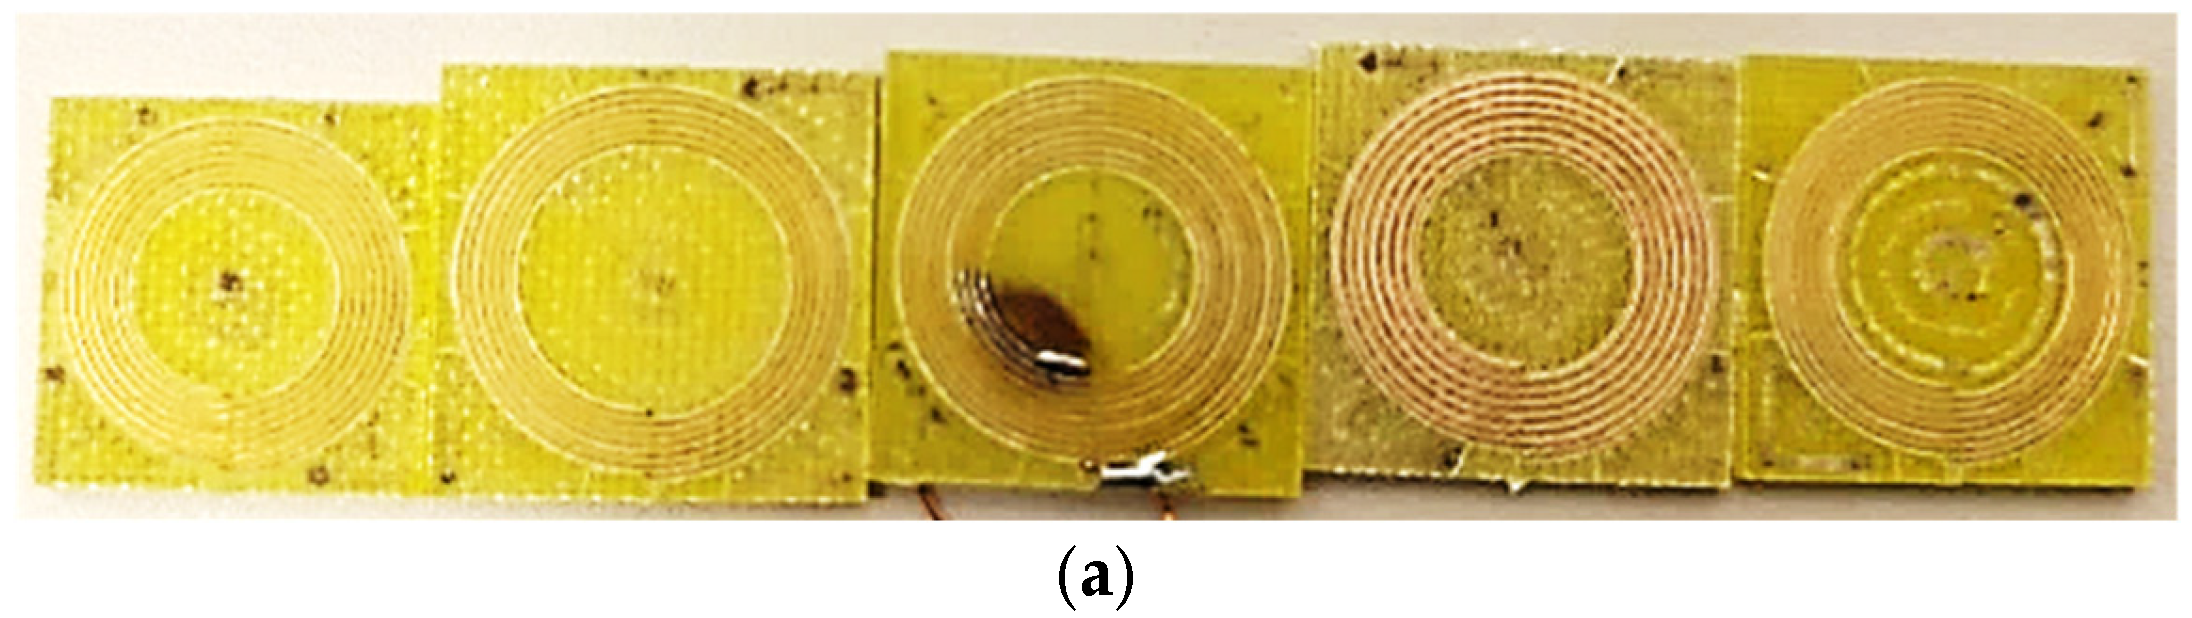
Thus, four sets of five planar structures were designed, numerically modeled, and built, considering the previously modeled coil shapes, namely circular, square, hexagonal, and octagonal, as can be seen in Figure 4. Terminals were then added to the practically created structures, and their inductance values were measured using an RLC meter. The antennas were fabricated on an FR4 substrate with a relative permittivity εr ≈ 4.4 and a thickness of approximately 1.6 mm. The conductive traces were made of copper with a thickness of approximately 35 µm.
Although Rogers substrates exhibit lower dielectric losses, our objective was to develop a low-cost measurement platform suitable for educational laboratories and research groups with limited budgets. FR4 remains the most widely available PCB substrate and is commonly employed in practical HF RFID tag fabrication, particularly at 13.56 MHz where dielectric losses are considerably smaller than in microwave applications. Using FR4 therefore supports the low-cost philosophy of the proposed measurement platform.
These material parameters were considered both in numerical modeling and in the practical realization of the antenna structures. The inductance of the structures, considering their shape, can be calculated via one of the equations (1–4). The inductance was determined with formula (1) for the square shape, (2) for the hexagonal shape, (3) for the octagonal shape, and (4) for the circular shape. In the structures considered, L is the inductance, µ is the permeability of the free space, N is the number of turns, dm represents the average diameter of the inductor, and ρ is the fill factor. The inner diameter of the inductor dm is calculated with formula (5), where De is the exterior diameter of the inductor and Di is the interior diameter of the inductor. Formula (6) determines the value of the fill factor, w represents the width of the turn, while s is the distance between the turns.
L = μ · N 2 · d m · 1.27 2 · l o g 2.07 ρ + 0.18 · ρ + 0.13 · ρ 2
L = μ · N 2 · d m · 1.09 2 · l o g 2.23 ρ + 0.17 · ρ 2
L = μ · N 2 · d m · 1.07 2 · l o g 2.29 ρ + 0.19 · ρ 2
L = μ · N 2 · d m · 1 2 · l o g 2.46 ρ + 0.2 · ρ 2
dm = (De + Di)/2
ρ = [N·w + (N − 1)·s]/dm
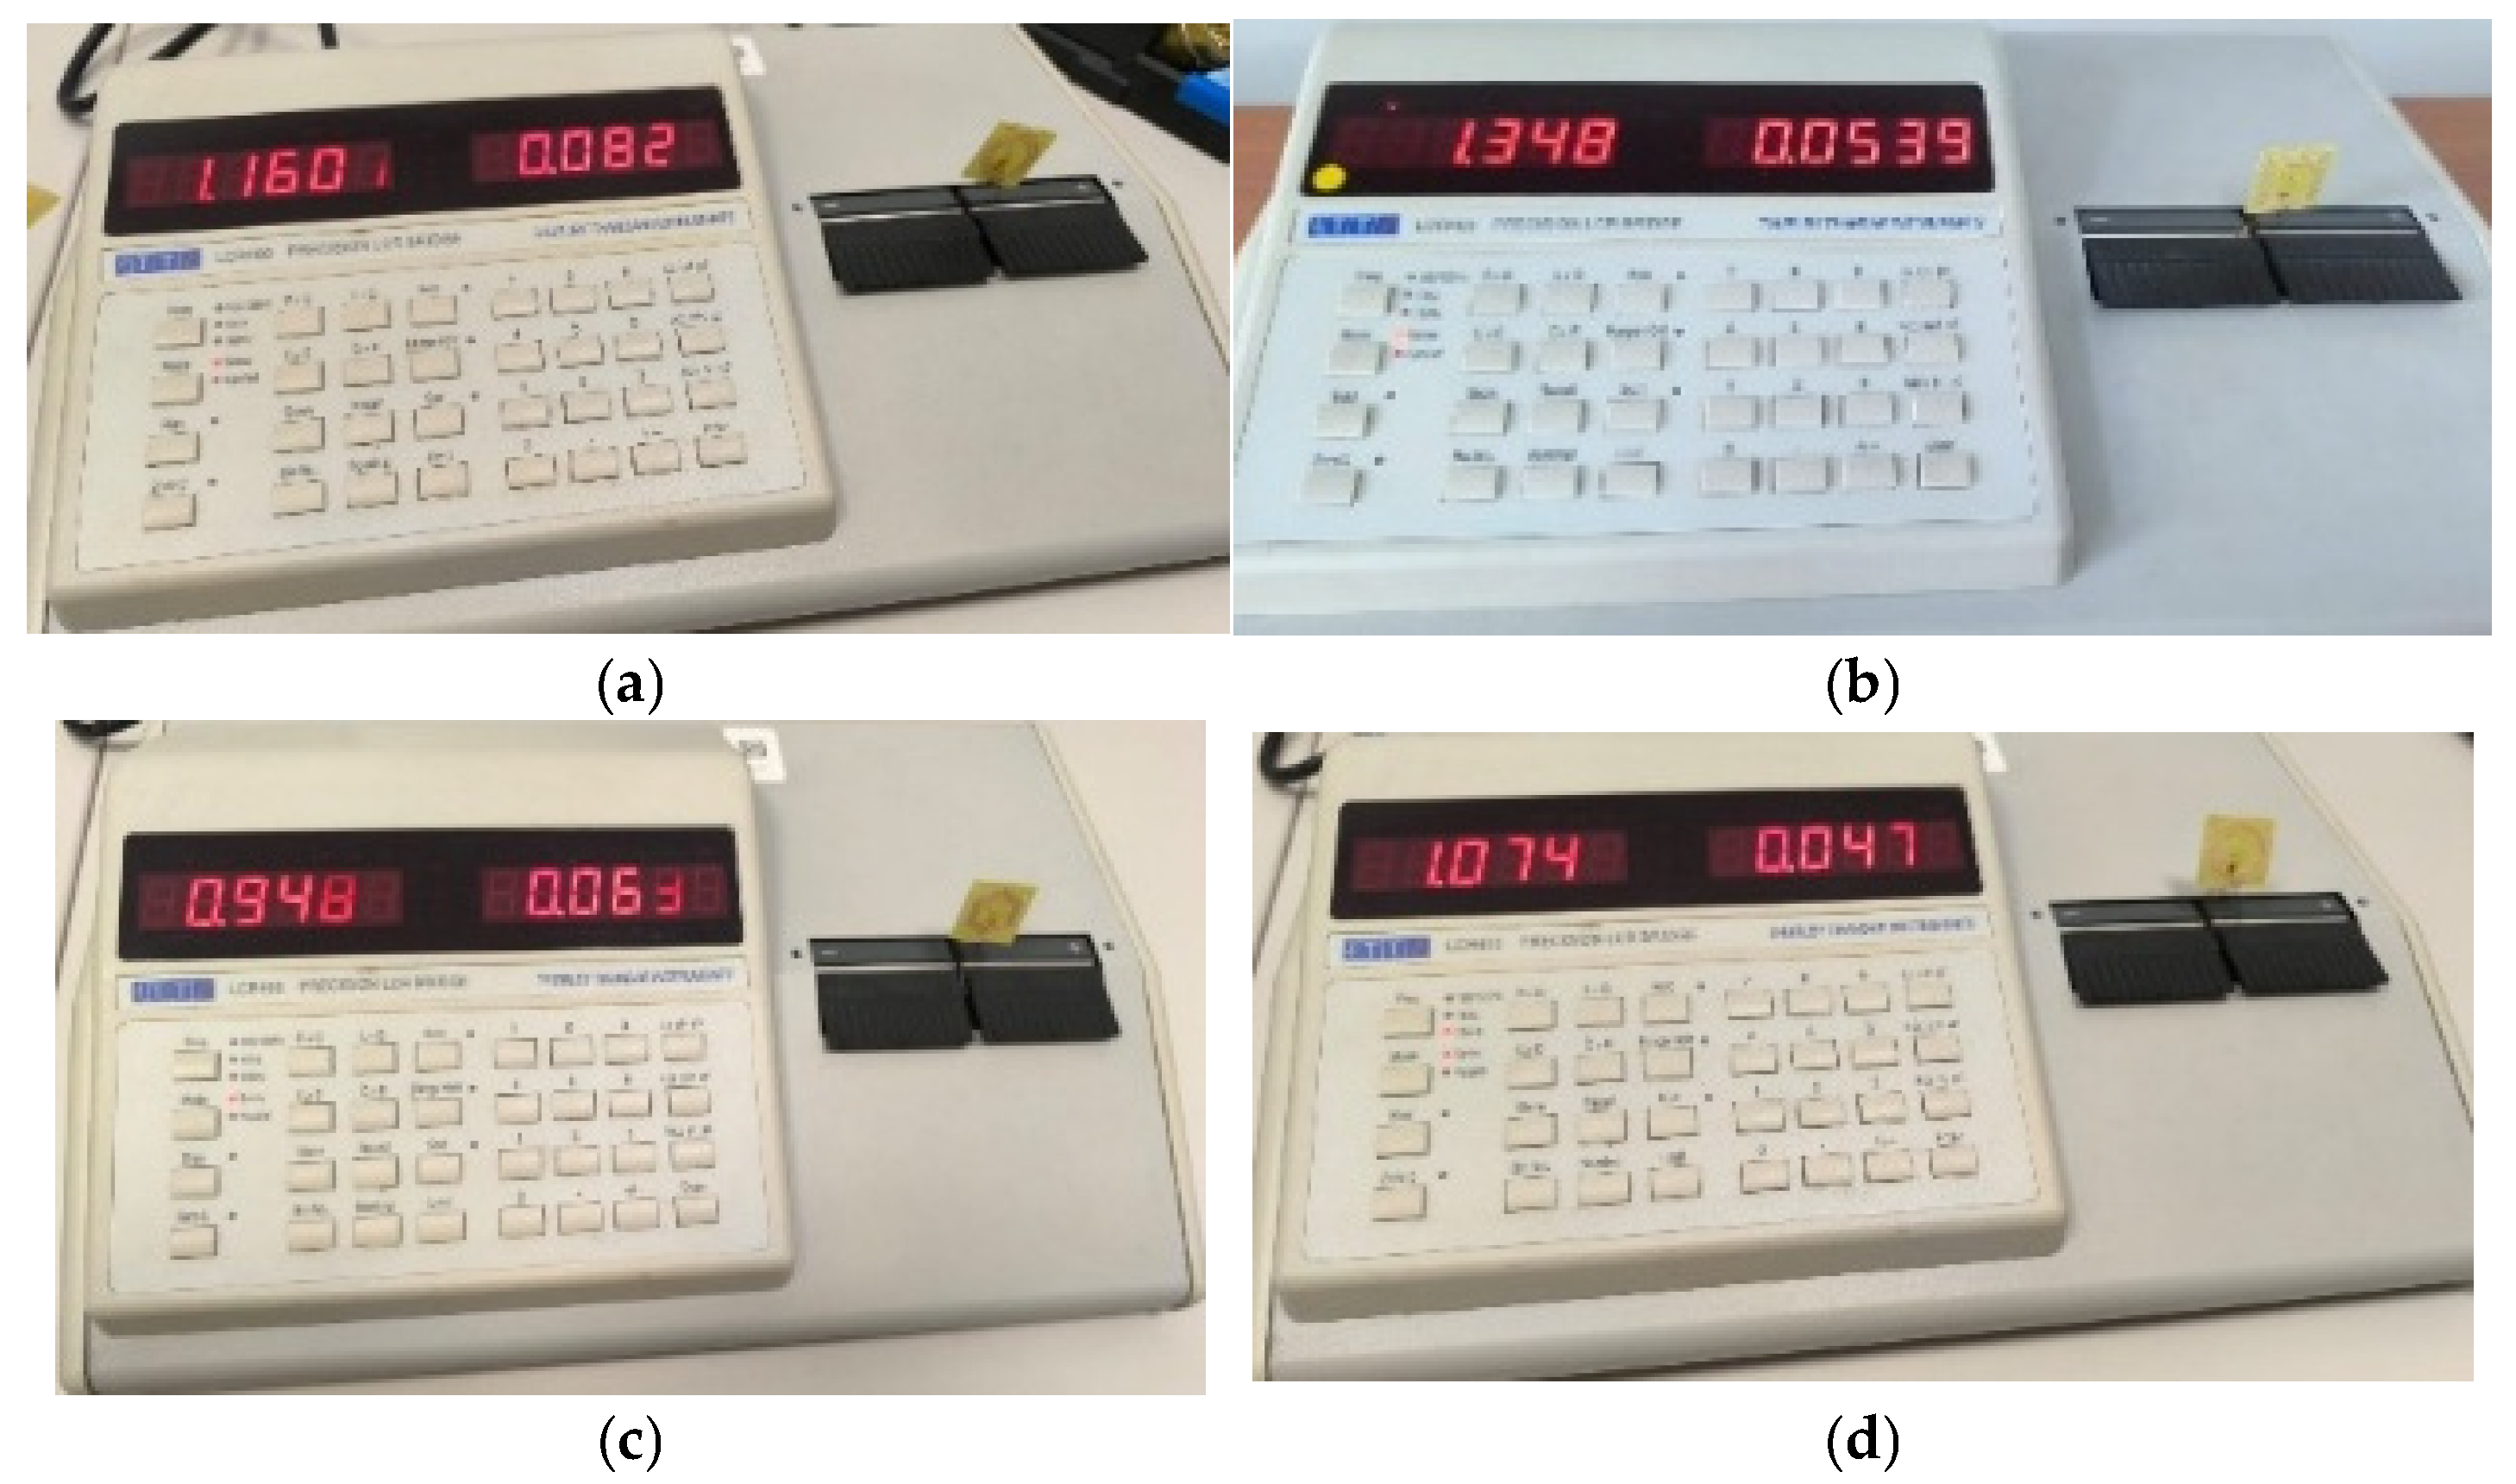
Table 2 presents, for example, the measurement of the inductance values for one structure made for each analyzed geometric shape, along with the values obtained analytically using the formulas from [19] and by numerical modelling for the structures with an outer diameter of 19 mm, 7 turns, a turn width of 0.4 mm, and a distance between the turns of 0.2 mm. It can be seen that the values are similar. The inductance values were measured using a calibrated ATT RLC meter. Prior to the measurements, the instrument was zeroed using the open/short compensation procedure recommended by the manufacturer in order to minimize the influence of the test leads. The measurements were performed using the instrument’s standard inductance measurement mode. The differences between the measured, analytical, and numerical inductance values may be partially attributed to fabrication tolerances, terminal parasitics, contact and soldering effects, and the influence of the measurement fixture. Since no de-embedding procedure was applied, the contribution of the connecting wires should be considered only as a possible source of deviation rather than a definitive explanation.
The resonance frequency of the equivalent circuit is determined by using the following formula:
f = 1 2 π L C
where L represents the inductance of the spiral coil and C is the capacitance used for tuning. The inductance values were estimated both analytically and numerically, considering the geometry of the planar spiral structures, and knowing the required value for the resonant frequency, the necessary capacitance was determined.
The measurement results for the inductance value obtained with an RLC meter are presented in Figure 6.
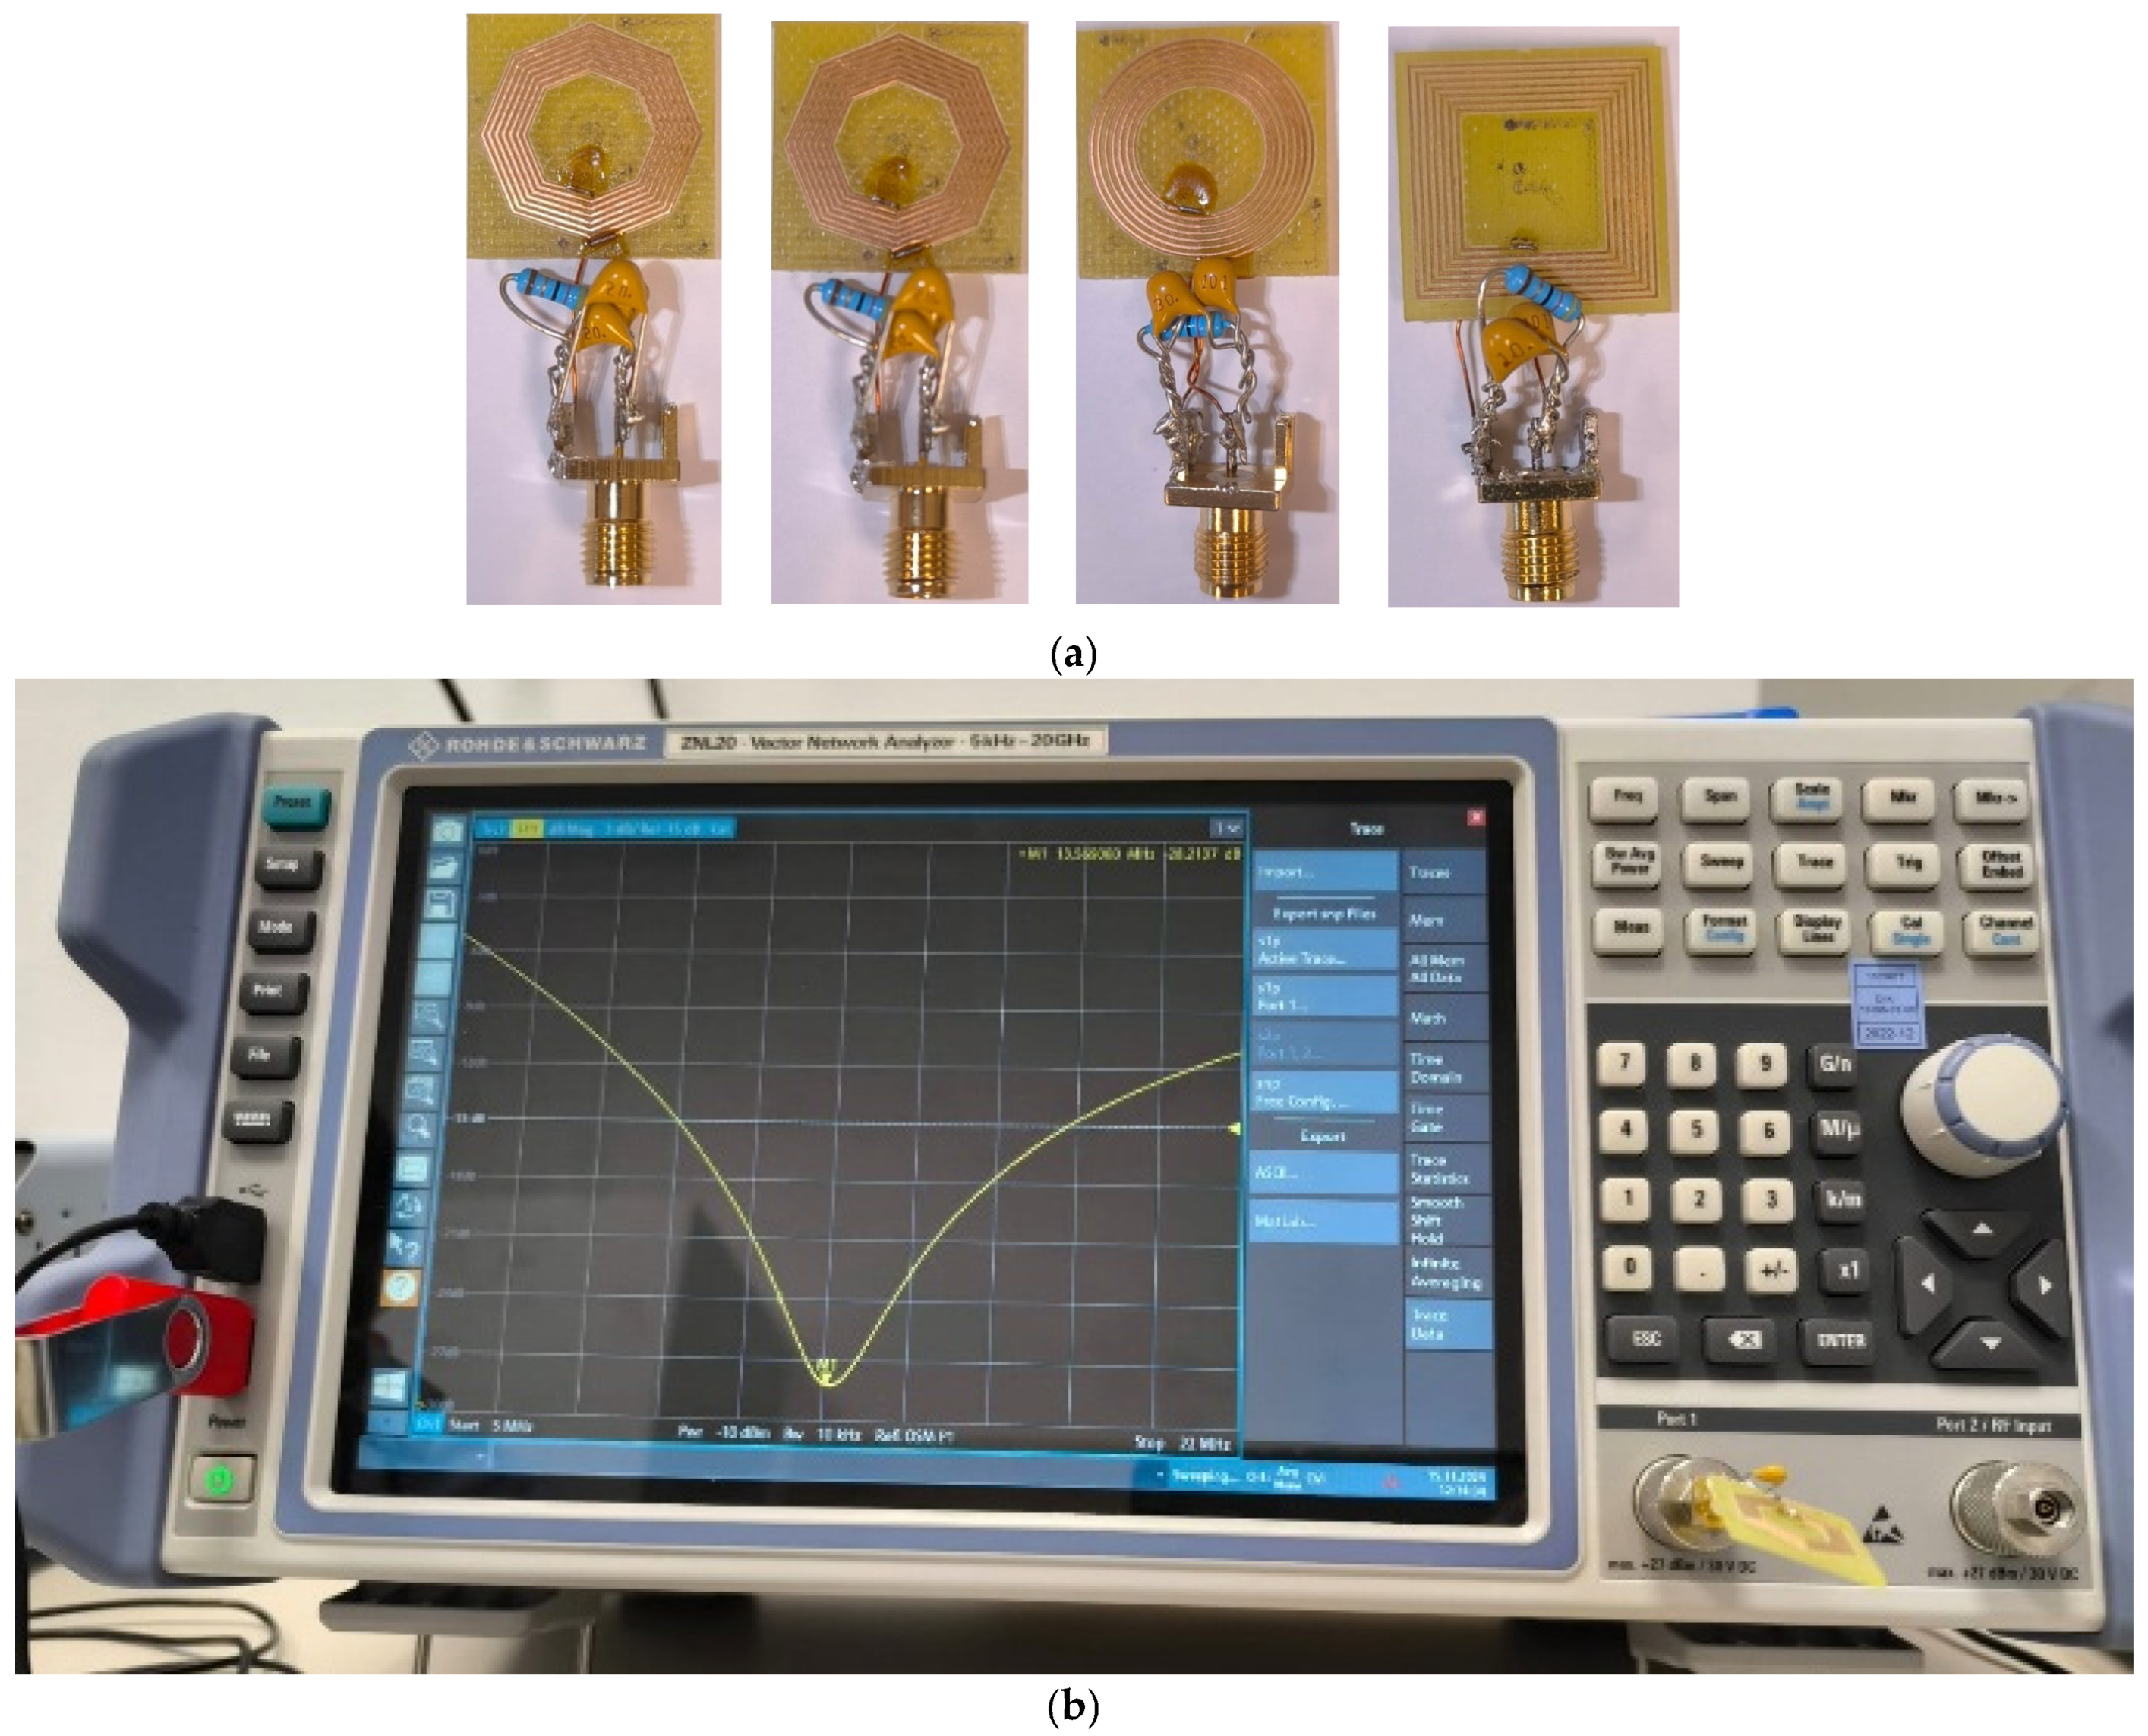
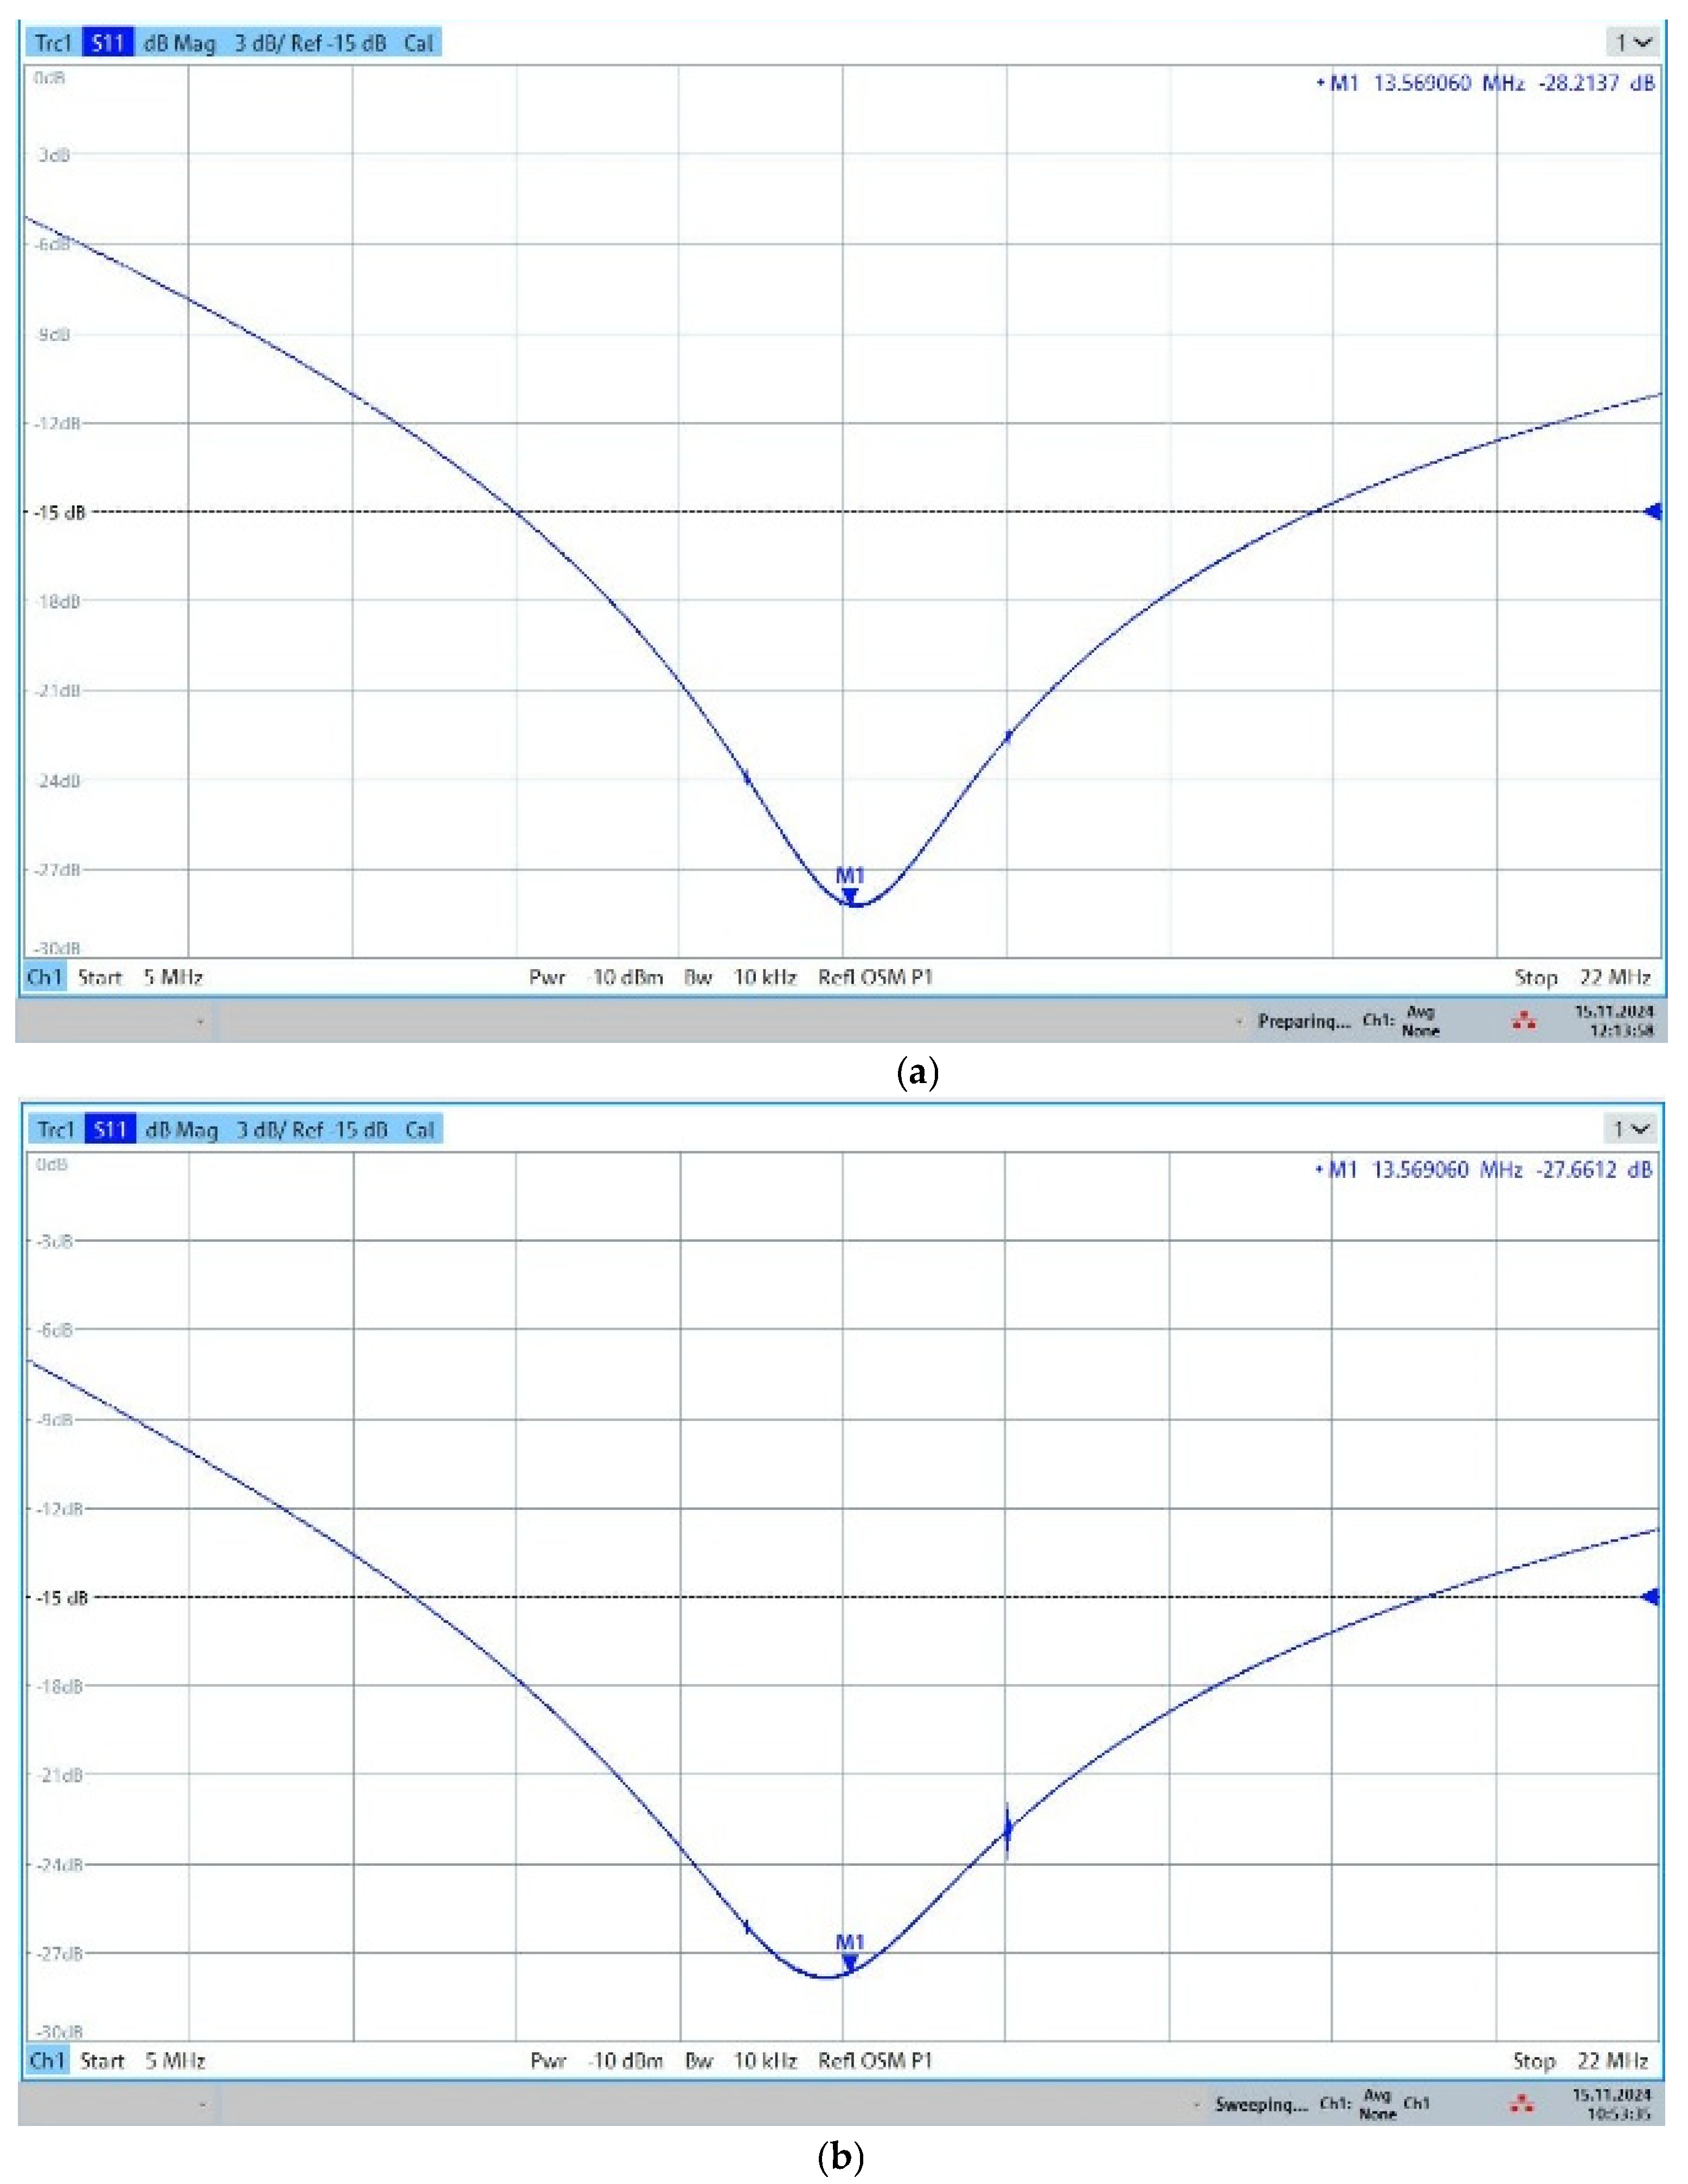
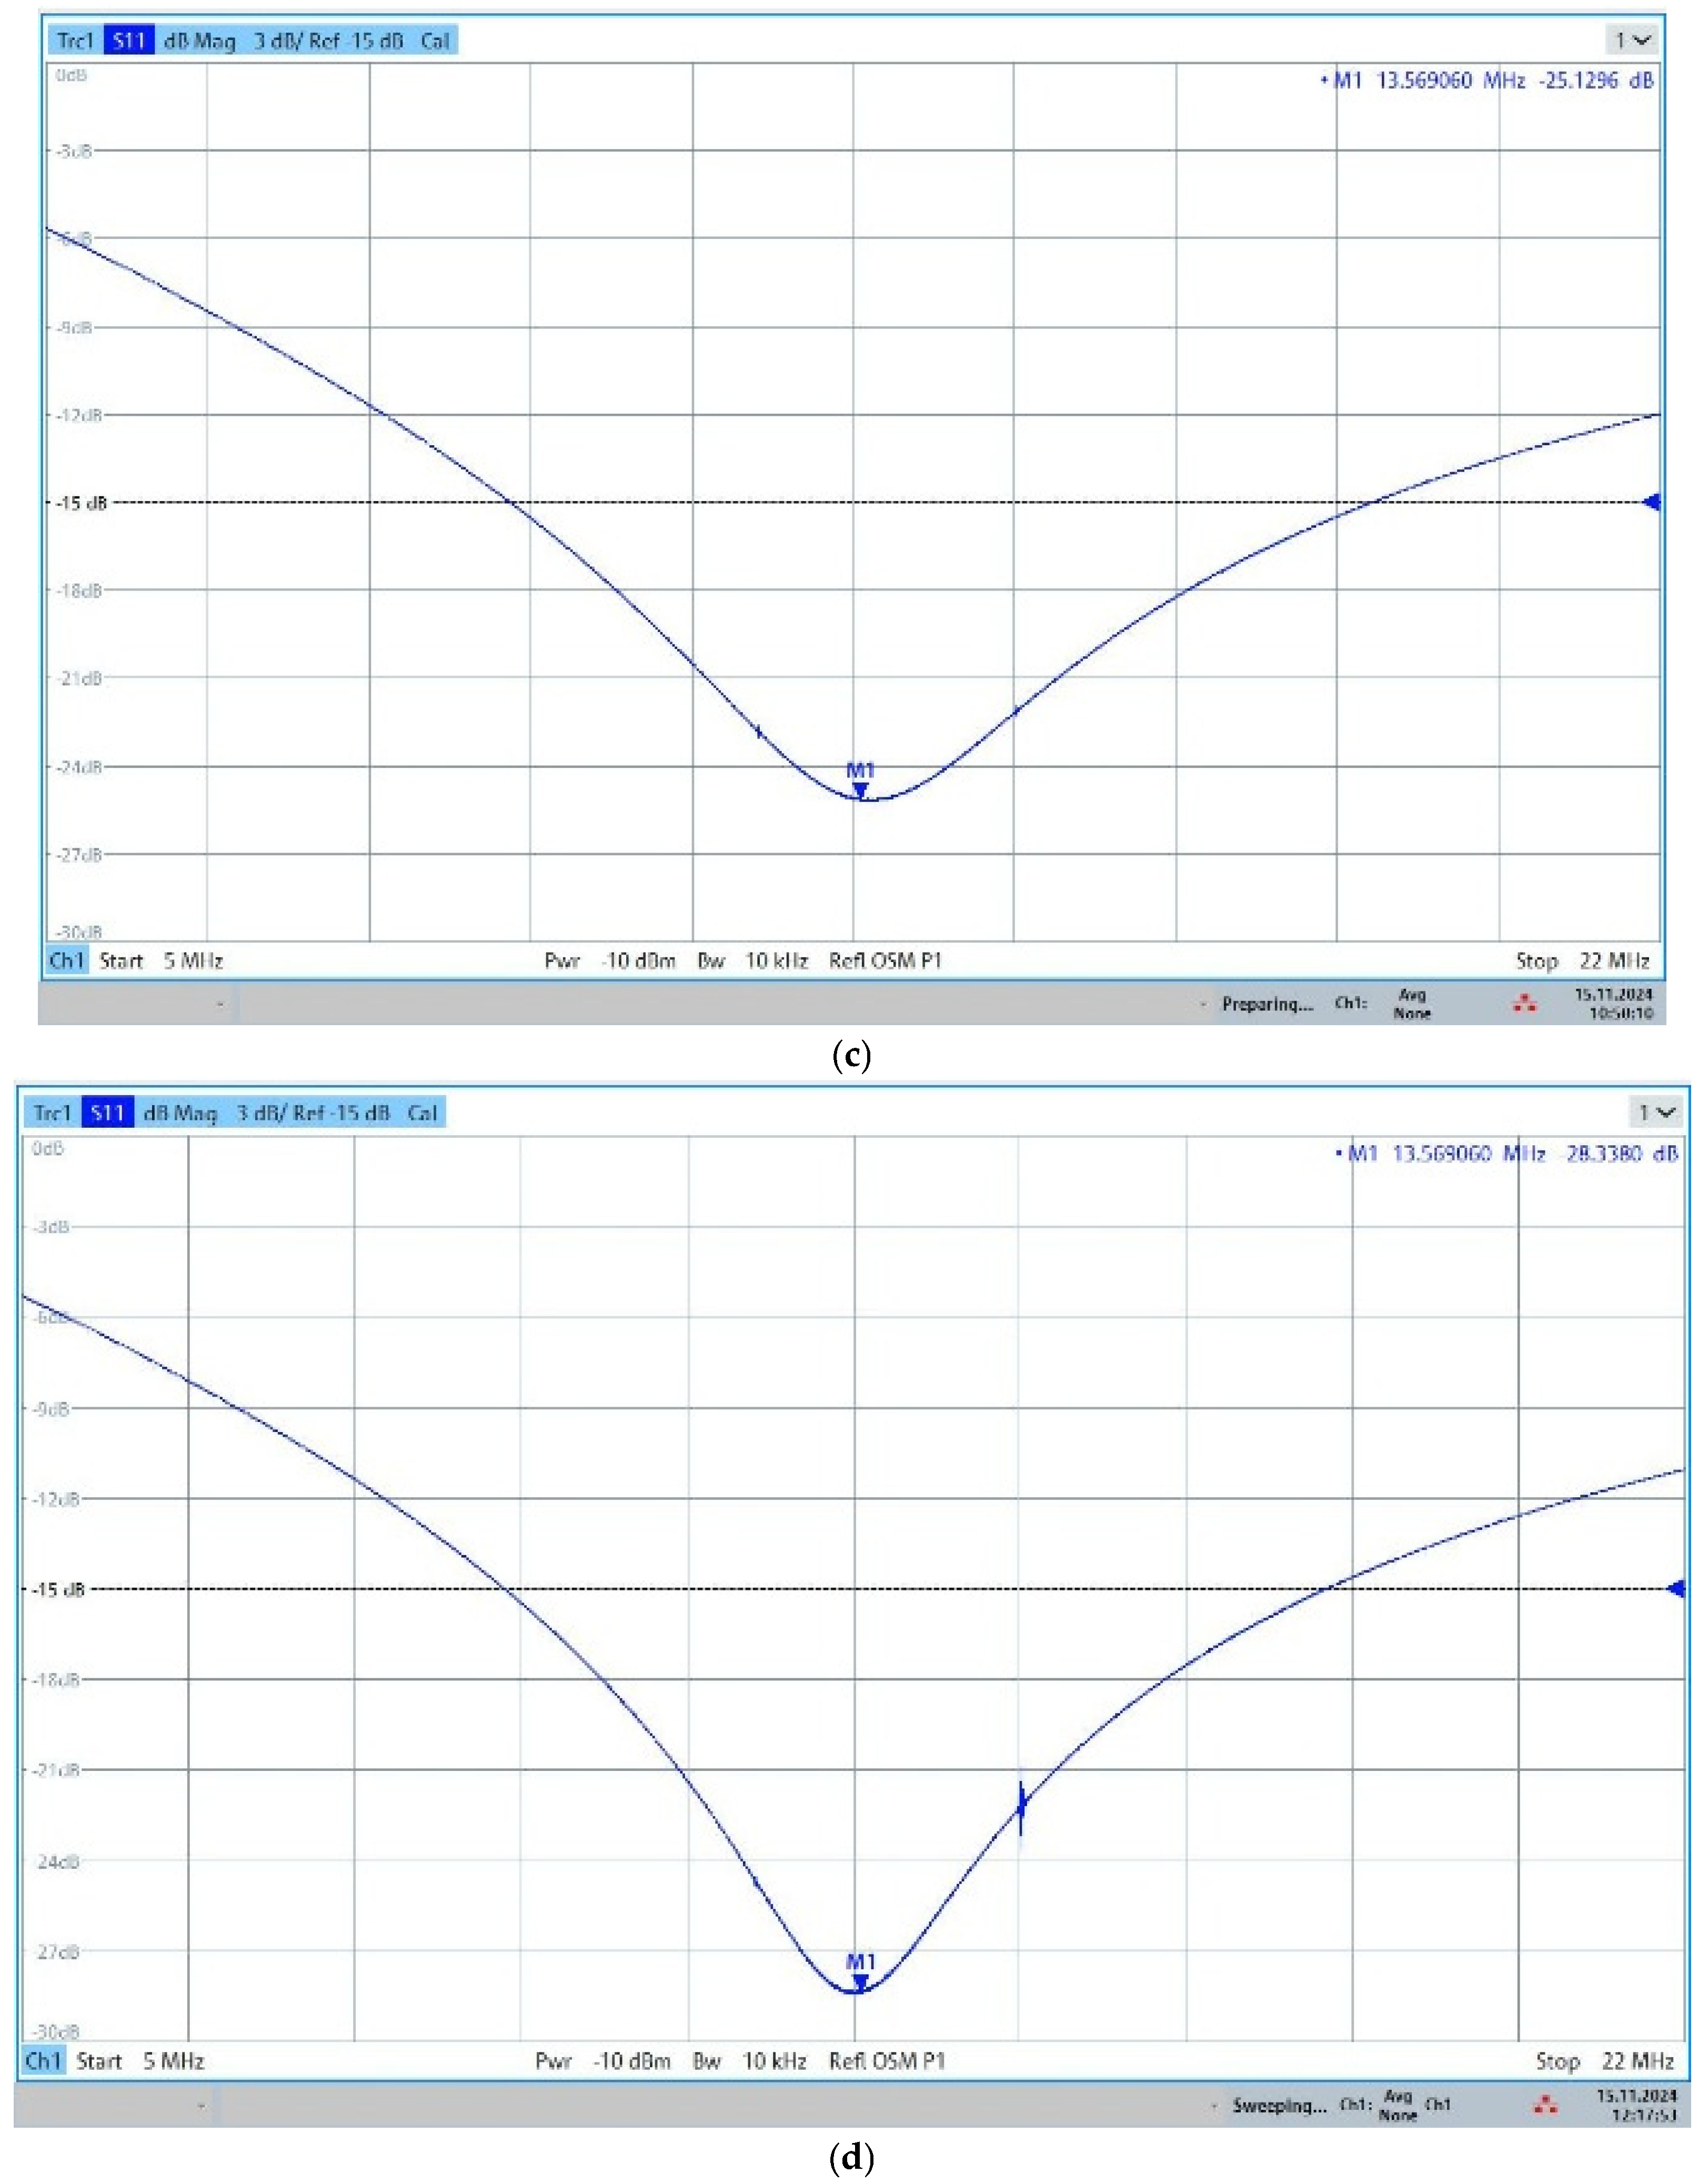
To obtain the resonant frequency, a 50 Ω resistor was added in parallel with the structures and the necessary capacitances; the relevant values, along with those calculated and those obtained by numerical modeling, are found in Table 3. The structures with the connected circuit elements can be observed in Figure 7 along with one of the measurements made to determine the resonant frequency. The results obtained with the help of the Vector Network Analyzer (Rohde&Schwarz, ZNL-20, Munich, Germany) are presented in Figure 8. The calculated values for the capacitance necessary for the circuit to resonate at 13.56 MHz were higher when obtained by numerical modeling, due to the dimensions of the circuit terminals modeled in the Ansys program. However, since the capacitors had specific values, it was possible to approximate this value by analytical calculation or numerical modeling.
The selected dimensions were chosen to satisfy several design constraints simultaneously: resonance at 13.56 MHz, similar external dimensions to ensure a fair comparison, compatibility with commercially available RFID readers, and manufacturability using the LPKF milling equipment. The number of turns, conductor width, and spacing were selected according to analytical inductance equations and subsequently verified by numerical simulations.
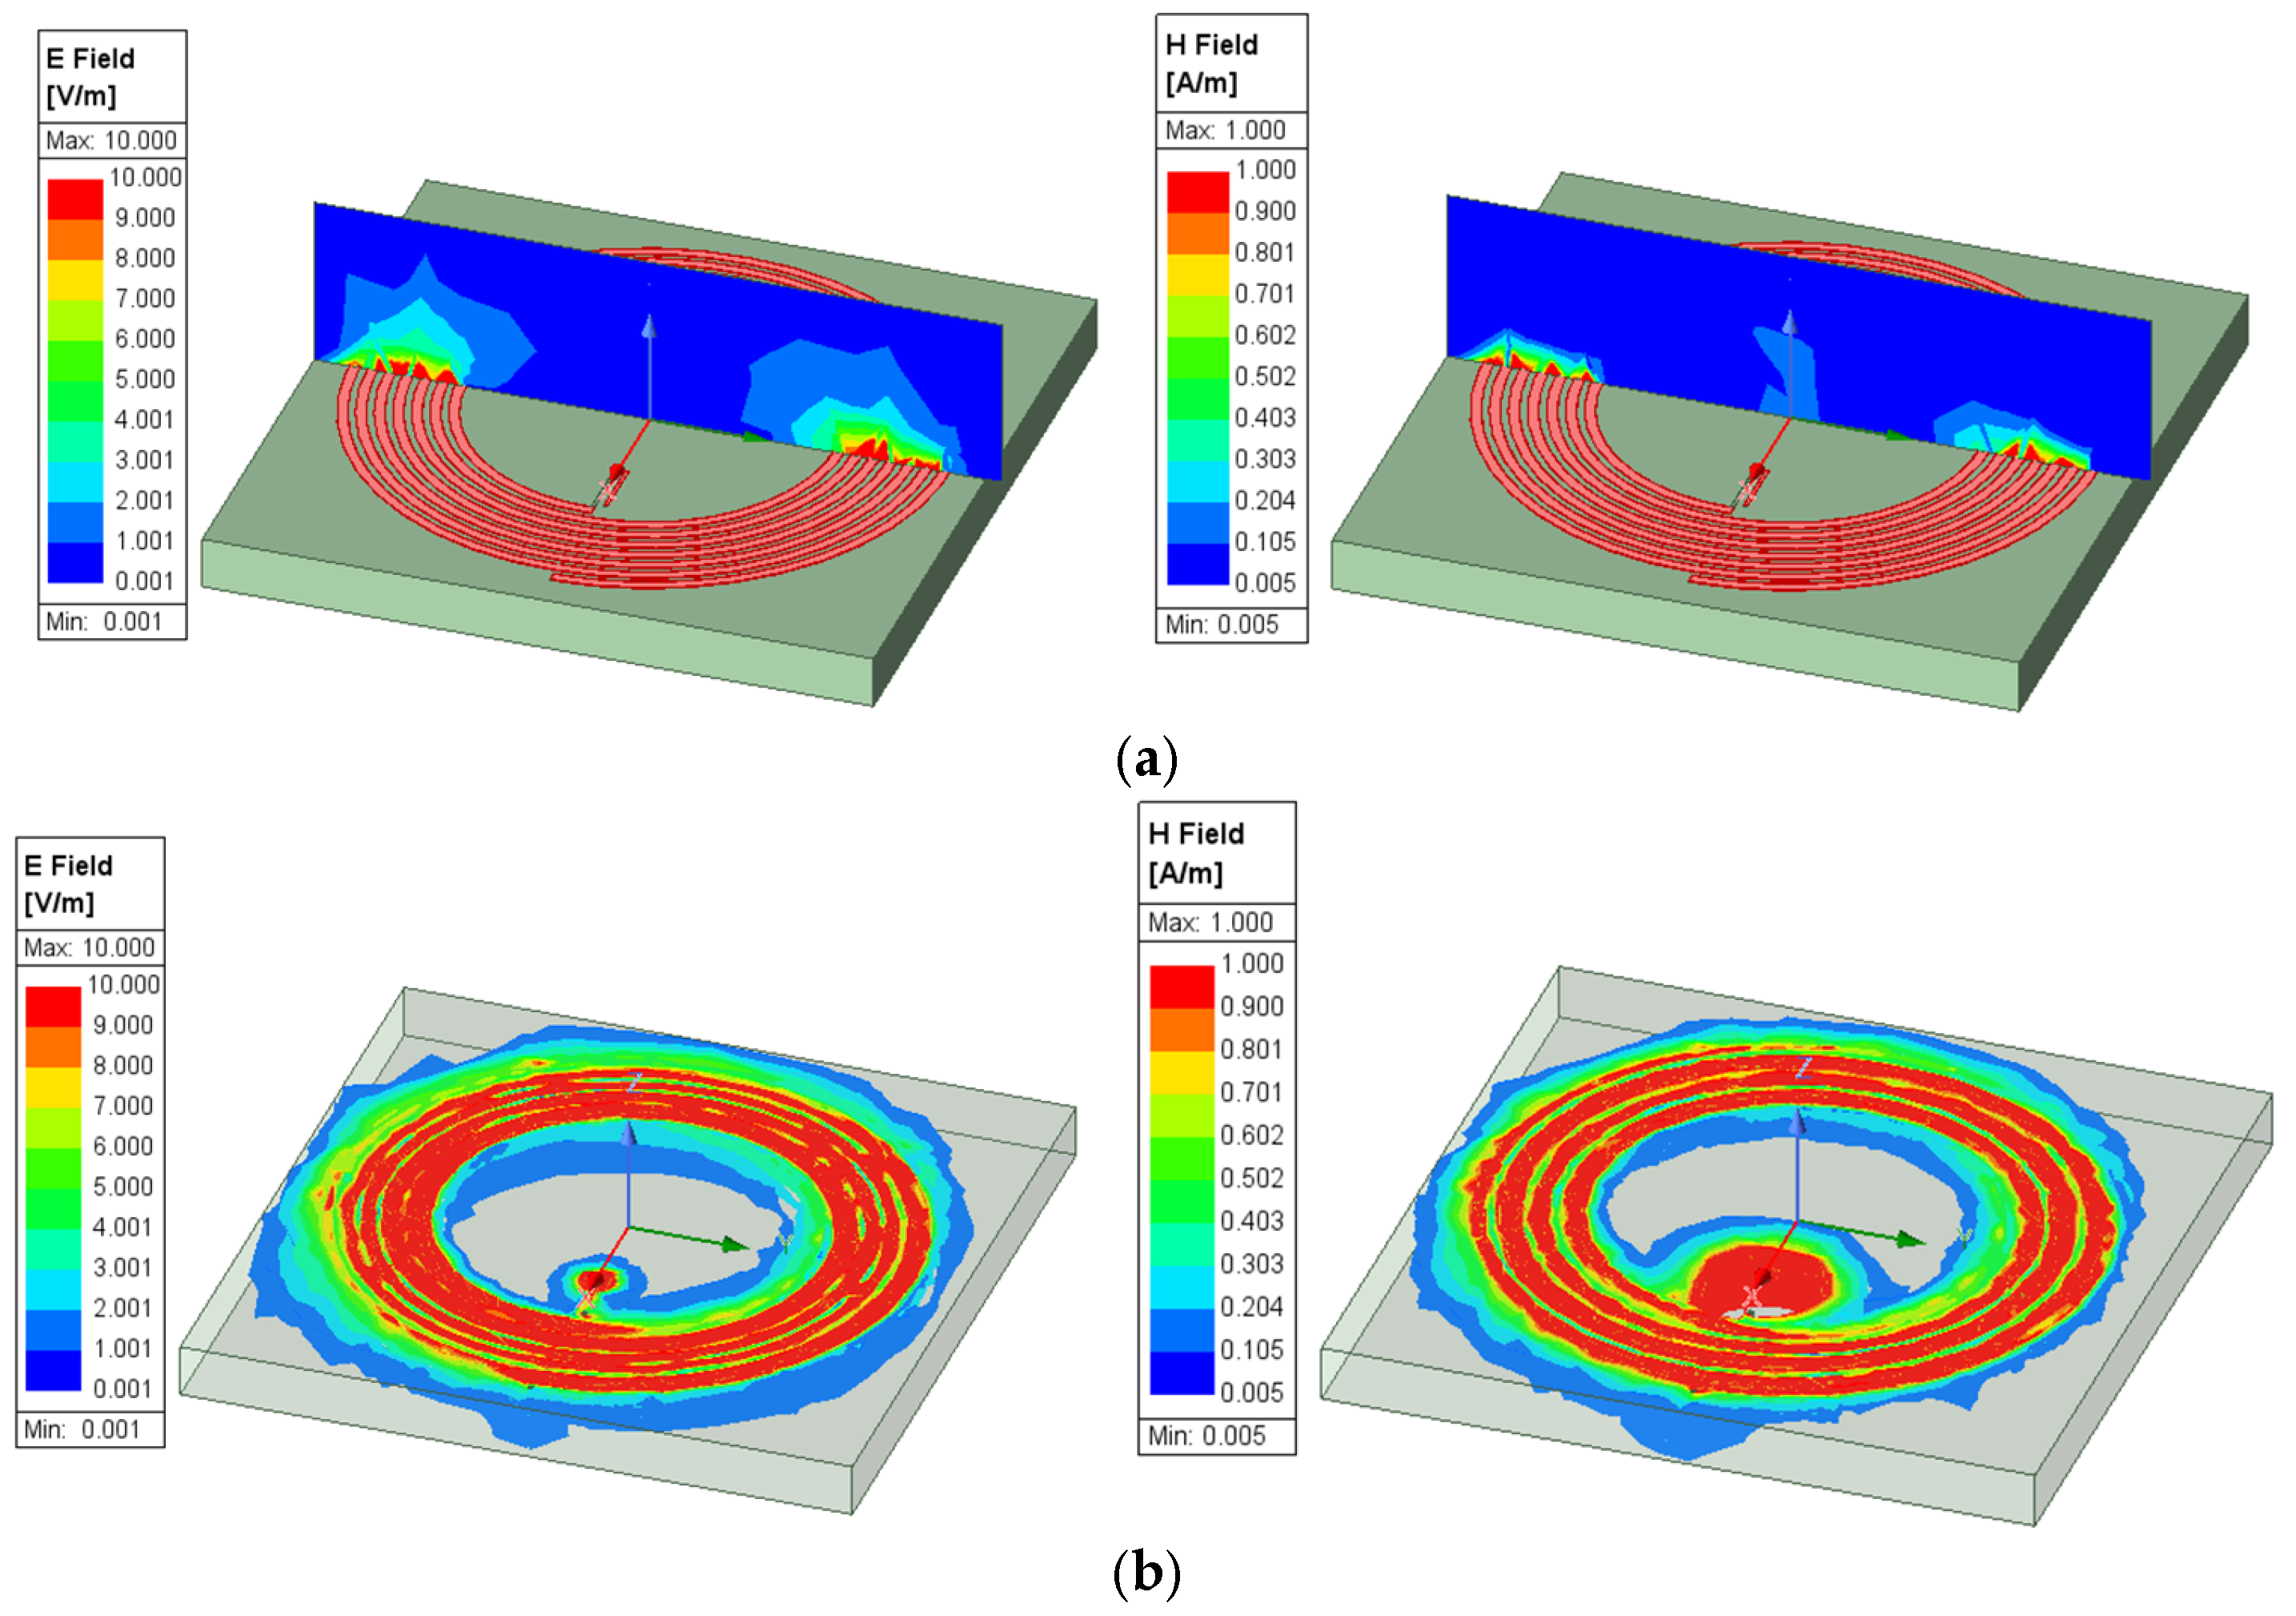
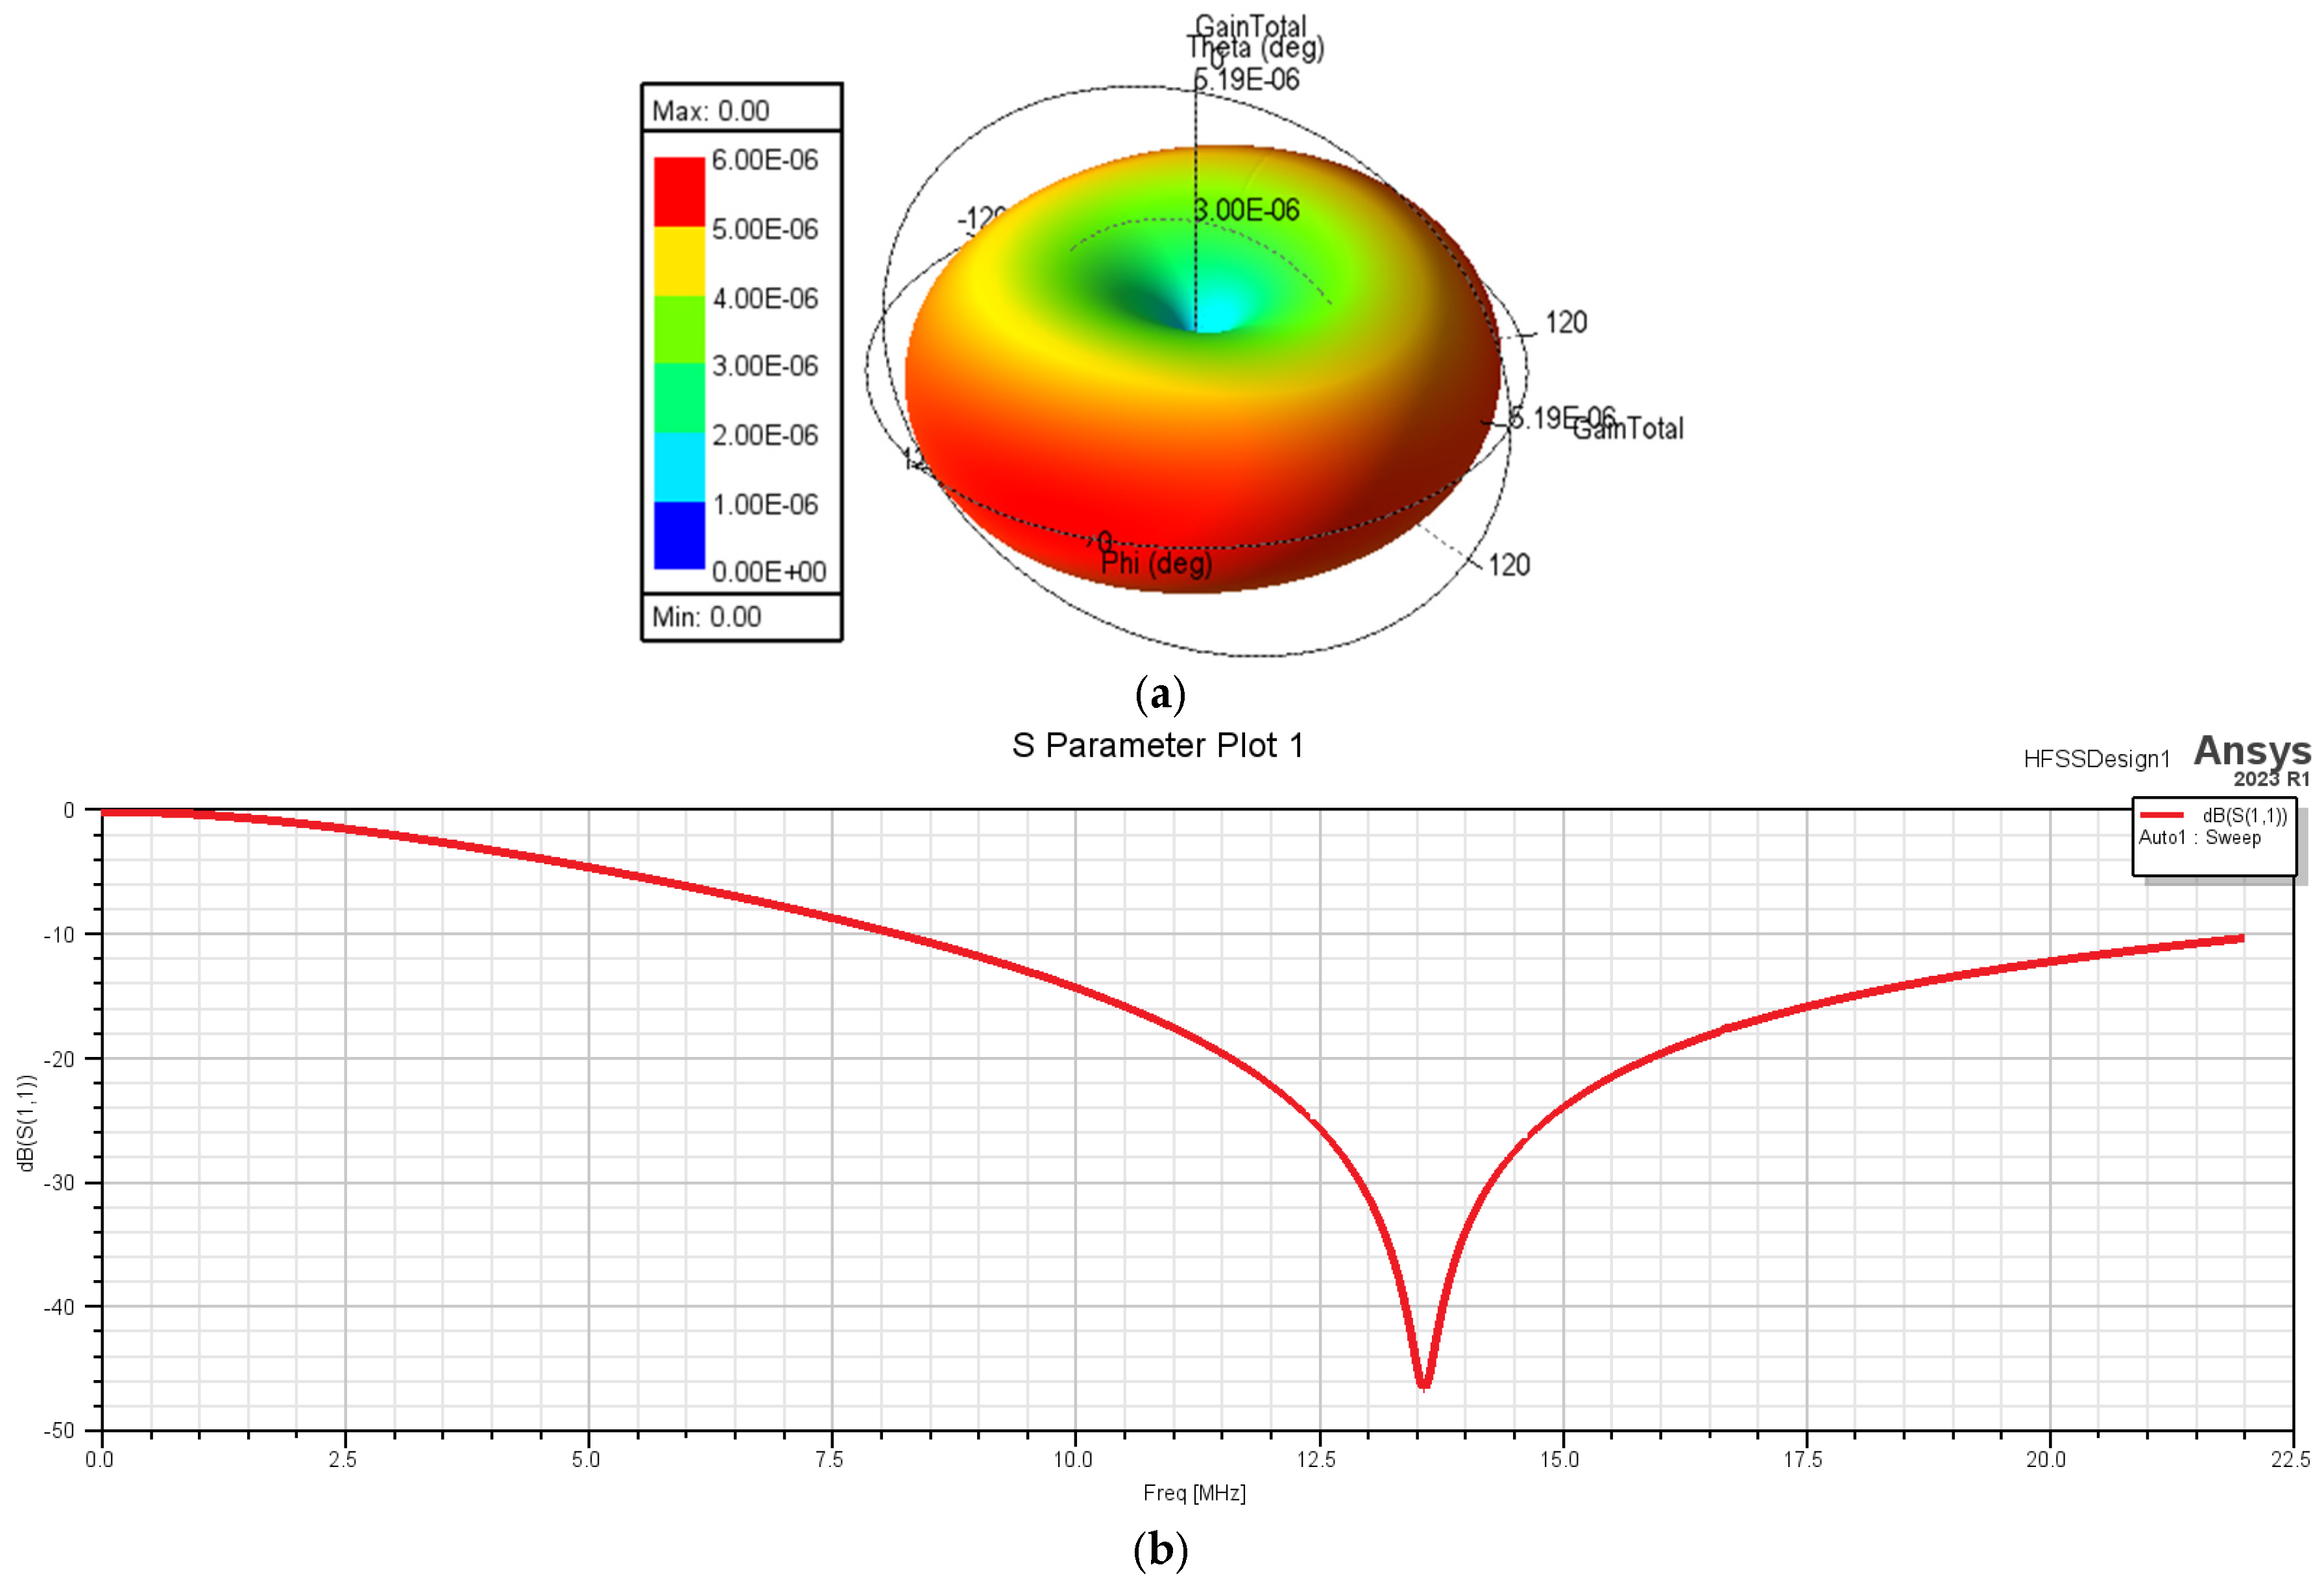
In order to better understand the operation of the tested antennas, the characteristic parameters were determined [20,21,22]. In Figure 9, the electric and magnetic field intensities in the dielectric and in a section above the circular spiral antenna are presented. Only one antenna was considered due to the fact that these parameters are similar to the ones determined for the other shapes of antennas analyzed. The gain and the S parameters of the antenna are presented in Figure 10.
To ensure a fair comparison between the antenna geometries investigated, all structures were characterized following the same experimental protocol. First, each planar spiral antenna was analytically designed using the well-established inductance equations reported in the literature and subsequently modeled in Ansys HFSS. The fabricated prototypes were then measured using an RLC meter to determine their actual inductance values, allowing the analytical and numerical results to be experimentally validated.
Based on the measured inductance, an external capacitor was selected for each structure in order to tune the equivalent parallel RLC circuit to the operating frequency of 13.56 MHz. The resonance frequency was verified experimentally using a Rohde & Schwarz ZNL-20 Vector Network Analyzer by identifying the minimum of the reflection coefficient (S11).
After resonance tuning, all antennas were evaluated using the developed automated measurement platform under identical experimental conditions. The same reader antenna, excitation level, measuring equipment, and environmental conditions were maintained throughout the experiments. The investigated variables were limited to the relative distance, angular orientation, antenna geometry, and environmental temperature, while all other experimental parameters were kept constant. The received signal level measured by the spectrum analyzer was used as a comparison metric because it directly reflects the effectiveness of the inductive coupling between the reader and tag antennas operating in the HF near-field region.
This characterization methodology combines analytical calculations, numerical simulations, electrical measurements, resonance verification, and automated experimental testing, providing a complete and reproducible framework for comparing HF RFID antenna geometries.

2.2. The Construction of the Automized Testing Stand for the Antenna Position Variation

The performance of HF RFID tag antennas is strongly influenced by the inductive coupling between the reader and the tag antenna. This coupling depends on several key parameters, including the distance between antennas, their relative orientation, and their geometric configuration. In order to experimentally evaluate the influence of these parameters under controlled conditions, a dedicated automated test setup was developed. The purpose of this system is to enable precise and repeatable variation of the relative position and orientation between the reader and the tag antenna, while measuring the received signal level. Conventional measurement approaches do not allow fine control of these parameters or may introduce measurement errors due to human interaction. Therefore, an automated and remotely controlled platform was designed to ensure measurement repeatability, accuracy, and minimal external interference. This setup directly supports the investigation of inductive coupling behavior in HF RFID systems, allowing the analysis of how geometric and positional factors influence energy transfer and communication performance.
The objective of this study is not to isolate the influence of antenna geometry as the only design variable. Instead, the proposed comparison considers representative planar spiral antennas designed according to commonly used HF RFID design practices and tuned to the operating frequency of 13.56 MHz. Consequently, parameters such as conductor length, inductance, resistance, and tuning capacitance differ among the investigated geometries, reflecting practical antenna implementations rather than idealized geometrical models. Therefore, the reported results should be interpreted as a comparative assessment of practical antenna designs rather than a study of geometry as an isolated parameter.
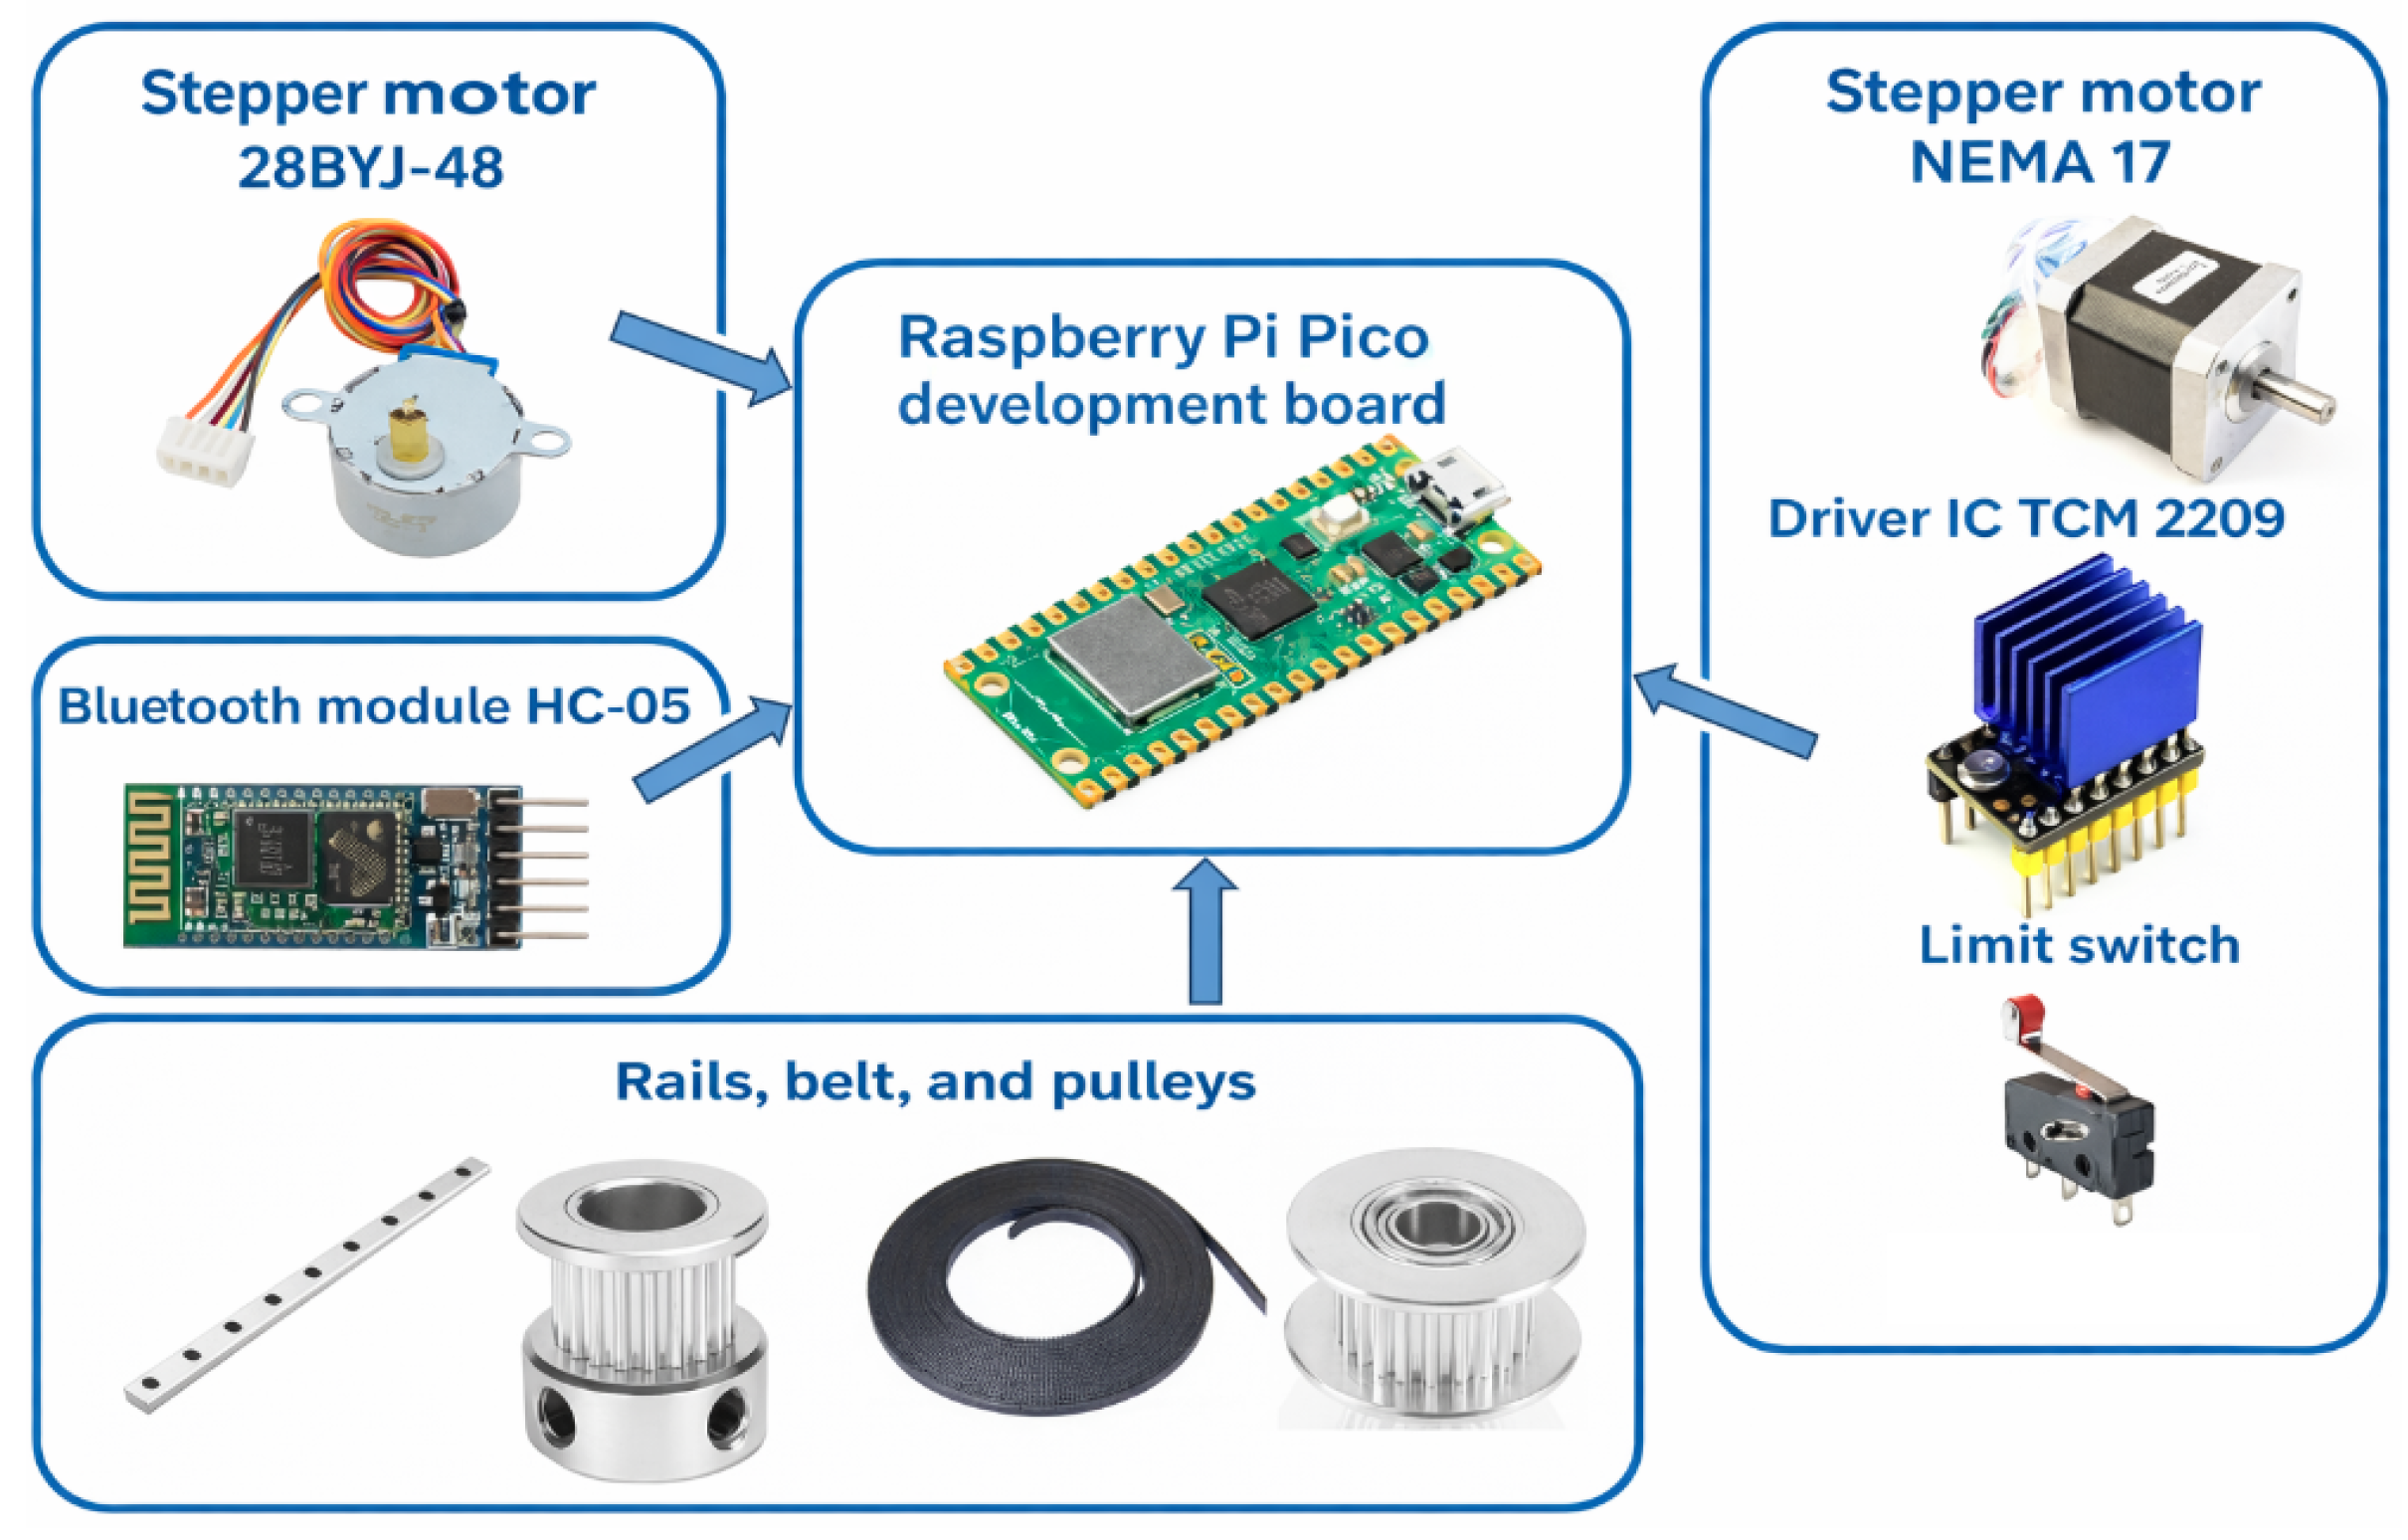
It was demonstrated in previous studies that the antenna positioning and geometry are very important [12,13,14,15,16], especially when two antennas must communicate between each other. This is the reason why the authors decided to create an automated test setup that is precise and easy to manufacture, implying small manufacturing costs, which can be easily integrated in the laboratory. Also, the stand is easy to move, having a small mass, and it is able to integrate other equipment. To achieve this objective, the use of a Raspberry Pi Pico (Cambridge, UK) development board was considered. This type of board is affordable while offering remarkable flexibility. It is equipped with a 2.4 GHz wireless interface and includes the following key features: an RP2040 microcontroller with 2 MB of flash memory, a micro-USB port, a wireless interface, and a 40-pin PCB with compact dimensions of 21 mm × 51 mm × 1 mm.
In addition to this basic component, the stand requires two stepper motors, namely 28BYJ-48 and NEMA17. The 28BYJ-48 motor is a small 28 × 19 mm motor powered by 5 V, whose speed and direction can be easily controlled, suitable for easily controlling the positioning of one of the RFID antennas that will be positioned on its rod using a support built specifically for it using a 3D printer. With the help of this motor, the angle between the two antennas can be changed.
The second NEMA 17 motor is a higher torque motor recommended for automation and/or robotics projects. It is used to change the distance between the two RFID antennas. This motor is used in combination with the TMC2209, which is a bipolar stepper motor control integrated circuit, known for its ultra-quiet operation. One of the antennas is positioned on rails, placed in a support created using a 3D printer; the motor moves this support using a belt on pulleys. Because we wanted the assembly to stop at the ends of the stand, a limit switch was also introduced so that this circuit could detect the ends. For the easy control of this assembly with a mobile phone, a Bluetooth module HC-05 was also added. All these components were part of the test stand and can be seen in Figure 11.
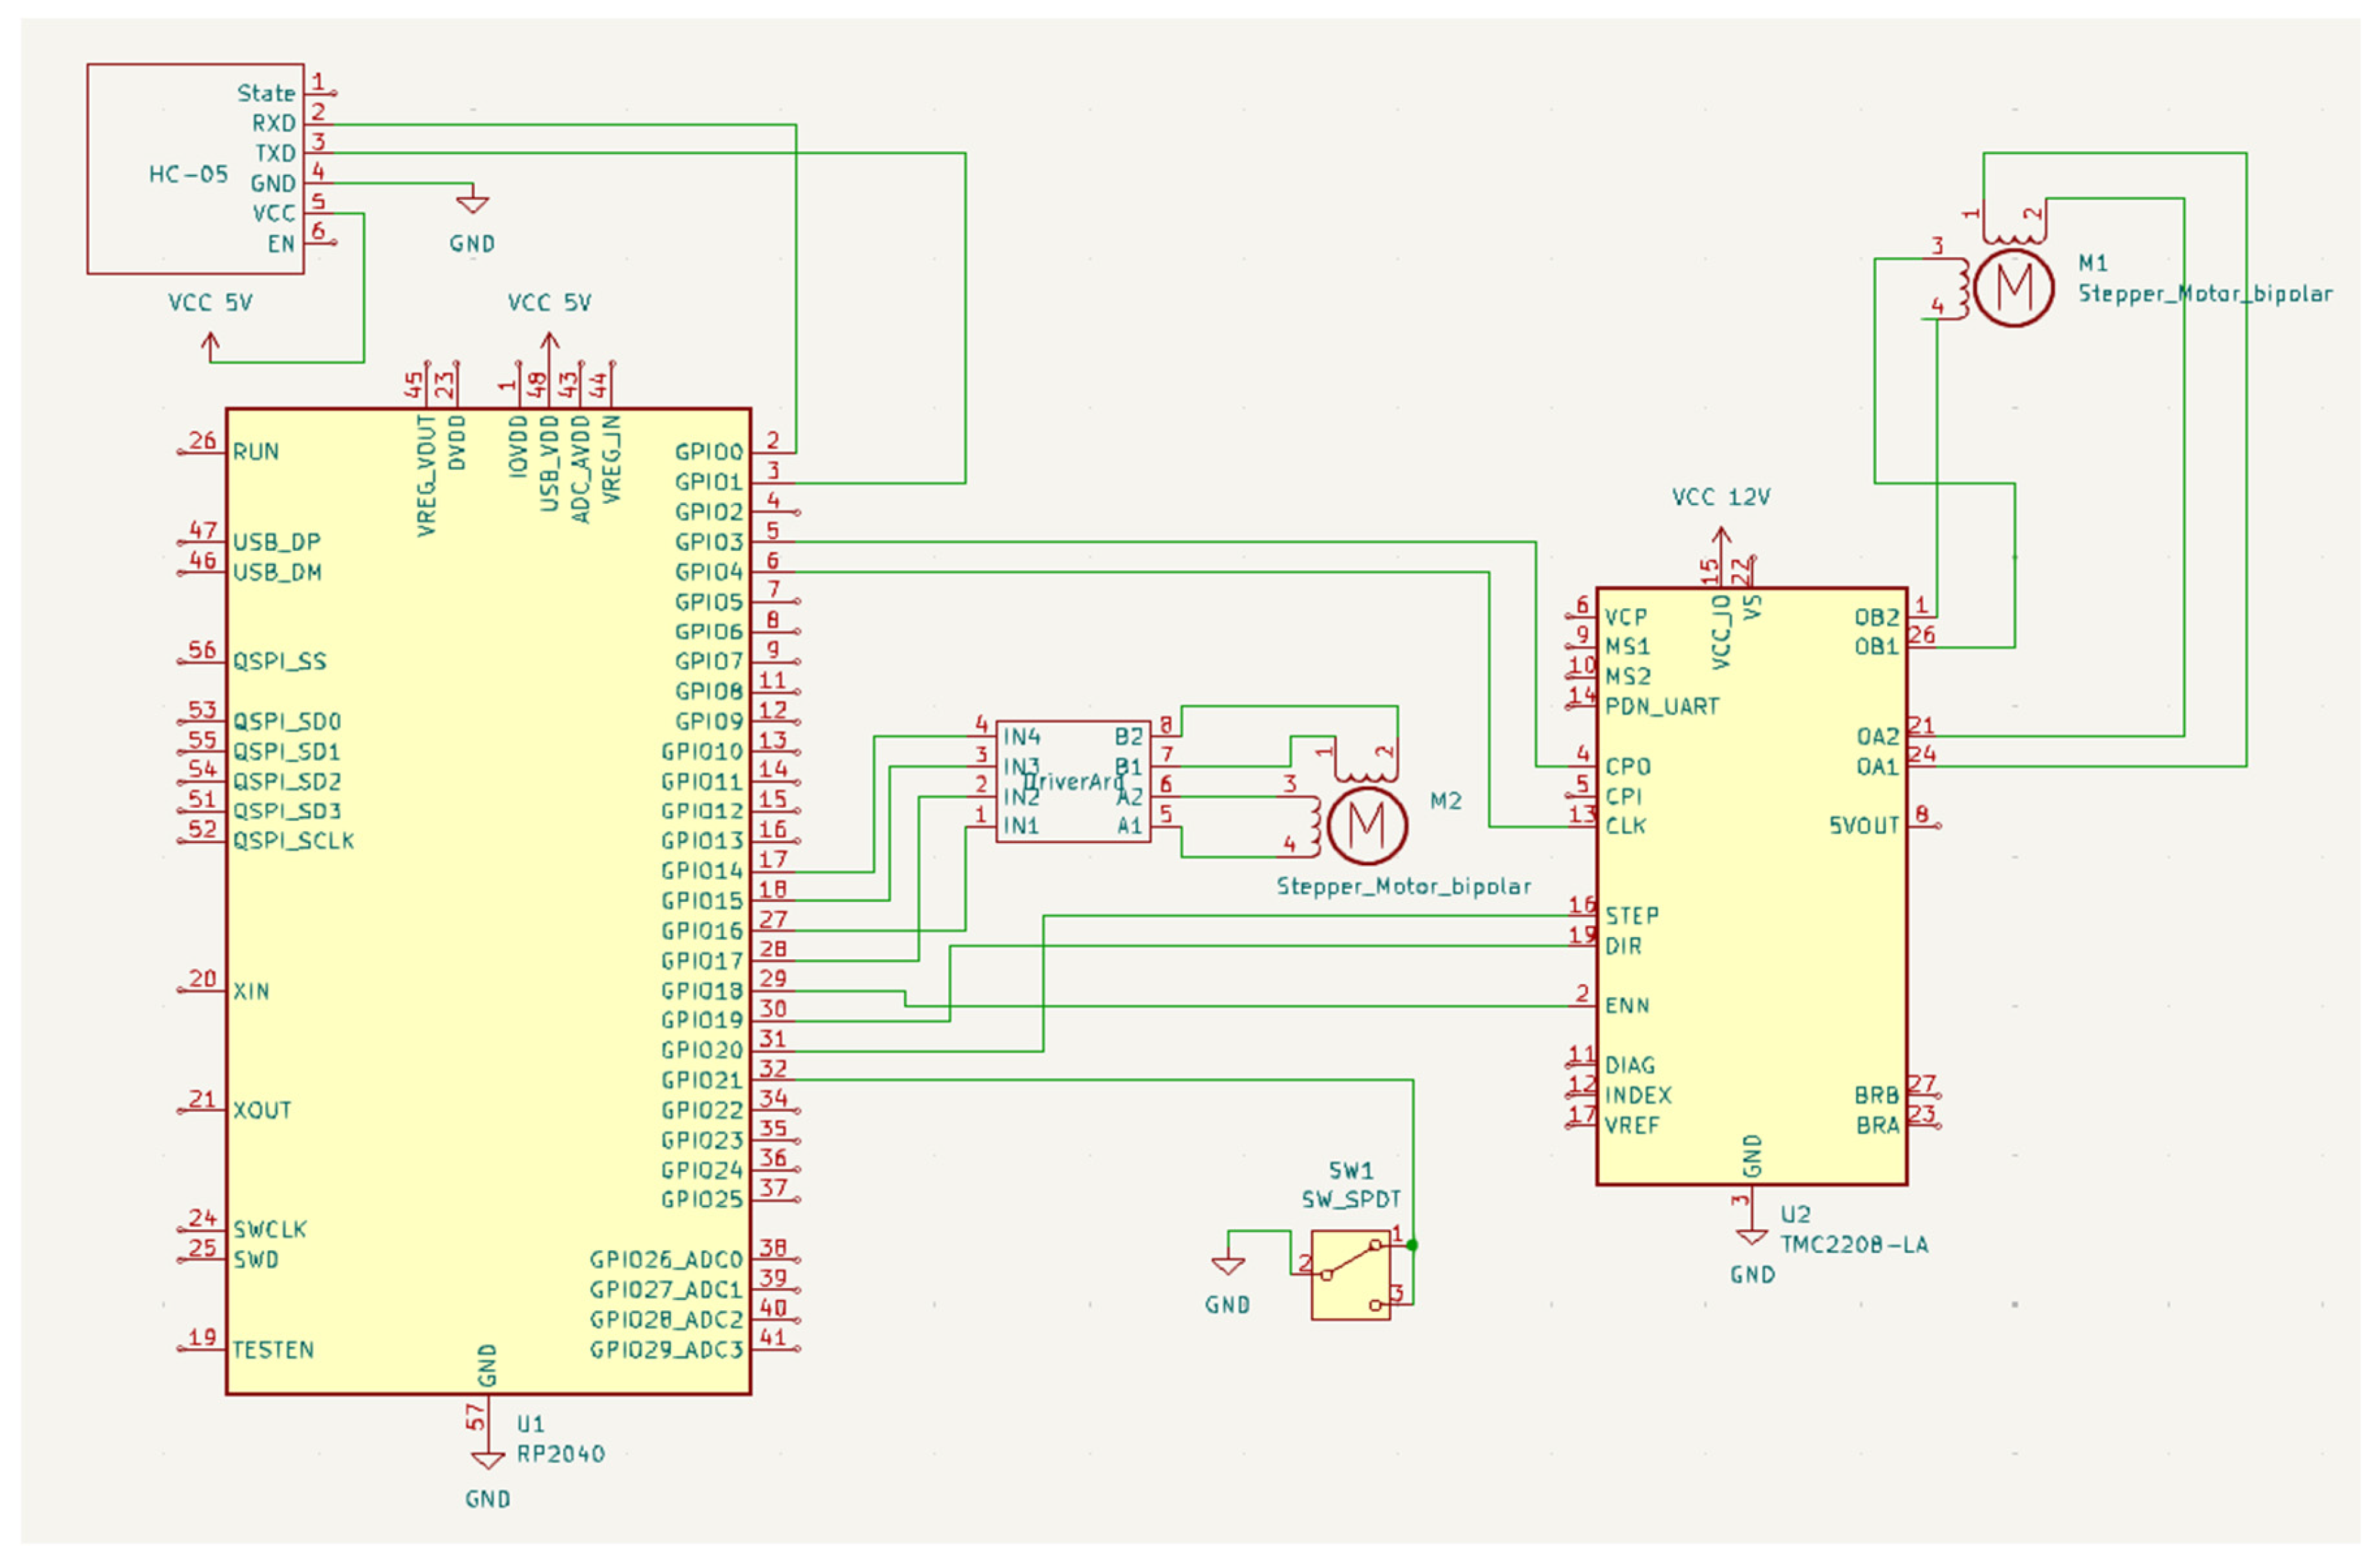
The electrical schematic diagram with all the connections of the test stand can be seen in Figure 12.
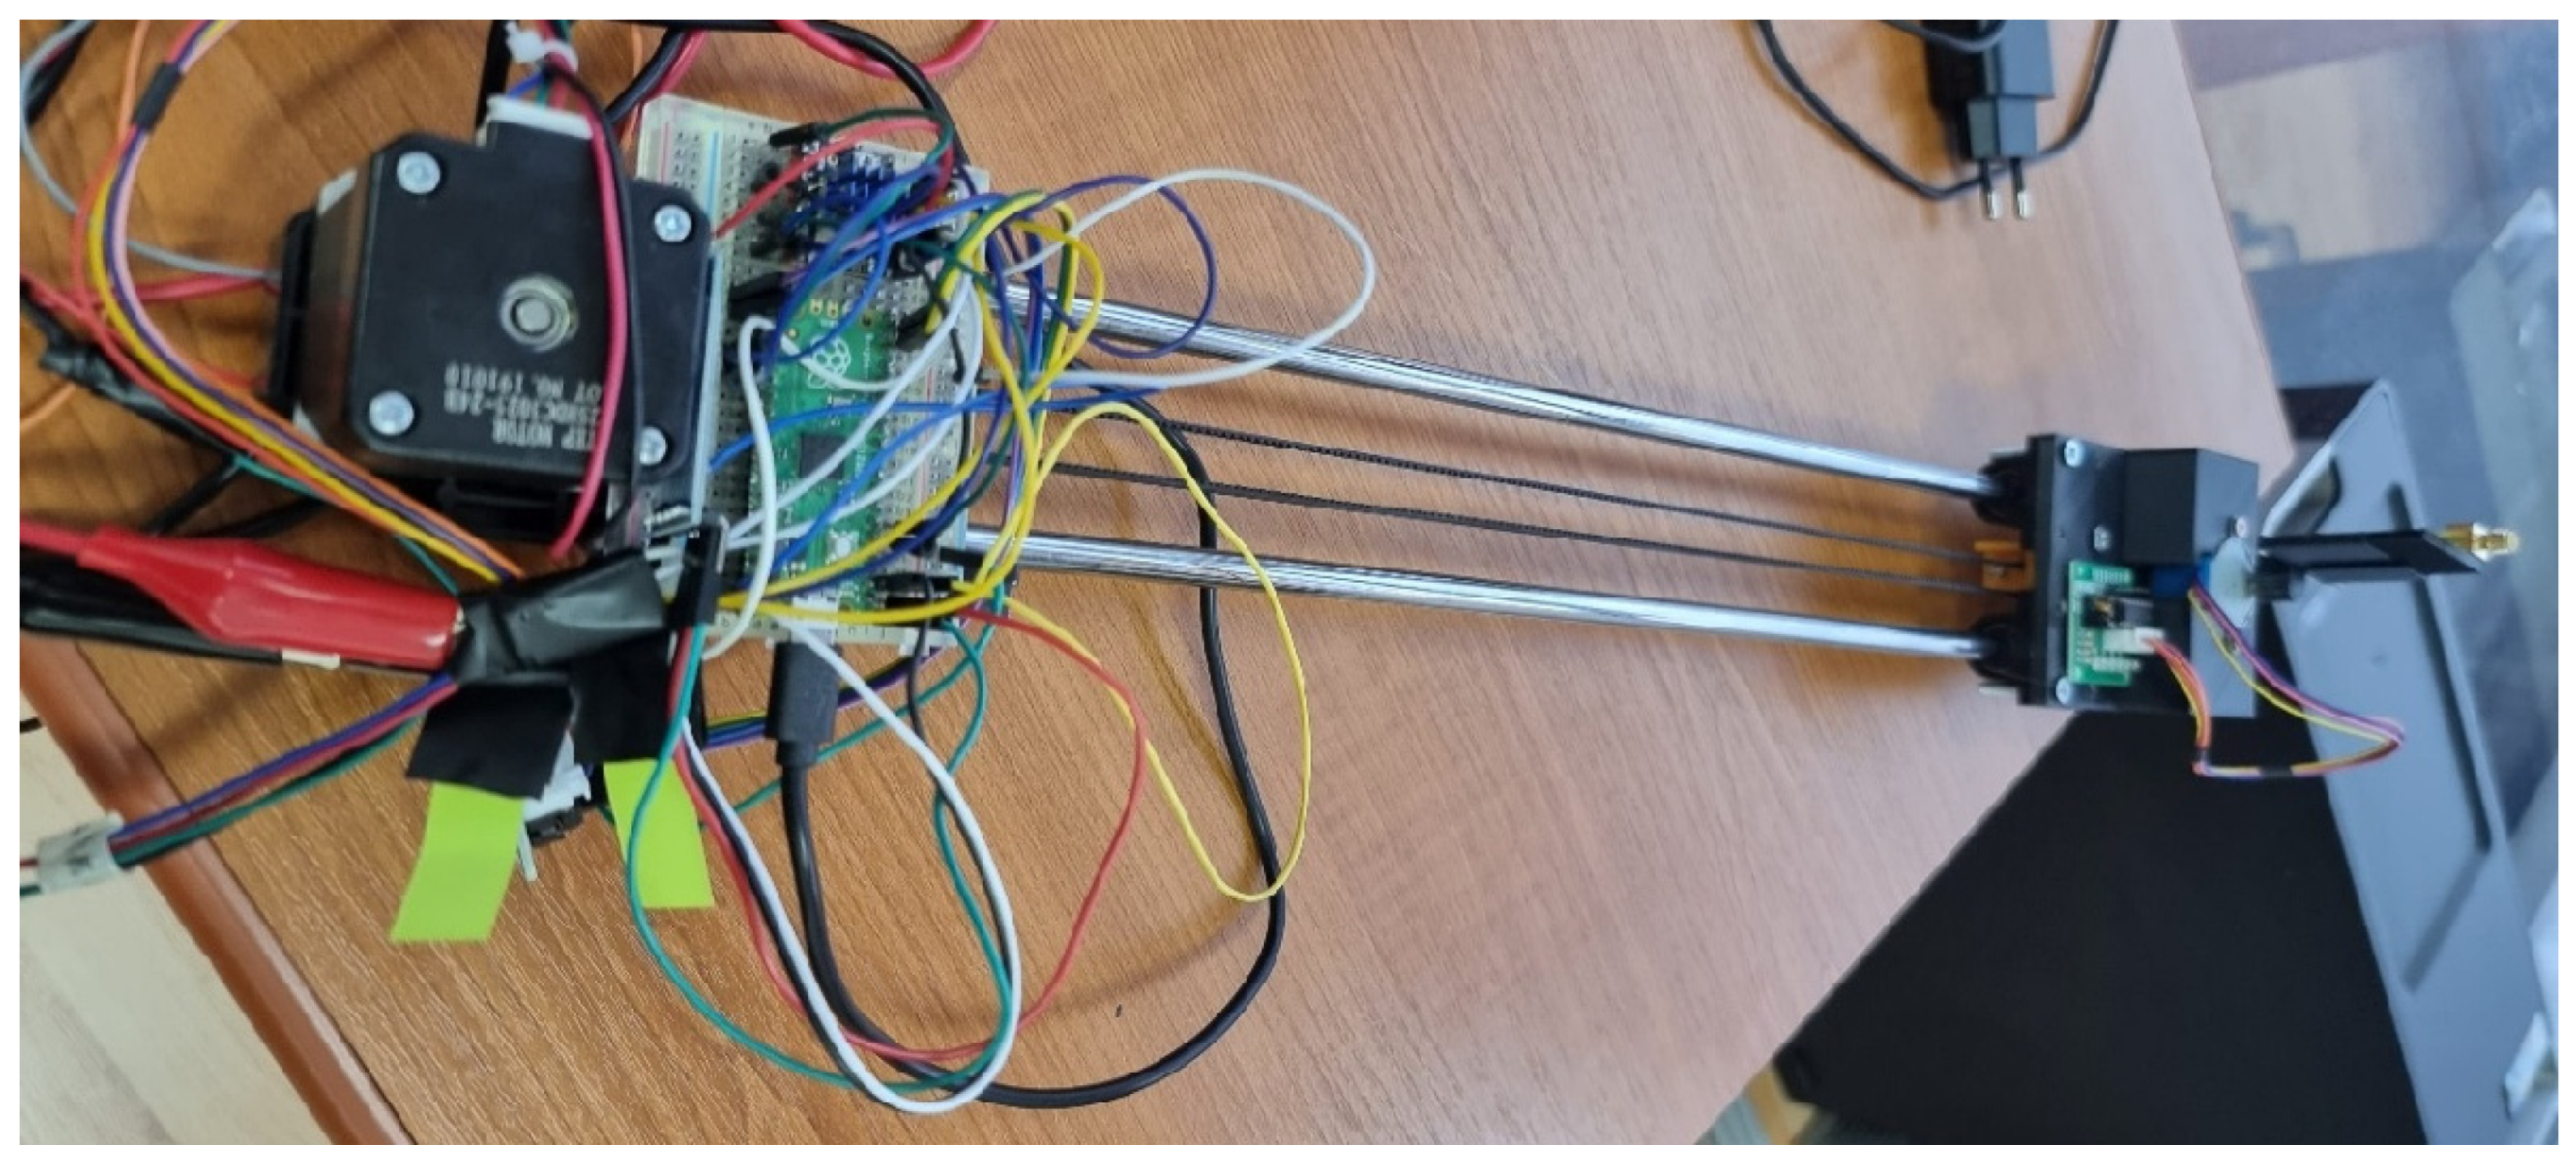
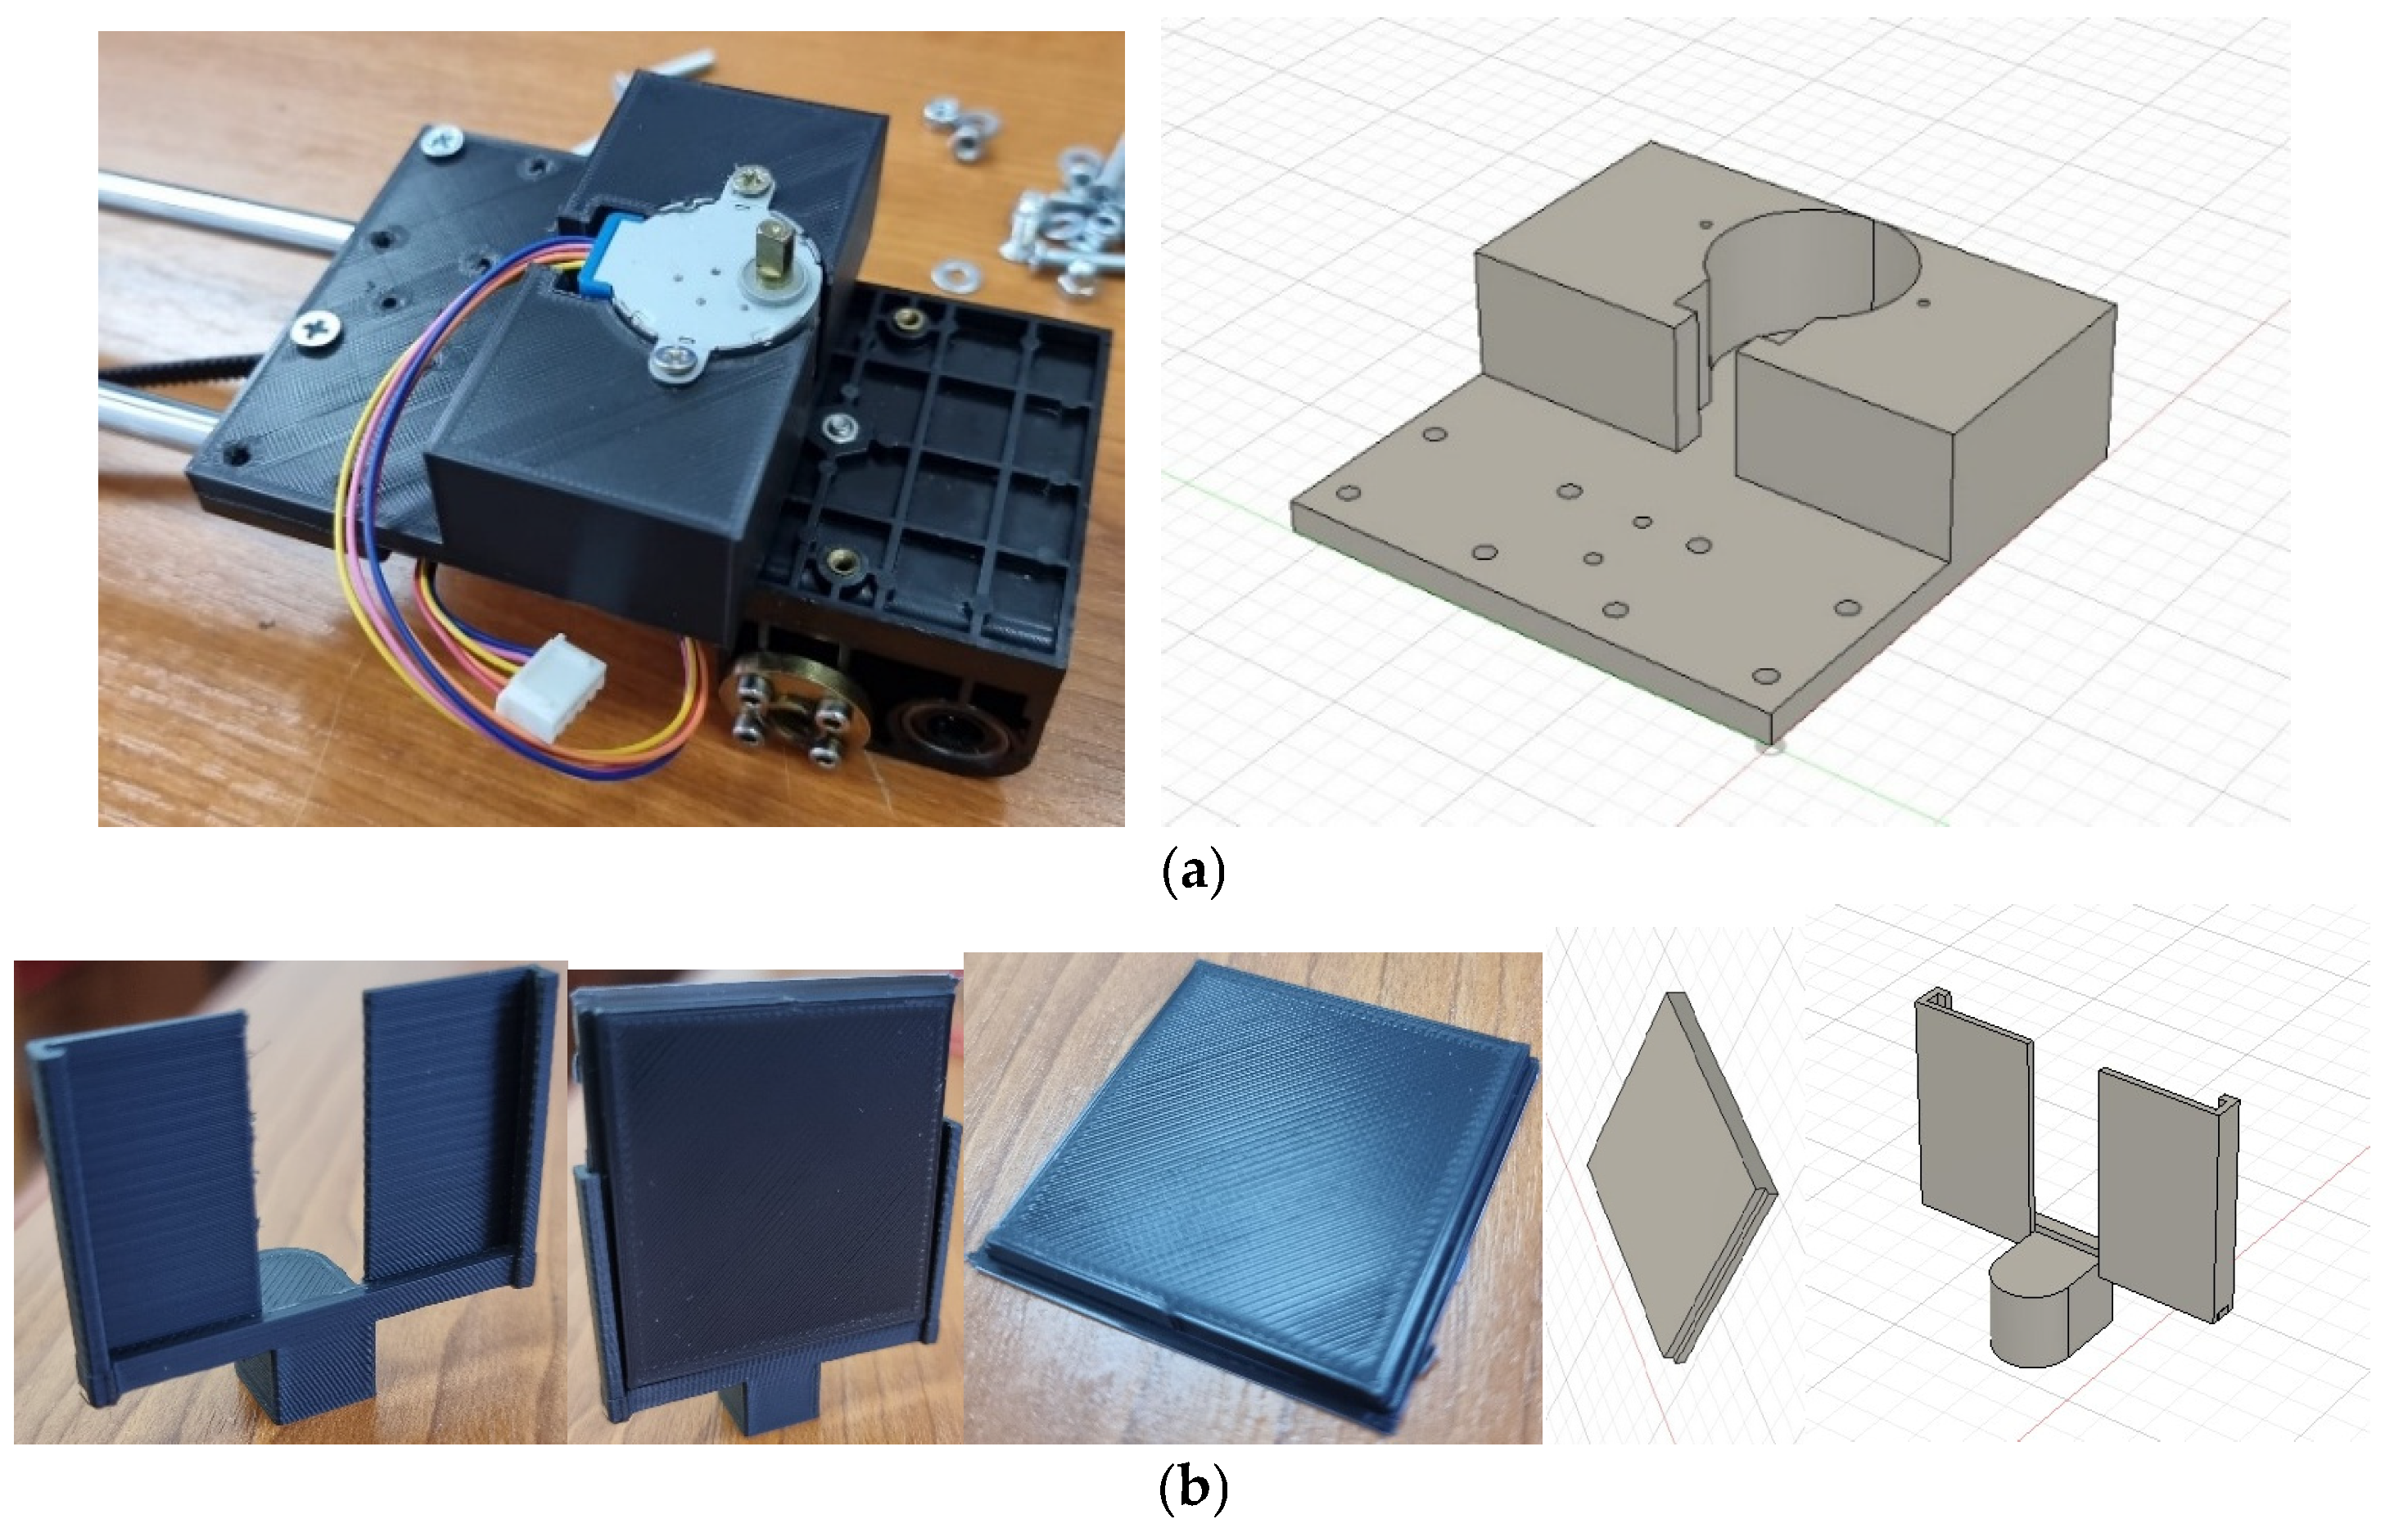
The constructed test stand can be seen in Figure 13. Part of it was created using a 3D printer for a better positioning of the antenna [23,24,25]. The authors created a support for the step-by-step motor and also, based on the dimensions of the antenna to be tested, created a support to place the antenna on top of the motor. The support for the antenna was created to accommodate the wires; it can be designed differently by users to suit the antennas to be tested. The 3D components can be seen in Figure 14. The antenna support has a special design so that the structure, which is fragile due to its small dimensions, is protected and well fixed to the stepper motor.

2.3. Creation of the Mobile App in Charge of the Test Stand Control

MIT App Inventor is an intuitive and visual programming environment that was first initiated by Google, and in 2012 it was taken over by MIT (Massachusetts Institute Of Technology), part of the MIT Center for Mobile Learning. With the help of this environment, complex applications can be created in a short time, using the block-based tool, which is noticeably easier to use compared to competing programming programs. The MIT App Inventor interface includes two main editors: the design editor and the block editor. The design editor is a drag-and-drop interface that arranges the elements of the application interface to look the way the creator wants. The block editor is an environment where the creator of the application can visually present the logic of the applications using color-coded blocks that fit together like puzzle pieces to describe the program. The code of the blocks is usually read from left to right, from top to bottom.
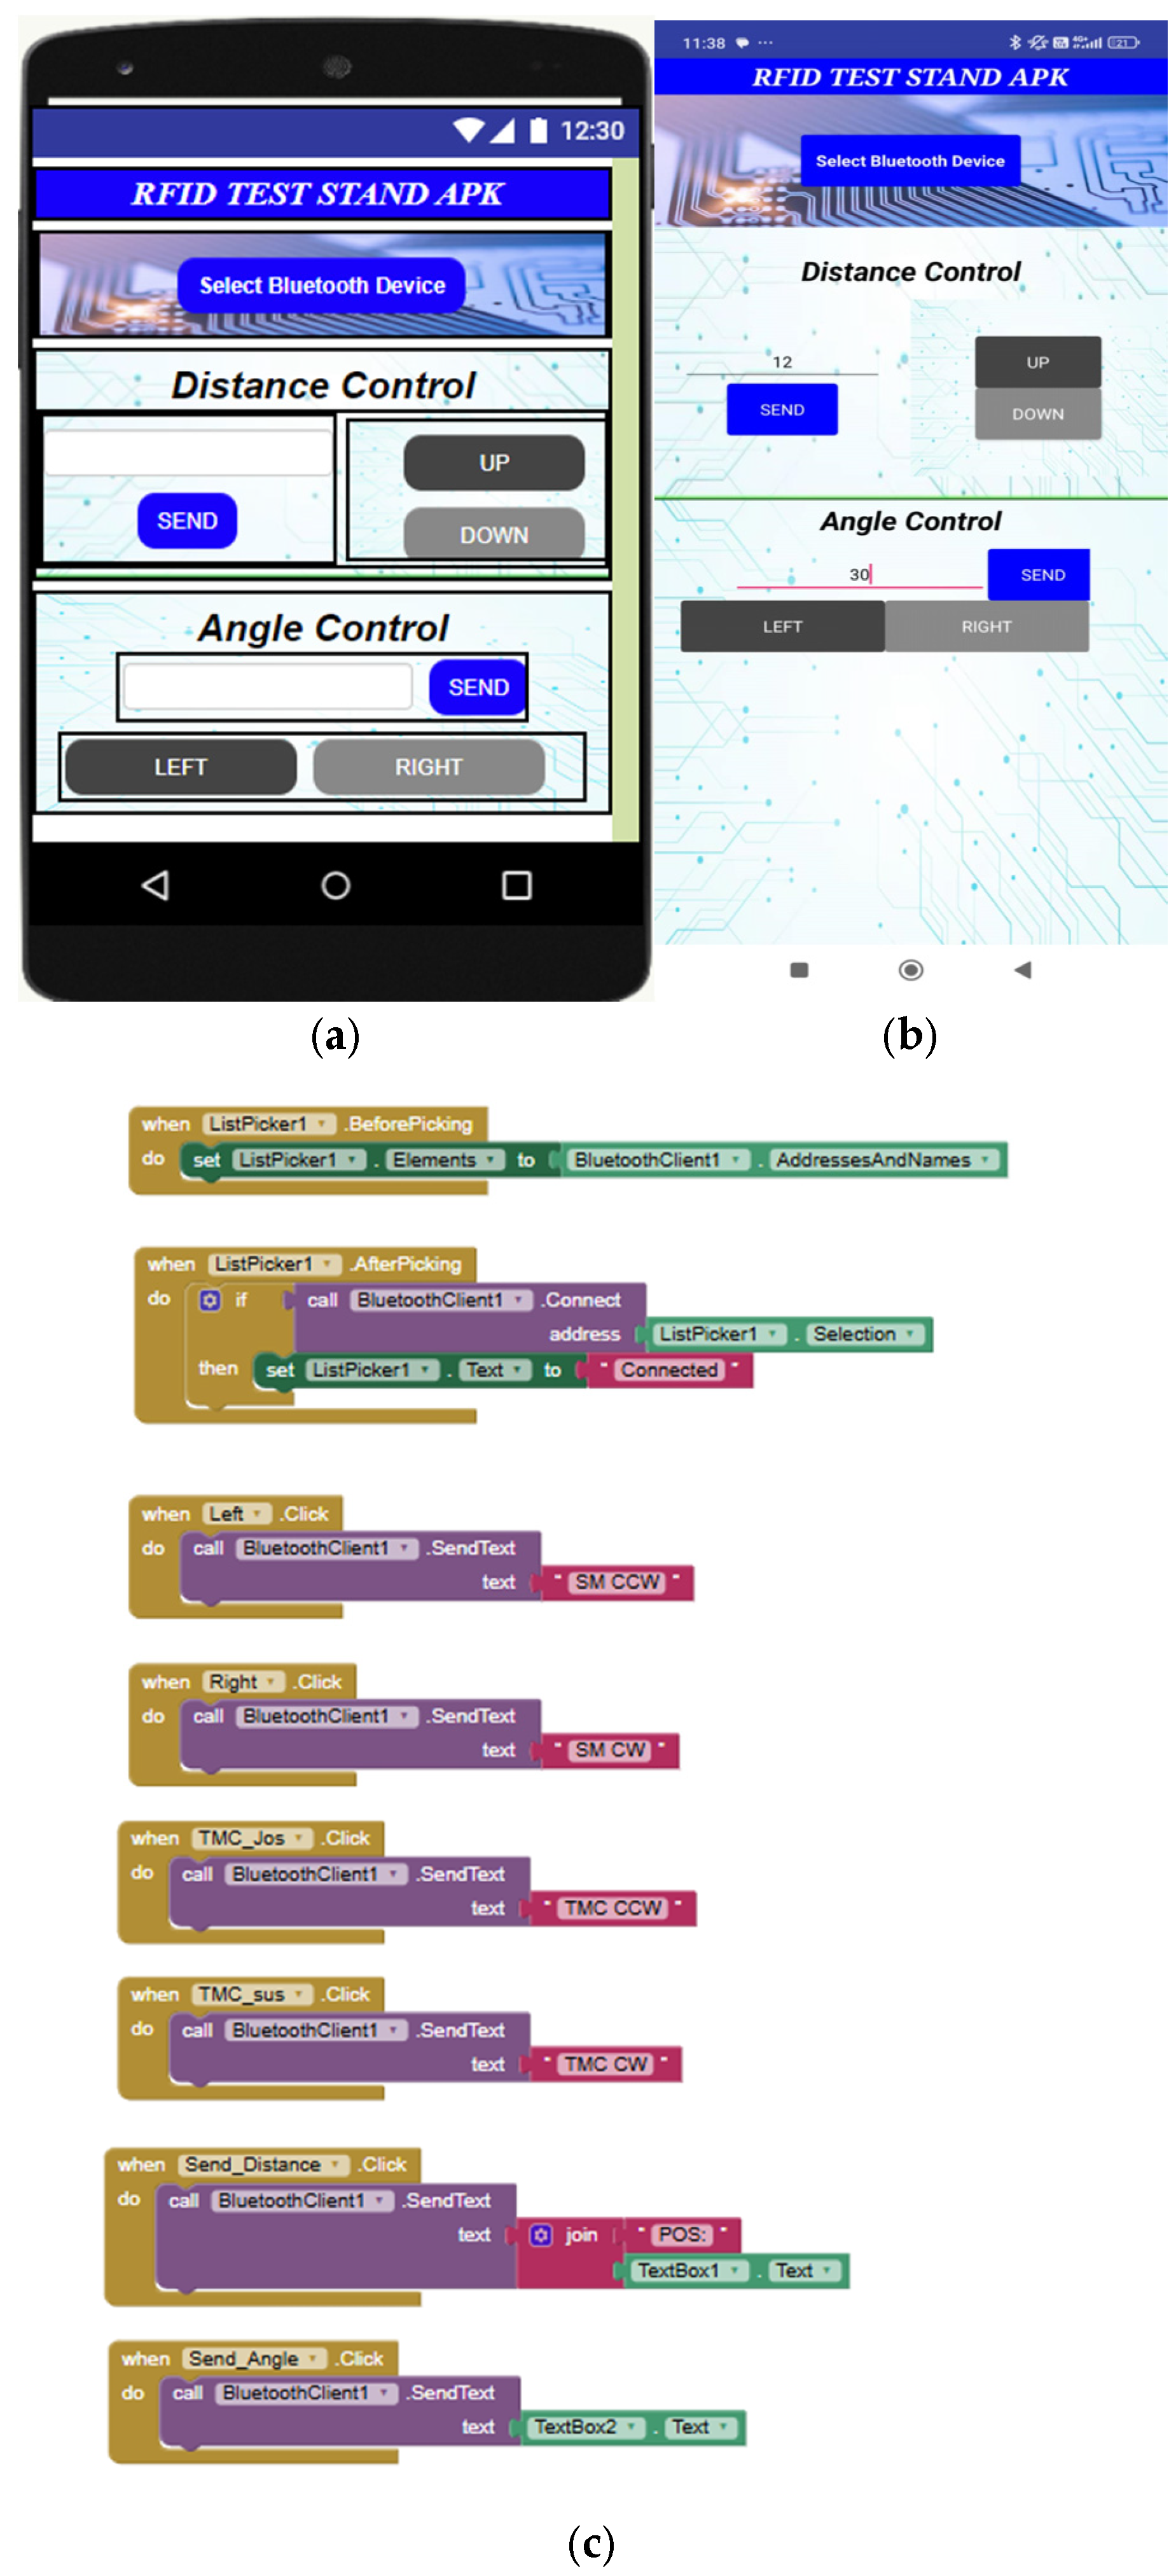
For remote control of the test stand, the application has been created with an interface that can be seen in Figure 15a. From this interface, the application can be connected to the Bluetooth module by pressing the Select Bluetooth Device button. There are two sections of this interface that control the two motors. Thus, in the Distance Control section, the user can control the distance between the two antennas under testing with a predefined step by pressing the up and down buttons. The possibility of moving directly to a desired distance between the antennas is also integrated in the application and is achieved by writing the distance in mm in the box on the left and pressing the send button. If a change in the angle of the antenna placed above the 28BYJ-48 stepper motor is desired, the user must go to the second section, namely Angle Control, where the left and right buttons rotate the antenna with a predefined step. If the user wants a precise change to a specific position, it can be written directly in the box on the left, after which the send button should be pressed. In Figure 15b, the block editor with the code that was created for this application can be seen.

2.4. Testing of the Influence of Environmental Factors on the RFID Antenna Performance

The influence of temperature on inductively coupled systems has attracted increasing attention in recent years. Although thermal effects have been extensively investigated for high-power wireless power transfer systems, where coil misalignment may significantly increase power losses and temperature rise, similar environmental considerations are also relevant for low-power inductively coupled systems such as HF RFID antennas. Therefore, evaluating antenna performance under controlled temperature conditions contributes to a better understanding of their operational stability [26,27].
The objective of this study is to evaluate the influence of environmental factors, particularly temperature, on the behavior of HF RFID tag antennas operating at 13.56 MHz. Since these systems rely on inductive coupling in the near-field region, variations in temperature may affect material properties and, consequently, the resonant behavior of the antenna.
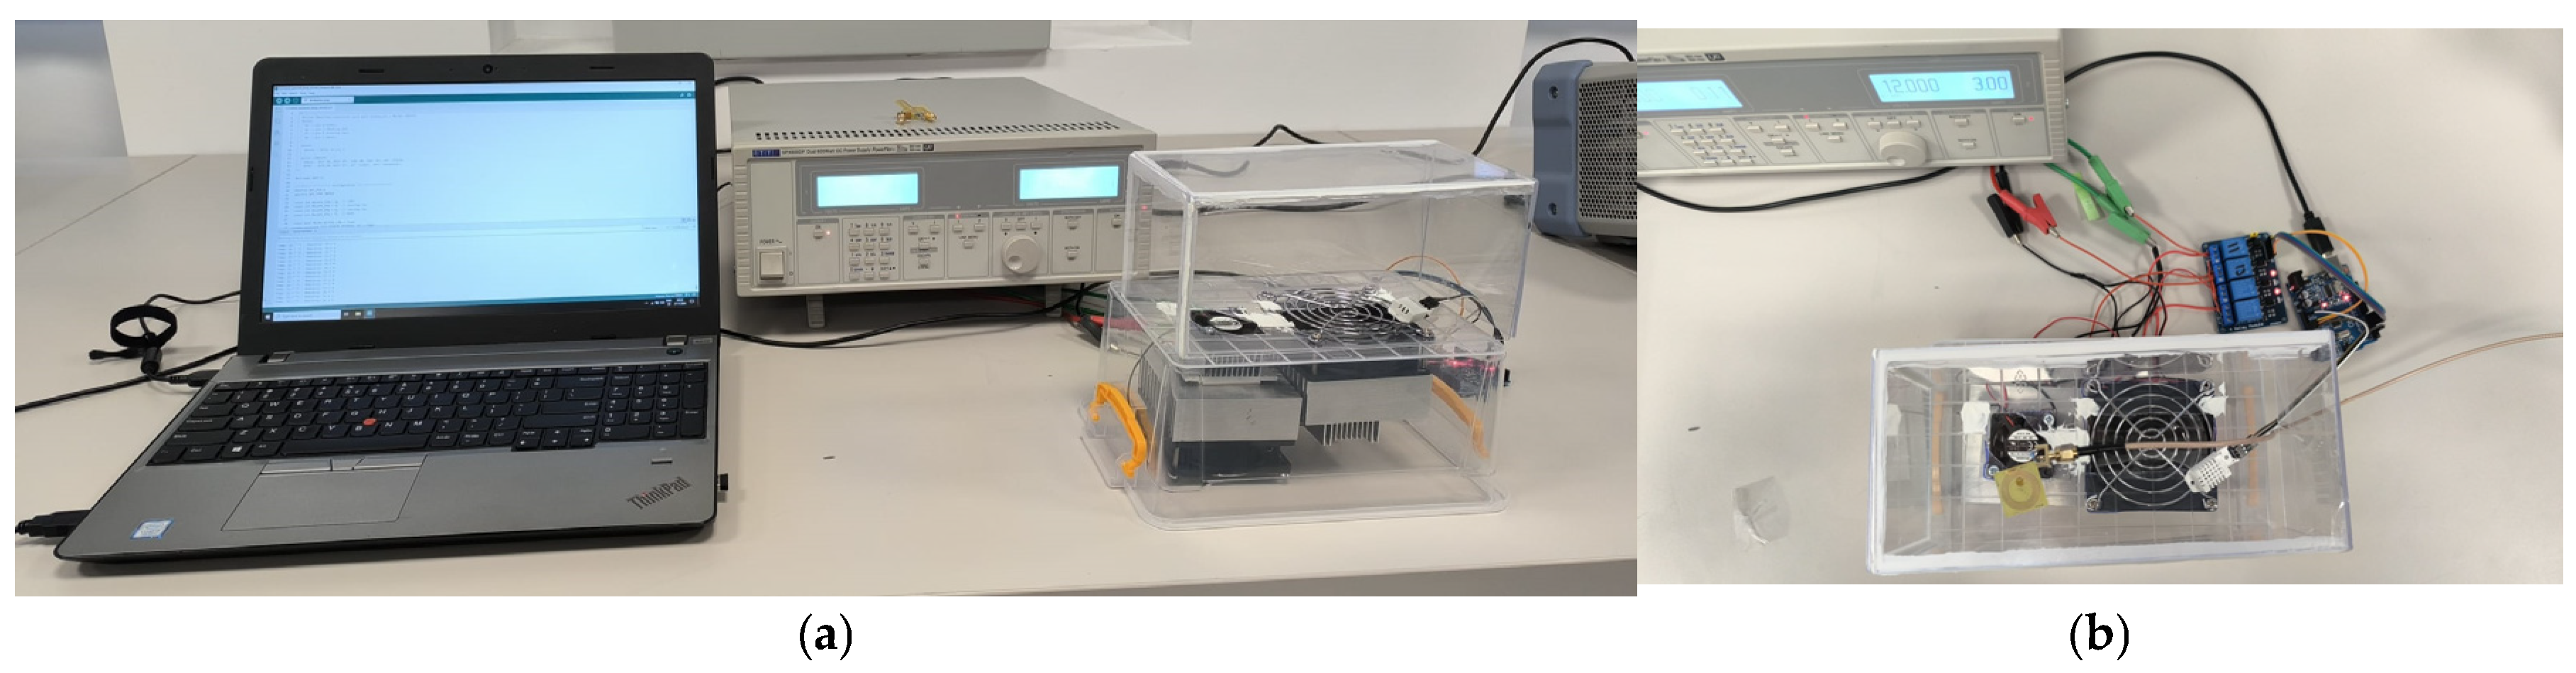
An automated thermal control system for an experimental chamber was created, using an Arduino Uno, an AM2302 (DHT22) temperature and humidity sensor, and a four-relay module. This allows both manual control and automatic thermostat-type operation, managing heating and cooling modes by switching the direction of the Peltier modules and activating the fans dedicated to each mode. Configuration and monitoring are performed via the serial monitor, where the user can set the target temperature, hysteresis, turn functions on or off, and track the system status in real time. This ensures precise temperature regulation, component protection, and flexibility in test or environmental control scenarios. The dimensions of this system are small enough to easily accommodate an antenna (20 cm × 10 cm × 30 cm) and to more easily maintain and modify the temperature. The temperature can vary between 15 °C and 50 °C and can be easily set by the user. Humidity is also monitored during the evaluation process, as this is one of the factors that influence wave propagation.
The stand, whose size is very small, has a low production cost of approximately EUR 100 (Figure 16). This stand is transparent in order to be able to follow the antenna during the temperature variation process and to be able to use a thermal imaging camera to track temperature changes over time. The Arduino board is connected to a computer where ArduinoIDE is installed and the temperature is easily controlled with the help of some instructions. Also, a source is connected to the test stand to power the Peltier and the fan.

3. Results

3.1. Influence of the Antenna Positioning

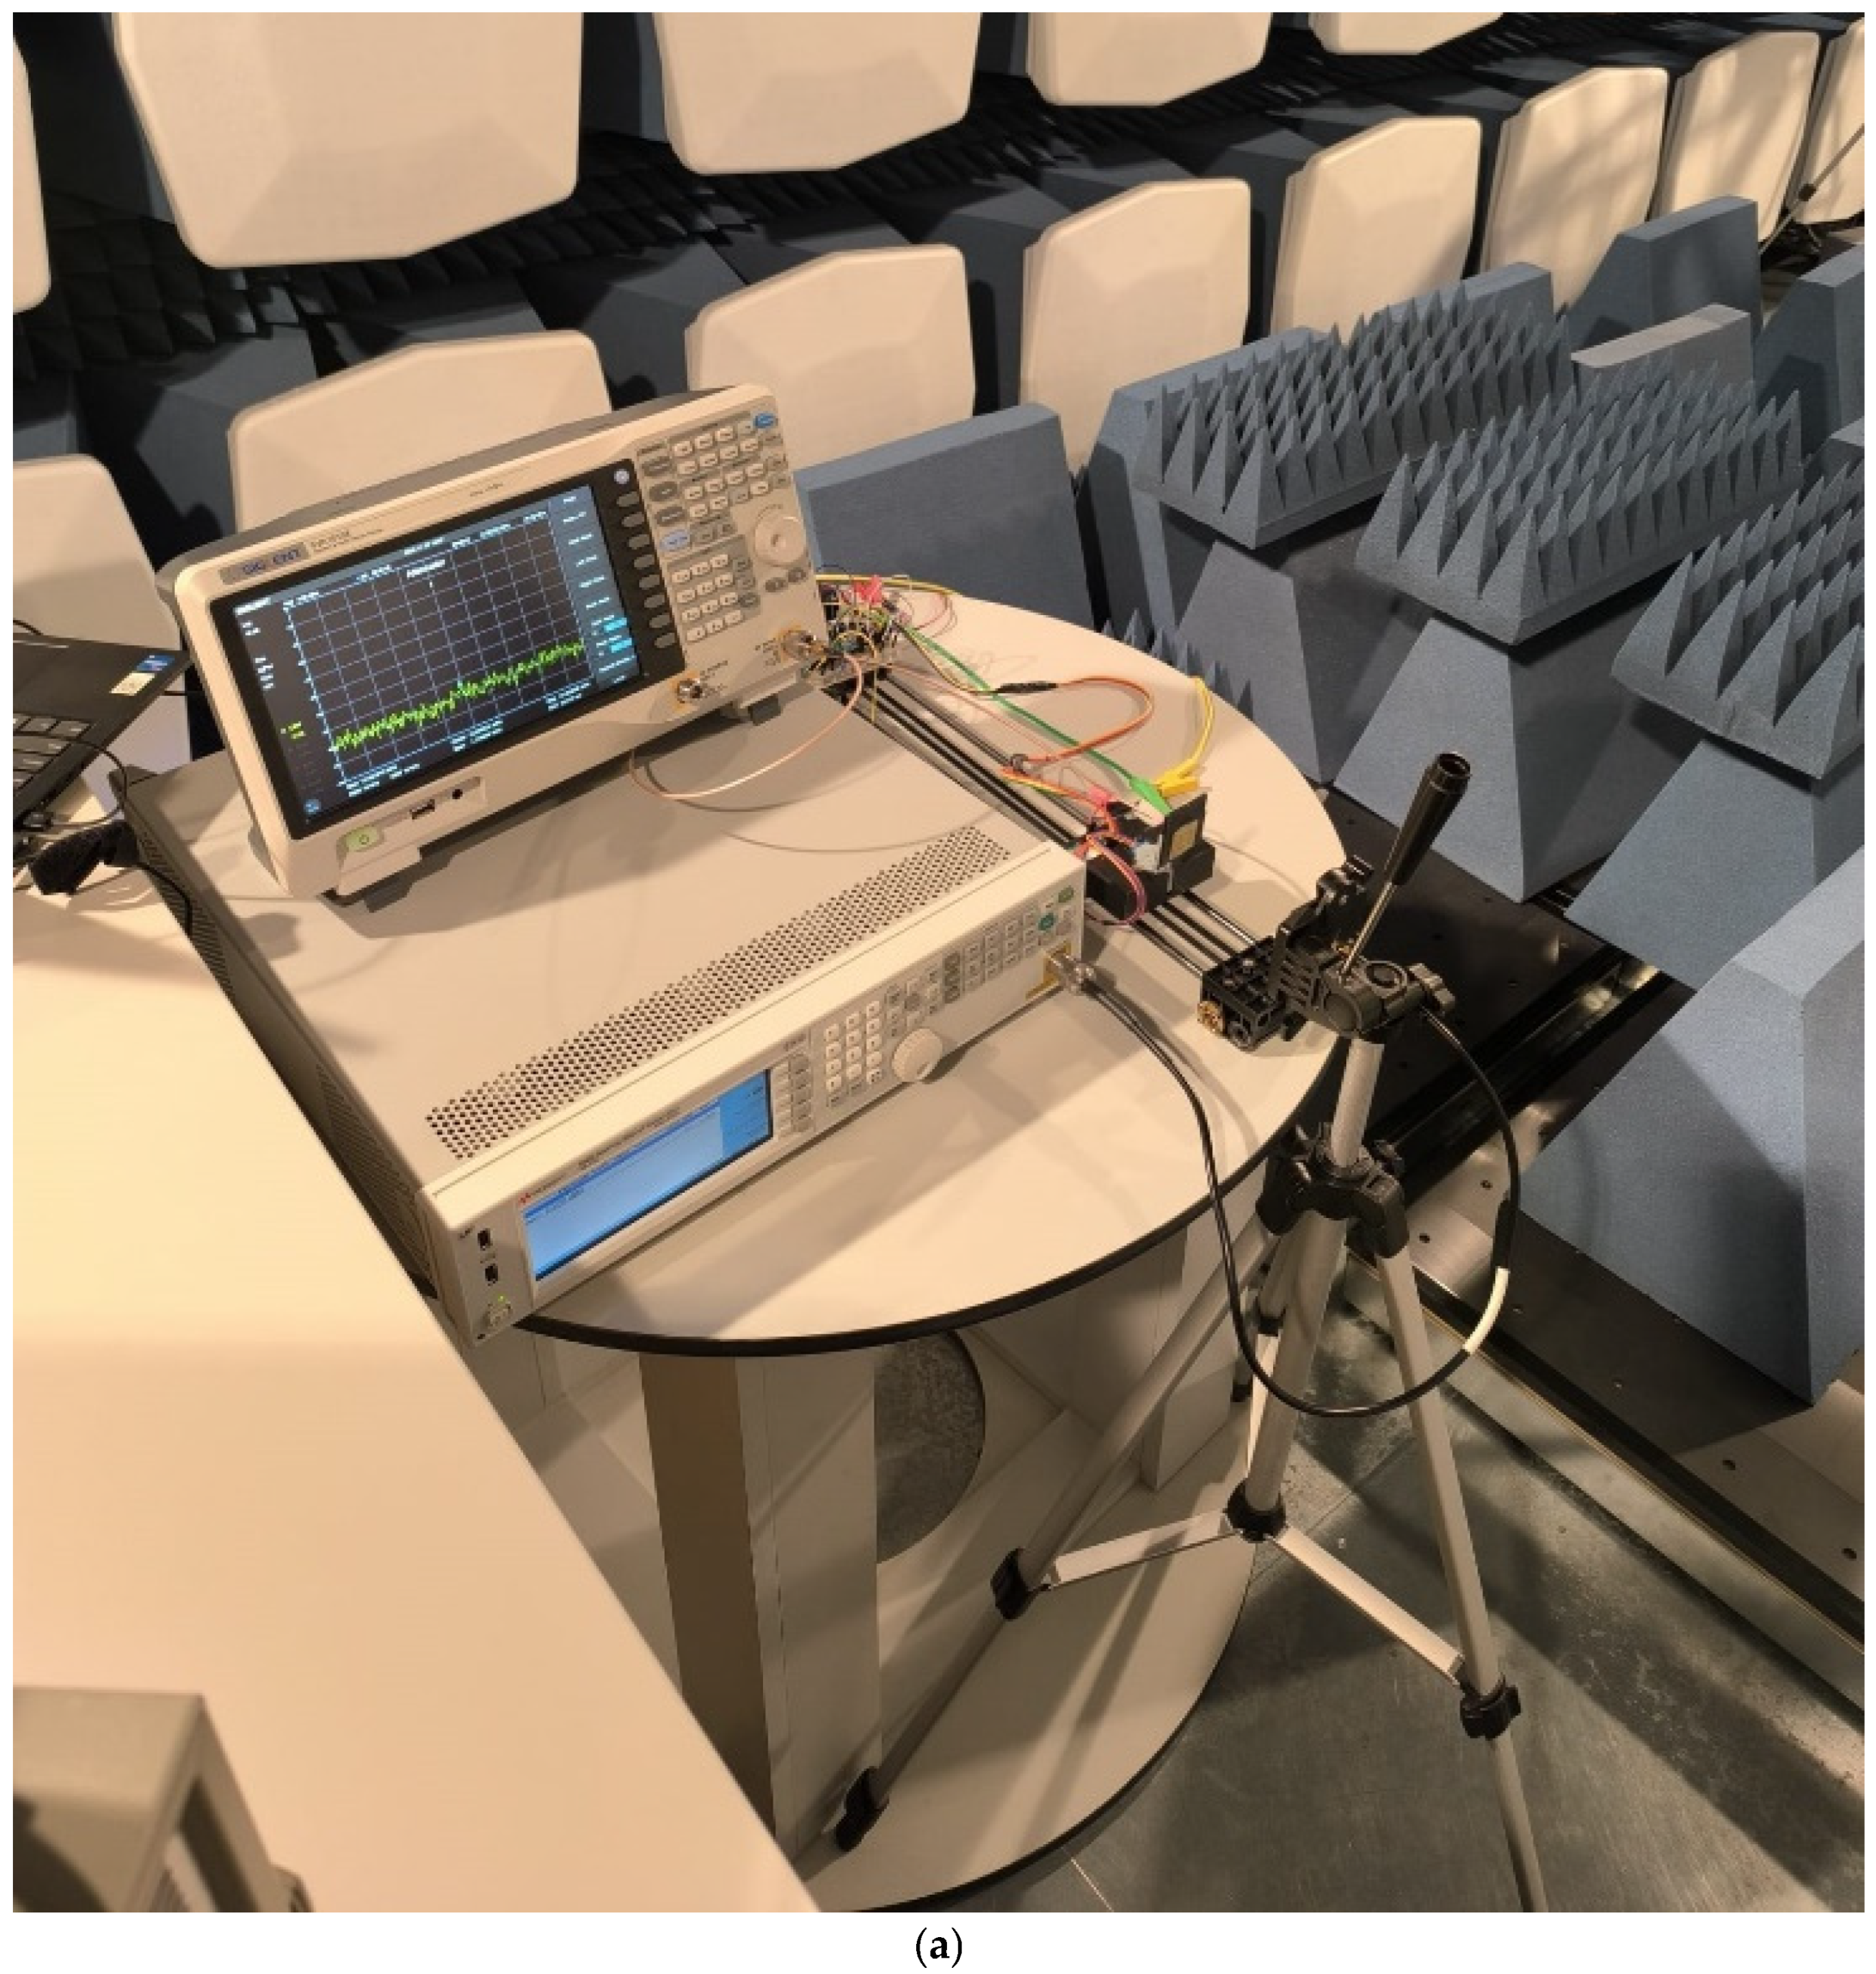
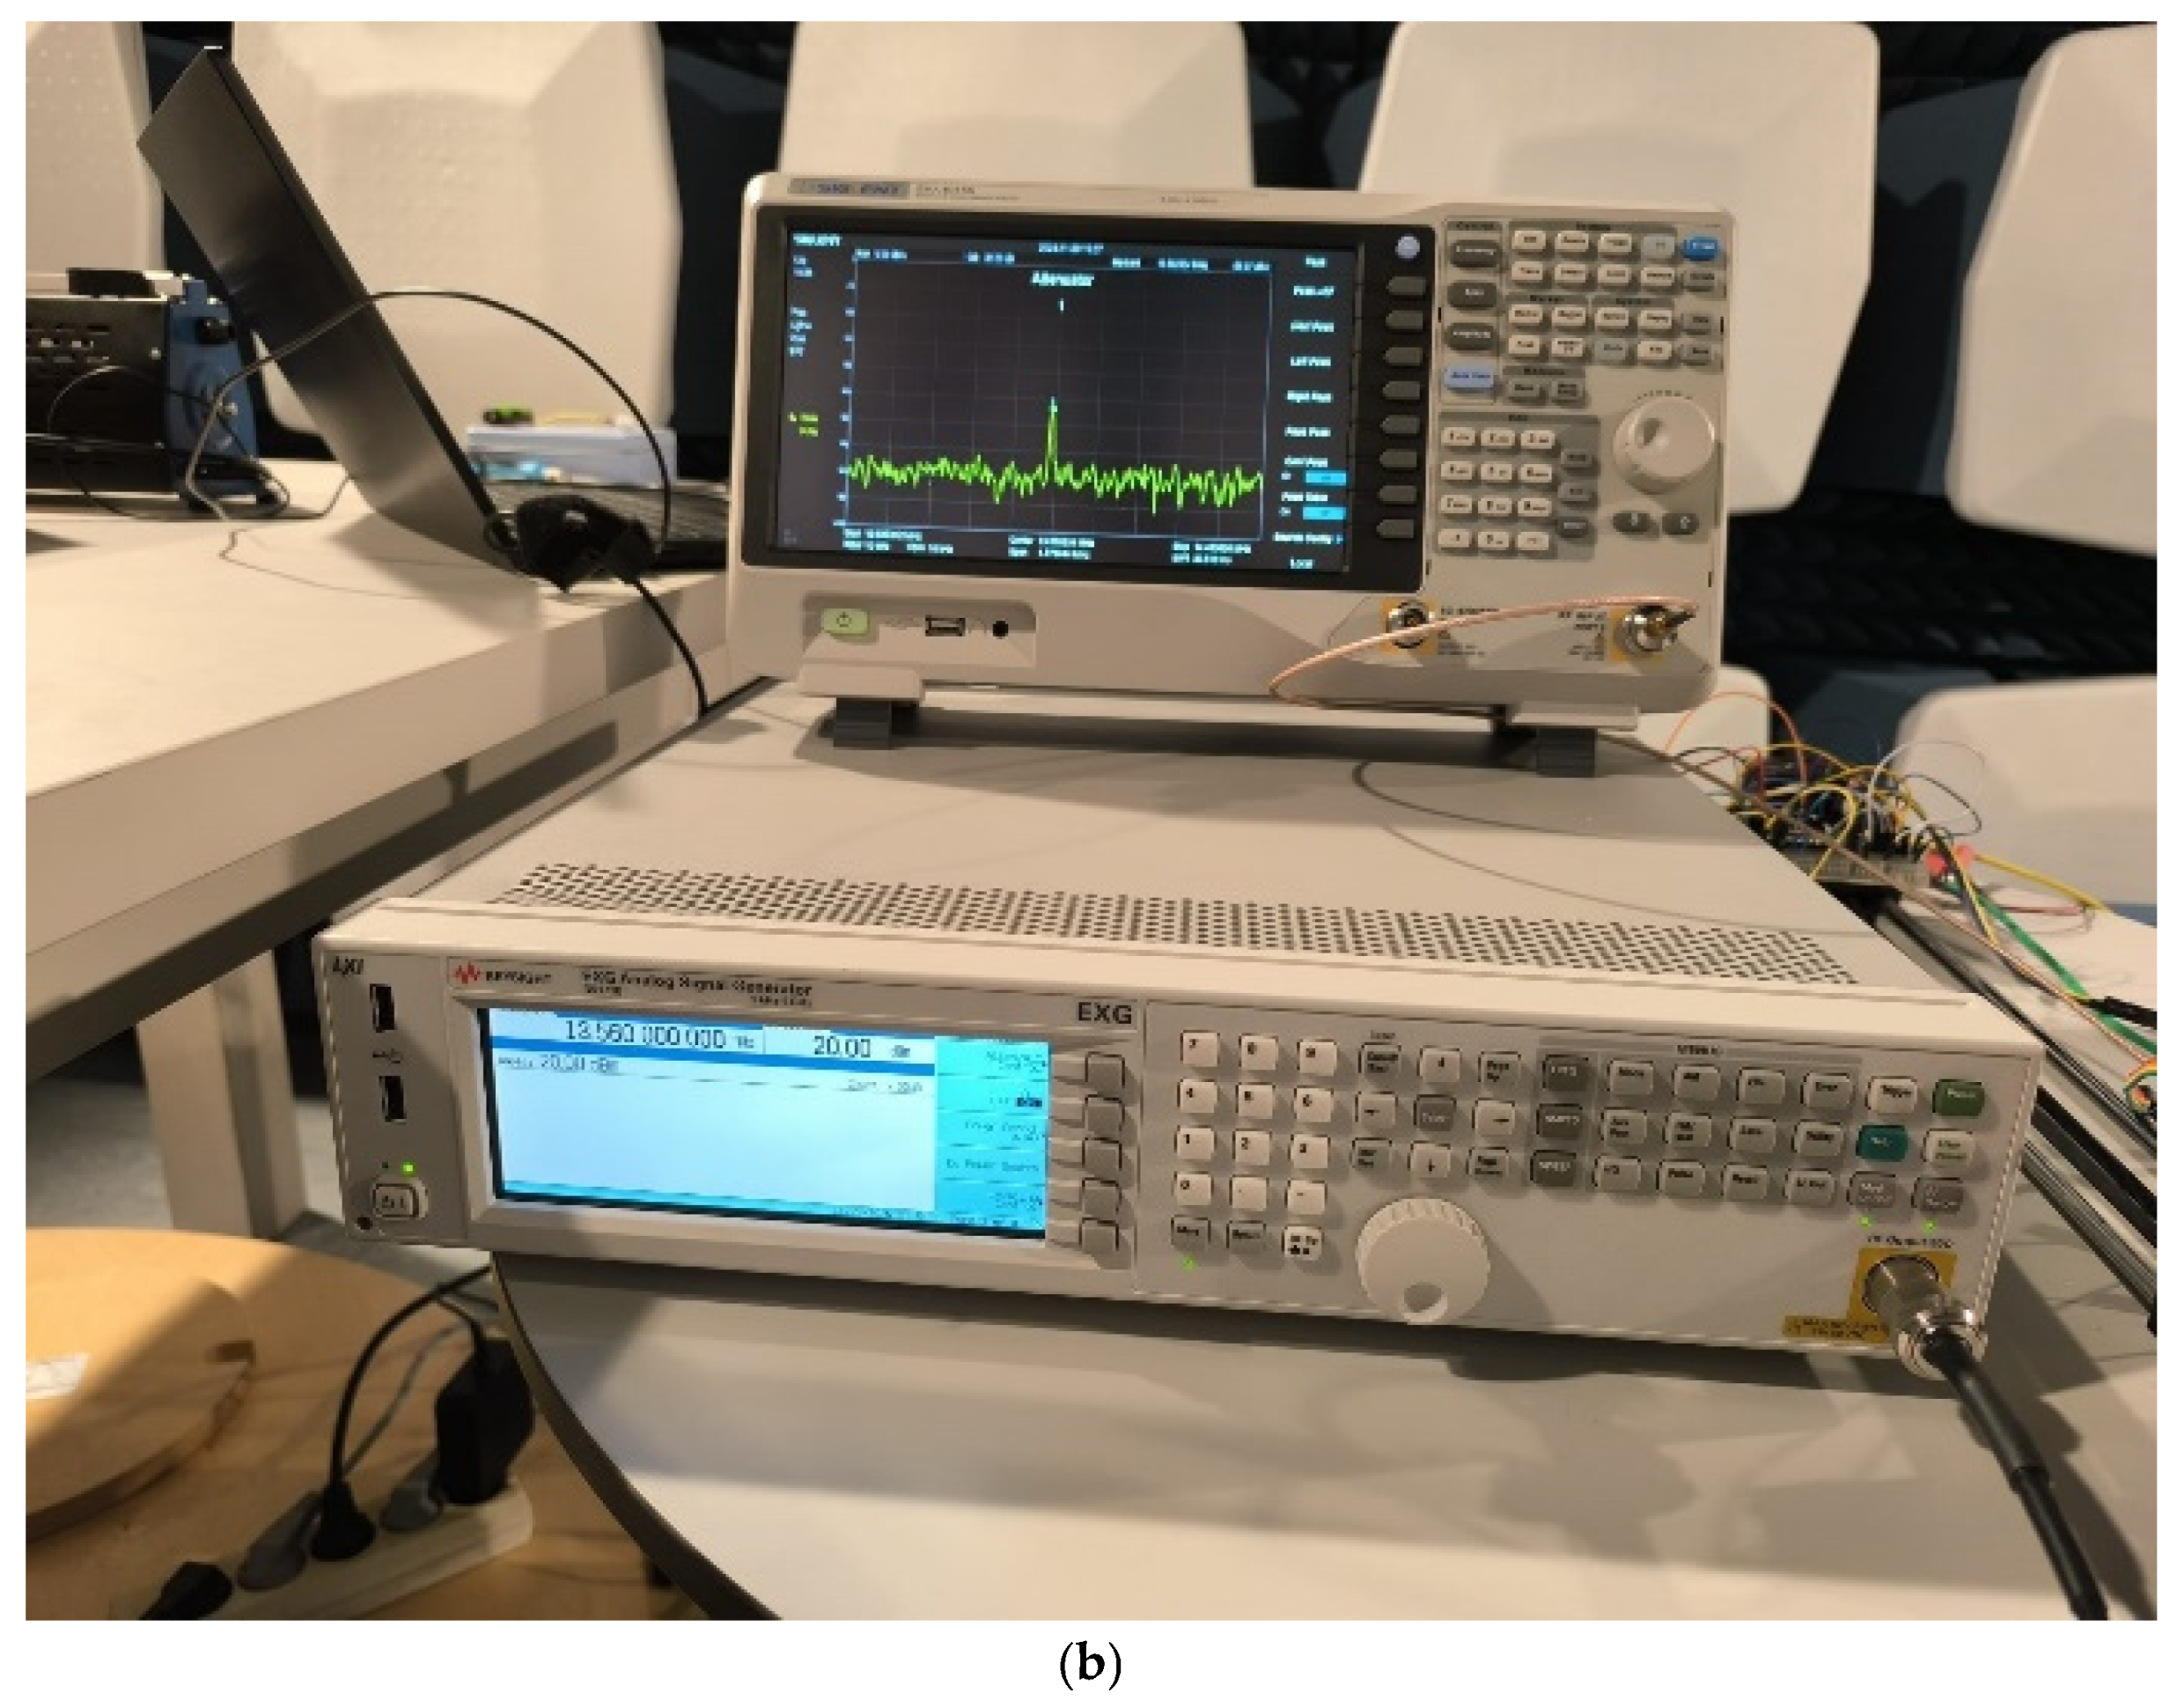
Two spiral inductive antennas were used for the test, one being considered as a transmitter and the other as a receiver. The transmitter was connected to a Keysight N5171B series signal generator (Santa Rosa, CA, USA) operating in the 9 kHz–6 GHz frequency range, which was set to the frequency of interest of 13.56 MHz and an amplitude of 20 dBm and placed on a tripod at the same height as the receiver on the automatic test stand. The receiver coil was positioned on the automated test stand with the ability to change its position and angle. It was connected to a Siglent SVA 1015X spectrum analyzer (Shenzhen, China) with a frequency range of 9 kHz–1.5 GHz and the power that it received was monitored. The configuration in which the measurements were performed can be seen in Figure 17. It should also be noted that these tests were performed in an anechoic chamber, thus providing isolation of the stand from possible interference. The study is based on magnetic near-field coupling, the relevant parameters being the magnetic coupling and received signal amplitude. In practical applications, environmental factors such as electromagnetic interference, metallic surfaces, humidity, and tag density may alter the behavior and reading performance of tag antennas compared to controlled laboratory conditions, but the first compliance test is always conducted in an environment without any other perturbing elements.
The signal level received was extracted from the value displayed by the spectrum analyzer at the operating frequency of 13.56 MHz. The received signal was measured using a calibrated SIGLENT SSA3021X Plus spectrum analyzer. The analyzer was configured with a center frequency of 13.56 MHz, a frequency span of 20 MHz, a reference level of 0 dBm, an input attenuation of 20 dB, and a sweep time of 25.5 ms. The received signal level was evaluated using the marker amplitude at the operating frequency of 13.56 MHz. Standard 50 Ω RF interconnections were employed throughout the experimental setup.
The received signal level was reported in dBm, using the marker amplitude measured at the operating frequency of 13.56 MHz. Values below the practical noise floor of the spectrum analyzer were considered below the detection limit and were not interpreted as physically meaningful received power levels. Therefore, such values were treated only as an indication of very weak or lost inductive coupling between the antennas.
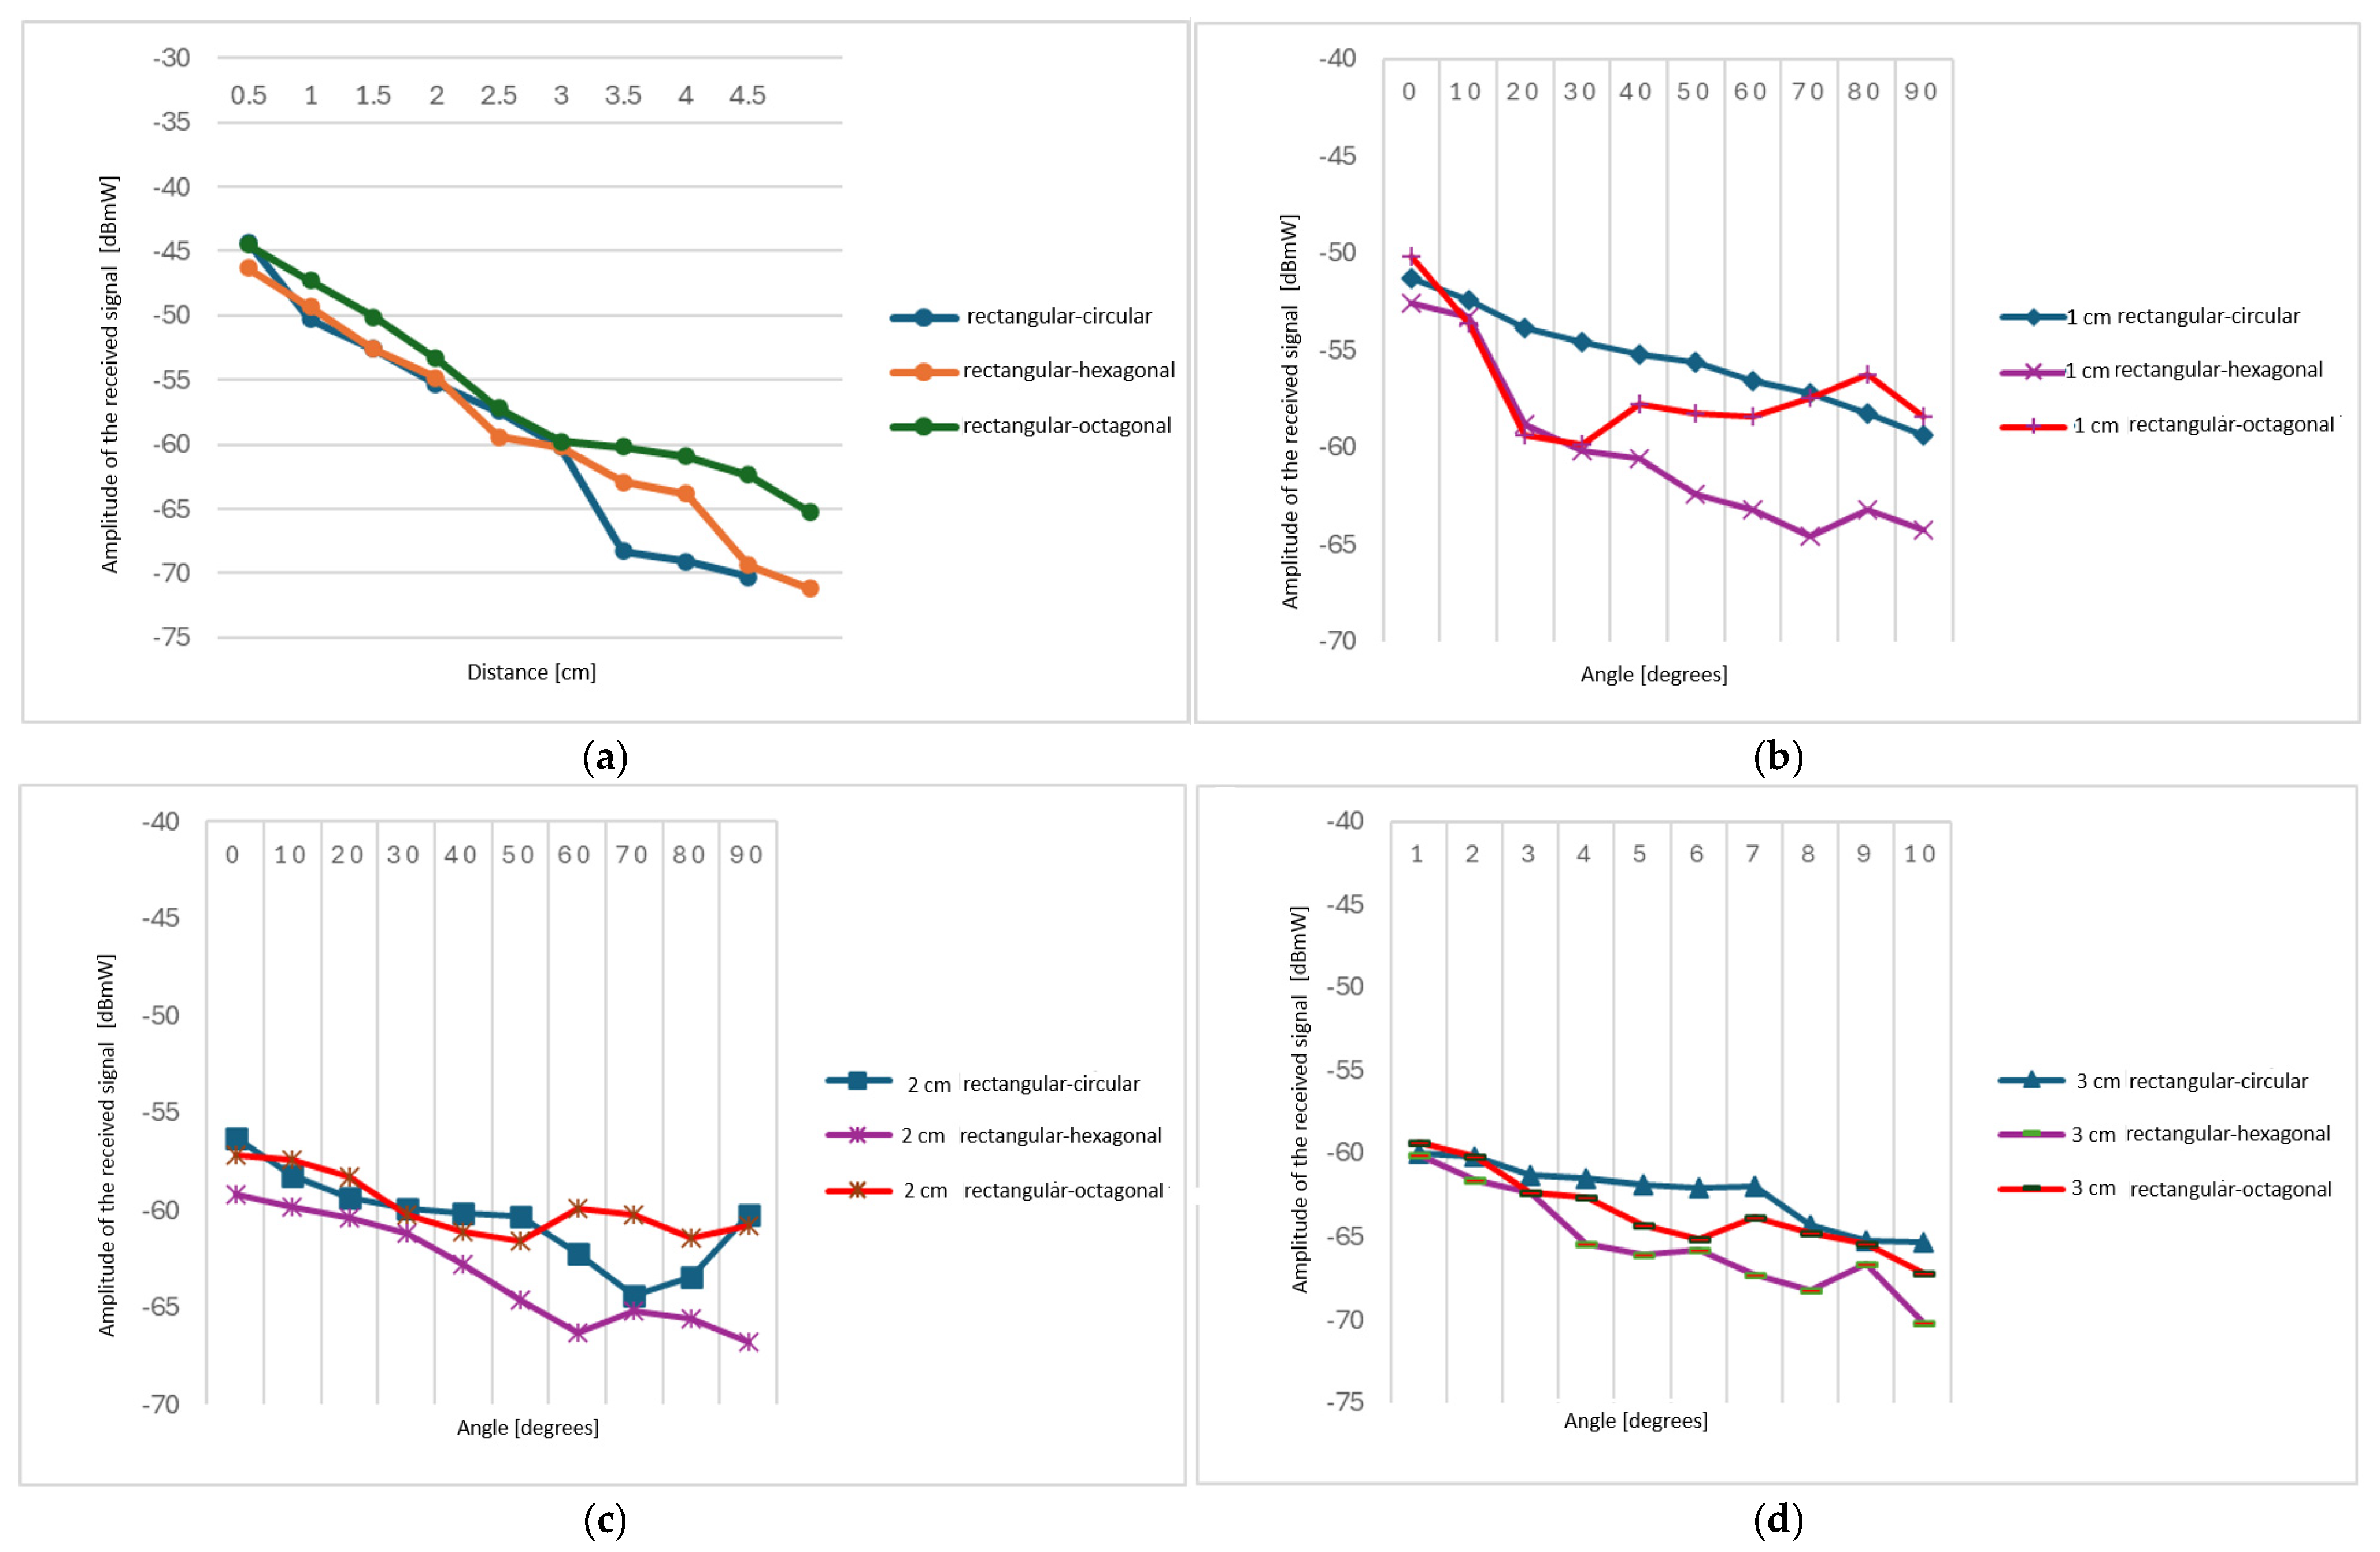
In the first case analyzed, a square spiral antenna with an outer diameter of De = 19 mm with seven turns was considered as the transmitter, with a distance between the turns s = 0.2 mm and a turn width w = 0.4 mm. The receiver was considered to be alternately the circular, hexagonal and octagonal antenna with the same dimensions as the receiver. The distance between the receiver and transmitter was varied across nine different points, increasing the distance with a step of 0.5 cm at each point. It was possible to observe a decrease in emissions from the transmitter to the receiver with the increase in the distance between them (Figure 18a). The best of these combinations was between the square and circular coils, where the signal was stronger.
This study focused on the tag antennas operating at 13.56 MHz, where the interaction between the antennas occurred in the magnetic near field region. The distance between them varied between 0 and 5 cm, a small distance being able to capture the inductive coupling effects specific to this frequency.
Also, the angle between the antennas was changed from 0 degrees to 90 degrees with a step of 10 degrees for all three combinations and it was observed again that the square–circular combination was the best of those analyzed in most cases. It is interesting to note that in the case of the octagonal–square combination the values were better for angles between 60 and 80 degrees (Figure 18). The square shaped structure was considered as the transmitter due to the fact that it resonated the best of all the shapes considered.
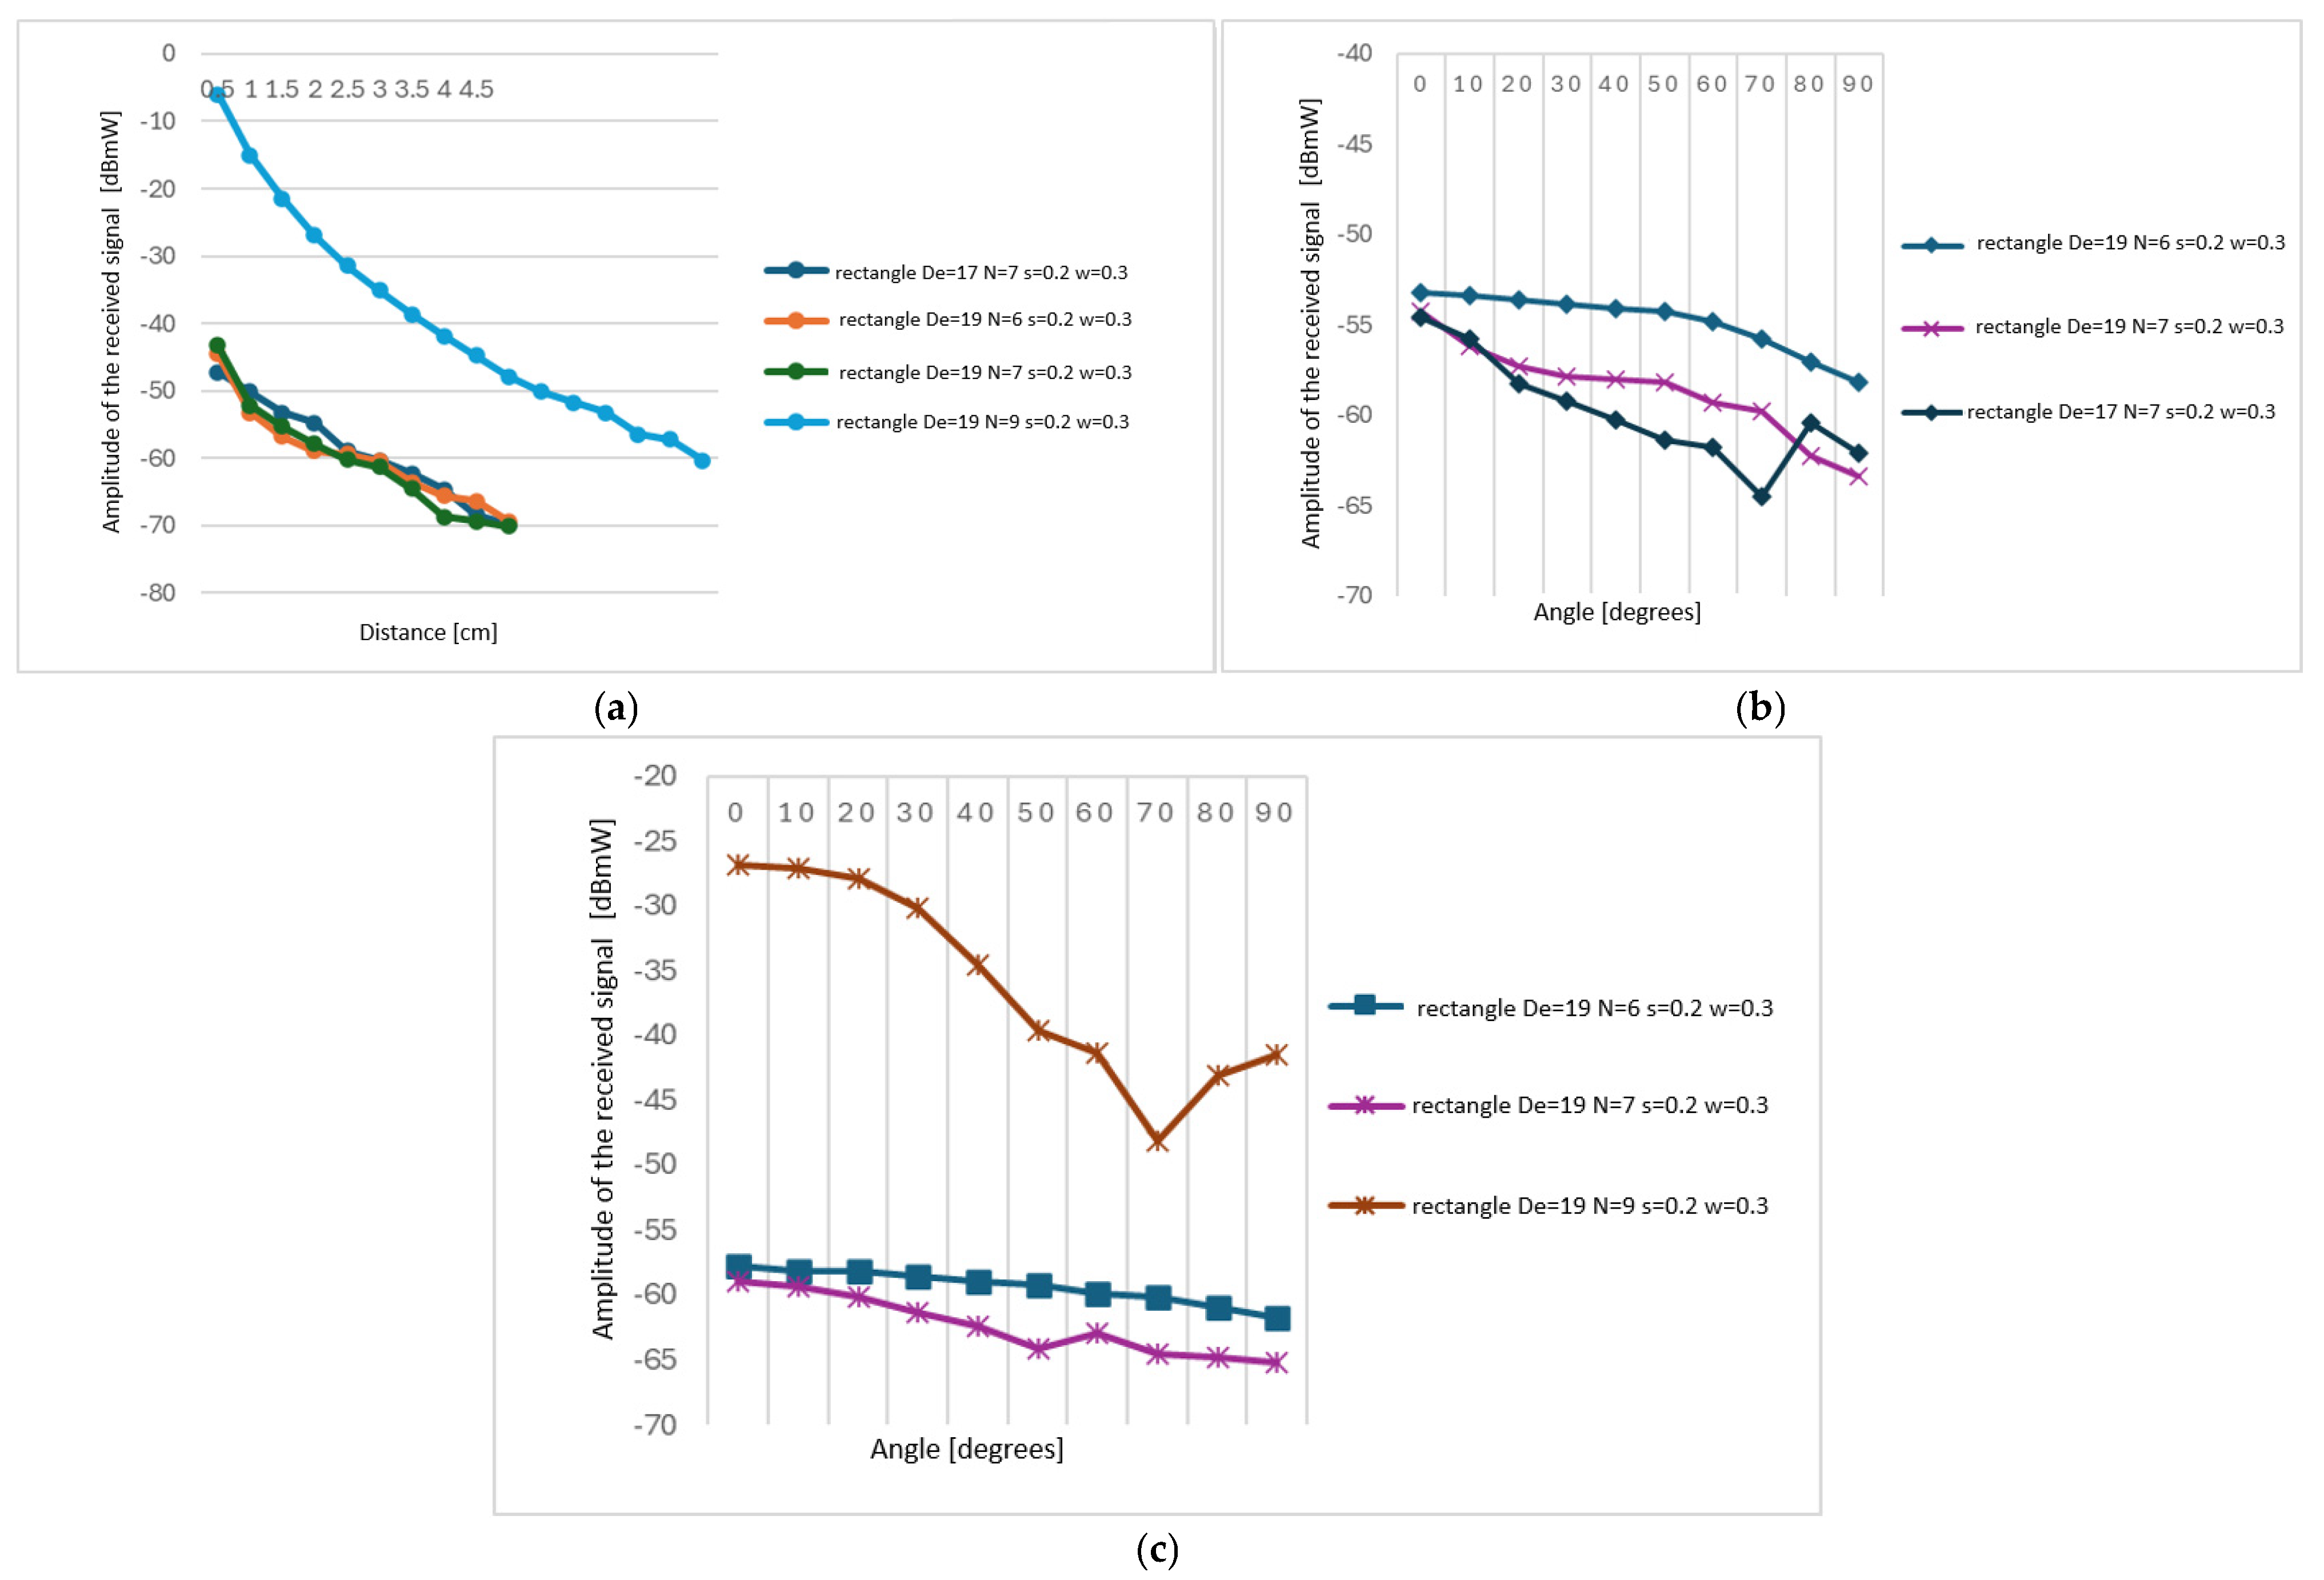
Knowing that square coils are the best when it comes to emissions, we checked what happened when we analyzed combinations of square-shaped structures. Thus, the same structure as in the previous case was considered as the transmitter and the other square structures presented in Figure 5 as the receivers. It can be seen that the structure with an outer diameter of 19 mm, nine windings and s = 0.2 mm, w = 0.3 mm was the best, receiving a signal with a higher amplitude even at greater distances. When the angle between the coils changed, the amplitude decreased with the increasing angle (Figure 19).
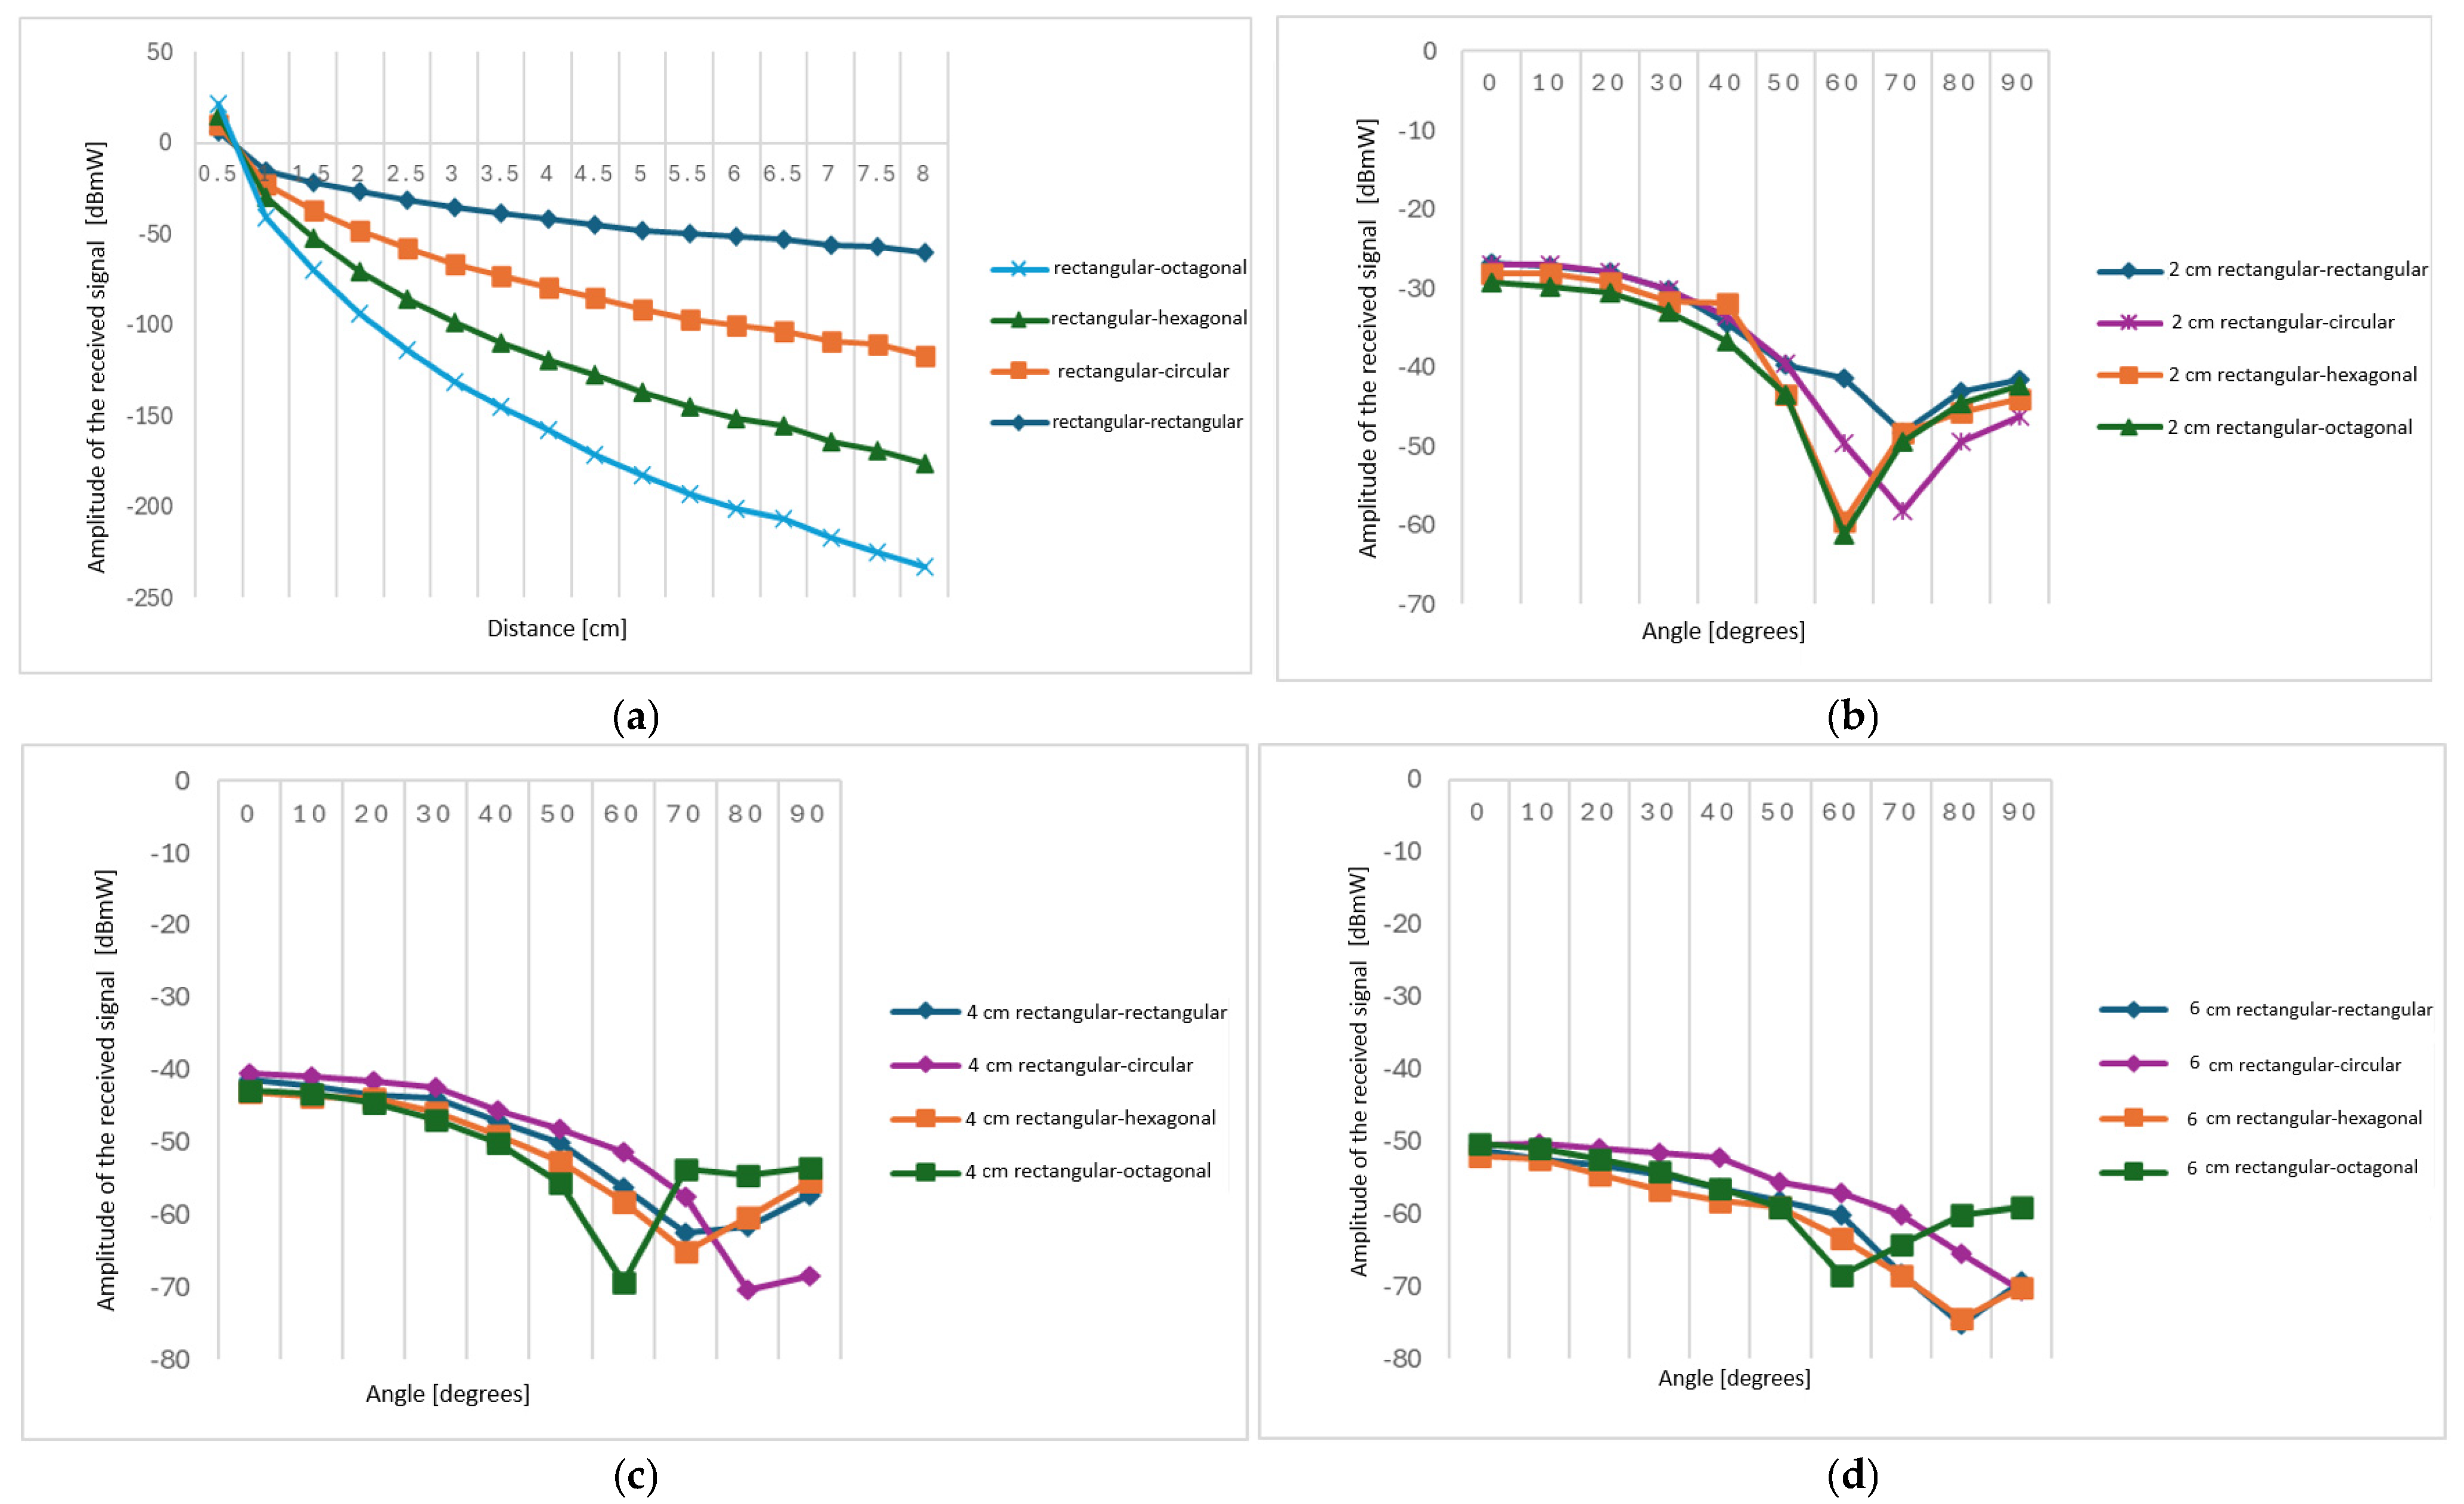
The last of the studies undertaken considered a transmitter comprising a rectangular spiral antenna with an outer diameter of 19 mm and a nine turns, which proved to be the best from the emission point of view. As receivers, spiral antennas of different shapes were considered with constructive parameters including an outer diameter of 19 mm, seven turns, s = 0.2 mm, and w = 0.3 mm. In Figure 20, it can be seen that a square–square combination was by far the best with regard to increasing the distance between the coils. This was also observed when the angle between the transmitter and the receiver changed. In this case too, an improvement in the amplitude of the received signal was apparent(although weaker than at 0 degrees) for the octagonal coils, which received better at angles between 60 and 90 degrees than any other shape considered. The sharp decrease observed in Figure 20 compared with Figure 18 was mainly caused by the modified antenna orientation, which significantly reduced the magnetic flux linkage between the reader and tag coils. Since HF RFID operation relies on near-field inductive coupling, small angular misalignments may strongly reduce the received signal level, especially at larger separation distances.
Before each measurement series, the antenna supports were mechanically aligned using the calibrated positioning system of the experimental stand. The positioning accuracy was mainly determined by the stepper motors and the 3D-printed supports.
To ensure measurement reliability, additional verification measurements were performed after repositioning the antennas during the experimental campaign. These measurements showed negligible variations under the controlled conditions of the anechoic chamber, confirming the stability of the measurement platform. The results reported in this paper correspond to the final validated measurements for each experimental configuration.
The overall measurement uncertainty was primarily determined by the specifications of the measuring instruments (RLC meter, Vector Network Analyzer, and Spectrum Analyzer) together with the positioning resolution of the automated platform, while the use of the anechoic chamber minimized the influence of external electromagnetic interference. Since all measurement equipment was calibrated according to the manufacturers’ specifications prior to the experimental campaign, the contribution of instrumental uncertainty is expected to be significantly smaller than the measured differences between the antenna configurations investigated.

3.2. Influence of the Temperature Variation on the S Parameters of the Antenna

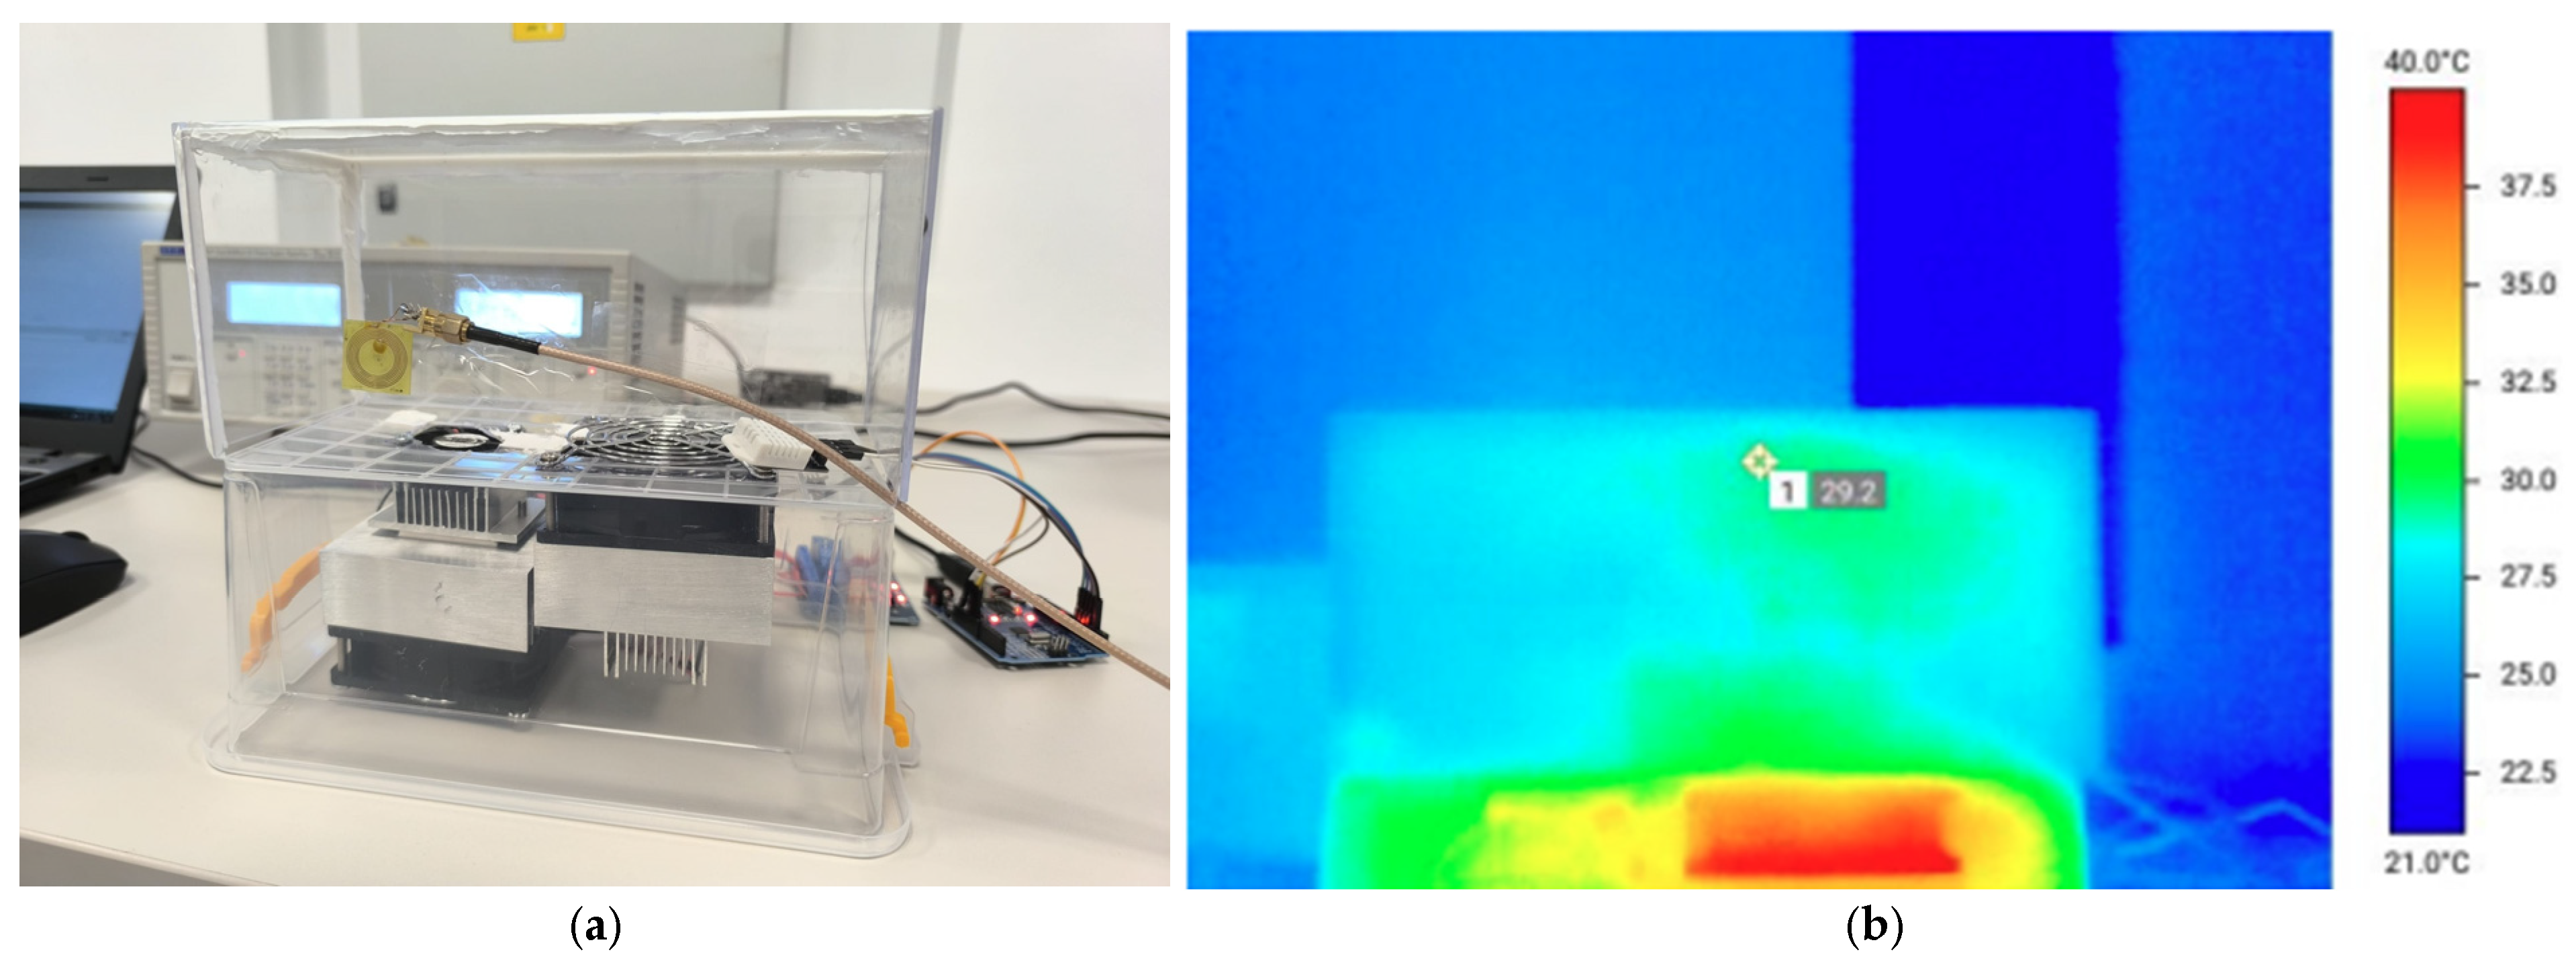
Figure 21 shows the test stand and a representation obtained with the thermal imaging camera Testo 871s (Titisee-Neustadt, Germany) when it was put into operation.
The thermal measurements were performed using a custom-built temperature control system based on an Arduino Uno microcontroller and a DHT22 temperature and humidity sensor. The Arduino continuously monitored the environmental conditions and controlled the heating and cooling elements through relay modules to maintain the desired temperature. Prior to each measurement, the antenna was allowed to reach thermal equilibrium at the selected temperature. During the experiments, the temperature and relative humidity were continuously monitored through the Arduino serial interface. The relative humidity remained approximately constant at 20% RH throughout the measurements, while the selected temperature was maintained within ±0.5 °C of the target value. The DHT22 sensor was positioned inside the thermal chamber, in the immediate vicinity of the antenna under test, allowing the temperature and relative humidity to be continuously monitored during the measurements.
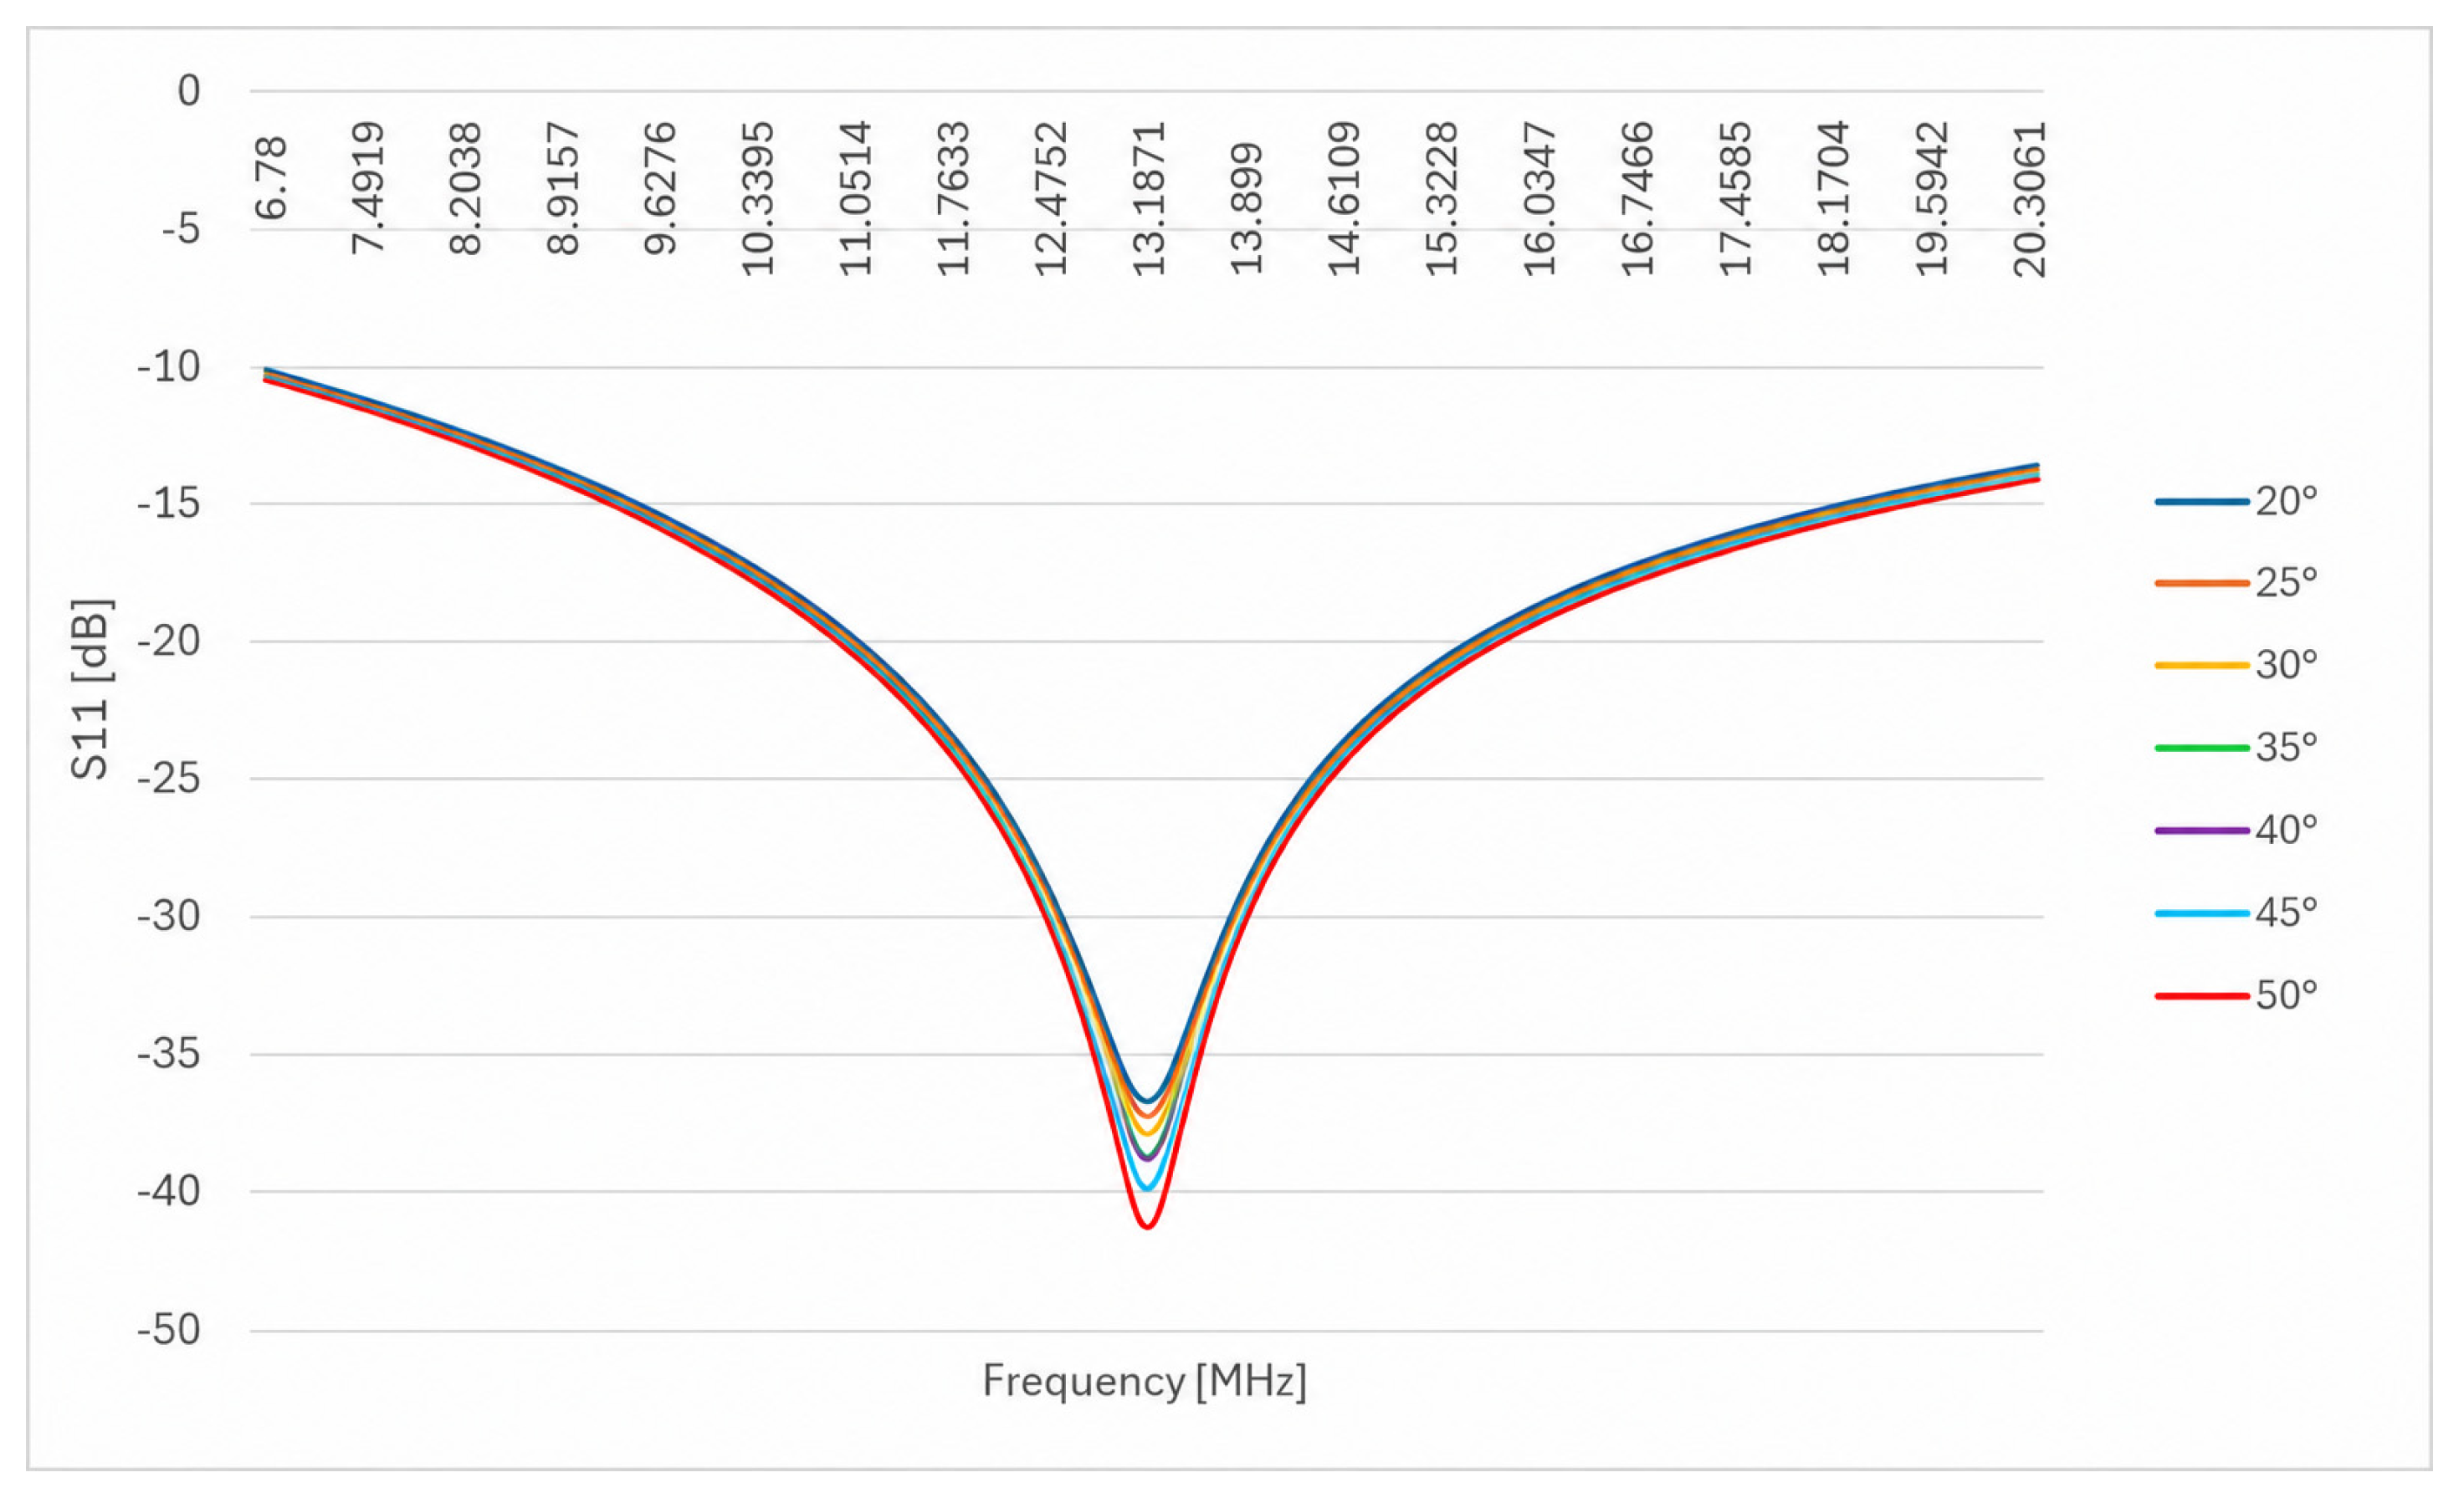
Using the test stand, the variation between the S parameters of two distinct antennas was represented with a variation of temperature between 20 and 50 degrees. In Figure 22, the S parameters with the variation of the temperature are represented for one of the antennas. It can be seen that the S parameters did not register big variations, so we can state that the antennas were not significantly influenced by these temperature variations.

4. Discussion

The experimental investigation demonstrates that the developed measurement platform provides a reliable and reproducible method for evaluating the performance of HF RFID tag antennas under controlled laboratory conditions. By combining automated positioning with wireless control, the influence of the operator during the measurements was minimized, resulting in improved repeatability compared with manual testing procedures.
The obtained results indicate that antenna geometry has a significant influence on the inductive coupling between the reader and the tag antenna. Among the investigated structures, the rectangular spiral antenna generally exhibited the highest received signal level, suggesting a more efficient magnetic coupling under the investigated operating conditions. Although all antennas were designed to operate at the same frequency, their different geometries resulted in different inductance values, current distributions, and magnetic field configurations, which affected the coupling efficiency.
The experimental results also confirmed the expected influence of the separation distance between the reader and the tag antenna. As the distance increased, the received signal level decreased because the mutual inductance between the coupled coils was reduced. This behavior is consistent with the operating principle of HF RFID systems based on near-field inductive coupling.
Antenna orientation proved to be another important parameter affecting system performance. The measurements showed that certain antenna geometries were more tolerant to angular misalignment than others. In particular, the rectangular and octagonal structures maintained satisfactory coupling over a wider range of orientations, while the circular and hexagonal geometries exhibited a more pronounced decrease in the received signal for larger rotation angles.
The influence of temperature on antenna performance was considerably smaller than the influence of geometry or positioning. Within the temperature range investigated, only minor variations of the signal level received were observed. These variations are mainly attributed to the slight changes in the electrical properties of the conductive materials and dielectric substrate, indicating that the investigated HF RFID antennas operated reliably under normal environmental conditions.
Compared with existing laboratory measurement approaches reported in the literature, the proposed platform provides a low-cost, portable, and easily reproducible alternative that does not require expensive robotic positioning systems or anechoic chambers. The modular architecture also allows future extensions, such as automated testing of additional antenna geometries, different operating frequencies, or integrated RFID tags.
Although the present work focused on passive HF RFID tag antennas operating at 13.56 MHz, the proposed methodology can be adapted for the experimental characterization of other inductively coupled wireless systems after appropriate redesign of the antenna structures and adjustment of the operating frequency.
One limitation of the present study is that only the antenna component of passive HF RFID tags was investigated, without including the RFID integrated circuit. In addition, the experiments were performed under controlled laboratory conditions using a limited number of antenna geometries. Future work will focus on evaluating complete RFID tags, extending the analysis to additional antenna designs and substrate materials, and validating the proposed platform under real operating conditions.

5. Conclusions

A test stand for RFID antennas was created, capable of controlling with high precision the distance and angle between the antennas, for users to be able to determine their influence on the interaction between the receiver and the transmitter. For better measurement results, a mobile application was created for remote control of the test stand to avoid the influence of the presence of the human body in the proximity of the antennas.
Measurements were made to determine the influence of the distance and angle between the antennas for several combinations of shape and geometric characteristics, and it was determined that of all the shapes considered, the square one was the best as a transmitter/receiver. It was also observed that the signal amplitude decreased with increasing distance between the antennas, as expected. A third conclusion is that there was an improvement in the amplitude of the received signal (although weaker than at 0 degrees) of the octagonal spiral antennas, which received better at angles between 60 and 90 degrees than any other shape considered.
A low-cost, small-sized system for analyzing temperature and humidity variation was also created. It was determined that temperature variation in the range of 20–50 degrees did not influence the operation of the analyzed antennas and did not cause them to heat up significantly.
The scientific contribution of this work lies in the experimental investigation of the influence of geometric and environmental parameters on the inductive coupling behavior of HF RFID tag antennas using a low-cost and flexible measurement platform.
Unlike existing commercial systems, the proposed setup allows precise control of antenna positioning and environmental conditions, enabling detailed analysis of the factors affecting coupling efficiency in the near-field region. The results provide practical insights into the optimization of HF RFID antenna design and positioning, contributing to improved system performance in real-world applications.

Author Contributions

Conceptualization, C.C., A.G. and C.P.; methodology, C.C., V.T. and C.M.; software, C.C., L.R.; validation, C.C., S.A., and M.G.; formal analysis, V.T. and C.M.; investigation, C.C., C.P. and A.G.; resources, C.C.; data curation, L.R., S.A. and M.G.; writing—original draft preparation, C.C.; writing—review and editing, C.P.; visualization, A.G., S.A. and M.G.; supervision, V.T., C.M.; project administration, C.C.; funding acquisition, C.C. All authors have read and agreed to the published version of the manuscript.

Funding

This research was funded by the Technical University of Cluj-Napoca. No grant number is associated with this funding.

Data Availability Statement

The data presented in this study are available from the corresponding author upon reasonable request.

Conflicts of Interest

The authors declare no conflicts of interest.

Abbreviations

The following abbreviations are used in this manuscript:
RFIDRadio frequency identification
NFCNear-field communication
MITMassachusetts Institute of Technology
UHFUltra-high frequency
HFHigh frequency
RLCResistor–inductor–capacitor
VNAVector network analyzer

References

  1. Diet, A.; Le Bihan, Y.; Conessa, C.; Alves, F.; Grzeskowiak, M.; Benamara, M.; Lissorgues, G.; Biancheri-Astier, M.; Pozzebon, A. LF RFID chequered loop antenna for pebbles on the beach detection. In Proceedings of the 2016 46th European Microwave Conference (EuMC), London, UK, 4–6 October 2016; IEEE: Piscataway, NJ, USA, 2016; pp. 41–44. [Google Scholar] [CrossRef]
  2. Gharat, V.; Colin, E.; Baudoin, G.; Richard, D. Indoor performance analysis of LF-RFID based positioning system: Comparison with UHF-RFID and UWB. In Proceedings of the 2017 International Conference on Indoor Positioning and Indoor Navigation (IPIN), Sapporo, Japan, 18–21 September 2017; IEEE: Piscataway, NJ, USA, 2017; pp. 1–8. [Google Scholar] [CrossRef]
  3. Caldarone, A.; Mondal, S.; Aliakbarian, B.; Chahal, P. Miniaturization of Multifunctional Low Frequency RFID Coil Antenna for Embedded Applications. In Proceedings of the 2020 IEEE International Symposium on Antennas and Propagation and North American Radio Science Meeting, Montreal, QC, Canada, 5–10 July 2020; IEEE: Piscataway, NJ, USA, 2020; pp. 1349–1350. [Google Scholar] [CrossRef]
  4. Salvati, R.; Palazzi, V.; Roselli, L.; Copparoni, L. A 13.56 MHz Time-Division Wireless Power and Data Transfer System. In Proceedings of the 2022 IEEE 12th International Conference on RFID Technology and Applications (RFID-TA), Cagliari, Italy, 12–14 September 2022; IEEE: Piscataway, NJ, USA, 2022; pp. 168–171. [Google Scholar] [CrossRef]
  5. Namadmalan, A.; Duffy, M. Design of Domino-Resonators for Enhanced Power and Data Transmission of 13.56 MHz RFID Sensors. IEEE Sens. J. 2023, 23, 20825–20833. [Google Scholar] [CrossRef]
  6. Rahman, S.N.; Bashar, S.S.; Al Mahmud, M.A.; Miah, M.S.; Karim, A.H.M.Z.; Marium, M. A Security System for Kindergarten School Using RFID Technology. J. Comput. Commun. 2019, 7, 21. [Google Scholar] [CrossRef][Green Version]
  7. Lynch, C.A.; Adeyeye, A.O.; Eid, A.; Hester, J.G.D.; Tentzeris, M.M. 5G/mm-Wave Next Generation RFID Systems for Future IoT Applications. In Proceedings of the 2021 IEEE International Conference on RFID Technology and Applications (RFID-TA), Delhi, India, 6–8 October 2021; IEEE: Piscataway, NJ, USA, 2021; pp. 77–80. [Google Scholar] [CrossRef]
  8. Pawan, C.T.; Shivaraj, S.H.; Kounte, M.R. RFID Characteristics and Its role in 5G Communication. In Proceedings of the 2020 4th International Conference on Trends in Electronics and Informatics (ICOEI)(48184), Tirunelveli, India, 15–17 June 2020; IEEE: Piscataway, NJ, USA, 2020; pp. 473–478. [Google Scholar] [CrossRef]
  9. Mota, V.L.G.; Magri, V.P.R.; Ferreira, T.N.; Matos, L.J.; Castellanos, P.V.G.; Silva, M.W.B.; Briggs, L.S. Swivel low cost prototype and Automatized Measurment Setup to Determine 5G and RFID Arrays Radiation Pattern. In Proceedings of the 2020 IEEE 3rd 5G World Forum (5GWF), Bangalore, India, 10–12 September 2020; IEEE: Piscataway, NJ, USA, 2020; pp. 491–496. [Google Scholar] [CrossRef]
  10. ANSI/IEEE Std 149-1979-1979(1-144); IEEE Standard Test Procedures for Antennas. IEEE: Piscataway, NJ, USA, 1979. Available online: https://ieeexplore.ieee.org/document/19510 (accessed on 28 January 2026).
  11. Balanis, C.A. Antenna Theory: Analysis and Design, 3rd ed.; John Wiley & Sons: Hoboken, NJ, USA, 2005. [Google Scholar]
  12. Barba, A.B.; Mostaccio, A.; Bayomi, R.A.H.; Lee, S.; Marrocco, G.; Someya, T.; Occhiuzzi, C. Upper-Bound Electromagnetic Performance of Substrate-Free Epidermal Tattoo Antennas for UHF Applications. Sensors 2026, 26, 1011. [Google Scholar] [CrossRef] [PubMed]
  13. Hamzah, N.; Sapuan, S.Z.; Sayegh, A.M.; Jenu, M.Z.M.; Nasimuddin. A portable measurement system for antenna’s radiation pattern. In Proceedings of the 2017 IEEE Asia Pacific Microwave Conference (APMC), Kuala Lumpur, Malaysia, 13–16 November 2017; IEEE: Piscataway, NJ, USA, 2017; pp. 547–550. [Google Scholar] [CrossRef]
  14. Kana-Chuctaya, A.; Hilario-Tacuri, A. Development of a prototype antenna radiation pattern measurement system using Software-Defined Radio. HardwareX 2025, 24, e00695. [Google Scholar] [CrossRef] [PubMed]
  15. Fontá Romero, C.; Arboleya, A.; Rodríguez Varela, F.; Sierra Castañer, M. Enhancing Robotic Antenna Measurements with Composite-Plane Range Extension and Localized Sparse Sampling. Sensors 2025, 25, 7200. [Google Scholar] [CrossRef] [PubMed]
  16. Wagih, M.; Moody, T. Open-Source Low-Cost Antenna Measurement Setup for Rapid Echoic Measurements. In Proceedings of the 2021 IEEE Conference on Antenna Measurements & Applications (CAMA), Antibes Juan-les-Pins, France, 15–17 November 2021; IEEE: Piscataway, NJ, USA, 2021; pp. 98–101. [Google Scholar] [CrossRef]
  17. Constantinescu, C.; Andreica, S.; Laszlo, R.; Giurgiuman, A.; Gliga, M.; Munteanu, C.; Pacurar, C. Numerical Modeling, Analysis, and Optimization of RFID Tags Functioning at Low Frequencies. Appl. Sci. 2024, 14, 9544. [Google Scholar] [CrossRef]
  18. Constantinescu, C.; Pacurar, C.; Andreica, S.; Gliga, M.; Grindei, L.; Rapolti, L.; Terec, D.; Giurgiuman, A. Development and Optimization of Antennas for 860–960 MHz RFID Applications and Their Impact on the Human Body. Technologies 2026, 14, 51. [Google Scholar] [CrossRef]
  19. Pacurar, C.; Topa, V.; Constantinescu, C.; Munteanu, C.; Gliga, M.; Andreica, S.; Giurgiuman, A. Adapting the Formula for Planar Spiral Inductors’ Inductance Computation to the New Oval Geometric Shape, Ideal for Designing Wireless Power Transfer Systems for Smart Devices. Mathematics 2025, 13, 348. [Google Scholar] [CrossRef]
  20. Pinchera, D.; Migliore, M.D.; Schettino, F.; Lucido, M.; Panariello, G. An effective compressed-sensing inspired deterministic algorithm for sparse array synthesis. IEEE Trans. Antennas Propag. 2017, 66, 149–159. [Google Scholar] [CrossRef]
  21. Vatamanu, D.; Miclaus, S. A computational approach of increasing the antenna system’s sensitivity of a Doppler radar destined to the detection of the human vital signs in the UHF-SHF frequency ranges. Sensors 2025, 25, 3235. [Google Scholar] [CrossRef] [PubMed]
  22. Yuan, Z.; Lian, Z.; Su, Y.; Wang, Y.; Zu, C.; Zhang, B.; Ling, L. Coupling Effects and Analysis in Extremely Large-Scale Planar Array Antennas. Sensors 2026, 26, 1109. [Google Scholar] [CrossRef] [PubMed]
  23. Colella, R.; Chietera, F.P.; Catarinucci, L. Analysis of FDM and DLP 3D-Printing Technologies to Prototype Electromagnetic Devices for RFID Applications. Sensors 2021, 21, 897. [Google Scholar] [CrossRef] [PubMed]
  24. Hebedean, C.; Munteanu, C.; Racasan, A.; Pacurar, C. Application of Windings Shifting for the Optimization of Planar Structures. Environ. Eng. Manag. J. 2013, 12, 1153–1159. [Google Scholar] [CrossRef]
  25. Hebedean, C.; Munteanu, C.; Racasan, A.; Pacurar, C. Optimum geometry for planar structures regarding their loss factor. In Proceedings of the International Conference and Exposition on Electrical and Power Engineering, 7th ed.; EPE: Iași, România, 2012; pp. 693–698. ISBN 978-1-4673-1172-4. [Google Scholar]
  26. Citroni, R.; Mangini, F.; Frezza, F. Efficient Integration of Ultra-low Power Techniques and Energy Harvesting in Self-Sufficient Devices: A Comprehensive Overview of Current Progress and Future Directions. Sensors 2024, 24, 4471. [Google Scholar] [CrossRef] [PubMed]
  27. Niu, S.; Zhao, Q.; Niu, S.; Jian, L. A Comprehensive Investigation of Thermal Risks in Wireless EV Chargers Considering Spatial Misalignment from a Dynamic Perspective. IEEE J. Emerg. Sel. Top. Ind. Electron. 2024, 5, 1560–1571. [Google Scholar] [CrossRef]
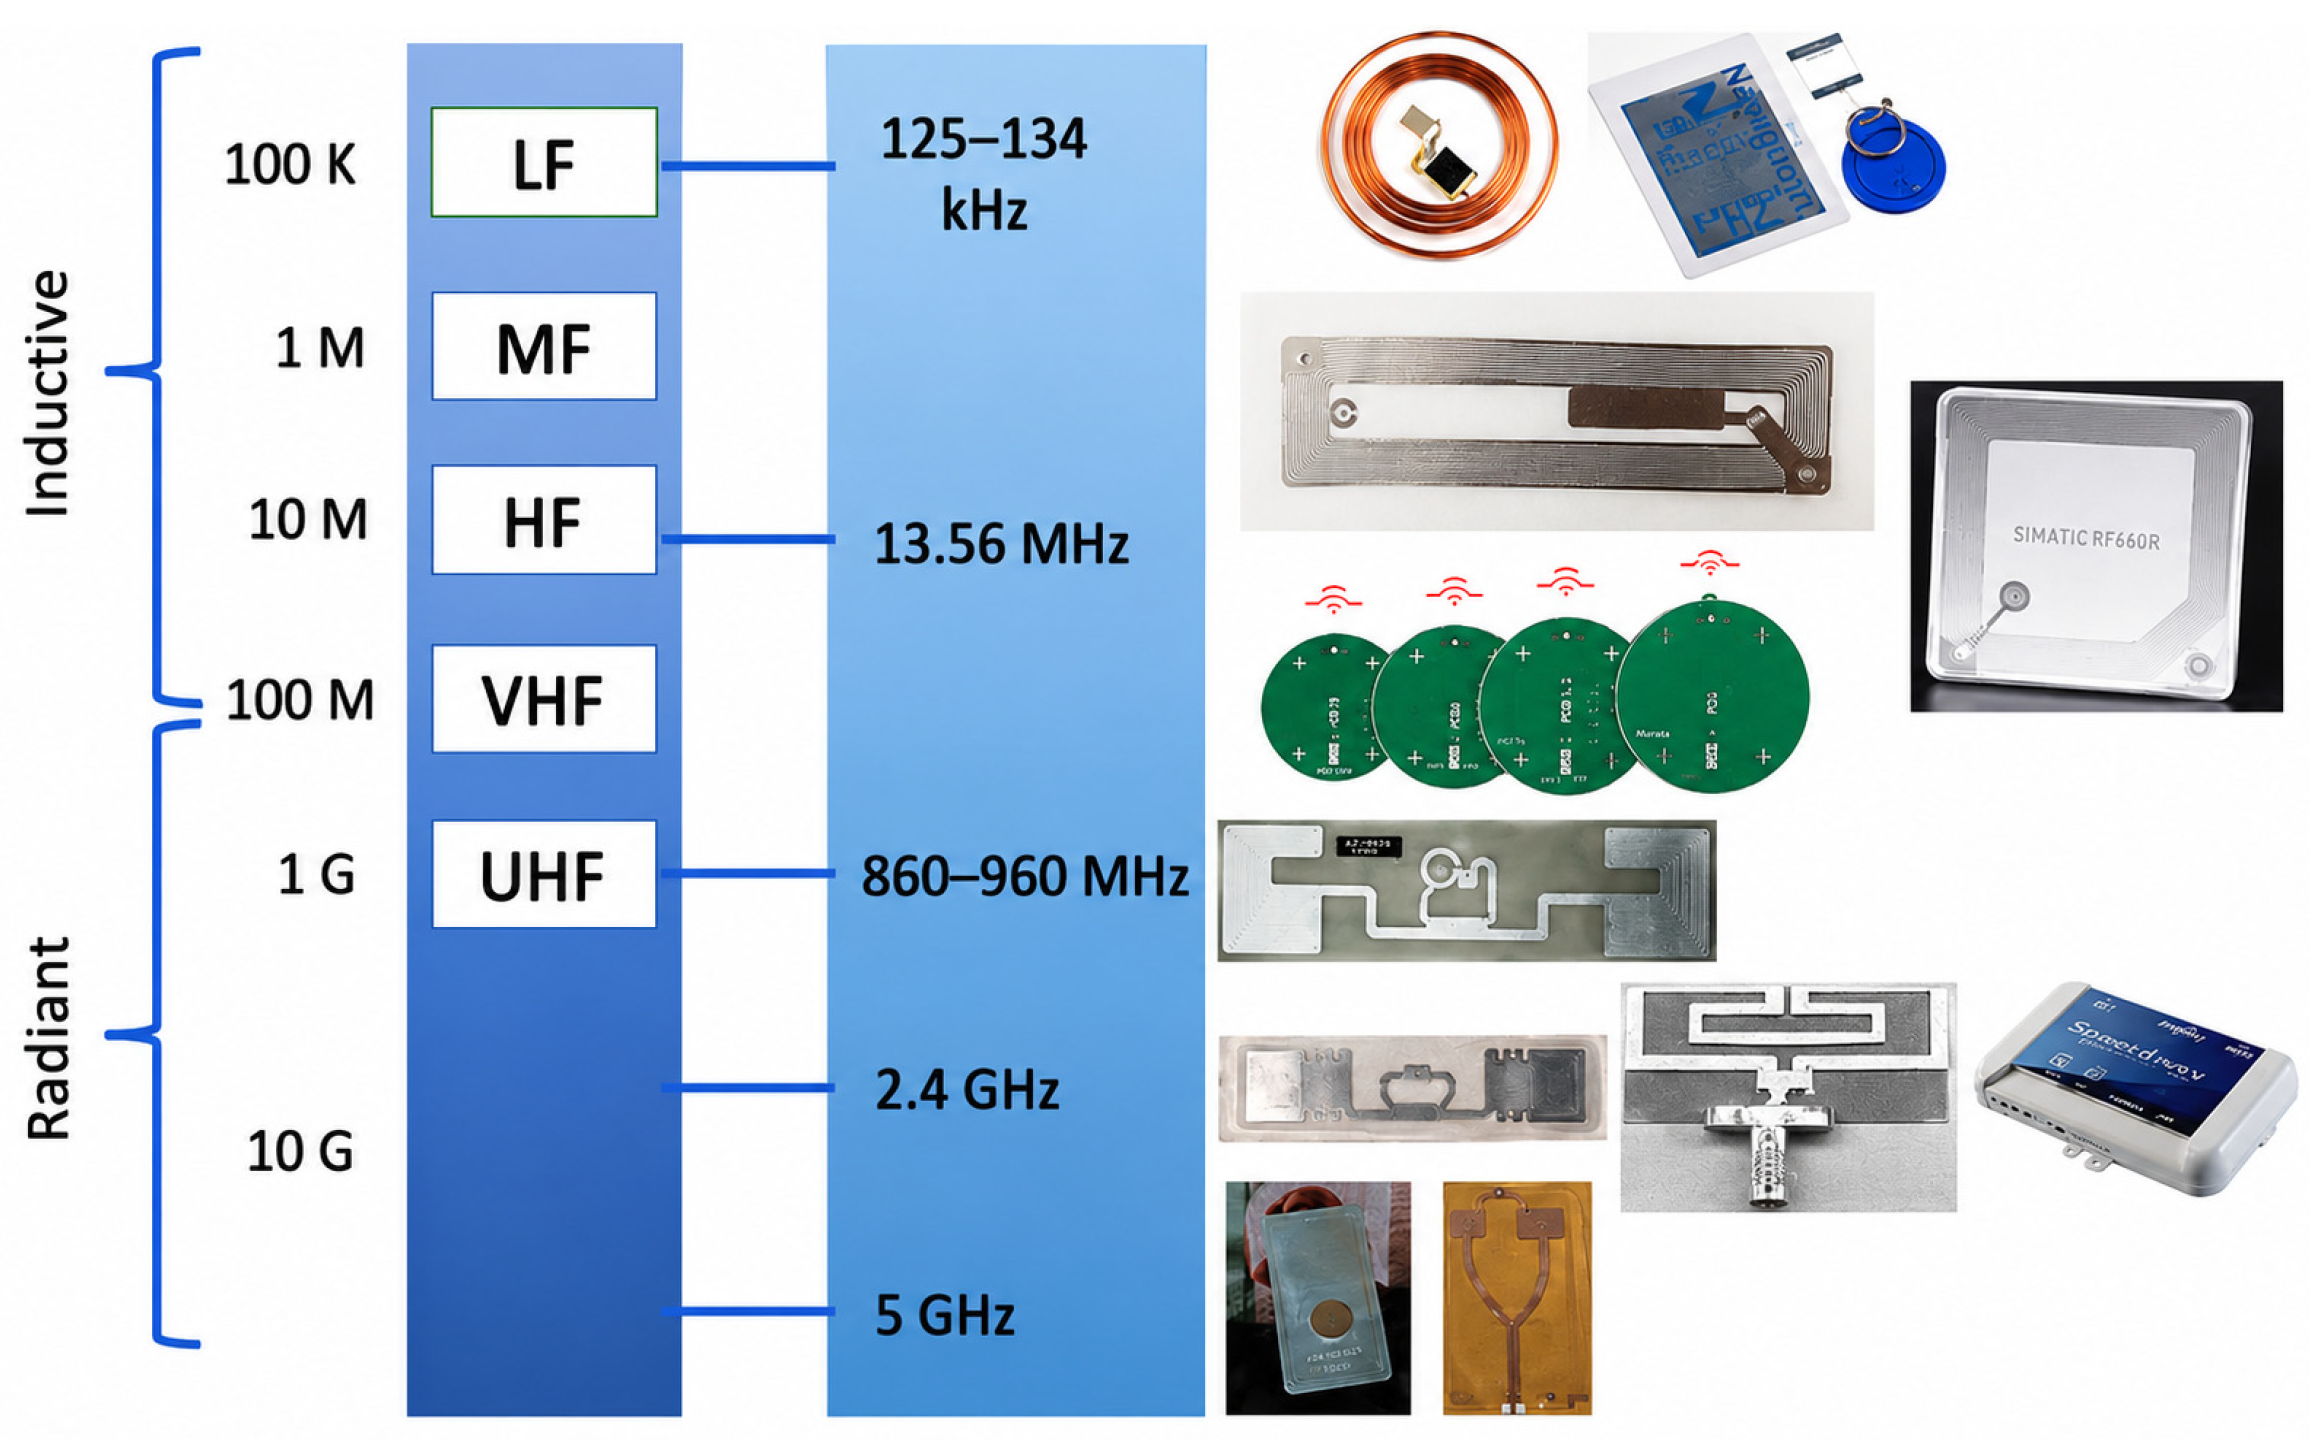
Figure 1. Frequency ranges used for different types of tag antennas.
Inventions 11 00072 g001
Figure 2. Steps carried out during the research process.
Inventions 11 00072 g002
Figure 3. Production line for planar electromagnetic components LPKF.
Inventions 11 00072 g003
Figure 4. Practically constructed tag antenna structures to be experimentally tested: (a) circular; (b) rectangular; (c) hexagonal; (d) octagonal.
Inventions 11 00072 g004aInventions 11 00072 g004b
Figure 5. Equivalent parallel RLC circuit model of the HF RFID tag antenna.
Inventions 11 00072 g005
Figure 6. Measurement of the structure’s inductance with an RLC meter: (a) circular, (b) rectangular, (c) hexagonal, (d) octagonal.
Inventions 11 00072 g006
Figure 7. The final analyzed structures to be measured: (a) analyzed structures; (b) determination of the resonance frequency using the VNA.
Inventions 11 00072 g007
Figure 8. Resonance frequency obtained for the analyzed structures: (a) circular, (b) rectangular, (c) hexagonal, (d) octagonal.
Inventions 11 00072 g008aInventions 11 00072 g008b
Figure 9. Electric and magnetic field representations for the circular spiral antenna: (a) in a cross section above the antenna, (b) in the dielectric.
Inventions 11 00072 g009
Figure 10. Characteristic parameters of the antenna: (a) gain, (b) S parameter.
Inventions 11 00072 g010
Figure 11. The components used to construct the test stand for the RFID antennas.
Inventions 11 00072 g011
Figure 12. The electric schematic diagram of the test stand.
Inventions 11 00072 g012
Figure 13. The test stand created for the evaluation of the RFID antennas.
Inventions 11 00072 g013
Figure 14. The design of the 3D printed components: (a) the printed support of the step-by-step motor, (b) the printed support of the RFID antennas.
Inventions 11 00072 g014
Figure 15. The mobile interface for the control of the implemented measurement stand design: (a) the interface on a mobile, (b) print screen from the application, (c) the code for the interface.
Inventions 11 00072 g015
Figure 16. The test stand for temperature variation: (a) lateral view, (b) vertical view.
Inventions 11 00072 g016
Figure 17. Test stand used for the RFID antenna evaluation: (a) test stand, (b) signal generator and spectral analyzer.
Inventions 11 00072 g017aInventions 11 00072 g017b
Figure 18. Signal amplitude modification with the variation of the spiral antennas shape and position from each other: (a) variation of the distance between them, (b) variation of the angle when the antennas are at 1 cm from each other, (c) variation of the angle when the antennas are at 2 cm from each other, (d) variation of the angle when the antennas are at 3 cm from each other.
Inventions 11 00072 g018
Figure 19. Signal amplitude modification with the variation of the rectangular spiral antennas position from each other: (a) variation of the distance between them, (b) variation of the angle when the antennas are at 1 cm from each other, (c) variation of the angle when the antennas are at 2 cm from each other.
Inventions 11 00072 g019
Figure 20. Signal amplitude modification with the variation of the rectangular spiral antennas position from each other: (a) variation of the distance between them, (b) variation of the angle when the antennas are at 2 cm from each other, (c) variation of the angle when the antennas are at 4 cm from each other, (d) variation of the angle when the antennas are at 6 cm from each other.
Inventions 11 00072 g020
Figure 21. Test stand: (a) visual image, (b) thermal image.
Inventions 11 00072 g021
Figure 22. Variation of the S parameters for a circular spiral antenna.
Inventions 11 00072 g022
Table 1. The dimensions of the structures considered.
De [mm]Ns [mm]w [mm]
1770.20.3
1960.20.3
1970.20.3
1970.20.4
1990.20.3
Table 2. Comparison of the results obtained through numerical, analytical and experimental methods for the inductor’s inductance.
Analyzed StructureL
Numerical Modeling [µH]
L
Analytically Calculated [µH]
L
Measured [µH]
Circular0.961.071.16
Rectangular1.211.241.35
Hexagonal0.911.070.95
Octagonal0.941.071.07
Table 3. Comparison of the results obtained through numerical, analytical, and experimental methods for the necessary capacitance to reach resonance at 13.56 MHz.
Analyzed StructureC
Numerical Modeling [pF]
C
Analytically Calculated [pF]
C
Measured [pF]
Circular160128.84131
Rectangular120111.5111
Hexagonal160128.13141
Octagonal161128.84141
Disclaimer/Publisher’s Note: The statements, opinions and data contained in all publications are solely those of the individual author(s) and contributor(s) and not of MDPI and/or the editor(s). MDPI and/or the editor(s) disclaim responsibility for any injury to people or property resulting from any ideas, methods, instructions or products referred to in the content.