Article

A Comparative Study on the Insulation Properties of Different Epoxy Materials for UHV DC Bushing Insulators

1
China Electric Power Science Research Institute, Beijing 100192, China
2
College of Electrical Engineering, Southwest Jiaotong University, Chengdu 611756, China
*
Author to whom correspondence should be addressed.
Inventions 2026, 11(4), 66; https://doi.org/10.3390/inventions11040066
Submission received: 29 April 2026 / Revised: 5 June 2026 / Accepted: 12 June 2026 / Published: 24 June 2026

Abstract

Ultra-high-voltage direct-current (UHVDC) transmission systems impose stringent requirements on the reliability of insulation materials used in converter transformer bushings. Epoxy resin systems are key insulating materials in resin-impregnated paper (RIP) capacitor bushings, and their processing characteristics, curing behavior, and electrical properties directly affect bushing performance. In this study, two epoxy insulation systems used for resin-impregnated paper (RIP) bushings, namely the imported Araldite LY1564/Aradur 3486 system and the domestic EP-2020/CA-3015 system, were systematically investigated through viscosity, curing, and electrical property tests. The results show that the viscosities of both resins decreased significantly with increasing temperature. At 60 °C, the viscosities of Resin A and Resin B were 151.6 mPa·s and 156.3 mPa·s, respectively. The mixed resin–hardener systems exhibited similar viscosity evolution and comparable pot life characteristics. DSC measurements revealed two-stage curing reactions for both materials, with first exothermic peak temperatures of 65.4 °C and 96.3 °C and second peak temperatures of 269.3 °C and 269.8 °C for Materials A and B, respectively. Electrical testing demonstrated that both materials exhibited similar temperature-dependent dielectric and resistivity behavior, with dielectric loss increasing at elevated temperatures and resistivity decreasing as temperature increased. The volume resistivity trends and dielectric characteristics of the two materials remained highly consistent throughout the investigated temperature range. The results indicate that Material B exhibits processing performance, curing characteristics, and electrical insulation properties comparable to those of Material A. Therefore, Material B demonstrates strong potential for application in UHVDC RIP bushing insulation systems and provides a promising alternative for the localization of key insulating materials.

1. Introduction

1.1. Research Background

Power systems are continuously expanding in scale, and the demand for long-distance power transmission is also increasing. Consequently, ultra-high-voltage direct current (UHV DC) transmission technology has been widely adopted. This technology offers advantages such as high transmission capacity, long transmission distances and low losses. Many countries have already utilised this technology in large-scale power grid projects. China’s construction scale in this field is also among the world’s leading.
DC transmission systems comprise a variety of critical components. Converter transformers, converter valves and bushings all have a significant impact on system operation. Among these, DC wall-penetrating bushings play a vital role in connecting different electrical zones. Current must pass through the bushing to be transmitted from indoor equipment to outdoor lines. Consequently, the bushing must not only withstand high voltages but also maintain stable insulation performance over the long term. Should an insulation fault occur in the bushing, system operation would be severely compromised. Resin-impregnated paper capacitor bushings are a common type of DC bushing structure. This structure typically employs a multi-layer capacitor screen configuration internally. During the manufacturing process, the insulating paper must undergo resin impregnation. Once cured, the resin forms a stable insulating structure. Epoxy resin and its curing agent system are therefore key materials in bushing manufacturing. The performance of these materials directly affects the quality of the insulating structure.
Epoxy materials must meet various requirements during processing. Firstly, the material must possess an appropriate viscosity. A lower viscosity facilitates the penetration of the resin into the insulating paper, thereby reducing air gaps and defects. Secondly, the material undergoes an exothermic reaction during curing. This exothermic behaviour affects the stability of the curing process; if heat is released too rapidly, internal stresses or defects may arise within the material. Finally, the cured material must possess excellent electrical insulation properties. These include low dielectric loss, stable dielectric constant, and high resistivity characteristics. These properties all influence the reliability of the bushings during long-term operation. Currently, some key insulation materials still rely primarily on imported products. Imported materials have accumulated considerable experience in engineering applications. However, this reliance also carries certain risks, such as unstable supply cycles and higher costs.
Domestic materials manufacturers have made some progress in recent years in the field of epoxy resin systems. Some domestically produced materials already possess good processability and electrical properties. However, the application of these materials in the field of UHV DC bushings requires further validation, necessitating systematic evaluation of material performance through experimental testing. By comparing domestic and imported materials, the differences between the two can be more clearly understood. The findings of such research can provide a basis for engineering applications. Consequently, conducting comparative studies on the processing properties, curing behaviour and electrical performance of epoxy materials is of significant value. This research will not only serve as a reference for material selection but also provide technical support for the domestic application of UHV DC bushings.
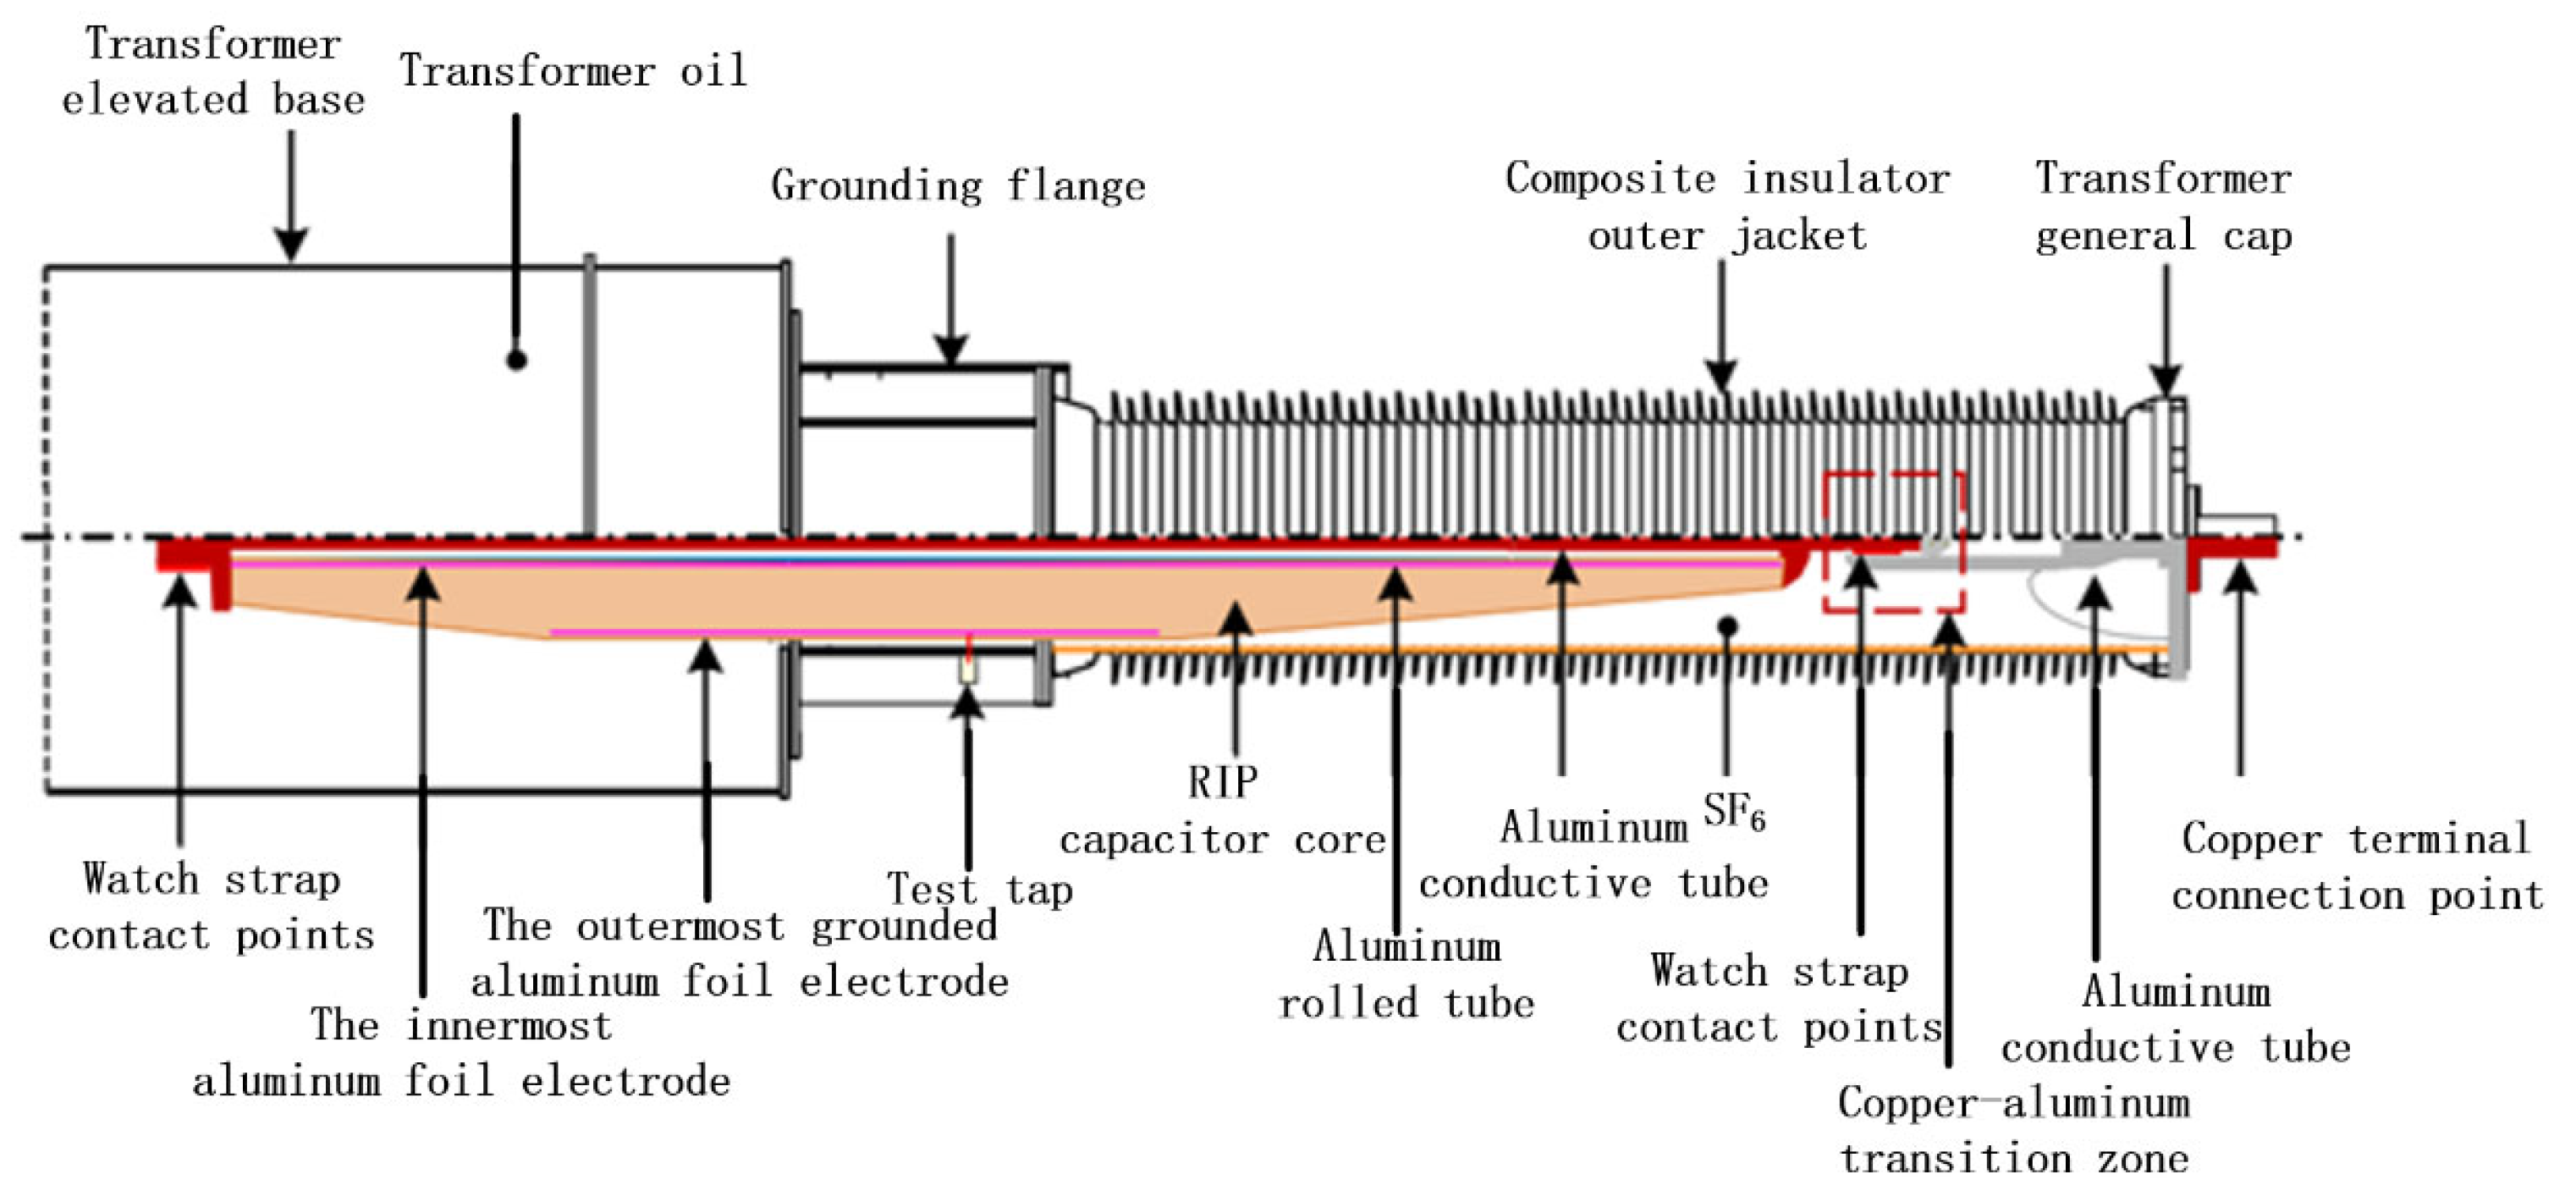
A schematic diagram of a typical resin-impregnated paper (RIP) bushing structure is shown in Figure 1. The epoxy resin system investigated in this study is mainly used for the impregnation and insulation reinforcement of the capacitor core, which directly affects the long-term electrical reliability of the bushing.

1.2. Current Status of Domestic and International Research

DC transmission equipment imposes stringent requirements on polymeric insulating materials, particularly under high-voltage direct-current electric, thermal, and environmental stresses [1,2]. Such research has primarily focused on aspects such as material structure, curing behaviour and electrical properties.
Firstly, some studies have focused on the application of epoxy resins in high-voltage insulation structures. Epoxy resins possess excellent mechanical and electrical insulation properties, and are therefore widely used in power equipment. For example, epoxy insulation structures can be found in bushings, transformers and gas-insulated equipment. Previous studies have shown that resin-impregnated paper insulation is widely used in high-voltage bushing structures, and its dielectric response, space charge behavior, and electro-thermal reliability directly influence the electric-field distribution and long-term operating stability of bushings [3,4,5]. Studies on epoxy resin and epoxy-impregnated insulation systems have demonstrated that microstructure, space charge accumulation, and charge transport behavior strongly affect dielectric response, breakdown characteristics, and insulation reliability under DC electric fields [5,6,7,8]. Consequently, the epoxy system has become a key material system in research on DC bushing insulation. Secondly, some scholars have investigated the curing behaviour of epoxy materials. Epoxy resin undergoes chemical reactions during the curing process. This reaction is typically accompanied by significant exothermic phenomena. Temperature fluctuations during curing affect the structural stability of the material. The curing regime directly affects the cross-linked network structure, dielectric properties, and thermal stability of epoxy resin insulation systems [9]. If curing conditions are inappropriate, defects or stress concentrations may arise within the material, thereby reducing insulating reliability. Consequently, investigating the curing reaction characteristics of epoxy materials is of great significance for optimising their application. In high-voltage electrical equipment, epoxy materials must maintain stable dielectric properties and breakdown strength. In recent years, interface charge-trap construction, nanofiller modification, and nonlinear conductivity design have been used to improve the dielectric strength, charge transport behavior, and thermal stability of epoxy-based insulation systems [10,11,12]. For example, inorganic fillers and interfacial modification strategies can regulate charge transport, introduce deep traps, and improve the dielectric performance of epoxy insulation materials. Relevant studies indicate that filler interfaces and charge-trapping structures can influence carrier transport mechanisms, thereby improving the electrical strength and insulation stability of epoxy materials [10,11,12]. Concurrently, some studies have also sought to improve thermal stability and breakdown strength by modifying the material structure. In addition, improving charge-trapping ability and regulating carrier migration have been shown to be effective approaches for enhancing the breakdown strength of epoxy insulation materials under high electric field or high-temperature conditions [8,9,12]. Furthermore, some studies have focused on the long-term operational performance of epoxy insulating materials. For instance, thermal ageing alters the chemical structure of the material and degrades its electrical properties. Relevant research indicates that thermal aging can deteriorate the morphology, resistivity, dielectric response, and breakdown performance of cured epoxy insulation materials, thereby reducing insulation stability [13]. Therefore, when evaluating insulating materials, it is necessary to comprehensively consider the thermal properties, electrical properties, and structural stability of the material.
Overall, existing research has analysed various properties of epoxy insulating materials. However, systematic comparative studies specifically addressing the application conditions of DC bushings remain scarce. In particular, there is still a limited body of published literature on comprehensive experimental investigations into the processing properties, curing behaviour and electrical properties of Material A and Material B. It is therefore necessary to conduct a systematic comparative analysis of the two materials through experimental testing.

1.3. Scope and Significance of This Study

For UHVDC resin-impregnated paper bushings, the epoxy insulation system must satisfy simultaneous requirements related to processing behavior, curing stability, and long-term electrical reliability. These requirements are not independent. The viscosity–temperature behavior determines whether the resin can effectively penetrate the porous insulating paper during vacuum impregnation. The time-dependent viscosity evolution governs the available processing window and pot life before gelation. The curing exothermic behavior affects the formation of the cross-linked network, internal thermal gradients, and potential residual stresses. Finally, the dielectric and resistivity properties of the cured material determine its ability to suppress polarization loss and charge transport under thermal and electrical stresses.
Therefore, the central objective of this study is not merely to compare two commercial epoxy systems, but to clarify how the processing, curing, and electrical characteristics of epoxy insulation systems are correlated and how these parameters can be used to evaluate their suitability for UHVDC RIP bushing applications. In this work, the imported Araldite LY1564/Aradur 3486 system is used as the engineering benchmark, while the domestic EP-2020/CA-3015 system is evaluated as a candidate insulation system. By comparing these two systems under the same testing conditions, the study aims to identify whether the domestic system can provide a comparable processing window, curing response, and temperature-dependent insulation behavior.
The main contribution of this work is the establishment of a process–curing–electrical property evaluation framework for epoxy insulation systems used in RIP bushings. This framework links viscosity evolution, curing exothermic characteristics, dielectric response, and resistivity behavior, thereby providing a more comprehensive basis for material selection than isolated single-property testing. The results can provide guidance for epoxy material selection, process parameter optimization, and localization of key insulation materials for UHVDC bushing manufacturing.

2. Materials and Methods

2.1. Experimental Materials and Preparation

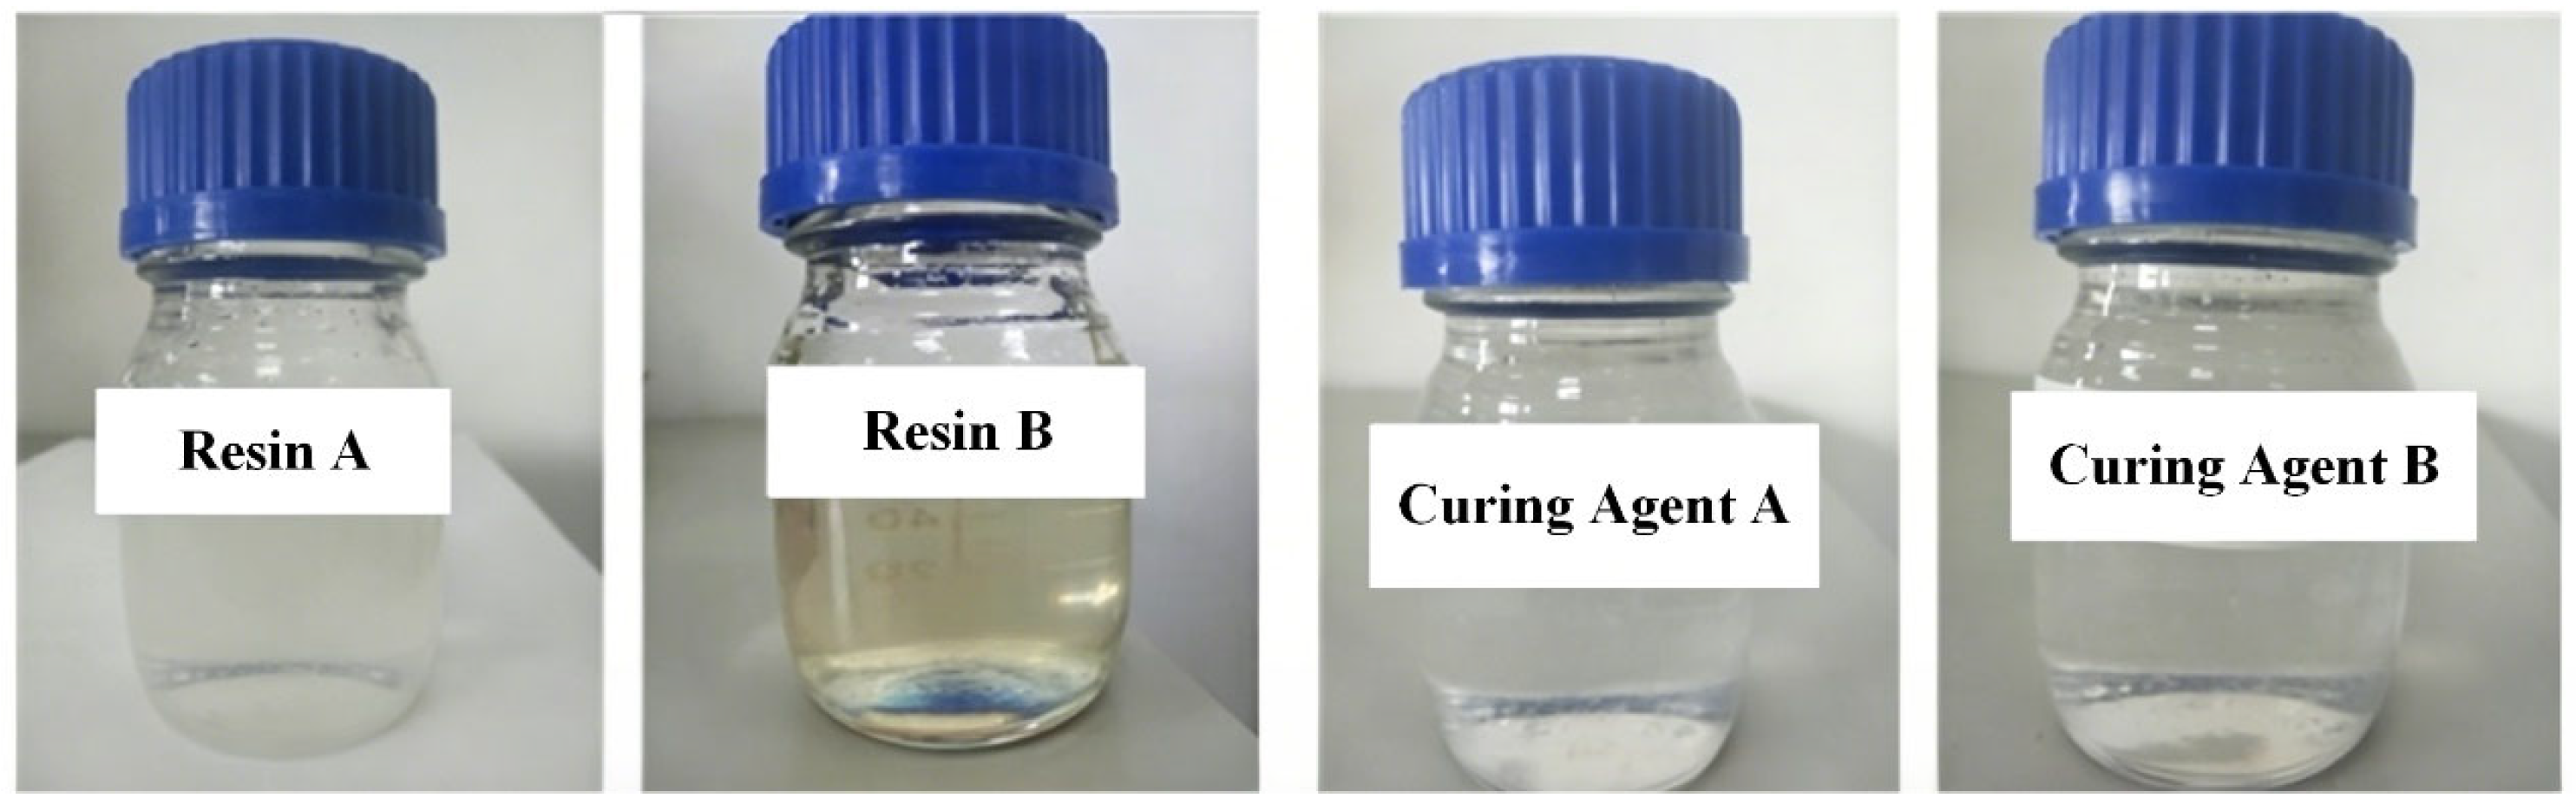
Two epoxy material systems were selected as the subjects of this study. The first group comprised Materials A commonly used in engineering applications. The second group comprised Materials B. Both types of material consisted of a resin and a curing agent. The resin and curing agent were mixed in the specified proportions, and experimental samples were then prepared. To facilitate comparison of the performance differences between the two materials, the basic parameters of the materials were first collated. Figure 2 presents the liquid resin and curing-agent samples used in the experimental investigation. Prior to specimen preparation, all materials were visually inspected to ensure the absence of contamination, precipitation, or phase separation.
Epoxy resin systems are widely used in high-voltage electrical equipment because of their favorable processability, curing controllability, dielectric properties, and mechanical stability [1,13,14]. Research indicates that epoxy resin possesses excellent insulating properties. For convenience of comparison throughout the manuscript, the imported Araldite LY1564/Aradur 3486 system is referred to as Material A, while the domestic EP-2020/CA-3015 system is referred to as Material B. During sample preparation, the resin and hardener were first weighed. The two materials were then mixed in the specified ratio. The experimental team used mechanical stirring to ensure the mixture was homogeneous. Subsequently, the mixed material underwent a degassing process under specified conditions. The degassing process reduces internal air bubbles in the material. As air bubbles can affect the material’s electrical properties, this step is particularly important. Once degassing is complete, the material is poured into a mold for curing. The curing process must be carried out under specific temperature conditions. After curing, the material is machined to produce test specimens of the specified dimensions. The resulting specimens are used for viscosity testing, thermal analysis and electrical performance testing.
The basic information and mixing ratios of the investigated epoxy systems are summarized in Table 1. Both systems employed the same resin-to-hardener mass ratio to ensure a fair comparison of processing and insulation properties.

2.2. Experimental Equipment

A variety of experimental equipment was utilised in this study to conduct material performance testing. Different types of equipment were employed for different types of experiments. Viscosity testing was carried out using a rotational viscometer. This instrument is capable of measuring changes in viscosity under varying temperature conditions. The rotational viscometer calculates viscosity by measuring the resistance encountered by a rotor as it rotates within the fluid. This method is widely applied in the study of the rheological properties of polymeric materials.
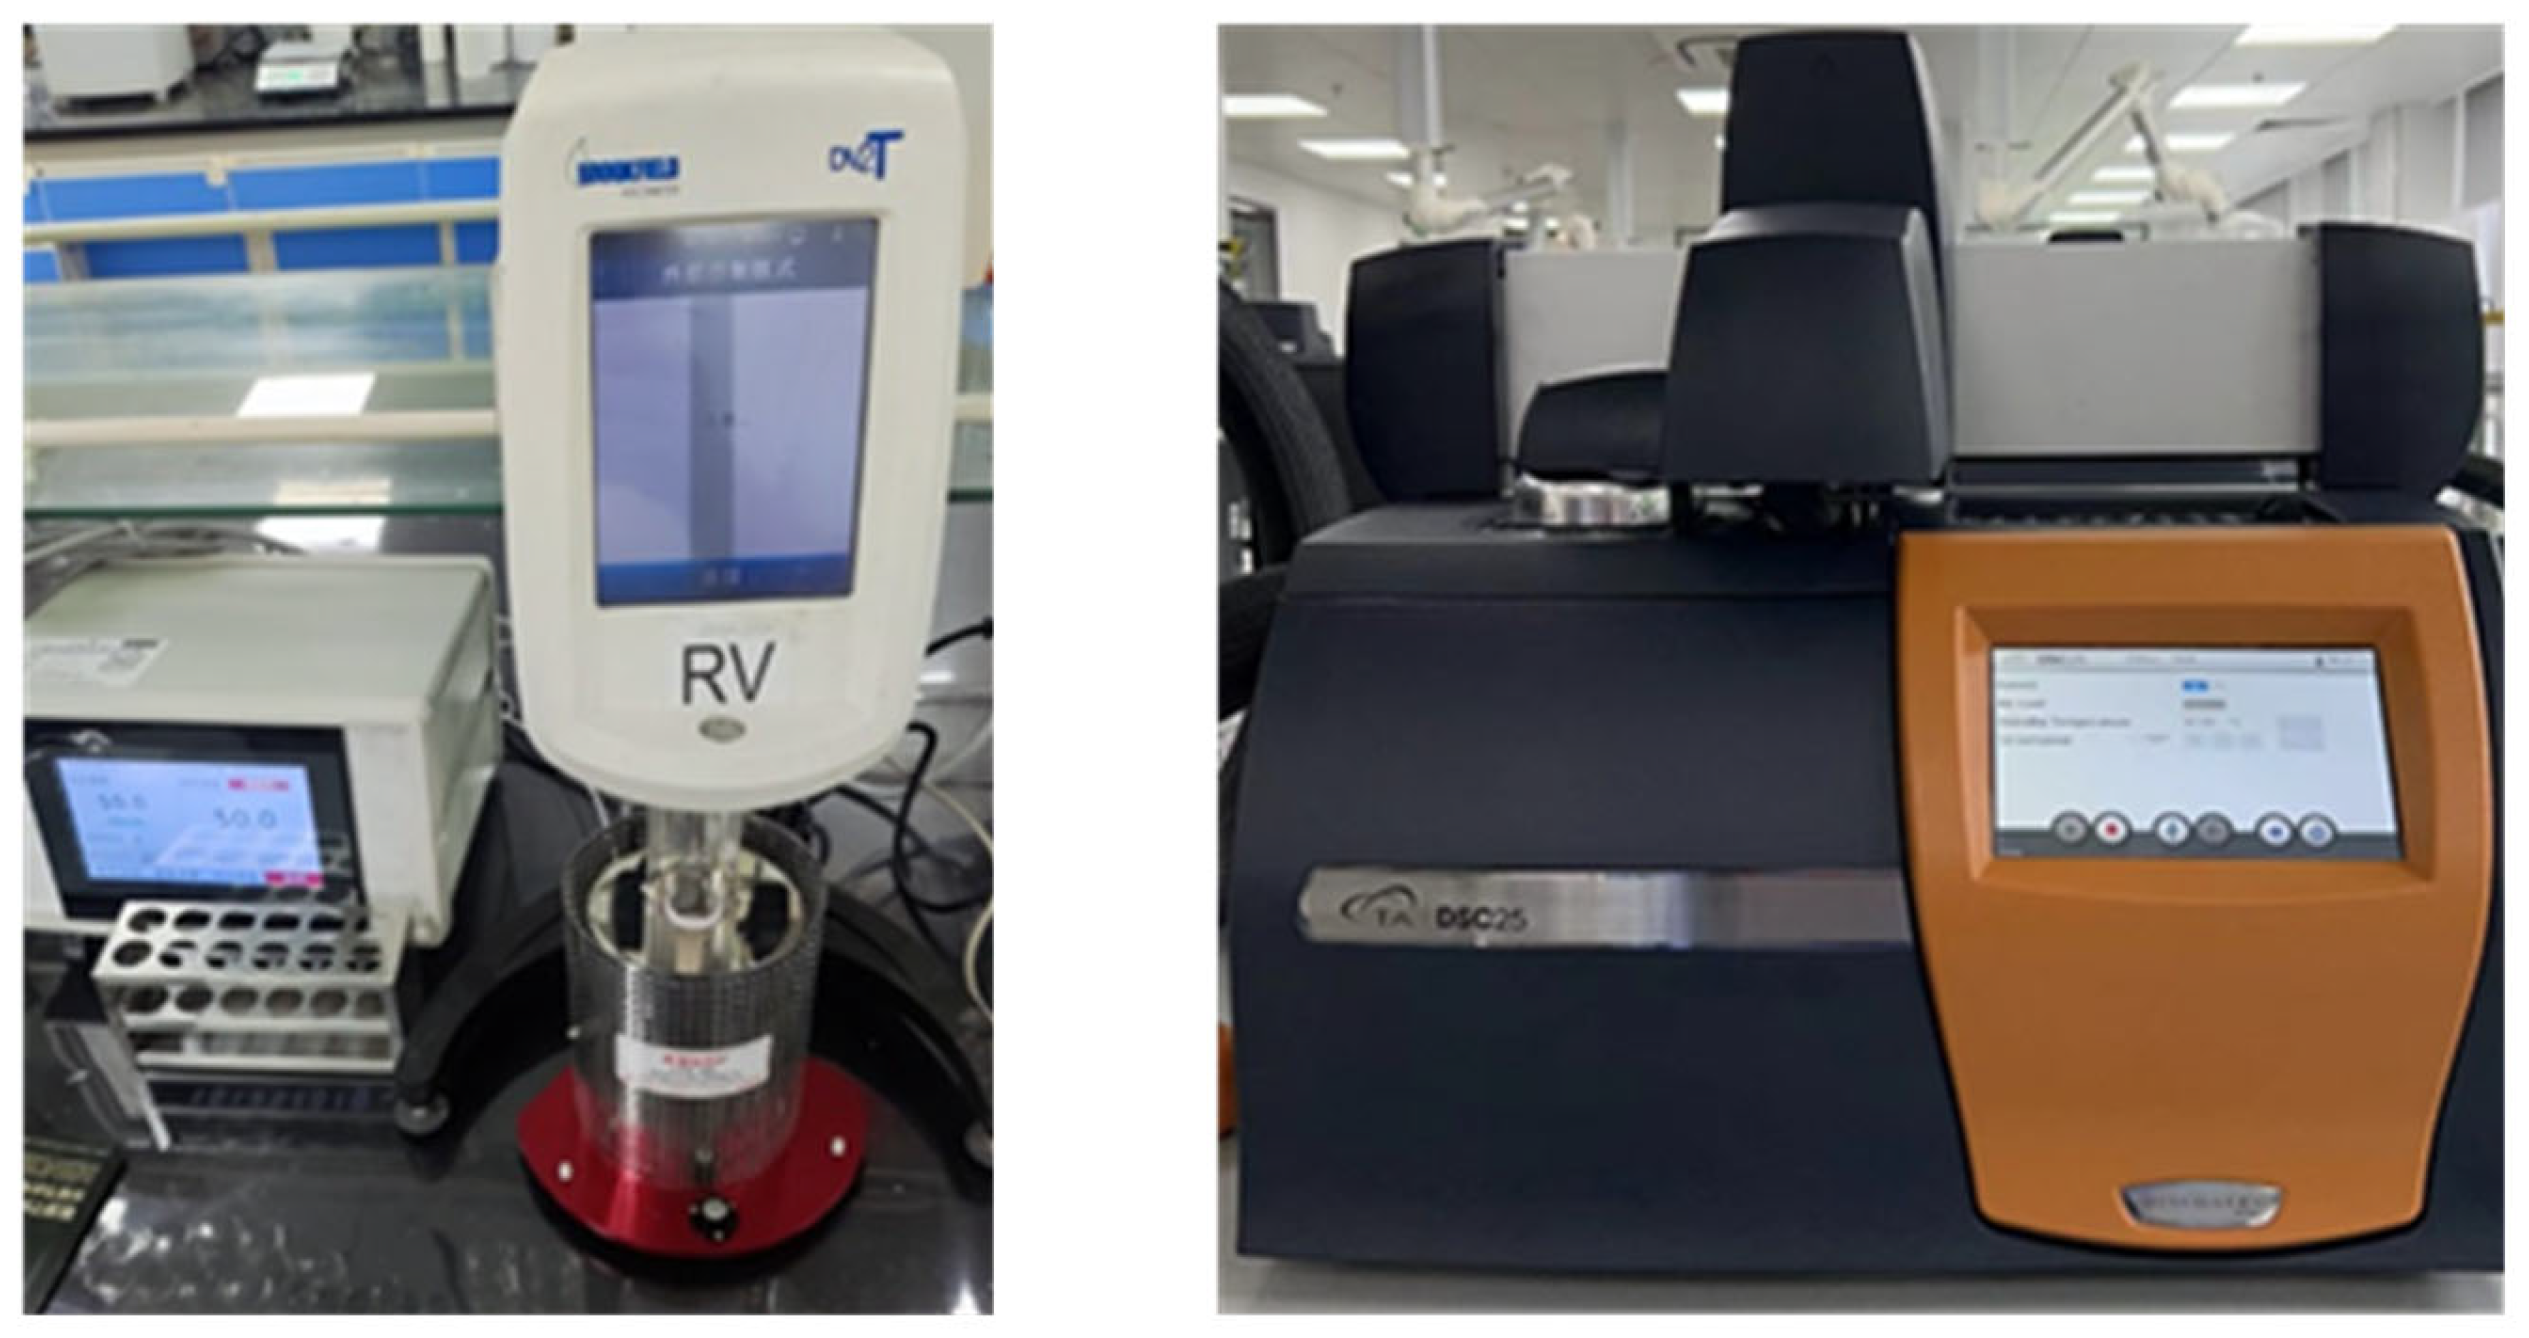
The viscosity and curing characteristics were measured using the experimental equipment shown in Figure 3. The rotational viscometer was used to evaluate rheological behavior, while the differential scanning calorimeter (DSC) was employed to investigate curing reactions and exothermic characteristics. A DSC can record changes in heat during heating or at a constant temperature. Epoxy resins undergo exothermic reactions during the curing process. A DSC can reflect the curing reaction characteristics of the material through exothermic peaks, and parameters such as curing temperature and reaction rate can be analysed from the DSC curve.
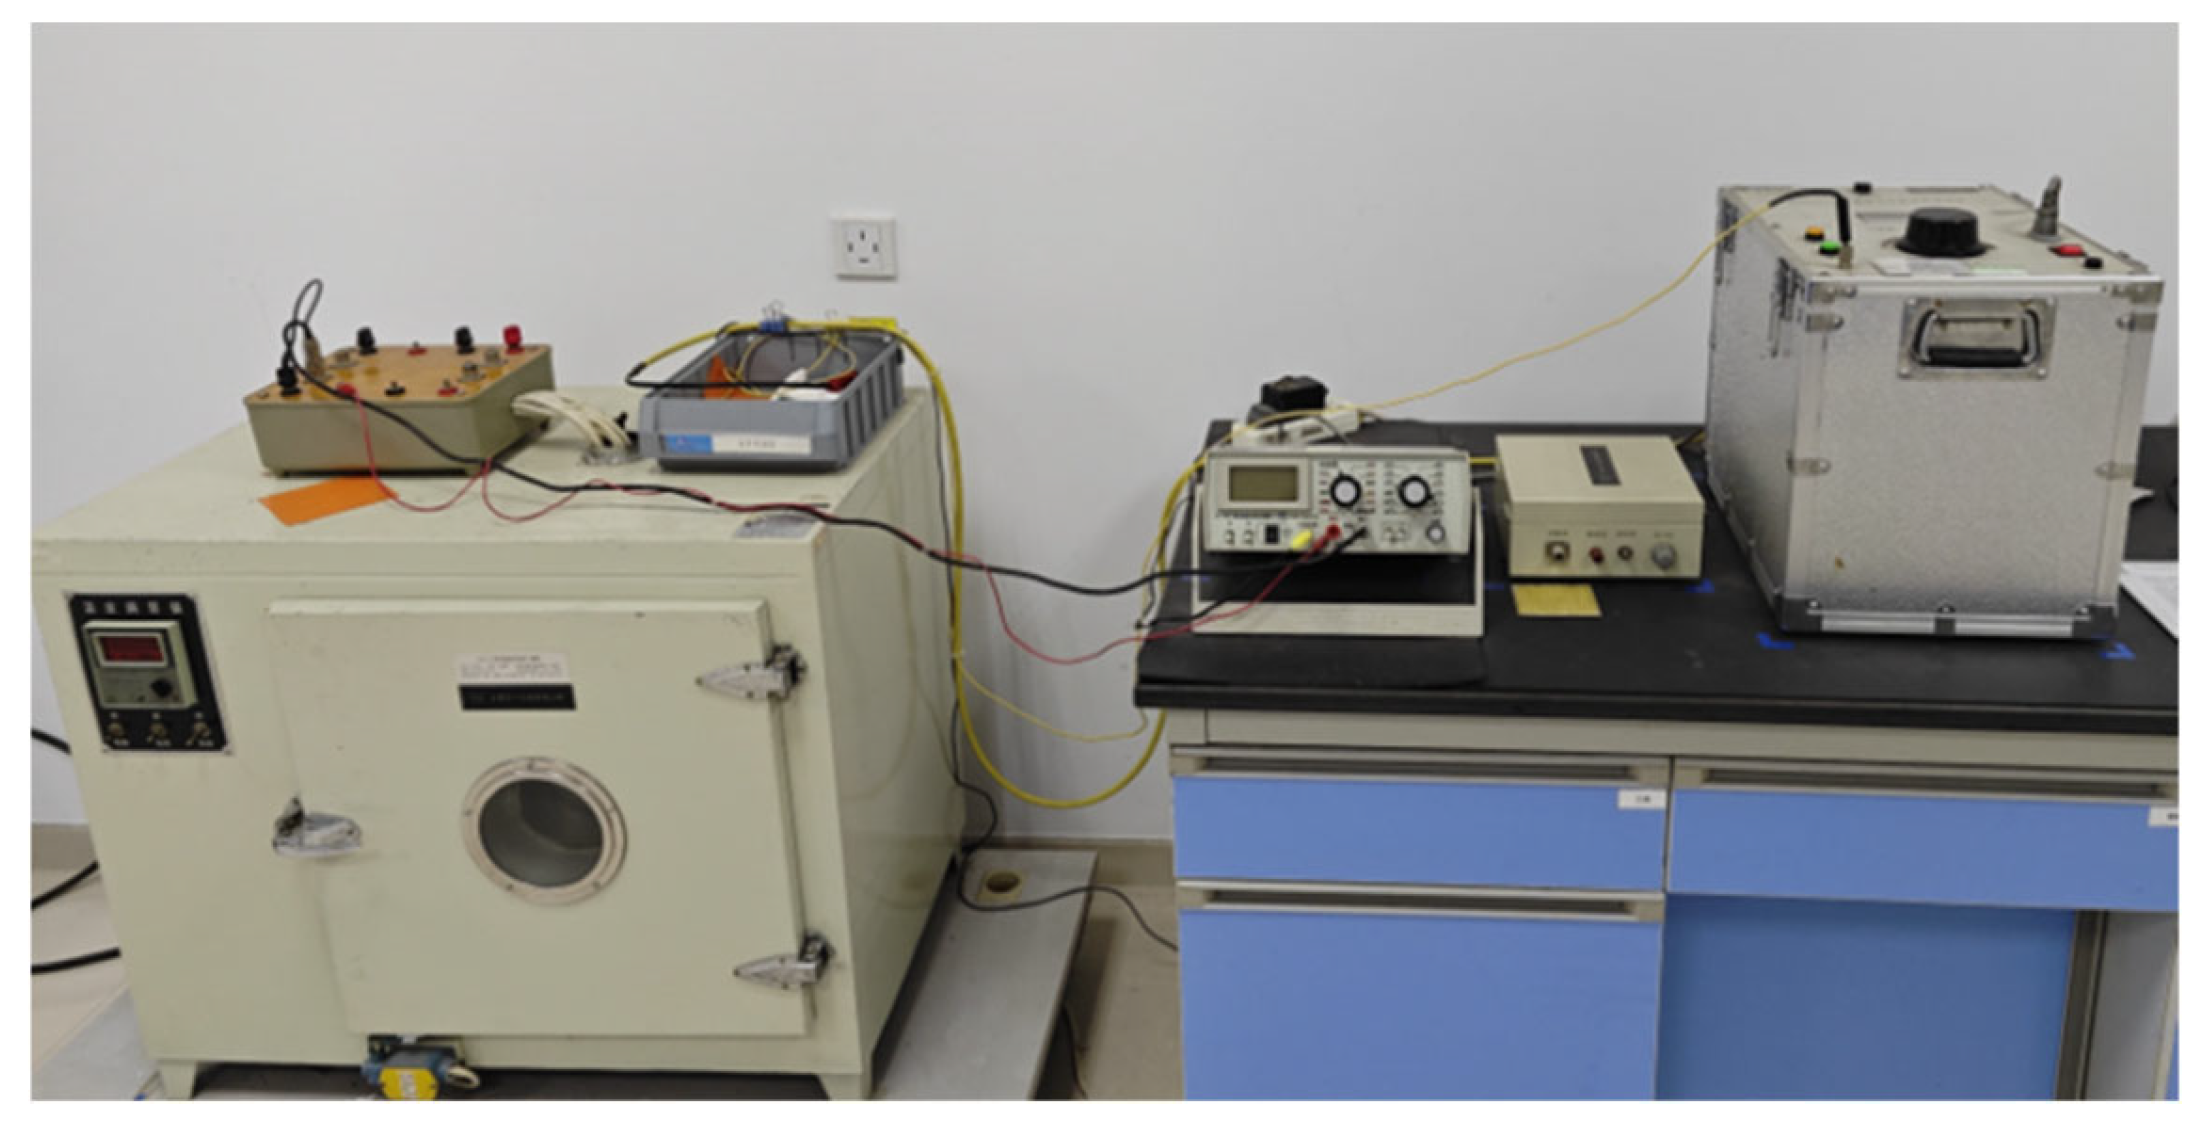
The electrical property testing platform is illustrated in Figure 4. This system was used to evaluate dielectric properties, volume resistivity, and surface resistivity over a wide temperature range. Dielectric property testing is typically carried out using a wide-temperature-range dielectric testing system. This equipment can measure the dielectric constant and dielectric loss of materials under different temperature conditions. Dielectric loss and dielectric constant were measured using a wide-temperature-range dielectric testing system. The resistivity characteristics were measured using a high-resistance meter, including volume resistivity and surface resistivity under different temperature conditions. Resistance characteristic testing is carried out using a high-resistance meter. This equipment can measure the volume resistivity of materials under different temperature conditions. Volume resistivity reflects the ability of charge carriers to migrate within the material. A higher volume resistivity generally indicates better insulating performance.

2.3. Test Protocol

This study conducts experimental testing across three aspects: material processing properties, thermal behavior, and electrical properties. The testing includes viscosity–temperature characteristics, exothermic behavior during the curing reaction, and temperature-dependent dielectric and resistivity properties. The researchers first tested the viscosity changes in the material under different temperature conditions. This test reflects the material’s flow characteristics during the impregnation process. Subsequently, the researchers tested the exothermic behavior of the material during the curing process. This experiment reflects the stability of the material’s curing reaction. Finally, the researchers tested the material’s electrical properties under different temperature conditions. Through these experiments, the material’s performance in high-voltage insulation applications can be comprehensively evaluated.

2.3.1. Viscosity–Temperature Characteristics Test

Viscosity is a key parameter for evaluating the processing properties of epoxy materials. Material viscosity affects the impregnation efficiency of the resin within the insulating paper. If the material viscosity is too high, the resin struggles to penetrate the internal structure of the insulating paper. Therefore, researchers need to test the viscosity changes in the material under different temperature conditions. A rotational viscometer was used for the measurements.
The selected temperature range covers the practical processing temperatures typically used during RIP bushing manufacturing. These parameters ensure that the measured viscosity behavior is representative of industrial production conditions. The experiment began with a viscosity test on the single-component resin. The experimenter placed the resin sample in a temperature-controlled chamber. The viscosity was then measured at various temperatures. The same test was subsequently carried out on the curing agent. Finally, the viscosity of the resin–curing agent mixture was tested. Additionally, the experiment measured the viscosity of the mixture as a function of time under constant temperature conditions. This test reflects the workable time of the material during processing. An excessively short workable time increases manufacturing difficulty. Therefore, this parameter is of significant importance for the application of the material. All viscosity test results are presented in Table 2.

2.3.2. Testing of Exothermic Characteristics of the Curing Reaction

Epoxy resins undergo cross-linking reactions during the curing process. This reaction releases a certain amount of heat. The exothermic process affects the quality of the cured material. If the heat release rate is too rapid, significant temperature gradients may develop within the material. Researchers used a differential scanning calorimeter (DSC) to test the material. The experiment began by placing a small sample of the material into a DSC sample pan. Subsequently, the instrument heated the sample according to a preset programme. The instrument records changes in heat flow during the heating process. Researchers analyse the exothermic curve to determine the characteristic temperatures and peak exothermic values of the material’s curing reaction. Studies indicate that the curing reaction process of epoxy materials influences their final structure and insulating properties. Consequently, curing exothermic behaviour has become a key indicator for evaluating epoxy systems.

2.3.3. Electrical Performance Testing

Electrical properties are key indicators for evaluating insulating materials. To assess the temperature-dependent insulation properties of the cured materials, this study conducted tests on dielectric loss, dielectric constant, volume resistivity, and surface resistivity.
The electrical testing conditions listed in Table 3 were selected according to relevant insulation material standards and operating requirements for high-voltage electrical equipment. The experiment first tested the dielectric loss and dielectric constant of the materials under different temperature conditions. Dielectric loss reflects the energy loss of the material in an electric field, while dielectric constant reflects the polarization response of the material. Finally, the researchers tested the volume resistivity and surface resistivity of the materials. Resistivity reflects the material’s ability to suppress charge transport. Previous studies have shown that the dielectric response and resistivity of epoxy-based insulation materials are strongly temperature-dependent, because temperature affects molecular segment motion, polarization relaxation, and charge-carrier transport [14,15]. Finally, the researchers tested the volume resistivity of the materials. Volume resistivity reflects the material’s electrical conductivity. Studies have shown that volume resistivity varies with temperature. Therefore, testing must be conducted under different temperature conditions. Through the above experiments, the differences between Materials A and Materials B in terms of processing performance, thermal behavior and electrical insulation properties can be systematically evaluated.

3. Results

3.1. Viscosity–Temperature Characteristics Test

Viscosity is a key parameter for evaluating the processing performance of epoxy materials. The material must possess good flow properties during the impregnation process. If the viscosity is too high, the resin will struggle to penetrate the internal structure of the insulating paper. If the viscosity is too low, the material may be difficult to control during processing. Consequently, the processing performance of the material is typically assessed via its viscosity–temperature relationship.

3.1.1. Viscosity–Temperature Testing

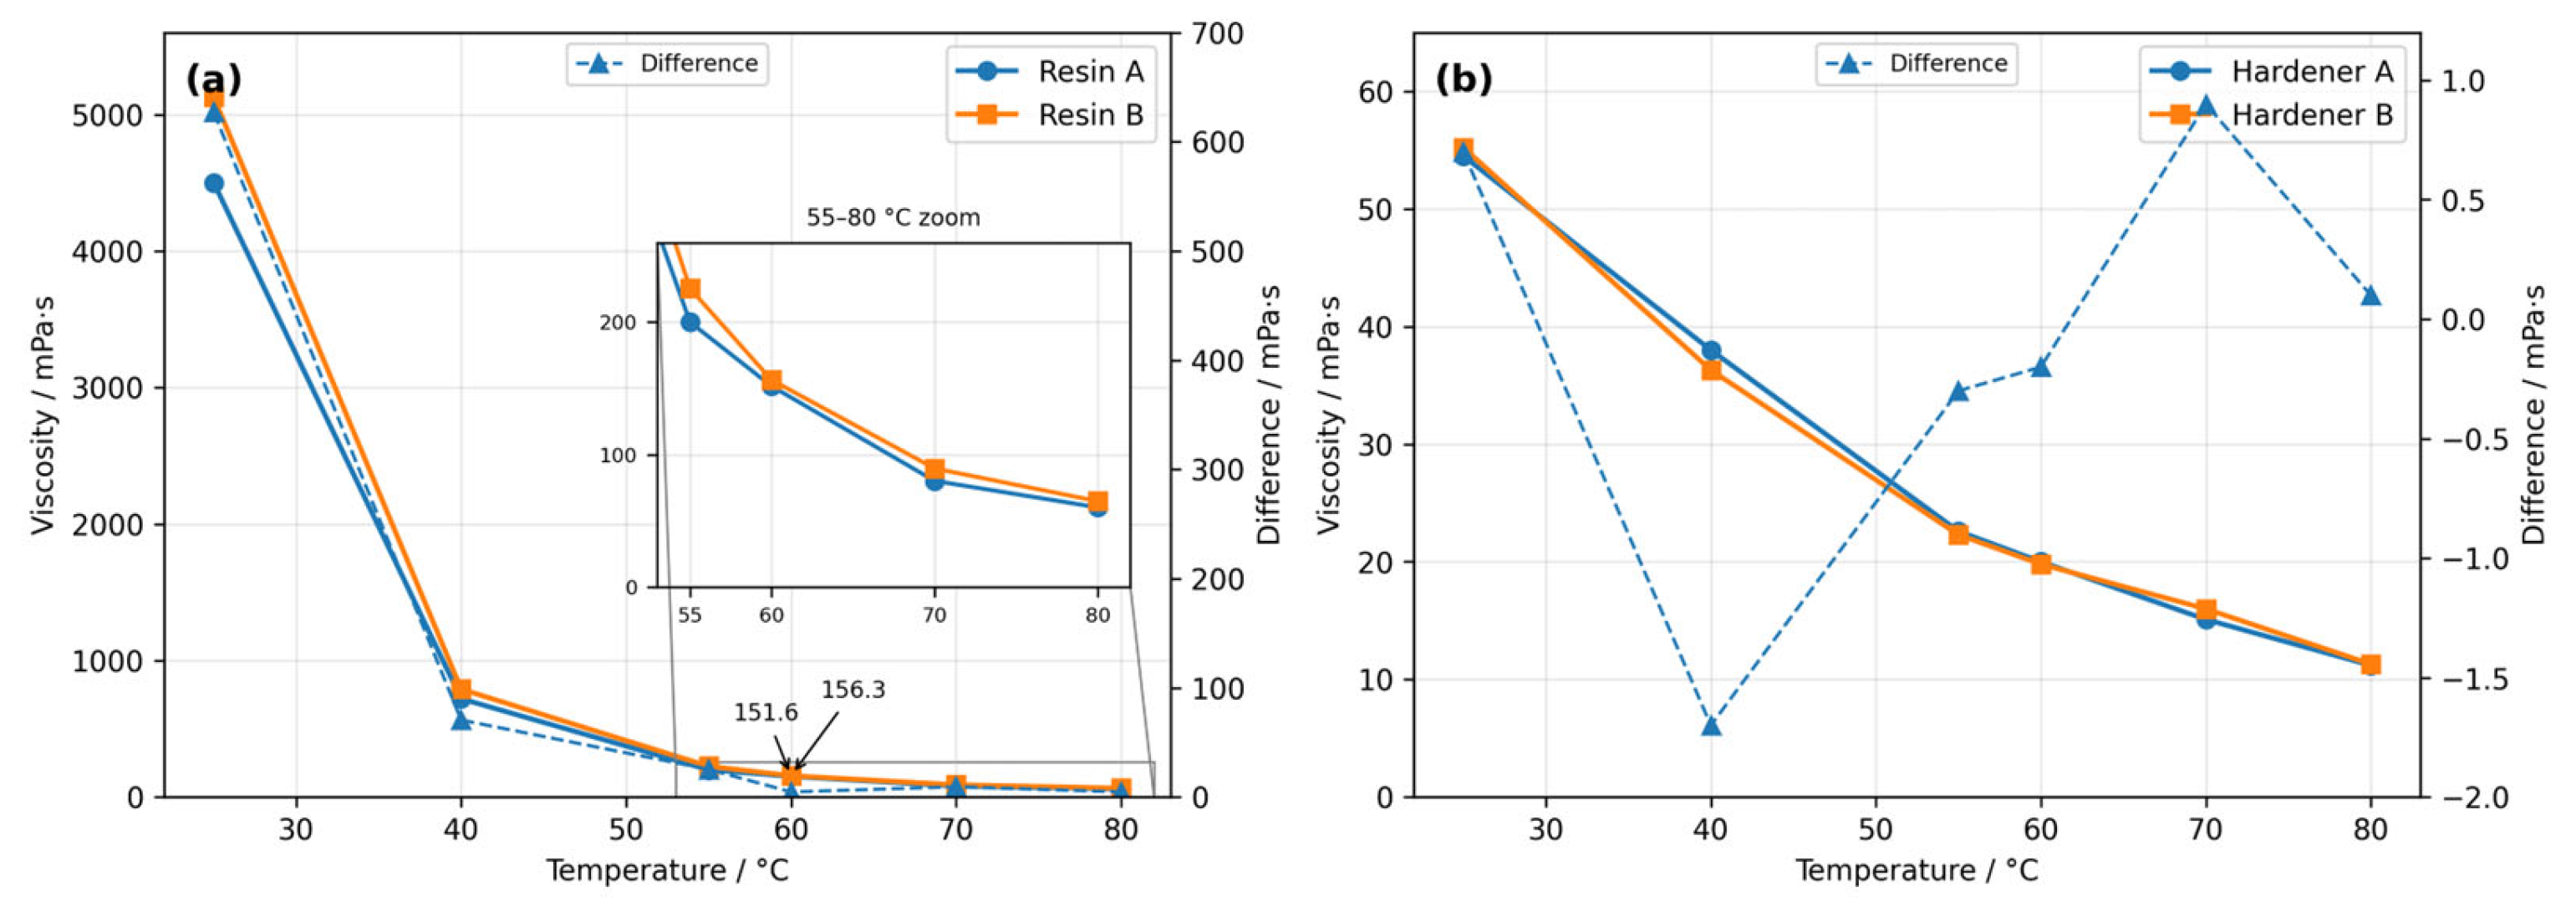
The viscosity–temperature curves of Resin A and Resin B are shown in Figure 5a. The results indicate that the viscosities of both resins decrease sharply with increasing temperature. At 25 °C, the viscosities of the two resins are relatively high, remaining in the range of approximately 4000–5000 mPa·s. This high viscosity at room temperature is mainly attributed to the limited mobility of epoxy molecular chains and relatively strong intermolecular interactions at low temperature. Under these conditions, the resistance to molecular motion is large, resulting in poor fluidity.
When the temperature increases from 25 °C to 40 °C, the viscosity of both resins decreases rapidly to below 1000 mPa·s. This sharp reduction of approximately 3000–4000 mPa·s is caused by the significant enhancement of molecular thermal motion. As temperature increases, the free volume within the resin system increases, intermolecular interactions are weakened, and the resistance to flow is greatly reduced. Therefore, the resin changes from a relatively high-viscosity state to a low-viscosity state suitable for impregnation.
The comparison at 60 °C was selected because this temperature is located within the typical processing temperature range used for resin impregnation in RIP bushing manufacturing. At this temperature, the resin must maintain sufficiently low viscosity to penetrate the porous insulating paper structure and reduce the formation of voids and defects. As shown in the enlarged inset of Figure 5a, the viscosity of Resin A at 60 °C is 151.6 mPa·s, whereas that of Resin B is 156.3 mPa·s. The difference between the two values is only 4.7 mPa·s, corresponding to a relative deviation of approximately 3.1%. This indicates that Resin B exhibits flow characteristics very similar to those of Resin A under practical impregnation conditions.
Overall, Resin B shows a slightly higher viscosity than Resin A over most of the investigated temperature range, but the difference becomes much smaller at elevated temperatures. In particular, within the range of 55–80 °C, both resins maintain low viscosity and show highly comparable temperature-dependent rheological behavior. These results suggest that the domestic Resin B can provide processing properties comparable to those of the imported Resin A during high-temperature impregnation. From an engineering perspective, the rapid viscosity reduction between 25 °C and 40 °C indicates that moderate preheating is essential for improving resin impregnation efficiency, while the comparable low-viscosity behavior of the two systems above 55 °C suggests that Material B can be processed under conditions similar to those used for Material A.
As shown in Figure 5b, the viscosity–temperature curves of Hardener A and Hardener B are significantly different from those of the epoxy resins shown in Figure 5a in terms of absolute viscosity level. The viscosities of both hardeners are much lower than those of the corresponding epoxy resins over the whole investigated temperature range. This is mainly because the curing agents generally possess lower molecular weight, smaller molecular size, and weaker molecular-chain entanglement than epoxy resins. Therefore, their resistance to flow is much smaller, resulting in better fluidity.
In addition, no marked viscosity difference is observed between Hardener A and Hardener B. The two curves almost overlap within the investigated temperature range, indicating that the imported and domestic curing agents have very similar rheological behavior. This similarity is beneficial for the subsequent mixing process because comparable hardener fluidity helps ensure homogeneous dispersion of the curing agent in the epoxy resin and reduces the risk of local concentration gradients during preparation.
The viscosity of both hardeners gradually decreases as the temperature increases from 25 °C to 80 °C. This decrease can be attributed to the enhancement of molecular thermal motion at elevated temperatures. With increasing temperature, intermolecular interactions are weakened, molecular mobility is improved, and flow resistance is reduced. Consequently, both hardeners exhibit improved fluidity at higher temperatures. From the perspective of RIP bushing manufacturing, the low and stable viscosity of the curing agents is advantageous for resin–hardener mixing and subsequent vacuum impregnation.

3.1.2. Viscosity–Temperature Testing of Resin–Hardener Mixed Systems

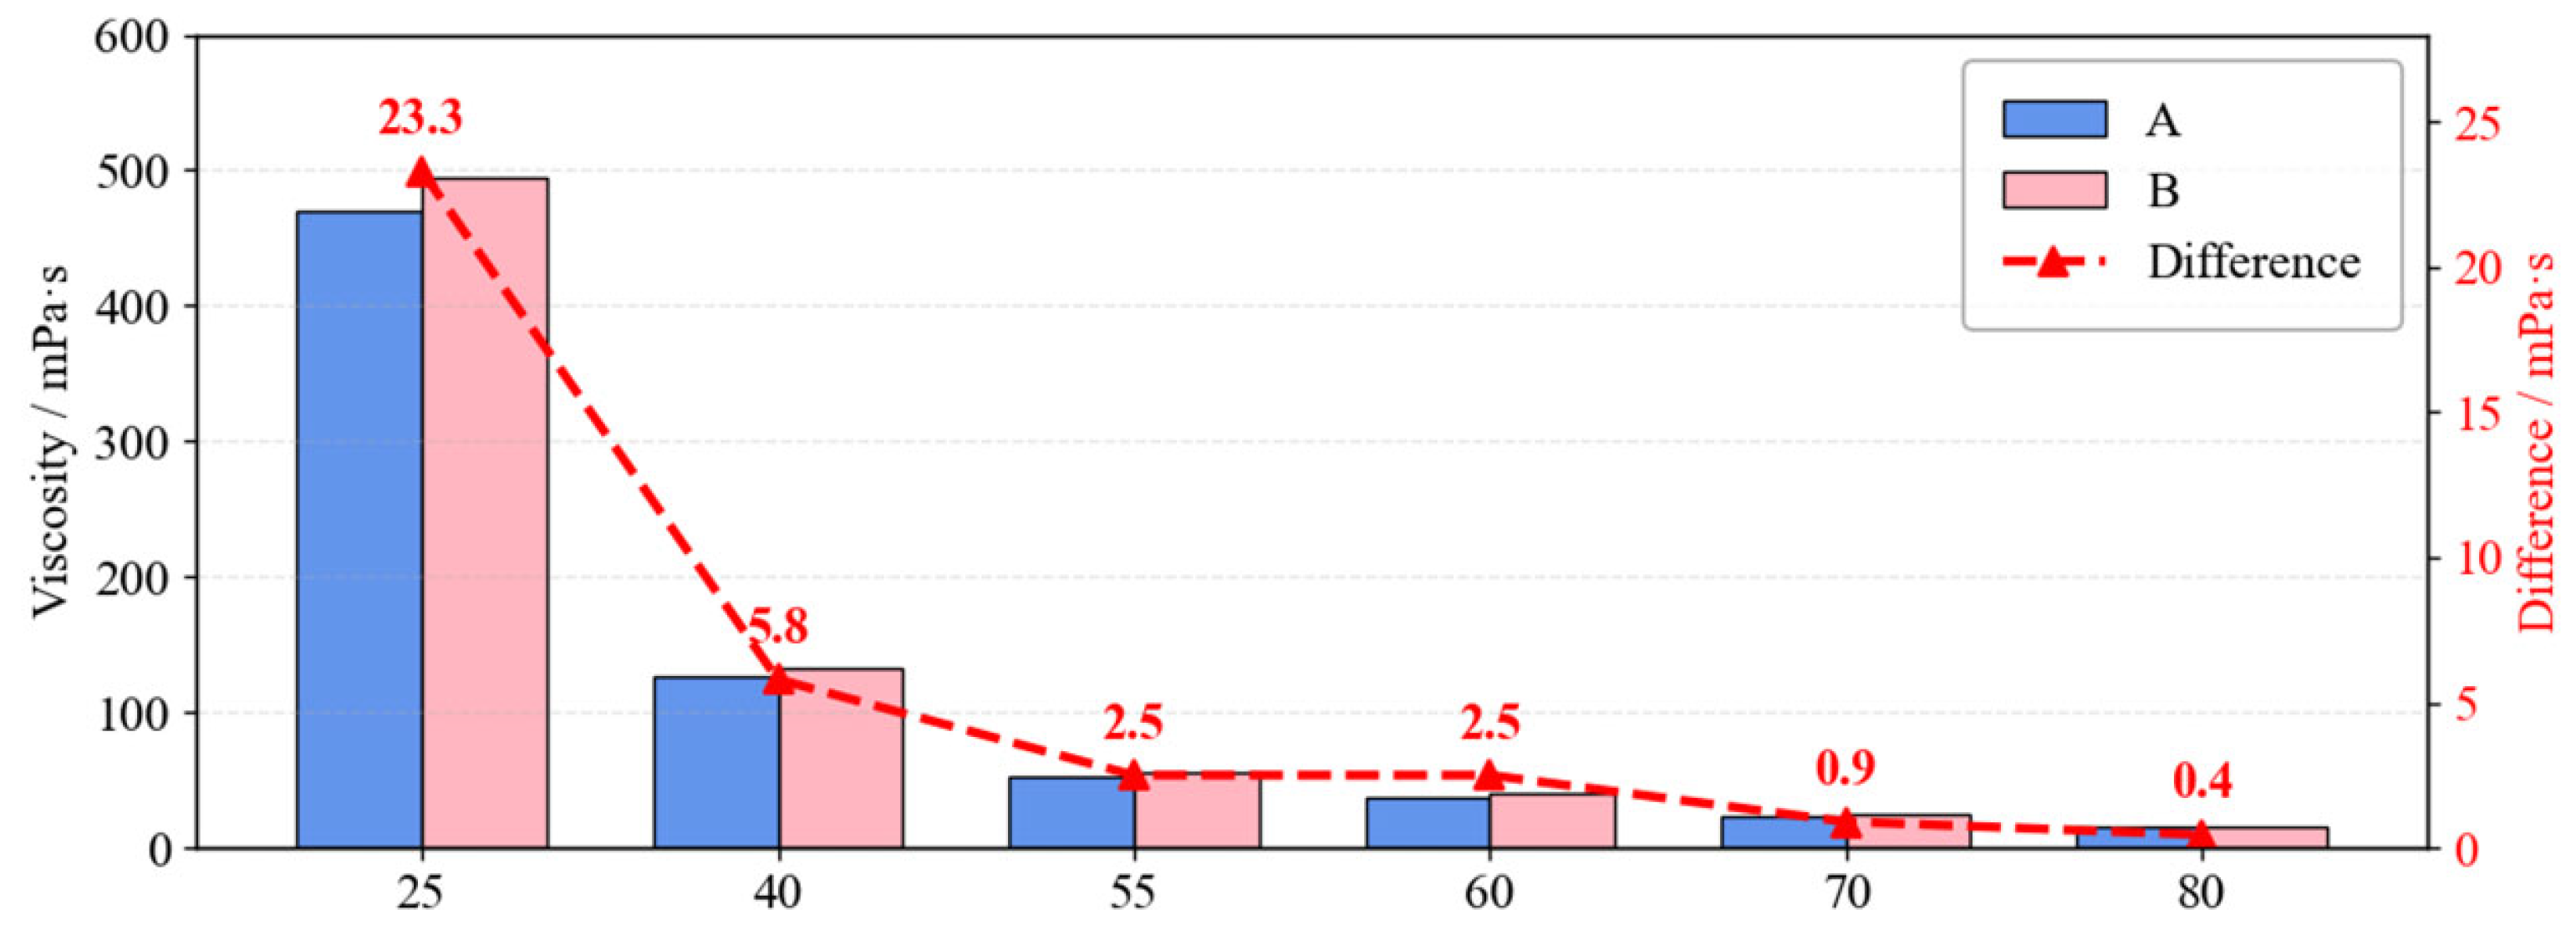
The resin and curing agent were mixed according to the specified mass ratio, and the viscosity–temperature behavior of the Resin A/Hardener A and Resin B/Hardener B mixed systems was then tested. The corresponding viscosity–temperature curves are shown in Figure 6, and the representative measured values are summarized separately in Table 4.
As shown in Figure 6, the viscosities of both mixed systems decrease significantly with increasing temperature. At 25 °C, the viscosity of the Resin A/Hardener A system is 470.6 mPa·s, while that of the Resin B/Hardener B system is 493.9 mPa·s. When the temperature increases to 40 °C, the viscosities of both systems decrease sharply to approximately 100 mPa·s. This rapid decrease is mainly attributed to the enhancement of molecular thermal motion in the resin–hardener mixtures. With increasing temperature, the free volume of the mixed system increases, intermolecular interactions are weakened, and the mobility of molecular chains is improved. As a result, the resistance to flow is greatly reduced, leading to a pronounced decrease in viscosity.
When the temperature further increases from 40 °C to 80 °C, the decrease in viscosity becomes less significant. This is because the mixed systems have already entered a relatively low-viscosity state after heating to approximately 40 °C. In this temperature range, the flow resistance has been largely reduced, and the additional viscosity reduction caused by further heating is therefore limited. This indicates that the viscosity–temperature relationship of the resin–hardener mixed systems is nonlinear, showing a rapid decline in the low-temperature range and a gradual decrease in the high-temperature range.
The data listed in Table 4 further confirm this trend. At 55 °C, the viscosities of the Resin A/Hardener A and Resin B/Hardener B systems are 55.9 mPa·s and 56.7 mPa·s, respectively. At 60 °C, the corresponding viscosities are 37.5 mPa·s and 40.0 mPa·s. The difference between the two systems is small within the main impregnation temperature range, indicating that the domestic EP-2020/CA-3015 system has viscosity–temperature behavior comparable to that of the imported Araldite LY1564/Aradur 3486 system.
Overall, the viscosity of the Resin B/Hardener B system is slightly higher than that of the Resin A/Hardener A system at the tested temperatures, but the difference remains limited. The small viscosity difference suggests that Material B can provide similar flow and impregnation characteristics to Material A. From the perspective of RIP bushing manufacturing, the low viscosity of both mixed systems above 40 °C is beneficial for resin penetration into insulating paper, while the comparable rheological behavior indicates that Material B can be processed under conditions similar to those used for Material A.

3.1.3. Time–Viscosity Testing of A/B Resin + Hardener Systems

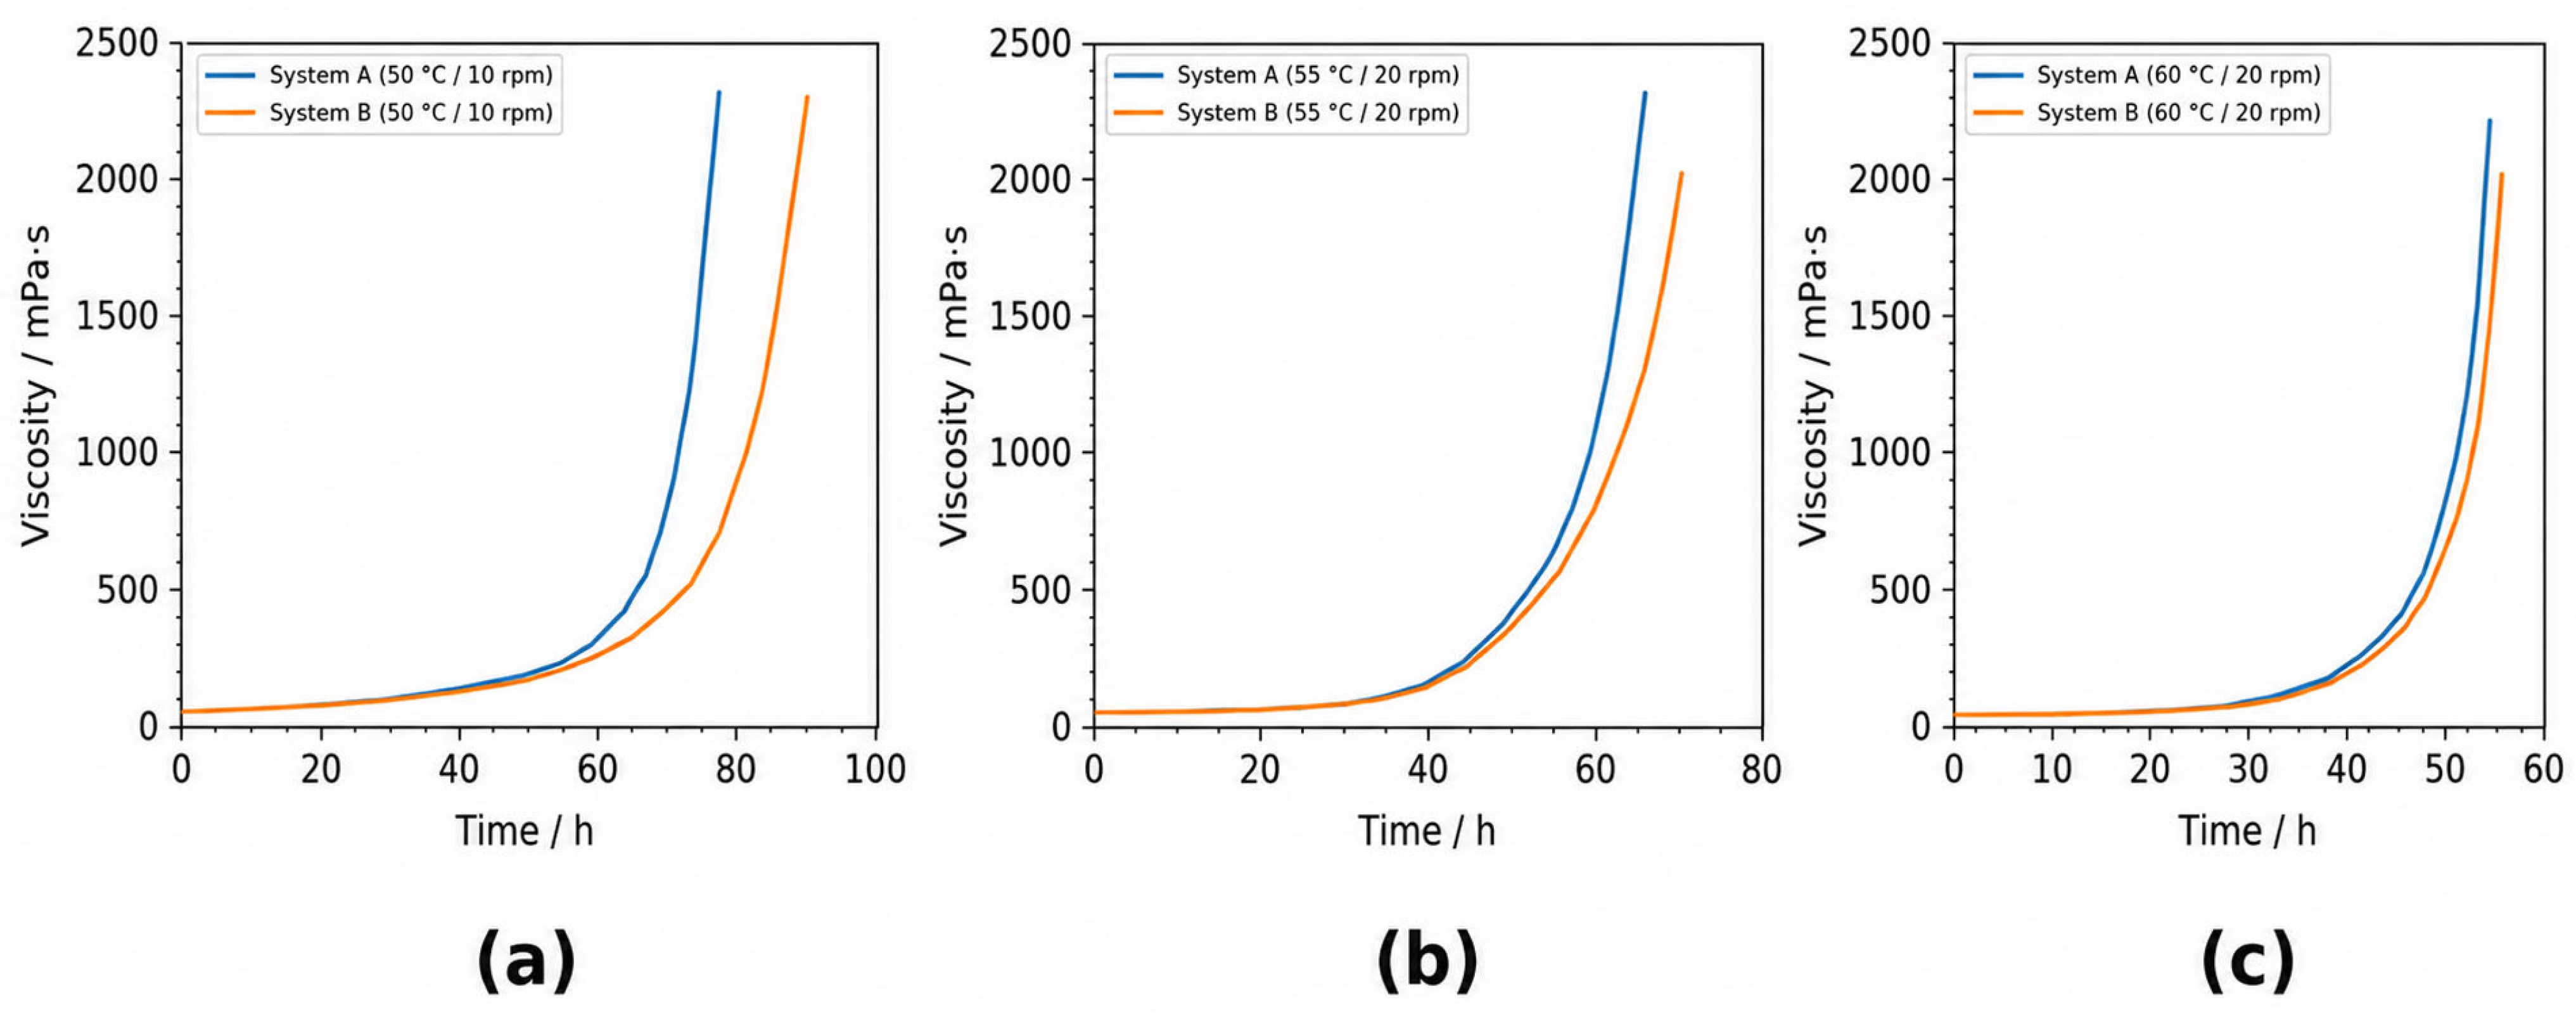
The time-dependent viscosity of the Resin A/Hardener A and Resin B/Hardener B mixed systems was tested under different processing conditions. The corresponding results are shown in Figure 7. To improve readability, the three graphs in Figure 7 have been labeled as Figure 7a, Figure 7b, and Figure 7c, corresponding to 50 °C/10 rpm, 55 °C/20 rpm, and 60 °C/20 rpm, respectively.
As shown in Figure 7, the viscosities of both mixed systems increase gradually with time and then rise rapidly after a certain period. This behavior is mainly related to the curing reaction of the epoxy resin system. In the initial stage, the resin and curing agent remain in a relatively low-reactivity state, and the molecular chains still have sufficient mobility. Therefore, the viscosity changes slowly. As the reaction proceeds, epoxy groups react with the curing agent, and a cross-linked network begins to form. The molecular mobility is gradually restricted, resulting in a rapid increase in viscosity. The time at which the viscosity begins to rise sharply can be used to evaluate the processing window and pot life of the material system.
Figure 7a shows the time–viscosity curves of the two mixed systems at 50 °C and 10 rpm. Under this condition, the viscosity increase mainly occurs between approximately 40 h and 80 h. The separation between the curves of System A and System B is relatively significant, indicating that the two systems exhibit a more obvious difference in viscosity evolution at this lower processing temperature and rotational speed. System A enters the rapid viscosity-growth stage earlier than System B, suggesting that System A has a slightly faster curing response or a shorter effective processing window under this condition.
Figure 7b presents the time–viscosity curves at 55 °C and 20 rpm. Compared with Figure 7a, the rapid viscosity increase occurs earlier, mainly between approximately 40 h and 60 h. This indicates that increasing the temperature and rotational speed accelerates the viscosity growth of the resin–hardener mixed systems. The separation between the curves of System A and System B becomes smaller, suggesting that the viscosity evolution behaviors of the two systems become more similar under this condition.
Figure 7c shows the time–viscosity curves at 60 °C and 20 rpm. Under this condition, the rapid viscosity rise mainly occurs between approximately 40 h and 55 h, indicating a further shortening of the available processing time. Compared with Figure 7b, the higher temperature accelerates the curing reaction and leads to earlier viscosity growth. The separation between System A and System B is similar to that observed in Figure 7b, and both systems exhibit comparable time-dependent viscosity behavior.
Overall, the three subgraphs in Figure 7 demonstrate that the viscosity evolution of the resin–hardener systems is strongly affected by temperature and rotational speed. A lower temperature and lower rotational speed result in a longer viscosity-stable period and a wider processing window, whereas higher temperature and rotational speed accelerate the curing reaction and shorten the pot life. Although a relatively obvious difference between Systems A and B is observed at 50 °C/10 rpm, their viscosity-growth behaviors become more comparable at 55 °C/20 rpm and 60 °C/20 rpm. These results indicate that the domestic EP-2020/CA-3015 system can provide a processing window similar to that of the imported Araldite LY1564/Aradur 3486 system under practical processing conditions, which is beneficial for resin impregnation and curing in RIP bushing manufacturing.

3.2. Exothermic Reaction Testing

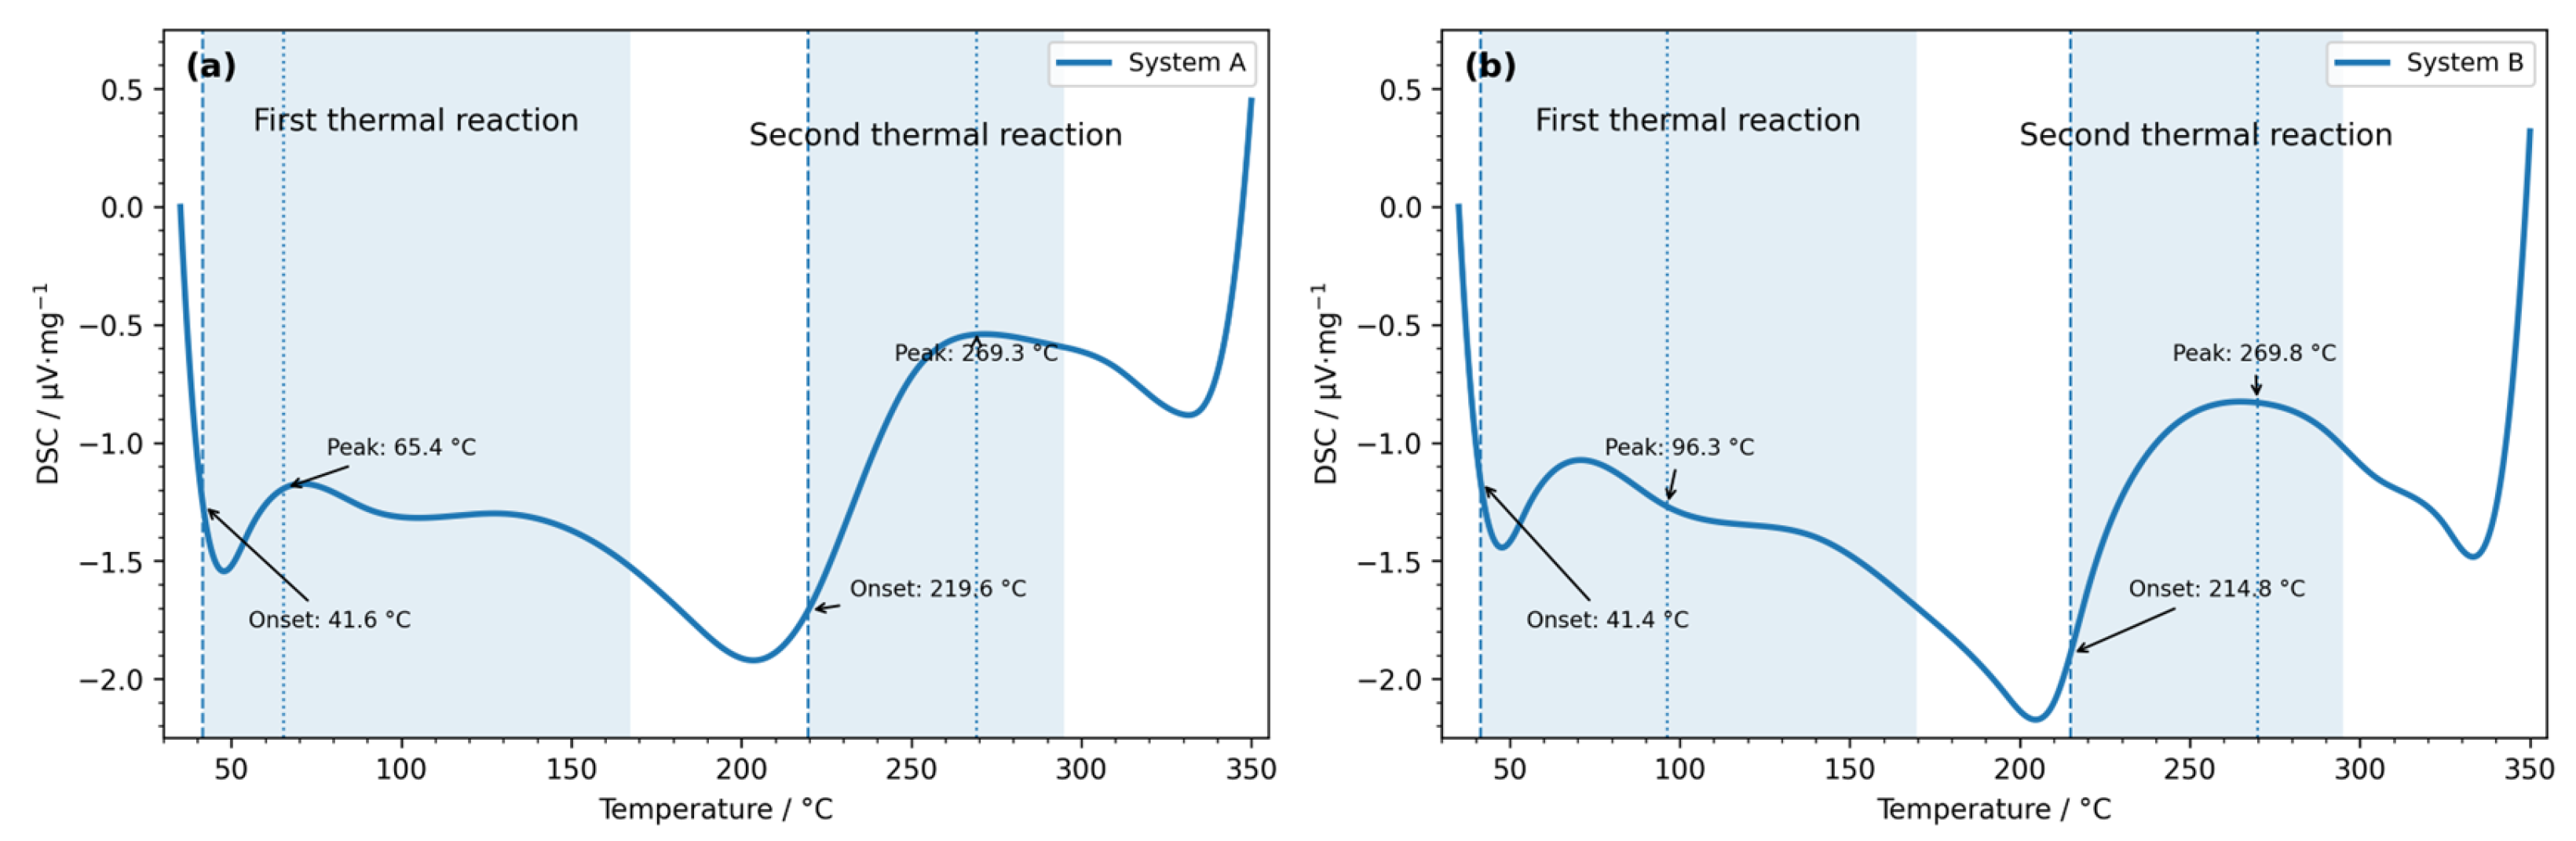
The curing exothermic behavior of the Resin A/Hardener A and Resin B/Hardener B systems was investigated using differential scanning calorimetry (DSC). The corresponding DSC curves are shown in Figure 8, and the characteristic curing parameters are summarized in Table 5.
As shown in Figure 8, both epoxy systems exhibit obvious exothermic peaks during the heating process, indicating the occurrence of curing reactions between the epoxy resin and the curing agent. To improve readability, the revised Figure 8 uses clearer curve labels and a higher-resolution format. The exothermic peaks correspond to the cross-linking reactions of the epoxy systems. When the temperature increases to a certain range, the reaction rate increases rapidly, resulting in obvious exothermic behavior.
The quantitative DSC results are listed in Table 5. For the Resin A/Hardener A system, the first reaction onset temperature is 41.6 °C, the first peak temperature is 65.4 °C, the first peak width is 125.7 °C, and the first exothermic value is 0.4137. For the Resin B/Hardener B system, the corresponding values are 41.4 °C, 96.3 °C, 128.2 °C, and 0.4000, respectively. The first reaction onset temperatures and exothermic values of the two systems are very close, indicating that both systems can initiate the curing reaction within a similar low-temperature range. However, the first peak temperature of Material B is approximately 30.9 °C higher than that of Material A. This indicates that although the initial curing reaction begins at a similar temperature, the maximum reaction rate of the first curing stage occurs at a higher temperature for Material B. This difference may be related to differences in resin–hardener reactivity and curing kinetics between the two epoxy systems.
In the second reaction stage, the Resin A/Hardener A system shows a reaction onset temperature of 219.6 °C, a peak temperature of 269.3 °C, a peak width of 75.4 °C, and an exothermic value of 0.9166. For the Resin B/Hardener B system, the corresponding values are 214.8 °C, 269.8 °C, 79.0 °C, and 0.9070, respectively. Unlike the first-stage peak temperatures, the second-stage peak temperatures of the two systems are almost identical, with a difference of only 0.5 °C. The second-stage exothermic values are also very close, indicating that the two systems exhibit similar deep-curing behavior at elevated temperatures.
The DSC results indicate that both epoxy systems exhibit typical two-stage curing characteristics. The first stage is associated with the initial reaction of relatively low-activation-energy groups, while the second stage corresponds to the further cross-linking and deep curing of the epoxy network. Overall, the DSC results indicate that both epoxy systems exhibit typical two-stage curing characteristics. The two systems show similar first-stage onset temperatures, peak widths, and exothermic values, but Material B exhibits a higher first-stage peak temperature than Material A. In the second curing stage, the peak temperatures and exothermic values of the two systems are highly consistent. These results suggest that the two systems have comparable overall curing behavior, while differences still exist in the first-stage curing kinetics. This similarity is important for engineering applications because curing exothermic behavior directly affects the temperature distribution, internal stress formation, and final insulation quality of RIP bushing materials.
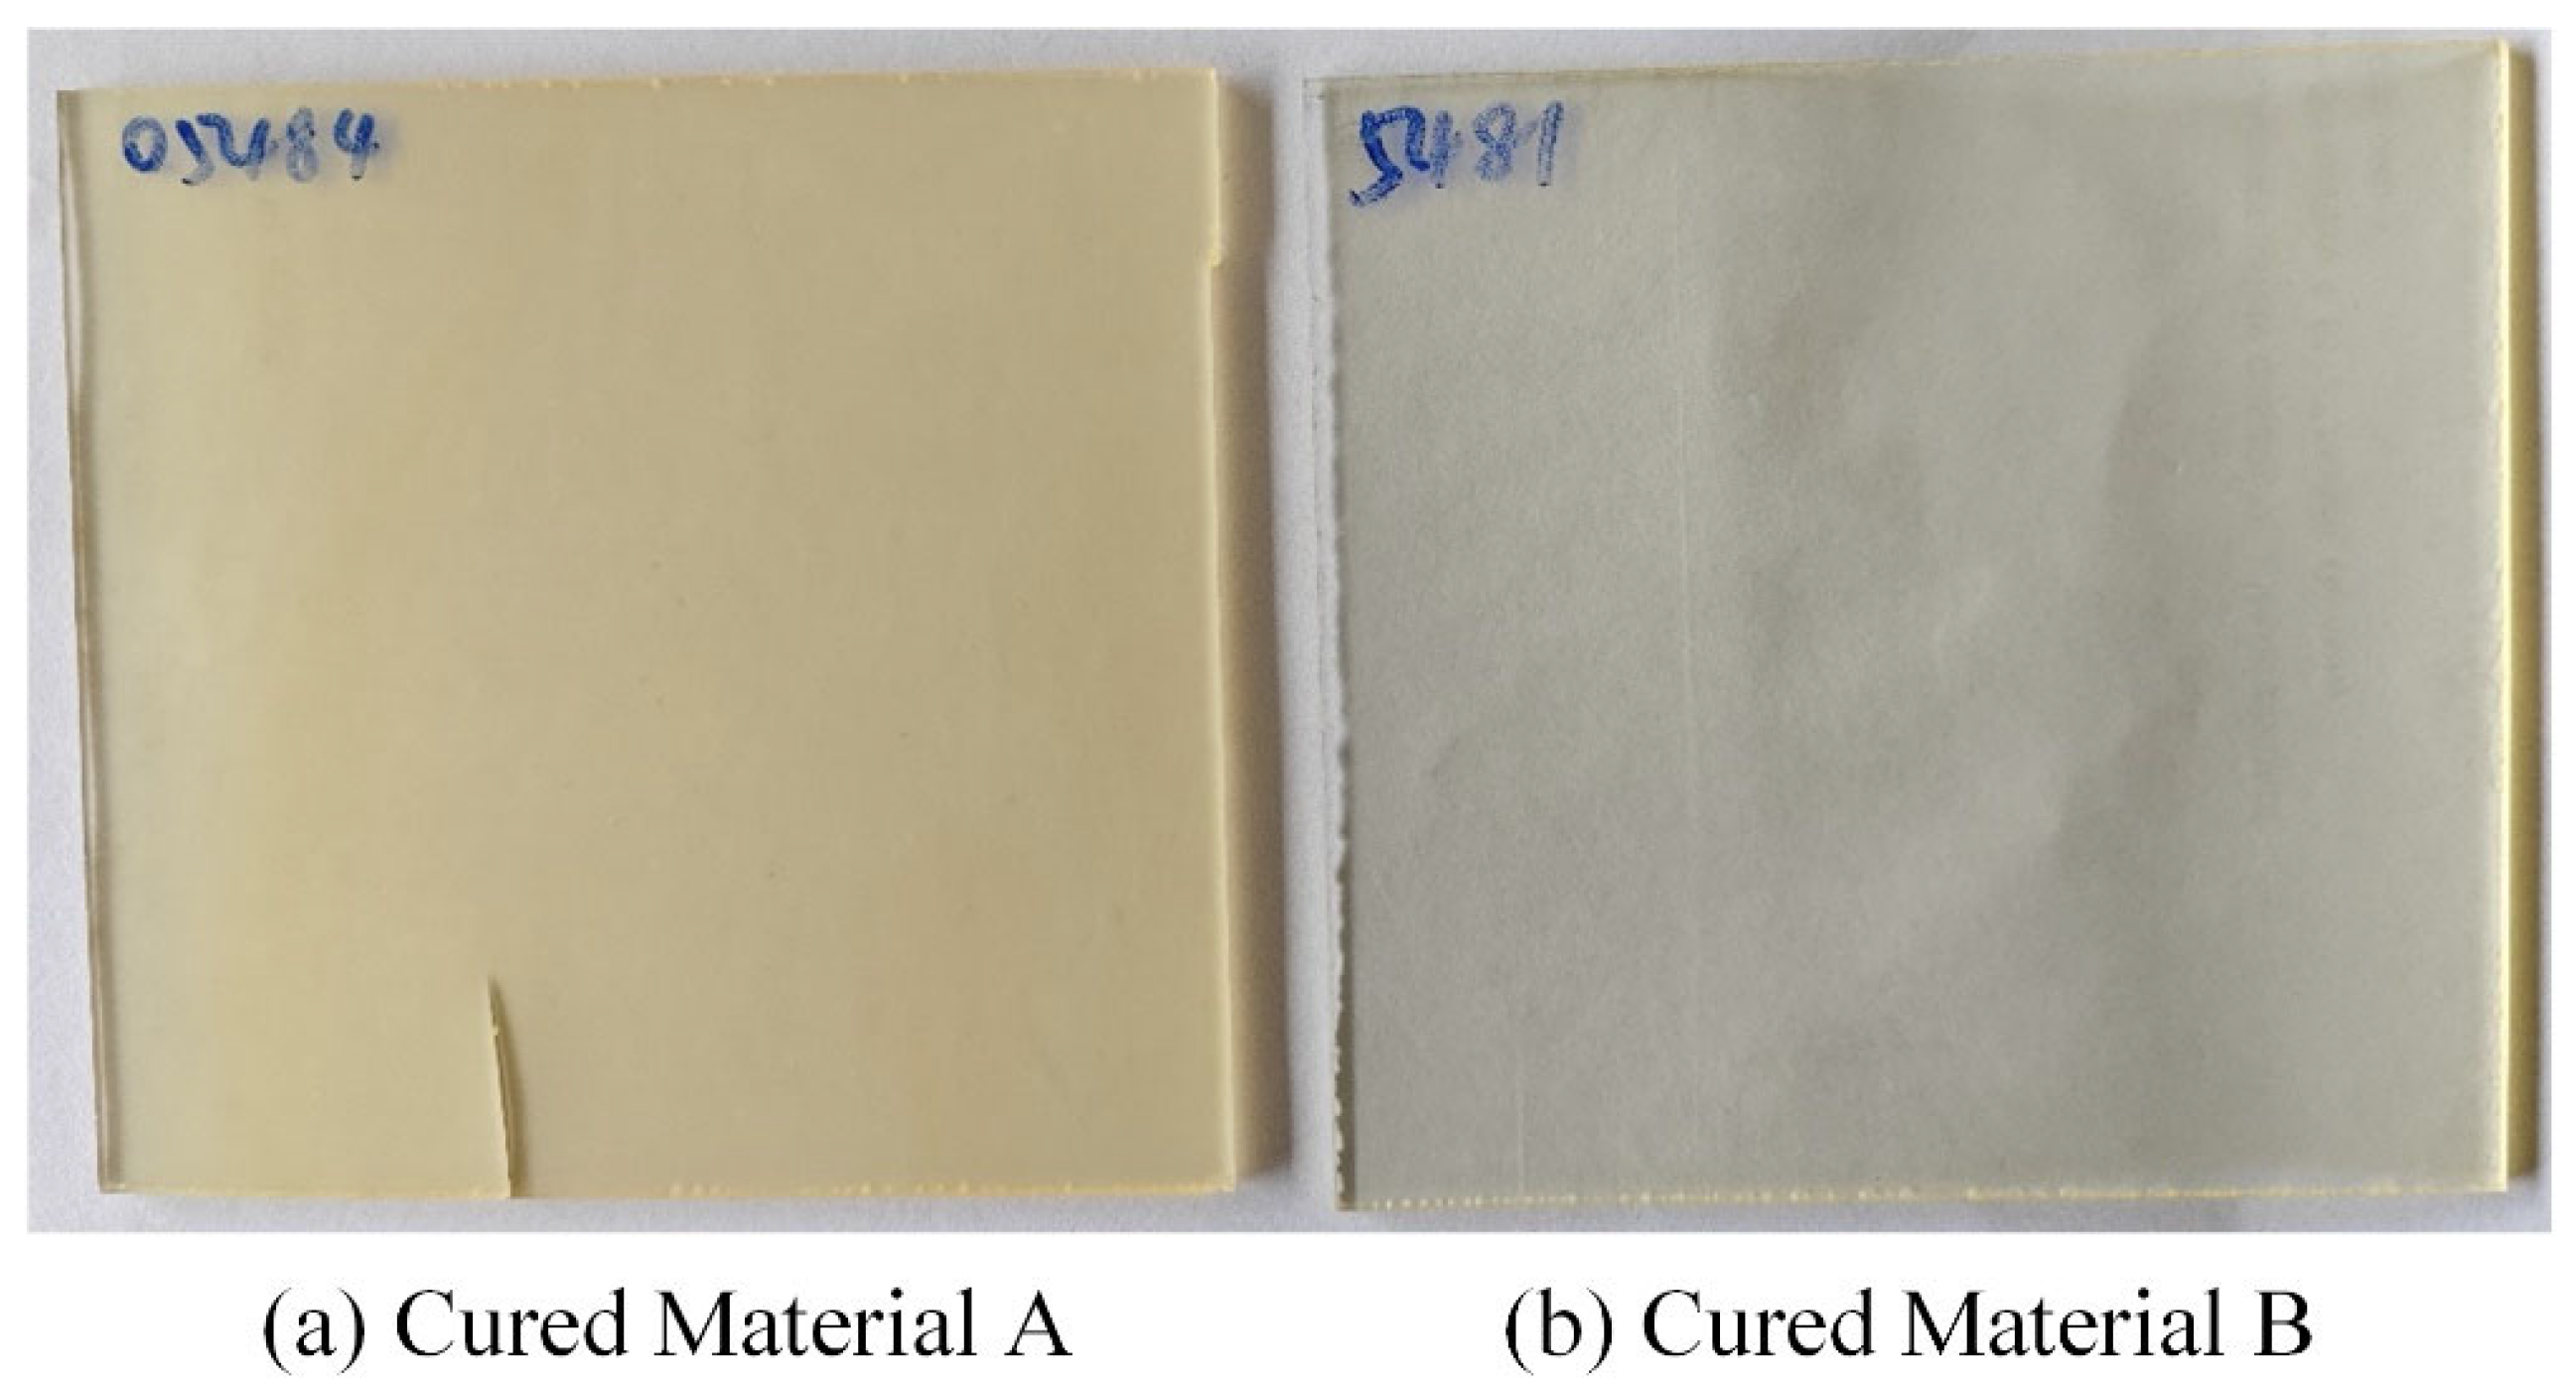
Figure 9 shows the cured specimens prepared from the two epoxy systems. These specimens were used for subsequent electrical property tests, including dielectric loss, dielectric constant, and volume resistivity measurements. As shown in Figure 9, the cured samples exhibit smooth surfaces and regular shapes, and no obvious cracks, pores, or surface defects can be observed. This indicates that both epoxy systems achieved acceptable curing quality under the selected preparation conditions. The good appearance and integrity of the cured specimens also provide a reliable basis for the subsequent comparison of electrical insulation properties.

3.3. Electrical Performance Testing

3.3.1. Dielectric Loss and Dielectric Constant–Temperature Testing for Materials A and B

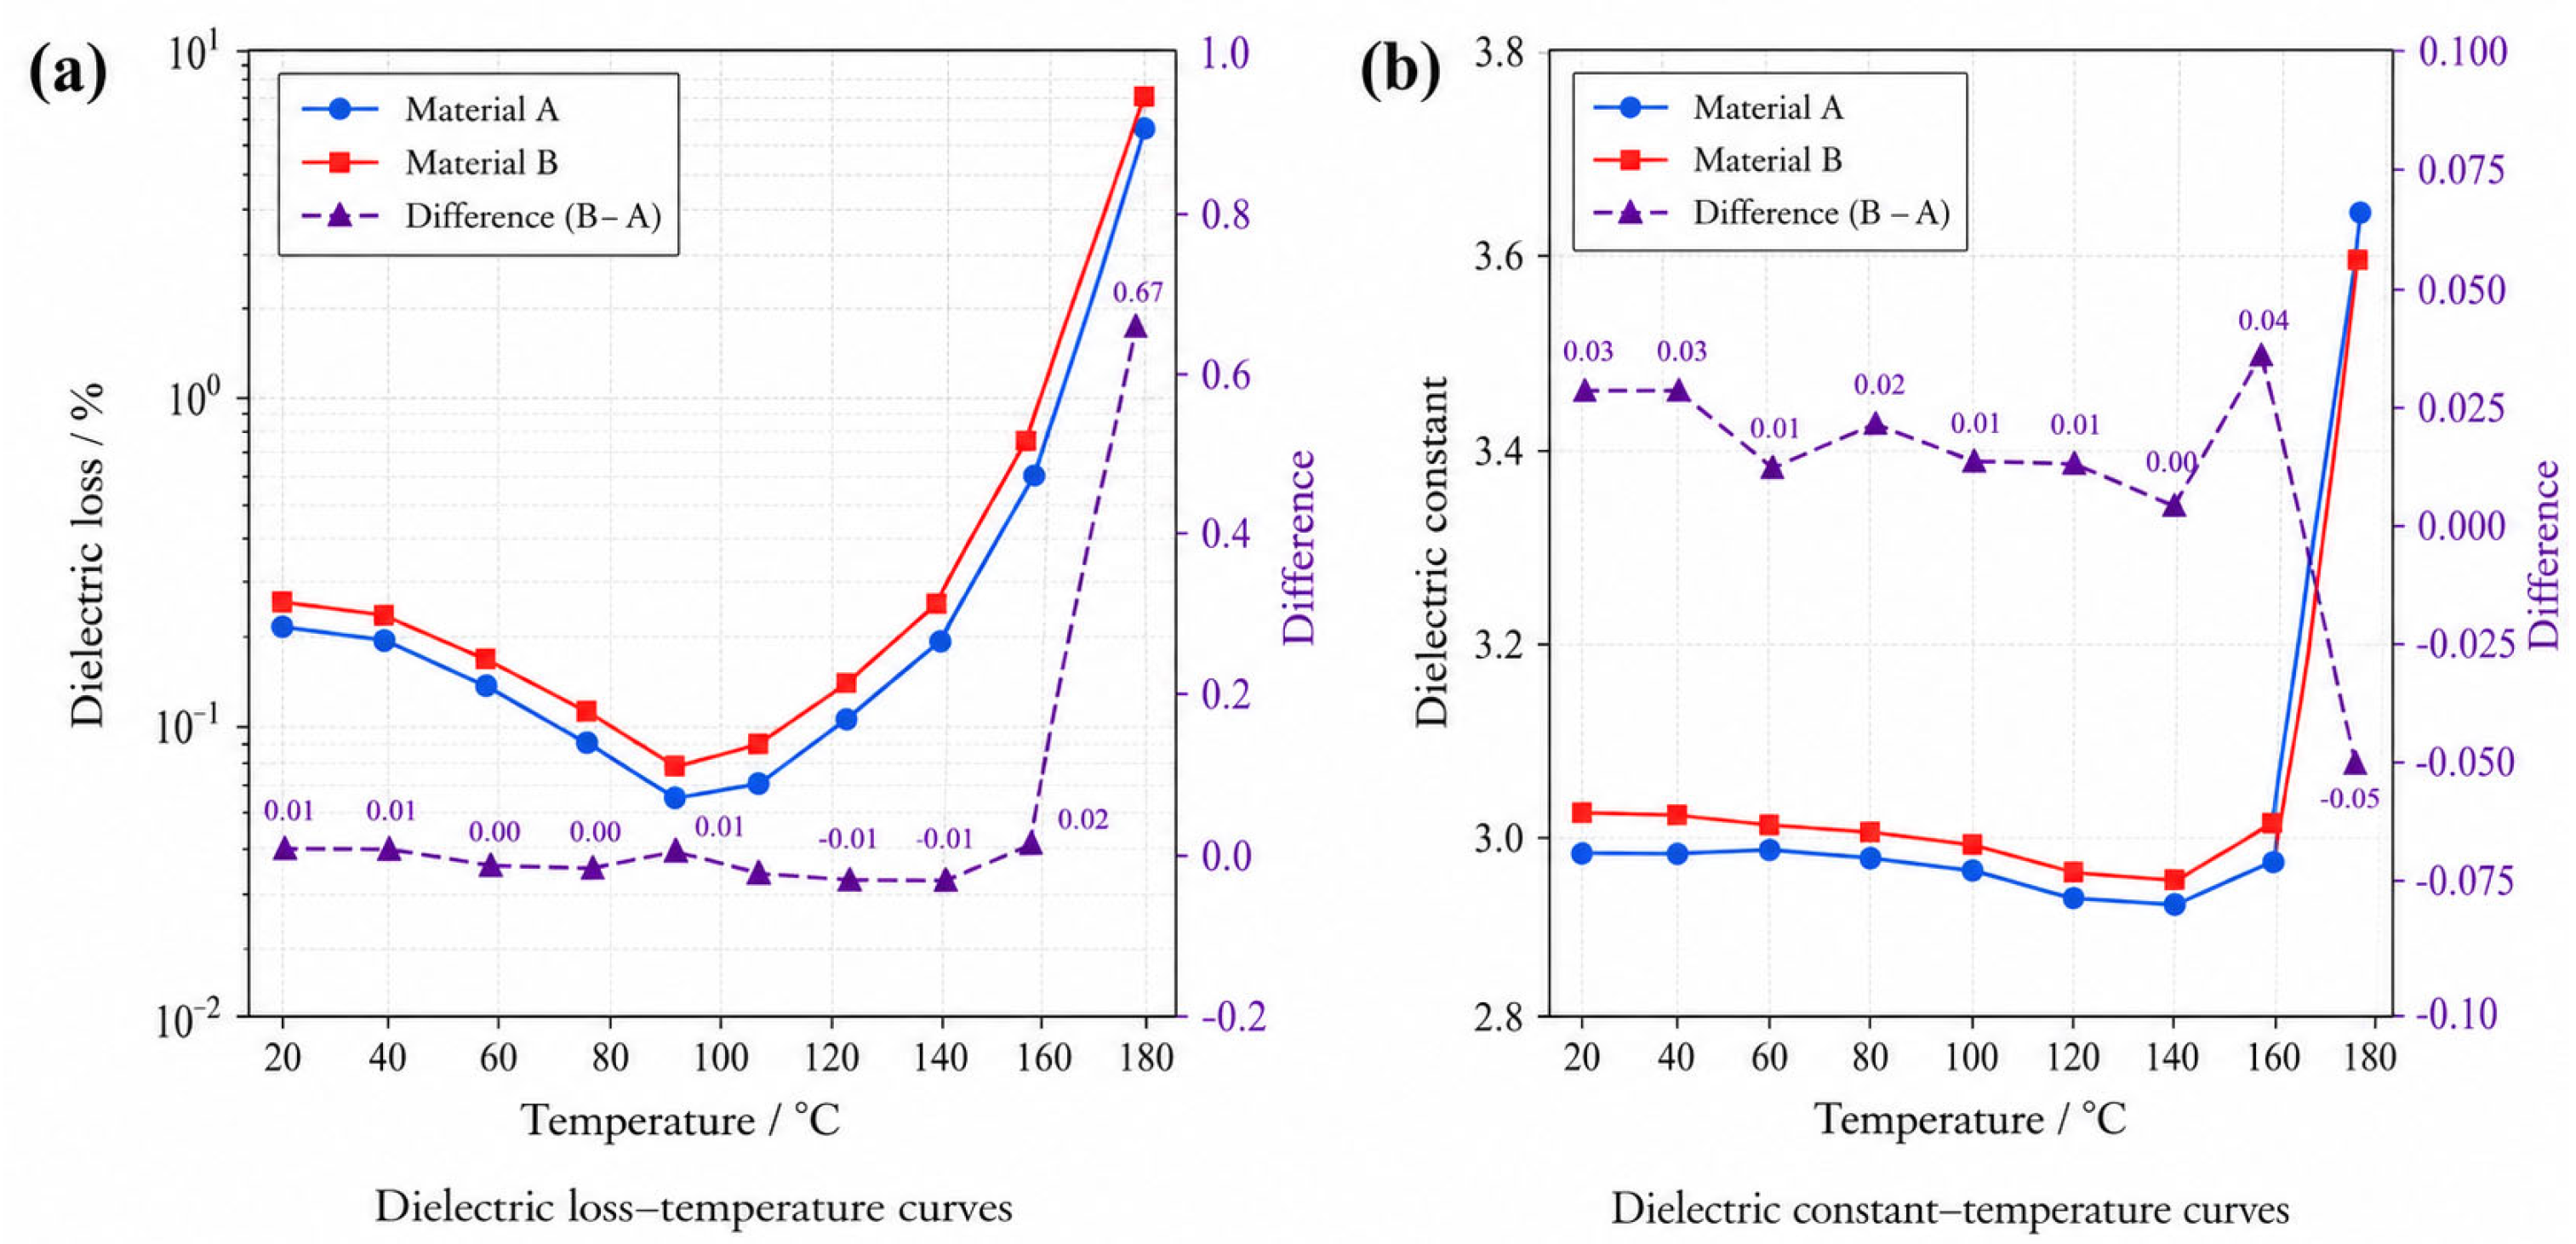
The dielectric properties of the cured epoxy materials were tested over a wide temperature range. The corresponding results are shown in Figure 10. To improve readability, Figure 10 has been divided into two subfigures. Figure 10a shows the dielectric loss–temperature curves of Materials A and B, while Figure 10b shows the dielectric constant–temperature curves of Materials A and B. The dielectric loss in Figure 10a is plotted on a logarithmic scale to better display the variation over the full temperature range.
As shown in Figure 10a, the dielectric loss of both materials first decreases slightly with increasing temperature and reaches a minimum at approximately 100 °C. Below this temperature, the cured epoxy network remains relatively stable, and the mobility of charge carriers and polar groups is limited. As the temperature increases to around 100 °C, part of the low-temperature polarization relaxation is weakened, and the dielectric loss decreases to its minimum value.
When the temperature further increases from 100 °C to 180 °C, the dielectric loss of both materials increases significantly. This increase can be attributed to the enhancement of molecular segment motion, dipolar relaxation, and charge-carrier migration at elevated temperatures. Under high-temperature conditions, the epoxy network becomes more thermally activated, and polar groups can more easily follow the alternating electric field. Meanwhile, the migration of charge carriers is promoted, which increases conduction loss. These factors lead to greater energy dissipation in the electric field and result in the rapid increase in dielectric loss, especially in the high-temperature range from 160 °C to 180 °C.
Figure 10b shows the temperature dependence of the dielectric constant of Materials A and B. In the temperature range from 20 °C to 140 °C, the dielectric constants of both materials remain relatively stable, with only slight fluctuations. This indicates that the polarization response of the cured epoxy systems is relatively stable within this temperature range. However, when the temperature increases from 160 °C to 180 °C, the dielectric constants of both materials noticeably increase. This phenomenon is mainly caused by enhanced dipolar polarization and interfacial polarization at elevated temperatures. As the temperature rises, the mobility of molecular segments increases, and bound charges and dipoles in the epoxy network can respond more effectively to the applied electric field. Therefore, the overall polarization ability of the material increases, resulting in a higher dielectric constant.
Comparing Materials A and B, the two materials exhibit very similar dielectric loss and dielectric constant trends over the whole temperature range. The difference between the two materials remains small in both Figure 10a and Figure 10b, indicating that the domestic EP-2020/CA-3015 system has dielectric behavior comparable to that of the imported Araldite LY1564/Aradur 3486 system. These results suggest that Material B can maintain insulation characteristics similar to those of Material A under temperature-dependent dielectric testing conditions.
As shown in Figure 10a, the dielectric loss of both materials increases with increasing temperature. Figure 10b indicates that the dielectric constants of Materials A and B remain comparable within the investigated temperature range.

3.3.2. Resistance–Temperature Testing of Materials A and B

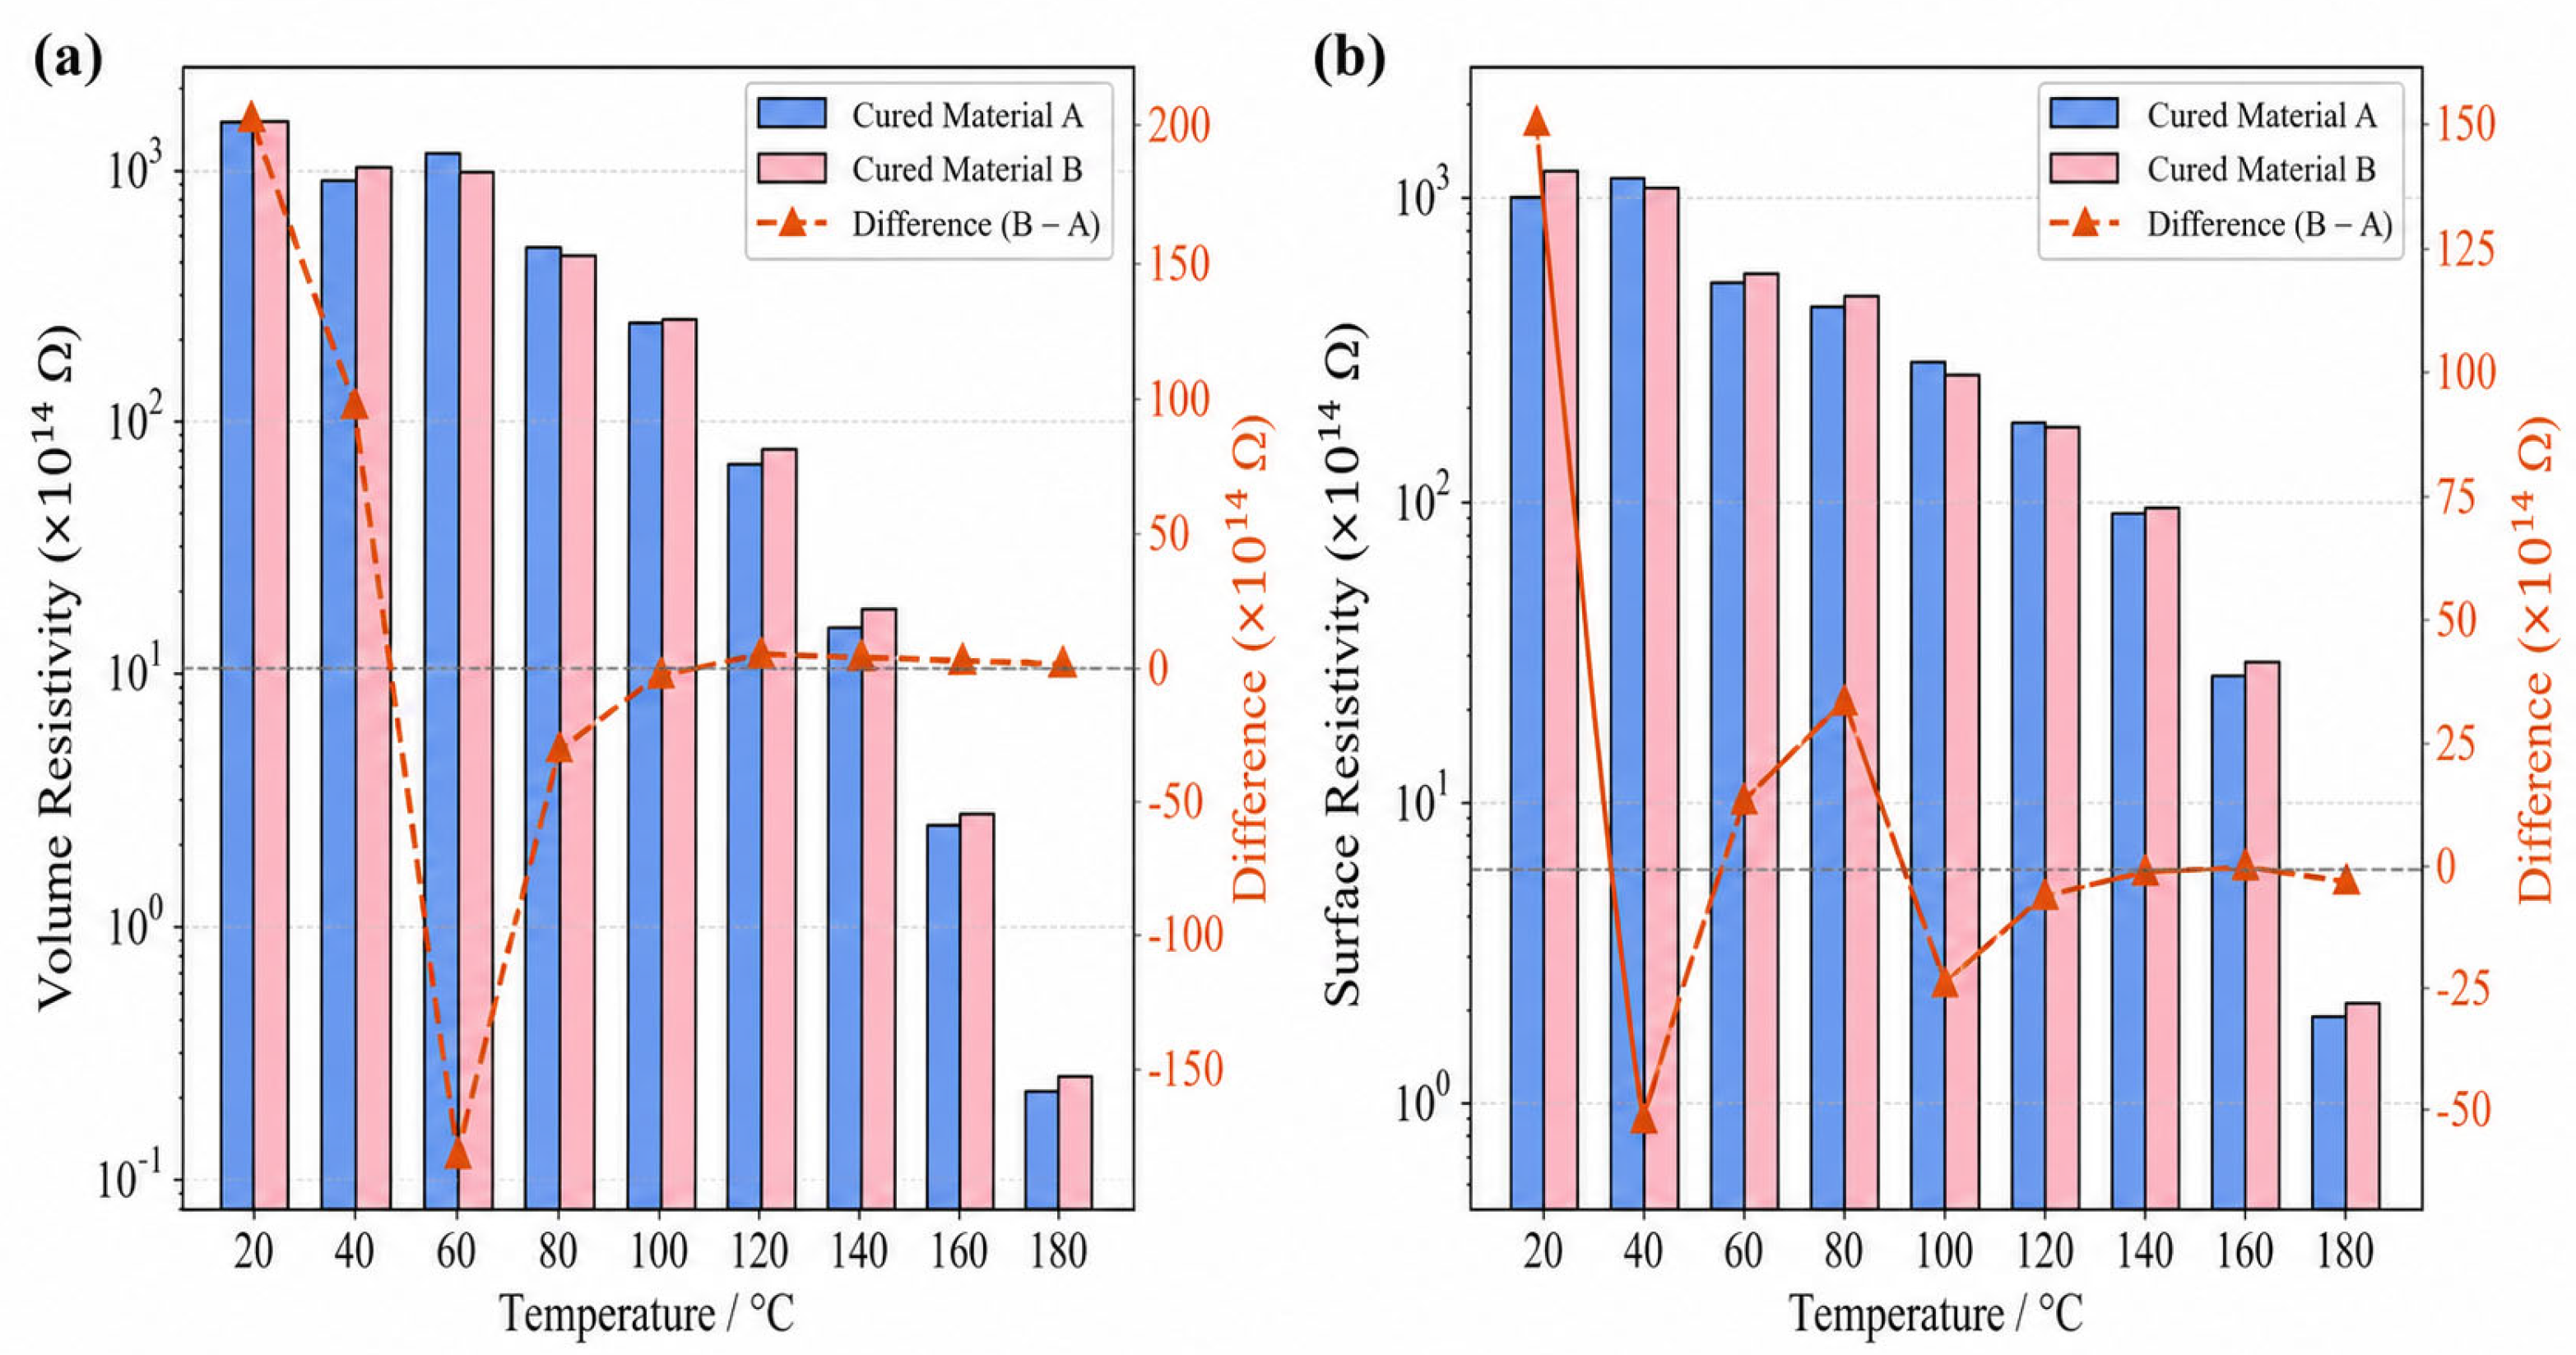
The resistivity properties of the cured epoxy materials were tested under different temperature conditions. The corresponding results are shown in Figure 11. To improve clarity, Figure 11 has been divided into two subfigures. Figure 11a shows the volume resistivity–temperature curves of Materials A and B, while Figure 11b shows the surface resistivity–temperature curves of Materials A and B.
As shown in Figure 11a, the volume resistivity of both materials decreases with increasing temperature. Volume resistivity reflects the ability of the material to suppress charge transport through the bulk insulation. At lower temperatures, the mobility of charge carriers inside the cured epoxy network is limited, and the material maintains high insulation resistance. As the temperature increases, the thermal activation of charge carriers becomes stronger, molecular segment motion is enhanced, and charge transport through the material becomes easier. Therefore, the volume resistivity gradually decreases.
The volume resistivity is calculated according to Equation (1):
ρ = R S L
where ρ is the volume resistivity, R is the measured volume resistance, S is the electrode area, and L is the sample thickness.
Figure 11b presents the surface resistivity–temperature curves of Materials A and B. Similar to volume resistivity, the surface resistivity also decreases as the temperature increases. Surface resistivity reflects the resistance to charge migration along the material surface. At elevated temperatures, surface charge transport is promoted due to enhanced thermal motion and increased carrier activity. As a result, the surface insulation resistance decreases.
Comparing Materials A and B, both materials exhibit similar temperature-dependent resistivity behavior. The decreasing trends of volume resistivity and surface resistivity are consistent for the two epoxy systems, indicating that Material B has insulation resistance characteristics comparable to those of Material A. These results further confirm that the domestic EP-2020/CA-3015 system can provide electrical insulation performance similar to that of the imported Araldite LY1564/Aradur 3486 system under temperature-dependent testing conditions.

4. Discussion

The systematic experimental comparisons conducted in this study clearly demonstrate that the selected epoxy resin–curing agent system B exhibits a high degree of consistency with material A—which is widely used in current engineering applications—in terms of key process performance and intrinsic electrical insulation properties. This key finding provides direct experimental evidence supporting the application of material B in the insulation of resin-impregnated bushings for ultra-high-voltage direct current (UHV DC) systems.
With regard to the rheological properties that determine the feasibility of the impregnation process, Materials A and B exhibit virtually identical viscosity–temperature curves and demonstrate similar pot lives at constant temperatures. From an engineering perspective, this implies that within the existing process window for bushing impregnation, Material B can achieve equivalent flow, penetration and workability without requiring significant adjustments to established production processes; this is a prerequisite for material substitution. Secondly, Differential Scanning Calorimetry (DSC) analysis revealed nearly identical curing exothermic behaviour between the two materials, including characteristic two-stage reactions, similar peak temperatures and reaction enthalpies. This constitutes the structural foundation for the materials to achieve the expected mechanical strength and long-term thermal stability. Finally, across a temperature range spanning –20 °C to 120 °C, both materials exhibit parallel and comparable trends in key electrical parameters such as dielectric loss and volume resistivity. This indicates that Material B has achieved a performance level equivalent to that of Material A in core insulation mechanisms, including the suppression of polarisation loss, the inhibition of conductive pathway formation and the maintenance of high insulation resistance.
In summary, through experiments conducted across the three performance dimensions of ‘process–curing–electrical’, this work has demonstrated, from a materials science perspective, the feasibility of Epoxy System B as an alternative to System A.

5. Conclusions

This paper presents an experimental comparative study of the A and B epoxy material systems. The research covers viscosity–temperature characteristics, exothermic behaviour during the curing reaction, and electrical property testing. The experimental results lead to the following main conclusions.
Firstly, Resin A and Resin B exhibit similar patterns in terms of viscosity–temperature variation. The viscosity of both materials decreases gradually as the temperature rises. This behaviour is consistent with the rheological properties of polymeric materials. As the temperature rises, the molecular chain motion of the material intensifies, resulting in a decrease in viscosity. The experimental results indicate that Resin B exhibits flow properties similar to those of Resin A under high-temperature processing conditions.
Secondly, Curing Agent A and Curing Agent B exhibit essentially consistent trends in viscosity changes. The difference in viscosity between the two curing agents under identical temperature conditions is minimal. Furthermore, the resin–curing agent mixture system also demonstrates similar patterns of change in its viscosity–temperature relationship. These results indicate that the Material B system possesses good process adaptability under impregnation processing conditions.
Thirdly, the viscosity of the resin–curing agent mixture gradually increases over time at a constant temperature. This change is primarily attributable to the cross-linking reaction of the epoxy resin. The experimental results show that the workable times of the Material A and Material B systems are essentially consistent. This indicates that Material B is capable of meeting the processing requirements of actual production processes.
Fourthly, DSC test results indicate that both material systems exhibit distinct exothermic peaks during the curing process. The temperatures of these exothermic peaks and the shapes of the curves are relatively similar. This suggests that Materials A and B exhibit a high degree of consistency in their curing behaviour. As the curing process influences the final structure of the material, this result indicates that Material B possesses good curing stability. Relevant studies have shown that a stable curing reaction aids in the formation of a uniform cross-linked structure and enhances the material’s insulating properties.
Fifth, the results of the electrical performance tests show that the dielectric loss of both materials increases with rising temperature. At the same time, the electrical performance tests show that both materials exhibit similar temperature-dependent dielectric and resistivity behavior. The dielectric loss increases at elevated temperatures, while the volume resistivity and surface resistivity decrease with increasing temperature. These trends are consistent with the thermally activated charge-transport behavior of polymeric insulating materials. The volume resistivity of the materials decreases with increasing temperature. These patterns of change are consistent with the general electrical characteristics of polymeric insulating materials. The experimental results also indicate that the electrical performance of Material B is at a similar level to that of Material A within the main test temperature range.
Based on the above experiments, a sound testing and evaluation system for epoxy resin materials has been established, providing a basis for the selection of epoxy insulation materials for bushings.

Author Contributions

Conceptualization, X.L. and H.T. (Hao Tang); methodology, Y.Z.; software, X.L.; validation, G.W., H.T. (Hao Tang) and K.L.; formal analysis, K.L.; investigation, H.T. (Huichuan Tang); resources, H.T. (Hao Tang); data curation, X.L.; writing—original draft preparation, X.L.; writing—review and editing, X.L.; visualization, H.T. (Hao Tang); supervision, H.T. (Hao Tang); project administration, H.T. (Hao Tang); funding acquisition, X.L. All authors have read and agreed to the published version of the manuscript.

Funding

This research was funded by the National Key R&D Program of China, grant number No. 2022YFB4301202.

Data Availability Statement

The original contributions presented in this study are included in the article. Further inquiries can be directed to the corresponding author.

Conflicts of Interest

Author Hao Tang, Xining Li and Yi Zhang were employed by China Electric Power Research Institute Co., Ltd. The remaining authors declare that the research was conducted in the absence of any commercial or financial relationships that could be construed as a potential conflict of interest.

References

  1. Angalane, S.K.; Kasinathan, E. A Review on Polymeric Insulation for High-Voltage Application under Various Stress Conditions. Polym. Compos. 2022, 43, 4803–4834. [Google Scholar] [CrossRef]
  2. Tanaka, T.; Imai, T. Advances in Nanodielectric Materials over the Past 50 Years. IEEE Electr. Insul. Mag. 2013, 29, 10–23. [Google Scholar] [CrossRef]
  3. Yang, H.; Chen, Q.; Wang, X.; Chi, M.; Zhang, J. Dielectric and Thermal Conductivity Characteristics of Epoxy Resin-Impregnated H-BN/CNF-Modified Insulating Paper. Polymers 2020, 12, 2080. [Google Scholar] [CrossRef] [PubMed]
  4. Liu, D.; Tong, X.; Liu, L.; Dong, X.; Yan, T.; Tang, W.; Wang, L.; Cao, B.; Luo, Z. A Simulation and a Computational Study on the Reliability Verification of Epoxy Resin Paper-Impregnated Bushings in Power Transformers. Energies 2025, 18, 3239. [Google Scholar] [CrossRef]
  5. Wang, Q.; Peng, Z.; Dodd, S.J.; Dissado, L.A.; Chalashkanov, N.M. Dielectric Response and Space Charge in Epoxy Impregnated Paper Composite Laminates. IEEE Trans. Dielectr. Electr. Insul. 2019, 26, 1532–1540. [Google Scholar] [CrossRef]
  6. Liu, P.; Zhang, H.; Zhang, S.; Su, X.; Xie, Z.; Peng, Z. Space Charge Dynamics in Epoxy Resin under Voltage Polarity Reversal at Various Temperatures. High Volt. 2021, 6, 770–781. [Google Scholar] [CrossRef]
  7. Zhang, H.; Li, K.; Jin, H.; Li, K.; Li, X.; Liu, P.; Peng, Z. Space Charge Dynamics in Epoxy Resins under the Influence of a Long-Term High Electric Field at Various Temperatures. Front. Chem. 2022, 10, 904750. [Google Scholar] [CrossRef] [PubMed]
  8. Li, J.; Kong, X.; Du, B.; Sato, K.; Konishi, S.; Tanaka, Y.; Miyake, H.; Takada, T. Effects of High Temperature and High Electric Field on the Space Charge Behavior in Epoxy Resin for Power Modules. IEEE Trans. Dielectr. Electr. Insul. 2020, 27, 882–890. [Google Scholar] [CrossRef]
  9. Li, J.; Aung, H.H.; Du, B. Curing Regime-Modulating Insulation Performance of Anhydride-Cured Epoxy Resin: A Review. Molecules 2023, 28, 547. [Google Scholar] [CrossRef] [PubMed]
  10. Yang, K.; Chen, W.; Zhao, Y.; He, Y.; Chen, X.; Du, B.; Yang, W.; Zhang, S.; Fu, Y. Enhancing Dielectric Strength of Epoxy Polymers by Constructing Interface Charge Traps. ACS Appl. Mater. Interfaces 2021, 13, 25850–25857. [Google Scholar] [CrossRef] [PubMed]
  11. Chen, Q.; Zhang, Z.; Cheng, S.; Yang, H.; Zhao, Z.; Wang, Z. Nonlinear Conductivity Characteristics of Epoxy Resin-Impregnated Nano-SiC-Modified Insulating Paper. J. Mater. Sci. Mater. Electron. 2022, 33, 17757–17772. [Google Scholar] [CrossRef]
  12. Teng, C.; Zhou, Y.; Li, S.; Zhang, L.; Zhang, Y.; Zhou, Z.; Zhao, L. Regulation of Temperature Resistivity Characteristics of Insulating Epoxy Composite by Incorporating Positive Temperature Coefficient Material. IEEE Trans. Dielectr. Electr. Insul. 2020, 27, 512–520. [Google Scholar] [CrossRef]
  13. Liu, D.; Tong, X.; Liu, L.; Chen, T.; Tang, J.; Tang, W.; Wang, L.; Cao, B.; Luo, Z. Research on the Thermal Aging Characteristics of Cured Epoxy Resin Insulating Materials for DC Bushings. Polymers 2025, 17, 1064. [Google Scholar] [CrossRef] [PubMed]
  14. Ge, G.; Tang, Y.; Li, Y.; Huang, L. Effect of Environmental Temperature on the Insulating Performance of Epoxy/MgO Nanocomposites. Appl. Sci. 2020, 10, 7018. [Google Scholar] [CrossRef]
  15. Li, S.; Li, M. Development of Epoxy Resin with Superior Breakdown Strength: A Review. Internet Energy 2024, 3, 89–101. [Google Scholar] [CrossRef]
Figure 1. Bushing diagram.
Inventions 11 00066 g001
Figure 2. Liquid samples of resin and curing agent.
Inventions 11 00066 g002
Figure 3. Rotational viscometer; auto differential scanning calorimeter.
Inventions 11 00066 g003
Figure 4. Electrical property testing apparatus.
Inventions 11 00066 g004
Figure 5. Viscosity–temperature characteristics of single-component materials: (a) viscosity–temperature curves of Resin A and Resin B, with an inset showing the enlarged viscosity range from 55 °C to 80 °C; (b) viscosity–temperature curves of Hardener A and Hardener B.
Inventions 11 00066 g005
Figure 6. Viscosity–temperature curves of the Resin A/Hardener A and Resin B/Hardener B mixed systems.
Inventions 11 00066 g006
Figure 7. Time-dependent viscosity curves of the Resin A/Hardener A and Resin B/Hardener B mixed systems under different processing conditions: (a) 50 °C/10 rpm; (b) 55 °C/20 rpm; (c) 60 °C/20 rpm.
Inventions 11 00066 g007
Figure 8. DSC curing exothermic curves of the (a) Resin A/Hardener A and (b) Resin B/Hardener B systems.
Inventions 11 00066 g008
Figure 9. Cured epoxy specimens prepared from the Resin A/Hardener A and Resin B/Hardener B systems for subsequent electrical property testing.
Inventions 11 00066 g009
Figure 10. Temperature-dependent dielectric properties of Materials A and B: (a) dielectric loss–temperature curves; (b) dielectric constant–temperature curves.
Inventions 11 00066 g010
Figure 11. Temperature-dependent resistivity properties of Materials A and B: (a) volume resistivity–temperature curves; (b) surface resistivity–temperature curves.
Inventions 11 00066 g011
Table 1. Basic information on the investigated epoxy systems.
ItemMaterial AMaterial B
Epoxy ResinAraldite LY1564EP-2020
Curing AgentAradur 3486CA-3015
OriginImportedDomestic
ApplicationUHV insulation equipmentUHV insulation equipment
Mixing Ratio100:90100:90
Certification StatusCommercially appliedTested by National Insulating Materials Quality Supervision and Inspection Center
Table 2. Viscosity Test Parameters.
ParametersValue
Test EquipmentRotary viscometer
Temperature range20–80 °C
Heating rate5 °C/h (≈0.083 °C/min)
Sample mass15 g
Table 3. Electrical Performance Test Parameters.
ParametersValue
Test propertiesDielectric loss, dielectric constant, volume resistivity, surface resistivity
Test Temperature20–180 °C
Dielectric property testWide-temperature-range dielectric testing system
Resistivity testHigh-resistance meter
Test specimensCured epoxy specimens
Table 4. Viscosity values of Resin A/Hardener A and Resin B/Hardener B mixed systems at different temperatures.
Temperature25 °C55 °C60 °C
Resin/Hardener A470.6 mPa·s55.9 mPa·s37.5 mPa·s
Resin/Hardener B493.9 mPa·s56.7 mPa·s40.0 mPa·s
Table 5. DSC curing exothermic characteristics of the Resin A/Hardener A and Resin B/Hardener B systems.
Test ParametersResin/Hardener AResin/Hardener B
First DSC reaction onset/°C41.641.4
First peak temperature/°C65.496.3
First peak width/°C125.7128.2
First exothermic value0.41370.4
Second DSC reaction onset/°C219.6214.8
Second peak temperature/°C269.3269.8
Second peak width/°C75.479
Second exothermic value0.91660.907
Disclaimer/Publisher’s Note: The statements, opinions and data contained in all publications are solely those of the individual author(s) and contributor(s) and not of MDPI and/or the editor(s). MDPI and/or the editor(s) disclaim responsibility for any injury to people or property resulting from any ideas, methods, instructions or products referred to in the content.