
Article

Multi-Channel Monitoring System with Nanosecond Resolution for Intermittent Faults in Electrical Connectors

1
School of Electrical Engineering and Automation, Harbin Institute of Technology, Harbin 150001, China
2
Aviation Key Laboratory of Science and Technology on Aero Combined Environment, Department of Frontier Technology Research, China Aero-Polytechnology Establishment, Beijing 100028, China
3
School of Instrumentation Science and Engineering, Harbin Institute of Technology, Harbin 150001, China
*
Author to whom correspondence should be addressed.
Inventions 2026, 11(3), 64; https://doi.org/10.3390/inventions11030064

Submission received: 25 May 2026 / Revised: 12 June 2026 / Accepted: 15 June 2026 / Published: 17 June 2026
(This article belongs to the Special Issue Recent Advances and New Trends in Signal Processing: 2nd Edition)

Abstract

Intermittent faults in electrical connectors refer to cases in which contact resistance exceeds a specified threshold for microseconds or less, causing transient power or signal interruptions. Accurate detection and quantitative recording of these events are important for connector reliability evaluation. In this work, an eight-channel monitoring system with nanosecond resolution for intermittent faults in electrical connectors is developed, enabling quantitative recording of intermittent events together with dynamic contact resistance (DCR) waveform acquisition. Two-stage programmable amplification is used for DCR measurement, while threshold comparison and FPGA-abased quadrature multiphase oversampling are combined to capture intermittent events. The system supports DCR measurement over 1 mΩ–10,000 mΩ with a maximum relative error of 0.41%, and provides 1.25 ns equivalent time resolution for intermittent event monitoring, with an expanded uncertainty of 0.28 ns–0.54 ns over 20 ns–10 μs. Vibration tests on high-speed connectors further demonstrate that the system captures real intermittent events under mechanical excitation and measures their durations with a maximum relative error of 0.66% relative to oscilloscope results.

1. Introduction

Electrical connectors play an irreplaceable role in electrical and electronic systems to realize power transmission and control signal transmission. Harsh environmental stresses, including mechanical vibration, shock, and temperature cycling, may lead to a gradual increase, transient rise, and fluctuation in contact resistance, and may even cause open-circuit failures [1,2]. Such faults are intermittent, random, and difficult to reproduce, making them important sources of the “No Fault Found” problem [3,4]. Therefore, explicit requirements for intermittent-event duration and resistance thresholds have been specified in different application fields. Consumer electronics generally require the intermittent duration to be less than 100 μs and the resistance threshold to be higher than 7 Ω. Automotive and industrial applications usually require an intermittent duration of 1 μs–10 μs and a resistance threshold higher than 5 Ω. Military and aerospace applications have the most stringent requirements, with the intermittent duration required to be less than 1 μs and the resistance threshold higher than 2 Ω [5,6].
Real-time acquisition of contact voltage drop signals has been widely used in engineering as a basis for failure analysis. Maul et al. [7] and Carvou et al. [8] quantified the severity of intermittent faults using the amplitude and time distribution of abnormal contact voltage drops. Based on this method, the effects of vibration frequency, temperature, and mating degradation on intermittent events have been further investigated [9,10,11]. However, this method is limited by sampling rate, memory depth, and channel number, making it challenging to support long-term, multichannel capture of nanosecond-scale intermittent events. In addition, various trigger-based and active diagnostic methods have been developed for intermittent event detection. Abbott [12] used a pulse detection and counting circuit to obtain the duration distribution of intermittent events longer than 20 ns. Ginart et al. [13] captured electromagnetic traveling-wave features generated by intermittent faults using differential current sensors to identify whether intermittent events occurred. Syed et al. [14], Kim [15], and Kanchwala et al. [16] detected intermittent faults by injecting carrier, modulated, or spread-spectrum signals into the system and analyzing the changes in the received signals. Auzanneau et al. [17,18] used continuous time-domain reflectometry and chaotic time-domain reflectometry methods to detect, locate, and estimate the duration of microsecond intermittent faults. Cheng et al. [19] pointed out that intermittent faults in connectors are usually manifested as transient increases in contact resistance, indicating that adding the capability to record the corresponding contact resistance waveform would be beneficial for analyzing intermittent fault behavior. However, the methods mentioned above mainly focus on event detection, localization, or duration estimation, while nanosecond event recording in parallel with DCR acquisition remains insufficiently addressed.
In a previous paper by the present authors, a single-channel prototype for DCR and intermittent duration measurement was preliminarily presented [20]. In this work, an eight-channel nanosecond resolution intermittent fault monitoring system for electrical connectors is developed. The system enables joint recording of DCR waveforms and intermittent events. The structure of this paper is organized as follows. Section 2 presents the methodology of the proposed system, including the system architecture, DCR measurement principle, and intermittent fault measurement principle. Section 3 presents the calibration results for DCR measurement and intermittent duration measurement. Section 4 discusses the application of the system in connector vibration tests and compares the recorded intermittent events with oscilloscope results. Section 5 summarizes the conclusions.

2. Materials and Methods

2.1. System Architecture

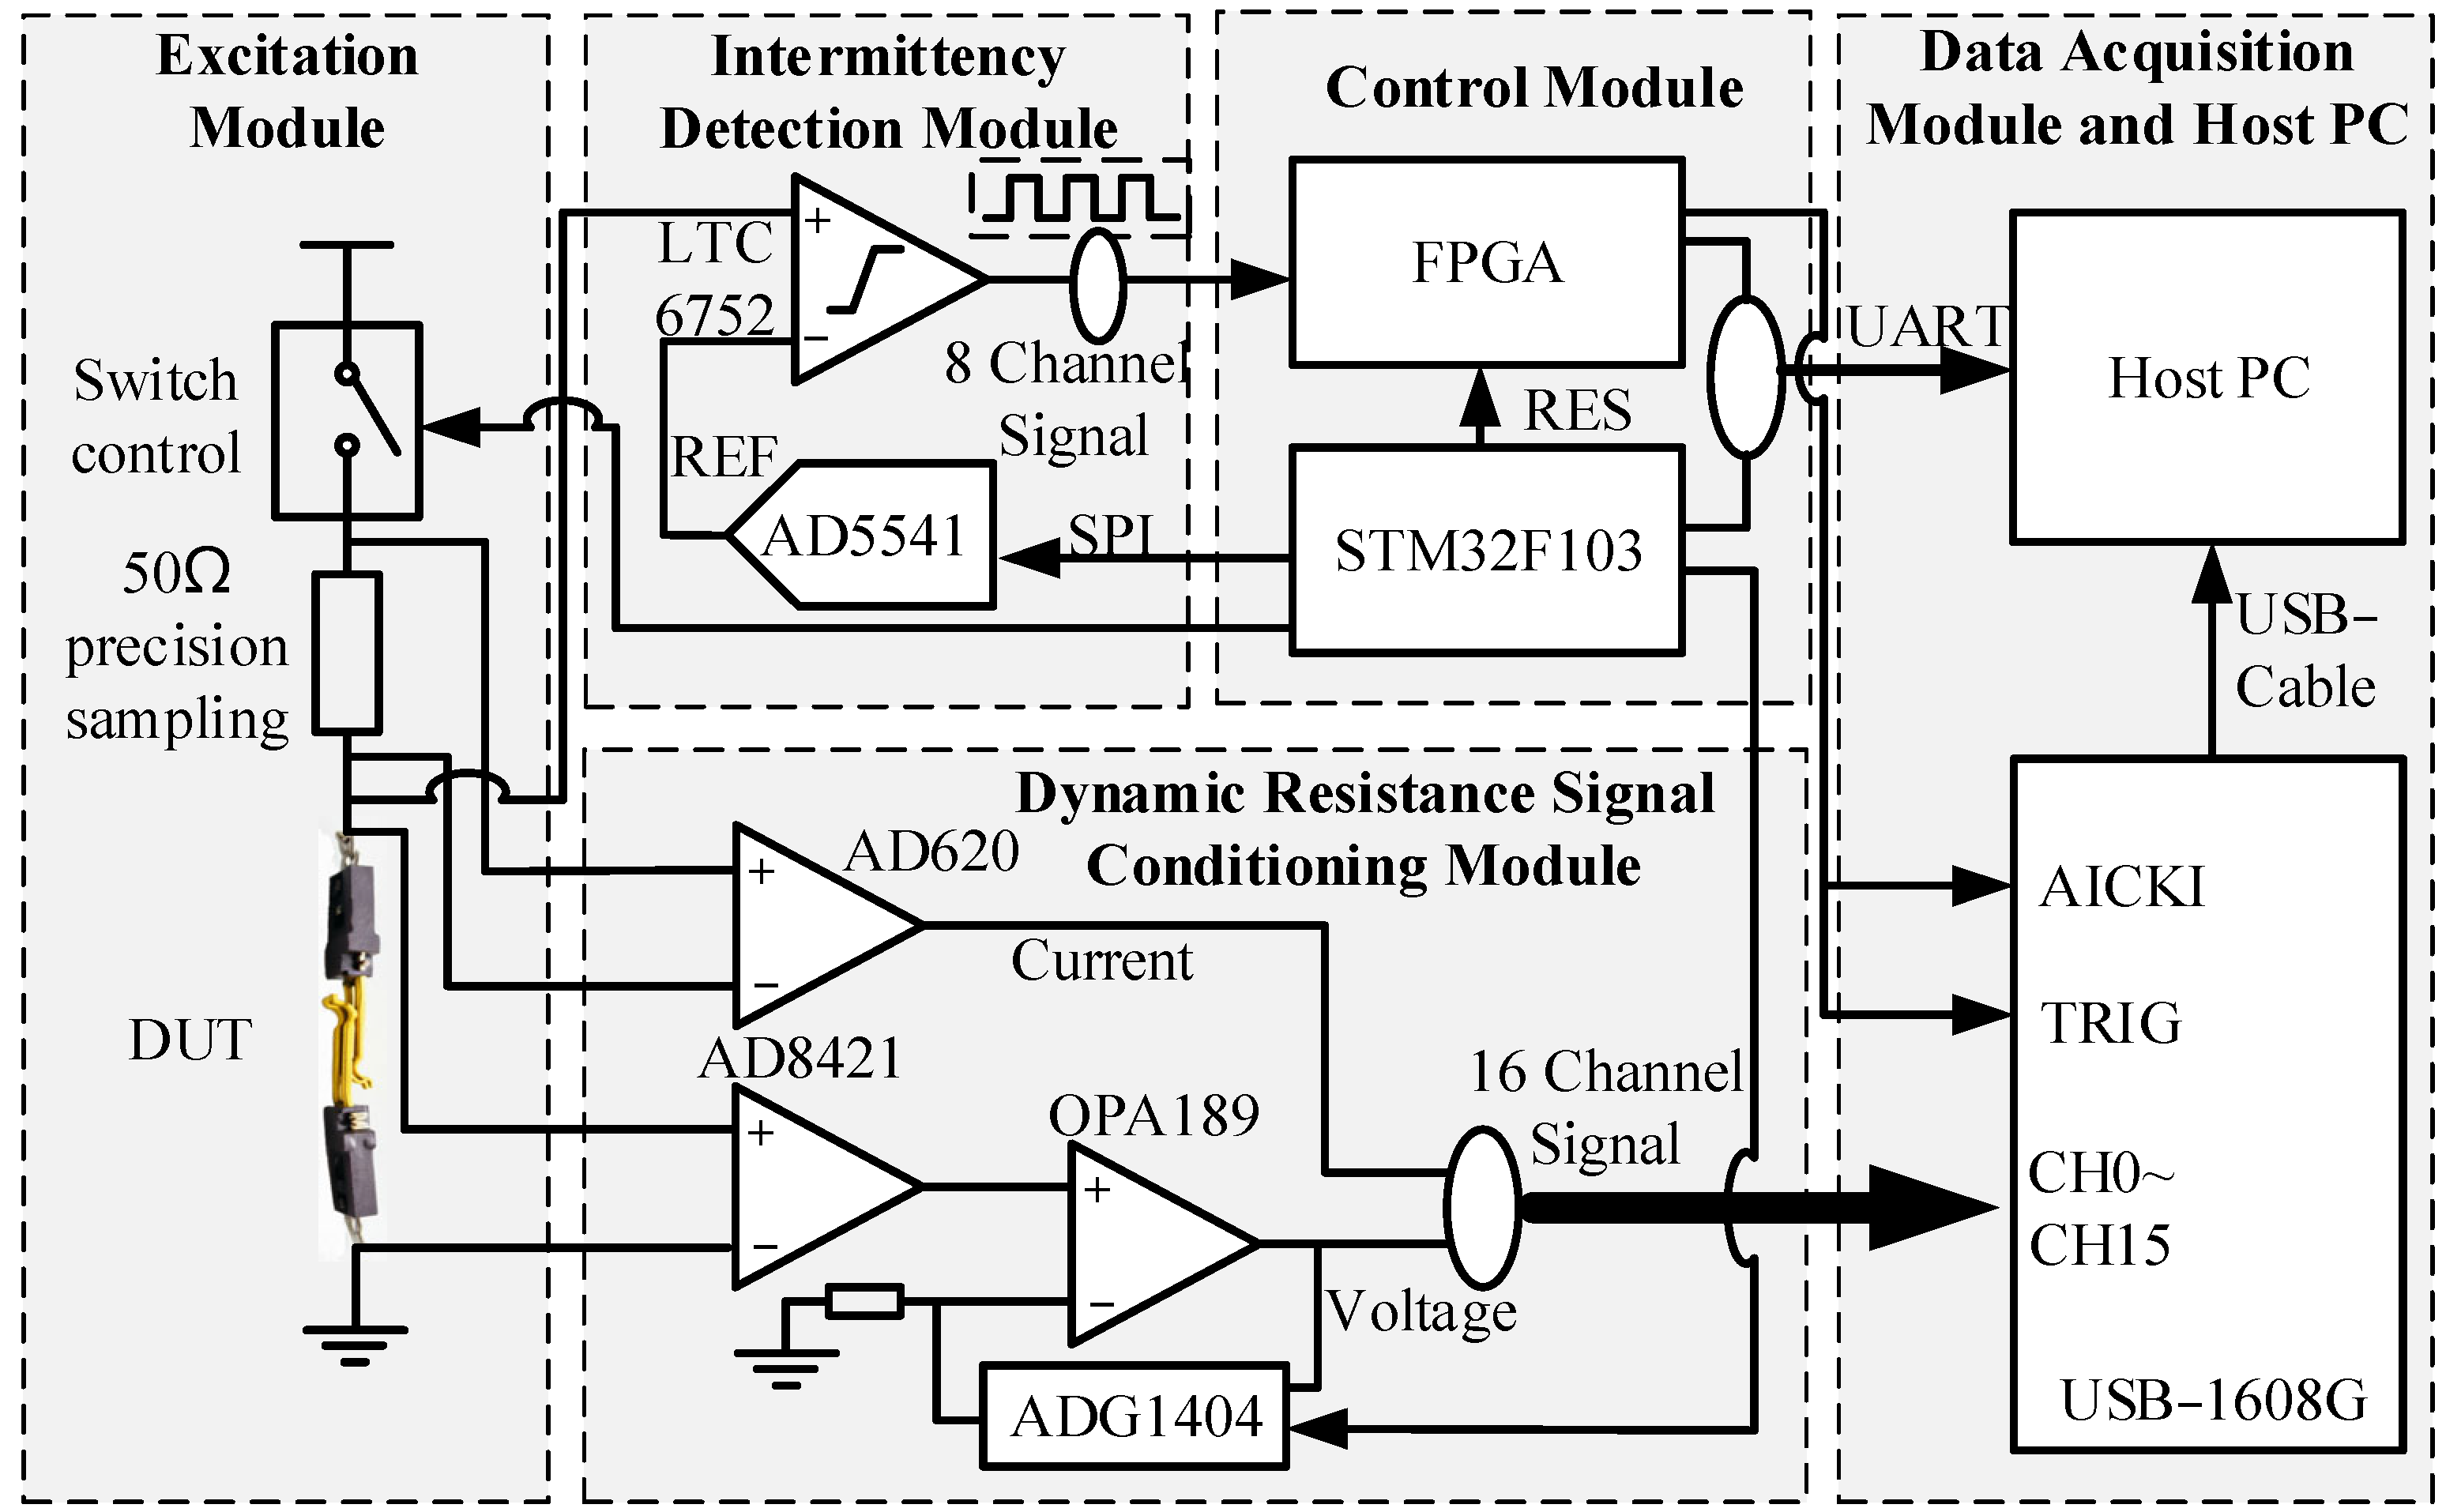
The system is designed to continuously acquire DCR waveforms of electrical connectors and record intermittent events. The overall architecture of the system is shown in Figure 1. The system consists of an excitation module, a DCR measurement module, an intermittent fault detection module, a control module, a data acquisition module, and a host PC, with eight intermittent fault detection channels and corresponding DCR measurement paths. The control module consists of a microcontroller (STM32-F103, STMicroelectronics, Geneva, Switzerland) and a field-programmable gate array (FPGA) (XC7A35T, Xilinx, San Jose, CA, USA), and the data acquisition module uses a data acquisition card (MCC USB-1608G, Measurement Computing Corporation, Norton, MA, USA).
The DCR measurement module conditions the contact voltage drop and test current signals of the connector, with the voltage-drop amplification gain configured by the microcontroller. The conditioned signals are sent to the data acquisition module, with the trigger signal and sampling clock provided by the FPGA. The host PC calculates and records the DCR waveform from the acquired contact voltage drop and test current.
The intermittent fault detection module compares the contact voltage of the connector with the threshold voltage for intermittent fault detection, which is configured by the microcontroller. When the contact voltage exceeds the threshold, the over-threshold condition is converted into a digital pulse. The FPGA records the start time, end time, and duration of the pulse, generates an intermittent event record, and uploads it to the host PC.

2.2. DCR Measurement Principle

To cover both milliohm-level resistance in the normal conduction state and ohm-level resistance during intermittent events, a two-stage amplification structure with switchable gain is designed. The first stage uses an AD8421 instrumentation amplifier to provide a differential gain of 10 for the contact voltage drop. The second stage is a programmable amplifier composed of an OPA189 and an ADG1404, providing four gain settings of 1, 10, 100, and 1000.
Let uc(t) denote the contact voltage drop. The output voltage can be expressed as
u o ( t ) = G 1 G 2 u c ( t ) + u e , o ( t ) ,
where G1 is the gain of the first-stage instrumentation amplifier, G2 is the gain of the second-stage programmable amplifier, and ue,o(t) is the output-referred equivalent error term. This term includes the input offset and input-referred noise of each stage, and the error of the first stage is further amplified by the gain of the second stage.
If the first and second stages are approximated as single-pole closed-loop systems, the overall bandwidth fsys can be approximated as
f sys ( 1 f 1 2 + 1 f 2 2 ) 1 2 ,
where f1 and f2 are the closed-loop bandwidths of the first and second stages, respectively.
Table 1 lists the resistance measurement range, total gain, and theoretical bandwidth corresponding to each gain setting. As the resistance measurement range decreases from 1000 mΩ–10,000 mΩ to 1 mΩ–10 mΩ, the total gain increases from 10 to 10,000, allowing contact voltage drops with different amplitudes to match the input range of the data acquisition module. The theoretical bandwidth decreases from 8.14 MHz to 14 kHz, indicating the dynamic response capability of each gain setting. For vibration-induced DCR fluctuation, this bandwidth is sufficient because the vibration frequencies encountered in connector testing are much lower than 14 kHz. Faster intermittent events are captured by the independent comparator–FPGA path, so the DCR bandwidth does not limit intermittent fault detection.
To further improve measurement accuracy, offset compensation is applied to the voltage-drop signal under total gains of 10, 100, 1000, and 10,000. After offset compensation and gain restoration, the voltage-drop signal in each range can be expressed as
u c ( t ) = u o ( t ) u off , v G v ,
where uc(t) is the compensated contact voltage drop, uo(t) is the output of the voltage sampling channel, uoff,v is the zero-offset voltage of the voltage-drop channel, and Gv is the total voltage-drop gain.
Similarly, the compensated test current can be expressed as
i c ( t ) = u i ( t ) u off , i G i R s ,
where ic(t) is the compensated loop current, ui(t) is the output of the current sampling channel, uoff,i is the zero-offset voltage of the current channel, Gi is the current measurement gain, and Rs is the current sampling resistor.
Therefore, the DCR is calculated as
R ( t ) = u c ( t ) i c ( t ) ,
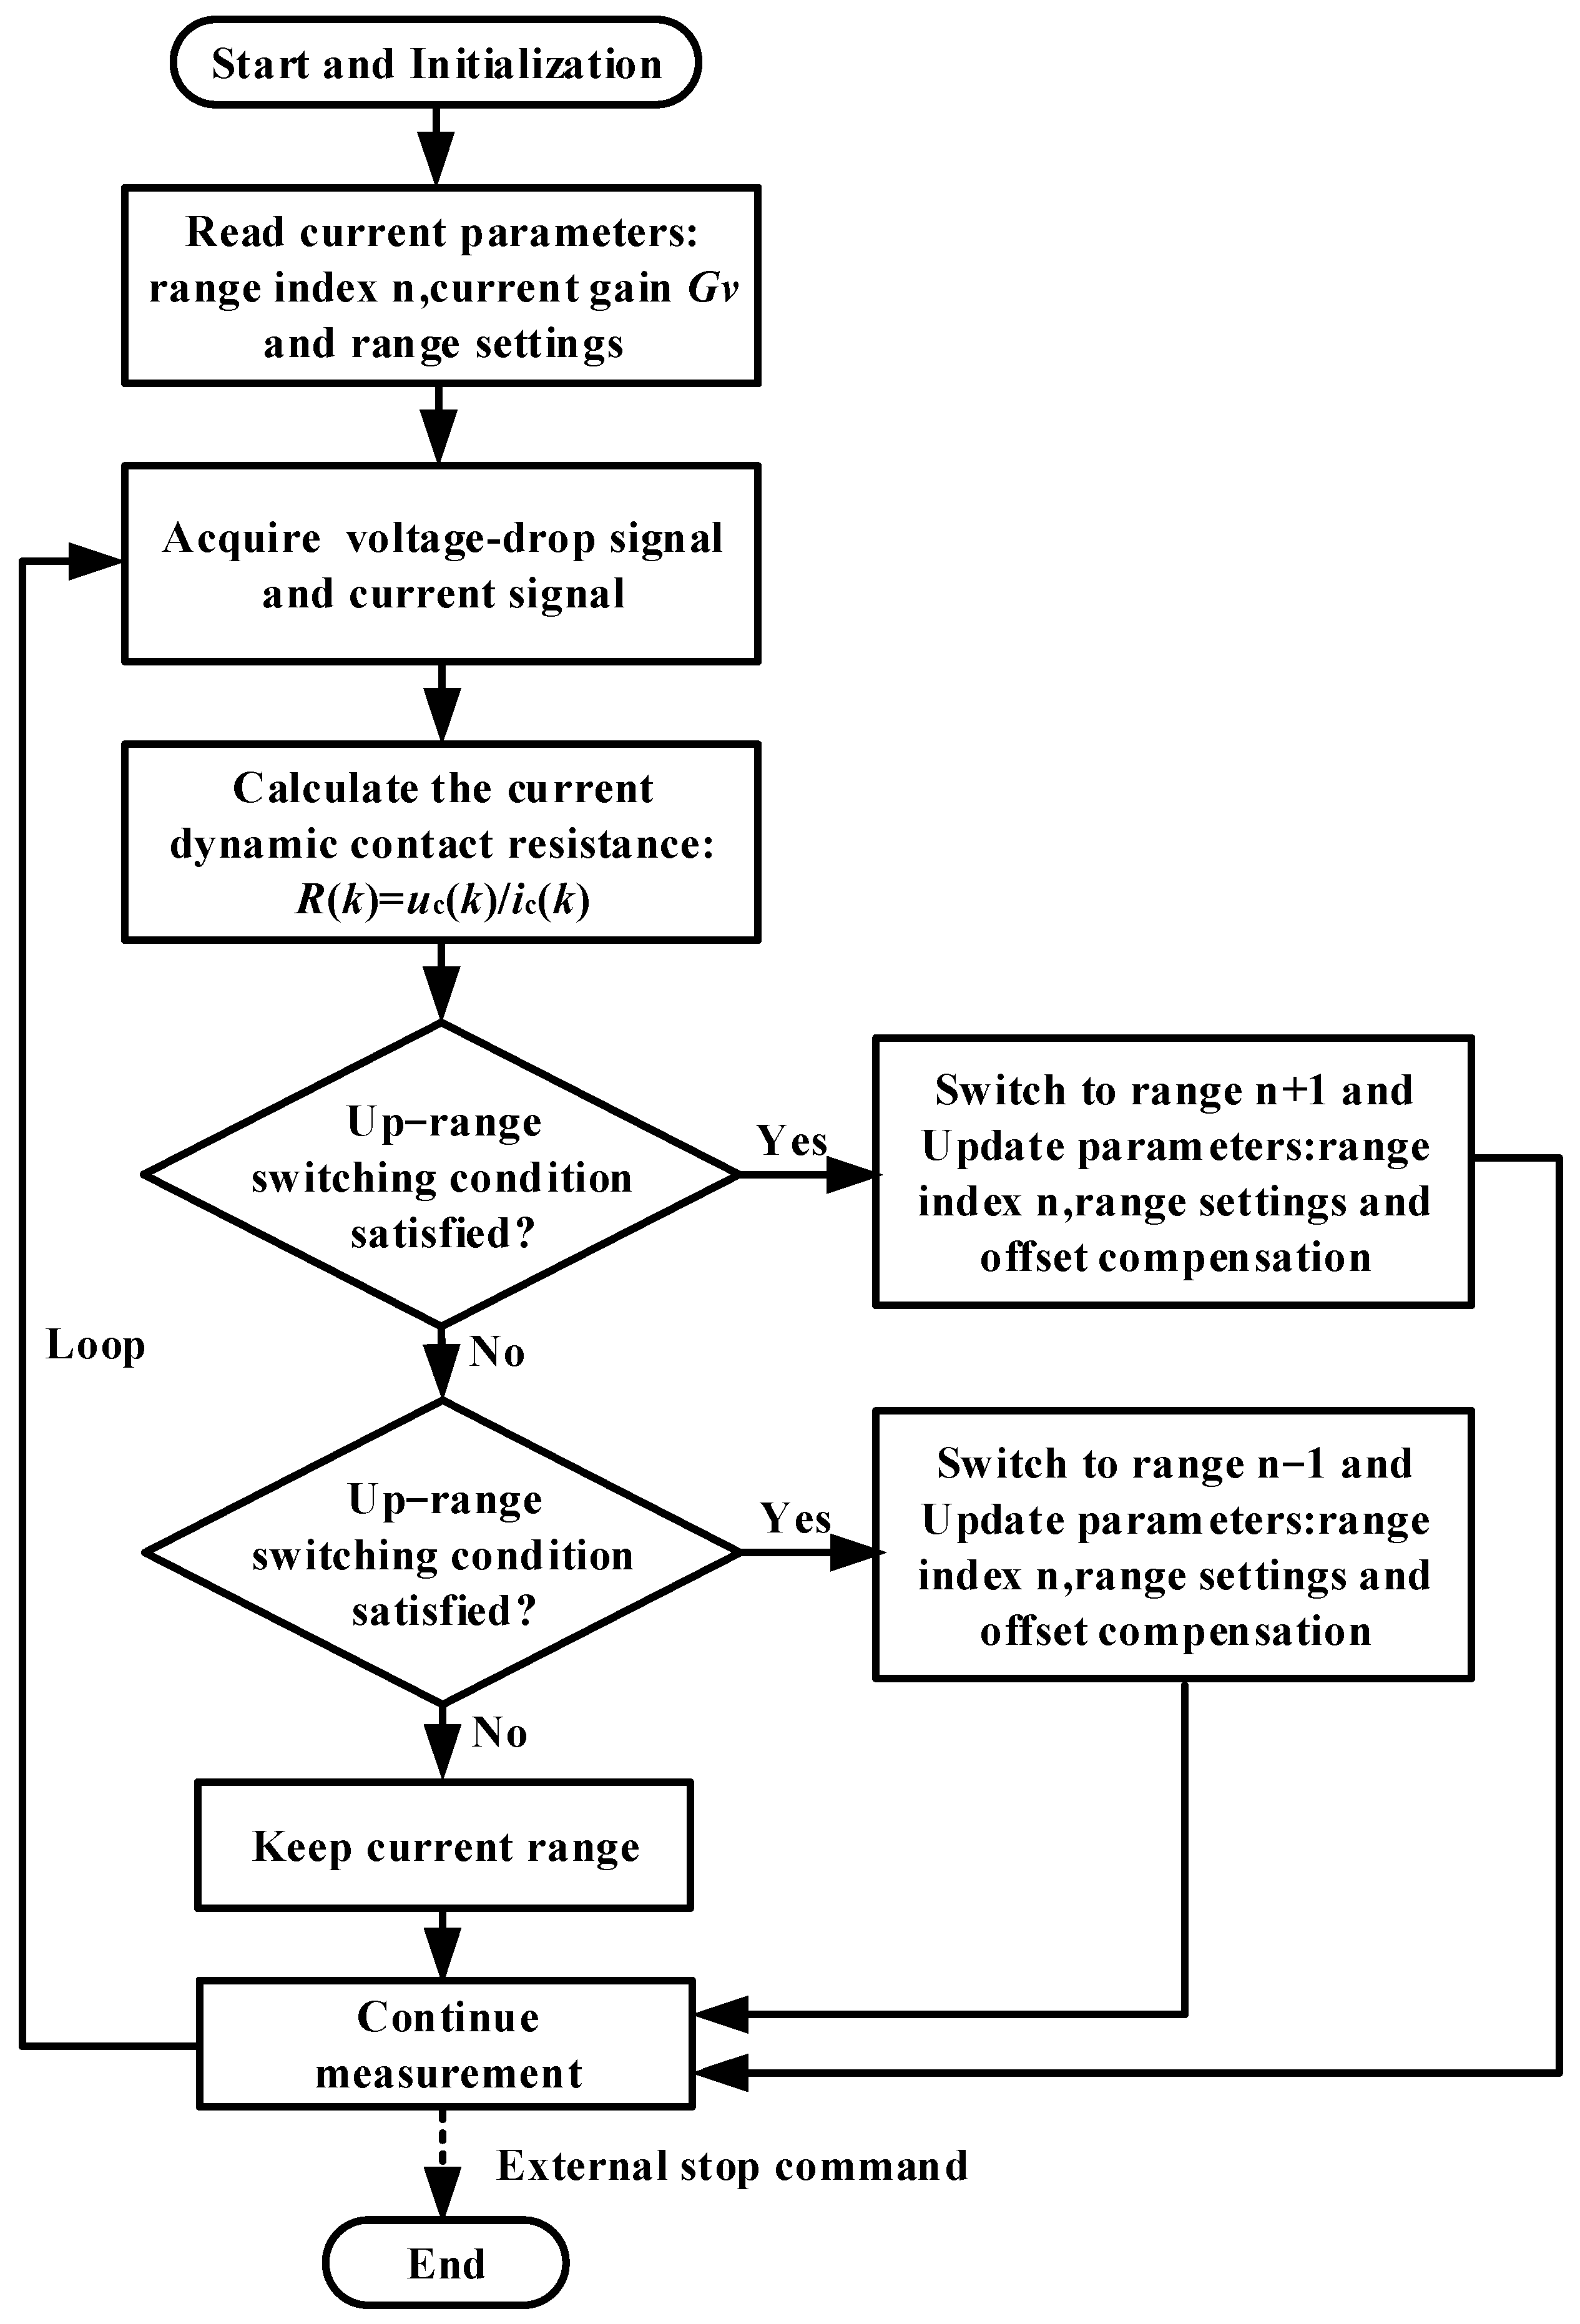
The system performs adaptive range switching according to the currently calculated R(t). The overall flowchart is shown in Figure 2.
For the n-th gain setting, the effective measurement range is defined as [RL,n, RH,n]. The upper and lower switching thresholds of this range are defined as
R n , u p p e r = α R H , n R n , l o w e r = β R L , n ,
where Rn,upper and Rn,lower are the upper and lower switching thresholds of the n-th range, respectively, and α and β are threshold coefficients satisfying 0 < β < α < 1. When R(t) is greater than Rn,upper, the system switches to a lower gain setting. When R(t) is less than Rn,lower, the system switches to a higher gain setting. The interval between the two thresholds forms a hysteresis region for range switching, which avoids frequent switching caused by small fluctuations near the threshold boundary. After the range is switched, the software updates the gain coefficient and offset compensation value corresponding to the current range.

2.3. Intermittent Fault Measurement Principle

The system adopts an intermittent fault detection structure based on threshold comparison and FPGA-based time stamping. Let Rth denote the intermittent resistance threshold and I0 denote the test current. The corresponding threshold voltage is
V th = I 0 R th ,
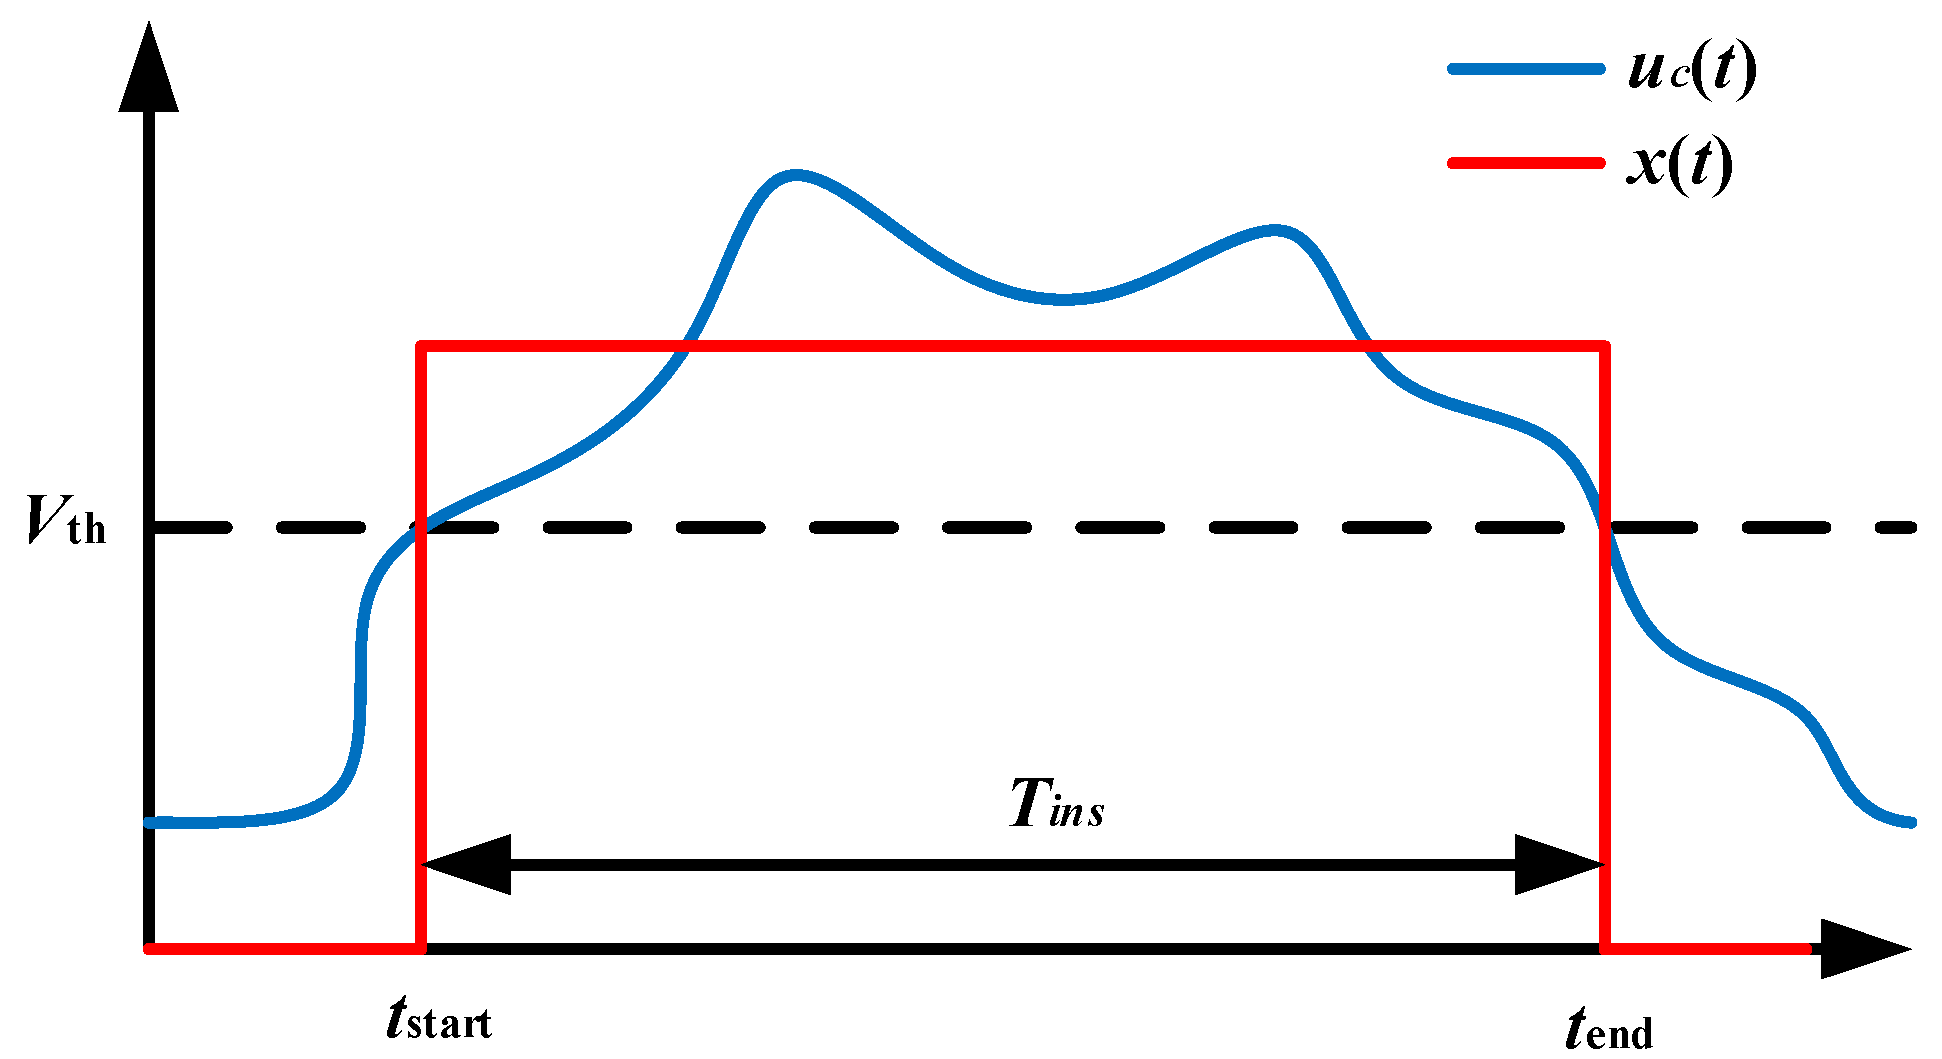
Figure 3 illustrates the conversion from the contact voltage to the comparator output x(t). When the contact voltage of the connector exceeds the threshold voltage Vth, the comparator converts the over-threshold state into a 3.3 V digital pulse; otherwise, x(t) remains at 0 V. The rising and falling edges of x(t) correspond to the start time tstart and end time tend of the intermittent event, respectively, and the time interval between them is defined as the intermittent duration Tins
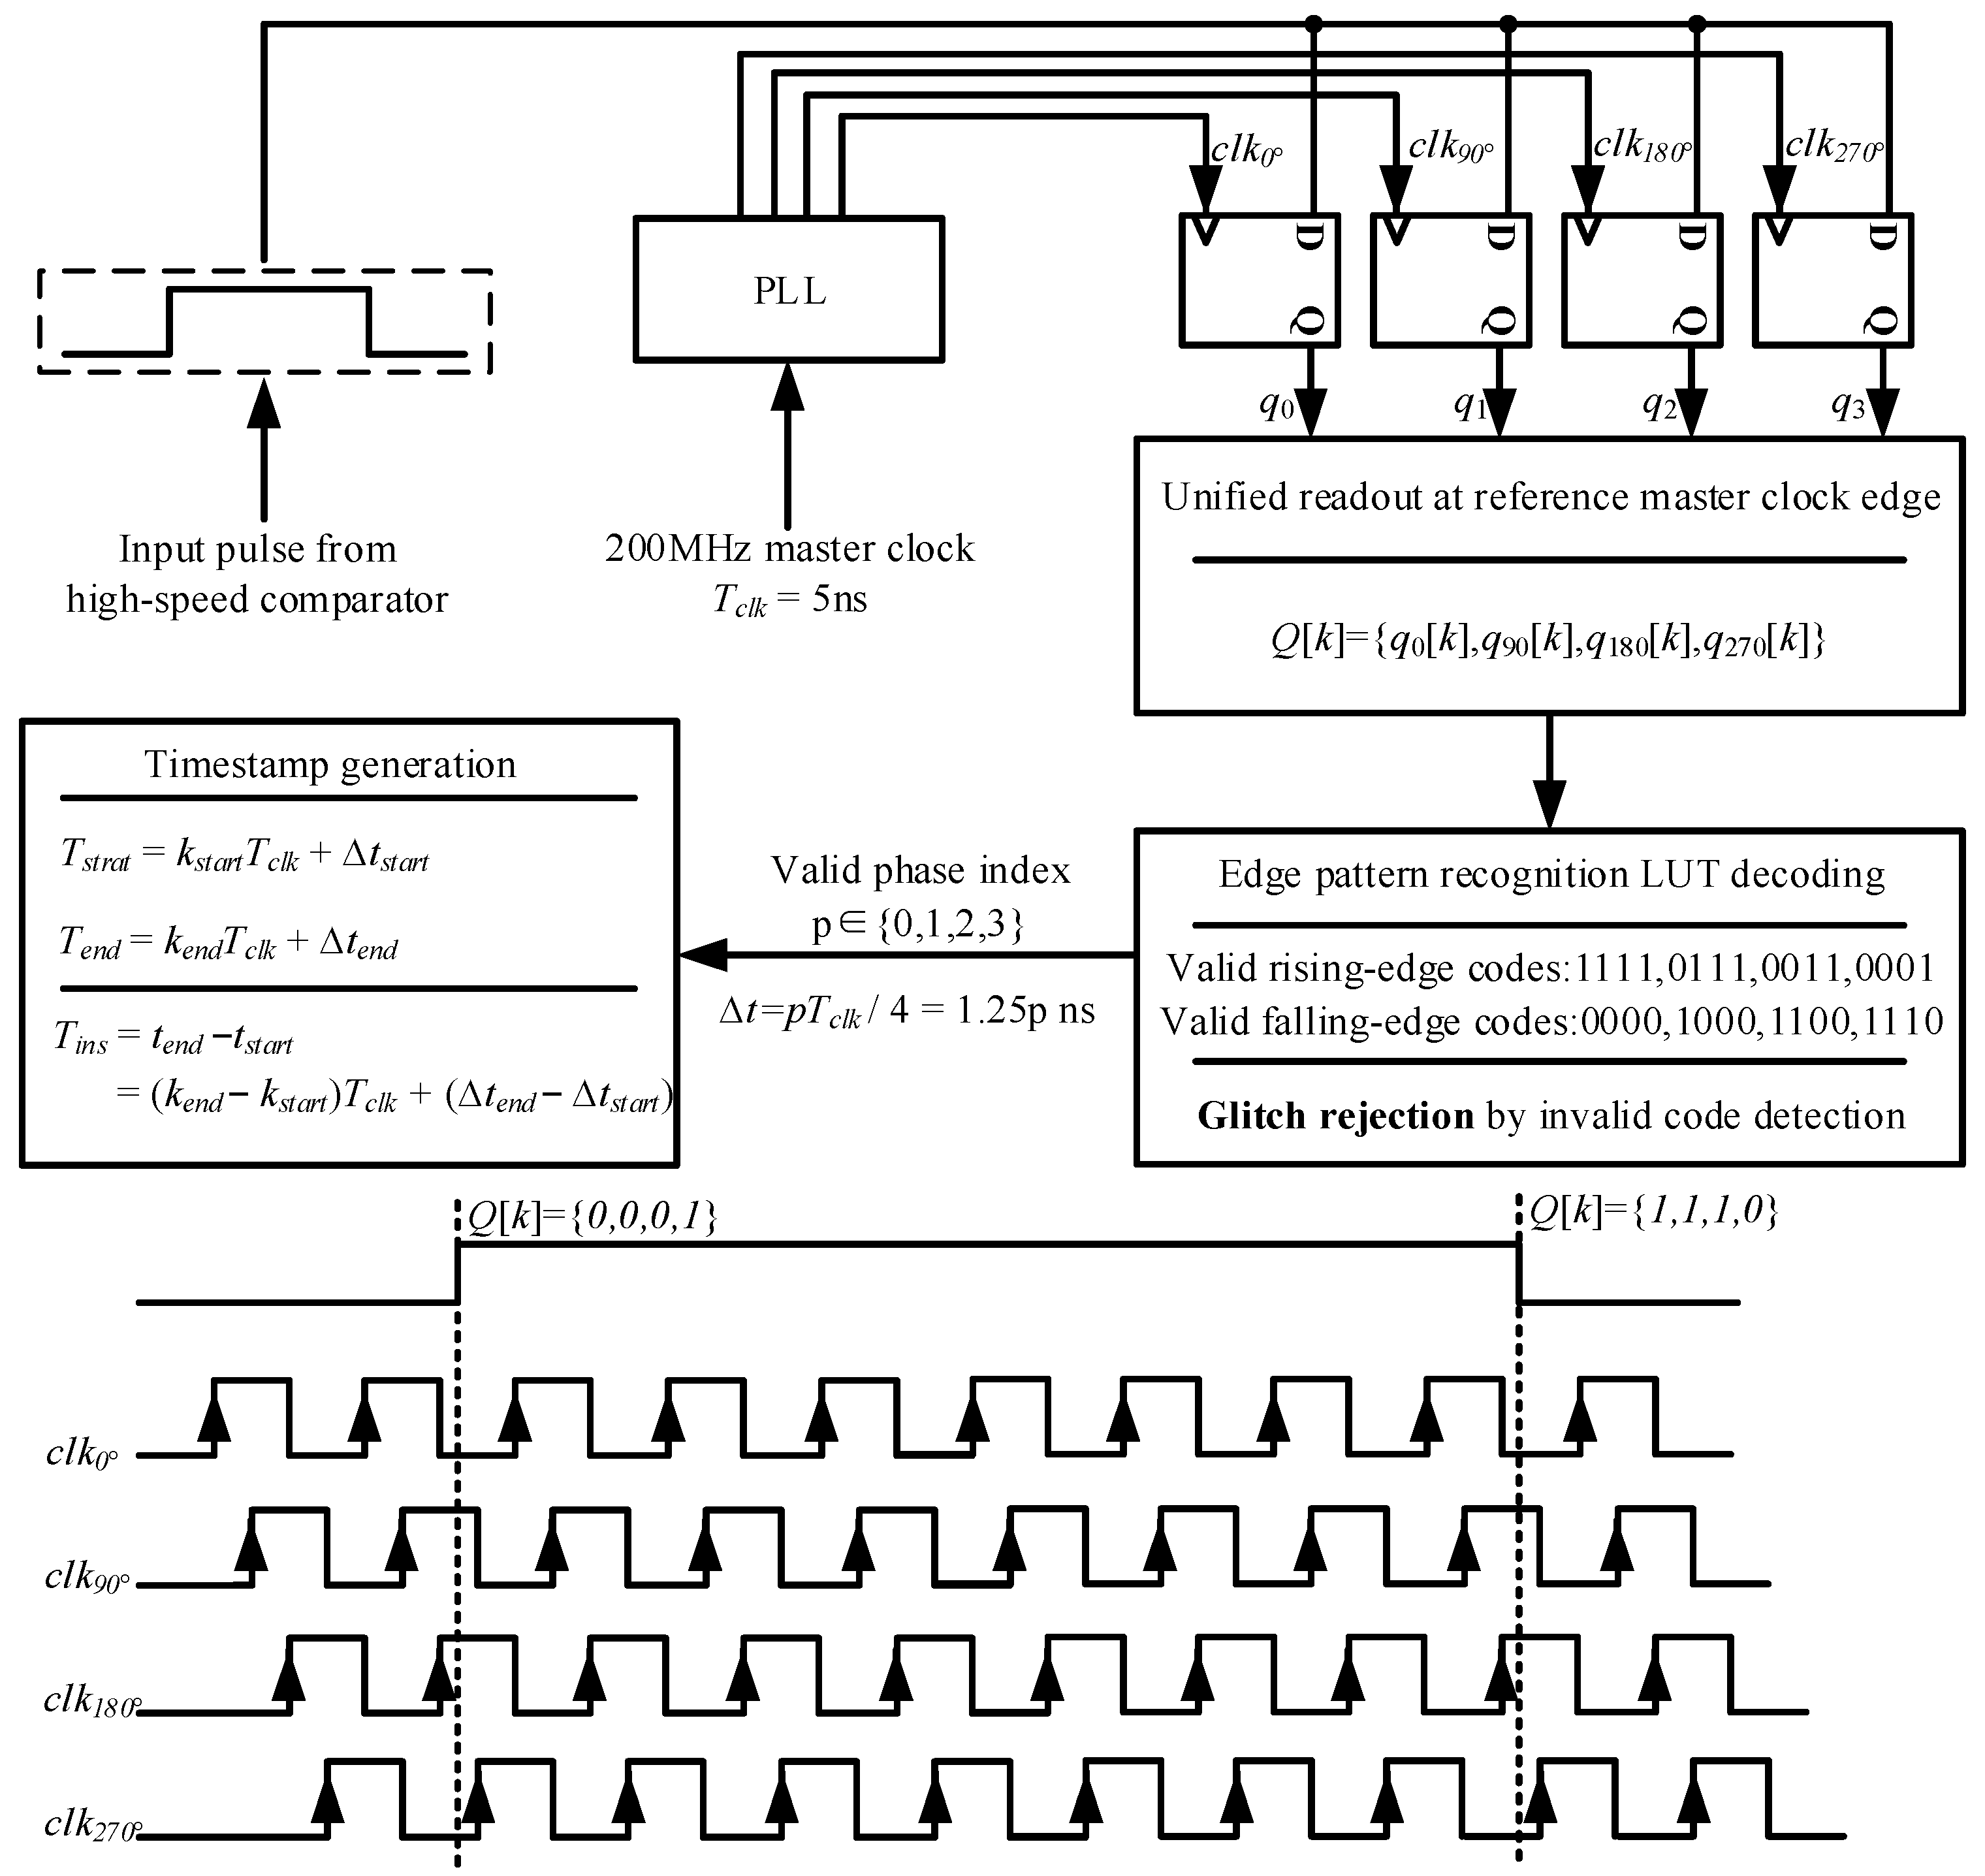
FPGA-based quadrature multiphase oversampling is used to improve the timing resolution of pulse edges, as shown in Figure 4. The FPGA master clock frequency is 200 MHz, corresponding to a clock period Tclk of 5 ns. A PLL generates four sampling clocks with the same frequency as the master clock and phases of 0°, 90°, 180°, 270°, respectively, to sample the comparator output x(t) in parallel. Since the four sampling points are evenly distributed within one master clock period, the equivalent sampling interval is 1.25 ns.
Let qm[k] denote the sampling result of the m-th phase in the k-th master clock period. The four-phase sampling results can be combined into a 4-bit sampling word:
Q [ k ] = { q 0 [ k ] , q 1 [ k ] , q 2 [ k ] , q 3 [ k ] } ,
where k is the master clock period index, and Q[k] is the 4-bit sampling word in the k-th master clock period. For a single valid rising edge or falling edge, the FPGA determines the phase index p of the edge by looking up the code pattern of Q[k], and obtains the sub-clock correction Δt:
Δ t = p T c l k 4 , p { 0 , 1 , 2 , 3 } ,
Therefore, the intermittent duration Tins can be expressed as
T i n s = t e n d t s t a r t = ( k e n d k s t a r t ) T c l k + ( Δ t e n d Δ t s t a r t ) ,
where tstart = kstartTclk + Δtstart is the start-edge timestamp of the intermittent event, and tend = kendTclk + Δtend is the end-edge timestamp.
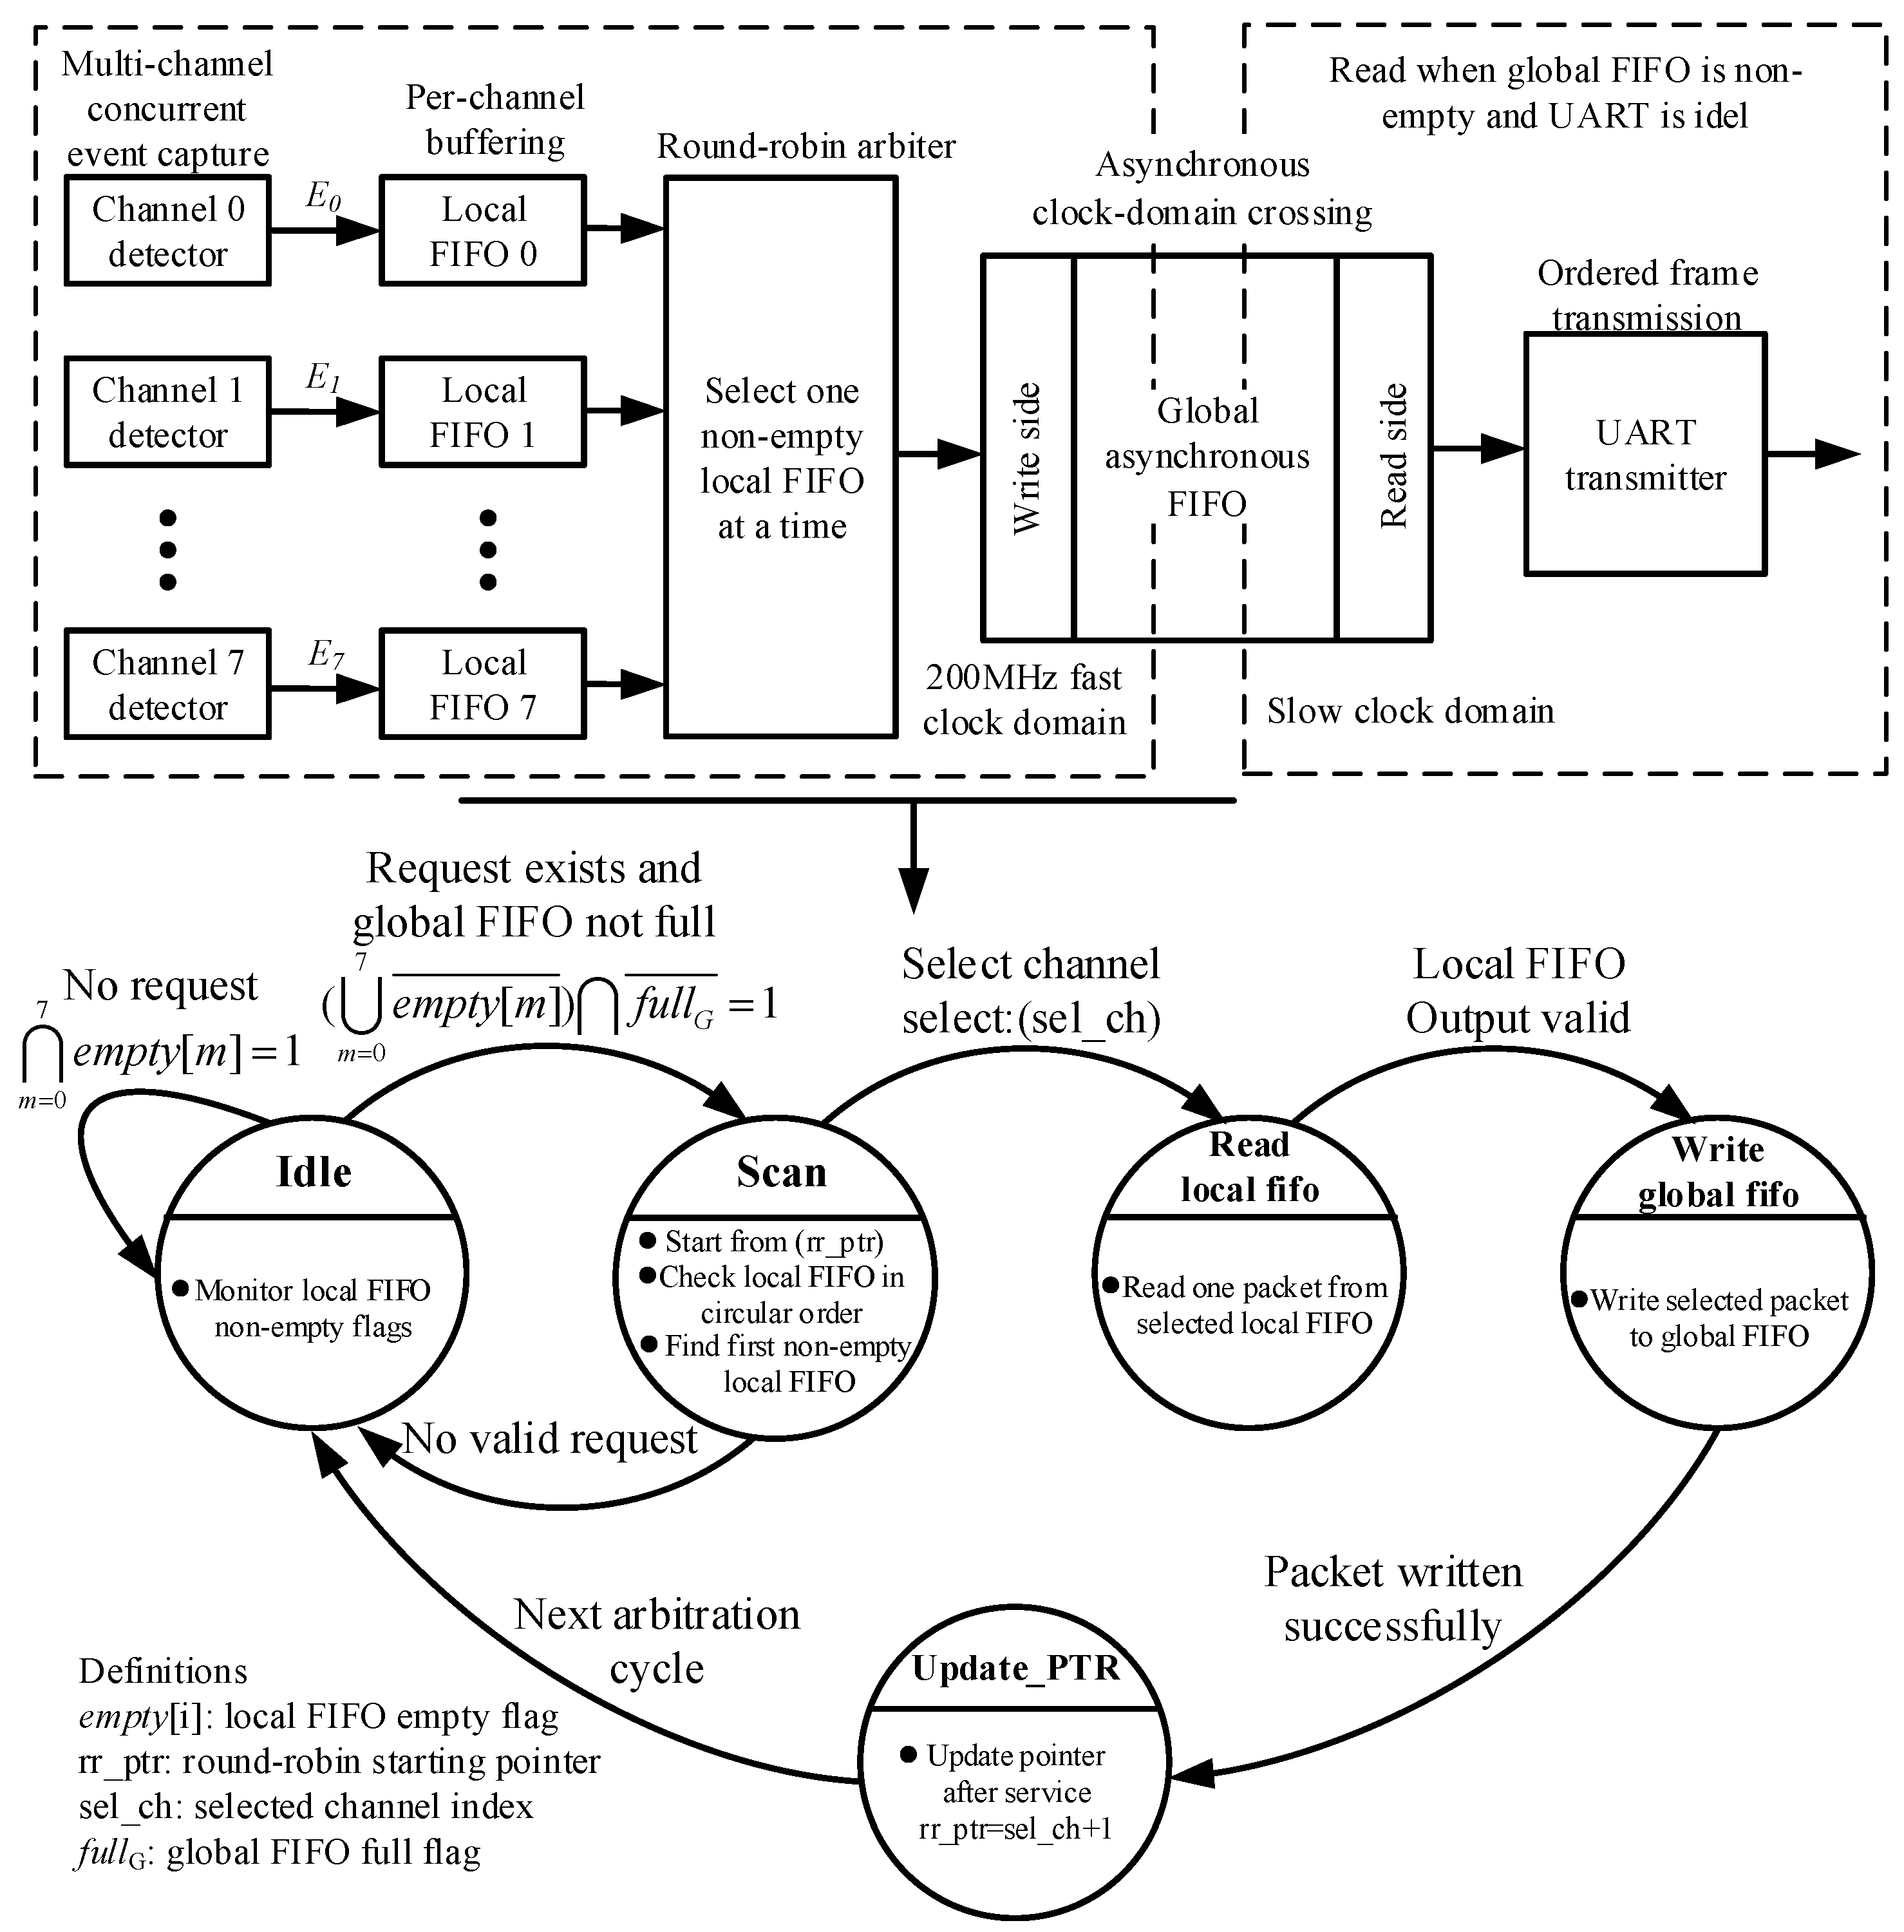
In multichannel testing, intermittent events in different channels may occur continuously or simultaneously within a short time interval. To avoid event loss, a hierarchical event buffering structure is implemented in the FPGA to separate intermittent-edge capture, event-frame generation, and low-speed uploading, as shown in Figure 5. This structure consists of independent FIFOs for each channel, a round-robin arbiter, a global asynchronous FIFO, and a UART upload module.
Each intermittent event detection channel is configured with an independent edge-detection unit. The unit operates in the 200 MHz high-speed clock domain, records the start time, end time, and duration of intermittent events, and generates an event frame. The event frame of the channel c can be expressed as
E c = { I D c , t s t a r t , c , t e n d , c , T i n s , c , F l a g c } ,
where IDc is the channel number, tstart,c and tend,c are the start and end timestamps, respectively, Tins,c is the intermittent duration, and Flagc is the event-valid flag.
The generated event frame is first written into the local FIFO of the corresponding channel. It is then read out sequentially by the round-robin arbiter, transferred into the global asynchronous FIFO, and uploaded to the host PC through the UART module. The host PC sorts and analyzes multichannel intermittent events according to the channel number and timestamp in the event frame.

3. Results

3.1. DCR

Standard resistors are used to evaluate the measurement error of DCR. Standard resistors with an accuracy of 0.01% and reference values of 1 mΩ, 10 mΩ, 100 mΩ, 1000 mΩ, and 10,000 mΩ (BZ3, Shanghai Dongmao Electronic Technology, Shanghai, China) are selected as the test objects. For each standard resistor, the contact voltage drop and loop current are continuously acquired for 1 s, and the mean DCR is calculated as
R ¯ = 1 N i = 1 N U i I i ,
where Ui and Ii are the contact voltage drop and loop current at the i-th sampling instant, and N is the number of sampling points. The relative measurement error is defined as
ε R = R ¯ R ref R ref × 100 % ,
where Rref is the nominal value of the standard resistor. Taking R ¯ as the measurement result, the Type-A standard uncertainty and expanded uncertainty are given by
u A ( R ¯ ) = s ( R ) N U ( R ¯ ) = k u A ( R ¯ ) ,
where s(R) is the standard deviation of the resistance sequence, and k is the coverage factor. In this work, k is set to 2. The measurement results and uncertainties for different standard resistors are listed in Table 2.
As the standard resistance increases from 1 mΩ to 10,000 mΩ, the relative error decreases from 0.41% to 0.02%, while the expanded uncertainty increases from 0.000226 mΩ to 0.026406 mΩ. For the 1 mΩ standard resistor, the contact voltage drop is small, and the relative influence of offset, noise, and quantization error is relatively large, resulting in a higher relative error. As the standard resistance increases, the absolute fluctuation of the calculated resistance also increases, leading to an increase in expanded uncertainty.

3.2. Intermittent Fault Duration

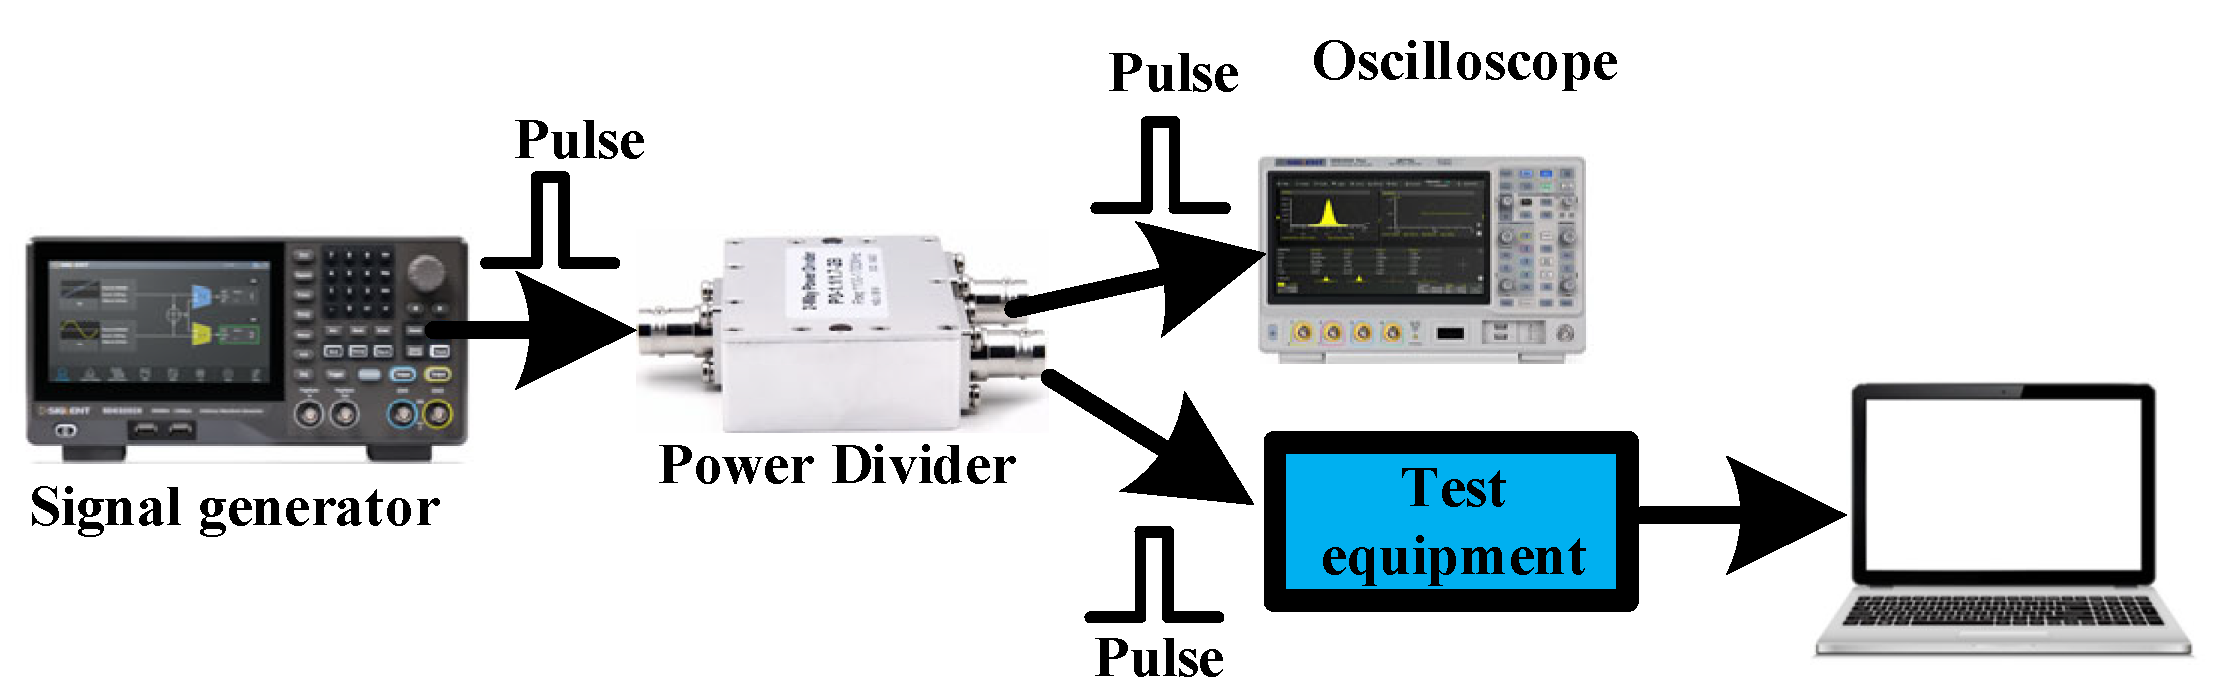
The measurement method for intermittent fault duration is shown in Figure 6. A signal generator (SDG3082X, SIGLENT Technologies, Shenzhen, China) outputs rectangular pulses with different pulse widths. The pulses are simultaneously input to an oscilloscope (SDS2504X Plus, SIGLENT Technologies, Shenzhen, China) and the proposed system by power divider (PD-1.1/1.7-2B, Eastsheep, Beijing, China). The oscilloscope measurement results are used as reference values. The system is configured with three intermittent resistance thresholds of 2 Ω, 5 Ω, and 7 Ω, which are converted into comparator threshold voltages according to the test current. The oscilloscope uses the same threshold voltage to measure the pulse duration, while the system records the start time, end time, and duration of each pulse.
For each pulse duration and threshold condition, the system repeatedly records the intermittent duration Tdev for m times, and the mean value T ¯ dev is calculated. The relative error is defined as
δ T = T ¯ dev T ¯ ref T ¯ ref × 100 % ,
where T ¯ ref is the mean duration measured by the oscilloscope. Taking T ¯ dev as the measurement result, the Type-A standard uncertainty and expanded uncertainty are given by
u A ( T ¯ dev ) = s ( T dev ) m U ( T ¯ dev ) = k u A ( T ¯ dev ) ,
where s(Tdev) is the standard deviation of repeated measurements, and k is the coverage factor. In this work, k is set to 2.
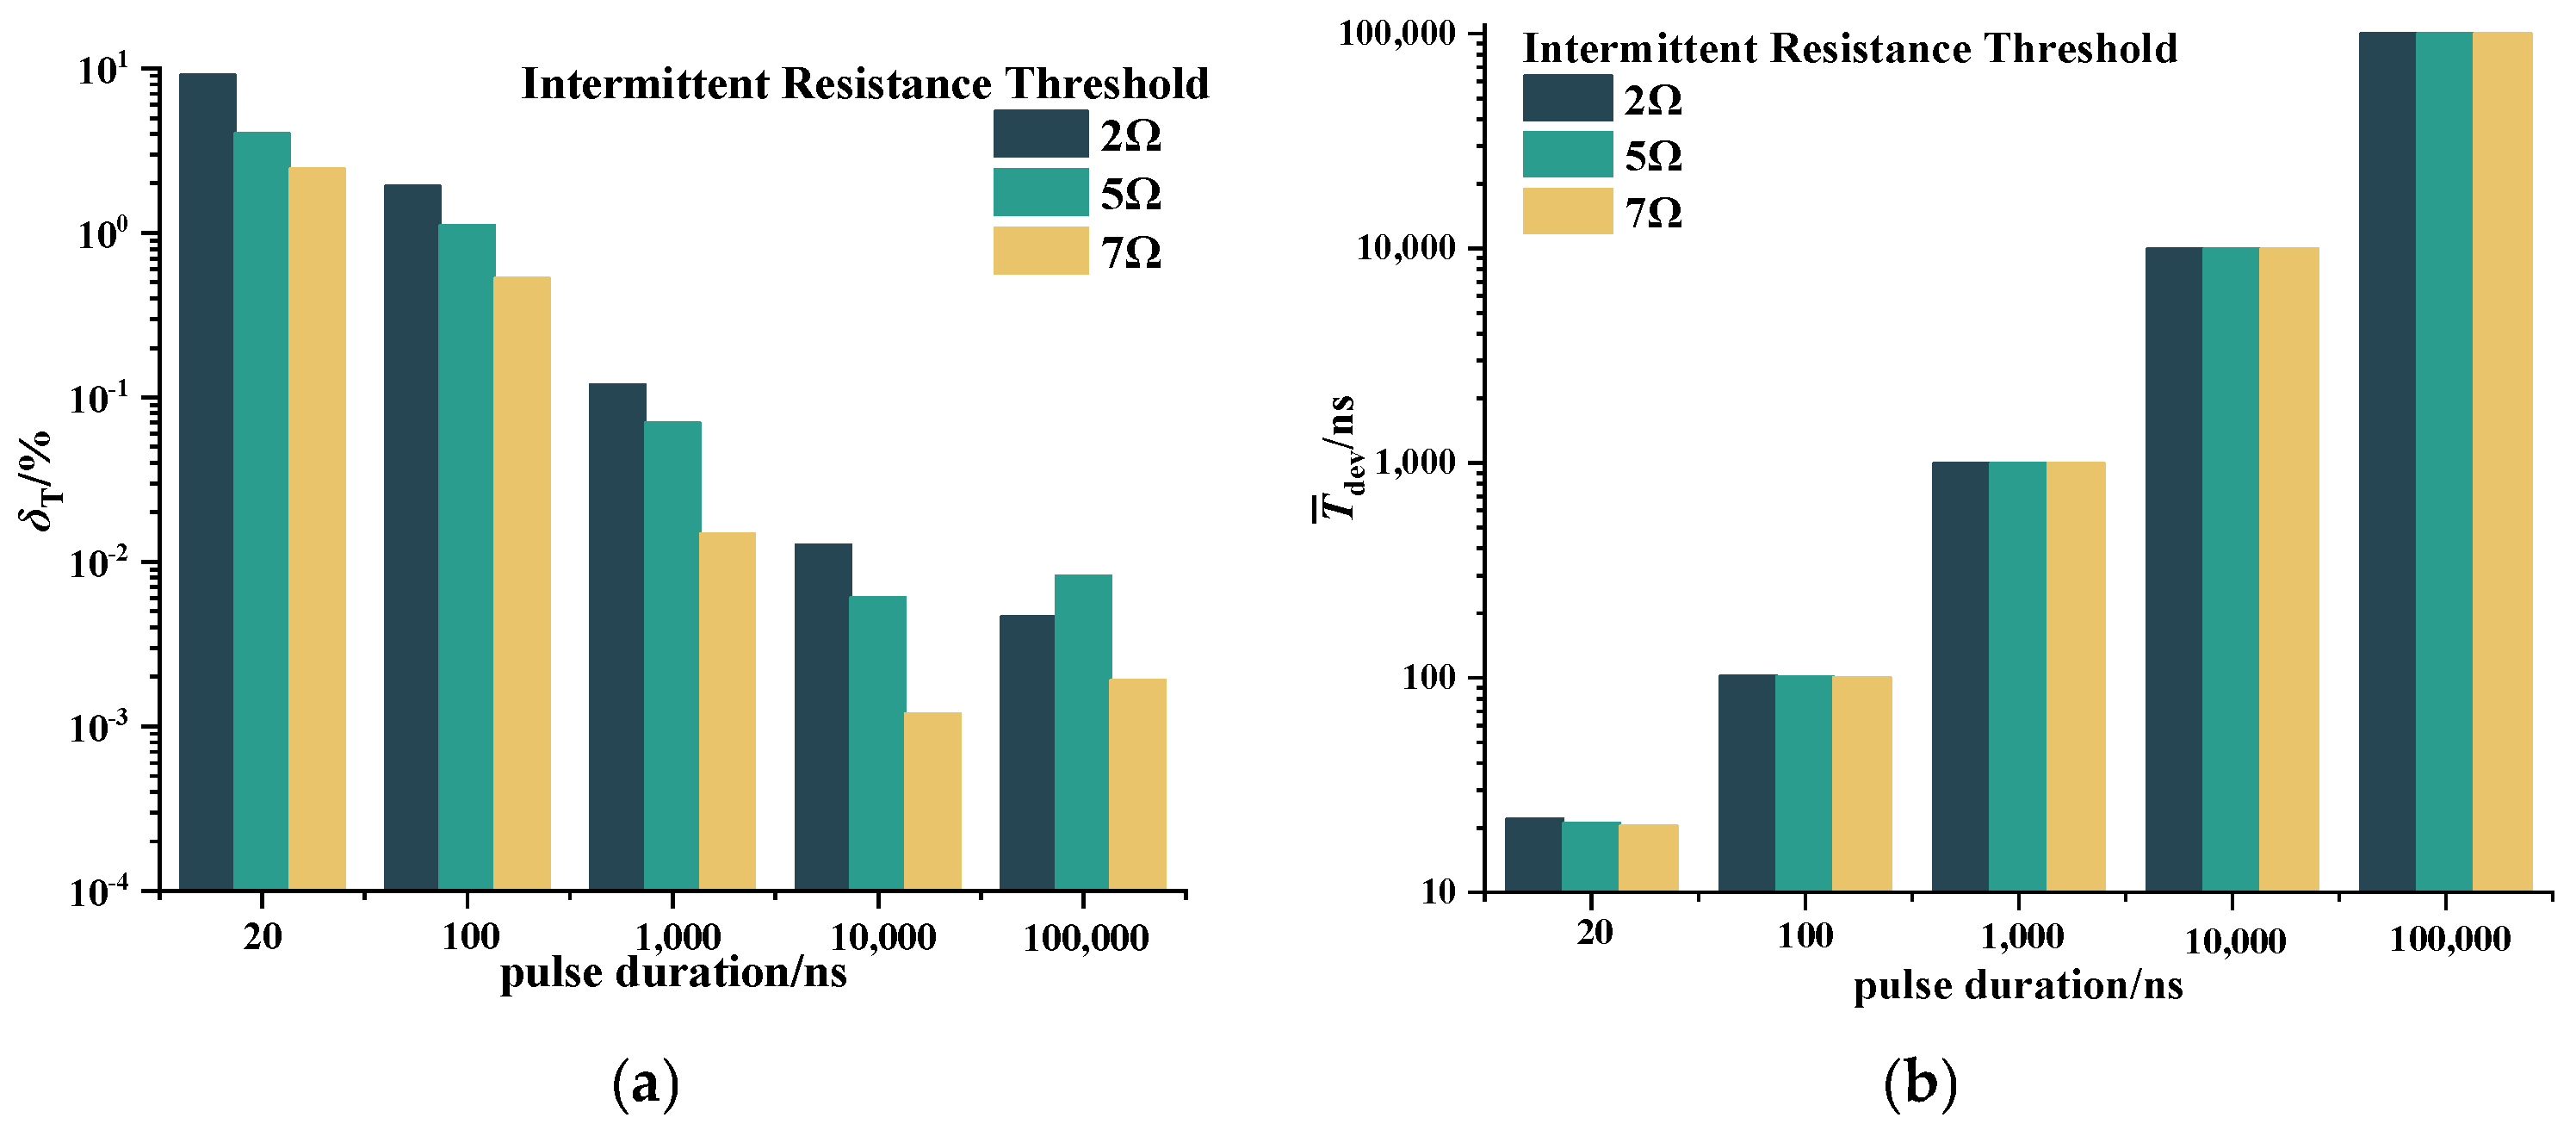
The test results under 2 Ω, 5 Ω and 7 Ω thresholds for different pulse widths are shown in Table 3 and Figure 7. As the duration increases from approximately 20 ns to 100 μs, the relative error generally decreases. Under the 20 ns condition, the maximum relative error is 9.09%; under the 100 ns condition, it decreases to 1.92%; and for durations of 1 μs and above, it is lower than 0.13%. The larger relative error at short pulse widths mainly results from edge quantization error introduced by the 1.25 ns equivalent timing step. As the duration increases, the proportion of the nanosecond-level absolute error in the total duration decreases, causing the relative error to decrease rapidly. For the same duration, the relative error generally decreases as the intermittent resistance threshold increases from 2 Ω to 7 Ω, indicating that the comparator switching point is less affected by baseline noise and threshold deviation at higher thresholds. The uncertainty results show that the expanded uncertainty is 0.28 ns–0.54 ns under the 20 ns–10 μs conditions, and increases to 1.42 ns–1.90 ns under the 100 μs condition, indicating a larger repeatability dispersion for longer duration measurements. This may be related to the pulse-width repeatability of the signal generator.
Compared with a setup using multiple high-speed oscilloscopes, the proposed system provides a unified FPGA time base for all channels and records intermittent events in an event-driven manner, thereby avoiding cross-instrument synchronization and post-alignment of waveform data. For long-term connector degradation tests, an oscilloscope-based setup would generally require continuous high-speed waveform recording to avoid missing sparse intermittent events, resulting in a large data volume. In contrast, the proposed system directly records over-threshold intermittent events as timestamps and durations, making it more suitable for long-term multichannel monitoring.

4. Discussion

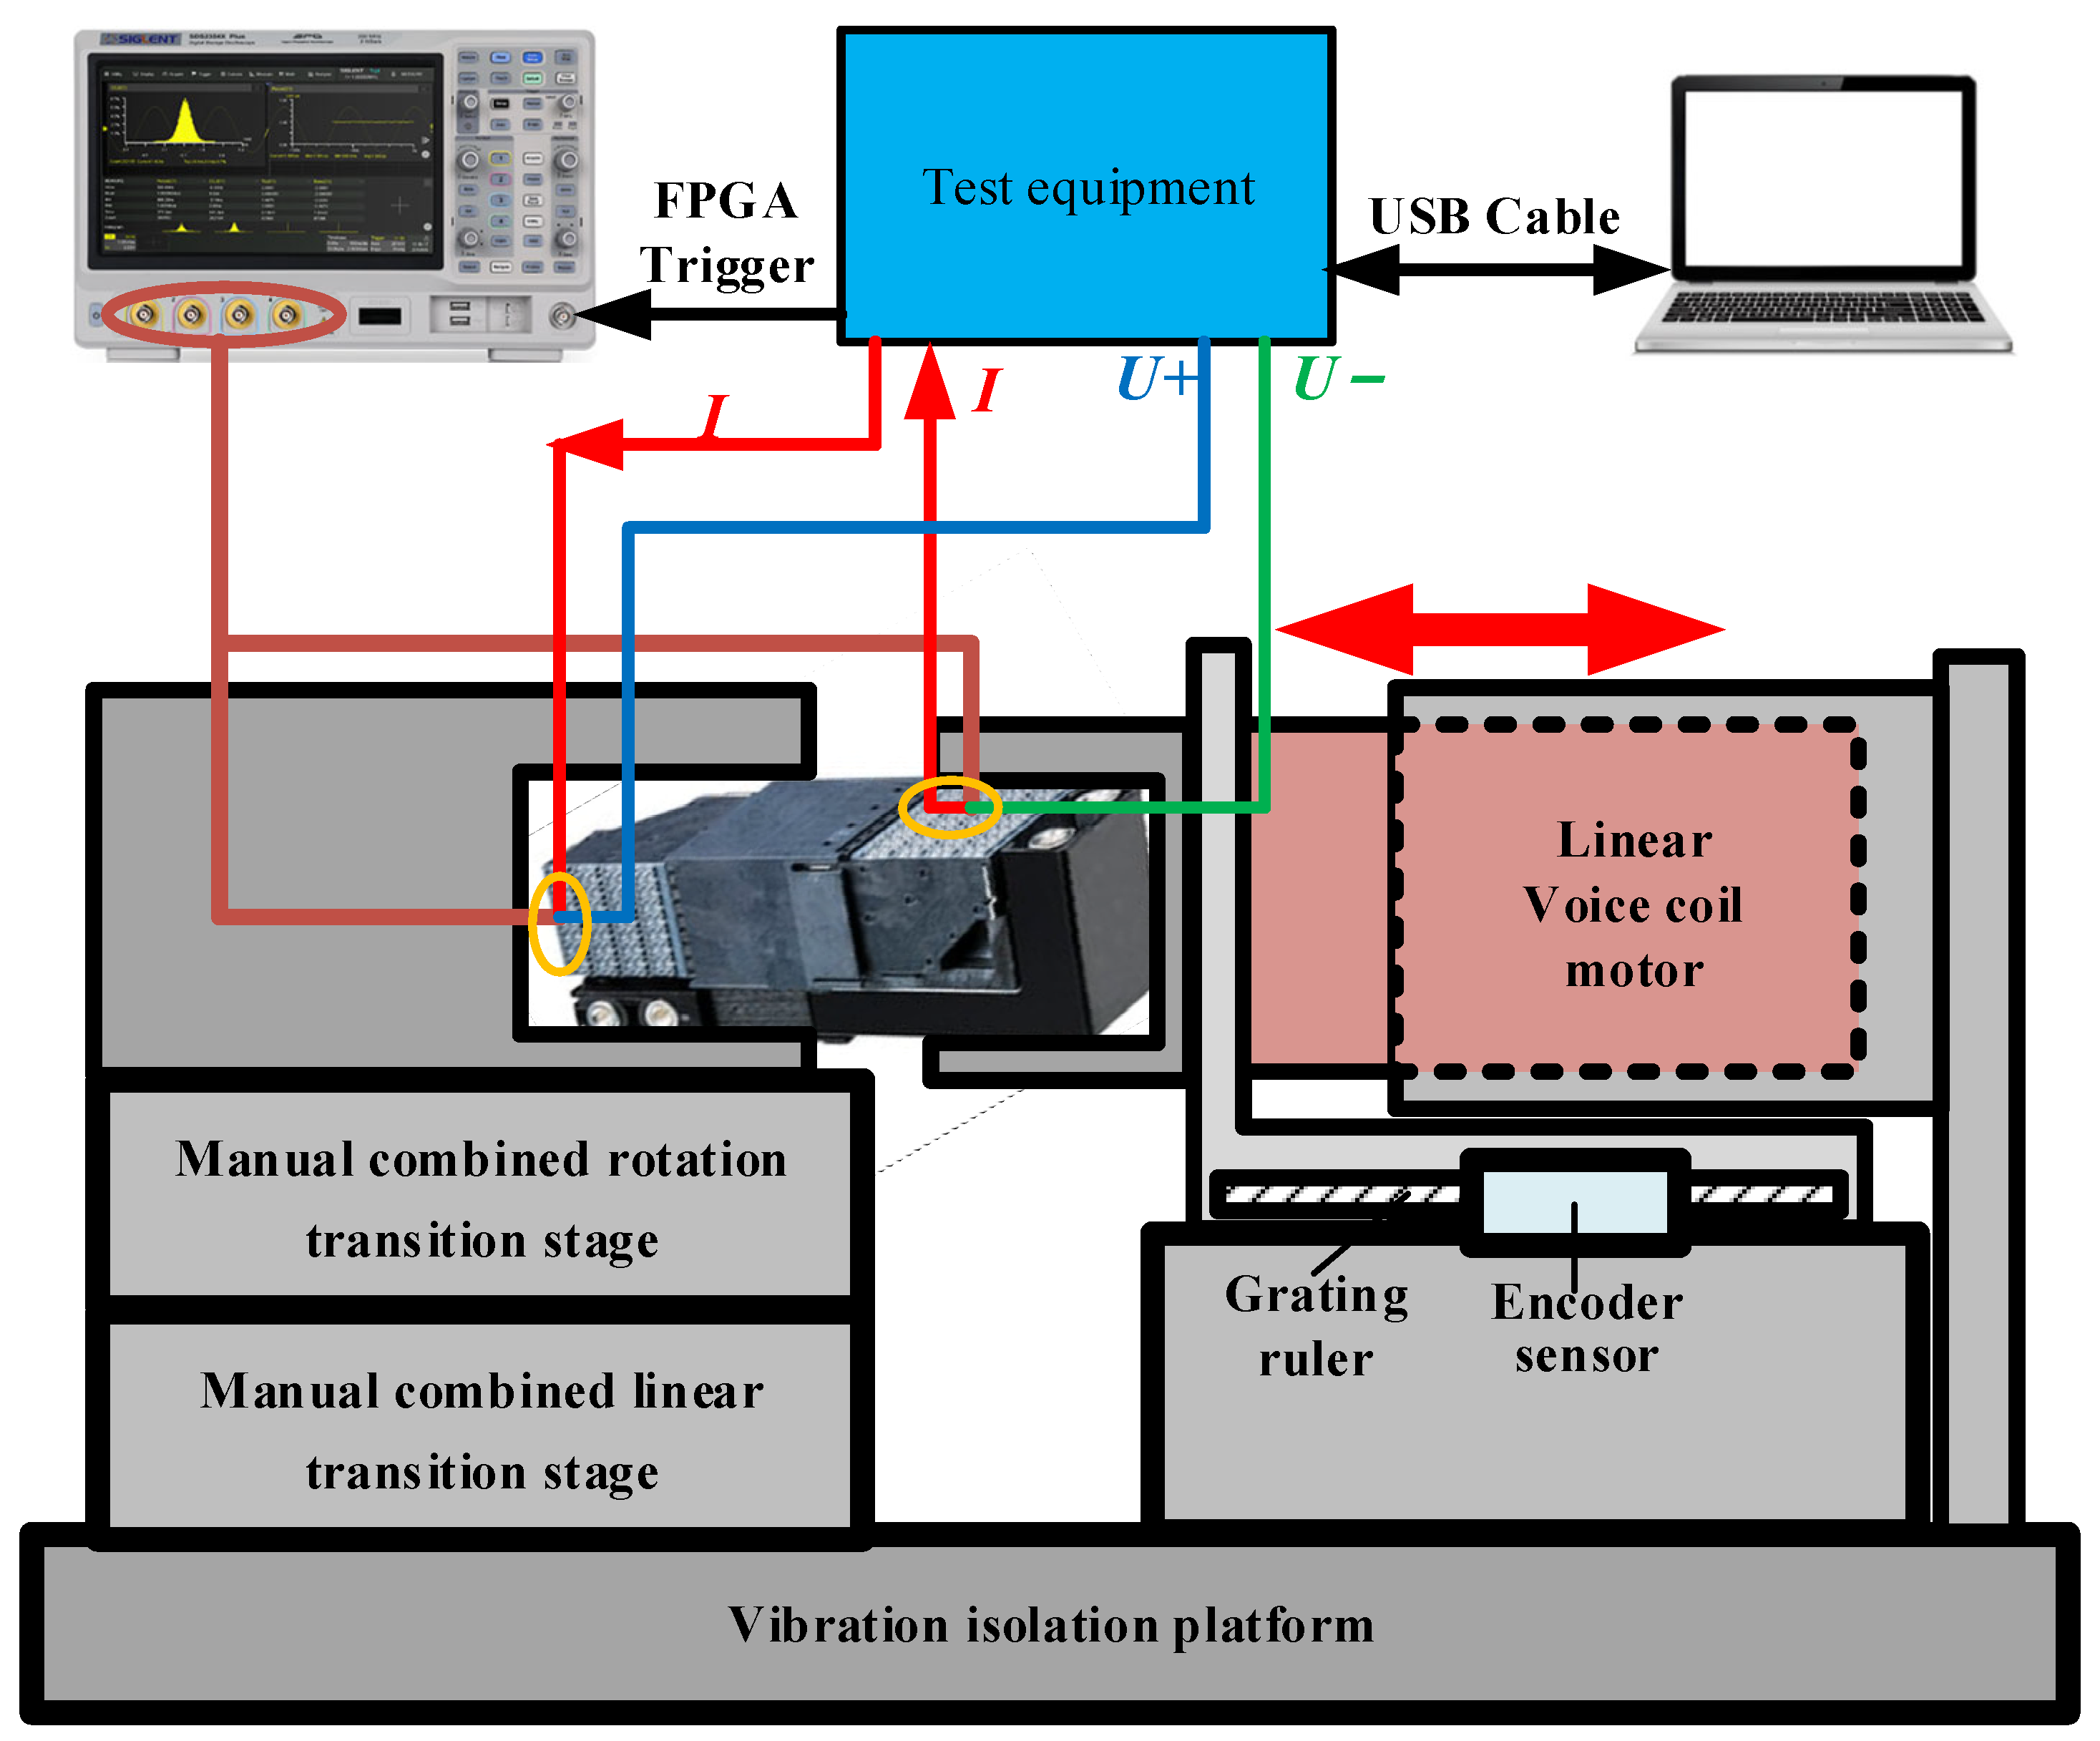
To evaluate the capability of the system to monitor the electrical contact response of connectors during vibration, the test platform shown in Figure 8 is established. A high-speed connector (Paladin, Amphenol, Wallingford, CT, USA) is used as the test specimen. One end of the connector is fixed on a translation-stage assembly, and the other end is fixed on a voice coil motor. The voice coil motor applies excitation along the mating direction of the connector. The connector demating displacement is set to 1 mm, and the vibration amplitude and frequency of the voice coil motor are set to 1 mm and 20 Hz, respectively. During vibration, the system and the oscilloscope simultaneously monitor four channels. The system records the DCR waveforms and intermittent events, while the oscilloscope records the contact voltage waveforms of the corresponding channels. The oscilloscope voltage threshold is set to 0.614 V, corresponding to the 7 Ω intermittent resistance threshold of the system. When a target intermittent event occurs, the FPGA in the system triggers the oscilloscope to save the corresponding waveform.
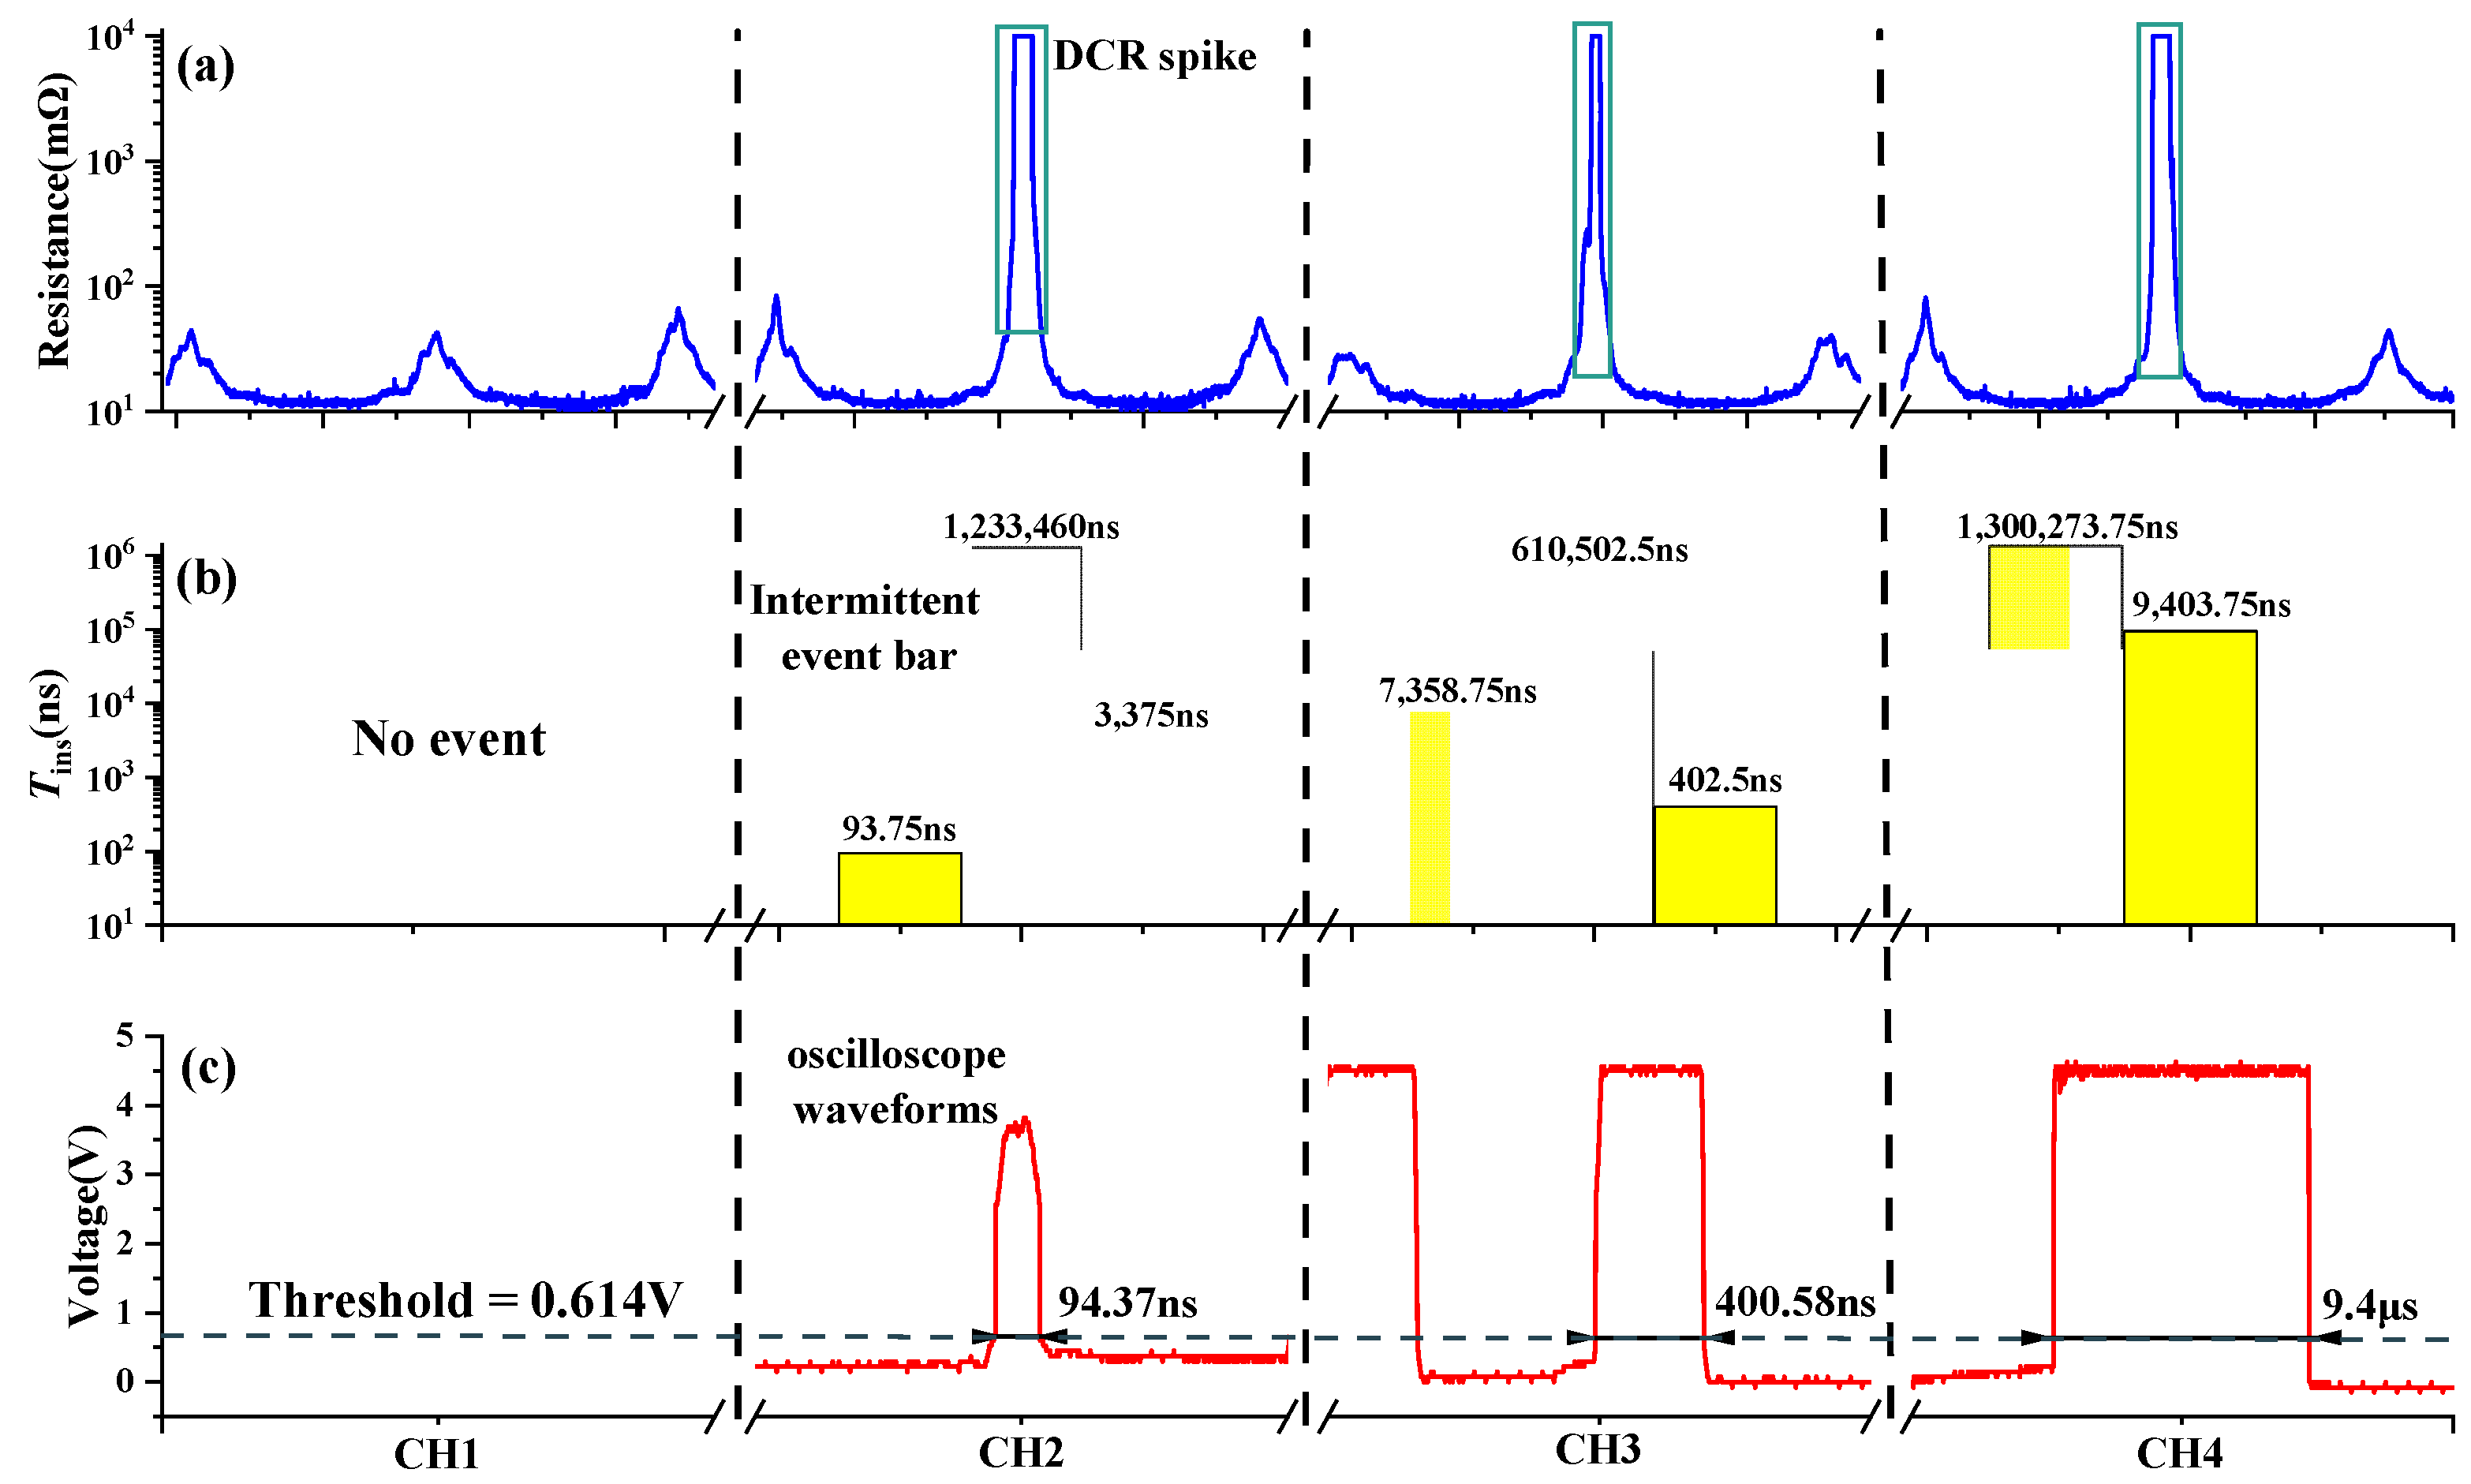
Figure 9 shows the measurement results of four channels within the same vibration time interval. Figure 9a shows the four-channel DCR waveforms recorded by the system. The resistance of Channel 1 shows periodic fluctuations, with a maximum value of 66.44 mΩ. Clear resistance spikes appear in Channels 2, 3, and 4, with the peak values reaching the measurement upper limit of 10,000 mΩ. Figure 9b shows the intermittent events recorded by the system. These intermittent events occur within the DCR pike regions marked in Figure 9a. Each bar represents one intermittent event, and the bar height represents its duration. No intermittent event is recorded in Channel 1. Channel 2 records intermittent events of 93.75 ns, 1.23 ms, and 3.38 μs. Channel 3 records intermittent events of 7.36 μs, 610.5 μs, and 402.5 ns. Channel 4 records intermittent events of 1.3 ms and 9.4 μs.
Figure 9c shows the oscilloscope measurement results corresponding to the highlighted event bars in Figure 9b. All of these pulses exceed the 0.614 V threshold, with durations of 94.37 ns, 400.58 ns, and 9.4 μs, respectively.
These results indicate that the contact responses of different channels are not identical within the same vibration time interval. Intermittent events are recorded near the resistance peaks in Channels 2, 3, and 4, and their durations cover the nanosecond, microsecond, and millisecond ranges. Meanwhile, short over-threshold pulses from hundreds of nanoseconds to several microseconds may occur before and after longer intermittent events, indicating that the contact instability process of the connector has multi-time-scale characteristics.
The short intermittent events completely captured by the oscilloscope in Figure 9c are compared with the intermittent events measured by the system and highlighted in Figure 9b. The results are listed in Table 4, where Tref is the over-threshold duration measured by the oscilloscope using 0.614 V as the threshold, and Tdev is the intermittent duration measured by the system using 7 Ω as the threshold. For the three actual intermittent durations of 94.37 ns, 400.58 ns, and 9400 ns, the corresponding durations recorded by the system are 93.75 ns, 402.5 ns, and 9403.75 ns, respectively. The relative errors are 0.66%, 0.48%, and 0.04%. These results demonstrate that the system can capture real intermittent events during connector vibration.

5. Conclusions

In this work, an eight-channel monitoring system with nanosecond resolution for intermittent faults in electrical connectors is developed. The test results show that the system covers a resistance measurement range of 1 mΩ–10Ω, with a maximum relative error of 0.41% in standard resistor tests. The intermittent fault detection module monitors intermittent events under thresholds of 2 Ω, 5 Ω, and 7 Ω, with an equivalent time resolution of 1.25 ns. The expanded uncertainty is 0.28 ns–0.54 ns over the duration range of 20 ns–10 μs. In vibration tests on high-speed connectors, the system captures real intermittent events under mechanical excitation. For three typical short intermittent events, the maximum relative error of duration measurement is 0.66% compared with oscilloscope measurements. Short over-threshold pulses in the hundred-nanosecond to microsecond range are also observed before and after long-duration intermittent events, showing that the system can be used to characterize the evolution of intermittent behavior in connectors during vibration. To further improve the monitoring performance, future work will focus on increasing the bandwidth of the high-gain DCR channel and the synchronized acquisition speed, so that fast resistance transients can be captured with higher waveform fidelity.

Author Contributions

Conceptualization, W.R. and C.Z.; methodology, Y.L. and Y.Z.; software, Y.L. and Y.Z.; validation, Y.L., Y.Z. and Y.M.; formal analysis, Y.L.; investigation, Y.L.; resources, W.R. and C.Z.; data curation, Y.L.; writing—original draft preparation, Y.L. and C.Z.; writing—review and editing, Y.L. and W.R.; visualization, Y.M.; supervision, W.R.; project administration, W.R.; funding acquisition, W.R. and C.Z. All authors have read and agreed to the published version of the manuscript.

Funding

This research and the APC were funded by the National Natural Science Foundation of China grant number U2441286, 52407166 and 52377140.

Data Availability Statement

The raw data supporting the conclusions of this article will be made available by the authors on reasonable request.

Acknowledgments

The authors would like to thank all members of the research team for their support during this study.

Conflicts of Interest

The authors declare no conflicts of interest.

References

  1. Antler, M. Survey of contact fretting in electrical connectors. IEEE Trans. Compon. Hybrids Manuf. Technol. 1985, 8, 87–104. [Google Scholar] [CrossRef] [Scilit]
  2. Fu, R.J.; Choe, S.Y.; Jackson, R.L.; Flowers, G.T.; Bozack, M.J.; Zhong, L.; Kim, D. Vibration-induced changes in the contact resistance of high power electrical connectors for hybrid vehicles. IEEE Trans. Compon. Packag. Manuf. Technol. 2012, 2, 185–193. [Google Scholar] [CrossRef] [Scilit]
  3. Qi, H.; Ganesan, S.; Pecht, M. No-fault-found and intermittent failures in electronic products. Microelectron. Reliab. 2008, 48, 663–674. [Google Scholar] [CrossRef] [Scilit]
  4. Syed, W.A.; Khan, S.; Phillips, P.; Perinpanayagam, S. Intermittent fault finding strategies. Procedia CIRP 2013, 11, 74–79. [Google Scholar] [CrossRef] [Scilit]
  5. GJB 1217A-2009; Test Methods for Electrical Connectors. Standards Press of China: Beijing, China, 2009.
  6. EIA-364-23; Electrical Connector/Socket Contact Resistance Test Procedure. US-ECIA: Alpharetta, GA, USA, 2021.
  7. Maul, C.; McBride, J.W.; Swingler, J. Intermittency phenomena in electrical connectors. IEEE Trans. Compon. Packag. Technol. 2001, 24, 370–377. [Google Scholar] [CrossRef] [Scilit]
  8. Carvou, E.; Ben Jemaa, N. Statistical study of voltage fluctuations in power connectors during fretting vibration. IEEE Trans. Compon. Packag. Technol. 2009, 32, 268–272. [Google Scholar] [CrossRef] [Scilit]
  9. Ren, W.; Wei, J.; Ma, X.; Cui, L. Effects of frequency on the intermittent failure phenomena of gold-plated electrical contact materials under fretting conditions. Mater. Res. Innov. 2015, 19, S5-127–S5-132. [Google Scholar] [CrossRef] [Scilit]
  10. Ren, W.; Wang, P.; Fu, Y.; Pan, C.; Song, J. Effects of temperature on fretting corrosion behaviors of gold-plated copper alloy electrical contacts. Tribol. Int. 2015, 83, 1–11. [Google Scholar] [CrossRef] [Scilit]
  11. Meng, Y.; Ren, W.; Zhang, C. Investigation on intermittent failure phenomenon of electrical connectors under repetitive mechanical insertion and withdrawal operations. IEEE Trans. Compon. Packag. Manuf. Technol. 2022, 12, 1533–1541. [Google Scholar] [CrossRef] [Scilit]
  12. Abbott, W.H. Time distribution of intermittents versus contact resistance for tin-tin connector interfaces during low amplitude motion. IEEE Trans. Compon. Hybrids Manuf. Technol. 1984, 7, 107–111. [Google Scholar] [CrossRef] [Scilit]
  13. Ginart, A.E.; Ali, I.N.; Goldin, J.W.; Kalgren, P.W.; Roemer, M.J.; Balaban, E.; Celaya, J.R. Sensing and characterization of EMI during intermittent connector anomalies. In Proceedings of the 2012 IEEE Aerospace Conference, Big Sky, MT, USA, 3–10 March 2012; pp. 1–7. [Google Scholar] [CrossRef] [Scilit]
  14. Syed, W.A.; Perinpanayagam, S.; Samie, M.; Jennions, I. A novel intermittent fault detection algorithm and health monitoring for electronic interconnections. IEEE Trans. Compon. Packag. Manuf. Technol. 2016, 6, 400–406. [Google Scholar] [CrossRef] [Scilit]
  15. Kim, C. Detection and location of intermittent faults by monitoring carrier signal channel behavior of electrical interconnection system. In Proceedings of the 2009 IEEE Electric Ship Technologies Symposium, Baltimore, MD, USA, 20–22 April 2009; pp. 449–455. [Google Scholar] [CrossRef] [Scilit]
  16. Kanchwala, H.; Ahmad, S.W. Multipoint intermittent fault detection of electronic interconnections using channel sounding techniques. IOP Conf. Ser. Mater. Sci. Eng. 2020, 946, 012006. [Google Scholar] [CrossRef] [Scilit]
  17. Auzanneau, F.; Layer, C. Microsecond intermittent fault detection for wire and connector defect prognostics. In Proceedings of the IEEE SENSORS 2017, Glasgow, UK, 29 October–1 November 2017; pp. 1–3. [Google Scholar] [CrossRef] [Scilit]
  18. Auzanneau, F. Detection and characterization of microsecond intermittent faults in wired networks. IEEE Trans. Instrum. Meas. 2018, 67, 2256–2258. [Google Scholar] [CrossRef] [Scilit]
  19. Cheng, X.; Lv, K.; Liu, G.; Qiu, J. Characteristics of intermittent fault in electrical connectors under vibration environment. IEEE Trans. Compon. Packag. Manuf. Technol. 2020, 10, 1575–1578. [Google Scholar] [CrossRef] [Scilit]
  20. Li, M.; Zhang, C.; Yang, Z.; Zhang, Y.; Ren, W. A new part-oriented test equipment for electrical contact reliability evaluation in high-speed connectors under vibration environments. In Proceedings of the 15th International Conference on Quality, Reliability, Risk, Maintenance, and Safety Engineering & the 8th International Conference on Materials and Reliability, Hohhot, China, 23–26 July 2025. [Google Scholar] [CrossRef] [Scilit]
Figure 1. Schematic diagram of the system architecture.
Inventions 11 00064 g001
Figure 2. Flowchart of adaptive range switching.
Inventions 11 00064 g002
Figure 3. Schematic diagram of contact-voltage threshold crossing and comparator output.
Inventions 11 00064 g003
Figure 4. Principle of quadrature multiphase oversampling.
Inventions 11 00064 g004
Figure 5. Principle of hierarchical event buffering structure.
Inventions 11 00064 g005
Figure 6. Intermittent fault duration test method.
Inventions 11 00064 g006
Figure 7. Intermittent fault duration measurement results: (a) Intermittent fault duration; (b) relative error.
Inventions 11 00064 g007
Figure 8. Schematic of the connector vibration test platform.
Inventions 11 00064 g008
Figure 9. Four-channel measurement results under connector vibration: (a) DCR waveforms recorded by the system; (b) intermittent event durations recorded by the system; (c) oscilloscope waveforms corresponding to the highlighted event bars in (b).
Inventions 11 00064 g009
Table 1. Theoretical design parameters of the voltage-drop amplification circuit.
RangeResistance Measurement RangeTotal GainTheoretical Bandwidth fsys
11000 mΩ–10,000 mΩ108.14 MHz
2100 mΩ–1000 mΩ1001.39 MHz
310 mΩ–100 mΩ1000140 kHz
41 mΩ–10 mΩ10,00014 kHz
Table 2. Measurement results and uncertainty for standard resistors.
Rref/mΩ R ¯ /mΩεR/%uA( R ¯ )/mΩU( R ¯ )/mΩ
10.99590.410.0001130.000226
109.96720.3280.0002730.000546
10099.7620.2380.0006660.001332
1000999.160.0840.0010610.002122
10,00010,0020.020.0132030.026406
Table 3. Measurement results and uncertainty under 2 Ω, 5 Ω, and 7 Ω thresholds.
Rth T ¯ ref/ns T ¯ dev/nsδT/%uA( T ¯ dev)/nsU( T ¯ dev)/ns
220.1121.93759.090.210.42
299.83101.751.920.140.28
21000.361001.56250.1200.240.48
210,000.5410,001.81250.01270.230.46
2100,009.31100,004.6250.004700.711.42
520.1320.93754.010.200.40
5100.20101.31251.110.170.34
51000.3010010.07000.210.42
510,001.9810,001.3750.006020.270.54
5100,012.37100,004.1250.008230.951.90
719.9520.43752.440.140.28
799.91100.43750.5280.230.46
71000.461000.31250.01470.180.36
710,001.1310,001.250.001240.240.48
7100,004.23100,002.31250.001910.891.78
Table 4. Comparison of intermittent duration.
Tref/nsTdev/nsAbsolute Error/nsRelative Error/%
94.3793.750.620.66
400.58402.51.920.48
94009403.753.750.04
Disclaimer/Publisher’s Note: The statements, opinions and data contained in all publications are solely those of the individual author(s) and contributor(s) and not of MDPI and/or the editor(s). MDPI and/or the editor(s) disclaim responsibility for any injury to people or property resulting from any ideas, methods, instructions or products referred to in the content.