Article

A Simple Automated Method for Microstructural Fluorescence Image Analysis to Determine the Degree of Polyploidy in Mono- and Dicotyledonous Plant Cells


by
Dmitriy A. Serov
1,
Dmitry A. Zakharov
1,
Natalia A. Semenova
1,
Maxim E. Astashev
1,2,
Valery A. Kozlov
1,3,*,
Alexey S. Dorokhov
4,
Andrey Yu. Izmailov
4 and
Sergey V. Gudkov
1,4
1
Prokhorov General Physics Institute of the Russian Academy of Sciences, 38 Vavilov St., 119991 Moscow, Russia
2
Federal Research Center “Pushchino Scientific Center for Biological Research of the Russian Academy of Sciences”, Institute of Cell Biophysics of the Russian Academy of Sciences, 3 Institutskaya St., 142290 Pushchino, Russia
3
Department of Fundamental Sciences, Bauman Moscow State Technical University, 5 2nd Baumanskaya St., 105005 Moscow, Russia
4
Federal State Budgetary Scientific Institution “Federal Scientific Agroengineering Center VIM” (FSAC VIM), 1st Institutskiy Pr. 5, 109428 Moscow, Russia
*
Author to whom correspondence should be addressed.
Inventions 2026, 11(3), 56; https://doi.org/10.3390/inventions11030056
Submission received: 23 April 2026 / Revised: 31 May 2026 / Accepted: 2 June 2026 / Published: 4 June 2026

Abstract

An evaluation of plant ploidy is an important task in breeding and biotechnology. Current methods of ploidy assessment (flow cytofluorometry and microscopy) are time-consuming and costly, and not applicable to real-world agricultural conditions. We developed an automated method for ploidy assessment based on fluorescence microscopy, which aims to accelerate and reduce the cost of plant ploidy analysis. The method is based on the automated selection of plant nuclei in fluorescence micrographs, followed by analysis of nuclear area, fluorescence intensity of the Hoechst DNA-binding probe, and nuclear geometry (circularity, roundness, solidity). The study was conducted on monocotyledonous and dicotyledonous plants with known genome sizes. Triticum aestivum Wt (6n, hexaploid) and Temp (4n, tetraploid) are monocotyledonous, and Capsella bursa-pastoris (4n, tetraploid) and Capsella rubella (2n, dT/iploid) are dicotyledonous. A simple fluorescent staining protocol combined with automated analysis using our ImageJ macro enables reliable separation of both monocotyledonous and dicotyledonous plants by genome size with an accuracy close (for dicots) or comparable (for monocots) to flow cytofluorometry. For ploidy separation in monocots, the most sensitive parameters are fluorescence intensity, nucleus area, and circularity. For ploidy separation in dicots, the most sensitive parameters are nucleus area, fluorescence intensity, and circularity.

1. Introduction

Polyploidy is the phenomenon of increasing the genome size due to its multiple copies [1]. The phenomenon of polyploidy often underlies the development of new highly productive varieties of agricultural plants [2]. At the same time, there is a trend in modern science advocating a return from polyploids to wild types to obtain varieties of agricultural plants resistant to phytopathogens [3,4,5,6]. In both cases, rapid and accurate assessment of plant ploidy is important from both the consumer’s and breeder’s perspectives. Often, parts of seeds or plant roots are used to assess ploidy. In the first case, it becomes possible to select seed material with the desired properties [7]. In the second case, it is possible to determine the ploidy of already growing plants without significant damage, including under conditions close to field conditions [8].
Currently, the development of automated methods for analyzing agricultural products and/or plants is actively developing [9,10], including automated analysis of plant ploidy [11]. Ideally, a method for assessing plant ploidy should be relatively inexpensive, fast, easy to learn, but at the same time should provide reproducible results and be suitable for analyzing a wide range of plants. Unfortunately, despite the abundance of laboratory methods for assessing plant ploidy [12], an ideal method for analyzing plant ploidy does not exist. The most common laboratory method for determining plant ploidy is flow cytofluorometry [13]. This method is characterized by high productivity [14]. Hotchst fluorescence brightness on genome size has been demonstrated [15,16,17]. However, flow cytofluorometry requires the purchase of expensive equipment and its ongoing maintenance, as well as highly qualified personnel at the stages of sample preparation, measurement, and subsequent analysis. Software for cytofluorometric analysis is often paid for and/or has closed-source code, which complicates the adaptation of the analysis protocol to a specific object and makes it impossible to use in real agricultural production conditions [18]. In addition, for this method, plant tissue must be completely dissociated using enzymatic treatment with cellulase, which is not easy to achieve for some types of plant objects [16]. In addition to cellulase treatment, cell dissociation and nuclei isolation are possible using special chopping buffers [19,20]. However, the effectiveness of the buffer depends on the plant species and selecting an adequate buffer for each object requires additional time [21,22].
Fluorescence microscopy is a more accessible alternative to flow cytofluorometry. Firstly, this method requires common and fairly affordable equipment. Secondly, fluorescence microscopy data are saved as raster images available for analysis using freely available software, such as ImageJ, CellProfiler, and others. Thirdly, unlike flow cytofluorometry, fluorescence microscopy provides information not only on the intensity of DNA fluorescence in plant nuclei, but also on the shape and size of the cell nucleus [23]. In flow cytofluorometry, attempts are known to evaluate nuclear morphology based on the values of forward and side scattering indices; however, the information obtained reflects the true characteristics of the nucleus very indirectly [24]. Flow cytometers are an exception. FlowSight and Image Stream Mark II cytometers, which incorporate a cell imaging system, are essentially fluorescence microscopes, with the optical path passing through a flow capillary containing moving cells. These devices are generally not readily available and are difficult to use for routine practice.
Fluorescence microscopy allows one to obtain information on the size and shape of the nucleus simultaneously with data on the intensity of DNA fluorescence with minimal sample preparation. Classical fluorescence microscopy is used to assess ploidy by counting the number of chromosomes stained with fluorescent dyes (DAPI, PI) [25]. However, direct chromosome counting by fluorescence microscopy has a number of significant drawbacks. Firstly, this method is only applicable to plants with a small number of large chromosomes, such as Allium cepa (16 chromosomes in total) [26,27,28]. Most agricultural plants have many times more chromosomes. For example, wheat Triticum aestivum has 42 chromosomes [29], so ploidy analysis of such plants using classical microscopy will take a significant amount of time. In addition, chromosome counting is only possible in dividing cells, preferably in metaphase or anaphase. The proportion of dividing cells at a given time in the desired phase of mitosis, even in meristems, is no more than 1–2% of all tissue cells [28]. The need to “accumulate” cells for analysis increases the duration and labor intensity of the study. Secondly, chromosome counting is a type of expert assessment, so this stage is very demanding in terms of personnel qualifications. The use of artificial intelligence (AI) algorithms is possible; however, training an AI model also requires highly qualified personnel and does not guarantee the accuracy of results comparable to expert assessment [30].
In this study, we developed and experimentally validated an automated method for analyzing plant cell nuclear microimages for polyploidy analysis. This method utilizes fluorescence microscopy and the open-source, freely available ImageJ software 1.54p software (Fiji). The method does not require expensive consumables, and mastering the software does not require specialized training. All parameters for searching and registering plant cell nuclei can be fine-tuned to meet the needs of a specific study or project. To validate the approach, a series of experimental studies was conducted on monocotyledonous and dicotyledonous plants.

2. Materials and Methods

2.1. Plants

The study was conducted on monocotyledonous and dicotyledonous plants with known genome sizes. Triticum varieties were chosen as monocotyledonous plants: T. aestivum L., Wt (6n, hexaploid) and Temp (4n, tetraploid) variety code 7754278 (from https://gossortrf.ru/registry/gosudarstvennyy-reestr-selektsionnykh-dostizheniy-dopushchennykh-k-ispolzovaniyu-tom-1-sorta-rasteni/ accessed on 29 May 2026). This variety was created and described by ‘Federal agricultural research center of the Northeast, named N.V. Rudnitskogo’ (Kirov, Russia). Different species of shepherd’s purse, Capsella, were chosen as examples of dicotyledonous plants: Capsella bursa-pastoris wt 3.4 (PGL 0001) 27 September 2021 (Aka Wt) (4n, tetraploid) and Capsella rubella (Aka Z) (2n, diploid). All plants were kindly provided from the collection of the N. I. Vavilov Institute of General Genetics of the Russian Academy of Sciences. Roots were chosen for the study because they lack colored and fluorescent structures: chloroplasts, lignin, suberin and/or non-photosynthetic pigments.

2.2. Plant Cultivation

Wheat seed sprouts were used for the studies. The seeds were germinated in pre-sterilized (120 °C, 2 h) glass Petri dishes with a diameter of 8 cm in a MIR-Compact climate chamber (AWTech, Moscow, Russia). A cotton pad soaked in deionized water was placed in the Petri dish. To obtain deionized water, a DV-5-OSMOS deionizer (Tsvet-Khrom, Moscow, Russia) equipped with a UV lamp for water sterilization was used. The electrical conductivity of the water used did not exceed 0.1 µS/mL. The day/night temperature regime was 27 °C/17 °C. Germination was carried out for 3–5 days until the formation of roots 5–8 mm long. From each grain root was cut with metal scissors, washed three times in deionized water, and fixed (see below).
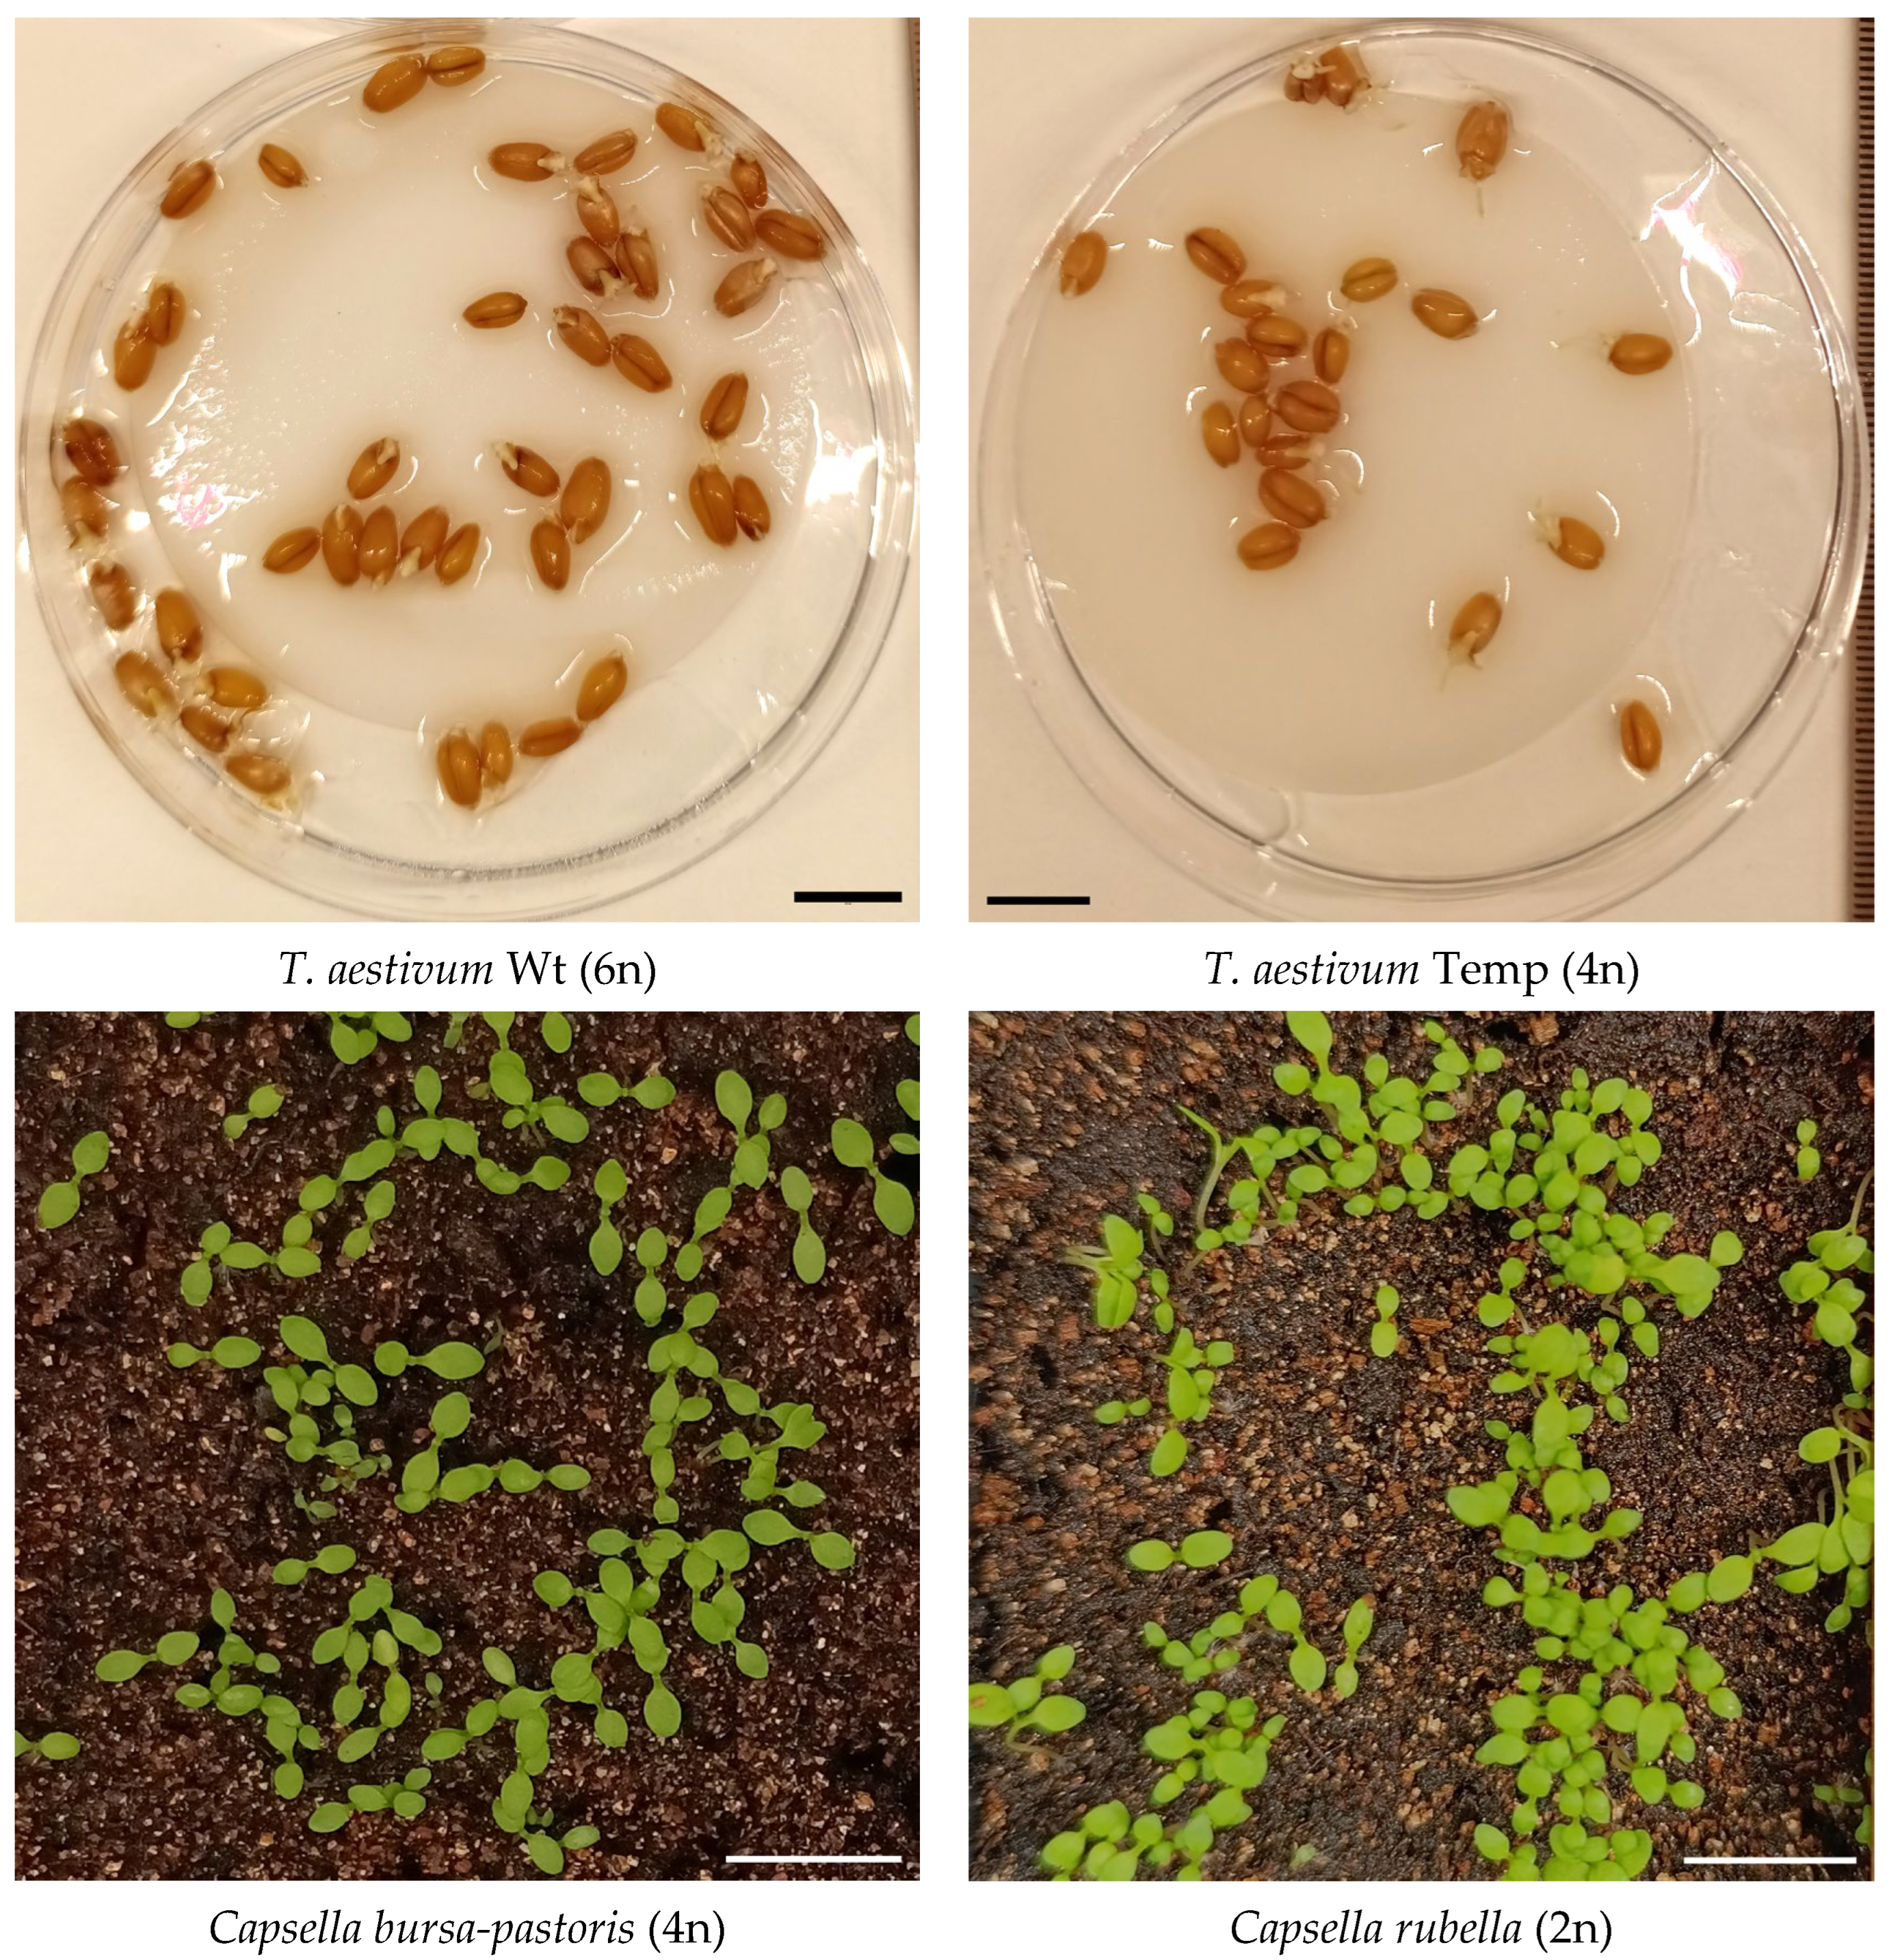
The roots of 7–9-day seedlings were used in the case of the Capsella assay. The plants were grown in a climate chamber. The photoperiod duration was 16 h. The day/night temperature regime was 27 °C/17 °C. Illumination in the climate chamber was provided by an SF60BK-1000 LED illuminator (Komplar, Moscow, Russia). The characteristics of photosynthetically active radiation were validated using a PG200N portable spectrometer (UPRtek, Zhunan, Taiwan). Photosynthetically active radiation λ 400–700 nm had an intensity of 600 μmol photon m2/s. Watering was performed every 5 days throughout the experiment, alternating between deionized water and a nutrient mixture. The nutrient mixture had the following composition: 0.05 g/L NH4NO3, 0.17 g/L KNO3, 1.06 g/L Ca(NO3)2∙H2O, 0.38 g/L K2SO4, 0.135 g/L KH2PO4, 0.49 g/L MgSO4∙7H2O. Young roots were dug up from the plants, 1–2 cm long sections were cut off, and they were washed from soil in deionized water. From each seedling, the root was cut with metal scissors, washed three times in deionized water, and fixed [31,32]. Photos of seedlings are shown below (Figure 1). Seedlings from randomly selected seeds of the aforementioned varieties were used in the present study. One root was cut from each seedling for analysis.

2.3. Fixation and Staining of Roots

Clark’s fixative, a 3:1 mixture of 95% isopropyl alcohol and glacial acetic acid (all LenReaktiv, Moscow, Russia), was used as the fixative solution. Ten to twenty roots were placed in 1 mL of freshly prepared Clark’s fixative and incubated for 15 min at room temperature with gentle agitation. After fixation, the roots were transferred to centrifuge tubes containing 1–1.5 mL of 70% isopropanol. The roots were stored in isopropanol in a refrigerator at 4 °C until staining and analysis. Storage for several months is possible.
To visualize nuclei, we used the fluorescent dye Hoechst 33258 (Lumiprobe RUS, Moscow, Russia). Immediately before staining, we performed partial gentle maceration of the roots in order to obtain a monolayer distribution of cells and ensure adequate analysis of the morphology of the nuclei. Gentle maceration was performed in a 10% aqueous solution of acetic acid for 1 min at 90 °C and gentle stirring at 200 rpm on a TS-100C thermo shaker (BioSan, Riga, Latvia). After treating the roots with acetic acid, they were transferred to 1 mL of deionized water and stained with 20 μg/mL Hoechst 33258 in the presence of 0.006% Triton X-100 (Sigma-Aldrich, Burlington, MA, USA) for 30 min in the dark at room temperature. After staining, the roots were transferred to 1 mL of deionized water. To prepare microscopic slides, root caps (1–2 mm from the tip) were cut off individually from the roots using a blade or scalpel and placed in a drop of deionized water. The root caps were covered with a 20 × 20 mm coverslip and gently pressed down on the slide with just enough force to disintegrate the root into individual cells. The prepared slides were then analyzed using fluorescence microscopy.

2.4. Fluorescence Microscopy

Microscopic preparations of root meristems were analyzed using a DMI4000 B fluorescence microscope (Leica, Wetzlar, Germany) equipped with an SDU-285 digital camera (SpetsTeleTekhnika, Moscow, Russia). WinFluorXE v 3.8.7 8-12-16 software (J. Dempster, Strathclyde Electrophysiology Software, University of Strathclyde, Glasgow, UK) was used for data collection. Visible light micrographs with phase contrast were taken to assess the integrity of individual cells. Fluorescence micrographs were recorded at excitation and emission λ of 350 and 450 nm, respectively (D0 filter set). Exposure time was 500–1000 ms, diode power was 400 conventional units, digital gain was ×323, and pixel binarization was 2 × 2. Data were acquired as 12-bit monochrome images and saved in TIFF resolution. The data were acquired as 12-bit monochrome images. Subsequent analysis was performed using ImageJ2 software v 1.54f Fiji (NIH, Bethesda, MD, USA).

2.5. Microstructural Fluorescence Image Analysis

Fluorescence microscopy is plagued by inhomogeneous illumination of the viewing field, as well as the presence of extraneous background fluorescence sources. In particular, in the case of plants, this is due to the cell wall cellulose, the removal of which requires the use of cellulases and is not always successful. We developed a special macro based on the freely available ImageJ2 software v 1.54f Fiji to solve the issue of inhomogeneous illumination of the viewing field and/or the presence of inhomogeneous background light sources (plant cell walls). The initial schematic of the macro for automated search and analysis of plant cell characteristics is shown in Figure 1.
Object selection (regions of interest, ROIs) is performed by ImageJ’s built-in “Particle Analysis” operator. This operator requires setting brightness threshold boundaries, after which it selects ROIs using a threshold discriminator based on the “all-or-none” principle. This method is not without its drawbacks. In particular, under non-uniform illumination, it is virtually impossible to select all ROIs in a single analysis. In this macro, we have developed a method for improving the functionality of this operator.
The macro operates by sequentially running “Particle Analysis.” After each run, the intermediate result is saved as a binary mask, and the analyzed brightness ranges are automatically modified in an arbitrarily defined step. In this case, “Particle Analysis” generates several series of ROIs, each with its own unique ranges of average brightness. In the first analysis cycles, the macro selects the brightest objects. In subsequent cycles, the macro adds new ROIs with lower brightness. Finally, the dim objects (usually at the edges of the field of view) are analyzed. When the same object “hits” both “bright” and “soft” areas at the same time, it generates several ROIs with the same coordinates, which will then be combined into one using the logical “or” operator.
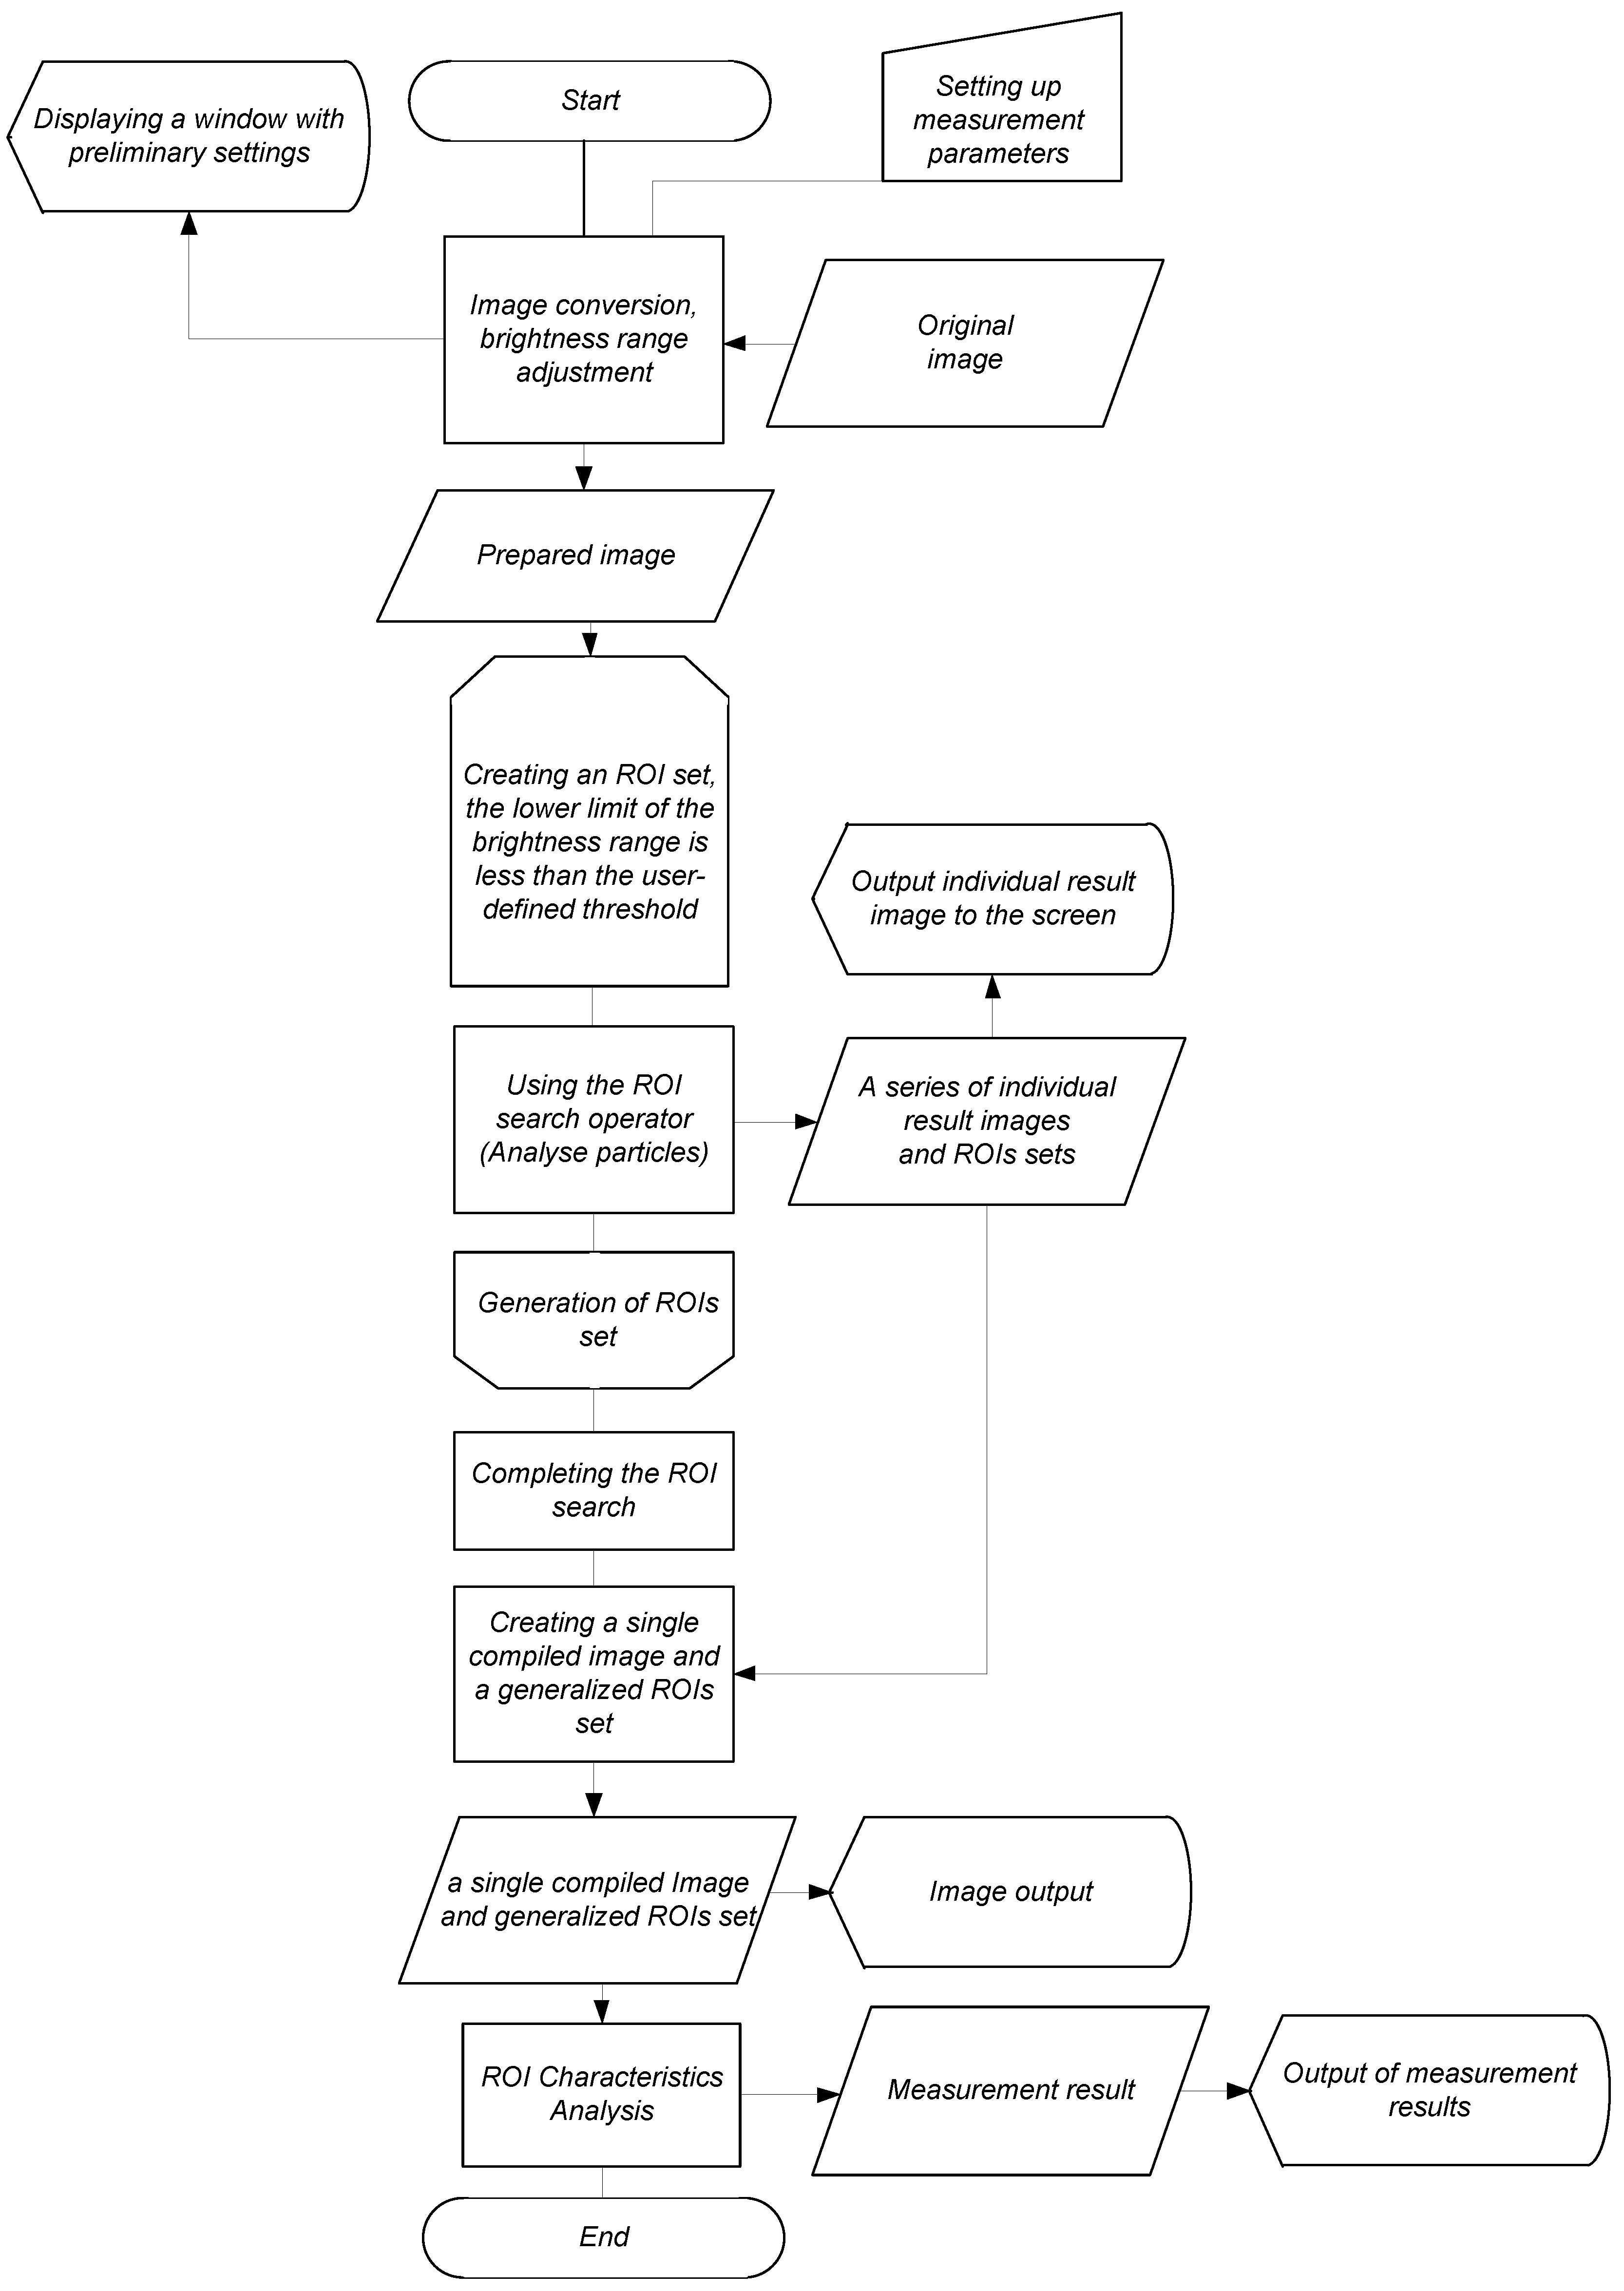
This removes duplicate ROIs. After generating a series of ROIs and combining them into a single list free of duplicates, the pre-defined characteristics are automatically measured. A more detailed step-by-step diagram of the macro’s operation is provided in Figure 2. To run the macro, launch ImageJ or Fiji and open the Supplementary File “Macro_polyploidy_v1.ijm”.
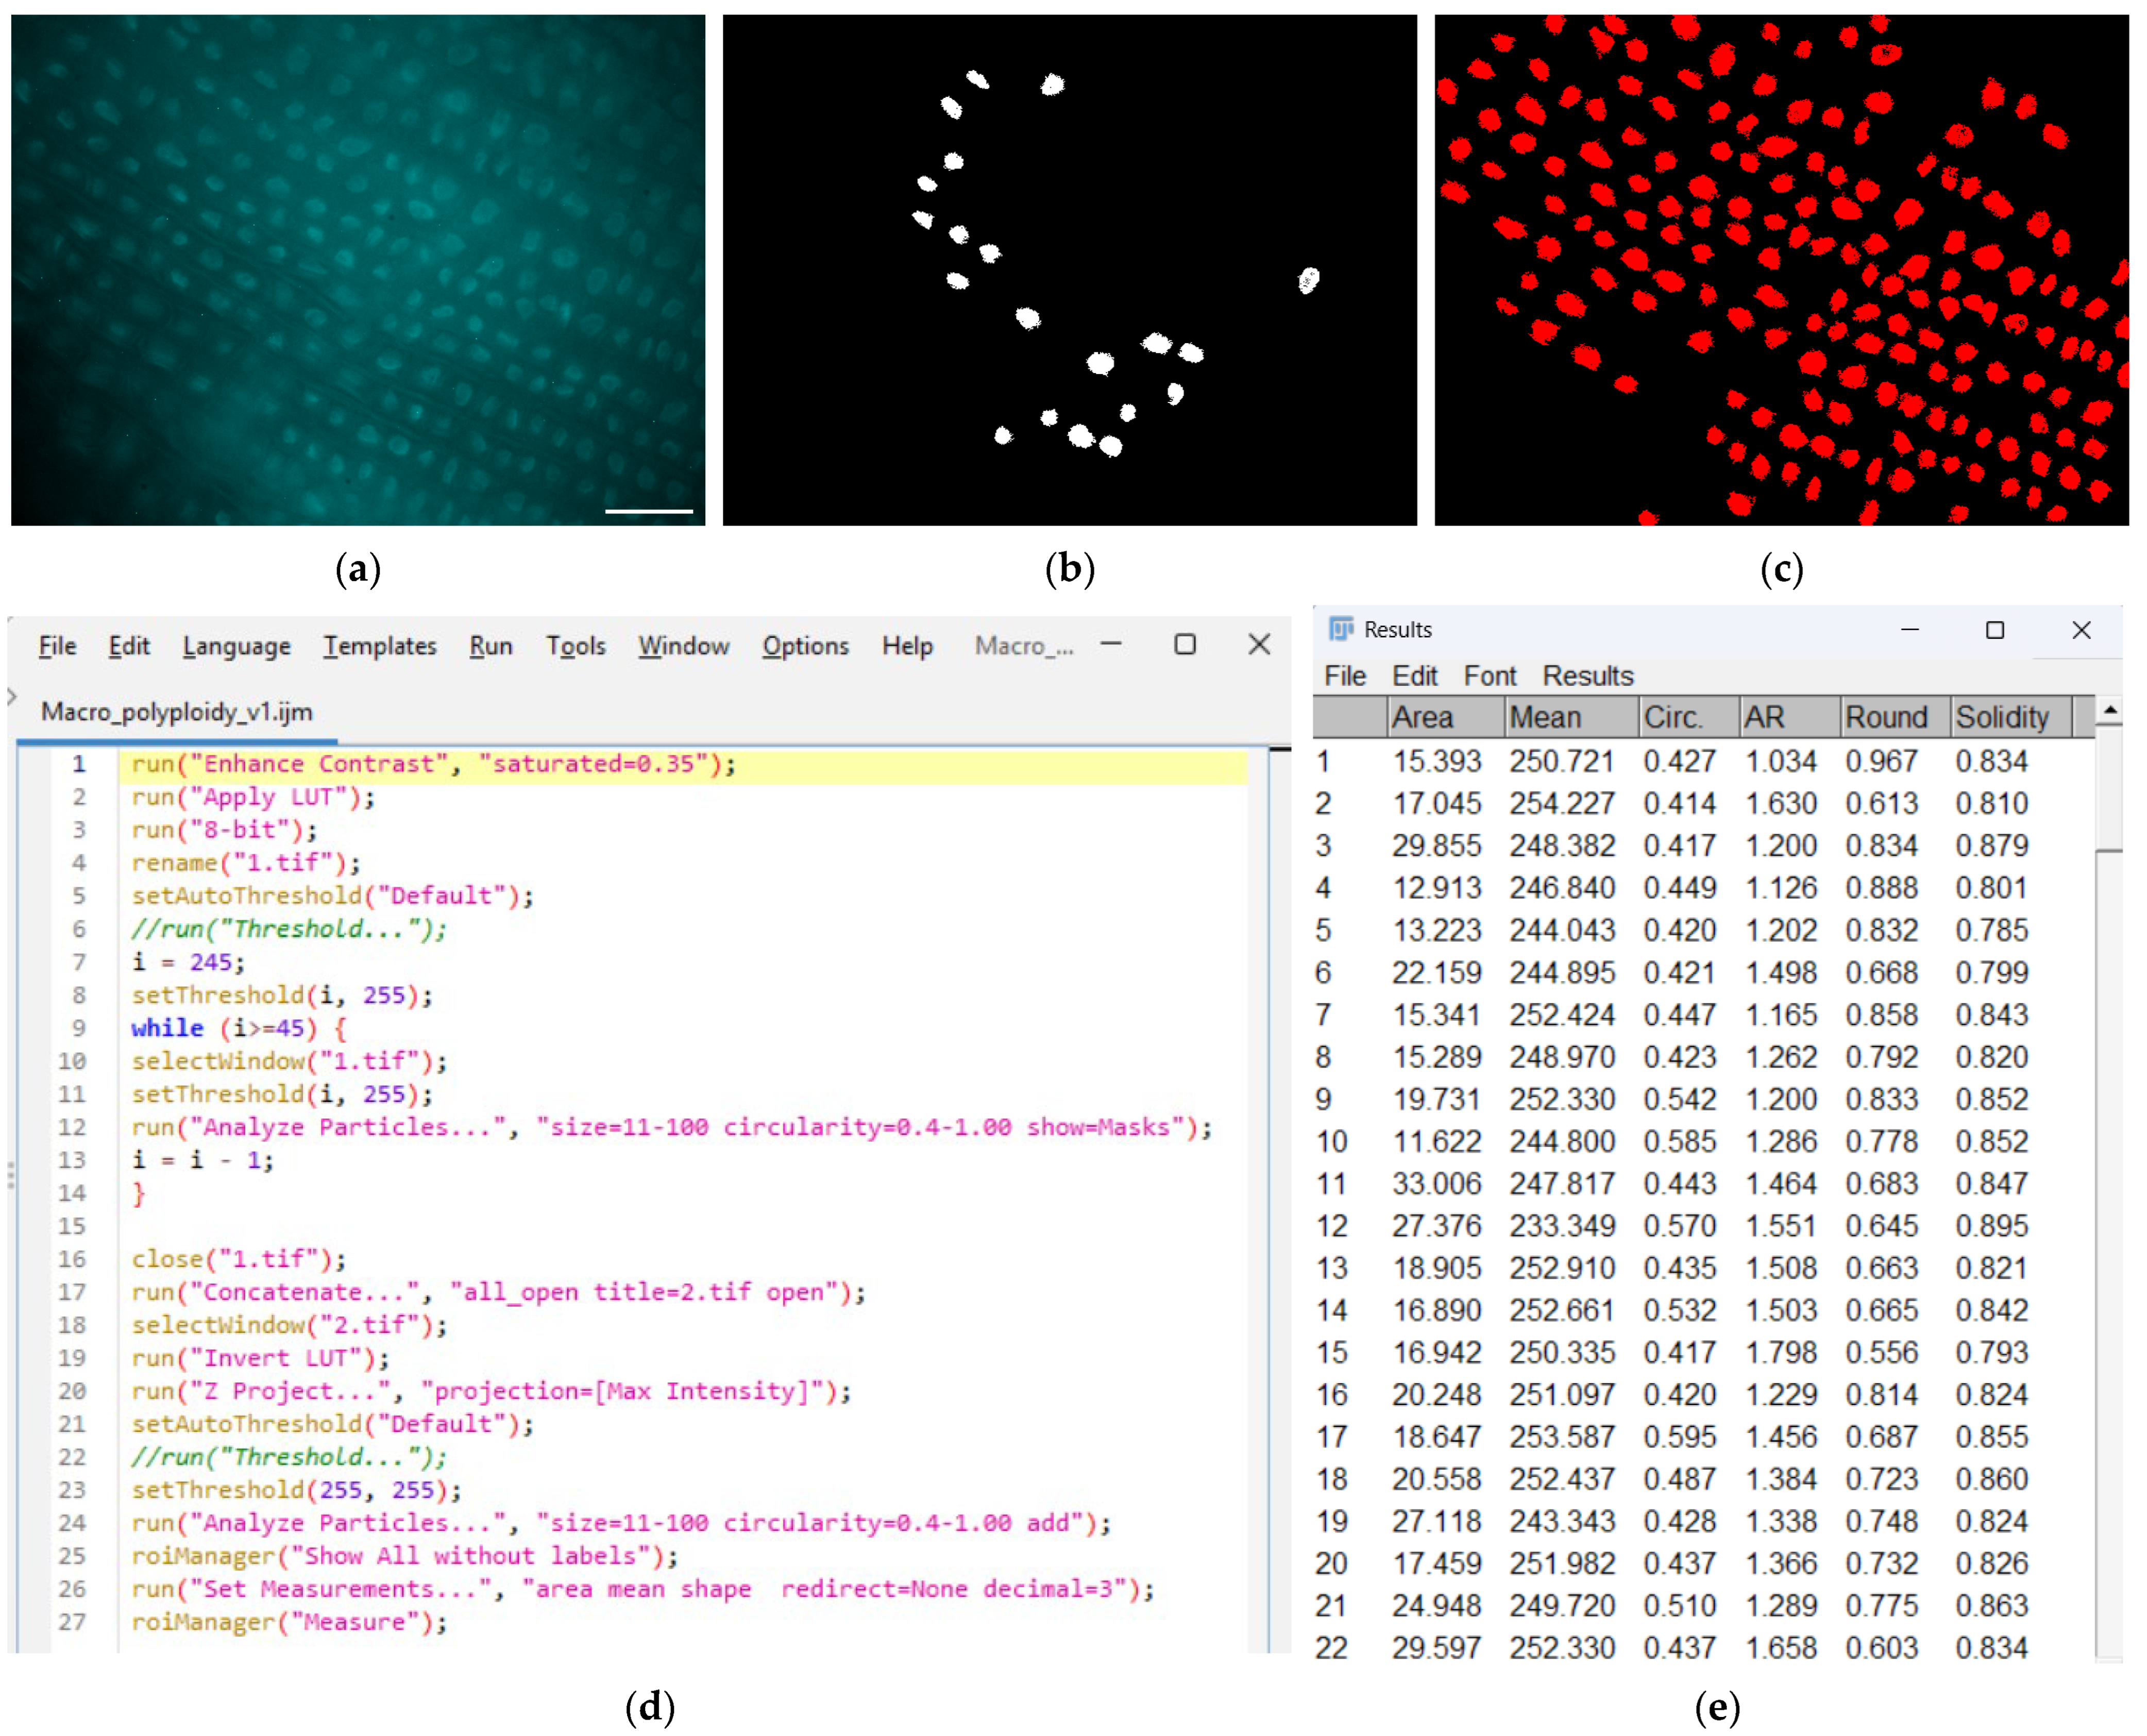
Examples of an open macro window, the original micrograph, the intermediate result of the macro, the final version of the ROI set and the measurement result are shown below (Figure 3).
The macro file can be found in the Supplementary Files, and the ready-to-use macro file can be found in the file Supplementary S1. Detailed instructions for the macro can be found in the file Supplementary S2. All macro parameters (maximum and minimum values of the brightness range, threshold shift step, particle size and shape) are configured in the open “Macro_polyploidy_v1.ijm” window in ImageJ before running the macro. When running, the macro loads the last saved settings. When analyzing the next image, the last saved settings are used. Any settings can be changed before or after running the macro. Saving the settings is done using the commands: “File” ⟶ “Save/Save as”.
Macro execution stages:
  • Load into ImageJ a source image in TIFF, PNG, or JPEG format with a brightness depth of 8, 12 or 16 bits.
  • Automated adjustment of the dynamic range of image brightness before analysis using brightness and contrast adjustment operators. Internal commands “Enhance Contrast”, “saturated = 0.35”. Apply new dynamic range limits.
  • Converting an image to 8-bit format. If the image is already 8-bit, the operator does nothing.
  • Enable the threshold discriminator operator: the internal command “Threshold”. Preset brightness threshold values: maximum 225 brightness units (can be changed by the operator), minimum 245 brightness units (can be changed by the operator). The step for changing the lower threshold value is i = 2 brightness units (can be changed by the operator). The terminal minimum value is the lower brightness threshold value, upon reaching which the search cycles for regions of interest will terminate (in our case = 15).
  • Execute the first cycle of creating binary nucleus masks with the entered area and circularity range settings: the internal operator “Analyze particles”. The area can be entered in pxl2, µm2, or any other units of measurement. The available range for area input is from 0.1 to infinity. Circularity is the ratio of the area of a figure to the area of a circle inscribed in this figure, formed by the ROI. For a perfect circle, circularity is equal to 1; for a thread or a figure of complex shape, it tends to 0. The “Threshold” and “Analyze particles” operators will be applied in the first cycle. The first operator selects a dynamic range of brightnesses from 245 to 255 units. All pixels brighter or paler than this range will be excluded from the analysis. Next, the second operator selects pixel areas with a brightness of 245–255 units. The selected area must have an area of ≥4 (e.g., 2 × 2) pxl2 and ≤400 (e.g., 20 × 20) pxl2, and also be a perfect circle. If the circularity value is changed to 0–1, a shape with an area of 4–400 pxl2 of any shape will be selected. The selected area becomes a region of interest (ROI). The number of ROIs selected in a single cycle is unlimited, depending on the macro settings. Next, binary masks are created. These are a 2-bit image of the entire analyzed field of view, in which brightness 1 corresponds to the selected ROI, and brightness 0 corresponds to all other areas that are not of interest to us in this cycle.
  • Automatically change the dynamic range and repeat the ROI selection cycle. Change the analyzed dynamic range of brightness by the specified value i = 2. The new dynamic range settings for intensity will look like 243–255 intensity units. Next, the “Analyze particles” operator is applied (area and circularity range settings are preserved across all cycles), and a new set of binary masks is created. The cycle from step 6 is repeated until the lower boundary of the intensity range no longer satisfies the condition ≥15 (see step 4). Each new cycle creates one image with a set of binary masks. Once the condition is reached, where the lower boundary of the analyzed intensity range is <15 (total range 14–256), stop the cycle and proceed to step 7.
  • Stop the “Threshold” and “Analyze particles” operators. Close the original image for analysis. Combine all generated sets of binary masks into a single stack of images (in our example, 120 images will be combined). Next, the operator for finding the maximum values over the entire stack will be applied to the stack (the “Z Project” operator, the “projection = [Max] function Intensity”). Thus, in each individual image, only ROIs (intensity = 1, which is the maximum brightness value for a 2-bit image) will be selected and transferred to the resulting image. The final image will also have only 2 gradations of intensity, and when “selected” again, each specific pixel cannot have a brightness higher than 1. Thus, if several ROIs (any number, in our example, from 2 to 120) coincide in the resulting image, they are combined into a single ROI with the largest area. The creation of a final image containing a set of all ROIs detected during all cycles of applying the macro.
  • The “Threshold” (1–1 brightness range, selects only ROI) and “Analyze operators” are used on the final image. Area range and circularity settings ROI for operator “Analyze particles” at this stage are indicated separately. The particles are by default identical to those used in steps 6–7, but the operator can change them if necessary. After applying the final “Analyze particles” operator, an ROI control operator (“ROI Manager”) opens, a list of ROIs is created, and is entered into ROI Manager and saved temporarily. Next, the ROI characteristic measurement operator “Measure” is launched. The list of characteristics to be evaluated can be changed or supplemented at the operator’s discretion. The list of characteristics evaluated at this stage of the work is listed below.
The following parameters were selected as the parameters to be evaluated:
  • The area of the nucleus in µm2. This characteristic is calculated as the product of the sum of pixels occupied by the image of the nucleus (ROI) and the magnification factor of the microscope and camera.
  • Hoechst average fluorescence intensity. This characteristic is estimated as the arithmetic mean of the brightness of all pixels within the ROI with preliminary subtraction of background values.
  • Circularity is a dimensionless coefficient that indicates how close an object’s shape is to a perfect circle. Circularity was calculated using Formula (1)
    C i r c u l a r i t y = 4 π S / P 2 ,
    where P is the perimeter of the ROI, and S is the area of the ROI. The formula relates the area and perimeter of an object: the larger the perimeter for the same area, the smaller the Circularity. For a circle with a given area, the circumference has the smallest perimeter. Therefore, for a perfect circle, Circularity = 1. The object with Circularity closer to 1 is the more “round”. Circularity → 0 in the case of elongated, irregular, or polygonal shapes.
  • Roundness is circularity corrected by aspect ratio. Roundness calculated by Formula (2)
    R o u n d n e s s = 4 S π   M a j o r A x i s 2 ,
    where S is the area of the ROI, MajorAxis is the greatest distance between the extreme points of the projection of the ROI shape [17,34]. This characteristic is also dimensionless and is fundamentally similar to Circularity, characterizing the similarity/difference in the shape of the nucleus from a circle. For an ideal circle, Roundness = 1. For elongated, irregular or polygonal shapes, Roundness → 0. However, Roundness, unlike Circularity, is less sensitive to small-sized irregularities around the perimeter of the figure.
  • Solidity was calculated using Formula (3)
    S o l i d i t y = S / S c o n v ,
    where S is the real area of ROI, Sconv—area of the smallest convex hull that completely encloses the object [35,36]. This characteristic describes the internal heterogeneities of the core. For a perfect circle or any other convex polygon, Solidity = 1. If the object has concavities, protrusions, “holes”, or a complex shape with acute and obtuse angles, then Solidity < 1. Circularity and Roundness do not react to “holes” inside the object, but Solidity does.
Summary information on the analyzed characteristics is presented in Table 1. Examples of figures and the shape characteristic values calculated for them are presented in Table 2.
In each preparation, 50–100 nuclei were analyzed. For each ploidy variant, the roots of six individual randomly chosen plants were prepared and analyzed.

2.6. Flow Cytofluorometry

Plants’ ploidies were validated using classical flow cytofluorometry to validate the method. A standard protocol with preliminary two-stage dissociation of plant tissues using Otto methods and subsequent staining with Hoechst 33258 (Lumiprobe RUS, Moscow, Russia) was chosen. The roots of randomly selected plants were washed in deionized water, and terminal fragments of 2–4 mm in length (including the root cap) were cut off using sterile scissors. The root fragments were placed in 50 mm Petri dishes with 1 mL of pre-prepared Otto chopping buffer I containing 100 mM citric acid and 0.5% Tween 20 (all Sigma-Aldrich, Burlington, MA, USA) with pH 2–3 [37]. Root fragments were minced for ~2 min using a sterile scalpel (DiaEm, Moscow, Russia) until a homogeneous mass was formed. The resulting mass was pipetted and passed through a nylon cell strainer (SPL Lifesciences, Pocheon-si, Republic of Korea) to remove unminced fragments. The suspension was centrifuged for 10 min at 600 g and room temperature. The supernatant was discarded, and the pellet was resuspended in 500 μL of Otto chopping buffer II (400 mM Na2HPO4·12H2O, pH 8–9) (all Sigma-Aldrich, Burlington, MA, USA). Nuclei were stained with 20 μg/mL Hoechst for 60 min at room temperature in the dark. Further nucleus fluorescence intensities were measured with a Longcyte CLQC-281 flow cytometer (ChBio, Nantou, Taiwan) at 405/450 (Ex/Em) wavelengths. A total of 20–50 thousand of plants nucleus were analyzed in each measurement. Roots of six individual randomly chosen plants were prepared and analyzed in each ploidy variant.

2.7. Statistical Processing

Further statistical processing was carried out with MS Office Excel v 14.0.6023.1000 and Origin v. 9.8.0.200 (OriginLab Corporation, Northampton, MA, USA). The obtained data were processed using nonparametric statistical methods. The results were presented as median values, interquartile ranges (25th and 75th percentiles), and additional percentiles (10th and 90th percentiles). Statistical hypotheses were tested using the Kruskal–Wallis one-way rank analysis of variance (Kruskal–Wallis One-Way Analysis of Variance on Ranks) followed by Dunn’s test method) or the Mann–Whitney U test. Differences were considered statistically significant when reaching a significance level of p < 0.05. In each experiment, at least five independent measurements were performed, each on an individual plant. Sample sizes are indicated in the figure legends. Cohen’s d for each pair of characteristics was calculated to further quantify the magnitude of changes.

3. Results

3.1. Monocotyledonous Plant Ploidy Assay by Microstructural Fluorescence Image Analysis

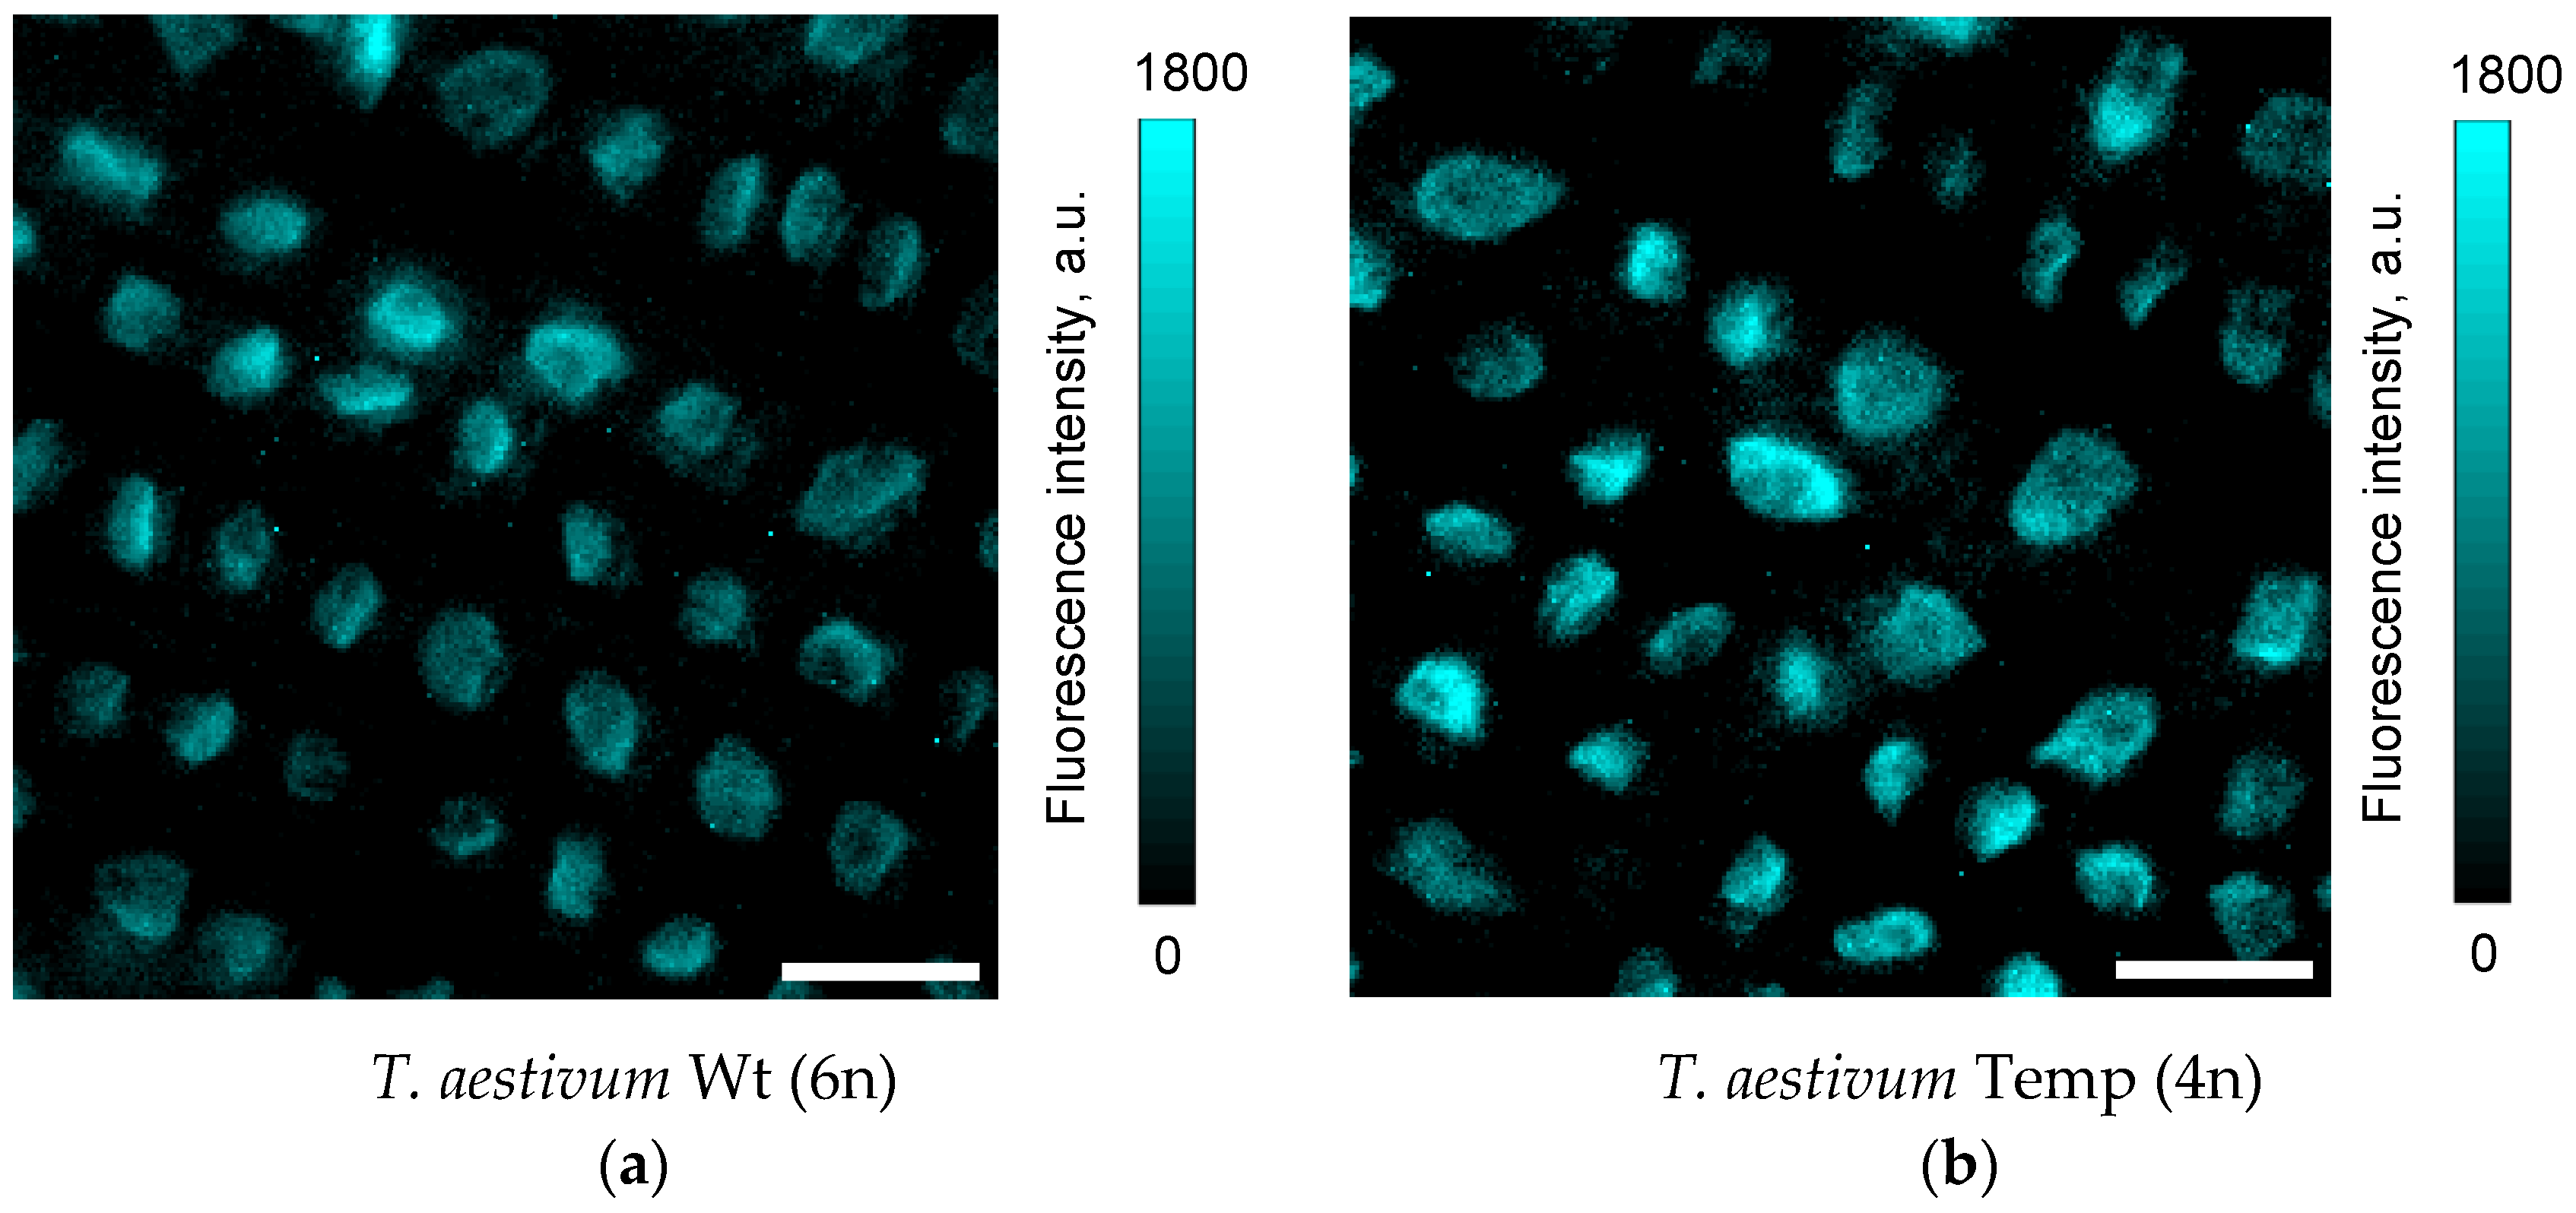
Examples of fluorescence micrographs of root meristem cell nuclei from wheat varieties of varying ploidy are shown in Figure 4. The boundaries of the nuclei are clearly visible in the image. A trend toward increasing nuclear size and fluorescence brightness with increasing ploidy is evident. Further quantitative analysis was performed using Fiji software and the developed macro. The results are presented in Figure 4, Figure 5, Figure 6, Figure 7 and Figure 8. Two types of analysis were performed. First, the distribution of selected parameters (size, fluorescence intensity, and nuclear shape characteristics) within a single preparation was assessed. Next, median values were calculated for individual wheat plants, and groups of plants of varying ploidy were compared.
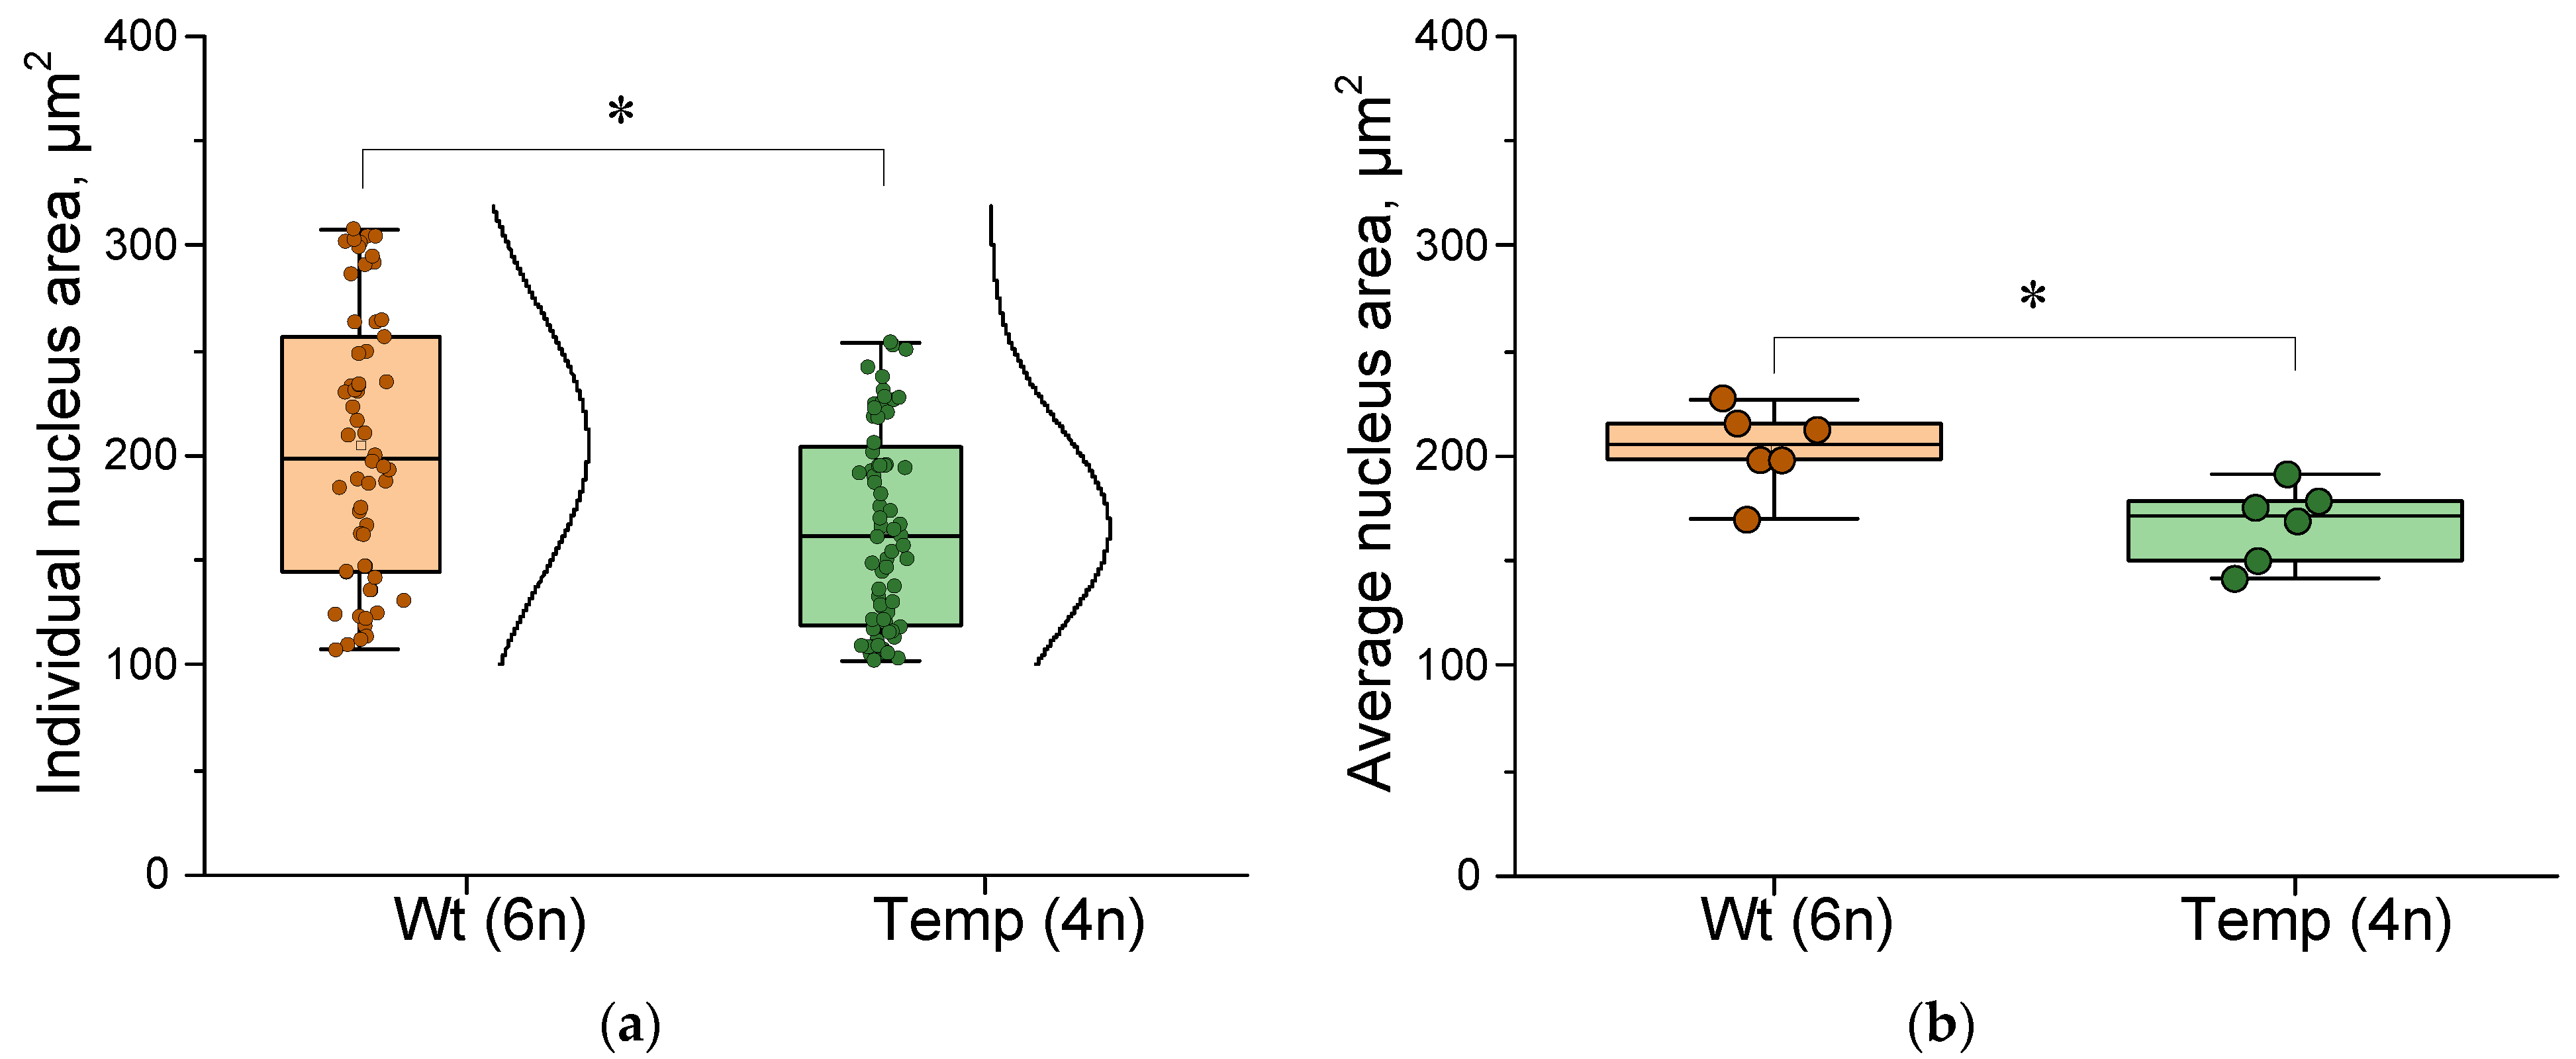
The effect of wheat ploidy on the nucleus areas was studied (Figure 5). The size of nuclei in cells was studied in two randomly taken rootlets of wheat variety Wt with ploidy 6n and variety Temp with ploidy 4n (Figure 5a). It was shown that in hexaploid, the size of nuclei in one rootlet can vary from 105 to 315 μm2, in tetraploid from 95 to 305 μm2. The median size of hexaploid nuclei is approximately 200 μm2, and in tetraploid nuclei, 175 μm2. The difference in the nuclear area between tetra- and hexaploids is more than 10%.
Thus, it was found that the size of the wheat nucleus depends on ploidy and is increased in the hexaploid variety compared to the tetraploid variety.
Figure 5b shows the average data for six individual root preparations. It is shown that the average nuclear size in different plants of a hexaploid can vary from 200 to 230 µm2, while in a tetraploid it ranges from 145 to 190 µm2. The median nuclear size of a hexaploid is approximately 205 µm2, while in a tetraploid it is 175 µm2. The difference in nuclear area between tetra- and hexaploids is more than 10%. Overall, in group analysis, the difference in size between tetra- and hexaploid plants is obvious without the use of statistical methods.
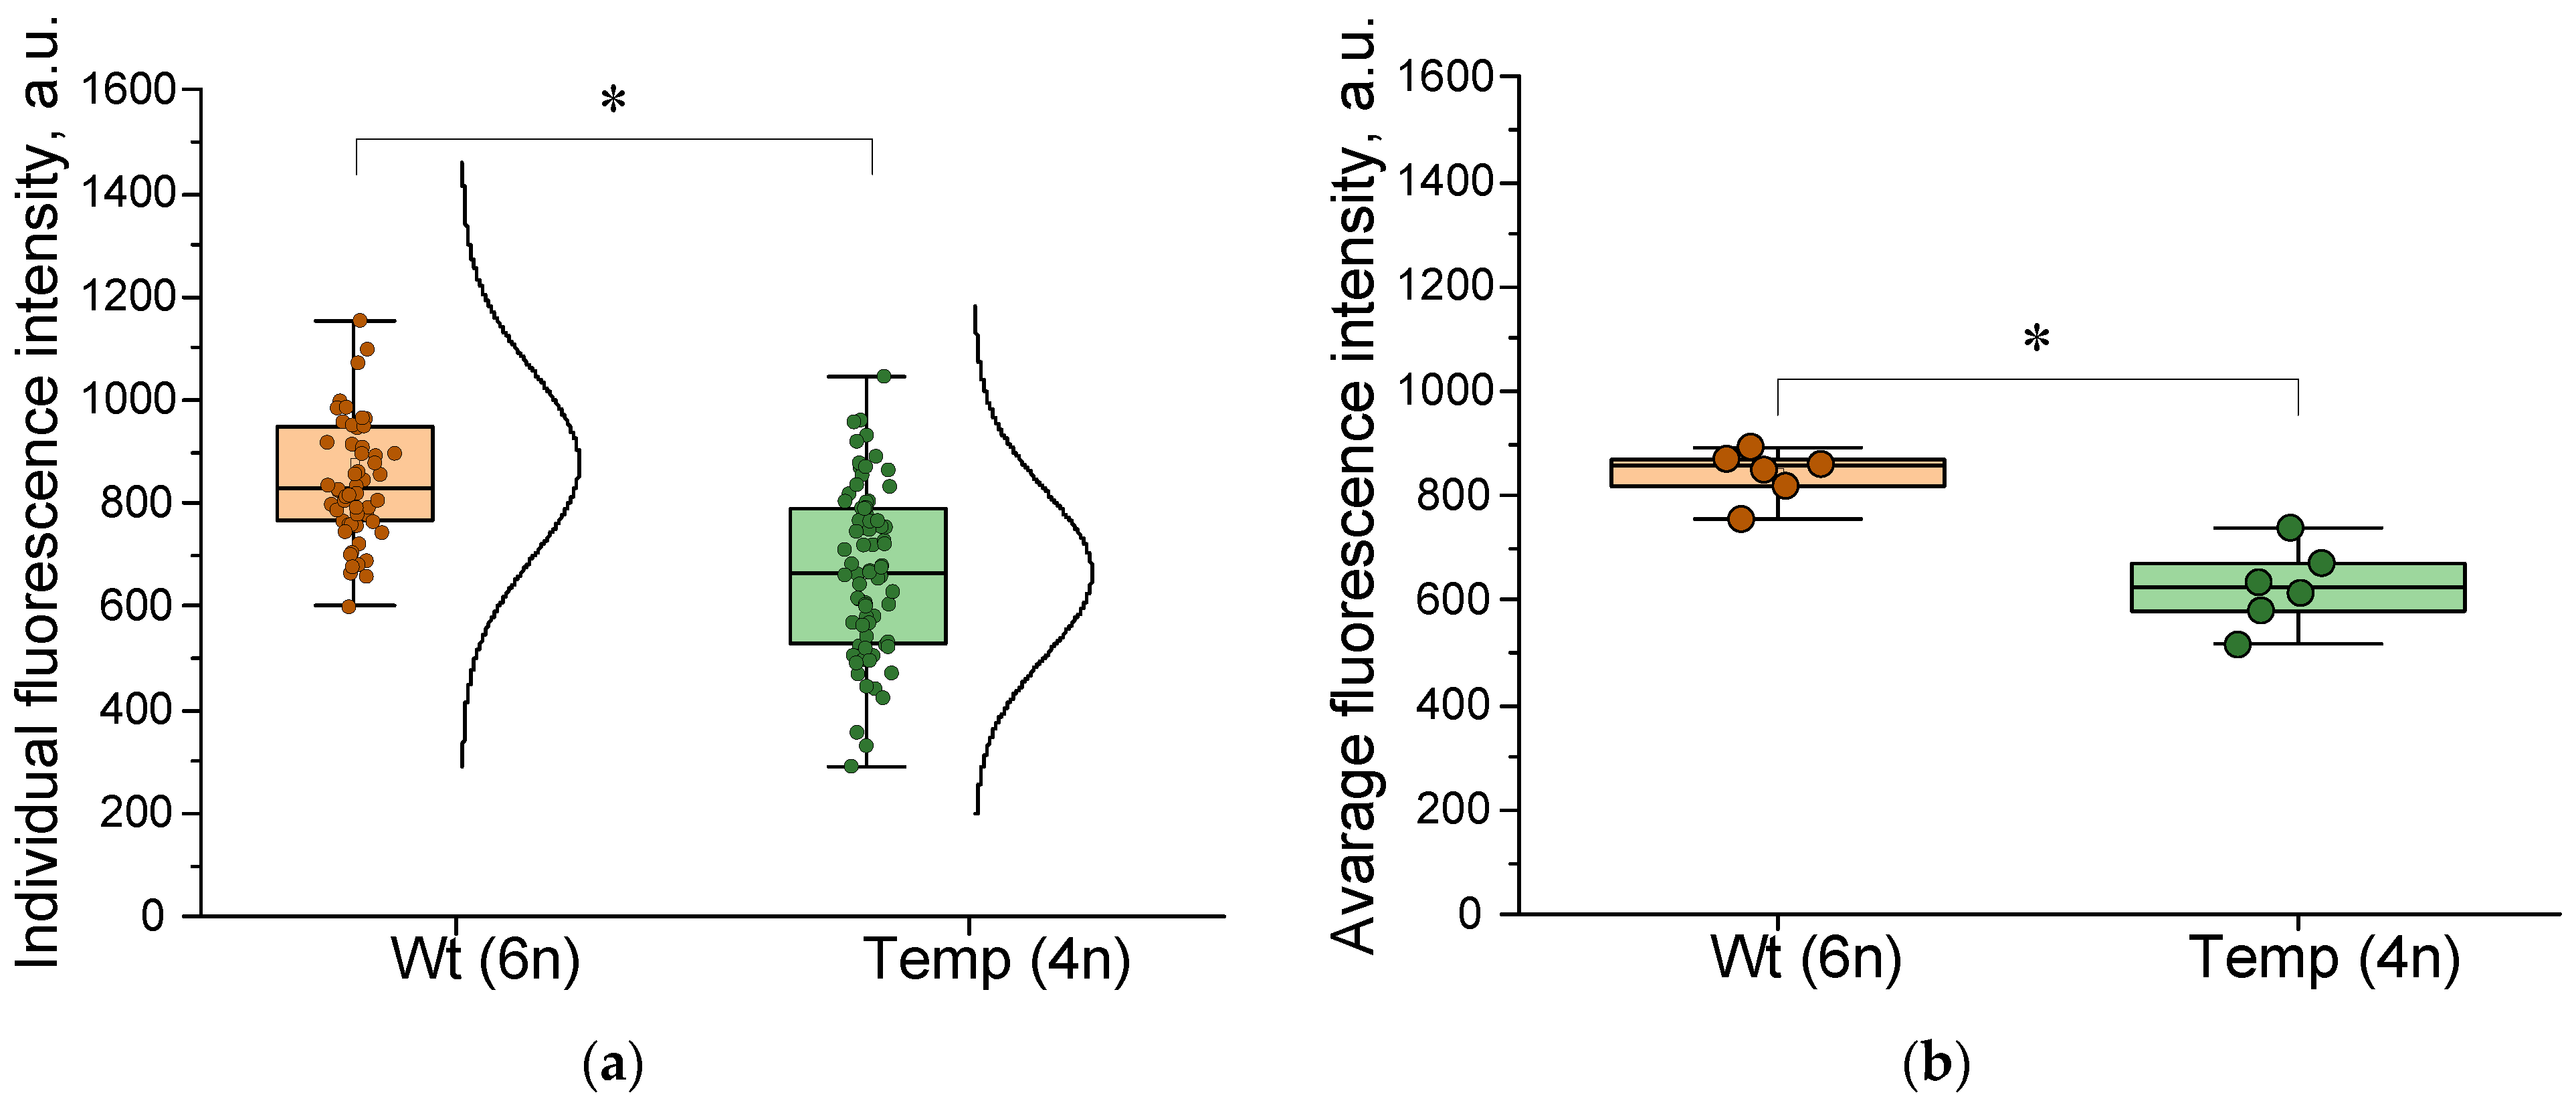
The effect of wheat ploidy on the nuclear fluorescence intensity was studied (Figure 6). The fluorescence intensity of the cell nucleus was studied in two randomly taken rootlets of wheat cultivar Wt with ploidy 6n and cultivar Temp with ploidy 4n (Figure 6a). It was shown that in hexaploid, the fluorescence intensity of nuclei in one rootlet can vary almost 2-fold, from 600 to 1100 a.u., while in tetraploid it can vary 4-fold, from 250 to 1000 a.u. The median fluorescence intensity of hexaploid and tetraploid nuclei is approximately 850 or 620 a.u., respectively. The difference in fluorescence intensity of nuclei in tetraploids and hexaploids is approximately 1.4-fold. Thus, it was found that the fluorescence intensity of wheat nuclei depends on the ploidy of the nucleus.
Figure 6b shows the average data for six individual root preparations. It is shown that in hexaploid plants, the median nuclear fluorescence intensity in different plants can vary from 820 to 880 a.u., while in tetraploid plants, it varies from 580 to 680 a.u. The median nuclear fluorescence intensities of hexaploids and tetraploids are approximately 860 a.u. and 520 a.u., respectively. The difference in nuclear fluorescence intensities between tetra- and hexaploids is approximately 1.7 times. In general, in group analysis, the difference in nuclear fluorescence intensity between tetra- and hexaploid plants is obvious without the use of statistical methods.
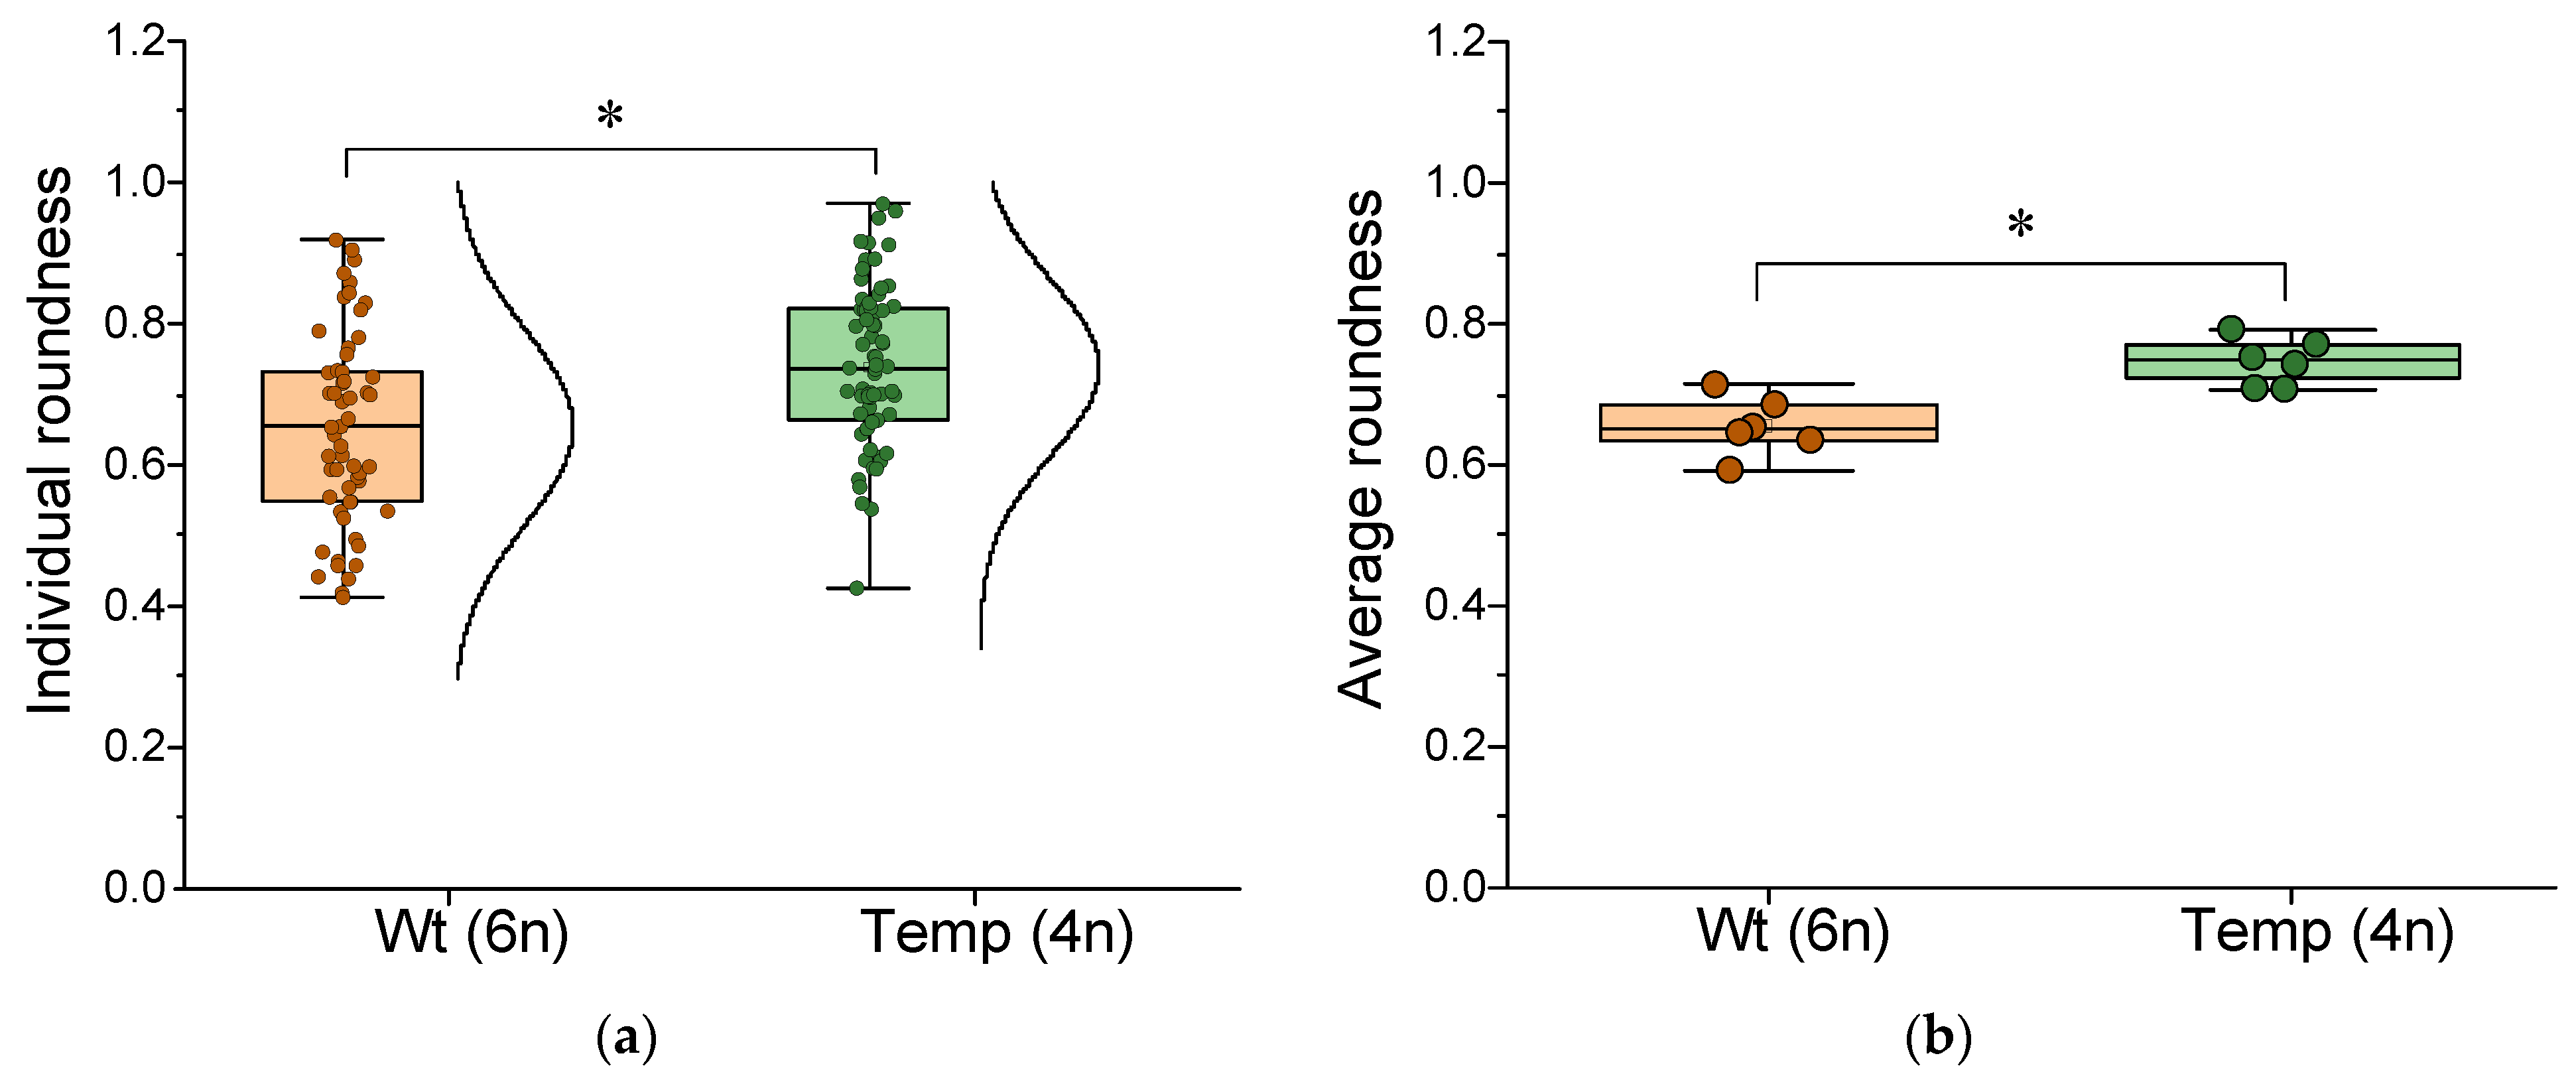
The evaluation of the nucleus shape is an adequate area of application, since it does not require additional modifications of the system. The following characteristics of the nucleus shape were selected: roundness, circularity and solidity. The effect of wheat ploidy on the nucleus roundness was studied (Figure 7). The nucleus roundness index was studied in two randomly taken roots of wild-type wheat Wt with ploidy 6n and the Temp variety with ploidy 4n (Figure 7a). It was shown that in hexaploid wheat, the roundness index values are distributed in the range from 0.4 to 0.9. The median values of the roundness index are less than 0.65. In tetraploid wheat, the roundness index values are distributed in the range from 0.44 to 0.95. The median values of the roundness index are slightly above 0.73. Despite small differences in the value of the roundness indicator of wheat nucleus (no more than 10%), they achieve statistical differences when comparing two individual plants with different ploidy.
Figure 7b shows the average data for six individual rootlet preparations. It is shown that the hexaploid has roundness values distributed in the range from 0.6 to 0.75. The median roundness value is 0.64. The tetraploid has roundness values distributed in the range from 0.73 to 0.79. The median roundness value for the Temp wheat variety is just over 0.76. The differences between the groups reached minimal statistical significance despite the weak visible difference (no more than 10%).
The observed trend in roundness change reached statistical significance. Thus, it was shown that wheat nucleus roundness values depend on ploidy. Overall, group analysis also showed that wheat nucleus roundness values depend on plant ploidy.
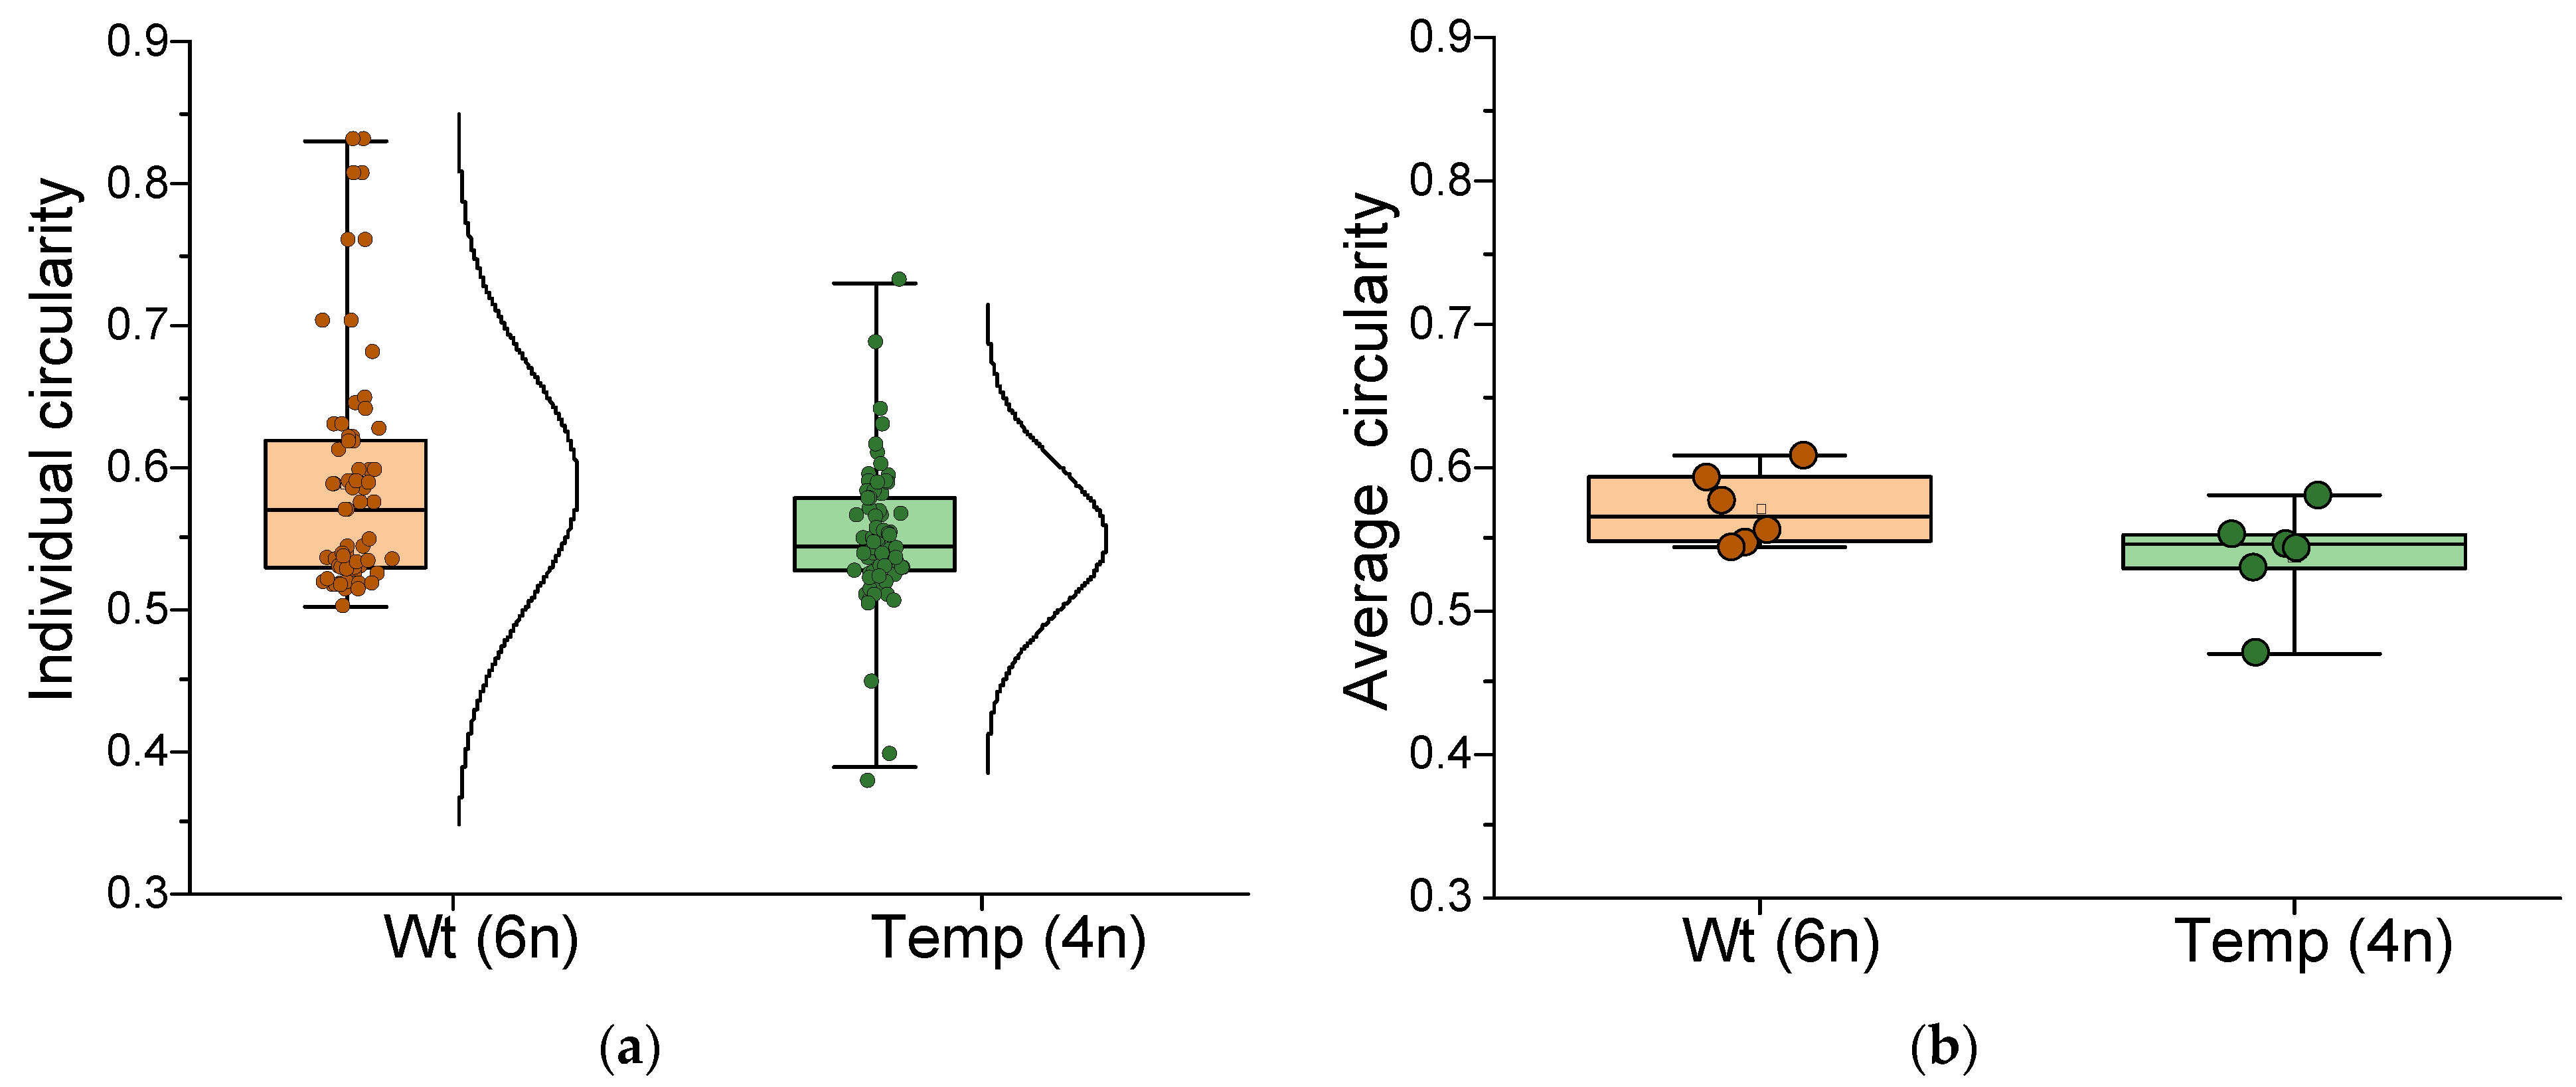
The effect of wheat ploidy on the circularity of the nucleus was studied (Figure 8). The circularity of the nucleus was studied in two randomly selected roots of the Wt wheat variety with a ploidy of 6n and the Temp variety with a ploidy of 4n (Figure 8a).
It was shown that in the hexaploid, the circularity values were distributed in the range from 0.5 to 0.85. The median values of the circularity were slightly over 0.55. In the tetraploid, the circularity values were distributed in the range from 0.40 to 0.75. The median values of the circularity were slightly less than 0.55. The differences between the groups did not reach minimal statistical significance. A more detailed quantitative assessment of change in characteristics using Cohen’s d can be found in Appendix A.
Figure 8b shows the averaged data for six individual root preparations. It is shown that for the hexaploid, the circularity values are distributed in the range from 0.6 to 0.7. The median circularity values are slightly over 0.65. For the tetraploid, the circularity values are distributed in the range from 0.35 to 0.6. The median circularity values are slightly under 0.57. In the group analysis, the differences did not reach statistical significance, as in the analysis of two randomly selected plants.
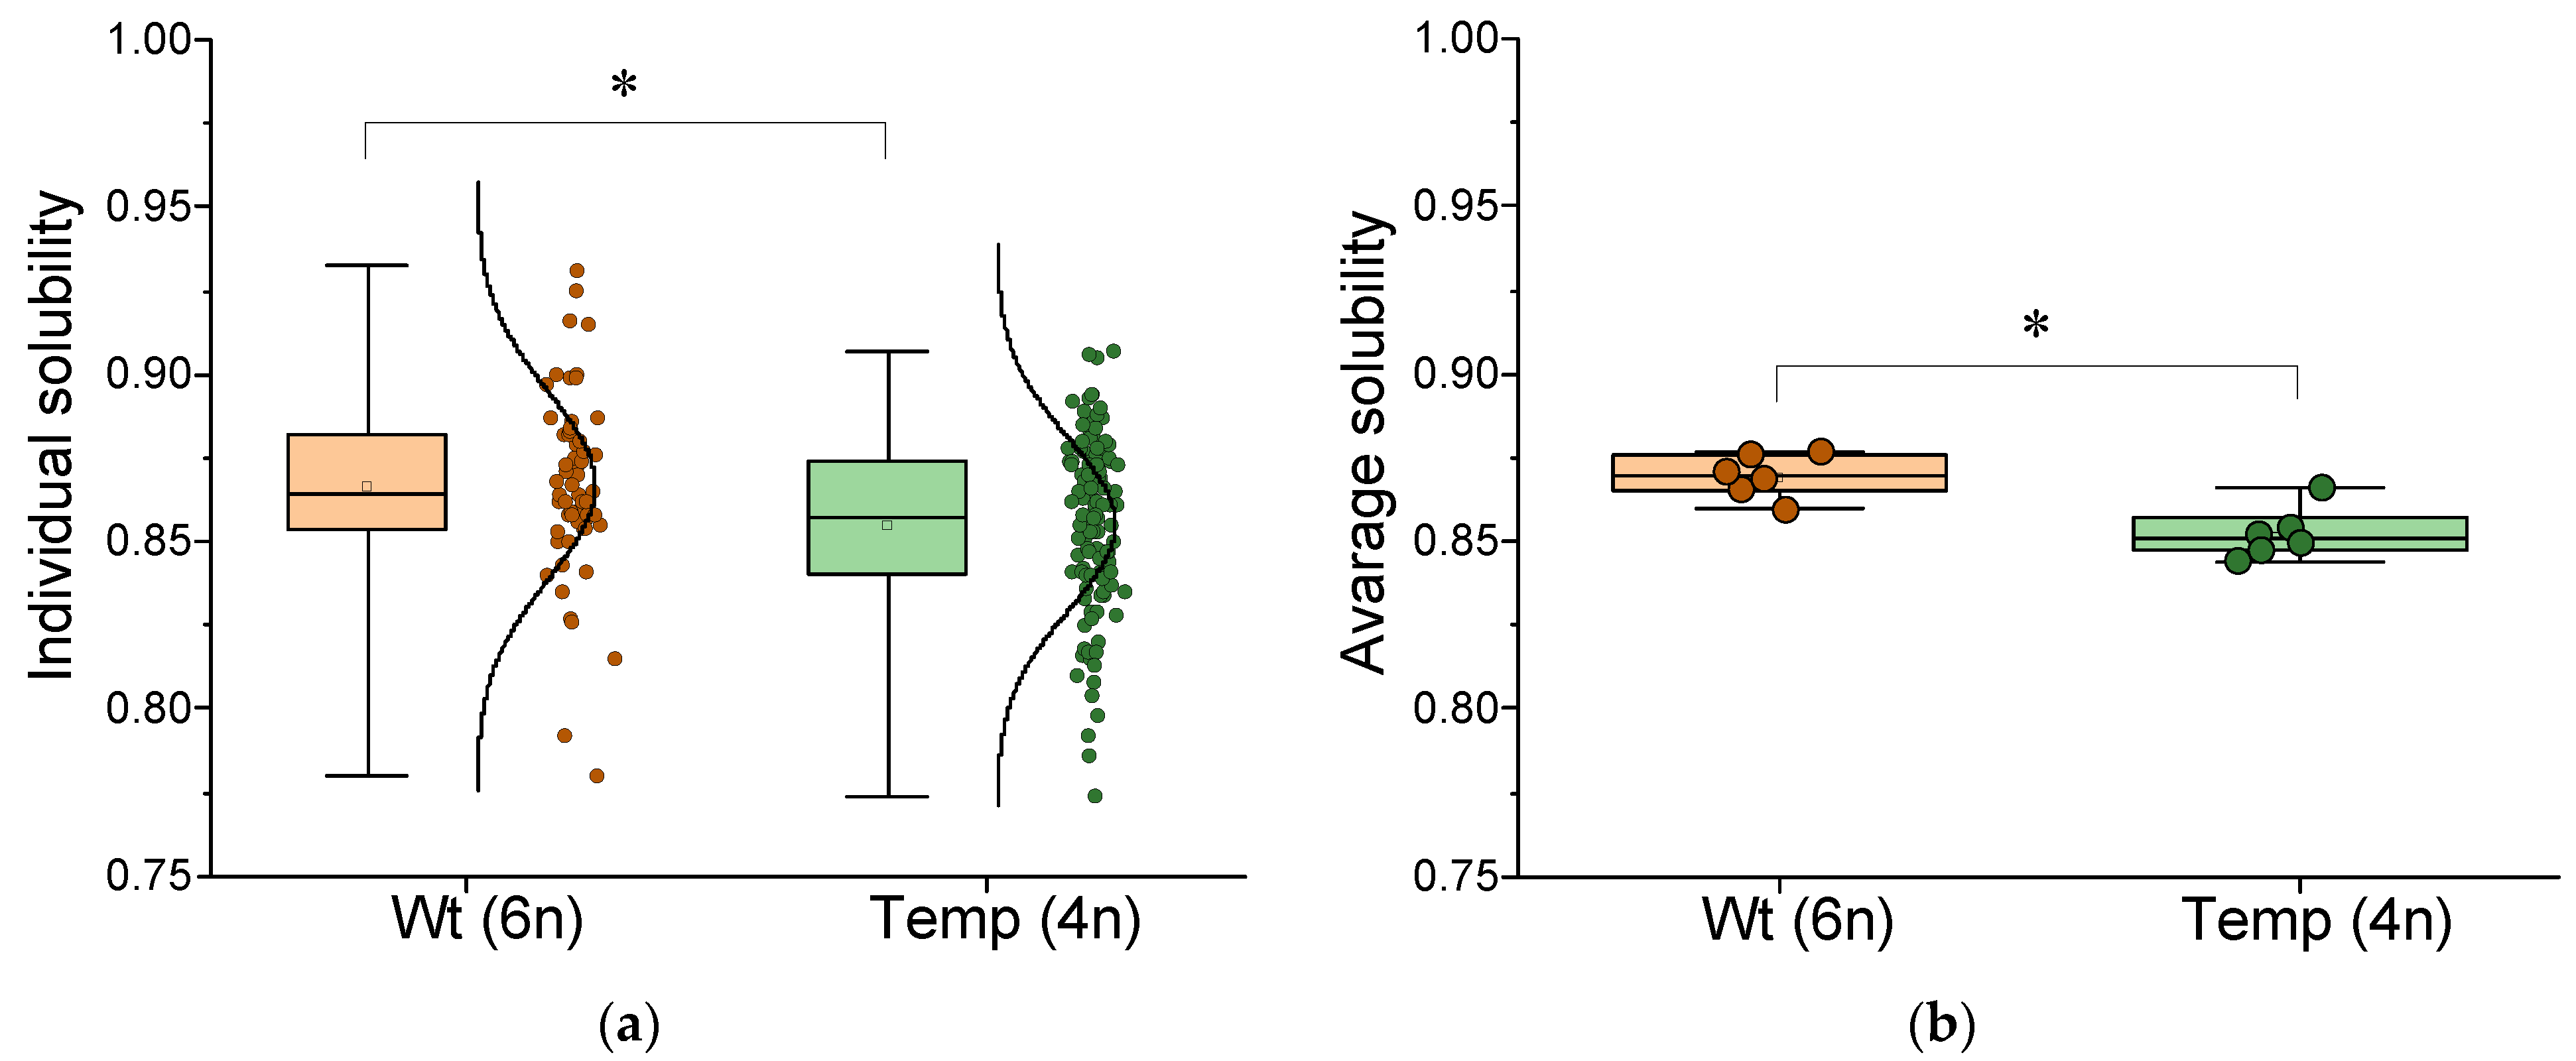
The solidity of the wheat nucleus was studied (Figure 9). The solidity of the nucleus was studied in two randomly selected roots of wheat cultivar Wt with ploidy 6n and cultivar Temp with ploidy 4n (Figure 9a). It was shown that in hexaploid, the solidity index values are distributed in the range of 0.77 to 0.95. The median solidity index values are slightly over 0.87. In tetraploid, the solidity values are distributed in the range of 0.76 to 0.93. The median solidity index values are slightly over 0.86. Despite the insignificant difference, the differences between the groups reached minimal statistical significance.
Figure 9b shows the averaged data for six individual rootlet preparations. It is shown that for the hexaploid, solidity values range from 0.86 to 0.88. The median solidity values are just over 0.87. For the tetraploid, solidity values range from 0.84 to 0.86. The median solidity values are approximately 0.85. Overall, the group analysis also showed that wheat nucleus solidity values depend on plant ploidy. The differences were more pronounced in the group analysis than in the analysis of two randomly selected plants.

3.2. Dicotyledonous Plant Ploidy Assay by Microstructural Fluorescence Image Analysis

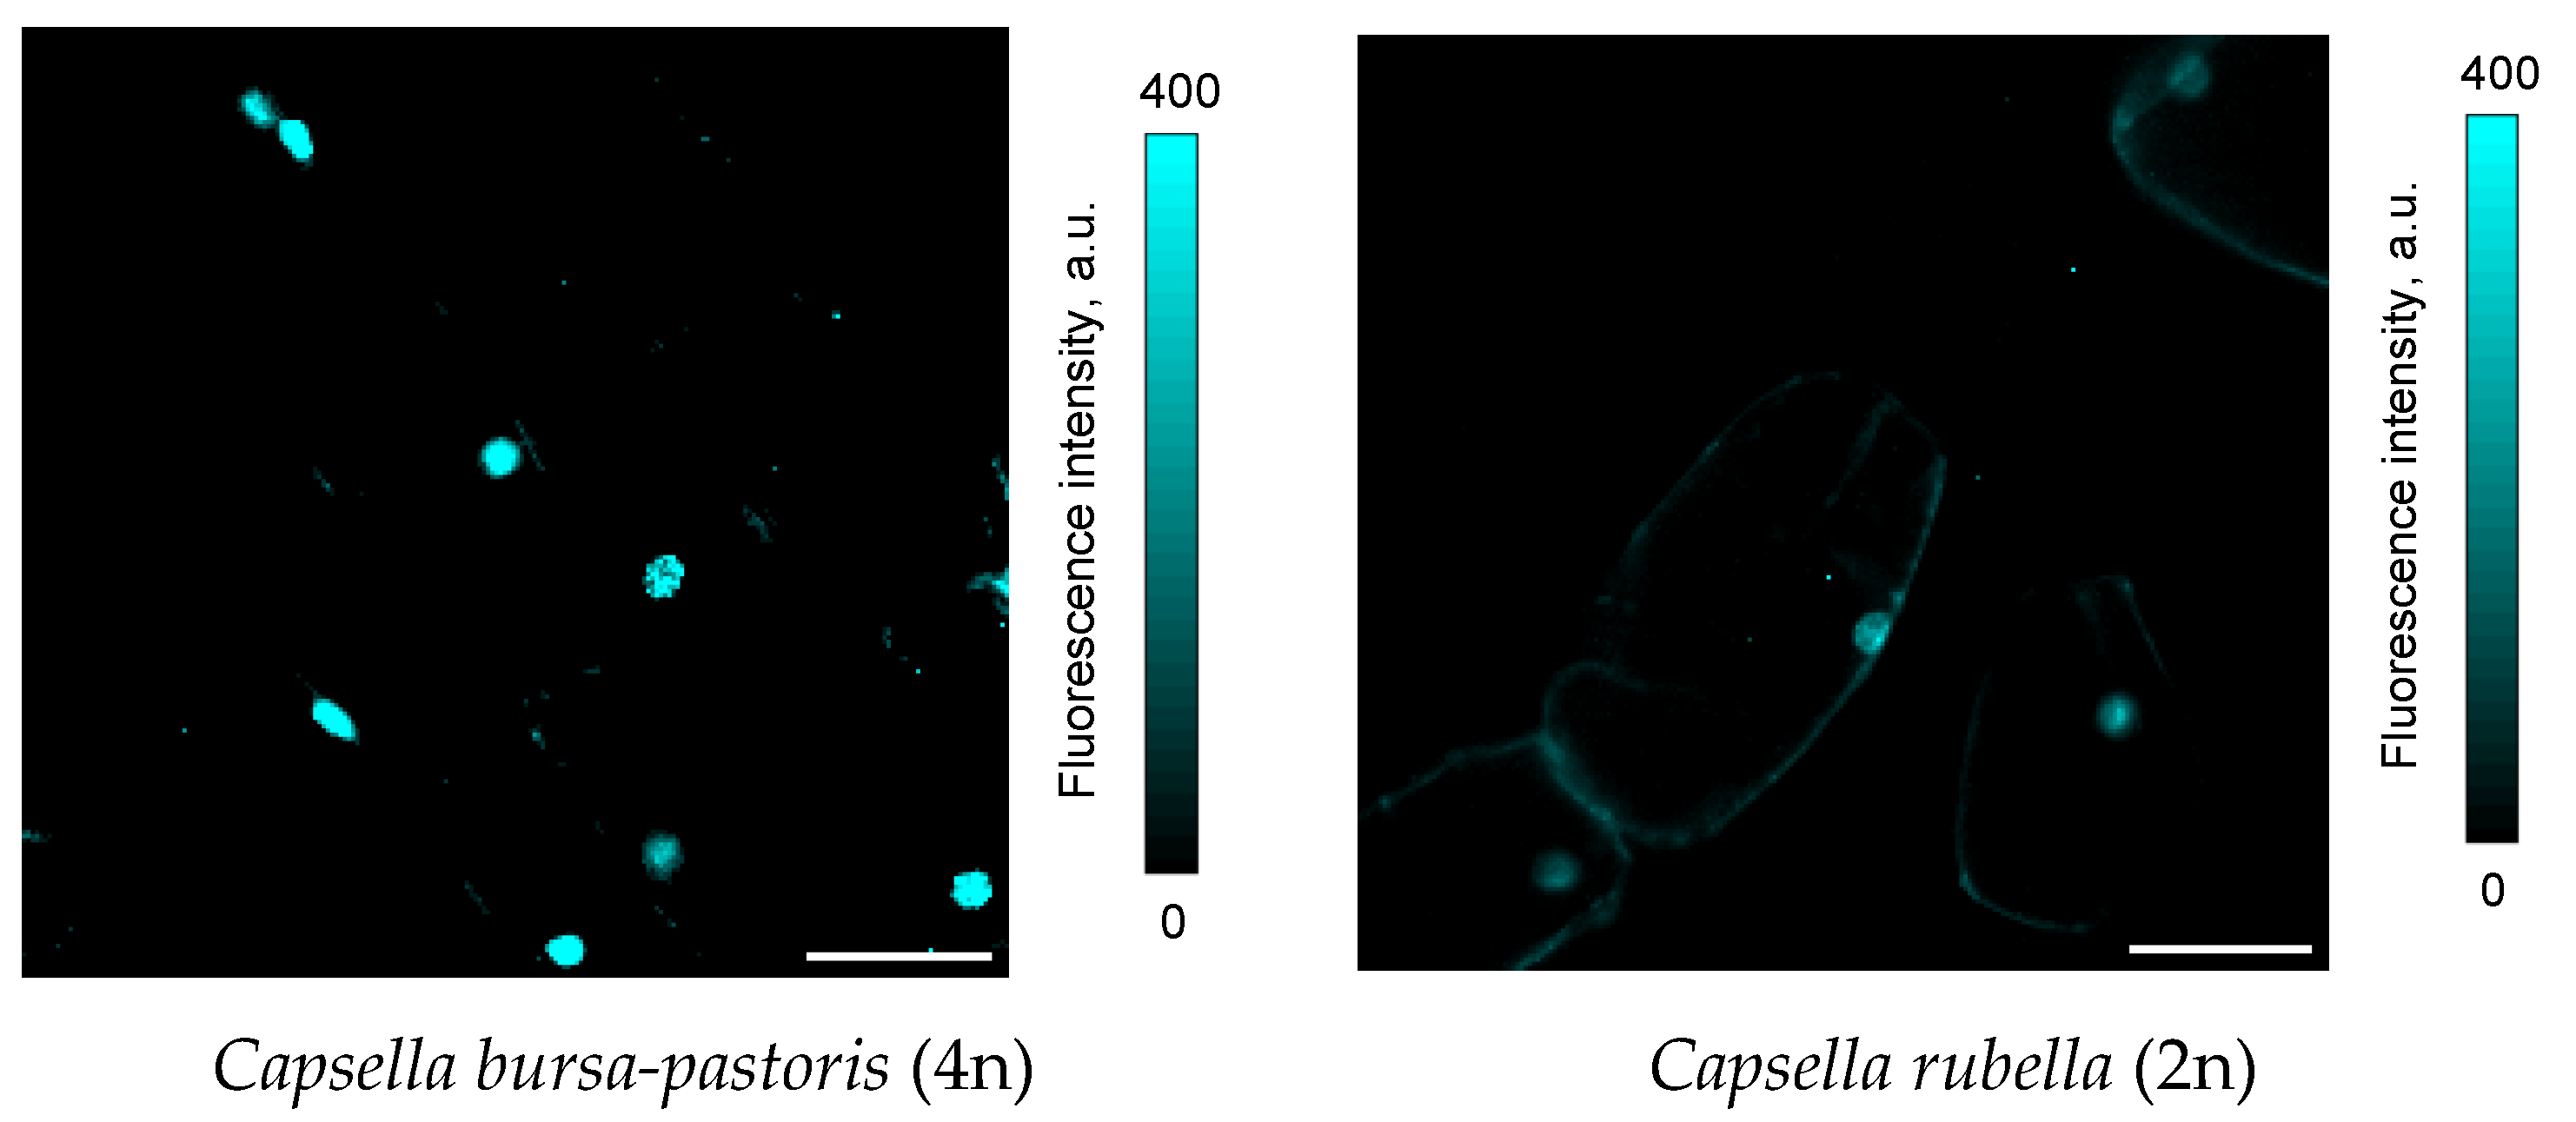
We analyzed the dependence of the above nuclear characteristics on ploidy using the example of dicotyledonous plants of the genus Capsella. Examples of fluorescence micrographs of nuclei of dicotyledonous plants of the genus Capsella are presented below (Figure 10). It is worth noting that both species, Capsella rubella and Capsella bursa-pastoris, have significantly smaller nuclear areas compared to wheat: the average area is 2–6 µm2 versus 100–200 µm2 in wheat. Despite this, we were able to perform a quantitative analysis of the nuclear characteristics of these plants (Figure 11, Figure 12, Figure 13, Figure 14 and Figure 15).
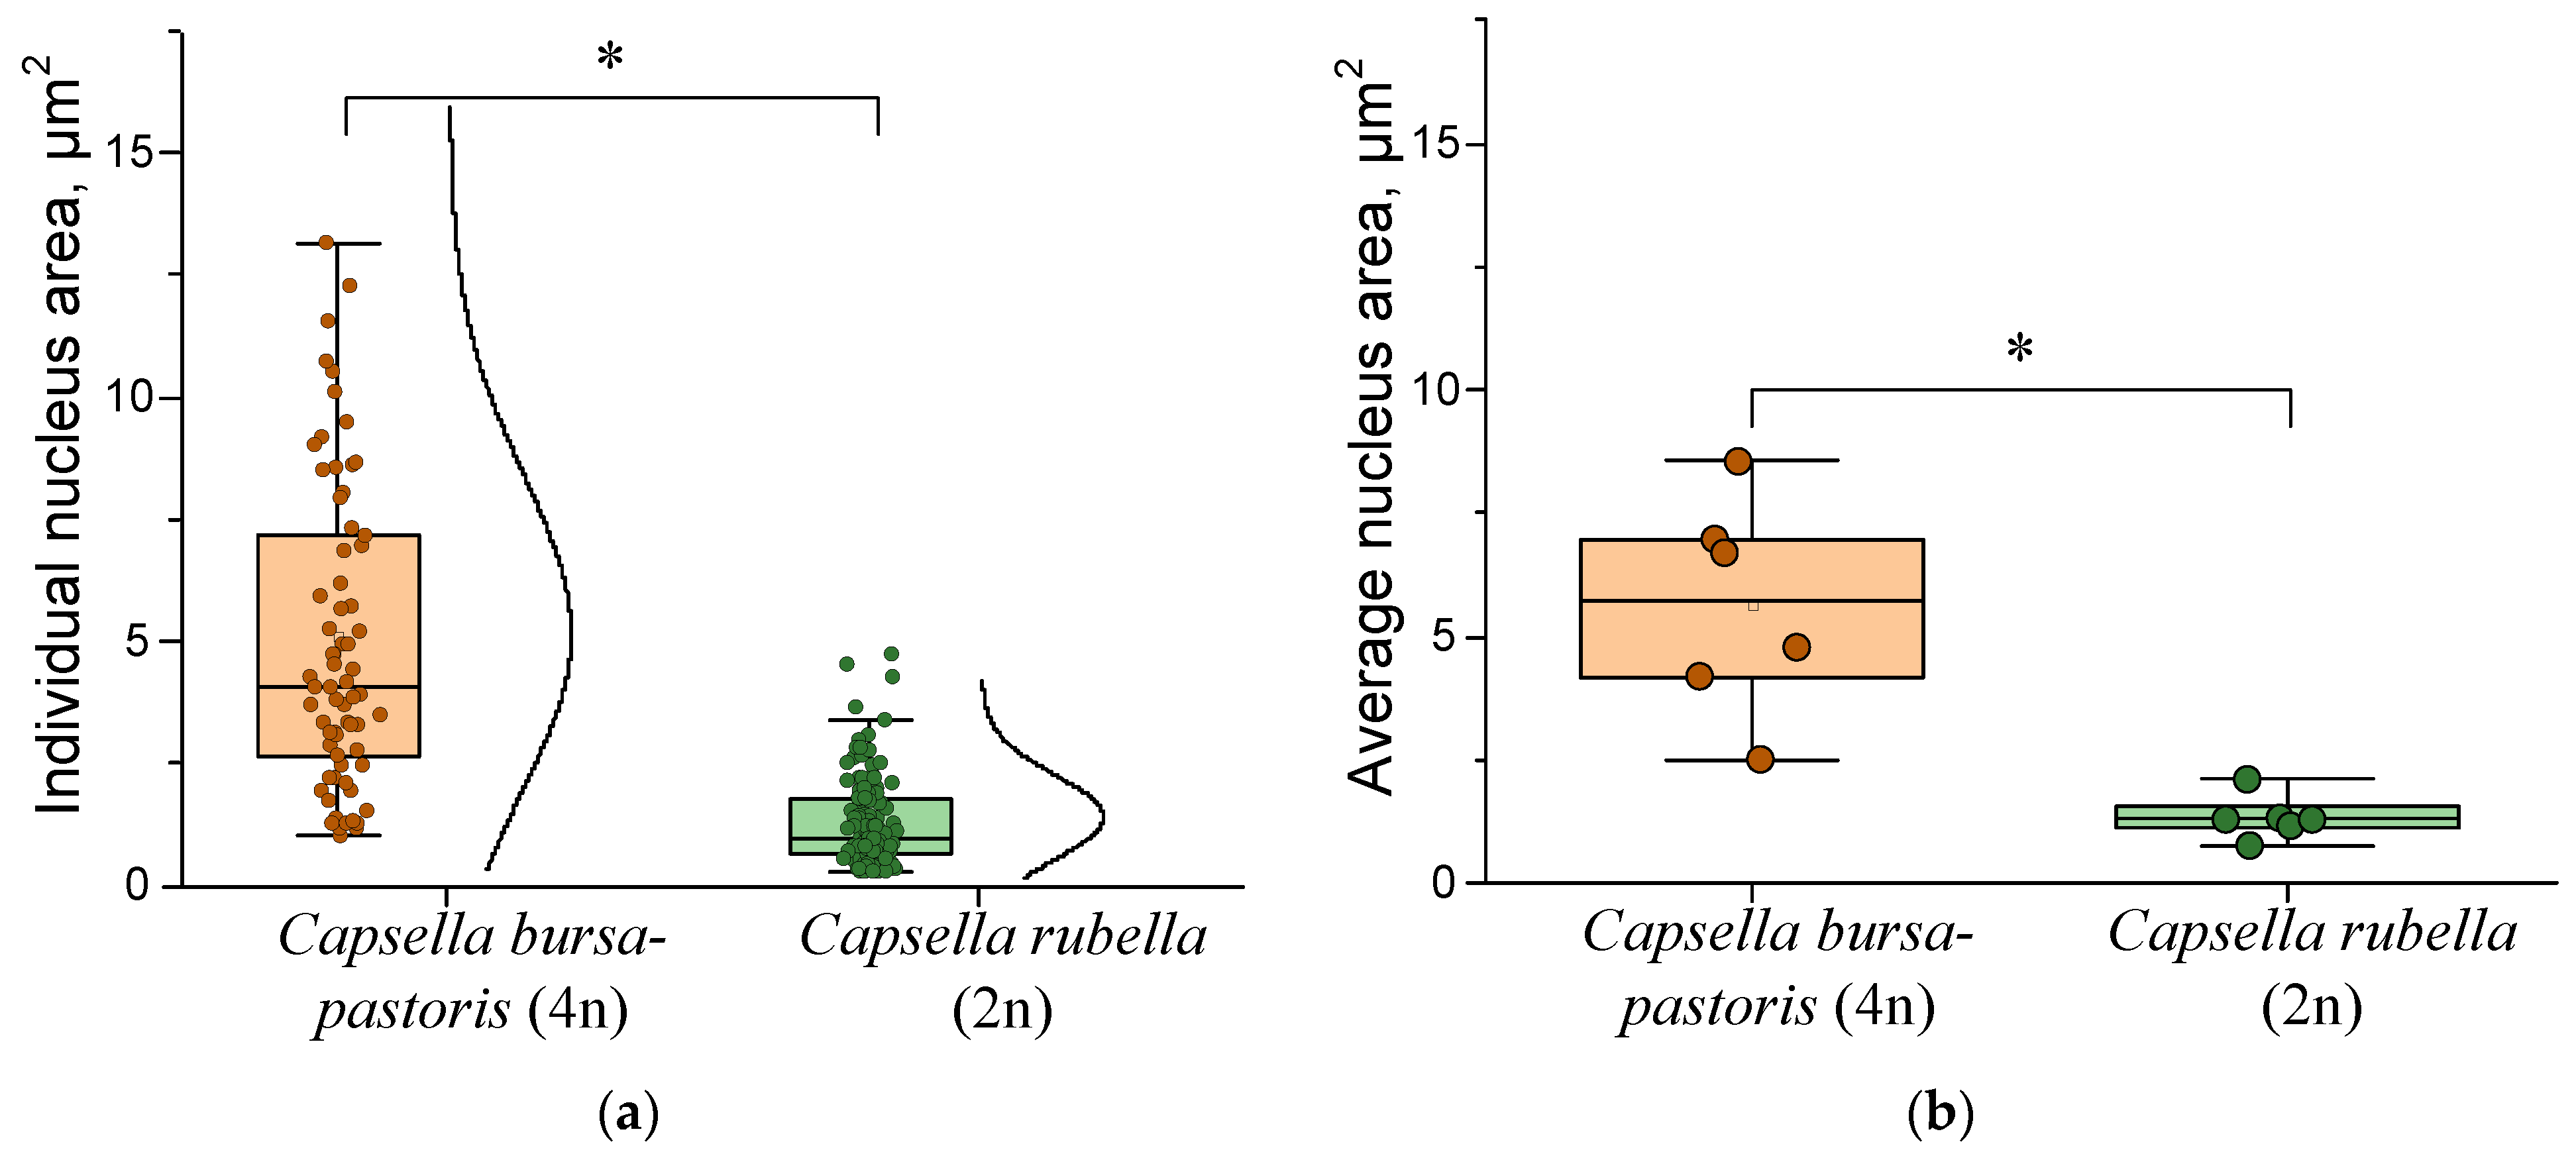
In the class of dicotyledonous plants, using C. bursa-pastoris as an example, a positive relationship was observed between the size of the nucleus and the size of the genome. In tetraploids, the nuclear area was 3–8 µm2, while in diploids it was 2–4 µm2 (Figure 11a). Moreover, in tetraploids, nuclei larger than 10 µm2 are found in approximately 5% of cases. Overall, tetraploids and diploids are quite distinguishable in terms of nuclear area, even at the level of individual randomly selected plants. Moreover, the range of the tetraploid nuclei sample is almost half an order of magnitude greater than that of the diploid sample.
Figure 11b shows the average data for six individual root preparations. It is shown that in the tetraploid, the nuclear area values are distributed in the range from 2 to 9 μm2. The median nuclear area values are approximately 5.5 μm2. In the diploid, the nuclear area values are distributed in the range from 0.5 to 2 μm2. The median nuclear area values are approximately 1 μm2. In general, the group analysis also showed that the nuclear area values of plants of the genus Capsella depend on the ploidy of the plants.
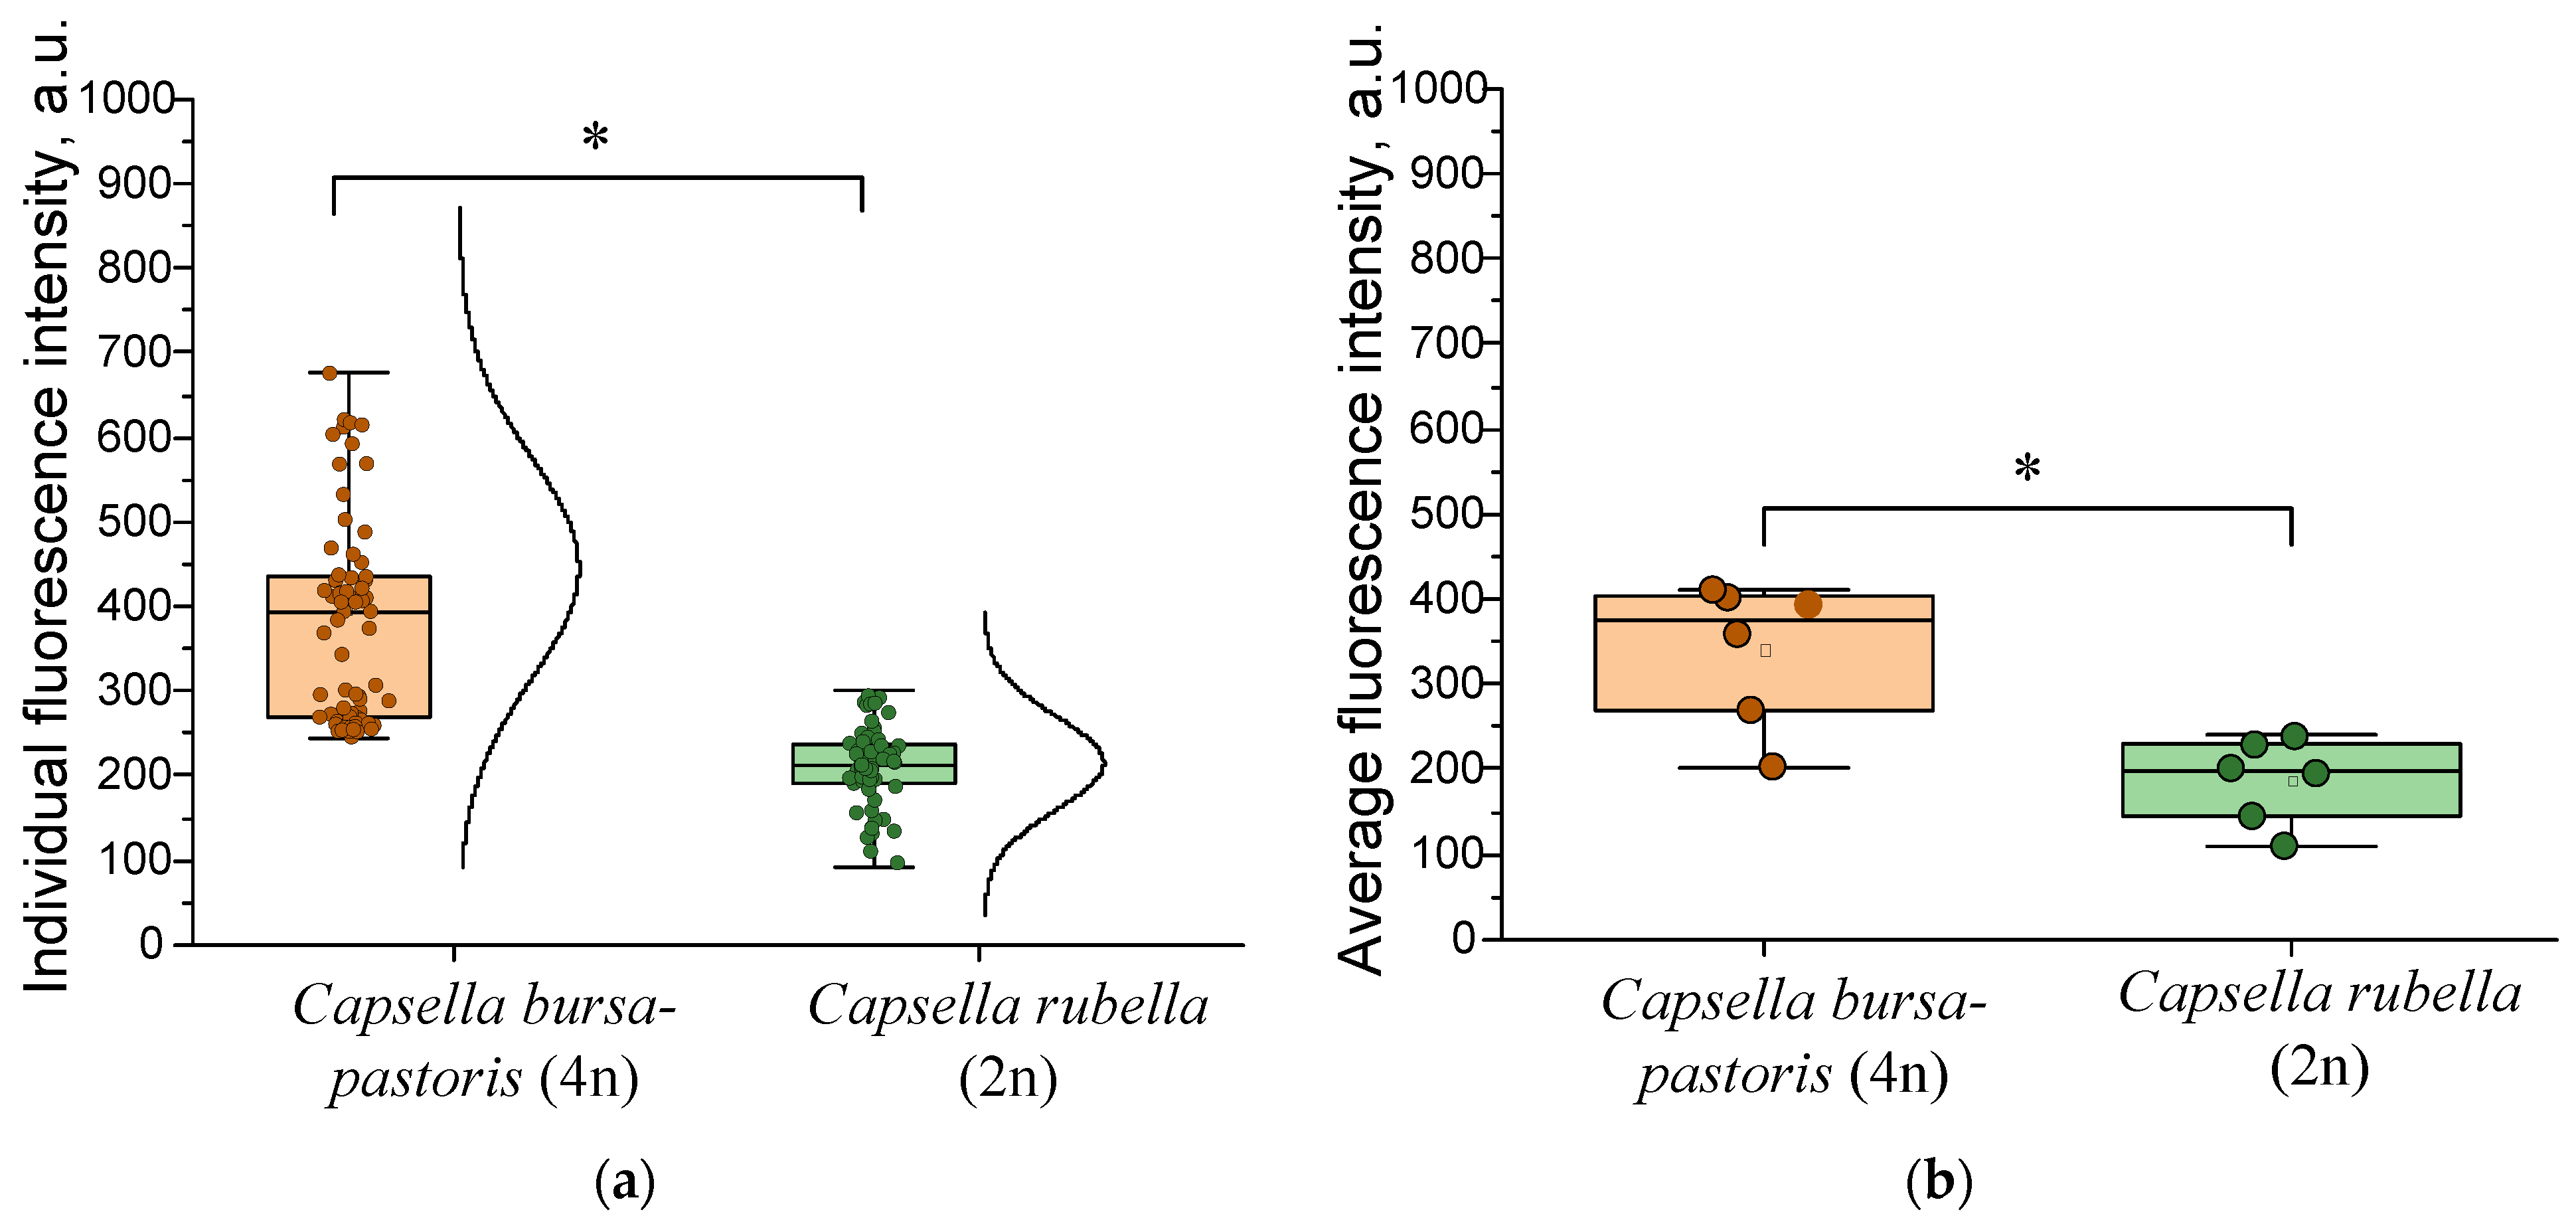
The influence of the ploidy of plants of the genus Capsella on the fluorescence intensity of the nucleus was studied (Figure 12). In two randomly taken roots of C. bursa-pastoris with ploidy 4n and C. rubella with ploidy 2n, the fluorescence intensity of the cell nucleus was studied (Figure 12a). It was shown that in a tetraploid, the fluorescence intensity of nuclei in one root can vary more than 2.5 times, from 250 to 650 conventional units, and in a diploid, it varies six times from 50 to 300 conventional units. The median fluorescence intensity of tetraploid nuclei is approximately 400 conventional units, in a diploid, 200 conventional units. The difference in nuclear fluorescence intensity between tetraploids and diploids is approximately 2-fold. Thus, it was found that the fluorescence intensity of the nuclei of plants of the genus Capsella depends on the ploidy of the nucleus.
Figure 12b shows the average data for six individual preparations of Capsella plant roots. It is shown that in tetraploids, the fluorescence intensity of nuclei in different plants can vary from 200 to 400 conventional units, while in diploids, it ranges from 100 to 250 conventional units. The median size of tetraploid nuclei is approximately 375 conventional units, while in diploids it is 200 conventional units. The difference in fluorescence intensity of nuclei in tetraploids and diploids is approximately 1.88 times.
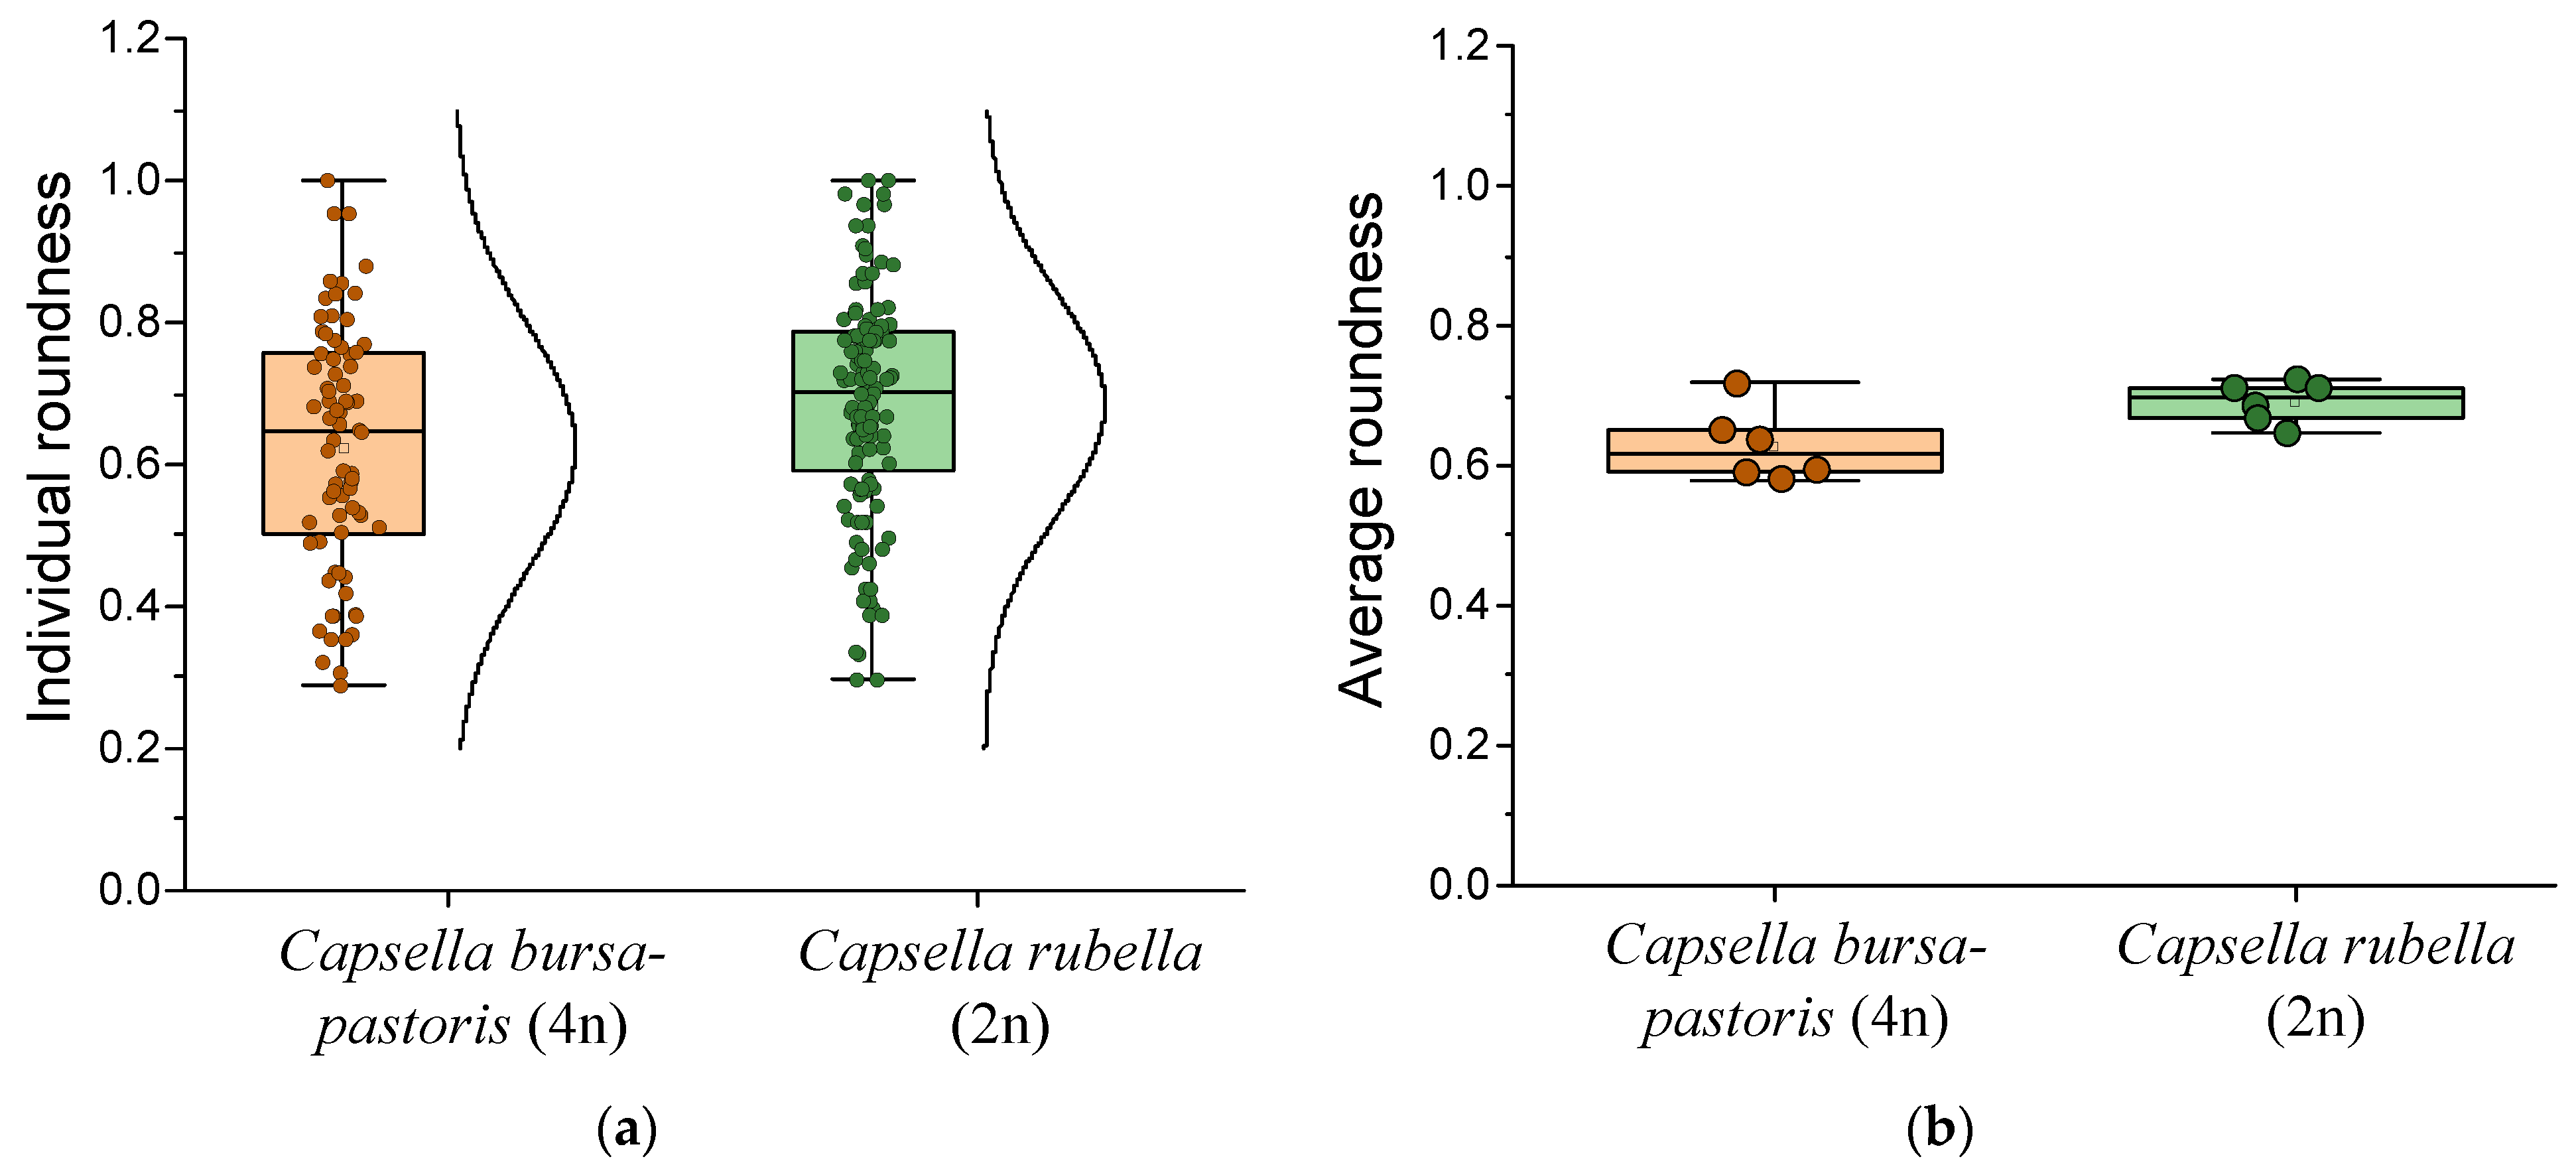
Roundness was studied in Capsella plants (Figure 13). The nuclear roundness was measured in two randomly selected roots of C. bursa-pastoris with ploidy 4n and C. rubella with ploidy 2n (Figure 13a). It was shown that the nuclear roundness in one rootlet of a tetraploid and a diploid can vary from 0.3 to 1.0. The median value of the nuclear roundness for a tetraploid is approximately 0.65, while for a diploid it is 0.7. However, the differences in the nuclear roundness values between tetraploids and diploids did not reach statistical significance. Thus, it was found that the nuclear roundness of two randomly selected Capsella plants does not depend on the nuclear ploidy.
Figure 13b shows the average data for six individual root preparations of plants of the genus Capsella. It is shown that the nuclear roundness index in tetraploid plants can vary from 0.58 to 0.7, while in diploid plants it ranges from 0.65 to 0.72. The median nuclear roundness index for tetraploids is approximately 0.65, while for diploids it is slightly less than 0.7. The differences in nuclear roundness values between tetraploids and diploids did not reach statistical significance.
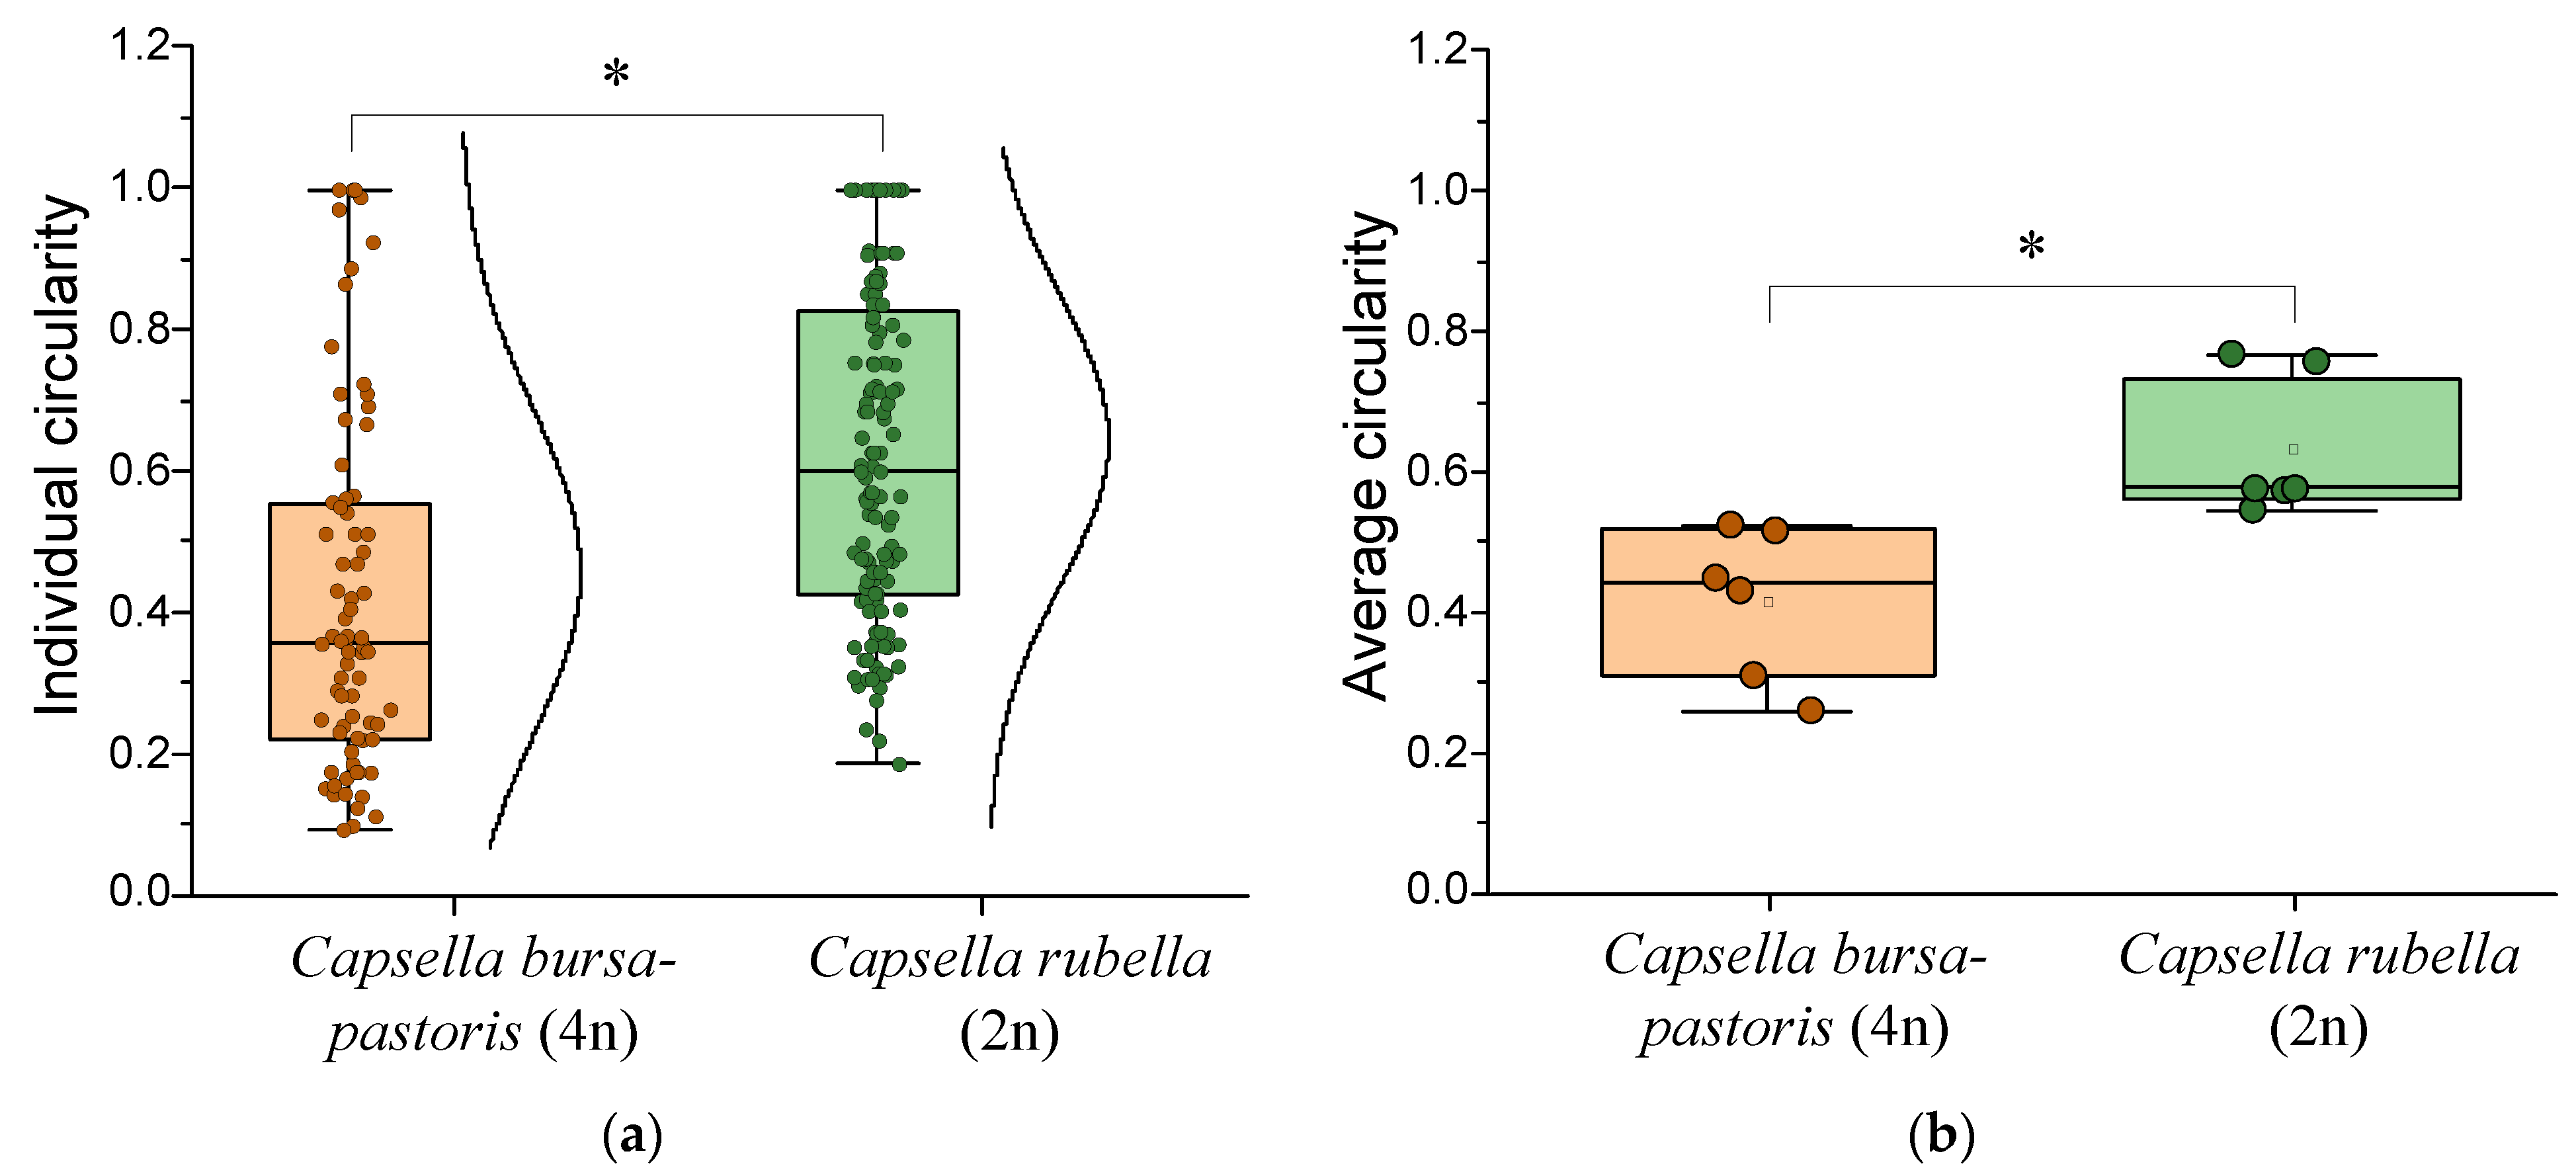
The influence of the ploidy of plants of the genus Capsella on the values of the nuclear circularity was studied (Figure 14). The values of nuclear circularity were studied in two randomly taken roots of C. bursa-pastoris with ploidy 4n and C. rubella with ploidy 2n (Figure 14a). It was shown that in both tetraploids and diploids, the values of nuclear circularity in one rootlet can vary from 0.1 to 1.0 and from 0.2 to 1.0, respectively. The median value of nuclear circularity in tetraploids is less than 0.4, and in diploids, 0.6. The difference in the value of nuclear circularity in tetraploids and diploids reaches statistical significance and is 1.5 times.
Figure 14b shows the averaged data for six individual root preparations of plants of the genus Capsella.
It is shown that the nuclear circularity index in tetraploid plants can vary from 0.25 to 0.52, while in diploid plants it ranges from 0.55 to 0.75. The median nuclear circularity index is approximately 0.45 for tetraploids and 0.6 for diploids. The difference in nuclear circularity between tetraploids and diploids reaches statistical significance and is approximately 1.3 times.
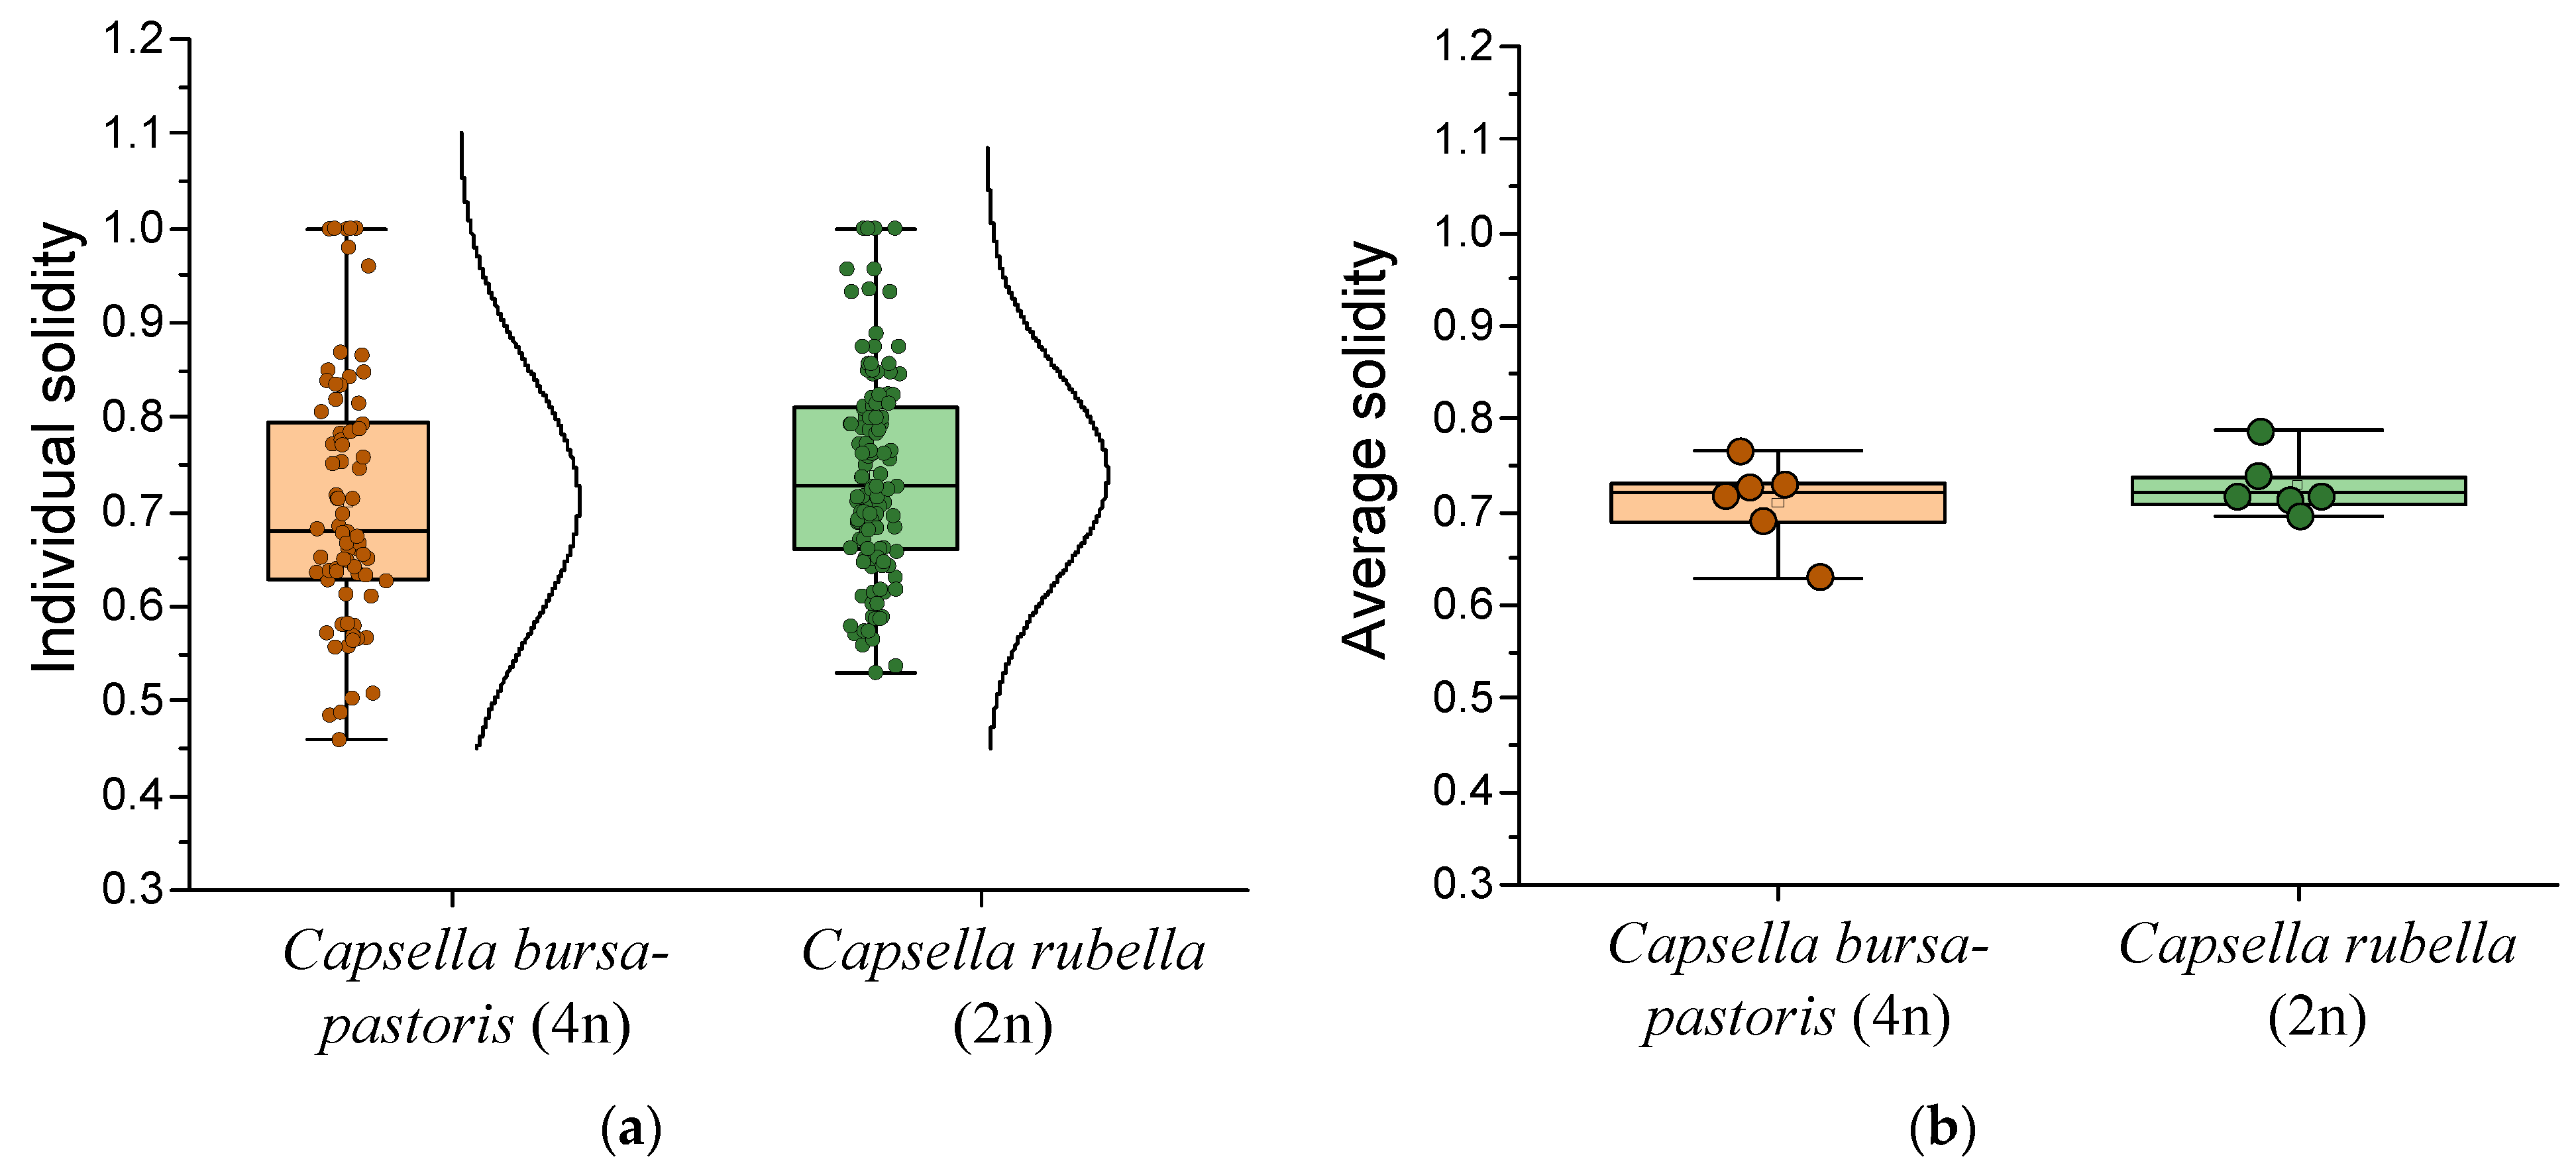
The influence of the ploidy of plants of the genus Capsella on the values of the nuclear solidity index was studied (Figure 15). The values of the nuclear solidity index were studied in two randomly taken roots of C. bursa-pastoris with ploidy 4n and C. rubella with ploidy 2n (Figure 15a). It was shown that in a tetraploid, the values of the nuclear solidity index in one root can vary from 0.45 to 1.0, in a diploid from 0.55 to 1.0. The median value of the nuclear solidity index of the tetraploid is almost 0.7, and in the diploid, 0.75. The difference in the values of the nuclear solidity index in tetra- and diploids did not reach statistical significance.
Figure 15b shows the average data for six individual root preparations of plants of the genus Capsella. It is shown that in tetraploid plants, the nuclear solidity index values in different plants can vary from 0.63 to 0.77, and in diploid plants from 0.7 to 0.75. The median nuclear solidity values for both tetraploid and diploid plants are approximately 0.72. There are no statistical differences in the change in solidity values depending on the ploidy of plants of the genus Capsella not identified.

3.3. Plant Ploidy Assay by Flow Cytofluorometry

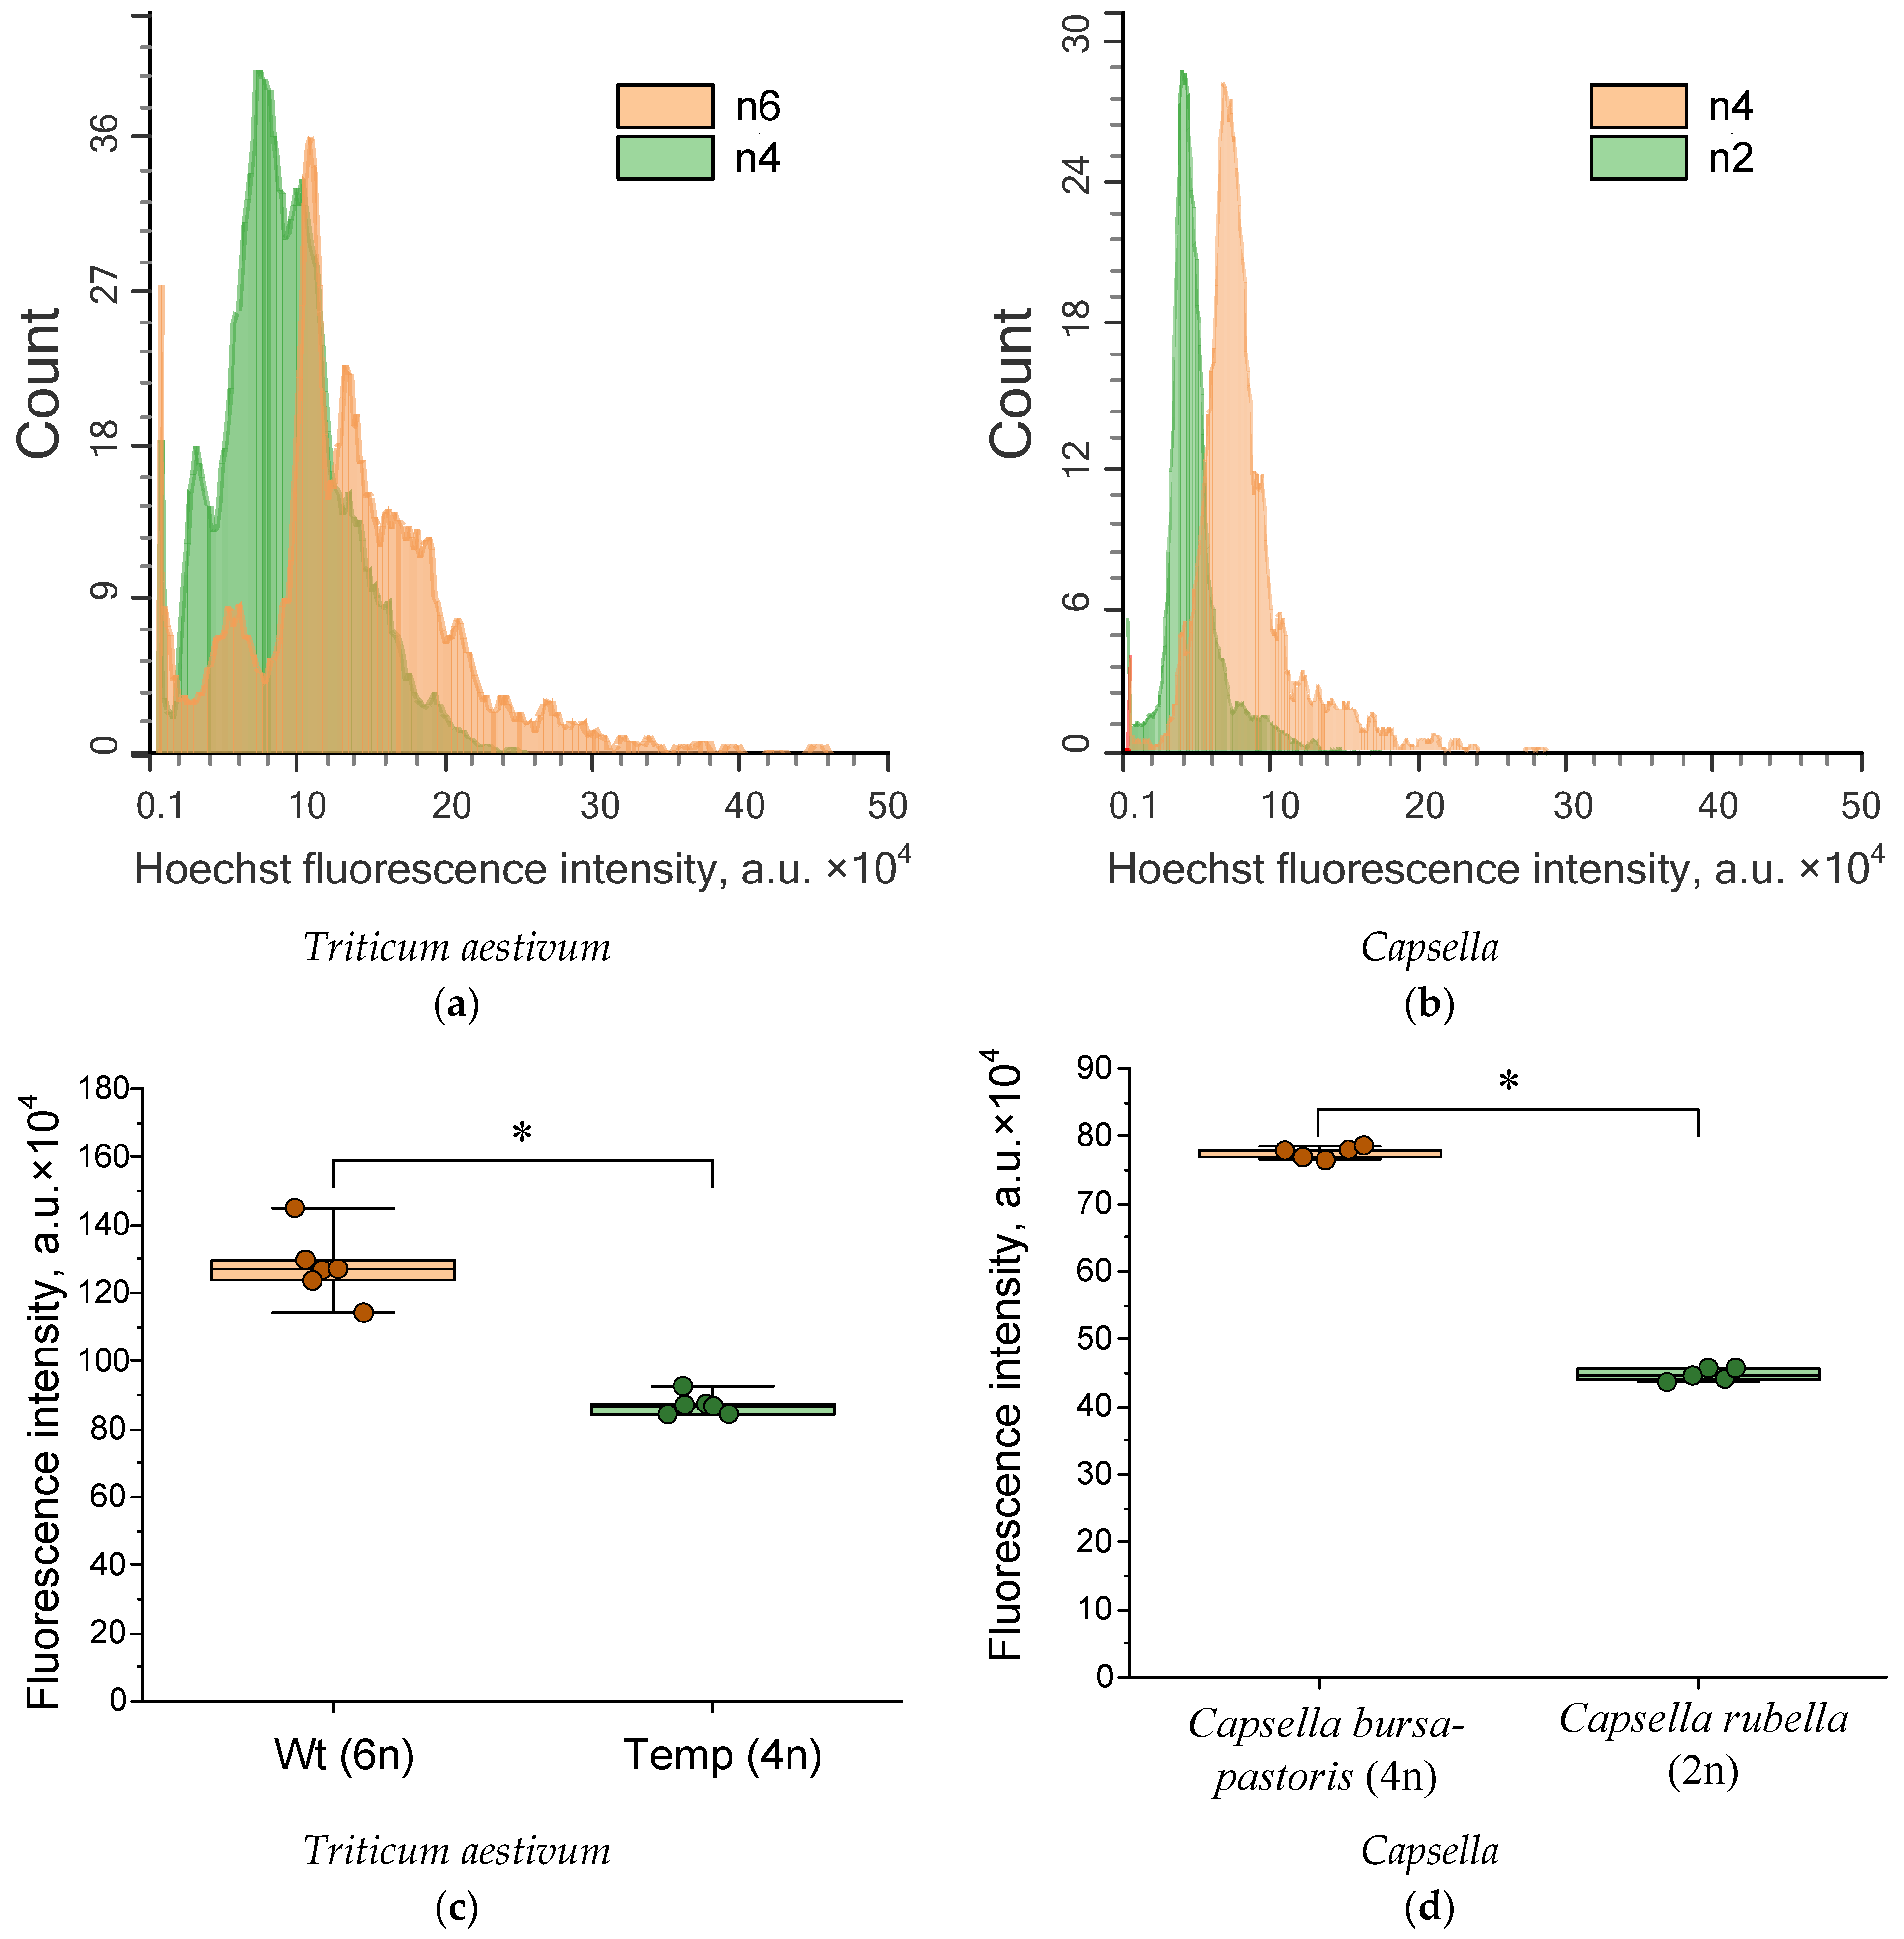
Flow cytofluorometry allows reliable separation of wheat varieties by ploidy (Figure 16a,c). The Hoechst fluorescence intensity ratio was equal to 1.42 ± 0.11 for monocot plants with ploidy 6n and 4n. This value is close to 1.5 (or 6:4). The error in determining ploidy from the theoretically possible value is 5–9% for flow cytofluorometry. The ratio of fluorescence intensities of n6 and n4 plant nuclei was ~1.7 times in the case of the developed automated method. In this case, the measurement error relative to the theoretical value was ~13%, which is slightly higher than that of flow cytofluorometry. Flow cytofluorometry also made it possible to reliably distinguish diploid plants from tetraploid ones in the case of dicotyledons, using the Capsella genus as an example (Figure 16b,d). The Hoechst fluorescence intensity ratio for n4 and n2 plants was 1.78 ± 0.12 times. This value differs from the theoretical expectation by 5–17%. The fluorescence intensity ratio for n4 and n2 plant nuclei was 1.88 in the case of our automated method, which is 6% lower than the theoretical expectation. Thus, the developed automated method enables ploidy assessment in monocotyledonous and dicotyledonous plants with accuracy comparable to the classical method of flow cytofluorometry.

4. Discussion

The developed automated technique for analyzing microimages of plant cell nuclei allows one to estimate the volume of the plant genome based on fluorescence intensity (Figure 6 and Figure 12) with an accuracy comparable to or slightly inferior to flow cytofluorometry (Figure 16). Unlike flow cytofluorometry, the developed automated technique is capable of determining important additional morphological characteristics of the nucleus, such as roundness (Figure 7 and Figure 13), circularity (Figure 8 and Figure 14), and solidity (Figure 9 and Figure 15).
It is known that the fluorescence intensity of fluorophores that do not interact or overlap with each other depends linearly on concentration [38]. It has been shown that in a hexaploid wheat variety, the fluorescence intensity of nuclei is, on average, 25–30% higher than in a tetraploid variety (Figure 6). The fluorescence intensity ratio of 3:2 correlates well with the ploidy ratio of the studied plants (6:4). For the classically used flow cytofluorometry method for ploidy assessment, a high correlation between the Hoechst fluorescence intensity and the genome size has been shown [14,15,16]; we were able to achieve results that are approximately accurate.
The fluorescence intensity in dicotyledonous plants also depended on the genome size (Figure 12). Moreover, with a 2-fold increase in ploidy, the fluorescence intensity increased by less than 50%. This phenomenon can presumably be associated with a more compact chromatin packing in the nucleus of dicotyledonous plants compared to monocotyledons [39], although there may be exceptions to every rule. Higher chromatin density in the genomes of plants of the genus Capsella is confirmed as follows. For one µm2 in the wheat nucleus, there are on average five conventional units of fluorescence intensity (Figure 4 and Figure 5), whereas in the nucleus of plants of the genus Capsella, there are on average 100 conventional units of fluorescence intensity (Figure 10 and Figure 11). In other words, the specific photon flux density from wheat nucleus is 20 times less than from the nucleus of plants of the genus Capsella.
Previous attempts have been made to estimate nuclear size using flow cytofluorometry [40]. In flow cytofluorometry, the size of the nucleus can be indirectly estimated by the values of forward (FS) and side (SS) light scatter. Microscopy allows for direct assessment of the size of nuclei, as well as the topology and morphology of nuclei [41]. The most popular indicators are Roundness, Circularity, and Solidity. There are also separate indicators characterizing the curvature of the nucleus, for example, the mean negative curvature according to Driscoll or mean negative curvature (MNC) [42]. There are close to curvature indices based on the shape of the nuclei [41]. There are indicators characterizing the texture of the nucleus, for example, the so-called Haralick features (textural measurements based on changes in intensity, as well as contrast, total dispersion, correlation and entropy) [43]. In general, the indicators of roundness (Figure 7 and Figure 13), circularity (Figure 8 and Figure 14) and solidity (Figure 9 and Figure 15) are quite useful and can be used as additional criteria for assessing ploidy and/or validating the results.
Overall, the developed automated method for analyzing plant cell nuclear microimages allows for estimating plant genome size based on fluorescence intensity with accuracy comparable to flow cytofluorometry (Figure 16). Ploidy analysis using flow cytofluorometry requires isolation of plant nuclei using cellulase or special chopping buffers. Available chopping buffers have varying effectiveness for different plant species [20,21]. Our results showed differences in the effectiveness of Otto chopping buffers for ploidy assessment in monocot and dicot plants. Separation of monocots was somewhat more effective. Using our method, we were able to demonstrate high efficiency in assessing fluorescence intensity for nuclei of monocot and dicot plants using a single cell dissociation buffer and the same staining protocol (Table 3). Furthermore, the developed automated method allows for obtaining additional information unavailable to flow cytofluorometry. A summary comparison of the developed automated method with conventional methods is presented in Table 3.
In addition to ploidy determination, the developed automated method for analyzing nuclear microimages can be applied to studies of the physiology of plant and animal cells. In particular, it can be used to analyze periodic/cyclic processes of oscillations of intracellular signaling molecules [44,45], which may be important for increasing the resistance of agricultural plants to drought and/or phytopathogens.

5. Conclusions

An automated method for analyzing plant cell nuclear microimages for polyploidy analysis has been successfully developed and tested. The developed method is based on a cyclic macro integrated into the freely available ImageJ software. The macro is easy to use and configure. All analysis stages can be customized: the size and shape of the analyzed particles, the brightness ranges of interest, and the measured parameters (area, pixel brightness, shape characteristics, and others). The method for analyzing plant cell nuclear microimages enables reliable separation of nuclei and plants based on genome size. For monocots, the most sensitive nuclear characteristics are fluorescence intensity and nuclear integrity. The nuclear fluorescence intensity ratio of 3:2 correlates with the genome sizes of 6n and 4n (3:2). Nuclear shape characteristics (integrity and circularity) for 6n and 4n plants demonstrated statistical differences; their variation does not exceed ≤5%. In dicotyledonous plants, the most sensitive parameters are nuclear area, fluorescence intensity, and circularity. An increase in ploidy from 2n to 4n increased Hoechst fluorescence intensity and nuclear circularity by 80% (1.88:1 ratio) and 45–48% (2:3 ratio), respectively. The sensitivity of the method is undoubtedly sufficient to distinguish between 2n and 4n plants. The method for analyzing microimages of plant nuclei allows for the simultaneous determination of several characteristics (at least five), which guarantees an accurate ploidy determination, since at least two characteristics will be sensitive. In the case of assessing nuclear fluorescence intensity in wheat, a high correlation between ploidy and fluorescence intensity is achieved, which is possible using flow cytofluorometric analysis. In the case of shepherd’s purse ploidy assessment, a weaker correlation between ploidy and fluorescence intensity is achieved; however, further optimization may improve accuracy. The “nucleus size-ploidy” relationship is similar in accuracy to flow cytofluorometry. Flow cytofluorometry is not capable of assessing nuclear shape (roundness, circularity, and solidity). Automated ploidy assessment using fluorescence microscopy may find application in plant breeding and agriculture.

Supplementary Materials

The following supporting information can be downloaded at: https://www.mdpi.com/article/10.3390/inventions11030056/s1.

Author Contributions

Conceptualization, S.V.G., A.S.D. and A.Y.I.; methodology, D.A.S., D.A.Z. and N.A.S.; software, D.A.S. and M.E.A.; validation, M.E.A. and V.A.K.; formal analysis, V.A.K.; investigation, D.A.S., D.A.Z. and N.A.S.; resources, S.V.G., A.S.D. and A.Y.I.; data curation, V.A.K.; writing—original draft preparation, D.A.S., D.A.Z. and N.A.S.; writing—review and editing, S.V.G., M.E.A. and V.A.K.; visualization, D.A.Z.; supervision, S.V.G.; project administration, S.V.G.; funding acquisition, S.V.G., A.S.D. and A.Y.I. All authors have read and agreed to the published version of the manuscript.

Funding

This research was funded by a grant from the Ministry of Science and Higher Education of the Russian Federation for large scientific projects in priority areas of scientific and technological development (subsidy identifier 075-15-2024-540).

Data Availability Statement

The raw data supporting the conclusions of this article will be made available by the authors on request.

Conflicts of Interest

The authors declare no conflicts of interest.

Abbreviations

a.u.arbitrary units
AIArtificial intelligence
DNADeoxyribonucleic acid
pxlpicture element
ROIRegion of interest
WtWild type

Appendix A

To further quantify the magnitude of changes, including those that did not reach statistical significance, we calculated Cohen’s d for each pair of characteristics. First, we analyzed the magnitude of changes in individual nuclei of different ploidies in monocots (Figure 5, Figure 6, Figure 7, Figure 8 and Figure 9a). In monocots, area, fluorescence intensity, and solidity were critically dependent on ploidy (Table A1). Circularity and roundness showed weak changes across ploidy. Next, we analyzed the magnitude of changes in individual nuclei of different ploidies in monocots (Figure 11, Figure 12, Figure 13, Figure 14 and Figure 15a). In dicots, the greatest changes were observed for area (Table A1). Solidity and fluorescence intensity showed moderate changes. All other parameters showed weak changes due to their large variation. Despite the small changes, statistical significance was achieved due to the large number of nuclei analyzed.
Table A1. Cohen’s d when comparing groups of nuclei differing in ploidy.
NoParameterT. aestivum Wt (6n) vs.
T. aestivum Temp (4n)
C. bursa-pastoris (4n) vs.
C. rubella (2n)
1Area−0.92622−4.50386
2Hoechst fluorescence intensity (microstructural fluorescence image analysis only applied)0.9917660.316108
3Circularity−0.22003−0.12063
4Roundness−0.194660.07821
5Solidity4.1143990.616288
The dependence of the effect strength on the value of the characteristic by module is as follows: ≤0.2—weak effect, ~0.5—moderate effect, ≥0.8—strong effect. The sign indicates the direction of the effect (decrease or increase).
In the next step, we assessed the magnitude of changes in group analysis (Figure 5, Figure 6, Figure 7, Figure 8, Figure 9b, Figure 10, Figure 11, Figure 12, Figure 13, Figure 14, Figure 15b and Figure 16c,d). The greatest differences were observed for fluorescence intensity, area, roundness, and solidity for monocots of different ploidies (Table A2). Circularity demonstrated moderate change.
Table A2. Cohen’s d when comparing groups of plants differing in ploidy.
NoParameterT. aestivum Wt (6n) vs.
T. aestivum Temp (4n)
C. bursa-pastoris (4n) vs.
C. rubella (2n)
1Area0.7716497440.875186145
2Hoechst fluorescence intensity (microstructural fluorescence image analysis)1.7697132410.796764794
3Hoechst fluorescence intensity (flow cytofluorometry)1.805633861−3.564248112
4Circularity0.526451888−0.861957403
5Roundness−0.945361901−0.532005637
6Solidity1.111658547−0.169527254
The dependence of the effect strength on the value of the characteristic by module is as follows: ≤0.2—weak effect, ~0.5—moderate effect, ≥0.8—strong effect. The sign indicates the direction of the effect (decrease or increase).
Hoechst fluorescence intensity measured by fluorescence microscopy and flow cytofluorometry showed comparable differences in ploidies n6 and n4. The greatest changes were demonstrated by the nucleus area, fluorescence intensity, and circularity for dicots. Fluorescence intensity measured by flow cytofluorometry was more strongly dependent on ploidy than the same parameter measured by fluorescence microscopy. This may be explained by differences in the sensitivity of the methods. However, both methods can achieve Cohen’s d ≥ 0.8, which is sufficient for reliable separation of plants by ploidy. Roundness and solidity show moderate and weekly changes, respectively. The data obtained from the Cohen’s d analysis of plant groups are consistent with the results of the Mann–Whitney test.

References

  1. Sattler, M.C.; Carvalho, C.R.; Clarindo, W.R. The polyploidy and its key role in plant breeding. Planta 2015, 243, 281–296. [Google Scholar] [CrossRef] [Scilit]
  2. Rauf, S.; Ortiz, R.; Malinowski, D.P.; Clarindo, W.R.; Kainat, W.; Shehzad, M.; Waheed, U.; Hassan, S.W. Induced Polyploidy: A Tool for Forage Species Improvement. Agriculture 2021, 11, 210. [Google Scholar] [CrossRef] [Scilit]
  3. Borodkina, A.G. Polyploidy—An effective method of breeding. Breed. Var. Breed. Hortic. Crops 2021, 8, 18–20. [Google Scholar] [CrossRef]
  4. Anatskaya, O.V.; Vinogradov, A.E. Polyploidy as a Fundamental Phenomenon in Evolution, Development, Adaptation and Diseases. Int. J. Mol. Sci. 2022, 23, 3542. [Google Scholar] [CrossRef] [Scilit]
  5. Trojak-Goluch, A.; Kawka-Lipińska, M.; Wielgusz, K.; Praczyk, M. Polyploidy in Industrial Crops: Applications and Perspectives in Plant Breeding. Agronomy 2021, 11, 2574. [Google Scholar] [CrossRef] [Scilit]
  6. Zubkova, M.A.; Ulitskaya, O.N.; Borodkina, A.G. Study of microsporogenesis features in tetraploid of apple. Contemp. Hortic. 2019, 4, 26–32. [Google Scholar]
  7. Domblides, E.; Ermolaev, A.; Belov, S.; Kan, L.; Skaptsov, M.; Domblides, A. Efficient Methods for Evaluation on Ploidy Level of Cucurbita pepo L. Regenerant Plants Obtained in Unpollinated Ovule Culture In Vitro. Horticulturae 2022, 8, 1083. [Google Scholar] [CrossRef] [Scilit]
  8. Palomino, G.; Martínez-Ramón, J.; Cepeda-Cornejo, V.; Ladd-Otero, M.; Romero, P.; Reyes-Santiago, J. Chromosome Number, Ploidy Level, and Nuclear DNA Content in 23 Species of Echeveria (Crassulaceae). Genes 2021, 12, 1950. [Google Scholar] [CrossRef] [Scilit]
  9. Gudkov, S.V.; Antipov, A.V.; Astashev, M.E.; Baybursky, V.L.; Baimler, I.V.; Beldova, D.A.; Bunkin, A.F.; Burmistrov, D.E.; Validov, S.Z.; Vasilyev, V.A.; et al. Ecology of Industrial Cities: Non-Standard Scientific and Technological Solutions for Environmental Monitoring, Neutralization, and Subsequent Advanced Processing of Industrial and Municipal Waste (A Review). Russ. J. Gen. Chem. 2025, 95, S449–S480. [Google Scholar] [CrossRef] [Scilit]
  10. Gudkov, S.V.; Sarimov, R.M.; Astashev, M.E.; Pishchalnikov, R.Y.; Yanykin, D.V.; Simakin, A.V.; Shkirin, A.V.; Serov, D.A.; Konchekov, E.M.; Guseynaga ogly, G.-z.N.; et al. Modern physical methods and technologies in agriculture. Physics-Uspekhi 2023, 67, 194–210. [Google Scholar] [CrossRef] [Scilit]
  11. García-Fortea, E.; García-Pérez, A.; Gimeno-Páez, E.; Sánchez-Gimeno, A.; Vilanova, S.; Prohens, J.; Pastor-Calle, D. A Deep Learning-Based System (Microscan) for the Identification of Pollen Development Stages and Its Application to Obtaining Doubled Haploid Lines in Eggplant. Biology 2020, 9, 272. [Google Scholar] [CrossRef] [Scilit]
  12. Ochatt, S.J.; Patat-Ochatt, E.M.; Moessner, A. Ploidy level determination within the context of in vitro breeding. Plant Cell Tissue Organ Cult. (PCTOC) 2011, 104, 329–341. [Google Scholar] [CrossRef] [Scilit]
  13. Bharati, R.; Shmeit, Y.H.; Šedivá, J.H.; Cong, T.T.N.; Kundu, J.K.; Severová, L.; Svoboda, R.; Fernández-Cusimamani, E. Comparative assessment of morphological, cytological, and photosynthetic characteristics of the induced octoploid and its tetraploid counterpart of Celosia argentea L. BMC Plant Biol. 2024, 24, 1227. [Google Scholar] [CrossRef] [Scilit]
  14. Galbraith, D.W. Simultaneous flow cytometric quantification of plant nuclear DNA contents over the full range of described angiosperm 2C values. Cytom. Part A 2009, 75A, 692–698. [Google Scholar] [CrossRef] [Scilit]
  15. Edgar, B.A.; Zielke, N.; Gutierrez, C. Endocycles: A recurrent evolutionary innovation for post-mitotic cell growth. Nat. Rev. Mol. Cell Biol. 2014, 15, 197–210, Erratum in Nat. Rev. Mol. Cell Biol. 2014, 15, 294. [Google Scholar] [CrossRef] [Scilit] [PubMed]
  16. Galbraith, D.W. Endoreduplicative standards for calibration of flow cytometric C-Value measurements. Cytom. Part A 2014, 85, 368–374. [Google Scholar] [CrossRef] [Scilit]
  17. Takashimizu, Y.; Iiyoshi, M. New parameter of roundness R: Circularity corrected by aspect ratio. Prog. Earth Planet. Sci. 2016, 3, 2. [Google Scholar] [CrossRef] [Scilit]
  18. McKinnon, K.M. Flow Cytometry: An Overview. Curr. Protoc. Immunol. 2018, 120, 5.1.1–5.1.11. [Google Scholar] [CrossRef] [Scilit]
  19. Galbraith, D.W.; Harkins, K.R.; Maddox, J.M.; Ayres, N.M.; Sharma, D.P.; Firoozabady, E. Rapid Flow Cytometric Analysis of the Cell Cycle in Intact Plant Tissues. Science 1983, 220, 1049–1051. [Google Scholar] [CrossRef] [Scilit]
  20. Zhang, J.; Zhang, P.; Wang, G.; Chen, C.; Wang, X.; Liu, G.; Ma, F.; Bao, Z. Determination of nuclear DNA ploidy distribution in the mesocarp of tomato red ripe fruit using a flow cytometer. Veg. Res. 2023, 3, 8. [Google Scholar] [CrossRef] [Scilit]
  21. Loureiro, J.; Rodriguez, E.; DoleŽEl, J.; Santos, C. Comparison of Four Nuclear Isolation Buffers for Plant DNA Flow Cytometry. Ann. Bot. 2006, 98, 679–689. [Google Scholar] [CrossRef] [Scilit]
  22. Pellicer, J.; Powell, R.F.; Leitch, I.J. The Application of Flow Cytometry for Estimating Genome Size, Ploidy Level Endopolyploidy, and Reproductive Modes in Plants. In Molecular Plant Taxonomy; Methods in Molecular Biology; Humana: New York, NY, USA, 2021; pp. 325–361. [Google Scholar]
  23. Dumur, T.; Duncan, S.; Graumann, K.; Desset, S.; Randall, R.S.; Mittelsten Scheid, O.; Bass, H.W.; Prodanov, D.; Tatout, C.; Baroux, C. Probing the 3D architecture of the plant nucleus with microscopy approaches: Challenges and solutions. Nucleus 2019, 10, 181–212, Erratum in Nucleus 2019, 11, i. [Google Scholar] [CrossRef] [Scilit]
  24. Matsuoka, Y. Imaging Flow Cytometry as a Molecular Biology Tool: From Cell Morphology to Molecular Mechanisms. Int. J. Mol. Sci. 2025, 26, 9261. [Google Scholar] [CrossRef] [Scilit]
  25. Julião, S.A.; Ribeiro, C.d.V.; Lopes, J.M.L.; Matos, E.M.d.; Reis, A.C.; Peixoto, P.H.P.; Machado, M.A.; Azevedo, A.L.S.; Grazul, R.M.; Campos, J.M.S.d.; et al. Induction of Synthetic Polyploids and Assessment of Genomic Stability in Lippia alba. Front. Plant Sci. 2020, 11, 292. [Google Scholar] [CrossRef] [Scilit]
  26. Kurbatova, S.; Pesnya, D.; Sharov, A.; Yershov, I.; Chernova, E.; Fedorov, R.; Semadeni, I.; Shurganova, G. Genotoxic Effects of Water in Aquatic Ecosystems with Varying Cyanobacterial Abundance Assessed Using the Allium Test. Environments 2025, 12, 321. [Google Scholar] [CrossRef] [Scilit]
  27. Pesnya, D.S.; Bolotov, S.E. Allium test genotoxicity data on water from river valley of Irtysh, West Siberia. Data Brief 2022, 41, 107861. [Google Scholar] [CrossRef] [Scilit]
  28. Pesnya, D.S.; Romanovsky, A.V.; Serov, D.A.; Poddubnaya, N.Y. Genotoxic effects of Heracleum sosnowskyi in the Allium cepatest. Caryologia 2017, 70, 55–61. [Google Scholar] [CrossRef] [Scilit]
  29. Bernard, M.; Bernard, S.; Badaeva, E.; Schlegel, R. Creating New Forms of Hexaploid Triticale Associating Complete R and D Genomes. Biology 2025, 14, 1632. [Google Scholar] [CrossRef] [Scilit]
  30. Bokhari, Y.; Alhareeri, A.; Aljouie, A.; Alkhaldi, A.; Rashid, M.; Alawad, M.; Alhassnan, R.; Samargandy, S.; Panahi, A.; Heidrich, W.; et al. ChromoEnhancer: An Artificial-Intelligence-Based Tool to Enhance Neoplastic Karyograms as an Aid for Effective Analysis. Cells 2022, 11, 2244. [Google Scholar] [CrossRef] [Scilit]
  31. Semenova, N.A.; Zakharov, D.A.; Stepanova, E.V.; Sarimova, S.R. Application of magnesium oxide nanoparticles to improve sweet basil (Ocimum basilicum L.) productivity in total control environment agriculture. Veg. Crops Russ. 2026, 6, 176–184. [Google Scholar] [CrossRef] [Scilit]
  32. Semenova, N.; Zakharov, D.; Stepanova, E.; Sarimova, S.; Baimler, I. The Impact of Magnesium Oxide Nanoparticles on the Growth Indicators, Pigment Content and Essential Oil Accumulation in Ocimum basilicum L. Russ. J. Plant Physiol. 2025, 72, 255. [Google Scholar] [CrossRef] [Scilit]
  33. ISO 5807:1985; Information Processing. Documentation Symbols and Conventions for Data, Program and System Flowcharts, Program Network Charts and Systems Resources Charts: Traitment de L’information. ISO: Geneva, Switzerland, 1985.
  34. Belosludtseva, N.V.; Serov, D.A.; Starinets, V.S.; Penkov, N.V.; Belosludtsev, K.N. Alterations in Mitochondrial Morphology and Quality Control in Primary Mouse Lung Microvascular Endothelial Cells and Human Dermal Fibroblasts under Hyperglycemic Conditions. Int. J. Mol. Sci. 2023, 24, 12485. [Google Scholar] [CrossRef] [Scilit]
  35. Zdilla, M.J.; Hatfield, S.A.; McLean, K.A.; Cyrus, L.M.; Laslo, J.M.; Lambert, H.W. Circularity, Solidity, Axes of a Best Fit Ellipse, Aspect Ratio, and Roundness of the Foramen Ovale. J. Craniofacial Surg. 2016, 27, 222–228. [Google Scholar] [CrossRef] [Scilit]
  36. Tambassi, M.; Pongolini, S.; Berni, M. Automated Analysis of Intracellular Phenotypes of Salmonella Using ImageJ. J. Vis. Exp. 2022, 186, e64263. [Google Scholar] [CrossRef] [Scilit]
  37. Dolezel, J. Plant DNA Flow Cytometry and Estimation of Nuclear Genome Size. Ann. Bot. 2005, 95, 99–110. [Google Scholar] [CrossRef] [Scilit]
  38. Lakowicz, J.R. Fluorophores. In Principles of Fluorescence Spectroscopy; Springer: Boston, MA, USA, 1999; pp. 63–93. [Google Scholar]
  39. Doğan, E.S.; Liu, C. Three-dimensional chromatin packing and positioning of plant genomes. Nat. Plants 2018, 4, 521–529. [Google Scholar] [CrossRef] [Scilit]
  40. Doležel, J.; Greilhuber, J.; Lucretti, S.; Meister, A.; Lysák, M.A.; Nardi, L.; Obermayer, R. Plant Genome Size Estimation by Flow Cytometry: Inter-laboratory Comparison. Ann. Bot. 1998, 82, 17–26. [Google Scholar] [CrossRef] [Scilit]
  41. Bourn, M.D.; Daly, L.F.; Huggett, J.F.; Braybrook, J.; Rivera, J.F. Evaluation of image analysis tools for the measurement of cellular morphology. Front. Cell Dev. Biol. 2025, 13, 1572212. [Google Scholar] [CrossRef] [Scilit]
  42. Driscoll, M.K.; Albanese, J.L.; Xiong, Z.-M.; Mailman, M.; Losert, W.; Cao, K. Automated image analysis of nuclear shape: What can we learn from a prematurely aged cell? Aging 2012, 4, 119–132. [Google Scholar] [CrossRef] [Scilit]
  43. Haralick, R.M.; Sternberg, S.R.; Zhuang, X. Image Analysis Using Mathematical Morphology. IEEE Trans. Pattern Anal. Mach. Intell. 1987, PAMI-9, 532–550. [Google Scholar] [CrossRef] [Scilit]
  44. Astashev, M.E.; Burmistrov, D.E.; Yanykin, D.V.; Grishin, A.A.; Knyazeva, I.V.; Dorokhov, A.S.; Gudkov, S.V. Application of Bispectral Analysis to Assess the Effect of Drought on the Photosynthetic Activity of Lettuce Plants Lactuca sativa L. Math. Comput. Appl. 2024, 29, 93. [Google Scholar] [CrossRef] [Scilit]
  45. Astashev, M.E.; Serov, D.A.; Tankanag, A.V.; Knyazeva, I.V.; Dorokhov, A.A.; Simakin, A.V.; Gudkov, S.V. Study of the Synchronization and Transmission of Intracellular Signaling Oscillations in Cells Using Bispectral Analysis. Biology 2024, 13, 685. [Google Scholar] [CrossRef] [Scilit]
Figure 1. Photo of seedlings of the studied plants with different ploidy. The scale bar is 10 mm.
Inventions 11 00056 g001
Figure 2. Block diagram of the algorithm for automated analysis of plant cell nuclei characteristics (ISO 5807:1985) [33].
Inventions 11 00056 g002
Figure 3. An example of macro processing: Initial image (a); intermediate result of creating binary masks set (b); final binary masks set (c); a view of opened macros window (d); an example of a result table (e). Scale bar is 50 µm.
Inventions 11 00056 g003
Figure 4. Examples of micrographs of root meristem cells of wheat Triticum aestivum cultivar Wt with a 6n karyotype (a) and cultivar Temp with a 4n karyotype (b). The blue-green pseudocolor corresponds to Hoechst 33258 fluorescence. The photographs were obtained with identical settings for illuminant brightness, camera exposure, gain, and image binarization. Background fluorescence was pre-subtracted. The color scale indicates the dynamic range of fluorescence brightness for each photograph. The scale bar is 20 µm.
Inventions 11 00056 g004
Figure 5. Dependence of the root meristem cell nucleus size on wheat ploidy. (a) Results of comparison of cell distribution by nucleus size in two randomly taken rootlets (Wt variety with ploidy of 6n, Temp variety with ploidy of 4n). Each point corresponds to an individual nucleus. Data are presented as medians and percentiles of 10, 25, 75 and 90%. The small squares inside the box correspond to the arithmetic mean values. The curves on the right demonstrate the shape of the nucleus distribution by the studied parameter. (b) Averaged data for the analysis of 6 individual plants. Each point corresponds to an individual plant. Data are presented as medians and percentiles of 10, 25, 75 and 90%. The small squares inside the box correspond to the arithmetic mean values. *—p < 0.05 by the Mann–Whitney test.
Inventions 11 00056 g005
Figure 6. Dependence of the fluorescence intensity of the nuclei of root meristem cells on the ploidy of wheat. (a) Results of comparison of cell distribution by fluorescence intensity of nuclei in two randomly taken rootlets (one rootlet is of the Wt variety with ploidy of 6n, the other is of the Temp variety with ploidy of 4n). Each point corresponds to an individual nucleus. Data are presented as medians and percentiles of 10, 25, 75 and 90%. The small squares inside the box correspond to the arithmetic mean values. In each sample, 50–100 nuclei were analyzed. The curves on the right demonstrate the shape of the distribution of nuclei by the studied parameter. (b) Averaged data for the analysis of 6 individual plants. Each point corresponds to an individual plant. Data are presented as medians and percentiles of 10, 25, 75 and 90%. The small squares inside the box correspond to the arithmetic mean values. *—p < 0.05 by the Mann–Whitney test.
Inventions 11 00056 g006
Figure 7. Dependence of the nuclear roundness on the ploidy of wheat plants. (a) Results of comparison of cell distribution by the nuclear roundness index in two randomly taken rootlets (one rootlet is of the Wt variety with ploidy of 6n, the other is of the Temp variety with ploidy of 4n). Each point corresponds to an individual nucleus. Data are presented as medians and percentiles of 10, 25, 75 and 90%. The small squares inside the box correspond to the mean values. In each sample, 50–100 nuclei were analyzed. The curves on the right demonstrate the shape of the nucleus distribution by the studied parameter. (b) Averaged data for the analysis of 6 individual plants. Each point corresponds to an individual plant. Data are presented as medians and percentiles of 10, 25, 75 and 90%. The small squares inside the box correspond to the mean values. *—p < 0.05 by the Mann–Whitney test.
Inventions 11 00056 g007
Figure 8. Dependence of the nuclear circularity value on the ploidy of wheat plants. (a) Results of comparing the distribution of cells by the nuclear circularity index value in two randomly selected roots (one root—Wt with ploidy 6n, the second—the Temp variety with ploidy 4n). Each point corresponds to an individual nucleus. Data are presented as medians and percentiles of 10, 25, 75, and 90%. The small squares inside the box correspond to the mean values. In each sample, 50–100 nuclei were analyzed. The curves on the right demonstrate the shape of the distribution of nuclei by the studied parameter. (b) Averaged data for the analysis of 6 individual plants. Each point corresponds to an individual plant. Data are presented as medians and percentiles of 10, 25, 75, and 90%. The small squares inside the box correspond to the mean values.
Inventions 11 00056 g008
Figure 9. Dependence of the nuclear solidity on the ploidy of wheat plants. (a) Results of comparison of cell distribution by the nuclear solidity index in two randomly taken rootlets (one rootlet is of the Wt variety with ploidy of 6n, the other is of the Temp variety with ploidy of 4n). Each point corresponds to an individual nucleus. Data are presented as medians and percentiles of 10, 25, 75 and 90%. The small squares inside the box correspond to the mean values. In each sample, 50–100 nuclei were analyzed. The curves on the right demonstrate the shape of the nucleus distribution by the studied parameter. (b) Averaged data for the analysis of 6 individual plants. Each point corresponds to an individual plant. Data are presented as medians and percentiles of 10, 25, 75 and 90%. The small squares inside the box correspond to the mean values. *—p < 0.05 by the Mann–Whitney test.
Inventions 11 00056 g009
Figure 10. Examples of micrographs of root meristem cells of shepherd’s purse, Capsella bursa-pastoris, with karyotype 4n and Capsella rubella with karyotype 2n. The blue-green pseudocolor corresponds to Hoechst 33258 fluorescence. Photographs were obtained with identical settings for illuminant brightness, camera exposure, gain, and image binarization. Background fluorescence was pre-subtracted. The color scale indicates the dynamic range of fluorescence brightness for each photograph. Scale bar: 10 µm.
Inventions 11 00056 g010
Figure 11. Dependence of the cell nuclear size of the shepherd’s purse root meristem on ploidy. (a) Results of comparison of cell distribution by nuclear size in two randomly selected roots (one root—C. bursa-pastoris with ploidy 4n, the other rootlet is C. rubella with ploidy 2n). Each point corresponds to an individual nucleus. Data are presented as medians and percentiles of 10, 25, 75, and 90%. The small squares inside the box correspond to the arithmetic mean values. 50–100 nuclei were analyzed in each sample. The curves on the right demonstrate the shape of the distribution of nuclei by the studied parameter. (b) Averaged data for the analysis of 6 individual plants. Each point corresponds to an individual plant. Data are presented as medians and percentiles of 10, 25, 75, and 90%. The small squares inside the box correspond to the arithmetic mean values. *—p < 0.05 by the Mann–Whitney test.
Inventions 11 00056 g011
Figure 12. Dependence of the fluorescence intensity of the nuclei of the cells of the root meristem of shepherd’s purse on ploidy. (a) Results of comparison of the distribution of cells by the fluorescence intensity of the nuclei in two randomly selected roots (one rootlet—C. bursa-pastoris with ploidy 4n, the other rootlet is C. rubella with ploidy 2n). Each point corresponds to an individual nucleus. Data are presented as medians and percentiles of 10, 25, 75, and 90%. The small squares inside the box correspond to the arithmetic mean values. A total of 50–100 nuclei were analyzed in each sample. The curves on the right demonstrate the shape of the distribution of nuclei by the studied parameter. (b) Averaged data for the analysis of 6 individual plants. Each point corresponds to an individual plant. Data are presented as medians and percentiles of 10, 25, 75, and 90%. The small squares inside the box correspond to the arithmetic mean values. *—p < 0.05 by the Mann–Whitney test.
Inventions 11 00056 g012
Figure 13. Dependence of the nuclear roundness value of the root meristem cells of shepherd’s purse on ploidy. (a) Results of comparison of cell distribution by nuclear roundness index values in two randomly selected roots (one rootlet—C. bursa-pastoris with ploidy 4n, the other rootlet is C. rubella with ploidy 2n). Each point corresponds to an individual nucleus. Data are presented as medians and percentiles of 10, 25, 75, and 90%. The small squares inside the box correspond to the arithmetic mean values. A total of 50–100 nuclei were analyzed in each sample. The curves on the right demonstrate the shape of the distribution of nuclei by the studied parameter. (b) Averaged data for the analysis of 6 individual plants. Each point corresponds to an individual plant. Data are presented as medians and percentiles of 10, 25, 75, and 90%. The small squares inside the box correspond to the arithmetic mean values.
Inventions 11 00056 g013
Figure 14. Dependence of the nuclear circularity index of the root meristem cells of shepherd’s purse on ploidy. (a) Results of comparison of cell distribution by nuclear circularity index values in two randomly selected roots (one rootlet—C. bursa-pastoris with ploidy 4n, the other rootlet is C. rubella with ploidy 2n). Each point corresponds to an individual nucleus. Data are presented as medians and percentiles of 10, 25, 75, and 90%. The small squares inside the box correspond to the arithmetic mean values. A total of 50–100 nuclei were analyzed in each sample. The curves on the right demonstrate the shape of the distribution of nuclei by the studied parameter. (b) Averaged data for the analysis of 6 individual plants. Each point corresponds to an individual plant. Data are presented as medians and percentiles of 10, 25, 75, and 90%. The small squares inside the box correspond to the arithmetic mean values. *—p < 0.05 by the Mann–Whitney test.
Inventions 11 00056 g014
Figure 15. Dependence of the nuclear solidity index value of the root meristem cells of shepherd’s purse on ploidy. (a) Results of comparison of cell distribution by nuclear solidity index values in two randomly selected roots (one rootlet—C. bursa-pastoris with ploidy 4n, the other rootlet is C. rubella with ploidy 2n). Each point corresponds to an individual nucleus. Data are presented as medians and percentiles of 10, 25, 75, and 90%. The small squares inside the box correspond to the arithmetic mean values. A total of 50–100 nuclei were analyzed in each sample. The curves on the right demonstrate the shape of the distribution of nuclei by the studied parameter. (b) Averaged data for the analysis of 6 individual plants. Each point corresponds to an individual plant. Data are presented as medians and percentiles of 10, 25, 75, and 90%. The small squares inside the box correspond to the arithmetic mean values.
Inventions 11 00056 g015
Figure 16. Ploidy estimation by flow cytofluorometry in monocots (a,b) and dicots (c,d): examples of histograms of nuclear distribution by fluorescence intensity (a,b) and averaged data (c,d). Averaged data for the analysis of 6 individual plants. Each point corresponds to an individual plant. Data are presented as medians and percentiles of 10, 25, 75, and 90%. The small squares inside the box correspond to the arithmetic mean values. *—p < 0.05 by the Mann–Whitney test.
Inventions 11 00056 g016
Table 1. Analyzed parameter properties.
No.CharacteristicMethod of DeterminationUnitsNotes
1AreaThe number of pxl2 occupied by the nucleus (ROI).pxl2 or µm2May depend on the amount and/or degree of chromatin packaging in the nucleus.
2Hoechst fluorescence intensityCalculation of the average brightness of all pxl nuclei (ROI). The brightness is proportional to the fluorescence intensity of the Hoechst probe bound to DNA in the nucleus.a. u.It is independent of nuclear geometry. Quantitative assessment of chromatin concentration in the nucleus is possible.
3CircularityComparison of the core shape (ROI) with a perfect circle along the perimeter.Dimensionless quantityHigh sensitivity to unevenness of the object’s surface, including small ones.
4RoundnessComparison of the shape of the nucleus (ROI) with the ideal circle by diameter (Feret Diameter).Dimensionless quantityHigh sensitivity to object elongation. Low sensitivity to object surface roughness.
5SolidityEstimation of the filling of the convex hull of the nucleus (ROI).Dimensionless quantityQuantitative assessment of convexities, concavities, “holes,” and/or complex edge shapes. High sensitivity to surface irregularities and voids within the object.
Table 2. Analyzed parameter examples.
No.FigureCircleSquareThreadRandom Area
1Example of an imageInventions 11 00056 i001Inventions 11 00056 i002Inventions 11 00056 i003Inventions 11 00056 i004
2Circularity1.0000.7850.0010.076
3Roundness1.0001.0000.0060.573
4Solidity1.0001.0000.9970.727
Table 3. Main characteristics of methods for automated assessment of plant ploidy.
No.CharacteristicMethod
Flow CytofluorometryClassical Optical (Fluorescence) MicroscopyFluorescence Microscopy with Automated Analysis
1Number of cells analyzed in one sample105–106102–103102–105
2The principle of ploidy determinationIndirect
(based on the fluorescence intensity of DNA-binding probes)
Direct
(counting chromosomes in each cell)
Indirect (based on fluorescence of DNA-binding probes)
3Time to complete the analysis of one sampleSeconds-minutesTens of minutesSeconds-minutes
4Ploidy estimation error in monocots 17%N/A 213%
5Ploidy estimation error in dicots11%N/A6%
6Evaluation of the shape and topology of the core- 3++
7Estimating the nucleus area-- (rarely indirectly)+
8Required degree of tissue dissociationComplete dissociation of cellulose into single cellsLight maceration with acetic acidLight maceration with acetic acid
9Possibility of storing samples before measurement-++
10Price of analysis software100–1000 USDFreely distributable softwareFreely distributable software
11Requirements for personnel qualifications during analysisMedium or highHighLow-medium
12Equipment price>10,000 USD>1000 USD100–1000 USD
1 The characteristic is calculated based on the Hoechst fluorescence intensity. 2 The measurements were not performed due to the large number of chromosomes for wheat and the small size of nuclei for Capsella. 3 The symbols “-”or “+” indicate the absence or presence of the possibility of studying the specified parameter, respectively.
Disclaimer/Publisher’s Note: The statements, opinions and data contained in all publications are solely those of the individual author(s) and contributor(s) and not of MDPI and/or the editor(s). MDPI and/or the editor(s) disclaim responsibility for any injury to people or property resulting from any ideas, methods, instructions or products referred to in the content.