
Article

A Study on the Impact of Ice-Covered Pantograph–Catenary Arc Characteristics and Ablation Mechanisms

1
China Academy of Railway Sciences Corporation Limited, Beijing 100081, China
2
School of Electrical Engineering, Southwest Jiaotong University, Chengdu 611756, China
*
Author to whom correspondence should be addressed.
Inventions 2026, 11(2), 32; https://doi.org/10.3390/inventions11020032
Submission received: 26 January 2026 / Revised: 23 February 2026 / Accepted: 23 March 2026 / Published: 25 March 2026

Abstract

Under severe ice and snow weather, ice-covered pantograph–catenary arcs affect the safe operation of high-speed trains. This study investigates the impact of ice-covered arc electrical characteristics, plasma parameters, and material ablation mechanisms. By constructing a comprehensive pantograph–catenary icing experimental platform, arc voltage, current signals, high-speed dynamic images, and emission spectra were synchronously collected under different icing thicknesses ranging from 0 to 15 mm. Research indicates that ice coverture causes frequent “extinction–reignition” phenomena during the arc initiation stage due to the latent heat absorbed by melting ice, significantly reducing the initial stability of arc combustion. Spectral analysis confirms that the arc excitation temperature and energy density are positively correlated with the concentration of hydrogen ions produced by water vapor ionization, reaching a peak under the 5 mm icing condition. Experimental results show that the average energy density of ice-covered arcs is approximately double that of the non-iced condition, causing the ablation pits on the carbon strip to exhibit characteristics of greater depth and wider copper deposition zones. This study reveals the unique mechanisms and damage characteristics of icing pantograph–catenary arcs, providing an important basis for the safe design and maintenance of pantograph–catenary systems in high-cold railway environments.

1. Introduction

In electrified railways, the pantograph–catenary system consisting of the catenary and the pantograph performs the critical task of providing a stable power supply for trains, and its current-collection quality directly affects the reliability and stability of train operations [1,2,3]. With the expansion of railway networks and the increasing complexity of operating environments, catenary icing has become one of the key factors restricting the performance of the pantograph–catenary system. Under meteorological conditions such as low temperature and high humidity, ice easily forms on the surface of the catenary, leading to significant changes in the geometric morphology and physical properties of the contact wire. Such changes exacerbate pantograph–catenary vibration [4], which in turn leads to an increase in the frequency of pantograph–catenary separation and the enlargement of separation gaps, thereby inducing frequent pantograph–catenary arcs. Compared to arcs without ice-covered conditions, the burning process of icing arcs is affected by multiple factors such as ice phase transitions and water vapor ionization. Its characteristics are more complex, and there are significant differences in the ablation mechanisms of the carbon strip and the contact wire [5,6].
At present, scholars both domestically and internationally have conducted extensive research on pantograph–catenary arcs. Research in this field is primarily categorized into experimental and simulation studies. In the early stages, researchers mainly focused on the characteristics of arcs under conventional conditions. On the experimental side, studies based on high-speed photography have explored the dynamic morphology of pantograph–catenary arcs and the evolution patterns of current and voltage [7]. While these investigations provided fundamental insights into arc behavior under normal operation, they did not consider the influence of ice, which fundamentally alters the arc initiation and combustion processes due to phase change and water vapor involvement. On the simulation side, magnetohydrodynamic (MHD) models have been established and optimized to investigate the evolution patterns of arcs, the dynamic characteristics during the pantograph lowering process, and to simulate arcs in a shielded environment using a dedicated test platform, thereby analyzing their electromagnetic radiation and sliding electrical contact properties [8,9,10,11,12,13,14]. Although these models successfully reproduced many features of arcs in air, they lack the capability to account for ice melting, water vapor ionization, and the associated energy exchange, leaving the behavior of ice-covered arcs unexplored. Furthermore, some scholars have begun to focus on arc characteristics in unconventional environments. In experimental studies, researchers established a self-built experimental platform with a specific environment to investigate arc characteristics under low-vacuum, high-humidity and different gas environment conditions [15,16]. Some researchers investigated the motion characteristics and internal mechanisms of pantograph–catenary arcs under low air pressure and strong airflow conditions [17]. These studies extended the understanding of arcs to non-standard conditions, yet none considered the presence of ice on the contact wire. The introduction of ice not only adds moisture to the arc gap but also introduces a dynamic phase-change process that significantly affects arc stability and energy distribution. In simulation studies, researchers established an MHD model to investigate the dynamic characteristics of pantograph–catenary arcing under the influence of crosswinds and input currents [18]. Some researchers proposed an electrical model to evaluate how train speed influences the characteristics of pantograph arcing and its impact on the traction power system [19,20]. Again, these works assumed dry contact conditions and did not address the unique challenges posed by ice accumulation. However, existing research primarily focuses on normal operating conditions, and systematic studies targeting the special environment of icing remain relatively scarce. A review of the literature reveals that although various environmental factors (such as low pressure, humidity, and airflow) have been investigated in the context of pantograph–catenary systems, the specific condition of ice-covered catenary has been overlooked. Moreover, compared with studies that treat the arc medium as a gaseous homogeneous phase, ice-covered conditions introduce a fundamentally different physical scenario involving a solid–liquid–gas–plasma multiphase transformation process. Consequently, there is currently no experimental data or theoretical guidance available to support the design, maintenance, and condition monitoring of pantograph–catenary systems operating in cold regions, which poses significant risks to railway safety under ice and snow conditions.
Regarding the research gaps, this study investigates the characteristics and material ablation mechanisms of pantograph–catenary arcs under icing conditions. A comprehensive experimental platform was constructed to simulate the separation and arcing process, utilizing copper contact wire specimens with adjustable ice thicknesses. By integrating high-speed photography, synchronous acquisition of voltage and current signals, and emission spectroscopy, this study systematically analyzes the arc extinction phenomena and the evolution of plasma parameters. Furthermore, the research quantifies arc energy density and explores the microscopic damage inflicted on carbon strips, including ablation pit morphology and the underlying causes of copper deposition.

2. Materials and Methods

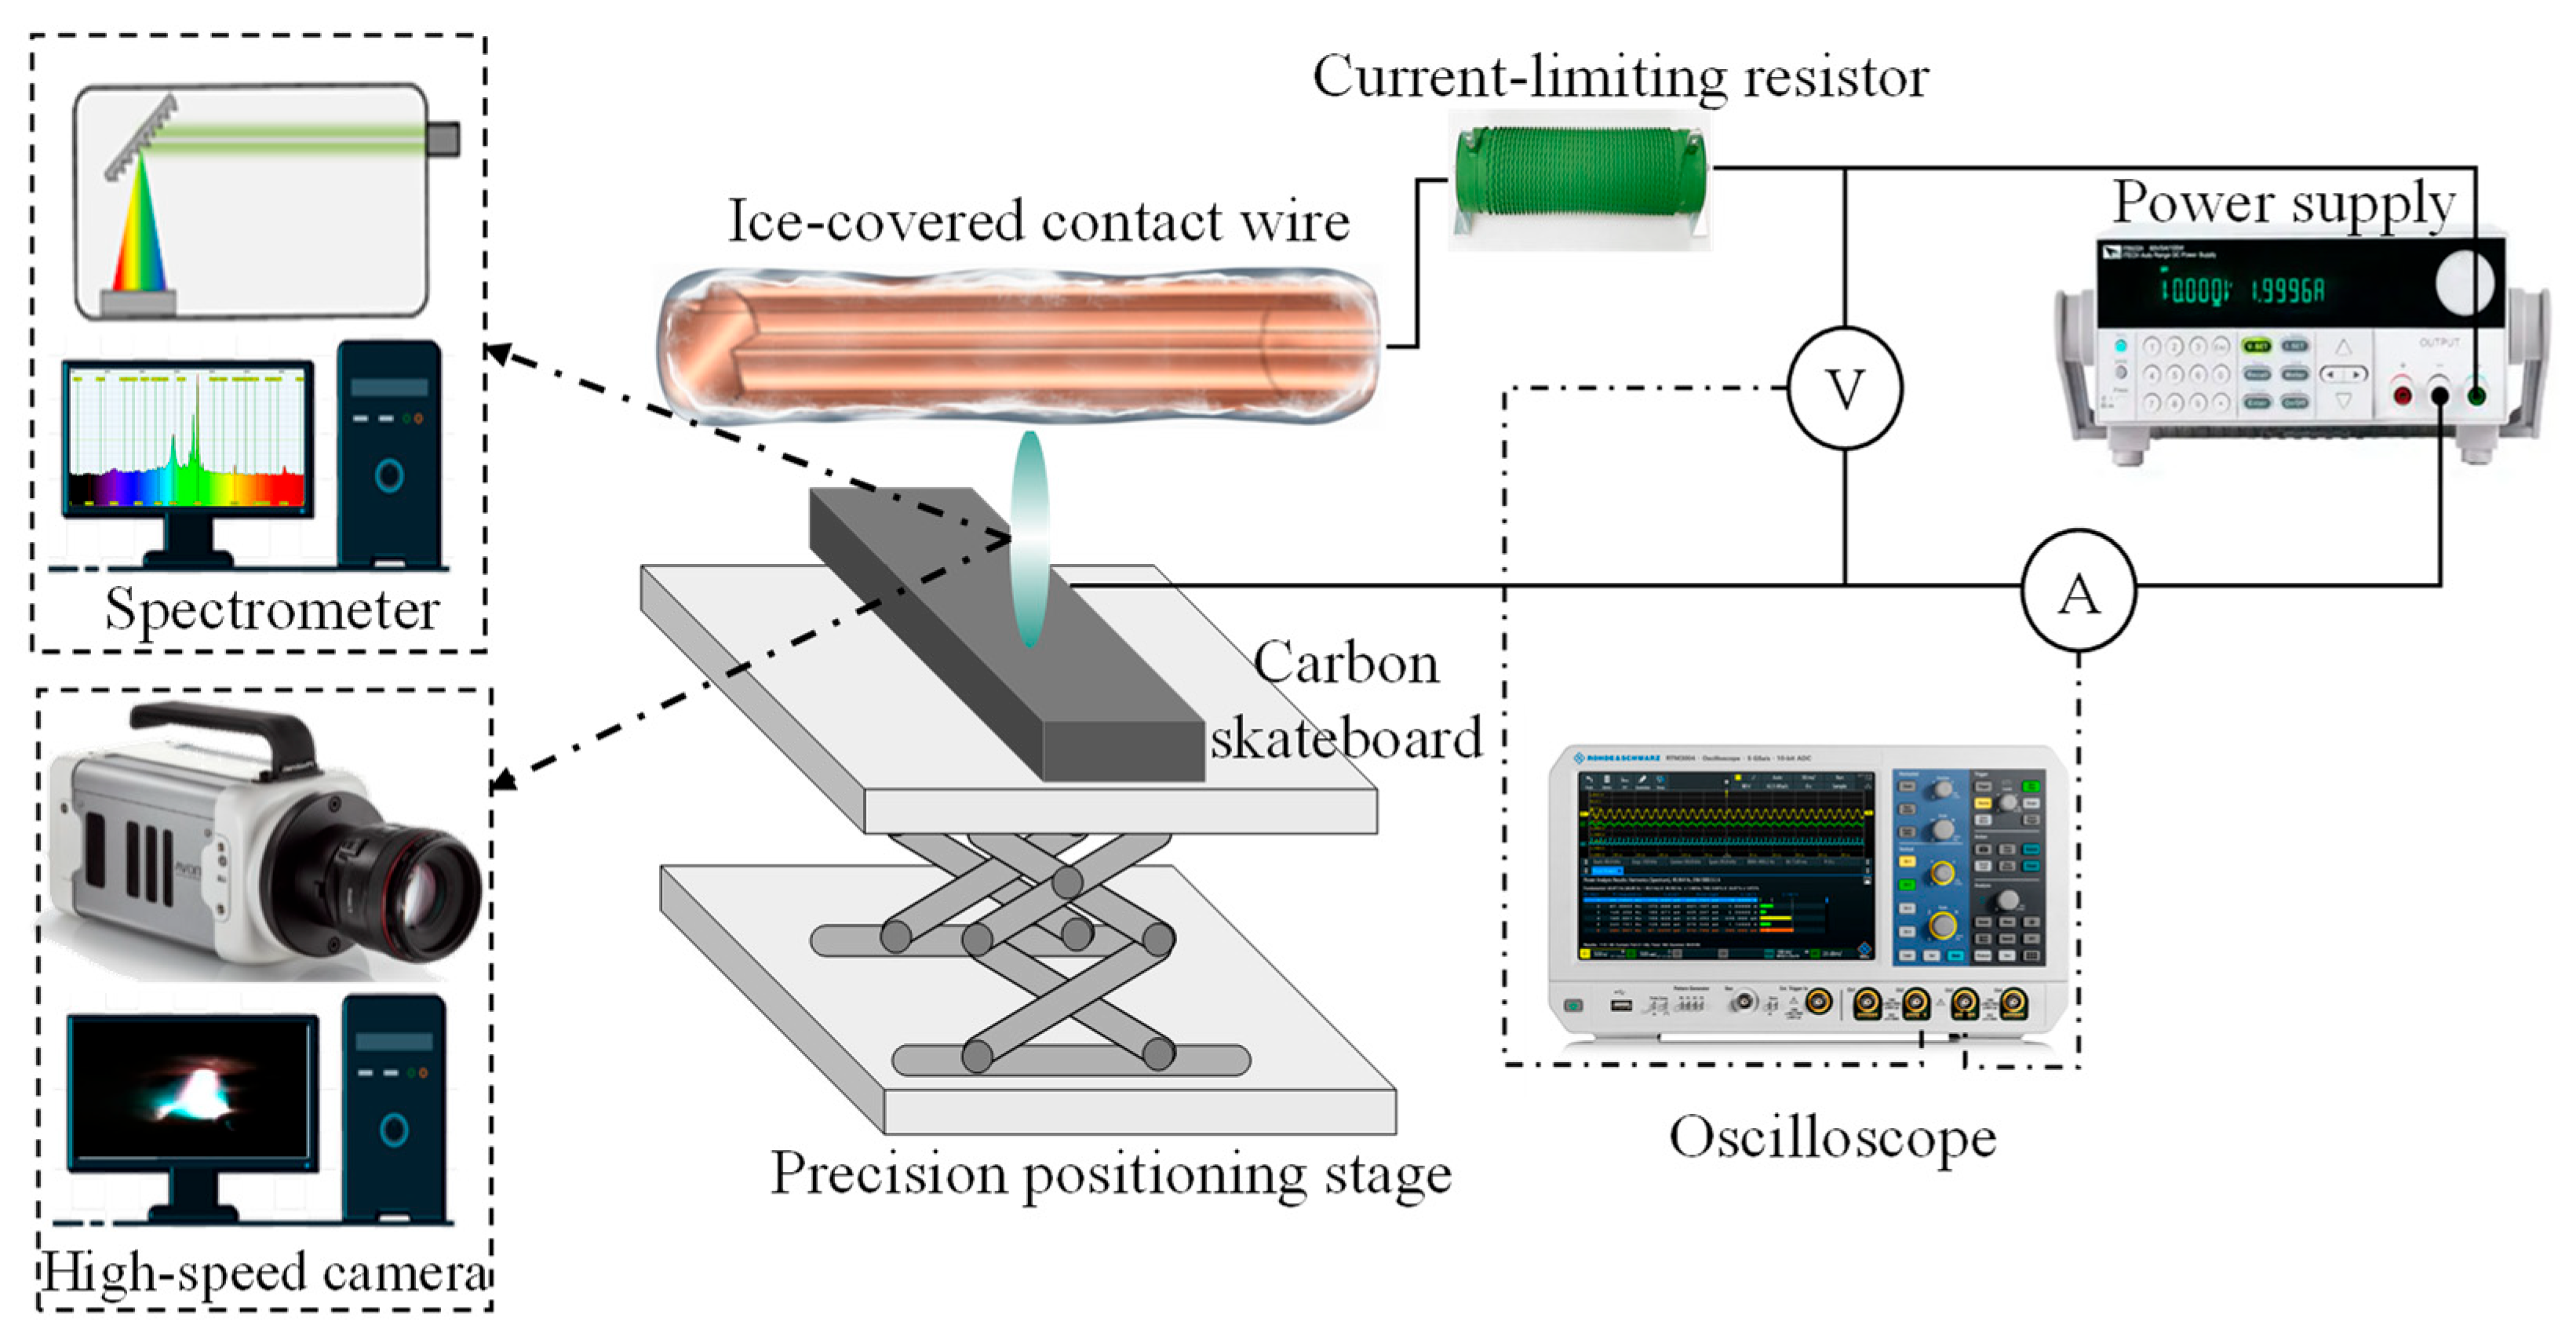
This study constructed a comprehensive experimental platform dedicated to simulating the separation and arcing process of the pantograph–catenary system under icing conditions, as shown in Figure 1.
To prepare an ice layer with controllable thickness, stable physical properties, and good repeatability on the surface of the contact wire specimens, a systematic icing method was adopted. First, the copper contact wire specimens were placed into a series of cylindrical molds with different base radii. Subsequently, an appropriate amount of rainwater was injected into the molds to ensure that the frozen ice layer possessed insulation properties closest to actual operating conditions, thereby avoiding interference from other factors on the arc characteristics. Finally, the assembled molds were placed as a whole into a constant temperature chamber at −20 °C for continuous low-temperature freezing, resulting in the formation of a dense simulated ice layer with precisely adjustable thickness on the outer surface of the copper rods. The ice-covered copper contact wire was precisely aligned with the carbon strip and maintained in stable contact under a contact pressure of 90 N. A linear motion control mechanism driven by a high-precision servo motor was configured within the experimental chamber to carry the carbon strip specimen, enabling the precise regulation of key parameters such as motion speed, separation distance, and contact pressure through programmed control. Subsequently, under the condition that the constant current power supply with a maximum output voltage of 65 V stably outputs 55 A current, the motor is controlled to separate the ice-covered copper wire and carbon ribbon at a speed of 50 mm/s, thereby generating an electric arc.
To achieve comprehensive monitoring of arc characteristics, a high-voltage differential probe and a precision current clamp were connected in parallel to the main circuit for the synchronous acquisition and transient recording of arc voltage and current signals. The high-voltage differential probe features a bandwidth of 100 MHz and a measurement range of ±1000 V. The precision current clamp has a bandwidth of 100 kHz, a measurement range of 0–100 A, and an output sensitivity of 0.1 V/A. Regarding the spatial evolution characteristics of the arc, the platform was equipped with an advanced high-speed camera system. Its acquisition capability of 6400 frames per second can clearly capture the dynamic images of the entire process, including arc generation, extension, oscillation, and extinction. Meanwhile, the emission spectrum data of the arc plasma were collected in real-time through optical fiber probes and a high-resolution spectrometer, which covers a wavelength range of 200–900 nm with a spectral resolution of 0.1 nm and is positioned near the arc channel [21,22,23,24,25,26]. These data provide support for analyzing critical parameters such as optical radiation intensity and spectral line features, thereby deeply revealing the energy distribution and physical properties within the arc.

3. Results and Discussion

3.1. Analysis of Voltage, Current, and Duration of Icing Arcs

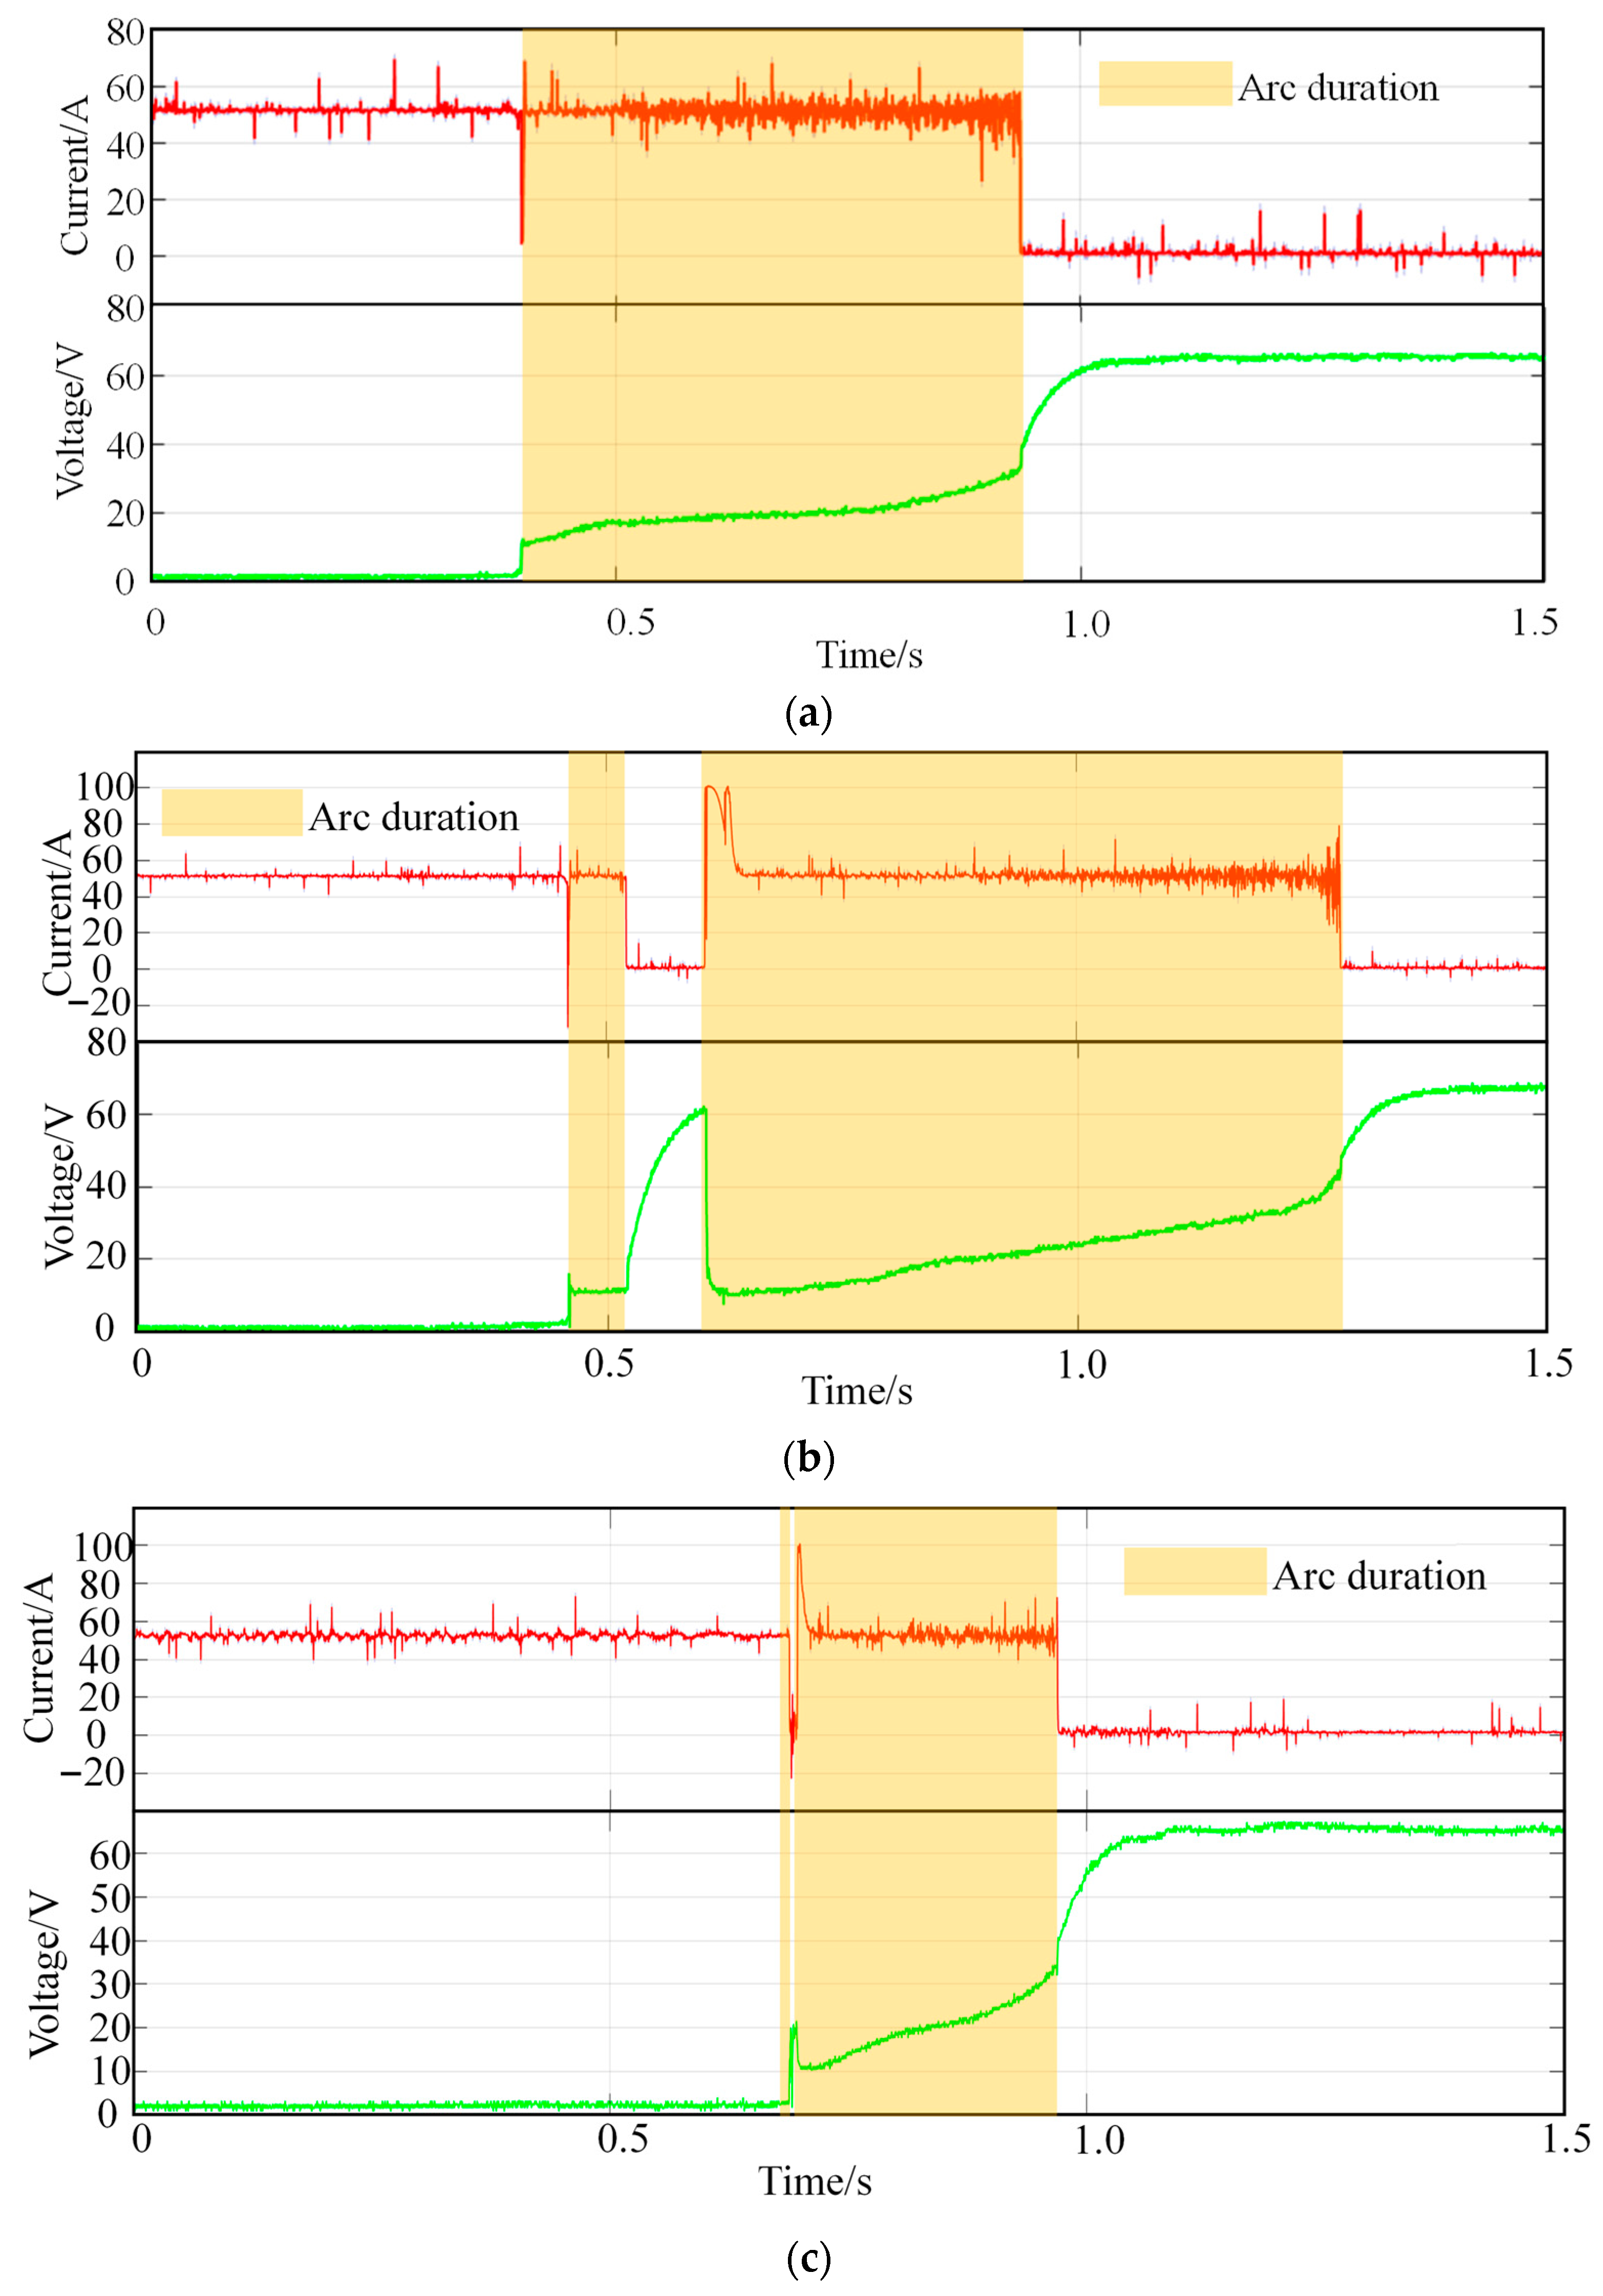
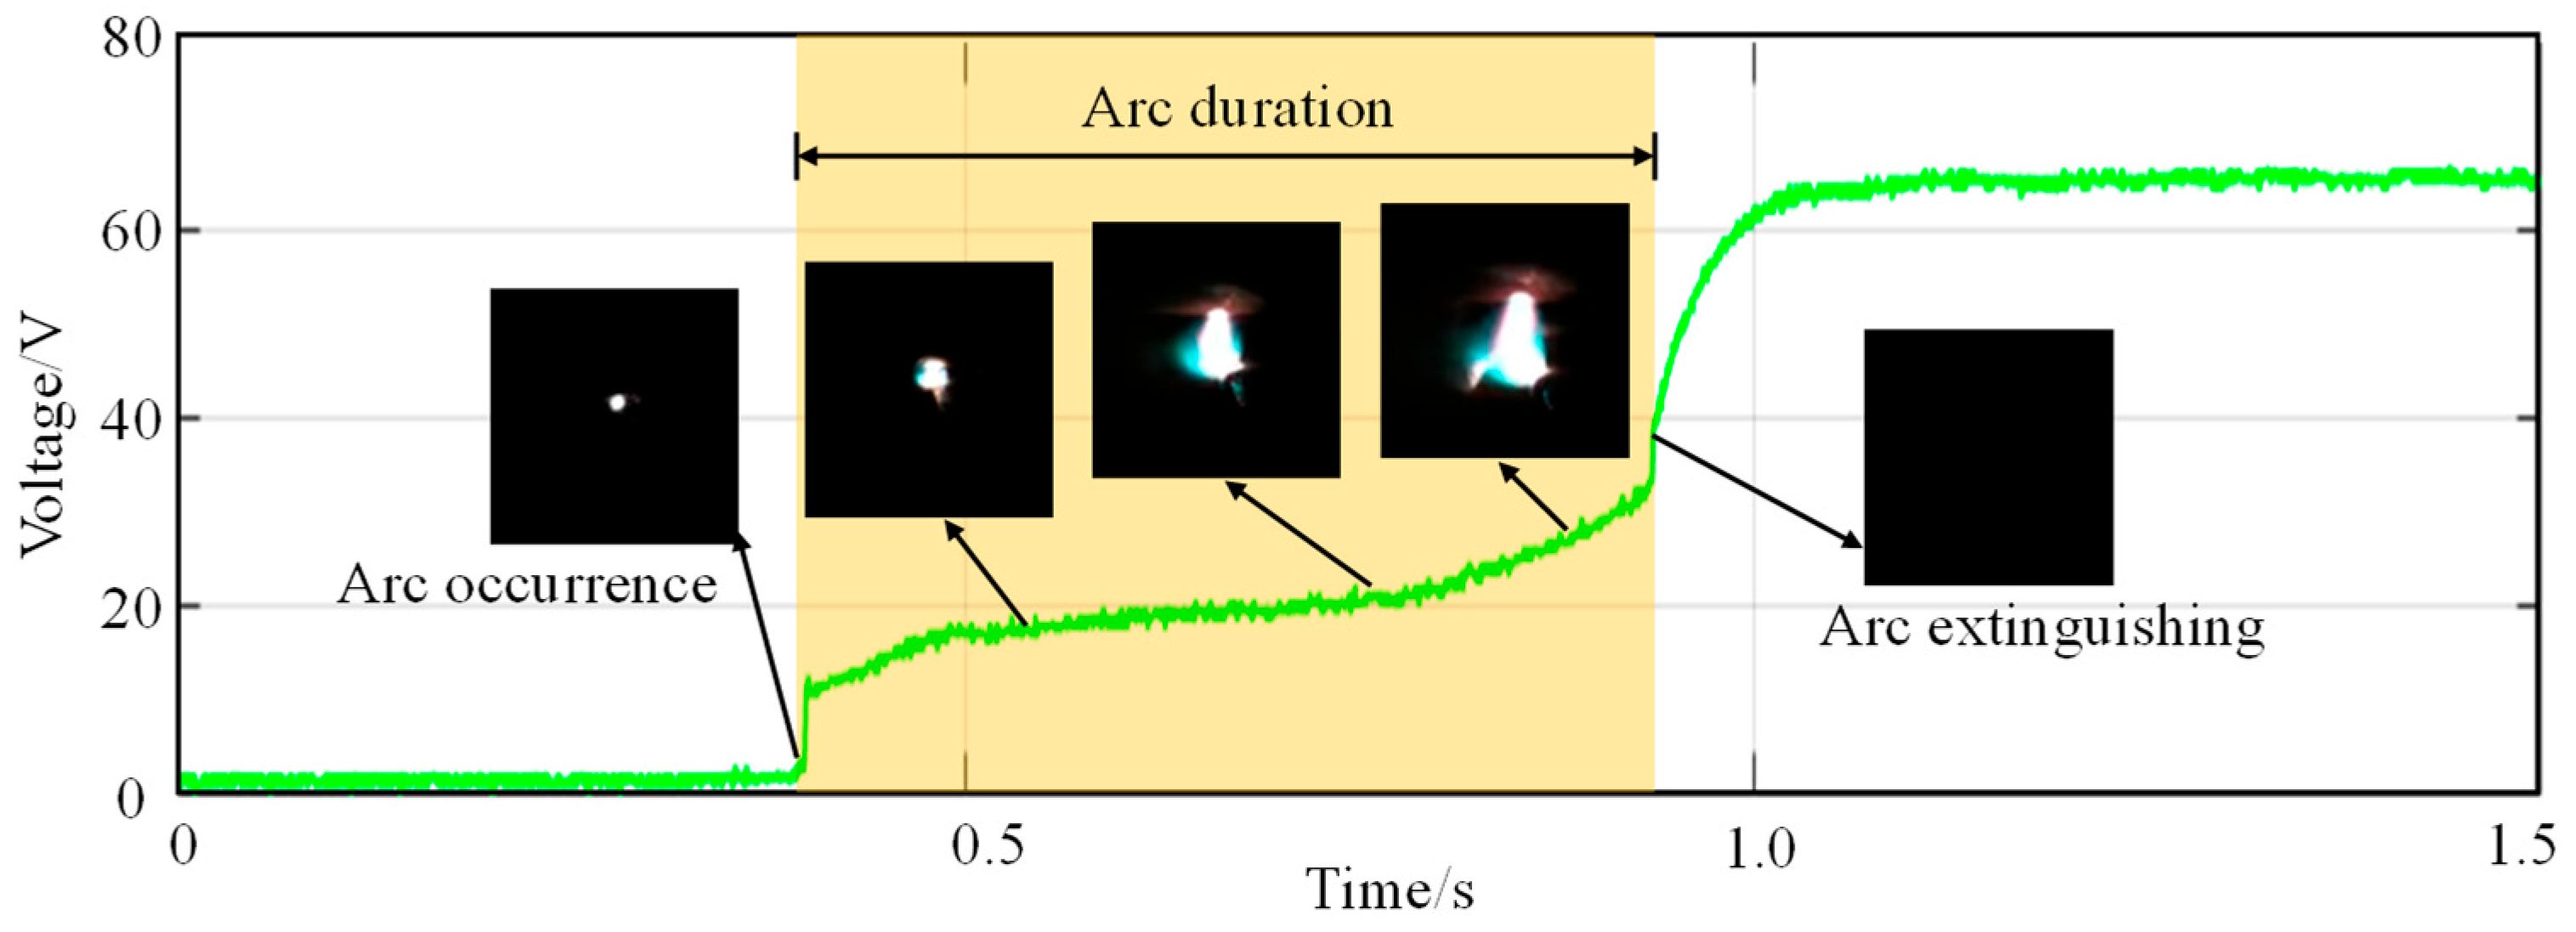
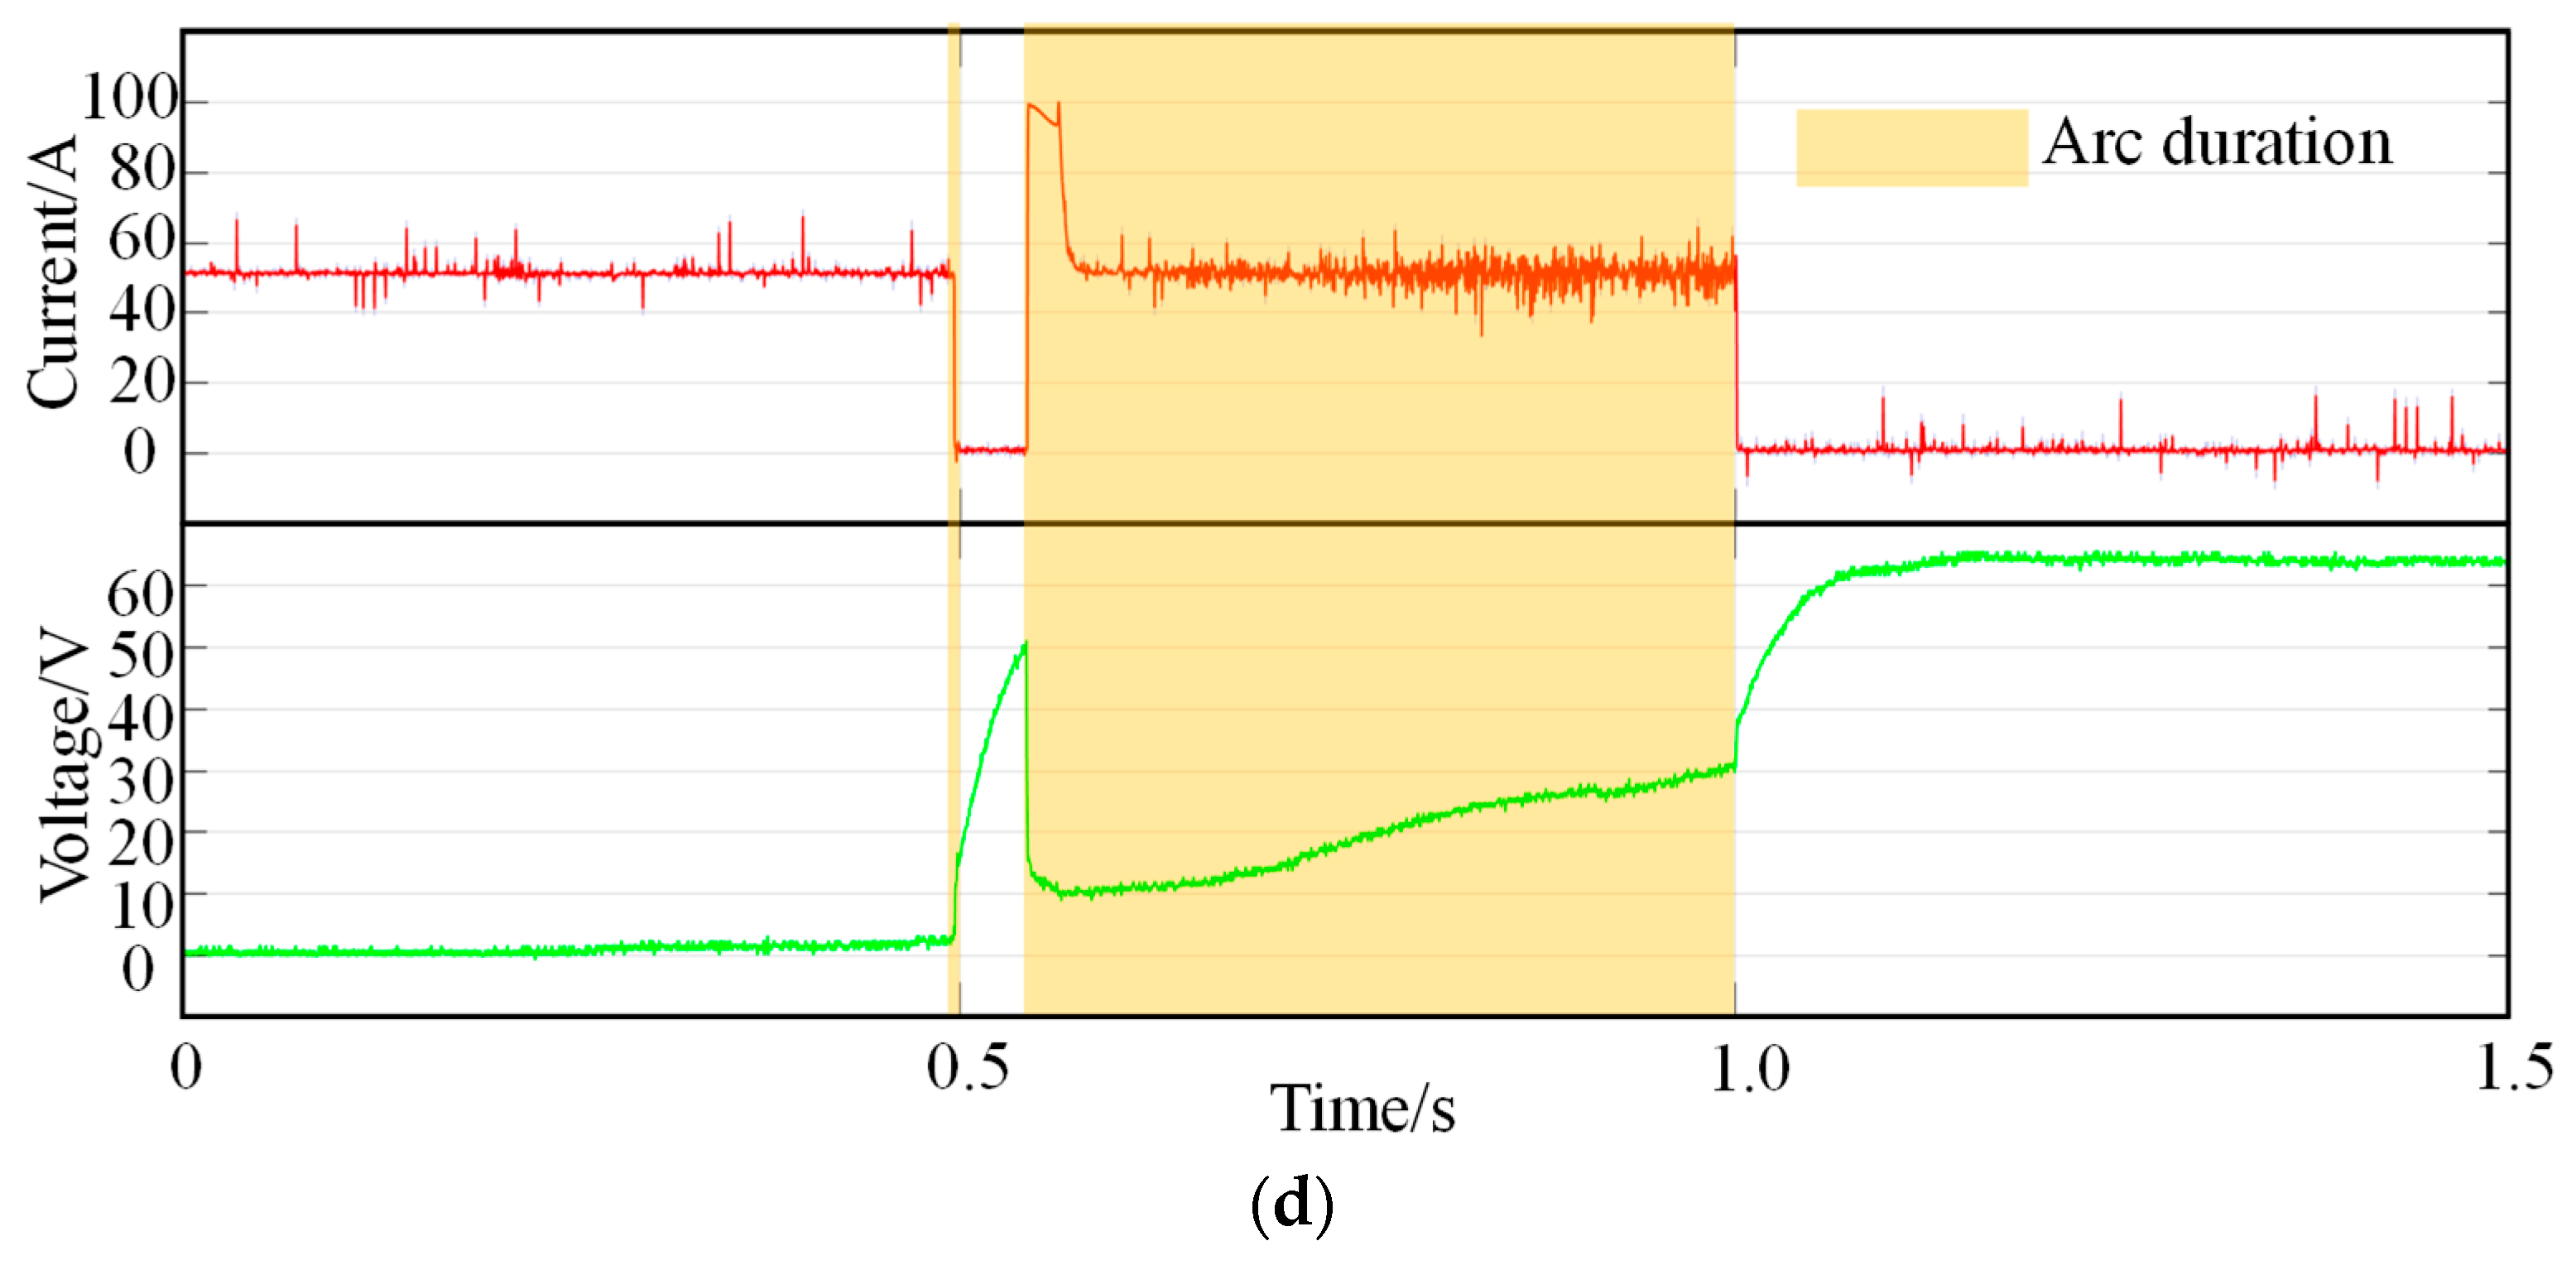
The arc voltage and current waveforms directly reflect the electrical behavior of the arc during its initiation, combustion, and extinction stages. To accurately correlate these electrical signals with the physical evolution of the arc, the high-speed camera system (with an acquisition rate of 6400 frames per second) was synchronized with the high-voltage differential probe and precision current clamp for simultaneous data collection. High-speed dynamic imaging can clearly capture the entire process of an arc from ignition to extinction, enabling direct and intuitive determination of the arc duration. These critical time points are correspondingly marked on the voltage and current waveforms as shown in Figure 2, which not only verifies the duration derived from electrical signal analysis but also facilitates precise alignment between the variations in electrical parameters and the arc’s physical processes during subsequent analysis. As shown in Figure 3, under different ice thickness conditions (0 mm, 5 mm, 10 mm, 15 mm), the voltage and current waveforms exhibit distinct variation patterns.
Overall, under different ice thickness conditions (0 mm, 5 mm, 10 mm, 15 mm), the arc voltage and current waveforms follow a consistent basic variation law while showing significant differences in key parameters. In terms of voltage performance, all cases exhibit an abrupt surge at the arc initiation stage, followed by a slow rise to a stable range of 35–45 V as the arc elongates, and finally a rapid recovery to 65 V when the arc is extinguished. However, it should be noted that under ice-covered conditions, the voltage behavior deviates from this typical pattern. As shown in Figure 3, after arc extinction, the voltage does not instantaneously return to the open-circuit value of 65 V but rises gradually. This is because a thin water film formed from the melting ice layer remains on the electrode surfaces, bridging the gap and providing a residual conductive path. This film allows a small leakage current to flow, keeping the voltage below 65 V until the film evaporates or breaks down, at which point the voltage finally reaches 65 V. For current behavior, during the entire arc duration, the current no longer maintains a steady state but presents significantly stronger fluctuations with increased harmonic components, and it plummets sharply to zero instantaneously at the moment of arc extinction. For without ice-covered and ice-covered arcs, the entire combustion process of without ice-covered arcs is relatively stable, while ice-covered arcs always experience arc extinction and reignition during the initiation stage. This is because the melting of the ice layer absorbs heat, causing the arc to extinguish, and then the gap is re-broken down, leading to arc reignition.
In summary, ice coverage significantly alters the electrical behavior of pantograph–catenary arcs, introducing extinction–reignition instability during initiation and a gradual voltage recovery after extinction due to the residual water film from ice melting.

3.2. Theory and Characteristic Analysis of Arc Spectra

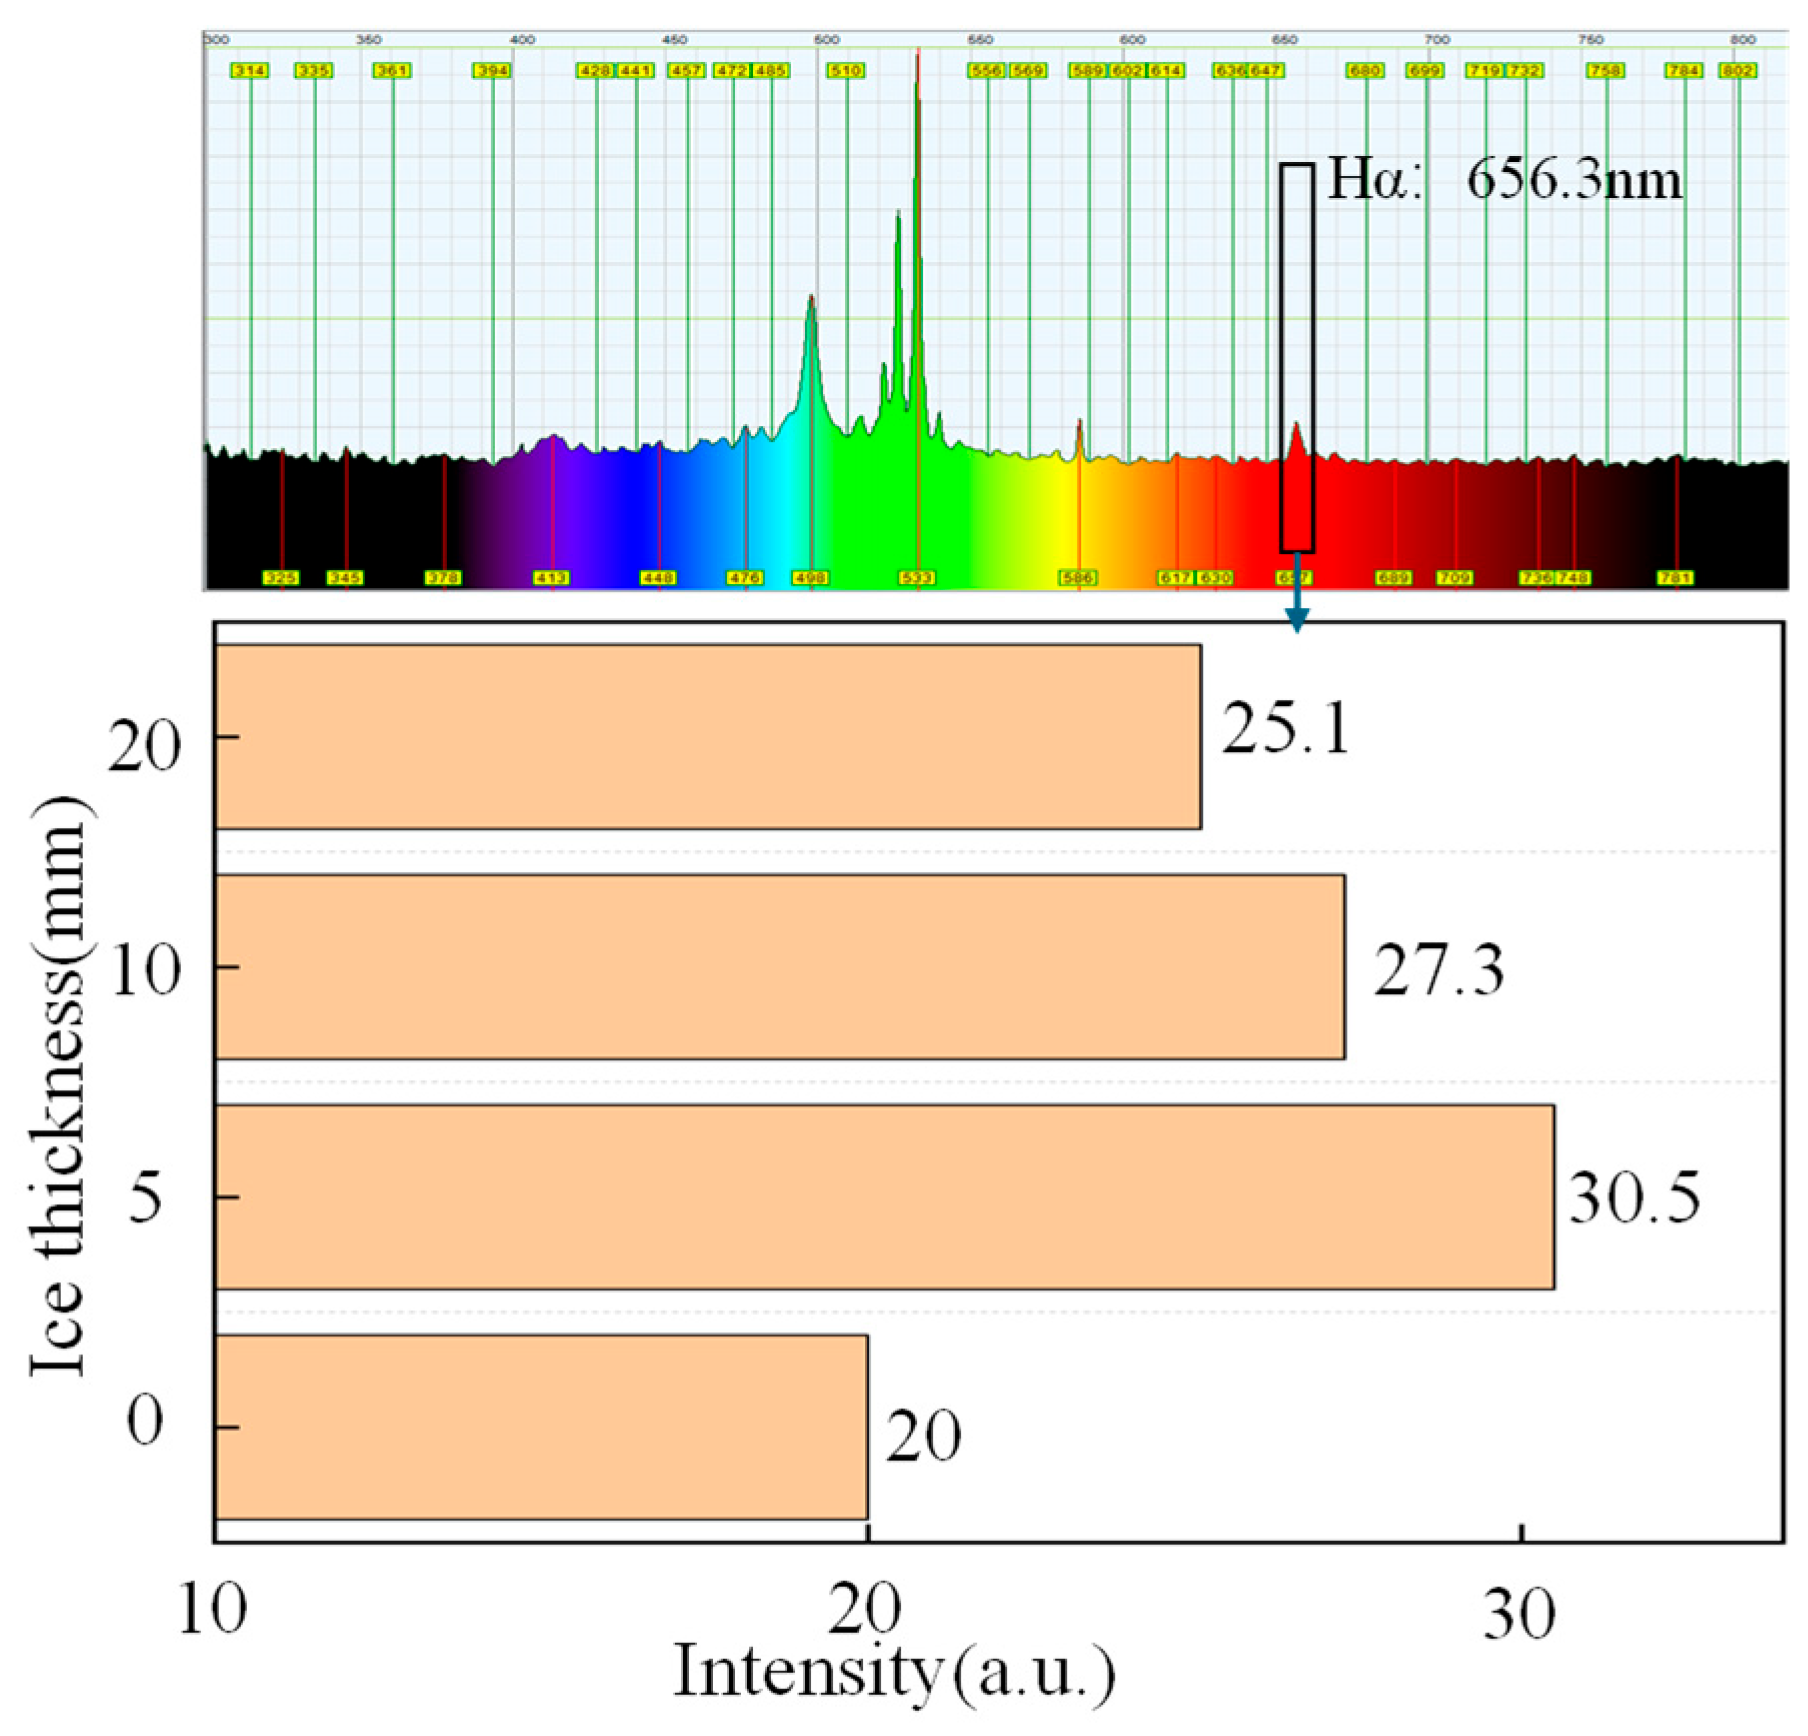
Spectral analysis plays a crucial role in this study. Currently, it is a research method capable of non-intrusive, in situ diagnostics of high-temperature arc plasma. This technological advantage allows us to accurately obtain key state parameters, such as internal particle composition and plasma temperature, without disturbing the arc combustion state. Through spectroscopic analysis, this study found that the intensity of the characteristic spectral lines of hydrogen atoms exhibits systematic variations with the increase in icing thickness along the contact line. Due to the highest spectral line generation efficiency of Hα, its variation is the most pronounced under different working conditions. Therefore, Hα was selected as the subject of this research. Under 5 mm ice-covered, the spectral line intensity of Hα reached its highest value of 30.5. As shown in Figure 4, as the icing thickness increased, the spectral line intensity decreased, dropping to its lowest value of 25.1 at 15 mm ice-covered. However, under 0 mm ice-covered conditions, the spectral line intensity of Hα was only 20. This is because the high temperature of the arc sublimates the ice or first melts and then vaporizes it into water vapor. The arc gas is filled with water vapor, and the neutral water vapor molecules are not simply a cooling medium within the high-temperature arc. Under the ultra-high-temperature environment of the arc, water vapor molecules are dissociated and ionized, efficiently producing a large number of highly mobile hydrogen ions and free electrons.
To quantitatively analyze the energy state of the ice-covered arc plasma, this study employed the Boltzmann plot method to calculate its excitation temperature. The principle of this method is based on a definitive functional relationship between the relative intensities of atomic spectral lines at different excitation energy levels and the excitation temperature of the plasma. Specifically, six characteristic spectral lines of hydrogen atoms were selected from the experimentally collected spectral data. Key parameters for these lines—including their specific wavelengths (λ), transition probabilities (Aki), and upper-level energies (Ek)—were sourced from the National Institute of Standards and Technology (NIST) Atomic Spectra Database, as listed in Table 1 [27]. These parameters were then substituted into Equation (1) for linear fitting [15].
ln I λ g A = 1 k B T E + ln h c n Z
In the equation, I represents the spectral line intensity, kB represents the Boltzmann constant, T denotes the plasma temperature, n is the number density of neutral particles in the plasma, A is the transition probability, h is Planck’s constant (6.63 × 10⁻³⁴ J·s), g is the statistical weight of the upper energy level, Z is the atomic partition function, and E is the excitation energy of the higher energy state. The excitation temperature T can be calculated using data from at least two spectral lines. In this study, six spectral lines were used, and the data from the table were substituted into Equation (1) to fit the plasma excitation temperature T .
It was finally concluded that under these experimental conditions, the excitation temperature of the arc plasma without ice coating was approximately 3667 K, and the excitation temperatures of the arc plasma with 5 mm, 10 mm, and 15 mm ice coating were 4213 K, 4097 K, and 3995 K, respectively. From this, it can be concluded that the temperature of the electric arc is positively correlated with the concentration of hydrogen ions.
These spectral results demonstrate that the presence of ice introduces hydrogen ions into the arc plasma, and the Hα line intensity serves as an effective indicator for evaluating arc energy under different icing conditions.

3.3. Analysis of Arc Energy and Ablation Mechanisms

The characteristics of arc energy density and its evolution patterns are essential prerequisites for revealing the ablation mechanisms of carbon sliders. In this section, based on the experimental results of arc power, energy density, and the characterization of material ablation, we systematically analyze the influence of icing conditions on arc energy and ablation mechanisms. Furthermore, the ablation mechanism of the icing arc is explored in depth.
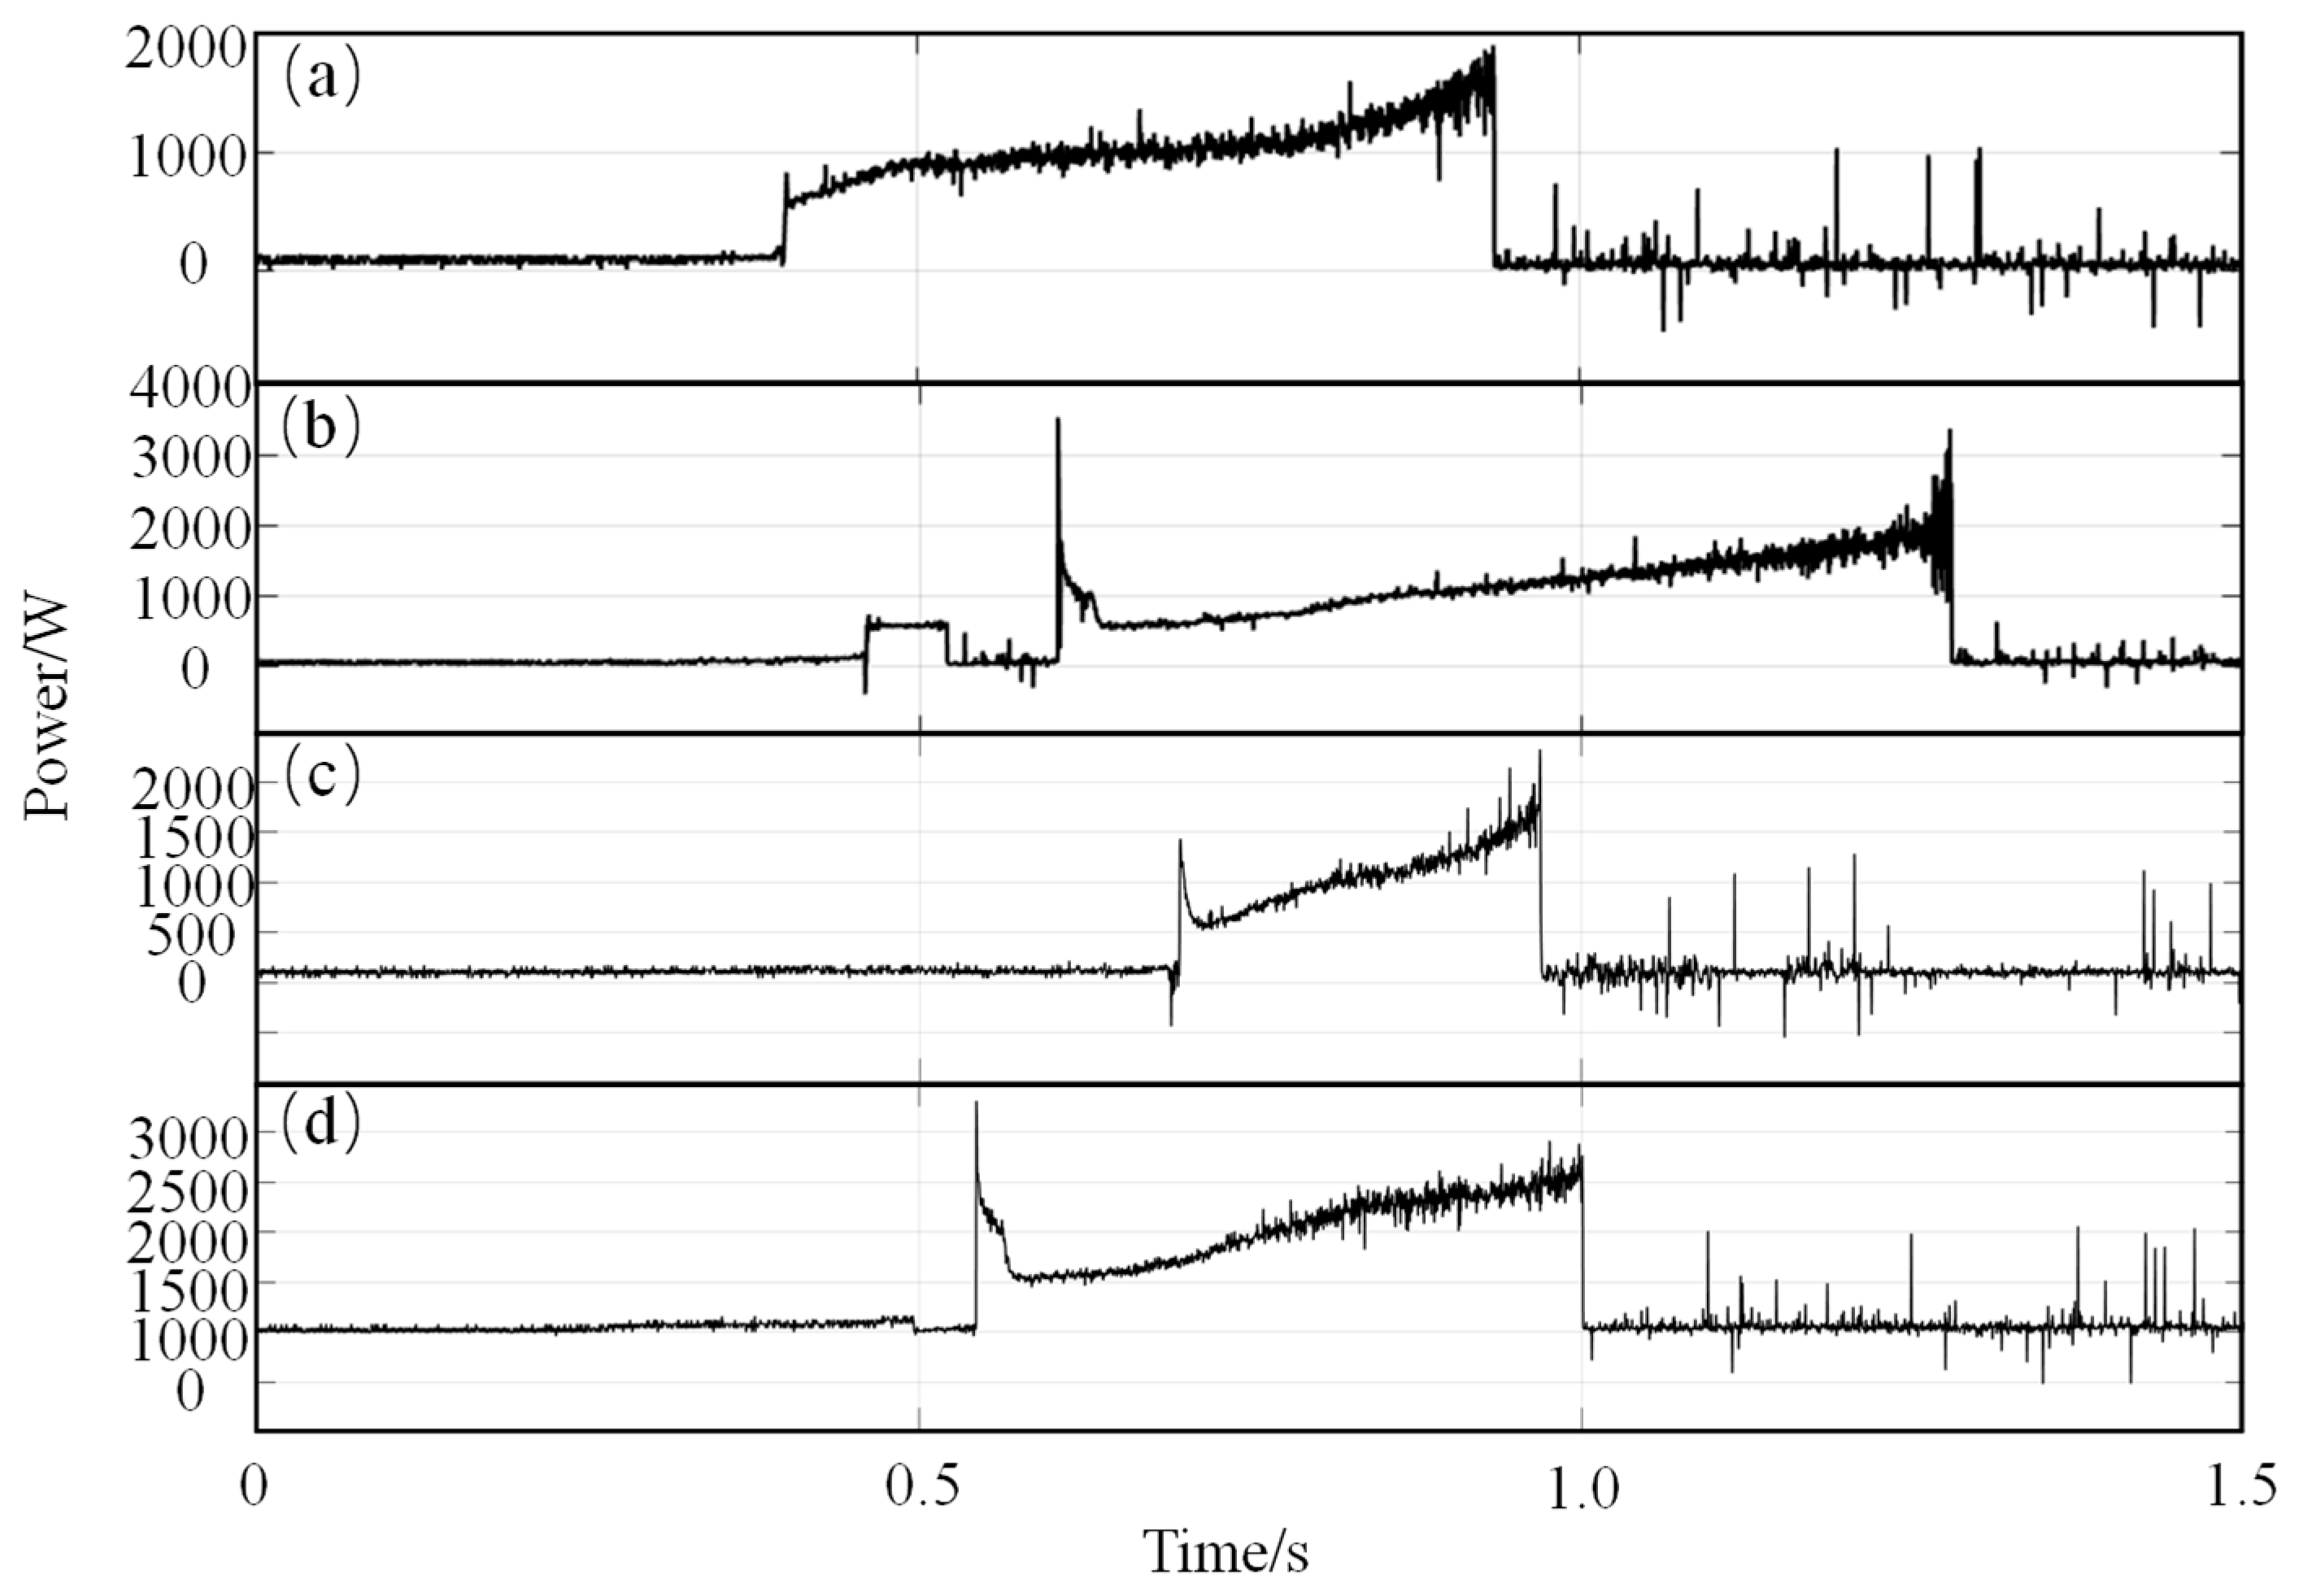
Arc power, as an instantaneous characterization parameter of energy release, has temporal evolution characteristics that directly reflect the stability of arc combustion. As shown in Figure 5, the arc power waveforms exhibit significant differences under different icing thicknesses (0 mm, 5 mm, 10 mm, and 15 mm). Under the without ice-covered condition, the arc power waveform is generally stable; although minor fluctuations exist, there are no obvious mutations or interruptions. This indicates that the arc combustion process is continuous and stable, with a uniform release of energy. Under ice-covered conditions (5–15 mm), the power waveforms are characterized by significant pulsed fluctuations. Abrupt power oscillations during the initiation phase align with the extinction–reignition cycles of the ice-covered arc. Specifically, latent heat absorption during ice melting causes transient arc extinction and a corresponding power nadir; subsequent gap breakdown facilitates reignition, driving power back to peak levels and generating distinct energy pulses.
Arc energy density (energy input per unit area) is a key determinant of material erosion, calculated as the ratio of arc energy to the arc action area. First, the arc power is calculated from the product of current and voltage, expressed by the formula
P t i = U t i I t i
where U t i and I t i are the instantaneous voltage and current at the i-th sampling point, respectively.
The arc energy is the integral of power over time, and the calculation formula is as follows:
E arc = t 0 t 1 P ( t ) d t
where P ( t ) is the instantaneous arc power, t 0 is the moment of arc initiation, and t 1 is the moment of arc extinction.
In this experiment, the current and voltage data are acquired discretely; therefore, the arc energy is calculated using the discrete form of the integral, as shown in the following formula:
E a r c Δ t i = 0 n P ( t )
where P ( t ) is the instantaneous arc power and Δ t is the sampling time interval.
The arc energy density is defined as the ratio of the total arc energy to the arc action area, as expressed by the following formula:
q arc = E arc S
where q arc is the arc energy density, E arc is the total arc energy, and S is the arc action area.
By substituting Equations (2) and (4) into (5), the calculation formula for arc energy density can be obtained as follows:
q arc = [ Δ t i = 0 n U   t i I t i ] / S
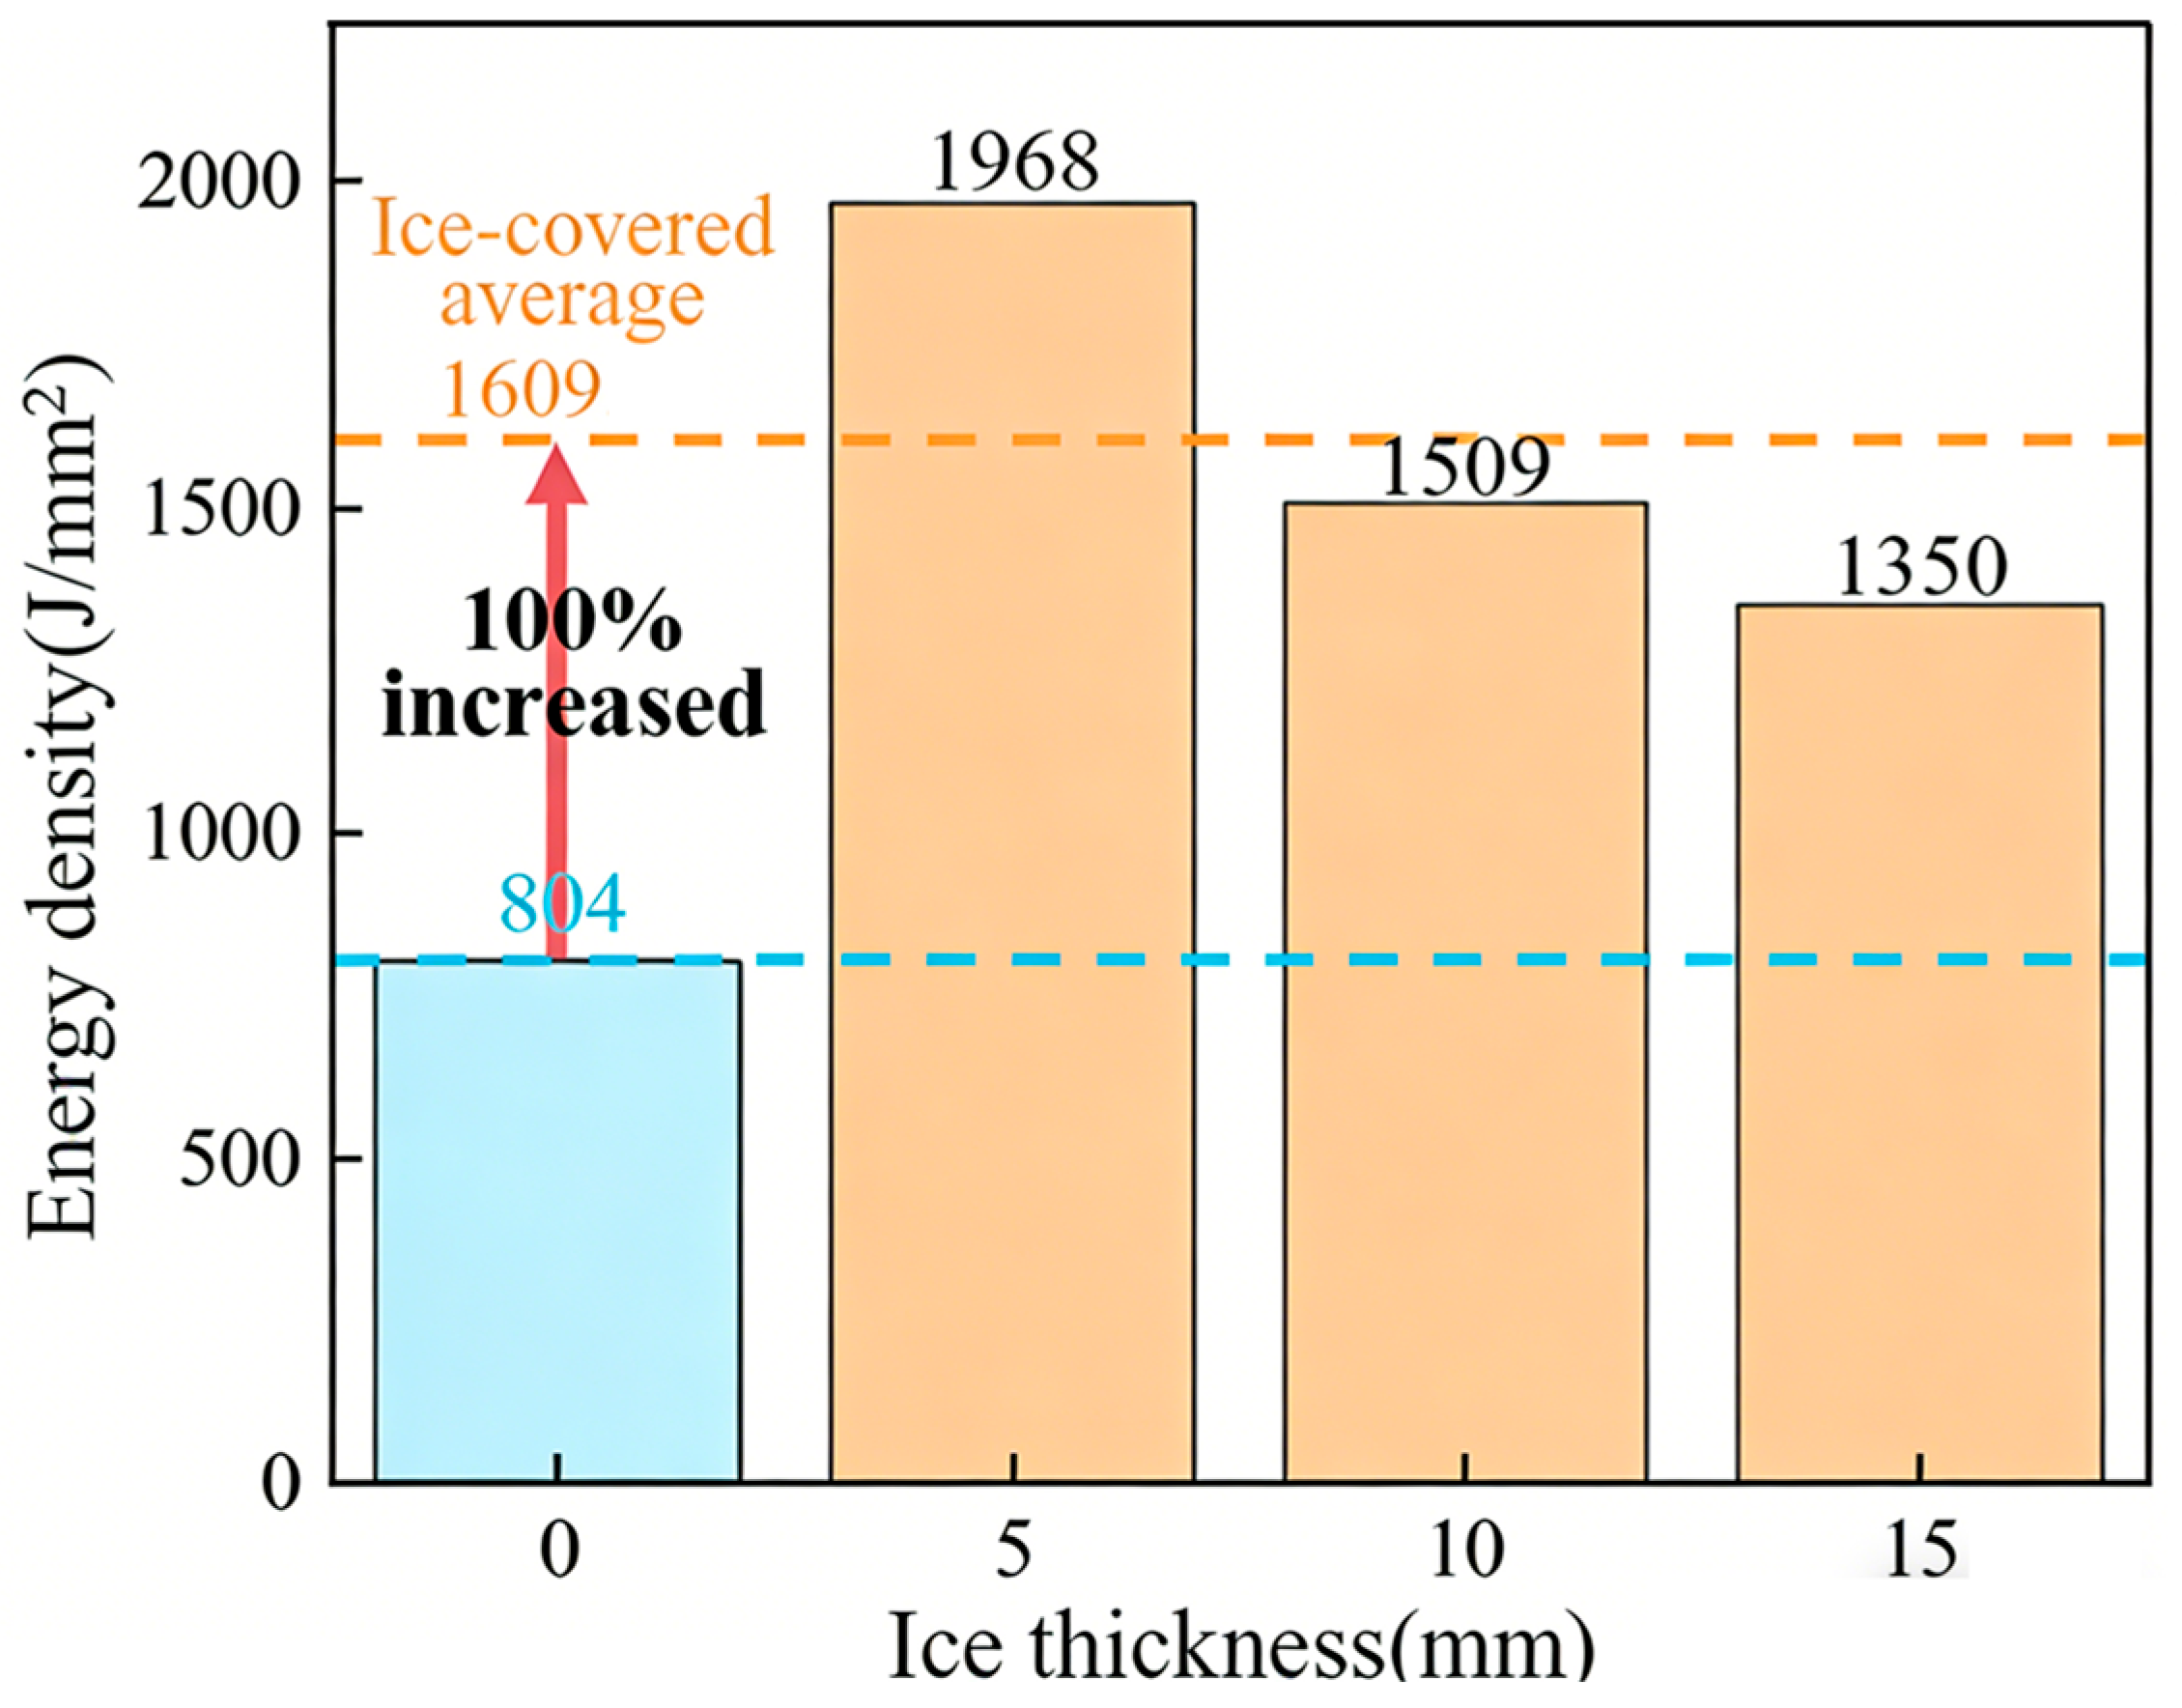
The statistical results of the energy density under different icing thicknesses are shown in Figure 6. The arc energy density without ice-covered is 803.85 J/mm2, while for icing thicknesses of 5 mm, 10 mm, and 15 mm, the arc energy densities are 1968.42 J/mm2, 1508.82 J/mm2, and 1350.00 J/mm2, respectively. The average energy density of all icing arcs is 1609.08 J/mm2, a 100% increase over the without ice-covered condition, indicating that icing significantly enhances the energy concentration effect of the arc. As the icing thickness increases from 5 mm to 15 mm, the average energy flux density exhibits a gradual downward trend; however, it remains over 1.8 times higher than that of the without ice-covered condition. This suggests that even under thick icing conditions, the energy damage potential of the arc far exceeds normal operating states. This pattern is consistent with the spectroscopic analysis results: at 5 mm icing, the Hα line intensity reaches its maximum (30.5) and the arc plasma temperature peaks (4213 K). The synergy of high temperature and high hydrogen ion concentration contributes to the maximization of energy density. In contrast, thicker ice layers consume more arc energy for phase transitions, leading to increased plasma energy loss and a corresponding decrease in energy flux density.
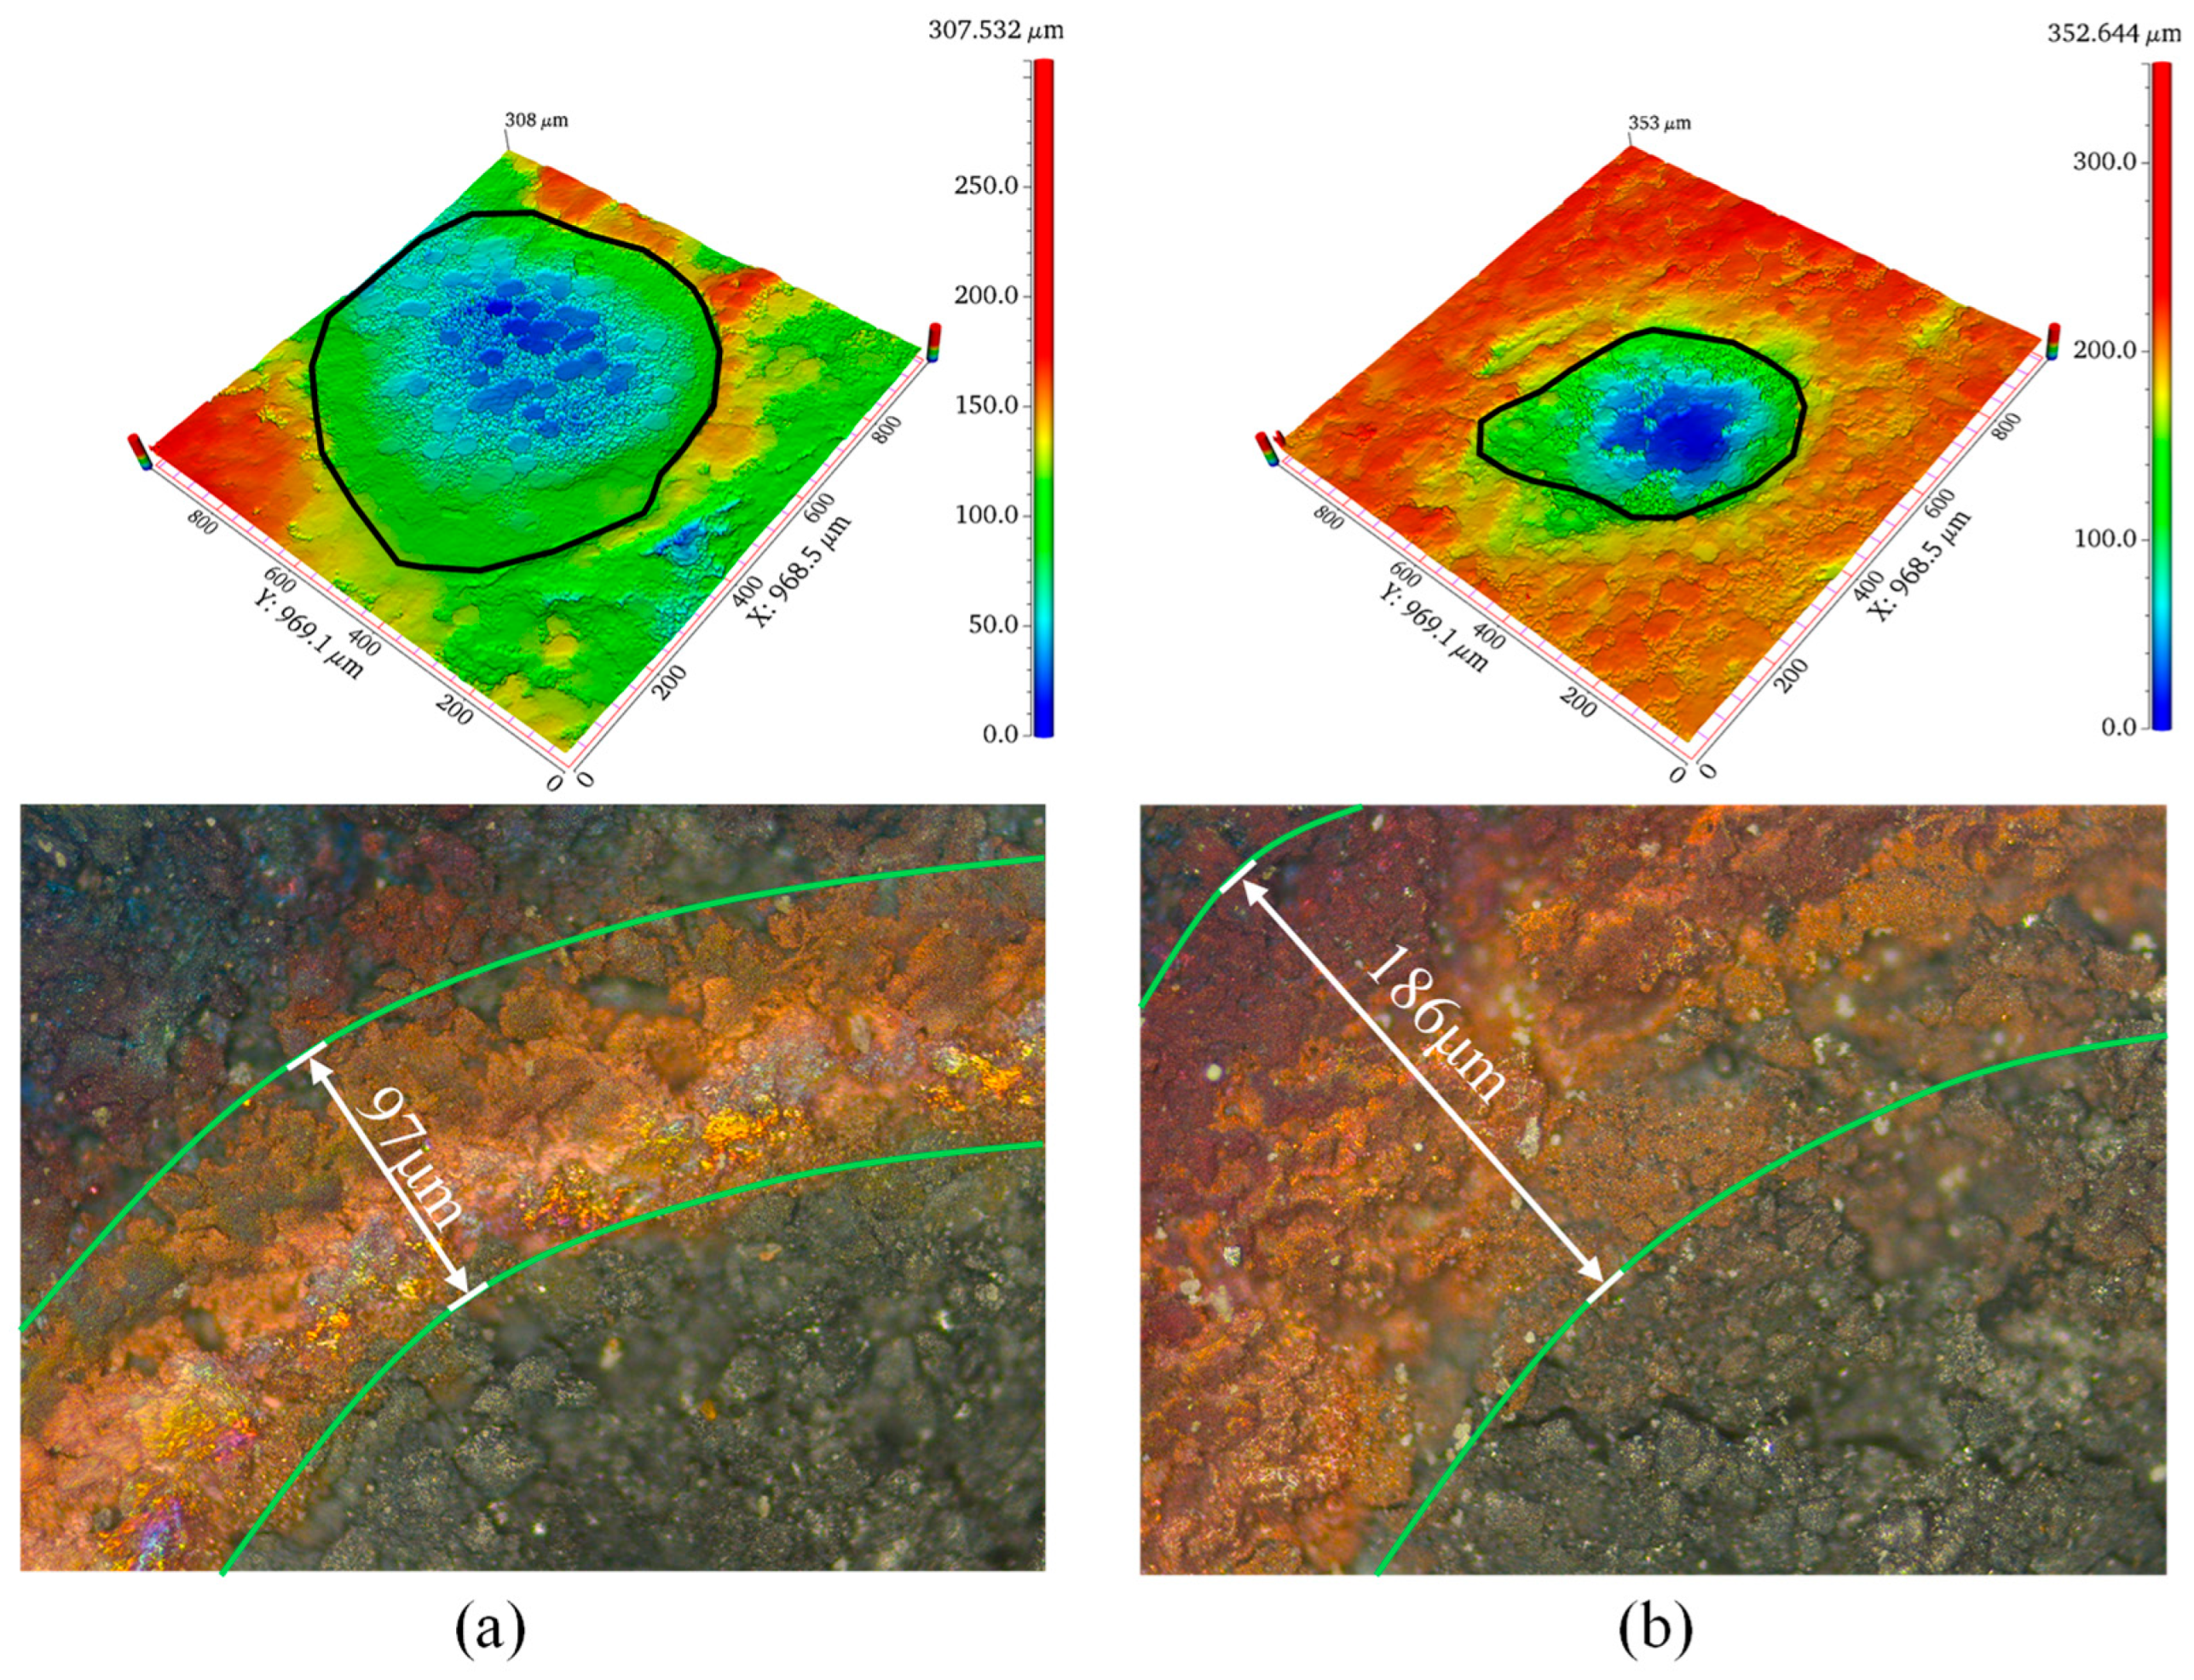
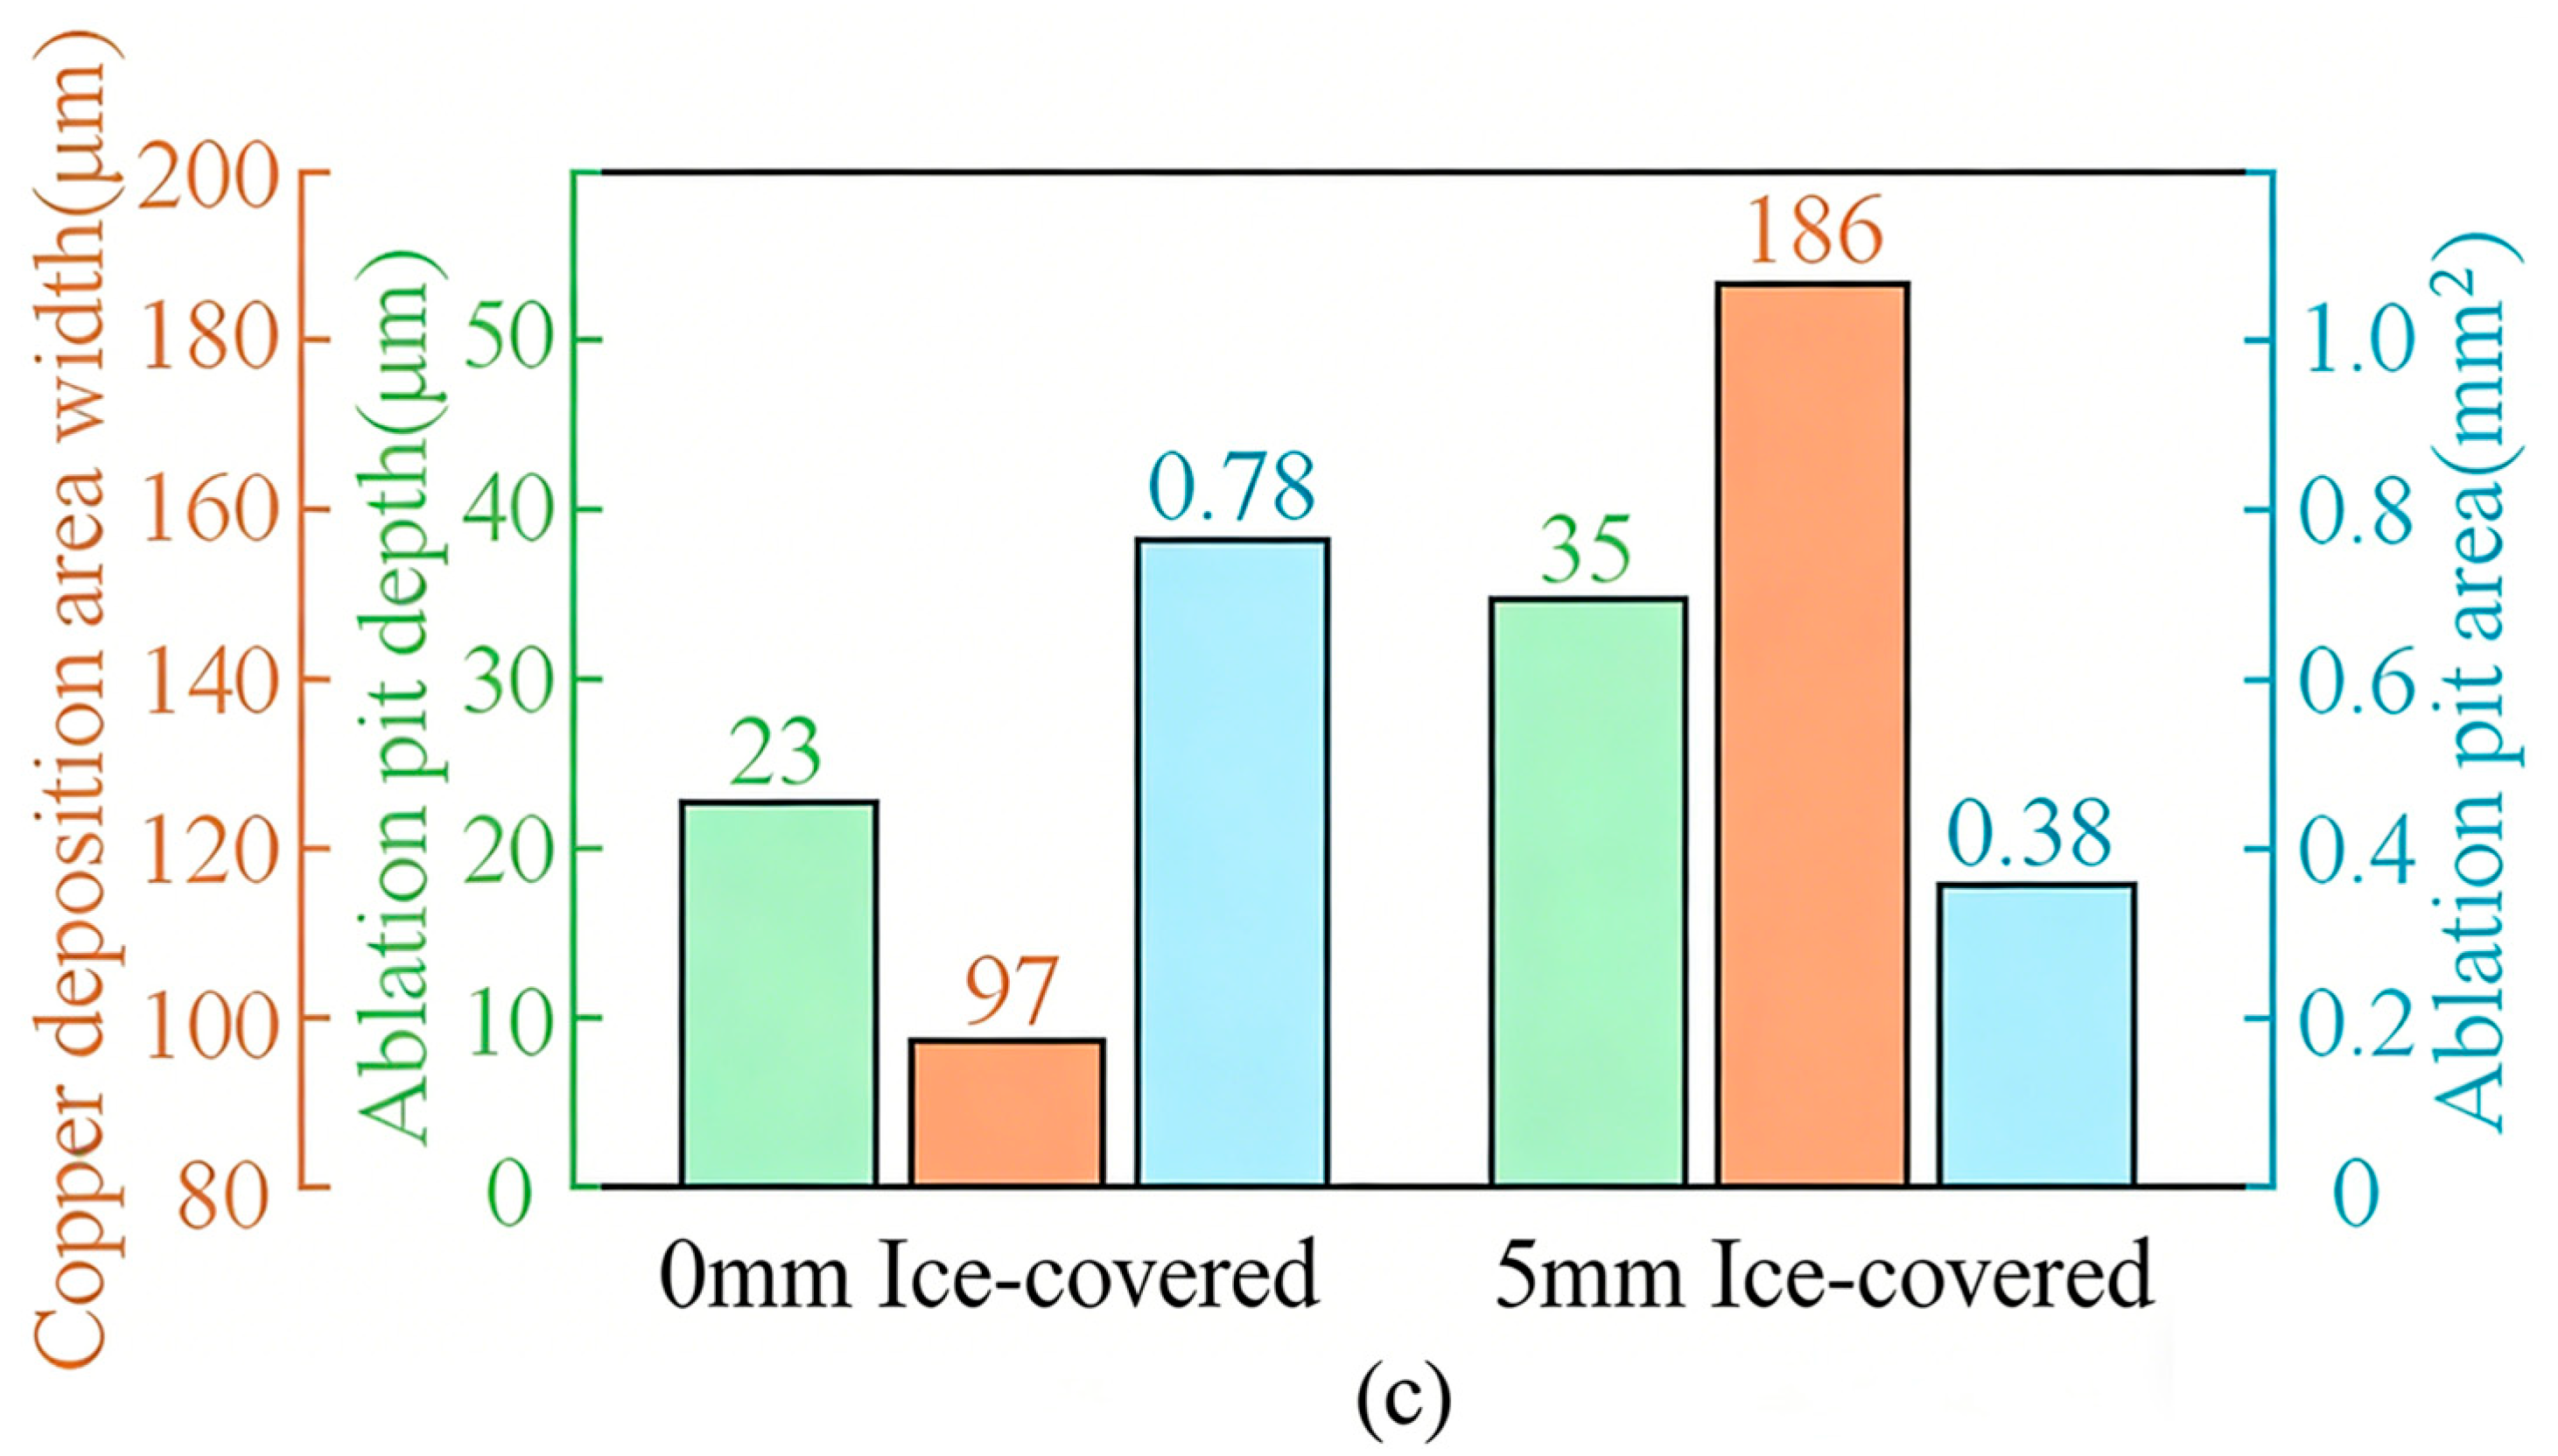
As a critical current-collection component of the pantograph–catenary system, characteristic changes in the carbon strip such as surface depressions, protrusions, cracks, and foreign matter deposition directly affect the contact stability of the interface. To highlight the impact of icing conditions on the carbon strip, a 3D profiler and a metallographic microscope were employed to capture the morphology of ablation pits for the arc in the without ice-covered condition (0 mm) and the arc with the highest energy density (5 mm), and the parameters were recorded as shown in Figure 7. The upper portions of Figure 7a,b present the 3D morphological views of the ablation pits, while the lower portions display the corresponding microstructure views. Specifically, Figure 7a represents the condition without ice-covered, and Figure 7b represents the icing condition. The area and depth of the ablation pits can be measured through the 3D morphological views, whereas the microstructure views reveal the copper deposition zones at the edges of the arc ablation pits. As illustrated in Figure 7c, the ablation pit area of the arc in the without ice-covered condition is 0.78 mm2 with an average depth of 23 μm, while the icing ablation pit has an area of 0.38 mm2 and an average depth of 34 μm. The characteristics of the icing arc ablation pit, specifically its smaller area and greater depth, are consistent with the previous calculation results of energy density. The copper deposition formed after ablation increases the surface roughness of the carbon strip. Under the condition without ice-covered, the width of the copper deposition zone is only 97 μm and is concentrated in a narrow band near the boundary between the ablation pit and the original surface. However, under the icing condition, the width of the deposition zone reaches 186 μm, which is 1.92 times that of the condition without ice-covered, and exhibits a wide and diffuse distribution. This difference provides direct evidence that the icing arc possesses higher energy intensity and stronger plasma migration capability. The elevated temperatures increase the evaporation of copper from the contact wire, and the pulsed energy impact further facilitates the diffusion of copper atoms. These factors lead to the formation of a wider and denser deposition area, which ultimately exacerbates the vicious cycle of friction and wear in the pantograph–catenary system.
In conclusion, the enhanced energy density of icing arcs, which is approximately double that of non-iced conditions, leads to more severe material damage characterized by deeper ablation pits and wider copper deposition zones on the carbon strip surface.

4. Conclusions

This paper presents the first systematic experimental investigation of pantograph–catenary arcs under icing conditions. By constructing a synchronized multi-diagnostic platform integrating high-speed imaging, electrical signal acquisition, and spectral analysis, we revealed how ice layer phase transition and subsequent water vapor ionization dominate arc characteristics. A key breakthrough is the establishment of a quantitative relationship between Hα spectral line intensity and arc energy density, providing a new diagnostic indicator for assessing the severity of icing arcs. The following conclusions through the experimental analysis of the pantograph–catenary system under icing conditions can be made: First, during the arc ignition stage, the icing arc is prone to extinction and reignition due to the endothermic melting of the ice layer, which results in the instability of the arc at the initial stage of combustion. Second, spectral diagnosis indicates that the concentration of hydrogen ions ionized from water vapor introduced by icing at high temperatures is positively correlated with the arc temperature and energy density, where the variation in the intensity of the Hα spectral line directly reflects the strength of the arc energy. In the experimental comparison of different icing thicknesses, the arc under the 5 mm icing working condition exhibits the maximum energy density and the highest temperature. Moreover, the average energy density of all ice-covered arcs is about twice that of the without ice-covered arcs, demonstrating a strong energy concentration effect. Finally, in terms of the arc ablation mechanism, the ablation pits generated by the icing arc have the typical characteristics of smaller area, greater depth and wider copper deposition zone. Such high-intensity pulsed energy impact and enhanced plasma migration ability significantly exacerbate the material damage and surface roughness of the carbon contact strip.

Author Contributions

Writing—original draft preparation, Z.W.; methodology, Z.L.; writing—review and editing, K.Z.; visualization, W.W.; data curation and validation, Z.Y.; project administration, H.Z. All authors have read and agreed to the published version of the manuscript.

Funding

This research was funded by National Natural Science Foundation of China, grant number 2024YFB4303300, National Key Research and Development Program of China, grant number 2024YFB4303304 and China Academy of Railway Sciences Group Co., Ltd. Foundation Project, grant number 2024YJ163.

Institutional Review Board Statement

Not applicable.

Informed Consent Statement

Not applicable.

Data Availability Statement

The original contributions presented in this study are included in the article. Further inquiries can be directed to the corresponding author.

Acknowledgments

The authors have reviewed and edited the output and take full responsibility for the content of this publication.

Conflicts of Interest

Author Zhiliang Wang and Zhuo Li were employed by the China Academy of Railway Sciences Corporation Limited. The funders had no role in the design of the study; in the collection, analyses, or interpretation of data; in the writing of the manuscript, or in the decision to publish the results. The remaining authors declare that the research was conducted in the absence of any commercial or financial relationships that could be construed as a potential conflict of interest.

References

  1. Wang, H.; Liu, Z.; Wu, Y. A Hierarchical Control Strategy for Active Pantograph in High-speed Railway. In Proceedings of the 2023 International Annual Conference on Complex Systems and Intelligent Science (CSIS-IAC), Shenzhen, China, 20–22 October 2023; pp. 826–833. [Google Scholar]
  2. Su, H. Pantograph Arc Detection of Urban Rail Based on Photoelectric Conversion Mechanism. IEEE Access 2020, 8, 14489–14499. [Google Scholar] [CrossRef] [Scilit]
  3. Wu, G.; Dong, K.; Xu, Z.; Xiao, S.; Wei, W.; Chen, H.; Li, J.; Huang, Z.; Li, J.; Gao, G.; et al. Pantograph–catenary electrical contact system of high-speed railways: Recent progress, challenges, and outlooks. Railw. Eng. Sci. 2022, 30, 437–467. [Google Scholar] [CrossRef] [Scilit]
  4. Yang, Z.; Yang, Z.; Huang, G.; Chen, X.; Ma, T.; Zhang, H.; Wei, W.; Wu, G. Effect of ice-covered catenary on dynamic interactions of pantograph-catenary system and limited speed of trains. Cold Reg. Sci. Technol. 2024, 228, 104331. [Google Scholar] [CrossRef] [Scilit]
  5. Ren, X.; Wu, Y.; Su, H.; Sun, Y. Develop self-forming conformal multifunctional interconnect layer to meet the demands of advanced Cu interconnect. In Proceedings of the 2025 26th International Conference on Electronic Packaging Technology (ICEPT), Shanghai, China, 5–7 August 2025; pp. 1–3. [Google Scholar]
  6. Xie, W.; Wu, G.; Yang, Z.; She, P.; Wang, H.; Zuo, H.; Wei, W.; Gao, G.; Tu, C. Study on the erosion characteristics of copper-carbon electrode pairs by DC air arc. High Volt. 2021, 6, 674–683. [Google Scholar] [CrossRef] [Scilit]
  7. Wei, W.; Wu, J.; Gao, G.; Gu, Z.; Liu, X.; Zhu, G.; Wu, G. Study on pantograph arcing in a laboratory simulation system by high-speed photography. IEEE Trans. Plasma Sci. 2016, 44, 2438–2445. [Google Scholar] [CrossRef] [Scilit]
  8. Ma, Y.; Gao, G.; Zhu, G. Numerical Simulation and Analysis of Temperature Distribution of Pantograph-Catenary Arc Characteristics of High-Speed Train. High Volt. Eng. 2015, 41, 3597–3603. [Google Scholar]
  9. Yu, X.; Wang, Z.; Song, M.; Song, L.; Yang, J.; Su, Y. Simulation Study on Arc Temperature of Urban Rail DC Pantograph-Catenary and Arc Ablation of Contact Line. Machines 2024, 12, 514. [Google Scholar] [CrossRef] [Scilit]
  10. Gao, G.; Hao, J.; Wei, W.; Hu, H.; Zhu, G.; Wu, G. Dynamics of pantograph–catenary arc during the pantograph lowering process. IEEE Trans. Plasma Sci. 2016, 44, 2715–2723. [Google Scholar] [CrossRef] [Scilit]
  11. Wang, Z.; Guo, F.; Wang, X.; Zhang, Y.; Wang, B.; Yan, X. Experimental research on radiated electroma gnetic noise of pantograph arc. In Proceedings of the 2015 IEEE 61st Holm Conference on Electrical Contacts (Holm), San Diego, CA, USA, 11–14 October 2015; IEEE: New York, NY, USA, 2015. [Google Scholar]
  12. Guo, F.; Ma, T.; Chen, Z. Sliding electrical contact characteristics under different current carrying conditions. J. Electrotech. 2009, 24, 18–23. [Google Scholar]
  13. Guo, F.; Jia, W.; Chen, Z.; Wang, Z.; Yin, F.; Liu, Y.; Xue, Y. Experimental research on current-carrying and friction characteristics of sliding electrical contact. In Proceedings of the 2010 56th IEEE Holm Conference on Electrical Contacts, Charleston, SC, USA, 4–7 October 2010; IEEE: New York, NY, USA, 2010. [Google Scholar]
  14. Guo, F.; Wang, L.; Zhang, Y.; Chen, J.; Liu, H.; Zhao, X.; Li, W.; Sun, Q.; Zhou, J.; Wu, D.; et al. Effect of sliding velocity on arc morphology of pantograph. J. Liaoning Tech. Univ. (Nat. Sci. Ed.)/Liaoning Gongcheng Jishu Daxue Xuebao (Ziran Kexue Ban) 2018, 37. [Google Scholar] [CrossRef]
  15. Luo, Y.; Yang, Z.; Dong, K.; Qian, P.; Xia, L.; Huang, C.; Zhang, H.; Wu, G.; Wei, W. Research on abnormal arc extinguishing phenomenon under low vacuum environment for electrified transportation. IEEE Trans. Transp. Electrif. 2023, 10, 6707–6714. [Google Scholar] [CrossRef] [Scilit]
  16. Dong, K.; Yang, Z.; Luo, Y.; Ma, Y.; Qian, P.; Wei, W.; Gao, G.; Wu, G. Arc stability and ablation characteristics in O2, N2, and air environments. Phys. Scr. 2024, 99, 075036. [Google Scholar] [CrossRef] [Scilit]
  17. Xu, Z.; Gao, G.; Wei, W.; Yang, Z.; Xie, W.; Dong, K.; Ma, Y.; Yang, Y.; Wu, G. Characteristics of pantograph-catenary arc under low air pressure and strong airflow. High Volt. 2022, 7, 369–381. [Google Scholar] [CrossRef] [Scilit]
  18. Yang, Z.; Xu, P.; Wei, W.; Gao, G.; Zhou, N.; Wu, G. Influence of the crosswind on the pantograph arcing dynamics. IEEE Trans. Plasma Sci. 2020, 48, 2822–2830. [Google Scholar] [CrossRef] [Scilit]
  19. Gao, G.; Zhang, T.; Wei, W.; Hu, Y.; Wu, G.; Zhou, N. A pantograph arcing model for electrified railways with different speeds. Proc. Inst. Mech. Eng. Part F J. Rail Rapid Transit 2018, 232, 1731–1740. [Google Scholar] [CrossRef] [Scilit]
  20. Huang, G.; Ma, T.; Liu, Y.; Li, Z.; Gao, G.; Wu, G. Effect of ice coating on thermal characteristics of pantograph-catenary arc and power quality of traction drive system. Electr. Power Syst. Res. 2026, 254, 112665. [Google Scholar] [CrossRef] [Scilit]
  21. Yang, Z.; Tang, B.; Qiu, Y.; Wu, J.; Wei, W.; Huang, X.; Luo, X.; Wu, G. Measurement of transient temperature using laser-induced breakdown spectroscopy (LIBS) with the surface temperature effect. J. Anal. At. Spectrom. 2023, 38, 1952–1961. [Google Scholar] [CrossRef] [Scilit]
  22. Huang, Z.; Xia, L.; Zhang, H.; Liu, F.; Tu, Y.; Yang, Z.; Wei, W. Evaluation of grounding grid corrosion extent based on laser-induced breakdown spectroscopy (LIBS) combined with machine learning. Comput. Electr. Eng. 2024, 120, 109849. [Google Scholar] [CrossRef] [Scilit]
  23. Gao, G.; Yan, X.; Yang, Z.; Wei, W.; Hu, Y.; Wu, G. Pantograph–catenary arcing detection based on electromagnetic radiation. IEEE Trans. Electromagn. Compat. 2018, 61, 983–989. [Google Scholar] [CrossRef] [Scilit]
  24. Datta, R.; Ahmed, F.; Hare, J.D. Machine-Learning-Assisted Analysis of Visible Spectroscopy in Pulsed-Power-Driven Plasmas. IEEE Trans. Plasma Sci. 2024, 52, 4755–4763. [Google Scholar] [CrossRef] [Scilit]
  25. Liu, F.; Jiang, Z.; Zuo, F.; Li, Y.; Wang, T.; Hu, D. Study on the evolution and performance of gas flow characteristics of wave rotor under the strengthening effect of arc channel. Appl. Therm. Eng. 2026, 291, 129943. [Google Scholar] [CrossRef] [Scilit]
  26. Pitto, M.; Fiedler, H.; Allen, T.; Verbeek, C.J.R.; Bickerton, S. High-power air plasma diagnostics by optical emission spectroscopy for subsecond continuous carbon fibre surface modification. Compos. Part A Appl. Sci. Manuf. 2025, 193, 108855. [Google Scholar] [CrossRef] [Scilit]
  27. Kramida, A.; Ralchenko, Y.; Reader, J.; NIST ASD Team. NIST Atomic Spectra Database (Version 5.12). 2024. Available online: https://physics.nist.gov/PhysRefData/ASD/lines_form.html (accessed on 3 December 2020).
Figure 1. Experimental device and signal acquisition system.
Inventions 11 00032 g001
Figure 2. Arc period extracting from voltage waveform cooperates with high-speed photographic image.
Inventions 11 00032 g002
Figure 3. Arc voltage, current, and duration under different ice thicknesses: (a) 0 mm, (b) 5 mm, (c) 10 mm, (d) 15 mm.
Inventions 11 00032 g003aInventions 11 00032 g003b
Figure 4. Hα line intensity for different ice thicknesses.
Inventions 11 00032 g004
Figure 5. Arc power for different ice thicknesses: (a) 0 mm, (b) 5 mm, (c) 10 mm, (d) 15 mm.
Inventions 11 00032 g005
Figure 6. Arc ablation energy density at different ice thicknesses.
Inventions 11 00032 g006
Figure 7. Comparison of surface morphology and parameters of arc ablation pits with and without ice-covered: (a) surface morphology without ice-covered; (b) surface morphology with ice-covered; (c) parameters of arc ablation pits.
Inventions 11 00032 g007aInventions 11 00032 g007b
Table 1. Atomic spectral line parameters.
ParticleObserved
Wavelength (nm)
Ritz
Wavelength (nm)
Transition Probability Aki (s−1)Excited State
Energy Ek(J)
Lower Level
H I486.1486.11.7188 × 10−72.0426 × 10−184d 2D 3/2
H I656.3656.36.4651 × 10−71.9366 × 10−183d 2D 5/2
Cu I324.8324.81.395 × 10−76.1150 × 10−193d104p 2P° 3/2
Cu I521.8521.87.5 × 10−79.9207 × 10−193d104d 2D 5/2
O I381.1381.15.14 × 10−71.3235 × 10−171s23p 2P° 3/2
N I305.25305.257.82 × 10−71.4153 × 10−171s26p 2P° 1/2
Disclaimer/Publisher’s Note: The statements, opinions and data contained in all publications are solely those of the individual author(s) and contributor(s) and not of MDPI and/or the editor(s). MDPI and/or the editor(s) disclaim responsibility for any injury to people or property resulting from any ideas, methods, instructions or products referred to in the content.