1. Introduction
Machine learning (ML) techniques are revolutionizing data analysis by enabling the rapid processing of large datasets and uncovering patterns that are often difficult to detect using traditional methods [
1]. In agriculture, ML has been extensively applied to insect management, soil health prediction, crop yield estimation, and the monitoring of animal behavior [
1,
2,
3,
4,
5].
Among these applications, ML-based behavior classification and welfare assessment have become particularly relevant in swine production, one of the most prominent sectors of global livestock farming. The growing demand for animal protein has driven the expansion of intensive pig farming systems [
6], which are characterized by high productivity, reduced labor costs, and limited space per animal. However, this intensification raises critical concerns regarding animal welfare [
7,
8].
Animal welfare is a fundamental pillar of modern livestock systems, as its compromise can negatively impact both animal health and productivity. According to the Welfare Quality
® protocol [
9], animal welfare is based on four key principles: good feeding, good housing, good health, and appropriate behavior. The latter encompasses the expression of social behaviors, positive human–animal interactions, and favorable emotional states [
10]. In swine production, vocalizations have emerged as key indicators of health and welfare, as they are closely associated with specific behavioral events [
11]. For example, coughing may indicate respiratory illness, whereas squealing is often linked to environmental stress, aggression, or pain [
12,
13].
Vocal pattern analysis provides valuable insights into social behaviors through the assessment of sound frequency, duration, and amplitude. Low-pitched vocalizations, such as grunts, may reflect social bonding [
14], whereas changes in pitch and intensity can reveal stress or discomfort. Stressful situations, such as isolation, castration, or weaning, typically elicit higher-pitched, more frequent, and prolonged vocalizations. Additionally, high-pitched calls may indicate food deprivation [
14]. Nevertheless, direct human observation presents limitations, such as observer bias and interference with natural behavior.
In light of these challenges, sound-based monitoring technologies have emerged as promising tools in precision livestock farming, particularly due to advancements in sensor technology and data processing [
15]. However, the acoustic environment in swine facilities is complex, with overlapping sounds [
16], thus, requiring robust classification algorithms. Recent studies have employed ML to correlate specific vocalizations with behavioral states. For instance, Yin et al. [
17] used convolutional neural networks (CNNs) to detect coughs, achieving 96.8% accuracy in identifying respiratory diseases. Liao et al. [
18] developed the transformer CNN model, which combines CNNs and transformer layers, reaching 96.05% accuracy. Other works by Hou et al. and Pann et al. [
19,
20] reported classification accuracies above 93% for grunts, squeals, and coughs.
Despite these advances, most models have not been adapted for deployment on low-cost embedded systems, which are essential for real-time monitoring in commercial farms [
17]. As highlighted by Reza et al. [
15], key challenges include achieving high accuracy while minimizing costs. A promising solution is tiny machine learning (TinyML), which enables the execution of sophisticated ML models on microcontrollers and IoT devices, overcoming constraints related to hardware, memory, and processing power [
21,
22].
In this context, the primary objective of this study is to develop an automated system to classify agonistic and social behaviors in pigs through vocalization analysis using accessible computing hardware. The proposed model, based on a convolutional neural network (CNN), is implemented on embedded devices such as smartphones via TinyML, aiming to provide a feasible solution for real-time welfare monitoring.
2. Materials and Methods
The dataset used in this study was collected in 2011 at the experimental pig facility of the University of Illinois Urbana-Champaign. Despite the age of the data, pig behavioral responses to temperature variations and social interactions remain consistent, making this dataset suitable for the proposed analysis.
2.1. Experimental Setup
The study was conducted over two weeks in June and July 2011 at the Experimental Swine Unit of the University of Illinois Urbana-Champaign. The pigs were housed in a climate-controlled facility with four identical rooms, each measuring 9.30 m (L) × 8.5 m (W) × 2.2 m (H), with insulated walls and ceilings to ensure thermal stability.
Twenty-four newly weaned Landrace × Large White piglets (19 days old) were selected, separated by sex, and randomly distributed into four pens, each housing six animals (three males and three females). After a seven-day acclimatization period, the groups underwent a dominance re-establishment phase under controlled thermal conditions.
Each pen (
Figure 1) was equipped with a drinker and three ad libitum feeders. A unidirectional microphone was placed 80 cm above the floor to record sound. All procedures were approved by the Institutional Animal Care and Use Committee (IACUC) under protocol 11083.
Treatments were administered at two-day intervals, with temperatures gradually increasing. The first treatment, conducted during the first week, consisted of alternating days of thermal comfort (27 °C) and moderate heat (35 °C). The second treatment, carried out during the second week, involved alternating days of thermal comfort (24 °C) and high heat (34 °C). In both treatments, the temperature increased by 2 °C every three hours.
2.2. Audio Acquisition
A unidirectional cardioid microphone (XM8500, Behringer Inc., Bothell, WA, USA) was used to collect the animals’ vocalizations. The microphone was connected to a signal amplifier (Micropower PS400, Behringer Inc., Bothell, WA, USA), which was linked to an audio and graphics card connected to a microcomputer. Unidirectional microphones capture sound from a single direction, making them more responsive to animal sound stimuli while reducing external noise from outside the pen. All recordings were saved in WAV format (waveform audio file) with a duration of ten seconds each. The audio files were grouped according to the time of day into four periods: dawn (00:00 a.m.–05:55 a.m.), morning (06:00 a.m.–11:55 a.m.), afternoon (12:00 p.m.–05:55 p.m.) and night (06:00 p.m.–11:55 p.m.). For this study, recordings from two days were used, with samples randomly distributed across the four time periods and thermal treatments.
2.3. Audio Processing
A preliminary analysis of the database was conducted to select the relevant vocalizations. The recordings were categorized based on the following observed behaviors: noises related to approaching the feeder, noises related to approaching the drinker, social vocalizations, agonistic vocalizations, and others (defined as recordings containing multiple behavioral categories simultaneously). All behaviors were identified based on the ethogram described by Massari et al. [
23].
From the selected database, 25 audio files were labeled as ‘agonistic’ and another 25 as ‘social’. The aim of this study was not to evaluate the impact of heat stress, but rather to identify two types of behavior (agonistic and social) using machine learning techniques. These files were imported into Audacity
® for processing. To reduce environmental noise and retain only information relevant to behavioral analysis using the convolutional neural network (CNN) model, a band-pass filter with cutoff frequencies of 650 Hz and 8 kHz was applied, in accordance with the sampling theorem [
24]. This theorem states that the sampling frequency must be at least twice the highest frequency in the signal.
During audio processing, segments of silence were detected and removed to ensure that the resulting audio contained only agonistic or social sounds. Silence removal settings used a threshold of −20 dB and a minimum duration of 0.5 s. Each audio clip was trimmed to a maximum length of two seconds so that only the vocalizations associated with each behavior were retained for training the model. Shorter clips capture less variability in sound, improving classification accuracy and allowing a greater number of training samples to be generated. After processing and compiling the audio clips into uniform time units, the final dataset contained 3 min and 46 s of audio. These clips were formatted to meet the input requirements of the machine learning platform used for model training.
The final dataset consisted of 2 min and 38 s of training data (1 min and 11 s of ‘social’ and 1 min and 27 s of ‘agonistic’) and 1 min and 8 s of testing data (54 s of ‘social’ and 54 s of ‘agonistic’). However, due to the noise reduction step during processing, where some samples underwent more extensive filtering, it was not possible to achieve a perfectly balanced distribution between the two classes during training and testing.
2.4. Model Development
Model development was carried out using Edge Impulse, an artificial intelligence (AI) platform that enables the deployment of advanced machine learning models on embedded devices via TinyML (Edge Impulse) [
25], eliminating the need for external processing and increasing energy efficiency [
26].
To balance the class distribution, undersampling was performed by randomly selecting samples from the majority class until both classes had equal representation. The dataset was then split into training (60%) and testing (40%) sets, with random stratification using the data augmentation tool provided by Edge Impulse. The model was trained for 250 epochs with a batch size of 128, using the stochastic gradient descent (SGD) optimizer with a learning rate of 0.01. No early stopping criteria were applied, and the hardware/software environment remained fixed throughout the experiments.
A convolutional neural network (CNN) architecture was used to train the animal vocalization classification model. This architecture was selected because it allows audio signals to be converted into spectrogram images for pattern recognition, thereby improving classification accuracy [
17].
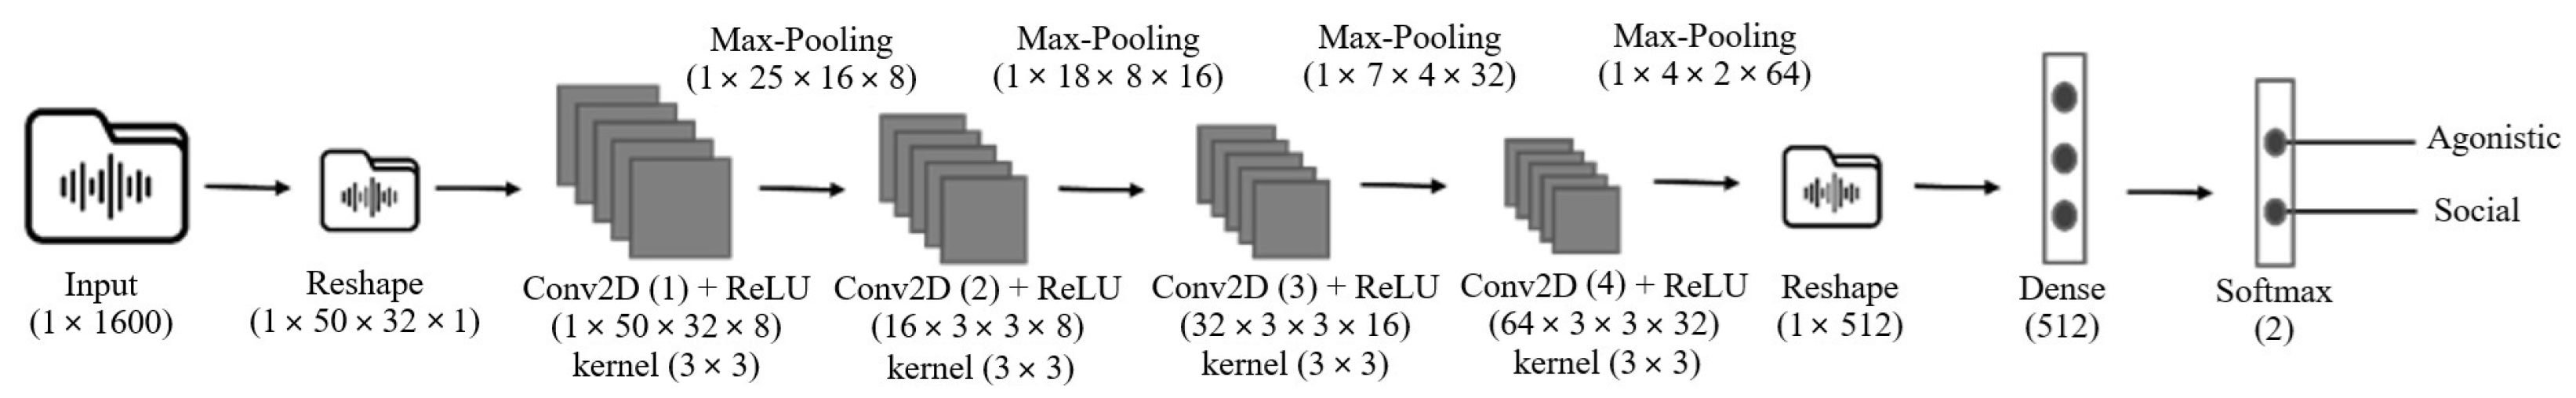
Figure 2 illustrates the proposed CNN architecture. The input layer (serving_default_x_0) accepts an input of size 1 × 16,000 (the original audio length), which is then reshaped into a 2D format of 1 × 50 × 32 × 1 to facilitate convolutional operations.
The first Conv2D layer applies eight filters of size 3 × 3, followed by a ReLU activation function, producing an output of 1 × 50 × 32 × 8. A Max-Pooling layer then reduces the spatial dimensions, while preserving features, to 1 × 25 × 16 × 8. The second Conv2D layer increases the depth to 16 channels using 16 filters (3 × 3), followed by another ReLU activation and Max-Pooling, resulting in an output of 1 × 13 × 8 × 16. The third Conv2D layer, with 32 filters (3 × 3) and ReLU activation, extracts more complex features. After another Max-Pooling operation, the output is 1 × 7 × 4 × 32. The fourth and final Conv2D layer increases the depth to 64 channels using 64 filters (3 × 3), followed by Max-Pooling, which reduces the output size to 1 × 4 × 2 × 64.
The Reshape layer flattens the 3D feature maps into a 1D vector of size 1 × 512 for classification. This vector is passed through a fully connected (dense) layer with 512 neurons. Finally, a Softmax layer outputs a probability vector of size 1 × 2, classifying the input into one of two categories: ‘agonistic’ or ‘social’.
After completing the training phase, the developed model was converted into a TinyML model—a compressed version optimized for deployment on embedded devices. Subsequently, the TinyML model was implemented in an IoT device simulator to evaluate its performance under real-world conditions (
Figure 3).
The model’s performance was assessed using the following metrics: accuracy, precision, F1-score, and sensitivity. Accuracy measures the overall correctness of the model by calculating the ratio of correctly predicted samples (true positives and true negatives) to the total number of samples. Precision quantifies the proportion of true positive predictions among all positive predictions made by the model. It is calculated as the number of true positives divided by the sum of true positives and false positives. Sensitivity (also known as recall) measures the model’s ability to correctly identify positive instances. It is computed by dividing the number of true positives by the sum of true positives and false negatives. The F1-score is the harmonic mean of precision and sensitivity. It provides a balanced evaluation by considering both precision and recall, which is particularly important when dealing with imbalanced datasets.
3. Results
During training, the model underwent multiple cycles of synaptic weight adjustment based on the error calculated in each iteration to optimize its accuracy [
27], ultimately achieving a performance of 96.6%. Analysis of the confusion matrix (
Table 1) revealed that the model correctly classified 100% of the agonistic vocalizations and 93.8% of the social vocalizations. These results indicate that the model effectively learned and standardized the extracted audio features, accurately distinguishing between agonistic and social behaviors.
When the trained model was applied to the test dataset, data not used during training, it achieved an accuracy of 92.08%. The confusion matrix for the test dataset (
Table 2) showed that agonistic behavior was correctly classified 85.2% of the time, with 14.8% misclassified as social behavior. In contrast, all instances of social behavior were correctly identified (100%).
Table 3 presents the performance metrics for the test dataset. The model achieved a precision of 85.2% for agonistic behavior, indicating that 85.2% of the samples predicted as agonistic were correctly classified. However, some social vocalizations were misclassified as agonistic. For social behavior, the model achieved a precision of 100%, meaning all predicted instances of social behavior were correct.
Sensitivity followed a similar trend. Social behavior had a sensitivity of 100%, indicating that all actual instances were correctly identified. Agonistic behavior had a sensitivity of 85.5%, meaning that while most instances were correctly detected, some were missing. The F1-score, which balances precision and sensitivity, was 92.0% for agonistic behavior and 100.0% for social behavior. These metrics underscore the model’s overall effectiveness in distinguishing between the two behavioral classes.
The compressed TinyML model, based on the previously trained CNN, was simulated using Edge Impulse’s online platform (
Figure 4). During simulation, the model exhibited a confidence level of 0.90 when classifying an unseen audio sample as agonistic (
Figure 4a) and 0.85 for social behavior (
Figure 4c). Notably, when the confidence level dropped below 0.50, the model classified the input as “No event detected” (
Figure 4b). The simulation also revealed an inference time of 244 ms, with memory usage of 23.1 KB RAM and 72.7 KB Flash.
Overall, the model demonstrated strong performance in behavior classification, maintaining reliability even when deployed on a resource-constrained mobile device.
4. Discussion
The classification of vocalization patterns yielded satisfactory results, with the convolutional neural network (CNN) model achieving over 90% accuracy, even when deployed on a low-cost platform with limited memory and hardware resources. Similar levels of accuracy were reported by Yin et al. [
17], who achieved 96.8% in classifying cough sounds in pigs. However, those authors did not implement their complex CNN model on constrained hardware, which underscores the feasibility of the TinyML approach presented in this study for real-time animal vocalization monitoring in environments such as farms, where computing resources may be limited.
Nevertheless, classification errors, particularly for agonistic behavior, highlight the need for a more comprehensive analysis in future phases. This will include augmenting the dataset with recordings collected on additional days. Despite a careful selection and organization of audio samples to accurately differentiate between the two behaviors, it is possible that low-intensity agonistic vocalizations were misclassified as social interactions. Additionally, although background noise was minimized through filtering and the use of unidirectional microphones, some residual noise may still have contributed to misclassification.
These challenges are consistent with findings by Hou et al. and Reza et al. [
15,
19], who, although studying different behaviors, also reported that low-intensity pig grunts could be difficult to distinguish from coughing or vocal syncope. Moreover, interference such as background noise or human activity was found to negatively impact classification accuracy in their studies as well.
Beyond classification accuracy, the use of TinyML in behavioral monitoring systems holds significant promise for real-time pig monitoring. In contrast to traditional monitoring systems that require sophisticated machine learning models and external processing units, TinyML enables on-device processing, reducing energy consumption and eliminating the need for high-bandwidth data transmission. This advantage was also emphasized by other authors [
26,
28,
29], who explored TinyML’s application in low-power embedded systems.
Consequently, TinyML emerges as a viable, cost-effective, remote, and continuous monitoring solution for pig producers. Real-time analysis of vocalization patterns can assist in identifying signs of stress, resource competition, or fighting, thus providing critical information for informed herd management. Future studies should explore improvements such as adaptive noise filtering, real-time model retraining, and dataset augmentation to enhance classification robustness across varying environmental conditions and to include a broader range of animal behaviors in the model.
5. Conclusions
This study demonstrated the feasibility of employing tiny machine learning (TinyML) to recognize pig vocalizations, achieving over 90% classification accuracy despite implementation on a low-cost, low-memory embedded system. These results highlight the potential of TinyML-based vocal monitoring for real-time behavioral classification in animals, offering a scalable and efficient alternative to more complex machine learning solutions.
Future research should focus on testing and refining this methodology by incorporating datasets with greater variability in vocalizations and background noise. Next steps include developing hardware prototypes for real-time application and further improving model performance. Integrating TinyML-based vocalization recognition into farm management practices holds great potential to facilitate early detection of health or welfare issues in livestock, reduce reliance on manual monitoring, and ultimately enhance animal welfare outcomes.


 ,
, 


