1. Introduction
Schlieren is a non-intrusive optical diagnostic technique employed to visualize spatial gradients in the refractive index of transparent media, typically arising from variations in density, temperature, or pressure. The method utilizes the deflection of collimated light rays as they traverse these inhomogeneous regions, which are subsequently converted into intensity variations on an imaging plane through the use of optical elements such as knife edges or color filters. The term schlieren, derived from the German word for “streaks” or “striae,” refers to the streak-like structures observed in the resulting visualizations. In scientific English, the word is written in lowercase, as it functions as a common noun rather than a proper noun. Schlieren techniques are widely applied in experimental fluid dynamics, aerodynamics, and heat transfer to capture phenomena such as shock waves, thermal plumes, and other compressible flow structures with high spatial resolution and sensitivity.
The concept of color schlieren dates back to 1892 and is attributed to Rheinberg [
1], who was inspired to use colored filters in his microscope. The color filter was obtained through the method of chemical staining, which was applied at that time to differentiate the chemical elements of the transparent flows being investigated. Using the technique of color contrast to distinguish between the different structures of his biological subject analyzed through a microscope, he patented a method that was later described by Settles as “analogous to Toepler’s black-and-white microscopic schlieren method” [
2].
Several methods of applying color filters as a calibration tool are found in the literature, with most descriptions emphasizing the mathematical model applied in order to retrieve density gradients, while briefly specifying the calibration process and tools.
Quantitative color schlieren relies on detecting color gradients in pixel displacements and relating them to the initial position of the color gradient on a background image taken without the investigated phenomena. Color filters are usually chosen either to produce a high contrast and highlight specific characteristics of transparent flows [
3], or their color distribution presents a specific pattern mathematically modeled to follow an equation making it easier to determine displacements by analyzing pixel values [
4]. By adding color to traditional schlieren imaging, the authors of [
4] present how the technique allows one to observe both the direction and strength of density gradients in high-speed flows, offering clearer and more detailed insights into shock wave behavior.
In order to be able to visualize a transparent flow, the studied phenomena have to have different density gradients when related to the environment. Chaloupka et al. [
5] introduced an innovative approach to color schlieren imaging. The authors developed a system that utilizes two optical paths and a double knife-edge configuration to enhance the visualization of refractive index gradients in transparent media. This setup allows for improved sensitivity and color differentiation in capturing fluid flow phenomena, making it particularly useful for studying complex flow fields and heat transfer processes. The paper details the design, implementation, and advantages of this method over traditional schlieren techniques.
Color schlieren can be used as a standalone method after being calibrated on a well-known test case [
6] or combined with other methods such as interferometry [
7] and BOS (background oriented schlieren) [
8] or even compared to computational fluid dynamics (CFD) simulations [
9] or data collected from physical sensors [
10].
In 2009, Ezoe et al. analyzed the airflow characteristics of nozzle jets used in leek peeling machines [
11]. Their objective was to understand the flow behavior of air jets emitted from leek peeler nozzles to optimize their performance in industrial applications. The study employs two main techniques: Rainbow Schlieren Deflectometry which visualizes variations in air density by capturing color patterns, allowing for the qualitative assessment of flow structures and Pitot Pressure Measurements which uses Pitot tubes, for measuring the velocity of the airflow, providing quantitative data on the jet’s speed and pressure distribution. By integrating these methods, the study offers a comprehensive analysis of the jet flow, combining visual patterns with precise measurements.
The combined approach reveals detailed insights into the jet’s behavior, including velocity profiles and density gradients. These findings are crucial for enhancing the efficiency and effectiveness of leek peeling processes.
Another popular method used in comparison with color schlieren is Particle Image Velocimetry (PIV). Scarano highlights [
12] the importance of PIV in providing non-intrusive, detailed, and instantaneous flow field data, which is critical for validating computational fluid dynamics (CFD) models and improving the design of high-speed aerospace systems. Through experimental examples and methodological insights, the work underscores PIV’s evolving role in advancing the understanding of complex supersonic flow phenomena.
Quantitative schlieren is primarily employed for the analysis of two-dimensional laminar flows, typically achieving a measurement error of around 2% [
13]. In recent years, substantial progress—supported by computer-aided developments—has been made toward adapting this technique for the investigation of three-dimensional flows. Although color schlieren serves as the quantitative method based on the schlieren approach presented herein, notable advancements have also been achieved in background-oriented schlieren (BOS) techniques [
14], colorimetry applications [
15], and detailed investigations of the color schlieren method itself, such as the work described in [
16]. The current system builds upon the studies reported in [
17,
18], which involved comprehensive calibration campaigns based on manual procedures. Furthermore, Tregub [
19] and Settles [
20] offer visualizations of similar turbulent jets captured using color schlieren, subtly reinforcing the need for a dedicated calibration system.
The present paper describes an innovative, automated calibrating system for a gradual color filter, described by Elsinga et al. [
13]. This system eliminates most errors resulting from human interaction, improves calibration times and increases data accuracy due to the possibility of increasing filter size, as shown in [
18].
Numerous influential studies in quantitative and color schlieren imaging—from foundational texts to modern applications—highlight the potential of the technique while also exposing limitations that the present automated calibration system directly addresses. Early works by Settles [
2,
3] and Kleine and Grönig [
4] laid the groundwork for schlieren methodologies but information on filter calibration suggests the involvement of manually intensive procedures, limiting repeatability and throughput. More recent experimental studies, such as those focused on gas leak detection [
1], industrial nozzle flows [
11], laser-induced shock phenomena [
7], and shock wave visualization [
4], would benefit significantly from reduced human intervention and faster calibration times. The system’s automation ensures greater consistency and repeatability, which is critical in studies like [
5,
6,
17], wherein quantitative parameter extraction (e.g., temperature, pressure) depends on precise calibration.
Flexibility is essential in experimental designs such as full-scale schlieren setups [
6], customized optical layouts [
5], and high-sensitivity filter configurations [
18]; here, the customizability and modular architecture of the system offer clear advantages. Studies involving image-based data correction or interpretation, such as [
8,
13,
16], would benefit from the system’s pre-/post-processing GUI tools and user-friendly interface, which help reduce the barrier to entry for users with varying levels of expertise. Additionally, the iterative optimization integrated into the system enhances workflows for studies requiring repeated parameter sweeps or sensitivity tests, such as [
9,
12,
14,
15]. Finally, the system’s ability to handle larger calibrated color filters—experimentally validated in [
18]—offers a significant sensitivity gain for setups that traditionally suffer from reduced resolution or longer calibration procedures.
The study performed in 2024 by Prisăcariu and Prisecaru [
17], serves as the foundational work that led to the development of the automated calibration mechanism presented in the current research. In that study, the authors implemented a quantitative color schlieren setup to extract physical parameters—such as density and velocity—from high-temperature exhaust flows. The manual calibration of color filters, however, proved to be a significant limitation, particularly in terms of accuracy, repeatability, and efficiency. These operational challenges highlighted the need for a more robust, consistent, and scalable calibration approach. As a direct response, the current work introduces an automated calibration system designed to overcome these constraints, offering higher precision, reduced human intervention, and faster processing times.
2. Calibrating Process and Description of the Automated System
2.1. Brief Explanation of the Calibration Process
In a Z-type schlieren system, the light emitted by a point-like source reaches the first parabolic mirror, after which the light is collimated between the two mirrors.
Point-like sources are, by definition, light sources with very small dimensions. Depending on the required sensitivity of the schlieren system, these sources can range from a simple lightbulb filament isolated by a diaphragm to a high-intensity, laser-doped optical fiber source.
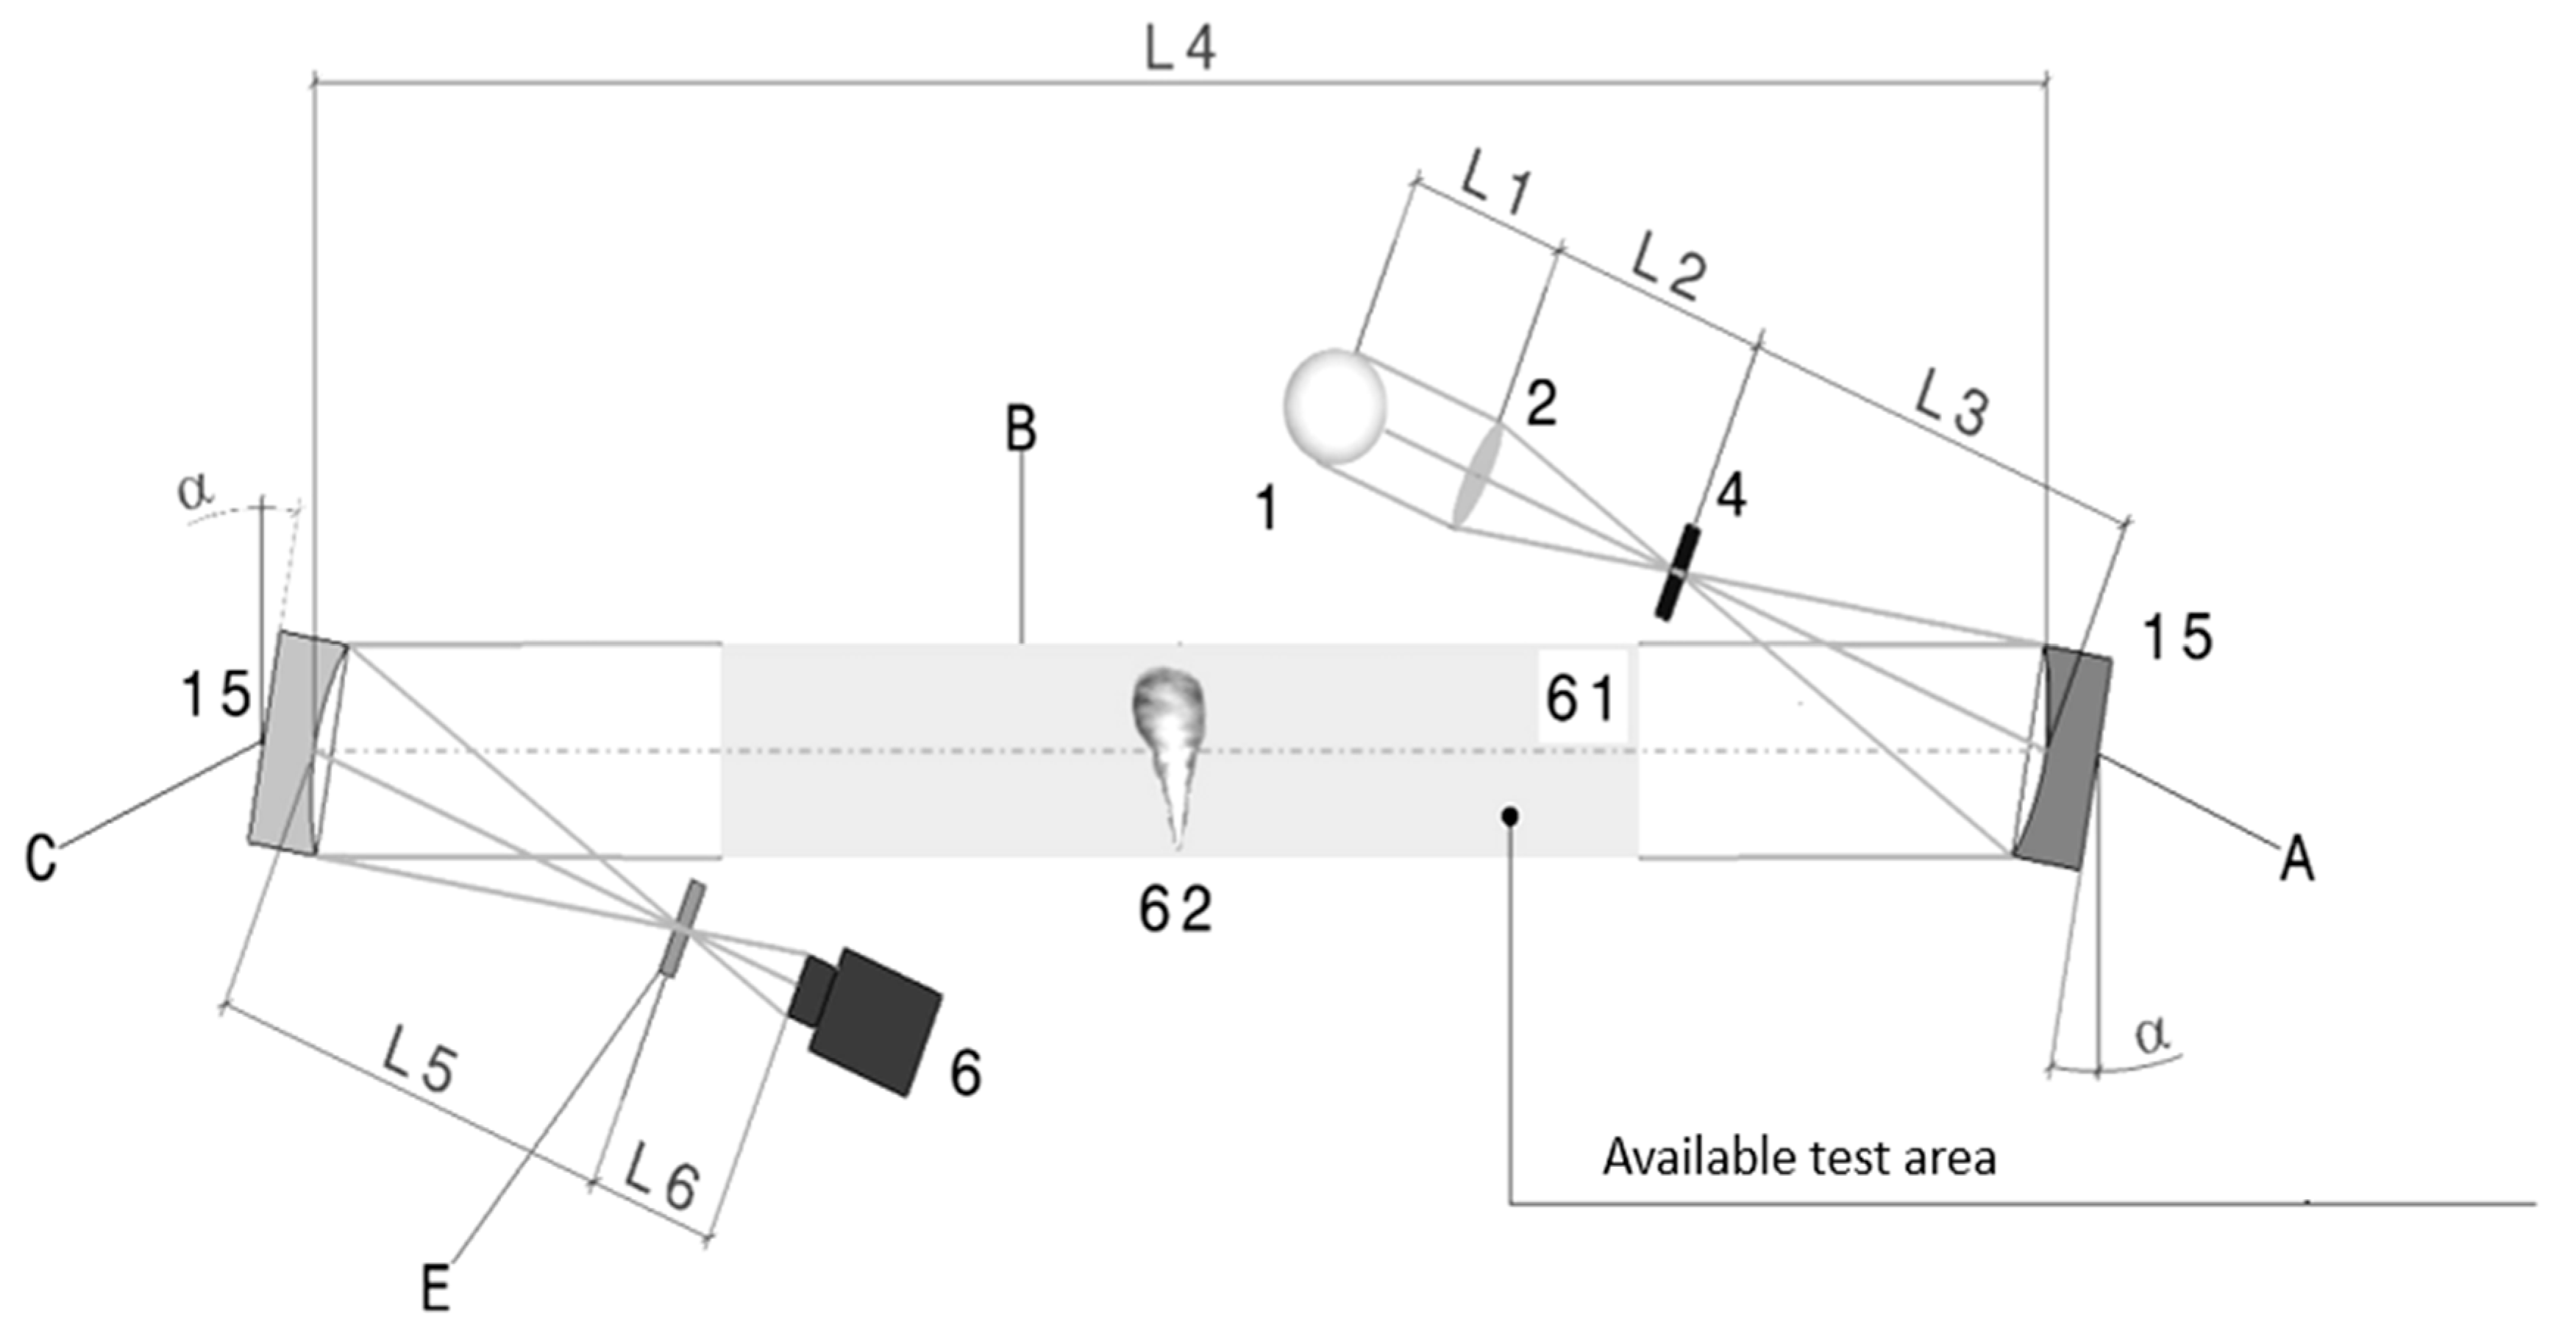
The second parabolic mirror redirects and focuses the light onto a high-speed camera, positioned right after the focal point of the second parabolic mirror. A cut-off knife edge—or, in the case of rainbow schlieren, a color filter—is placed at the focal plane of the secondary mirror. The configuration is named “Z-type” because the parabolic mirrors are rotated slightly about their vertical axes to redirect the light path, creating a characteristic Z-shaped beam trajectory, as seen in
Figure 1a.
The assembly of the final automated system is derived from the challenges presented by the calibration process.
The system presented herein can sustain all types of filters calibrated by translating them onto the light source.
The type of filter chosen for motivating the present paper is the gradual RGB filter presented by Elsinga in [
12]. This filter is a square filter with colors varying as specified by Equations (1)–(3).
Filter sensitivity is directly linked to the size of the filter and the manufacturing method of the filter. This is investigated in [
18], wherein an analysis of the influence of the size of color-calibrated schlieren filters on the general sensitivity of quantitative schlieren systems was conducted [
18]. The study highlights notable differences between 5 mm × 5 mm and 15 mm × 15 mm schlieren filters. While smaller filters enhance image contrast, they can also introduce dark regions in the visual field. In contrast, larger filters produce more measurement points but require longer calibration times.
System sensitivity is calculated with the following formula:
where
represents the filter dimension
represents the dimension of the light source, and f is the focal length of the second parabolic mirror. For the 5 mm × 5 mm filter, the deflection angle registered by the system is
, and
for 15 mm × 15 mm filter [
18]. The color filter is placed in the focal plane of the second parabolic mirror, replacing the classic cut off knife, as shown in
Figure 1, for (a) a Z-type schlieren system and (b) a lens-type schlieren system.
Figure 1.
(a) Schlieren system Z-type: 1—light source, 2—biconvex lens, 3—square diaphragm, 4—first parabolic mirror, 5—test area, 6—second parabolic mirror, 7—color filter, 8—CCD camera, (b) lens schlieren system, 1—light source, 2,3—biconvex lenses, 4—color filter, 5—camera lens, 6—camera sensor.
Figure 1.
(a) Schlieren system Z-type: 1—light source, 2—biconvex lens, 3—square diaphragm, 4—first parabolic mirror, 5—test area, 6—second parabolic mirror, 7—color filter, 8—CCD camera, (b) lens schlieren system, 1—light source, 2,3—biconvex lenses, 4—color filter, 5—camera lens, 6—camera sensor.
The filter is calibrated by translating it on the light source, starting from one corner until reaching the opposite one. For each translation, an image is captured, for example, if the filter dimensions are
, and the light source is
, the calibration curve would have 144 points, while if one keeps the source dimensions but changes the filter dimensions to
, it obtains 25 calibration points. The calibration curves are extracted for each pixel. Examples of calibration points can be found in
Figure 2.
Figure 2.
Calibration curves for square color schlieren filters: (
a) on the R/G and B/R ratio as found in [
17] and (
b) calibration of the graded filter as represented by color ratios, as found in [
13].
Figure 2.
Calibration curves for square color schlieren filters: (
a) on the R/G and B/R ratio as found in [
17] and (
b) calibration of the graded filter as represented by color ratios, as found in [
13].
As a result of the calibration process, the primary need is to have a system independently run calibration sessions. Starting from the filter translation process and ending with data processing, human interaction is needed only for data interpretation and curation.
2.2. Automated System Hardware and Control Mechanism
A color filter is characterized by two main aspects: the level of sensitivity it provides to the schlieren system (its ability to accurately represent both the smallest and the largest density gradients) and the ease of implementation, which is directly influenced by the type of color distribution across the filter image (such as a gradual RGB spectrum distribution or a segmented color distribution, etc.). The system is composed of six subassemblies, A, B, C, D, E, and F, connected by individual elements and other elements different from the subassemblies’ elements, positioned at heights H1 and H2, where H1 is variable and H2 is fixed. The subassemblies are positioned in a Z-type schlieren configuration, as seen in
Figure 3.
Figure 3.
Illustration of how to position the calibration system within a Z-type schlieren setup, where L1—the distance from the light source to the lens, L2—the focal length of the biconvex lens, L3—the focal length of the parabolic mirror, L4—the distance between parabolic mirrors (always at least twice the focal length of the parabolic mirror), L5–the focal length of the second parabolic mirror, and L6—the distance between the knife edge and the CMOS sensor (these distances are kept constant throughout the figures), is the angle between the mirror and the system’s axis, and A, B, C, and E are the subassemblies.
The light source (1) is electronically controlled through the cable (11), fixed on the breadboard (12) with the support (7) and a rod (6) and an adaptor (9) through the screw plate (8) and metric screws (10). A biconvex lens (2) used for light focusing is fixed on the optical breadboard table (12) with a lens positioning support (3). The lens adaptor (13), fixing rod (7), screw plate (8), and metric screws assure lens (2) positioning. The light produced by the circular light source is focused into a round image at the focal point of the biconvex lens. In the focal point of the biconvex lens, a square diaphragm (4) is positioned, reducing the light image to a square, with dimensions dictated by the diaphragm opening (for the current case, the dimensions of the diaphragm are between , shaping the square light fascicle (5)). The square diaphragm is fixed on the optical table (12) through a rod (6) and a support (7) through the fixing plate (8).
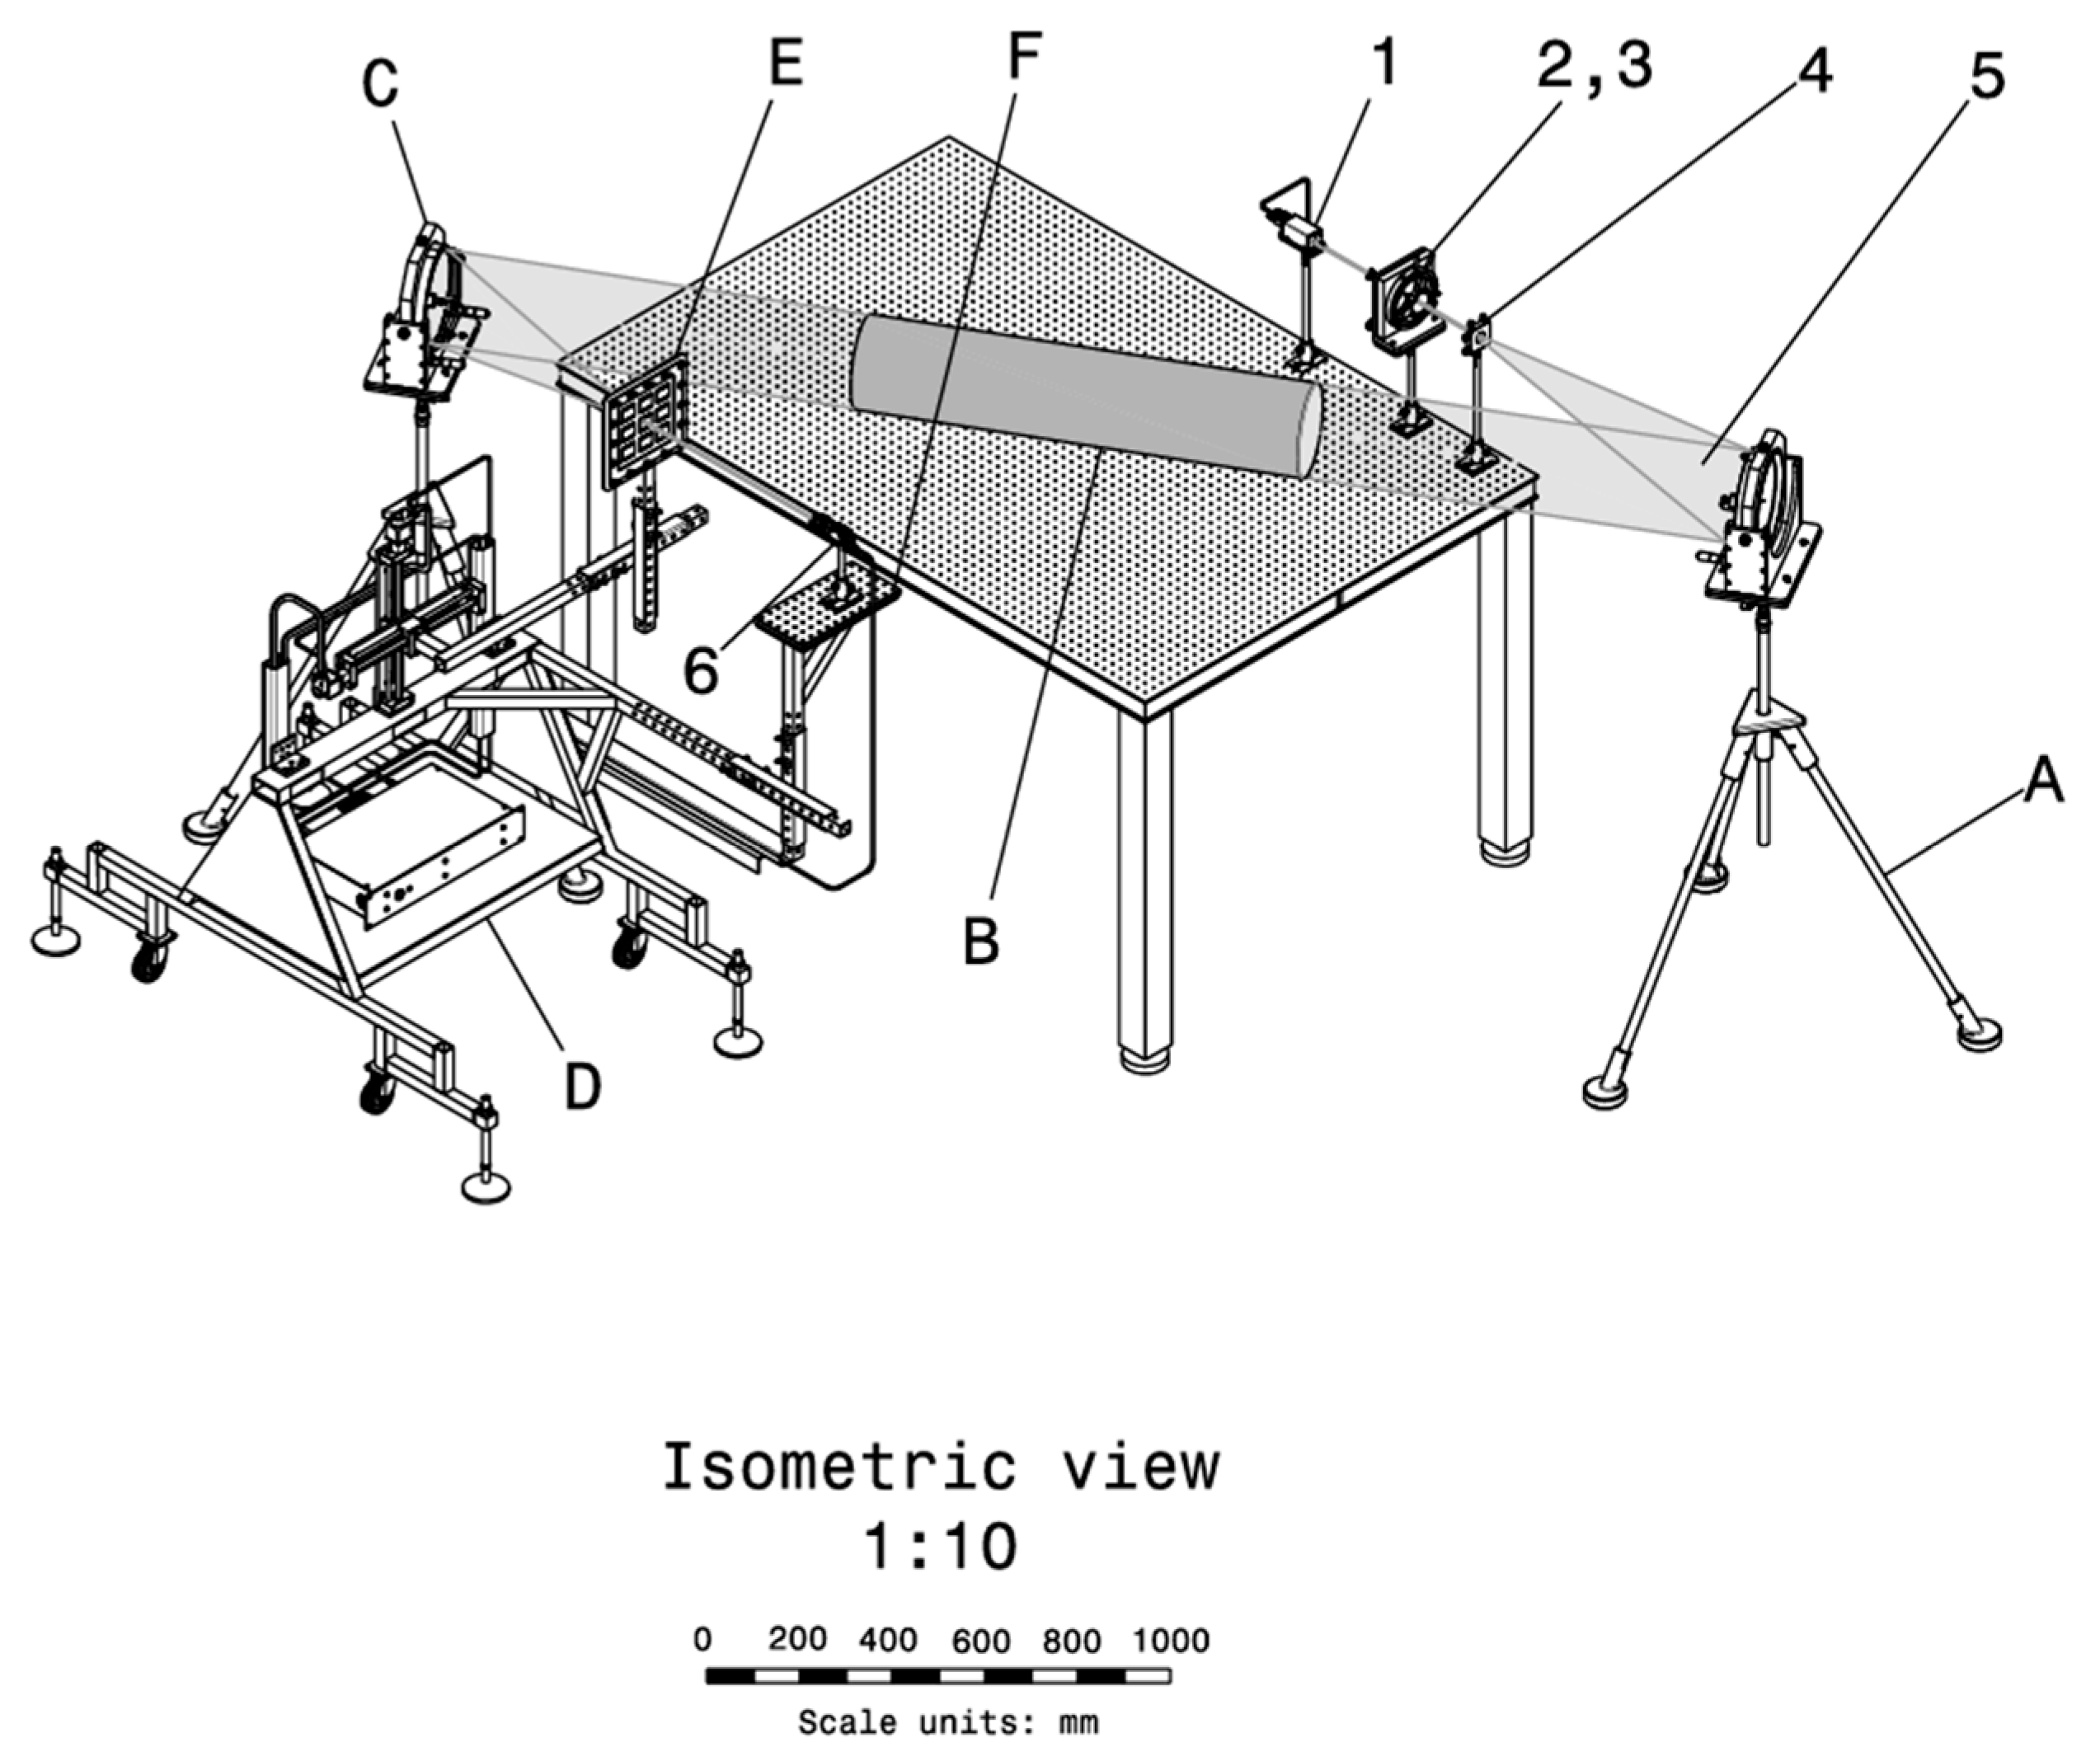
Subassembly A is composed of a parabolic mirror (15) with a large diameter (for this case, ~250 mm), supported vertically by the micrometric mirror position adjustment system (16), positioned on the ground with the tripod (22) and other auxiliary elements: the parabolic mirror support plate (17), metric screw (18), flat washer (19), grower washer (20), and metric nut (21). Subassembly A and its components are depicted in
Figure 4, while its integration within the general system can be seen in
Figure 4.
Subassembly B is integrated in the general system (
Figure 4 and
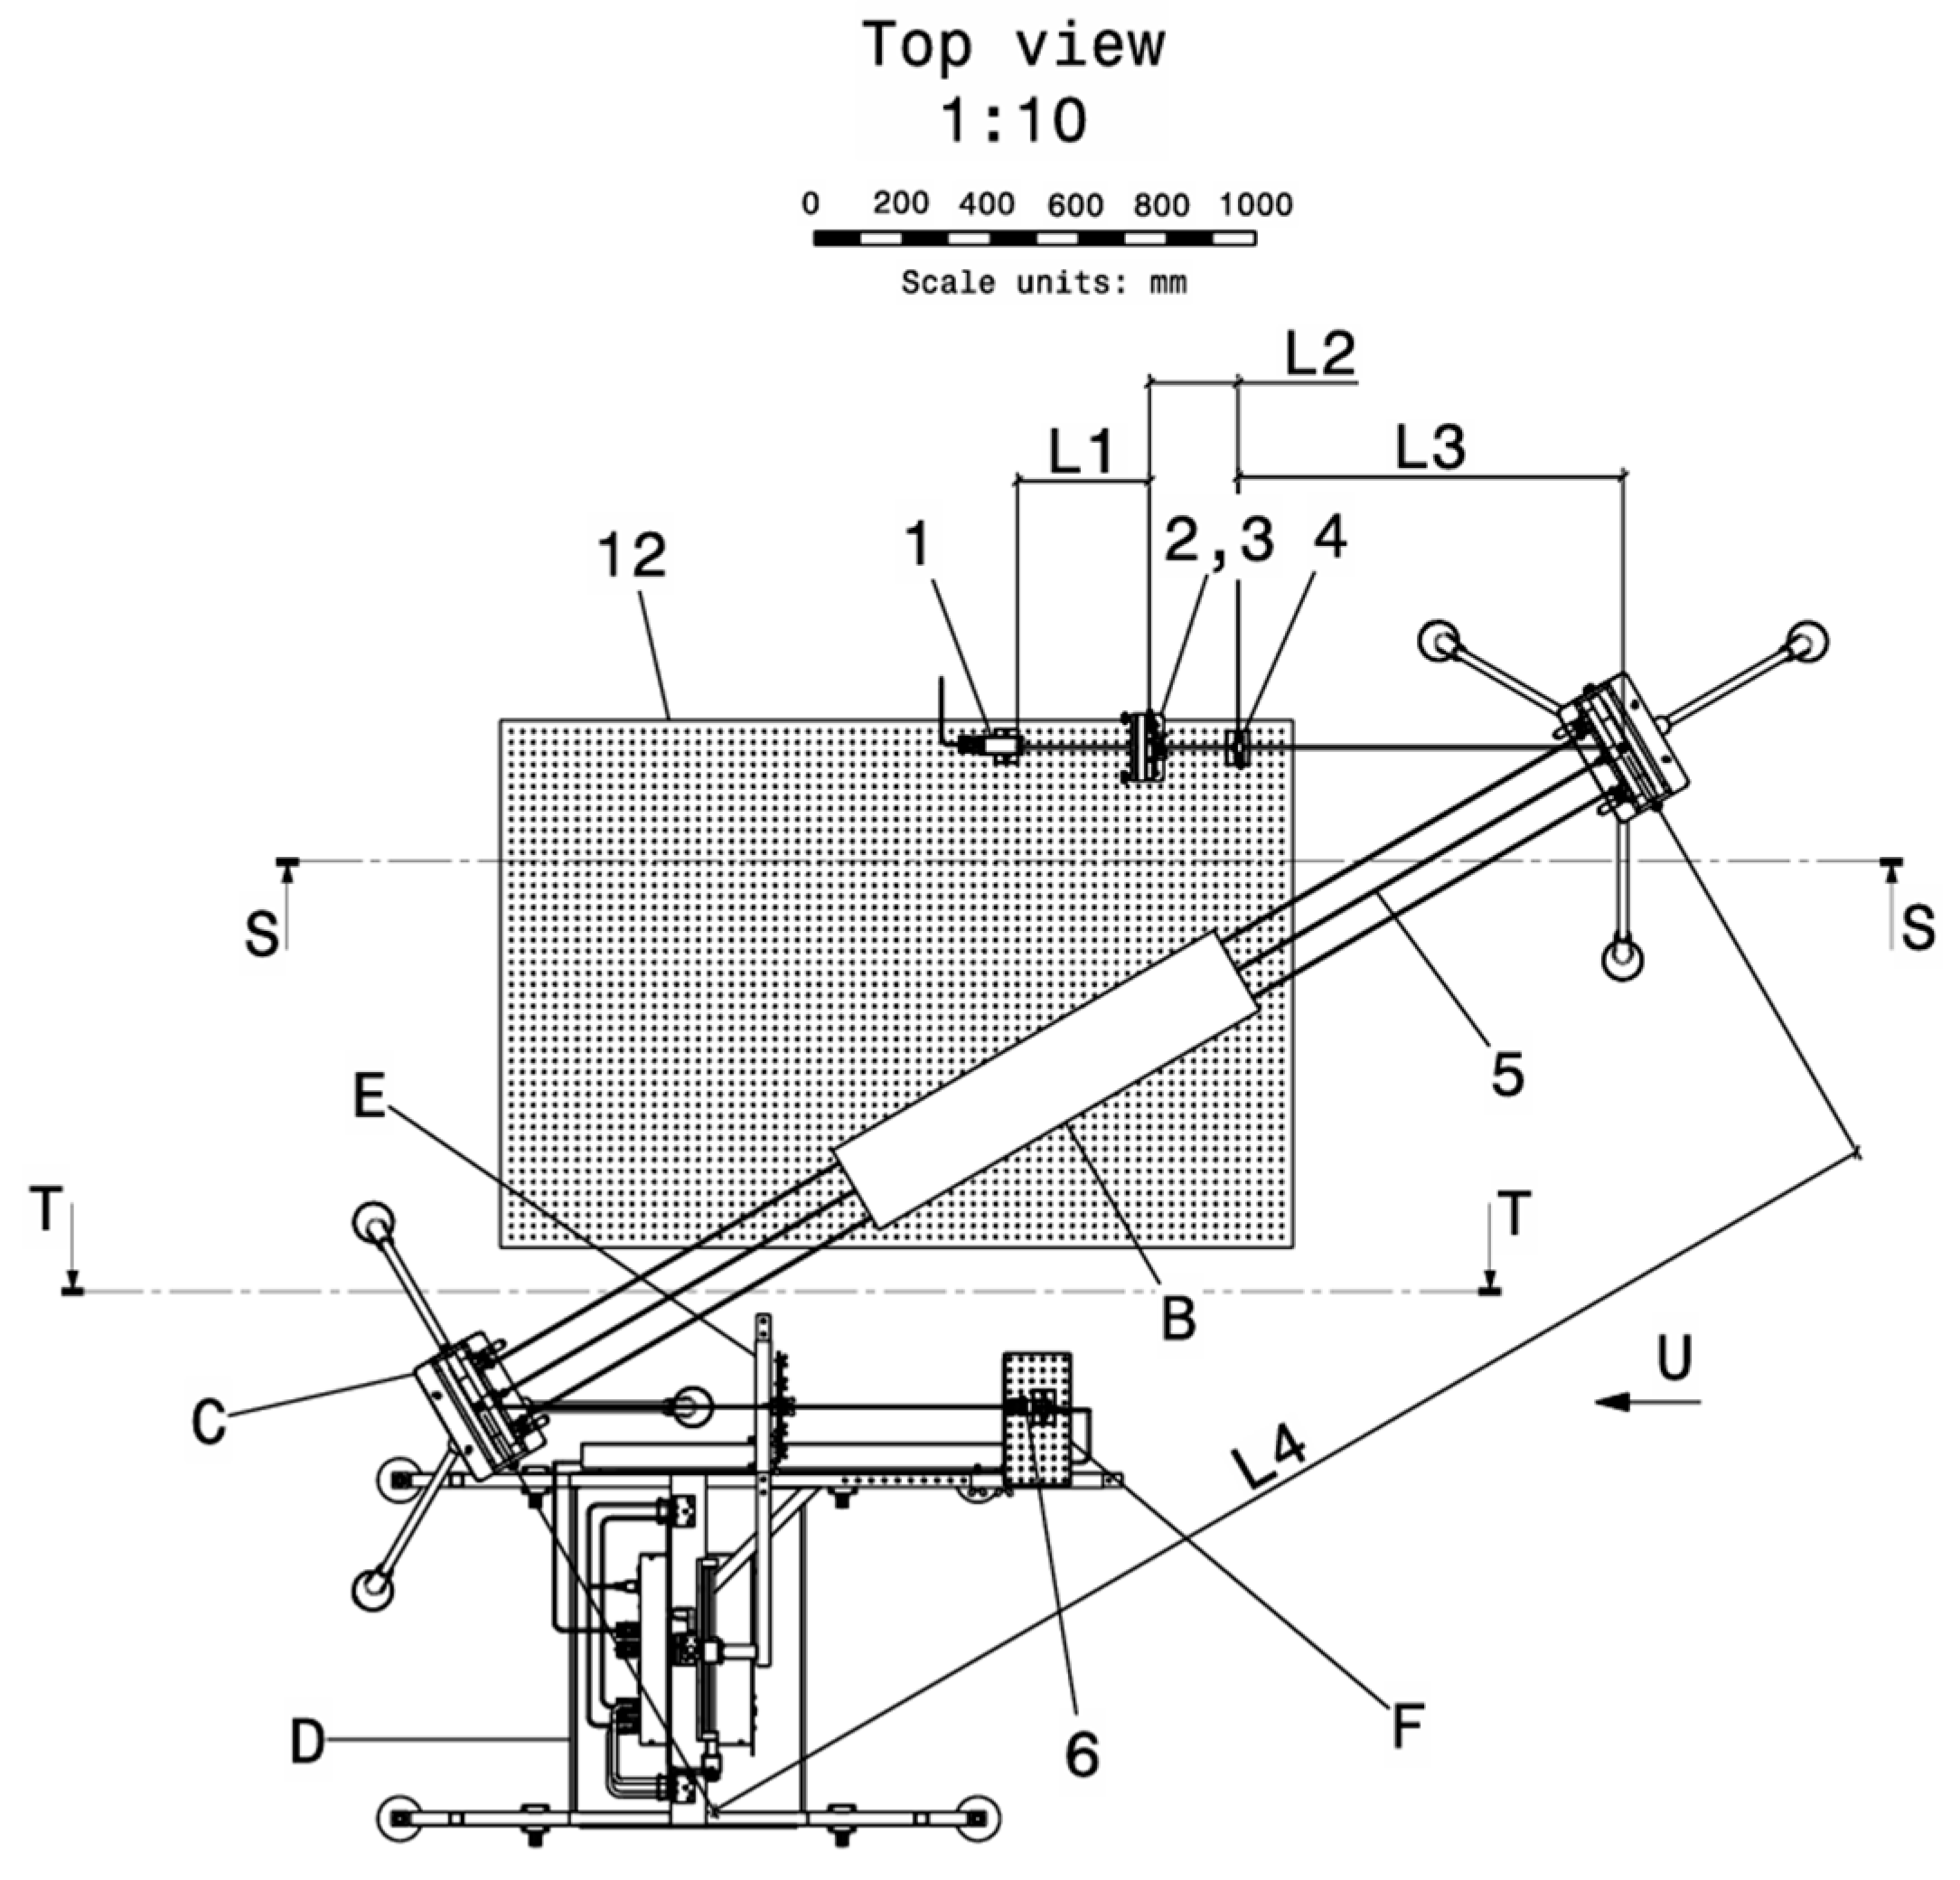
Figure 5), and it is composed of the testing area (61), containing the analyzed phenomena (62), which are schematically described in
Figure 3.
Subassembly C is composed of a parabolic mirror (15), supported by the micrometric mirror position adjustment system (16), fixed on the ground by the tripod (22), with metric screws (18), flat (19) and grower (20) washers, and a metric nut (21). It is integrated into the general assembly, as represented in
Figure 5, and its components can be observed in
Figure 6.
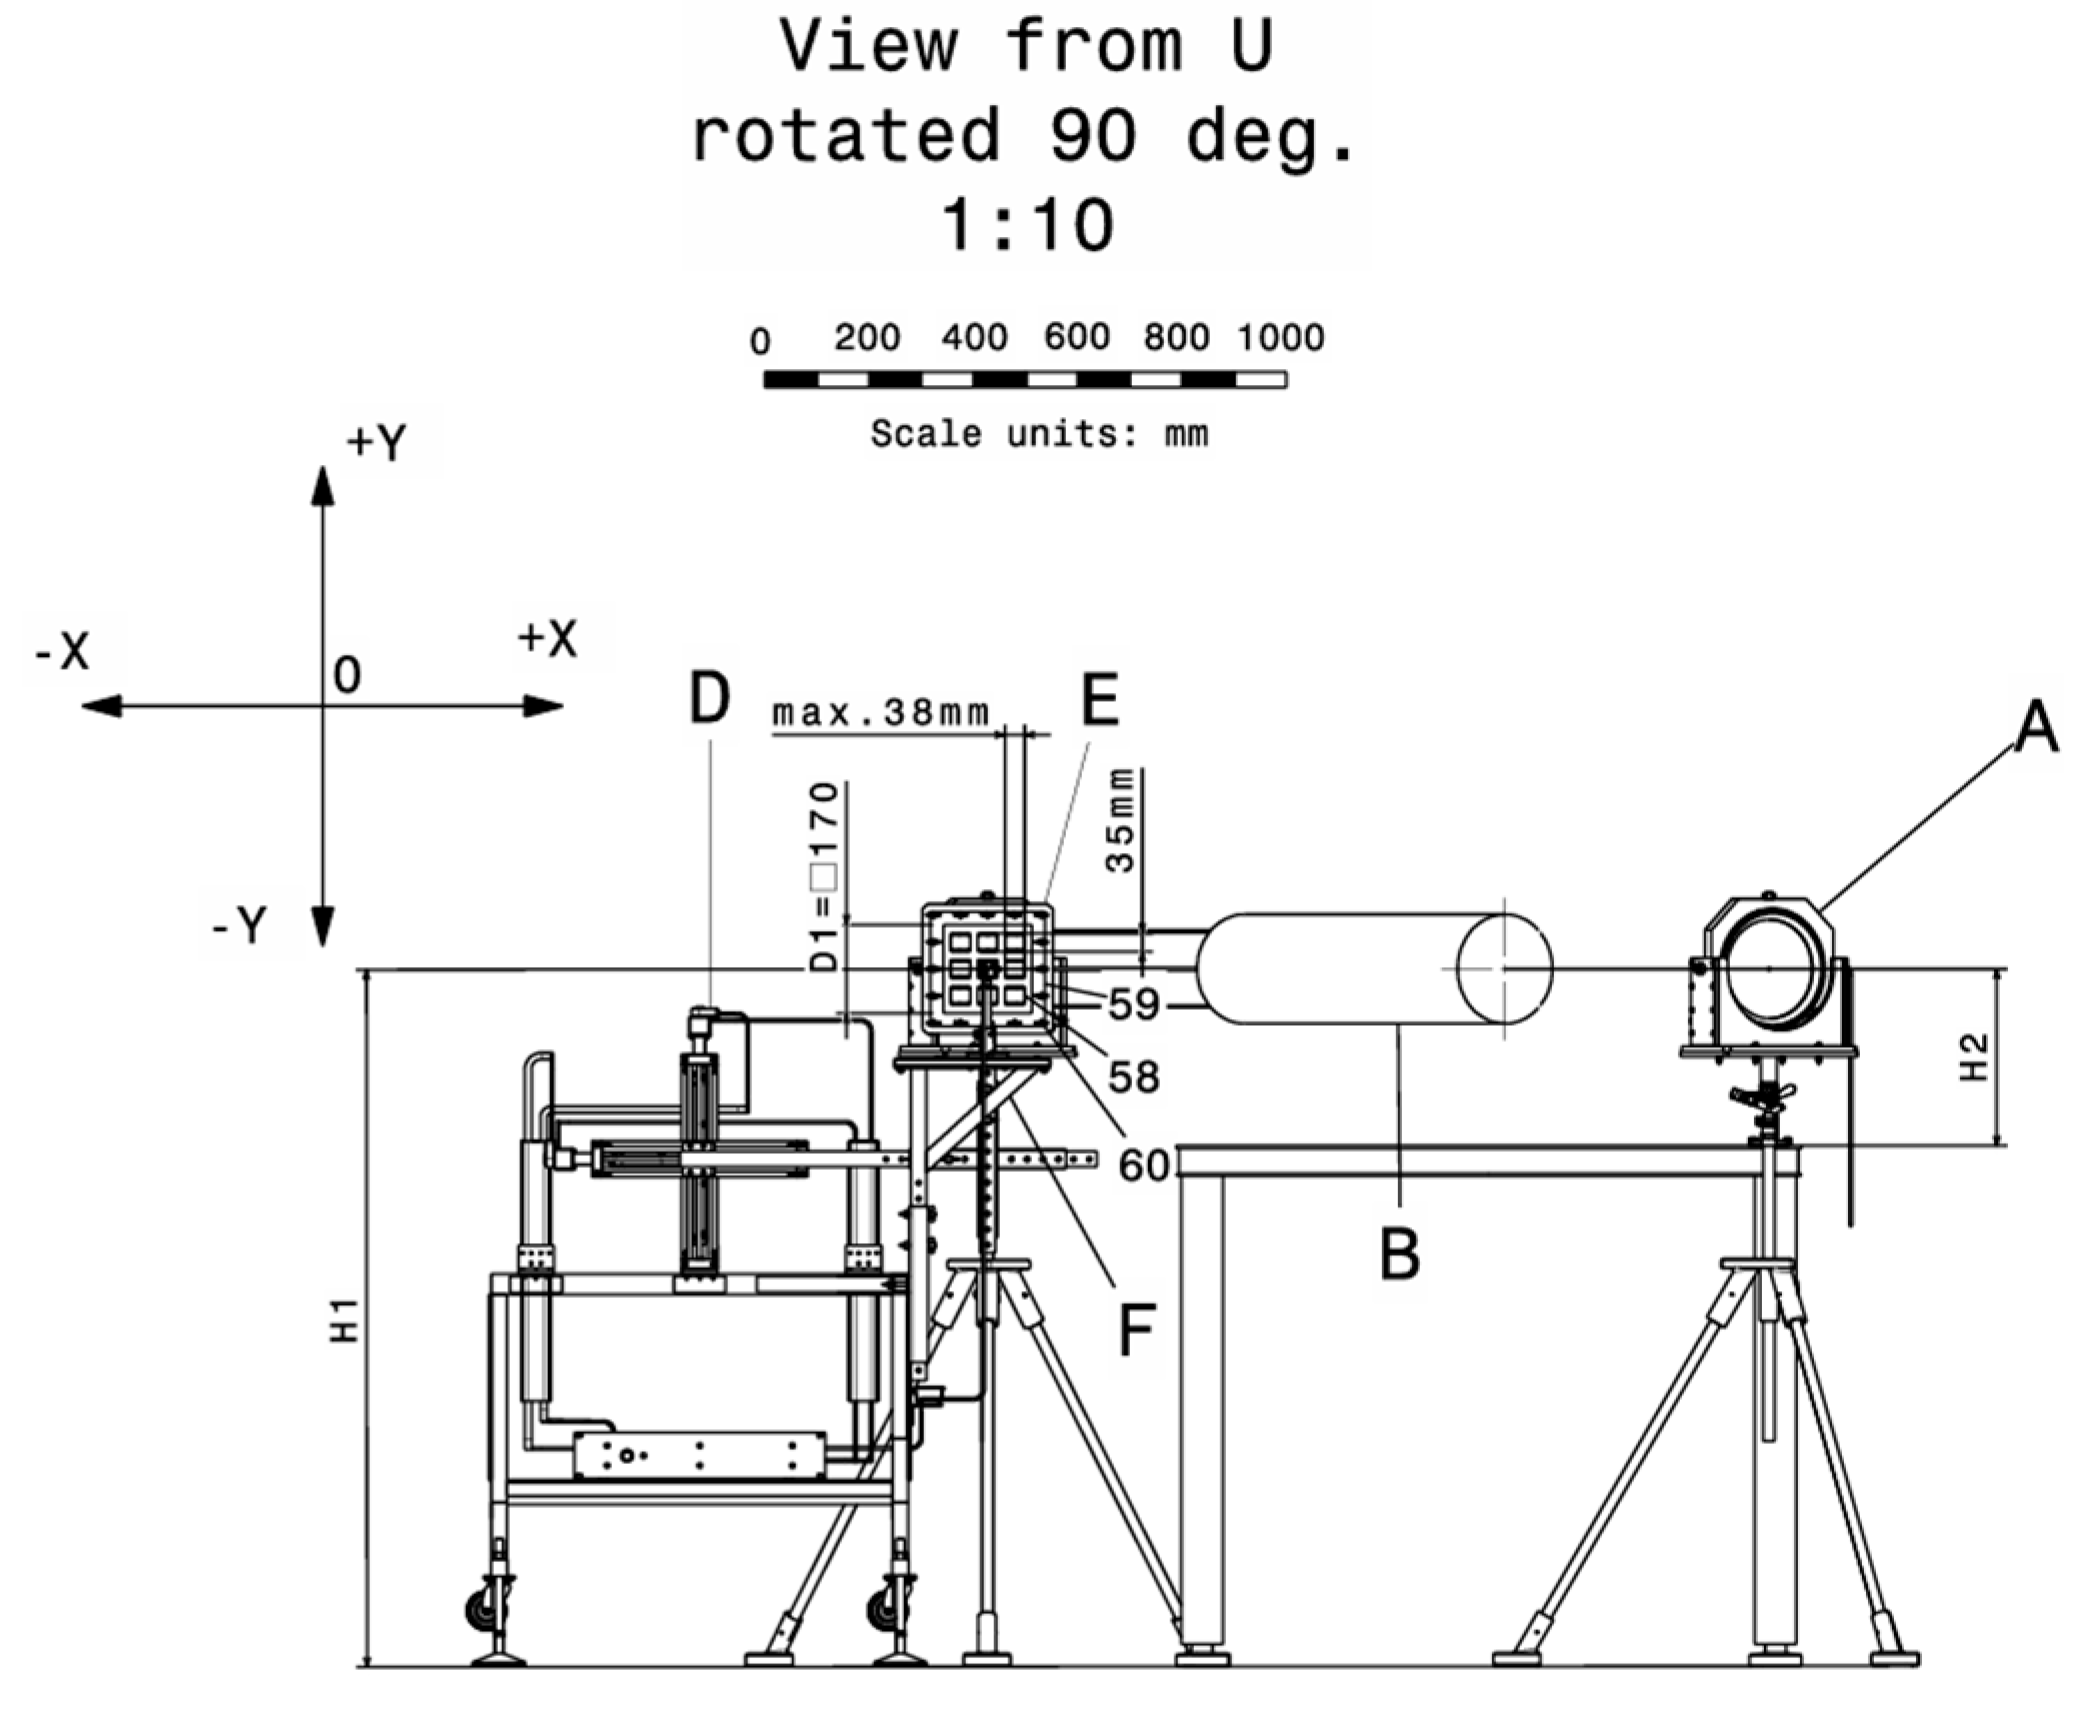
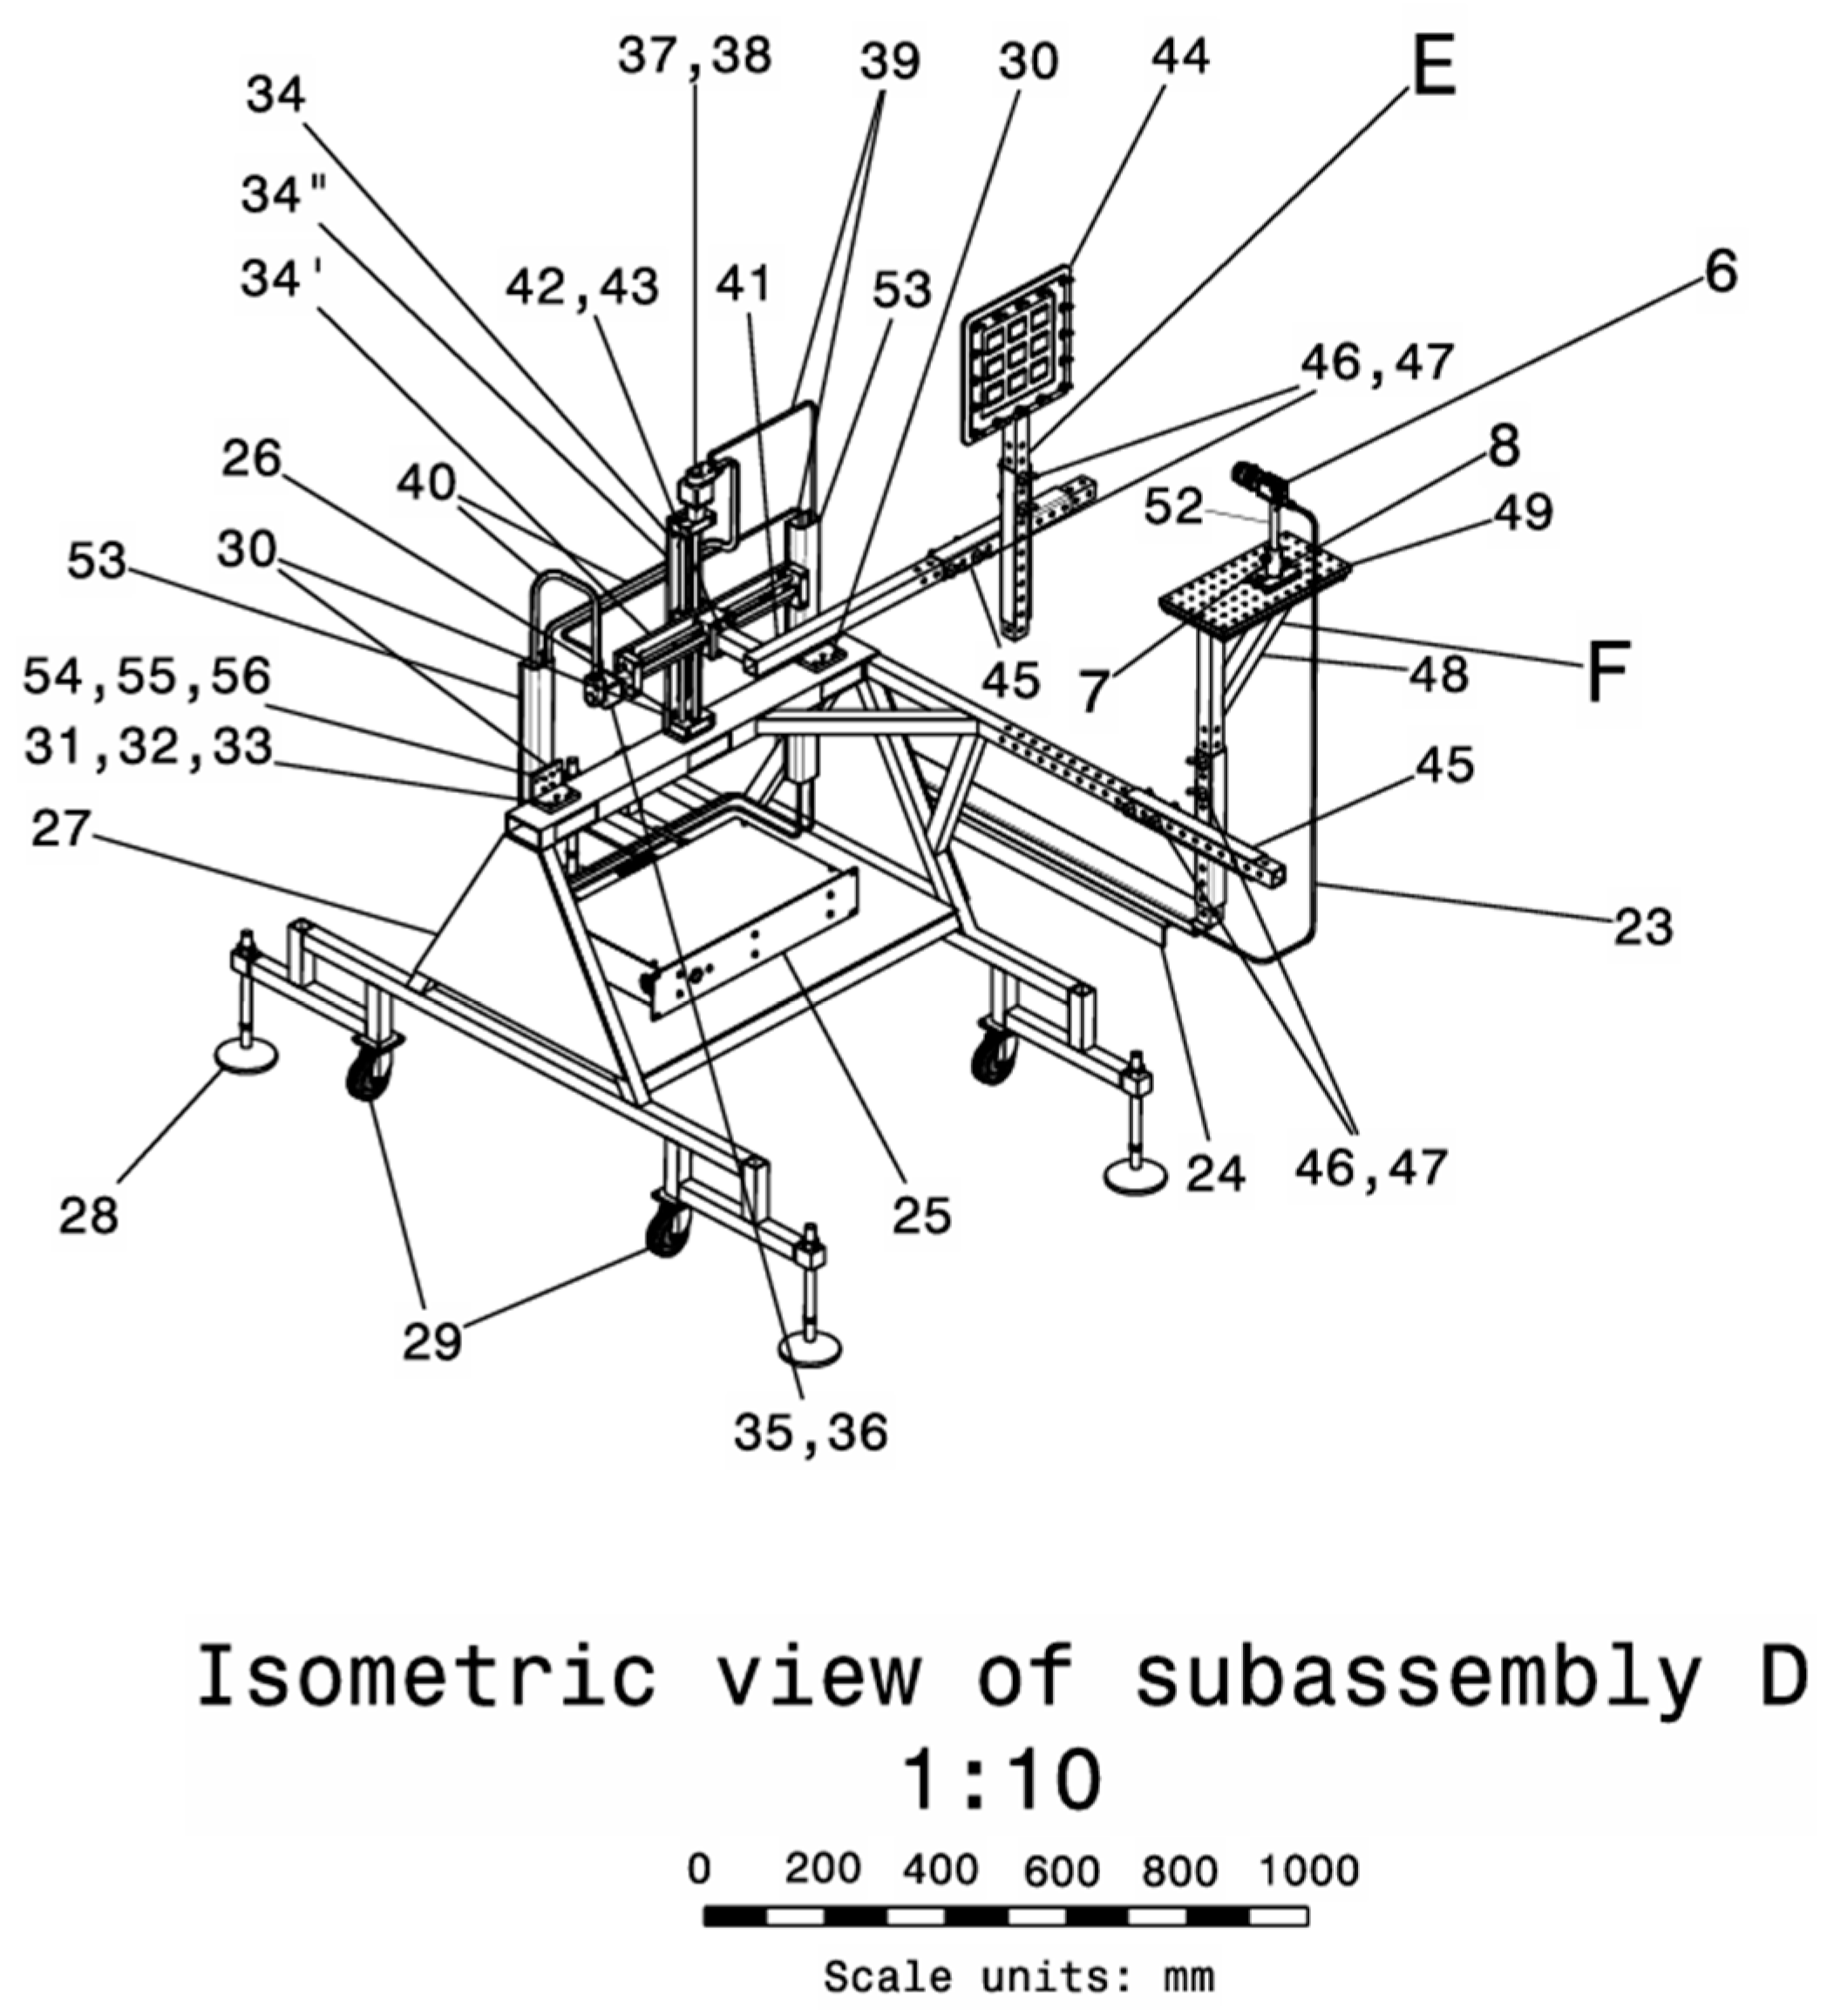
Subassembly D is composed of a metallic support (27) with four adjustable feet (28). The subassembly can be repositioned due to the rotating wheels (29). The metallic support holds the X-Y robotic system (34), fixed on (27) through the L profile (30) and fixing screws (31), grower washer (32), and nut (33). The robotic system (34) contains the two mobile arms (34′) and (34′′) which assure the horizontal and vertical movement of the angled bracket (41), fixed with metric screws (42) and a grower washer (43). The subassembly’s integration within the system can be observed in
Figure 8, while the components’ order and montage are depicted in
Figure 7.
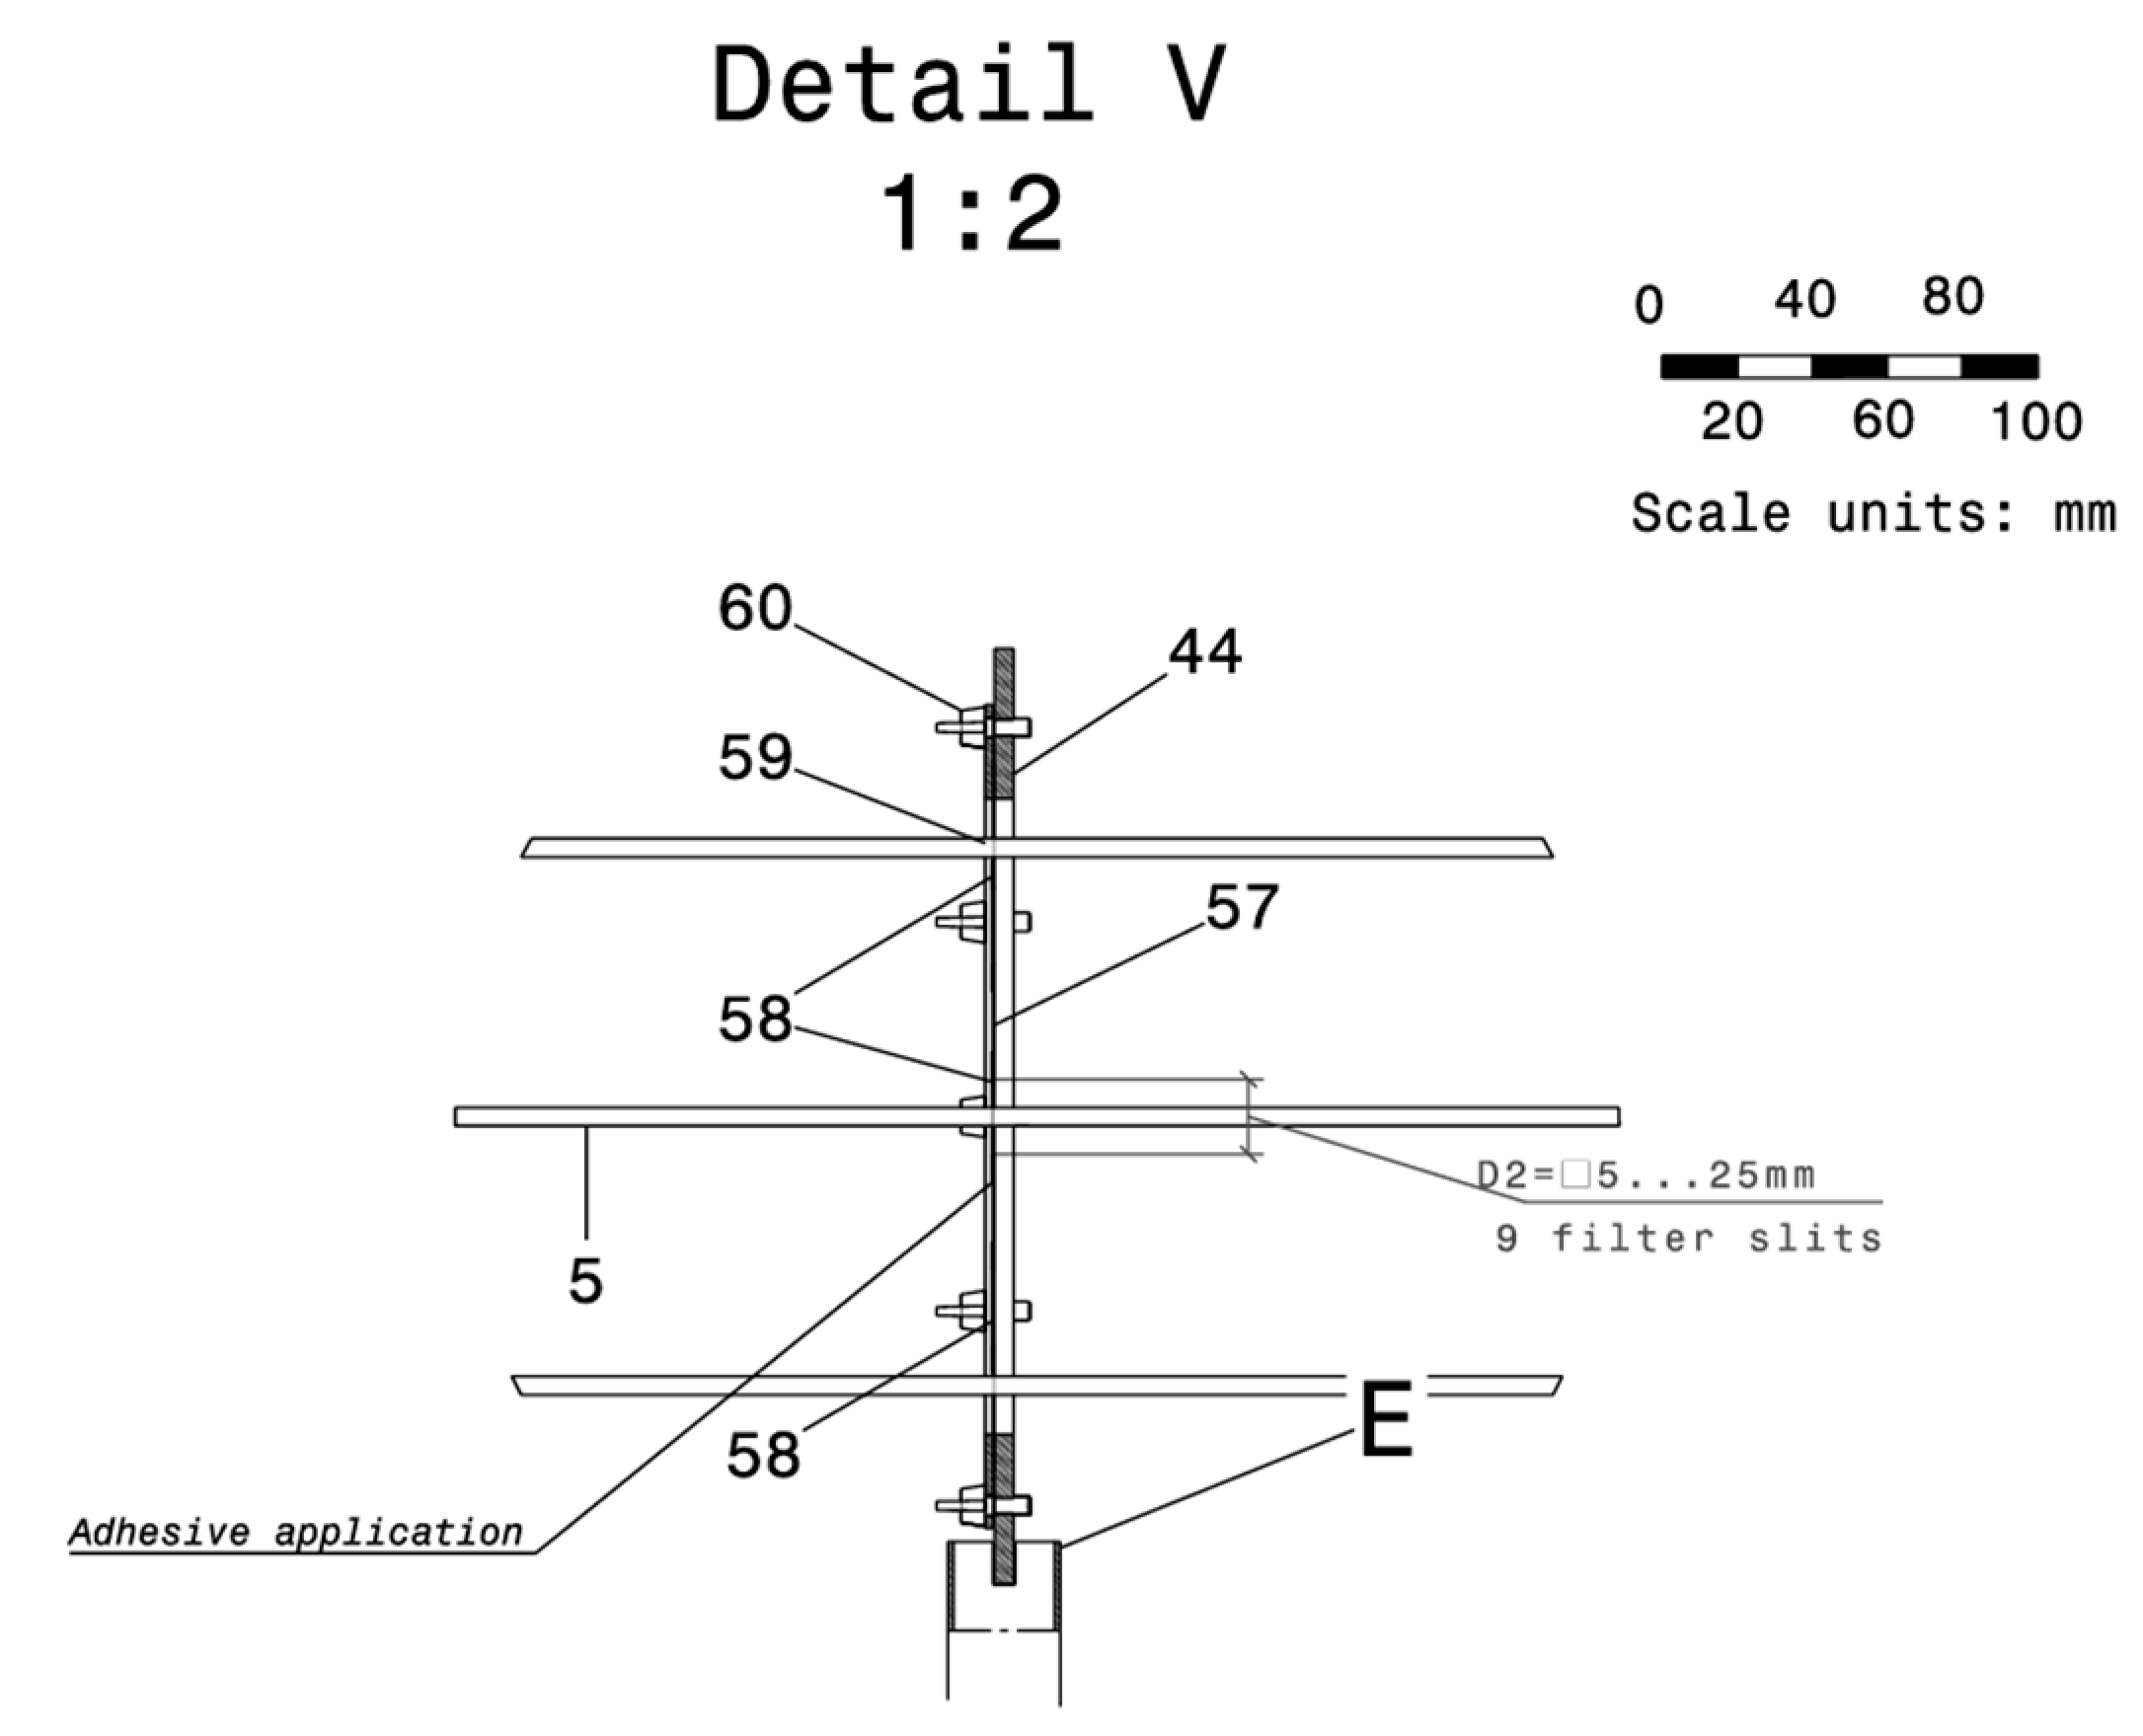
Subassembly E is mounted on the subassembly D, through the mounting cross (54) and the wing screw (46) with the wing nut (47), and it is composed of the color filter holder support (44) and the plate for fixing the color filter (57), which can be glued in. The color filters (58) can be manufactured from photographic film or colored gelatin strips and, in the current configuration, can have dimensions up to
. Given this advantage, it can be fixed on the plate (57) with a proper commercially available adhesive. The pressing plate (59) is fixed with a wing screw (60). Subassembly E is integrated into the general assembly according to
Figure 4, and the components are depicted in the V detail in
Figure 10.
Subassembly F is part of subassembly E. Subassembly F is composed of the support (48) on which the optical table top is mounted (49), fixed with metric screws (50) and the grower washer (51), which are fixed on the metallic support (27) through the mounting cross (45) and support (7) fixed on the optical breadboard table (49) with the metric screws (8) and rod (52), which supports the high speed camera (6), which can be controlled with a trigger cable (23). The trigger cable (23) crossed the mechanical through (24) to reach the control module (25), dedicated to the X–Y robotic module (34), harvesting the electrical signal of the step motors (35), (37), through the signal cables (40) and power cables (39) which are kept separate to minimize interferences and are directed toward the control module (25) through the mechanical throughs (53), fixed on the L profiles (30) with screws (54), a flat washer (55), and a nut (56). Subassembly F is mounted within the general assembly according to
Figure 4, and the components are depicted in
Figure 9, while
Figure 10 illustrates the details of the montage.
Figure 4.
Isometric overview of the installation, where subassemblies A, C, E, and F are presented.
Figure 4.
Isometric overview of the installation, where subassemblies A, C, E, and F are presented.
Figure 5.
Top view of the installation with all of the system’s subassemblies and appropriate distances.
Figure 5.
Top view of the installation with all of the system’s subassemblies and appropriate distances.
Figure 6.
S-S section through the assembly (as per
Figure 5).
Figure 6.
S-S section through the assembly (as per
Figure 5).
Figure 7.
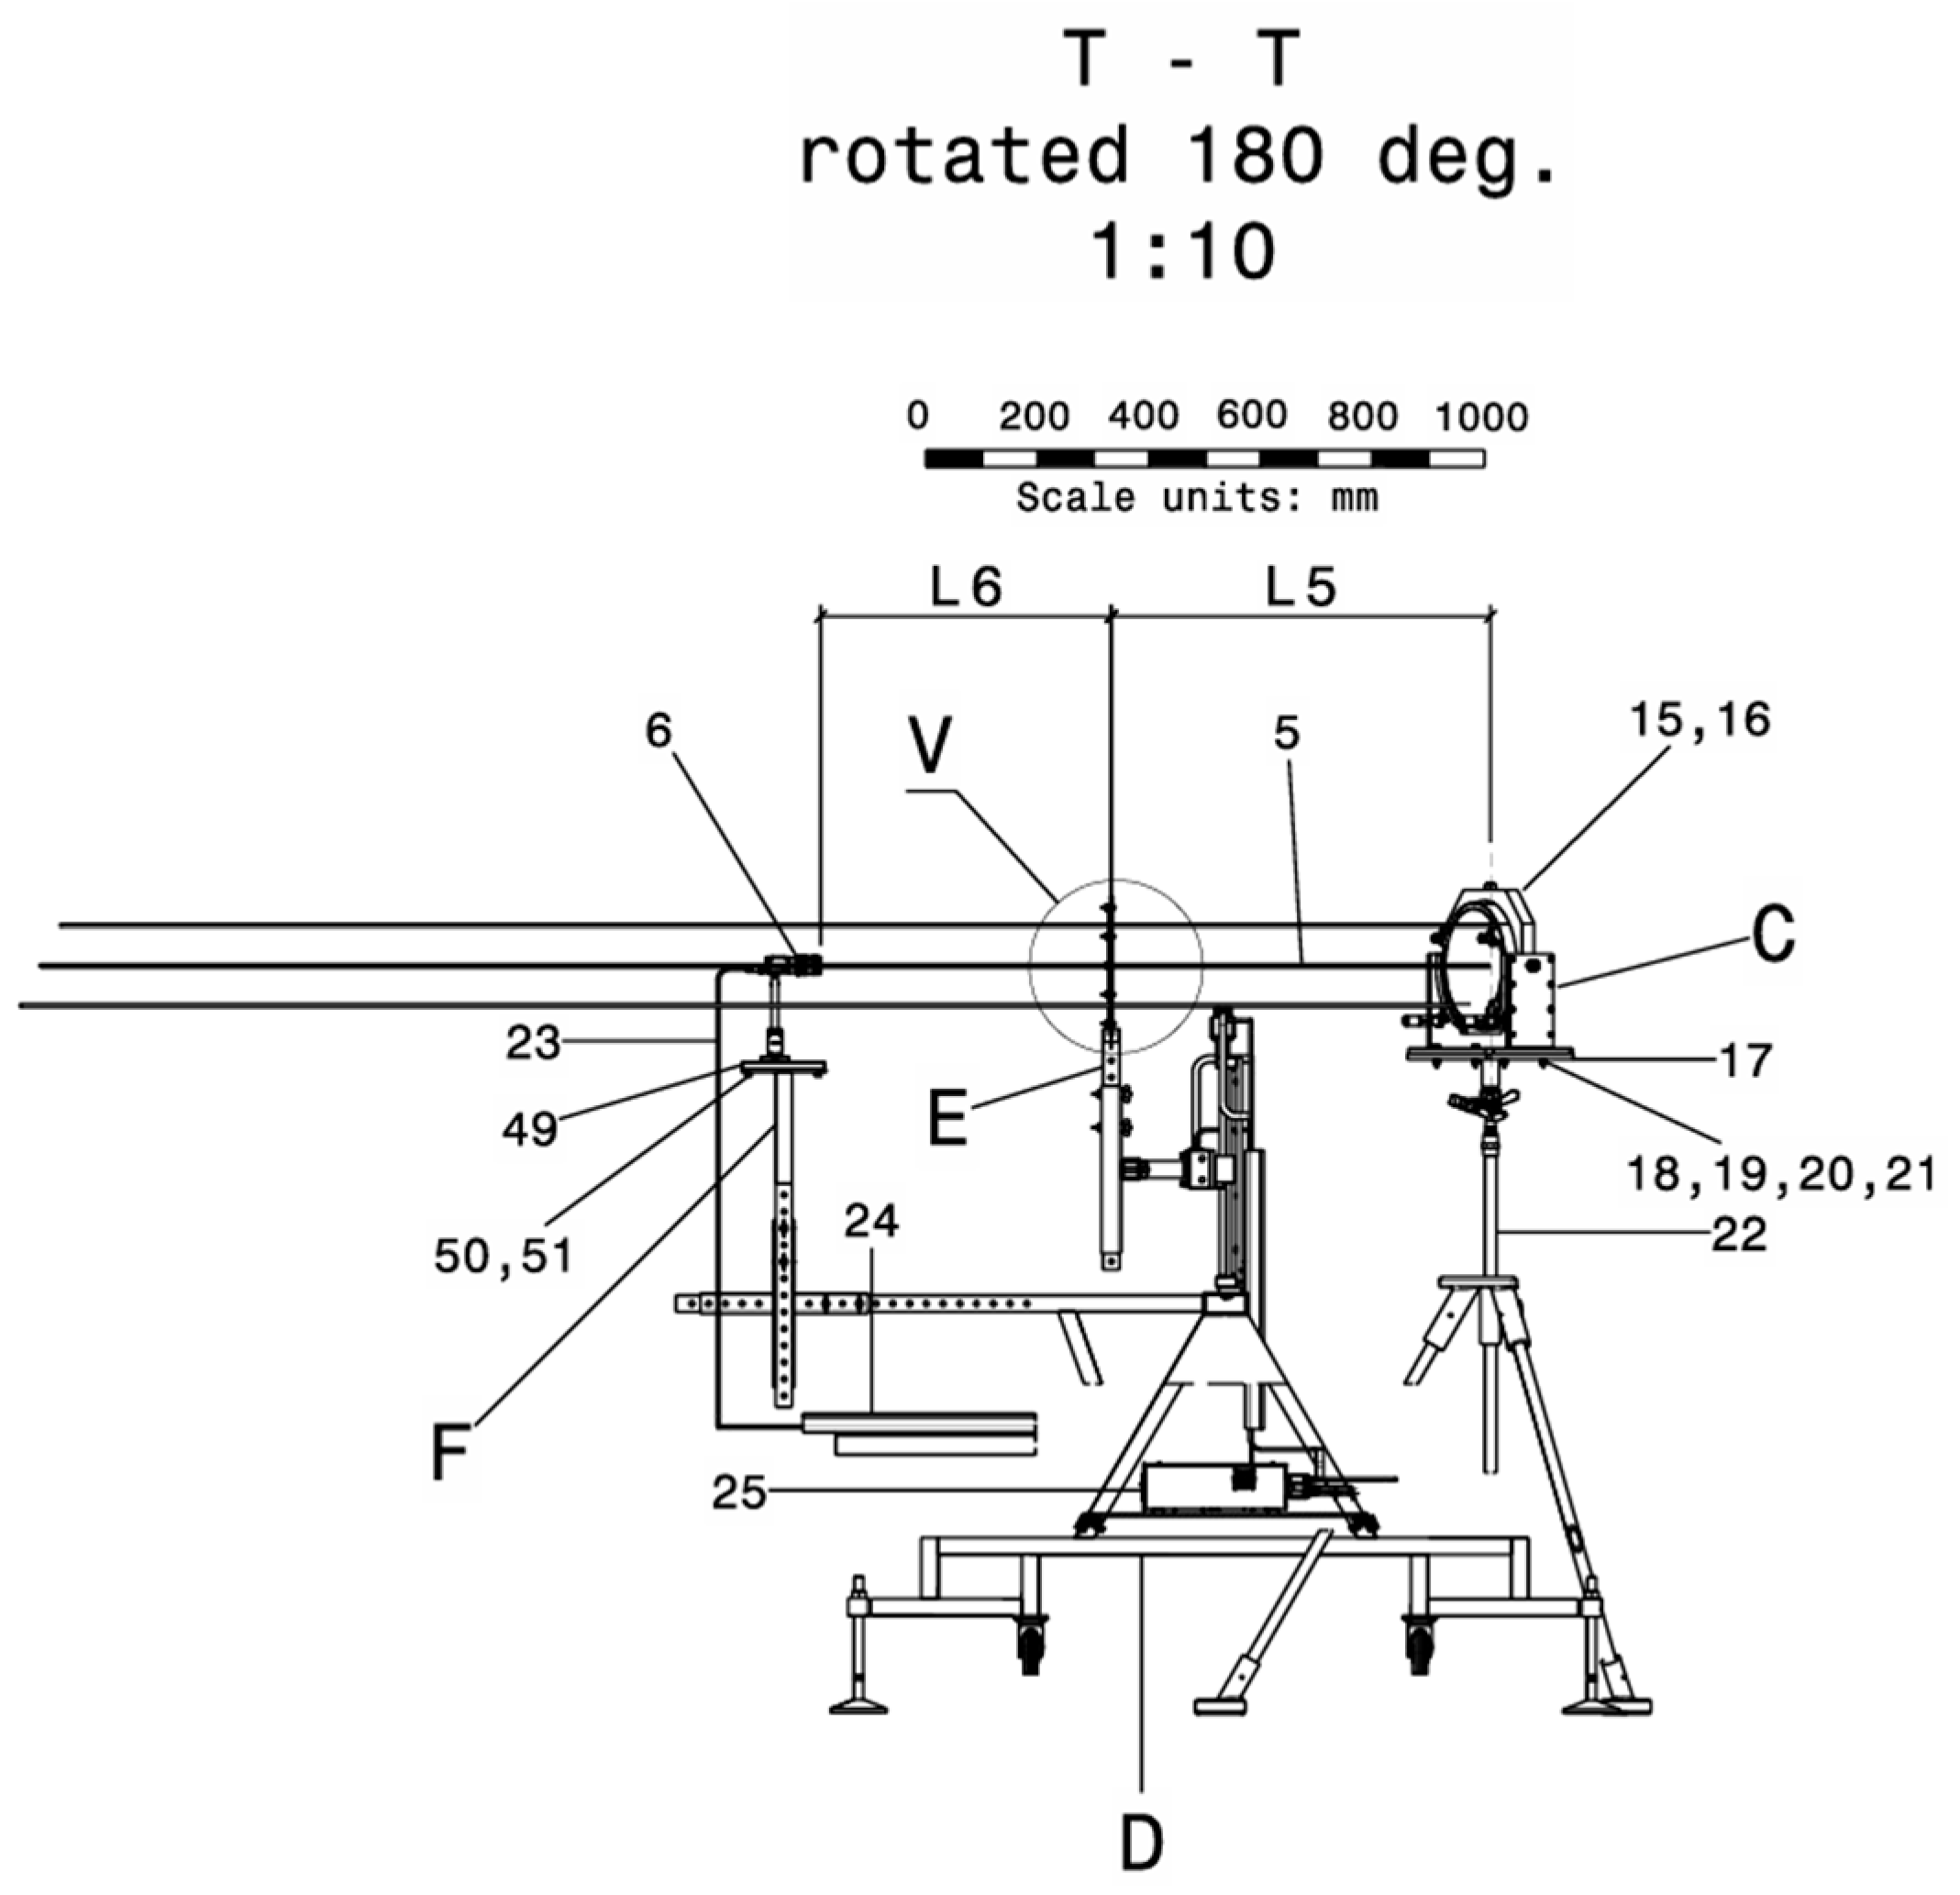
Section T-T (as per
Figure 5).
Figure 7.
Section T-T (as per
Figure 5).
Figure 8.
X-Y robotic system (view from U, angled at 90).
Figure 8.
X-Y robotic system (view from U, angled at 90).
Figure 9.
View from U (from
Figure 5), highlighting the calibration system.
Figure 9.
View from U (from
Figure 5), highlighting the calibration system.
Figure 10.
Montage from the V detail in
Figure 5, with square holes.
Figure 10.
Montage from the V detail in
Figure 5, with square holes.
2.3. System Workflow Description
The automated calibration system is capable of capturing and processing images to generate pixel calibration curves without requiring human supervision or intervention. These curves can be manually refined or corrected by adjusting post-processing parameters or modifying the source code, allowing for greater flexibility.
An implementation of calibration curve extraction using the method proposed by Elsinga [
13] is detailed in [
21], where user-friendly MATLAB applications with graphical user interfaces (GUIs) are provided to streamline the process. Both pre-processing and post-processing GUIs support the extraction and refinement of calibration curves, as well as the adjustment of frames containing the phenomenon under investigation.
Pre-processing tools enable the system to focus on specific regions of interest (ROIs), filtering out irrelevant pixels and thereby reducing computation time. The post-processing application includes multiple steps for deriving calibration curves from various filter types, including the gradual color filter used in the aforementioned system.
Once the calibration curves are extracted, physical parameters can be computed from the schlieren images. These include velocity maps, density gradient fields, temperature distributions, and pressure fields, among others. To accurately retrieve these parameters, appropriate equations and coefficients must be defined and applied. Furthermore, experimental conditions specific to each test case must be considered to minimize potential errors.
Because flow characteristics and experimental setups vary, the data post-processing application should be tailored to each scenario. Nevertheless, even when human oversight is incorporated, the automated system significantly reduces processing time, thanks to the iterative nature of data analysis.
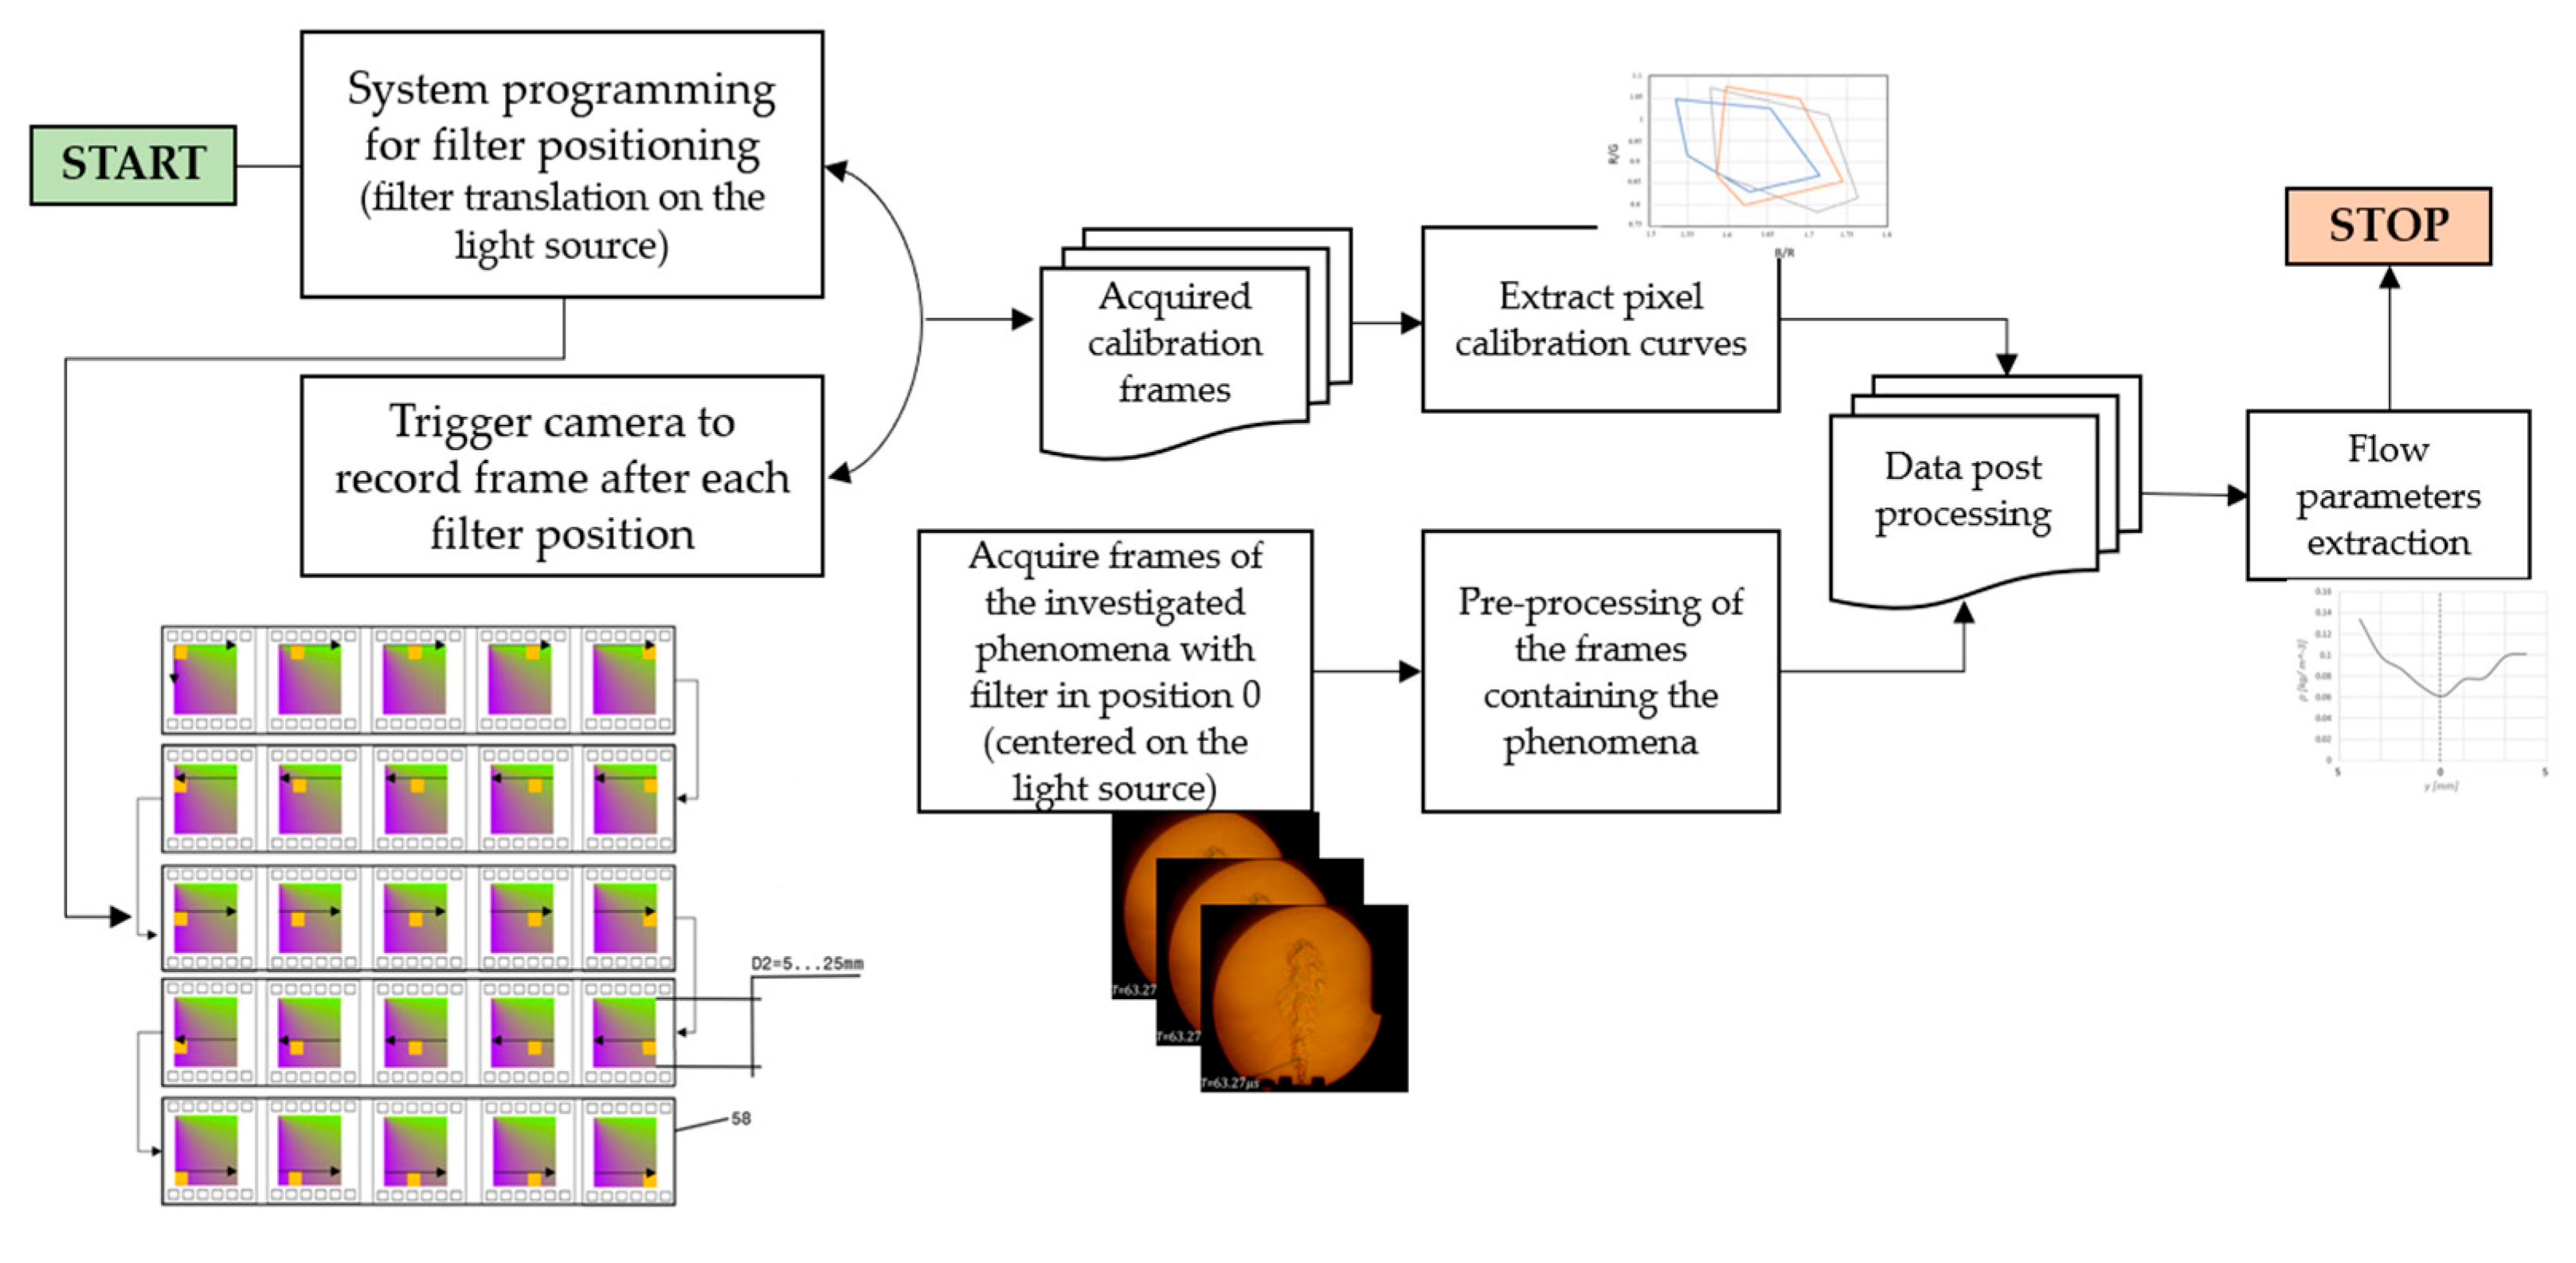
A more edifying scheme of the automated process can be found in
Figure 11.
Figure 11.
Automation process schematics with images from the test case described in [
17].
Figure 11.
Automation process schematics with images from the test case described in [
17].
3. Discussion
The implementation of an automated calibration system for schlieren color filters represents a substantial advancement in the field of optical flow diagnostics, both in terms of experimental efficiency and measurement precision. Drawing from the authors’ extensive experimental experience and practical deployment of the system, the improvements offered by automation are both quantifiable and significant.
Traditionally, the calibration of color schlieren filters involves a labor-intensive process that requires manual adjustments at each filter position—typically 20 to 30 steps per calibration session, with each step taking between 5 and 10 min. This process results in a total calibration time ranging from 2 to 5 h per experiment. In contrast, the automated system performs the full calibration in approximately 15 to 30 min, reducing the total processing time by up to 90%. This dramatic reduction in time not only increases experimental throughput but also enables more frequent recalibration when conditions change, enhancing experimental robustness.
Beyond efficiency, the system delivers a marked improvement in positional accuracy. Manual filter positioning introduces a mechanical uncertainty typically in the range of ±50–100 µm, stemming from user handling and backlash in adjustment mechanisms. The automated system, utilizing precision motion controllers and an integrated feedback loop for iterative optimization, reduces this uncertainty to ±1–10 µm. This enhanced accuracy directly improves the fidelity of pixel calibration curves and the resolution of extracted flow fields, minimizing the propagation of error during post-processing and field reconstruction. Moreover, automation eliminates operator-induced variability, a factor often overlooked in traditional calibration workflows but crucial for scientific reproducibility. The system’s ability to follow an identical calibration protocol across experiments ensures that variations in data are primarily due to physical changes in the flow field rather than inconsistencies in setup or procedure.
An important feature of the system is its compatibility with larger color filters. These filters, shown through both analytical modeling and experimental validation, enhance the system’s sensitivity by approximately 10–20%. The increased spatial and chromatic resolution translates into improved contrast and better detectability of fine flow structures—especially in high-gradient regions such as shocks, shear layers, or thermal plumes. This improvement directly impacts the accuracy of the derived parameters such as velocity, pressure, temperature, and density gradients, which are critical in many high-speed and reactive flow studies.
Despite these advances, certain limitations must be acknowledged. The final calibration quality remains partially dependent on the intrinsic characteristics of the flow, such as the degree of turbulence, spatial gradient sharpness, and refractive index variations. Highly turbulent flows or flows with weak gradients can introduce challenges in pixel interpretation during the calibration mapping process.
Additionally, the performance of post-processing software—including image registration, noise filtering, and field reconstruction algorithms—plays a crucial role in achieving accurate quantitative measurements. While the automated system provides a stable and high-quality input dataset, the fidelity of final outputs still relies on the efficacy of the computational pipeline downstream.
Importantly, the system’s open-source architecture and modular design offer a flexible foundation for further development. Future work may involve the integration of adaptive control algorithms that tailor calibration sequences based on flow conditions in real time, or the implementation of machine learning models to enhance pixel-level classification and reconstruction accuracy. The system’s design also supports extension to multi-camera or stereo schlieren configurations, broadening its applicability to three-dimensional flow analysis.
Therefore, the automated calibration system delivers measurable improvements in efficiency, accuracy, and reproducibility—addressing longstanding challenges in schlieren imaging workflows. It provides a scalable and customizable platform for researchers across disciplines, from high-speed aerodynamics to thermal and biomedical flows. By enabling high-fidelity, low-variability, and rapid calibration procedures, this work lays the foundation for a new generation of quantitative optical diagnostics in fluid dynamics research.
4. Conclusions
This work presents, to the authors’ knowledge, the first comprehensive design of an automated calibration system for schlieren color filters—representing a critical step forward in the field of optical diagnostics for gas dynamic flows. By addressing key limitations of manual calibration procedures, the system enhances the accuracy, reproducibility, and throughput of flow visualization experiments, establishing a new standard for experimental fluid mechanics.
The automated system substantially reduces the need for human intervention, operating autonomously to minimize operator-induced variability and labor demands. Through automated image acquisition and calibration curve generation, the system significantly shortens processing time. Its capability to pre-select regions of interest further optimizes computational efficiency by targeting only the most relevant data.
A core strength of the system lies in its ability to enforce standardized calibration and data processing protocols across experiments. This consistency is essential for achieving rigorous scientific reproducibility and reliable comparative analysis. Designed with flexibility in mind, the system features an open-source, modular architecture that allows researchers to adapt software parameters and hardware components to suit a wide variety of flow conditions and experimental setups. Integrated pre- and post-processing interfaces offer fine control over key operations such as frame selection, image filtering, and data correction. These tools contribute to improved calibration precision and enhanced resolution of physical parameters. The system also enables the direct extraction of multiple flow properties—including velocity, temperature, pressure, and density gradients—from schlieren imagery, thereby expanding its diagnostic utility. Importantly, the system supports the calibration of larger color filters, which have been shown both analytically and experimentally to increase schlieren system sensitivity. This allows for the detection of finer-scale flow features that are often inaccessible with manually calibrated systems. The inclusion of an automated feedback loop further supports iterative optimization, making the system well-suited for high-throughput workflows and complex parameter explorations. The intuitive graphical user interface ensures accessibility for users across varying levels of technical expertise, extending the system’s applicability to both academic research and industrial applications. Its modular, scalable design also facilitates future expansion, enabling the integration of emerging technologies and diagnostic tools.
In summary, this work delivers a robust, adaptable, and high-performance framework for the automated calibration of schlieren systems. By combining precision, efficiency, and versatility, it opens new avenues for the quantitative visualization of fluid dynamics and lays a foundation for future innovations in optical flow diagnostics.


