Review

Acoustic Energy Harvested Wireless Sensing for Aquaculture Monitoring

1
College of Engineering, China Agricultural University, Beijing 100083, China
2
Yantai Institute, China Agricultural University, Beijing 100083, China
*
Author to whom correspondence should be addressed.
Inventions 2025, 10(3), 41; https://doi.org/10.3390/inventions10030041
Submission received: 22 April 2025 / Revised: 1 June 2025 / Accepted: 3 June 2025 / Published: 5 June 2025

Abstract

As society develops, the aquaculture industry faces challenges such as environmental changes and water contamination. Water quality monitoring and preventive measures have become essential to prevent property losses. Traditional water quality monitoring methods rely on manual sampling and laboratory analysis, which are inefficient and costly. Additionally, the operational lifespan of conventional water quality sensors is limited by battery capacity, making long-term and continuous monitoring difficult to ensure. This review focuses on water quality sensor systems and provides a comprehensive analysis of self-powered schemes utilizing acoustic energy harvesting technology. It comprehensively discusses the overall architecture of self-powered sensors, energy harvesting principles, piezoelectric transducer mechanisms, and wireless transmission technologies. It also covers acoustic energy enhancement devices and the types and development status of piezoelectric materials used for acoustic energy harvesting. Furthermore, the review systematically summarizes and analyses the current applications of these sensors in aquaculture monitoring and evaluates their advantages, disadvantages, and prospects.

1. Introduction

As the global population surges, food demand correspondingly rises. Fish, a vital human protein source, must be produced sufficiently. Thus, advancing the aquaculture industry holds significant strategic importance [1] Aquaculture involves replicating the natural habitats of fish and other aquatic animals to cultivate and rear aquatic organisms [2]. While nurturing commercially valuable aquatic resources, it also boosts the biodiversity of fish and shellfish. Unlike terrestrial crops and livestock farming, fish absorb water through respiration and are highly sensitive to water pollutants. Consequently, aquaculture is exceptionally vulnerable to environmental conditions [3] despite its rapid growth and rising economic significance in the food industry, aquaculture such as climate change, geographical disasters, water pollution, and environmental damage from human activities [4]. A persistent challenge for aquaculture farmers is monitoring water quality efficiently [5].
To address the challenges faced by the aquaculture industry, the application of water quality sensors has become essential for preventing industrial losses [6]. Advances in sensor and wireless communication technologies enable farmers and water quality scientists to collect, process, and transmit water quality data in real-time, whether on-site or in remote laboratories [7]. This allows for remote monitoring of water quality parameters such as dissolved oxygen, pH, salinity, turbidity, and temperature in fish ponds [8]. It also minimizes human error and time delays, reduces overall data collection costs, and significantly enhances the quantity and quality of data across spatial and temporal scales [9].
Sensors are “active objects” continuously consuming energy to extract helpful information from the physical world they perceive [10]. Therefore, these devices require a continuous energy supply, and energy availability is a major concern in many fields [11]. If no external power source is available, they can only rely on their battery capacity and lifespan for operation [12]. The underwater working environment of water quality monitoring sensors makes charging difficult, and their operational lifespan is constrained by battery capacity and the energy consumed by detection and communication processes [13]. Detection’s long-term and continuous nature is a significant challenge for this technology [14]. Utilizing the unique underwater environment to harvest energy for the self-powered operation of underwater sensors while updating their working mechanism to achieve low-power operation represents a significant step towards self-powered longevity and extended service life [15]. In response to the special working conditions of water quality sensors underwater, piezoelectric energy harvesting mechanisms demonstrate significant advantages in the field of environmental mechanical energy conversion [16]. This technology has much higher electromechanical coupling and piezoelectric coefficients than electrostatic, electromagnetic, and triboelectric energy conversion mechanisms [17]. Relying on the intrinsic polarization characteristics of piezoelectric materials, it requires no external excitation power, auxiliary magnetic fields, or contact electrodes. Moreover, piezoelectric devices can maintain stability in extreme underwater environments such as high pressure and high humidity [18].
Compared to traditional solar and wind energy harvesting devices, acoustic energy harvesting technology offers unique advantages in underwater self-powered sensor systems [19]. First, the energy attenuation coefficient of sound waves propagating in water is much lower than that of other energy forms [20] In contrast, solar photovoltaic panels experience over 90% light intensity attenuation at a depth of just 1 meter underwater and are almost ineffective in turbid or deep waters [21]. Second, wind energy harvesting devices must be deployed above the water surface, making them vulnerable to the instability of wind distribution in time and space and exposing them to structural damage risks in typhoon-prone areas [22]. In contrast, acoustic energy harvesting systems can operate entirely submerged, altogether avoiding surface meteorological disturbances [23]. Utilizing piezoelectric energy harvesting mechanisms to capture and convert acoustic energy into electrical energy is a highly compatible solution for underwater power supply [24].
However, the practical application of acoustic energy harvesters is still limited, mainly due to challenges such as system instability caused by unexpected variables leading to fluctuations in incident frequency and sound pressure levels and familiar sound sources’ low sound pressure levels [25]. Therefore, placing acoustic transmitters on the bottom of vessels to provide acoustic energy for underwater wireless sensor systems is a stable solution. By conformally integrating with shipborne sonar systems and reusing the continuous sonar signals generated during navigation as an energy source, this approach avoids additional energy consumption and significantly enhances system reliability through integrated design. Subsequently, piezoelectric transducers convert acoustic energy into electrical energy, which is rectified and stored in batteries to power the sensor system. The sensor array transmits collected water quality monitoring parameters to the CPU for processing, with final data transmission to land-based stations via wireless communication systems.
This paper comprehensively reviews acoustic energy harvesting systems, covering their overall architecture, energy harvesting principles, piezoelectric transducer power conversion mechanisms, sensing principles, and wireless transmission technologies. It summarizes the current types of acoustic energy harvesting enhancement devices and piezoelectric materials, analyzes their advantages, disadvantages, and future development prospects in combination with the current status of aquaculture monitoring applications, and provides a systematic summary and evaluation.

2. Acoustic Energy Harvested Wireless Sensing Principle

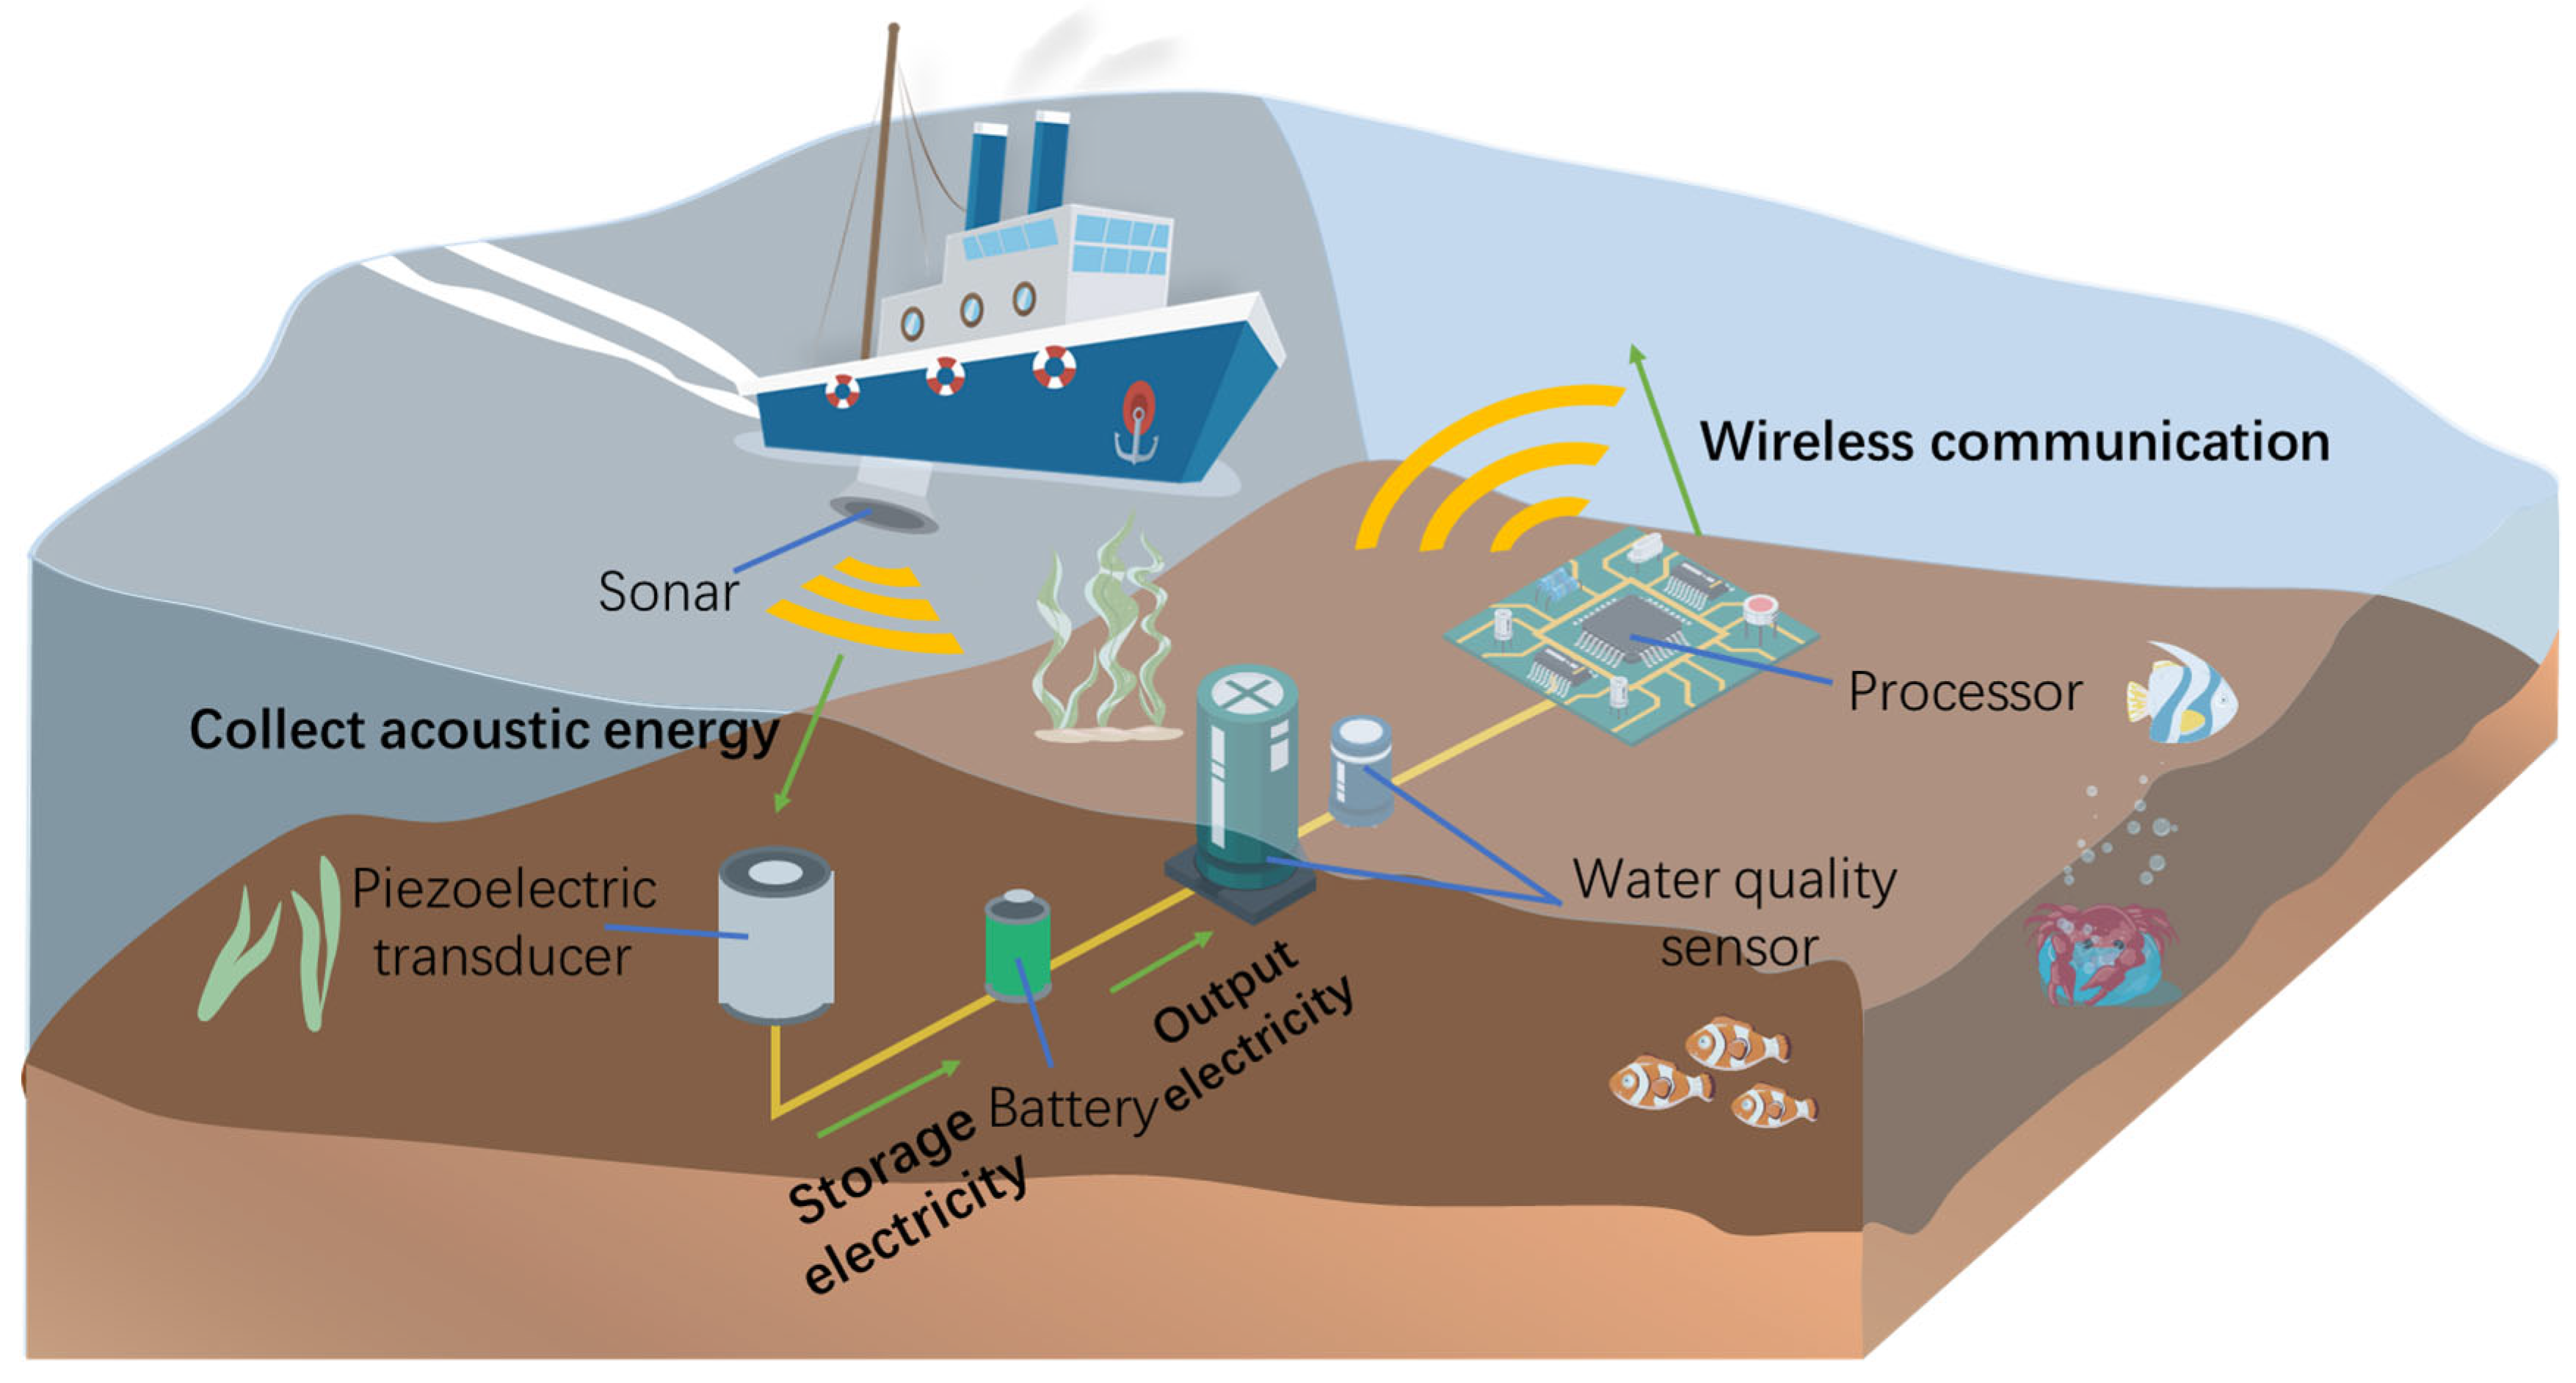
2.1. Overall Architecture

The acoustic energy harvesting self-powered sensor system primarily consists of a sonar transmitter, a piezoelectric acoustic energy harvesting transducer, a battery, a low-power processor, and a sensor detection device; the overall structure is shown in Figure 1. The workflow is as follows: the sonar transmitter emits sound waves, the piezoelectric transducer harvests the acoustic energy, converts it into electrical energy based on the piezoelectric principle, and stores the energy in the battery after rectification. The stored energy powers an underwater water quality sensor array. The processor processes the sensor data, which is ultimately transmitted to the ground via a wireless transmission module. Acoustic energy harvesting technology can replace the high-cost traditional method of replacing underwater sensor batteries, enabling continuous, stable, and long-duration monitoring of aquatic environments.

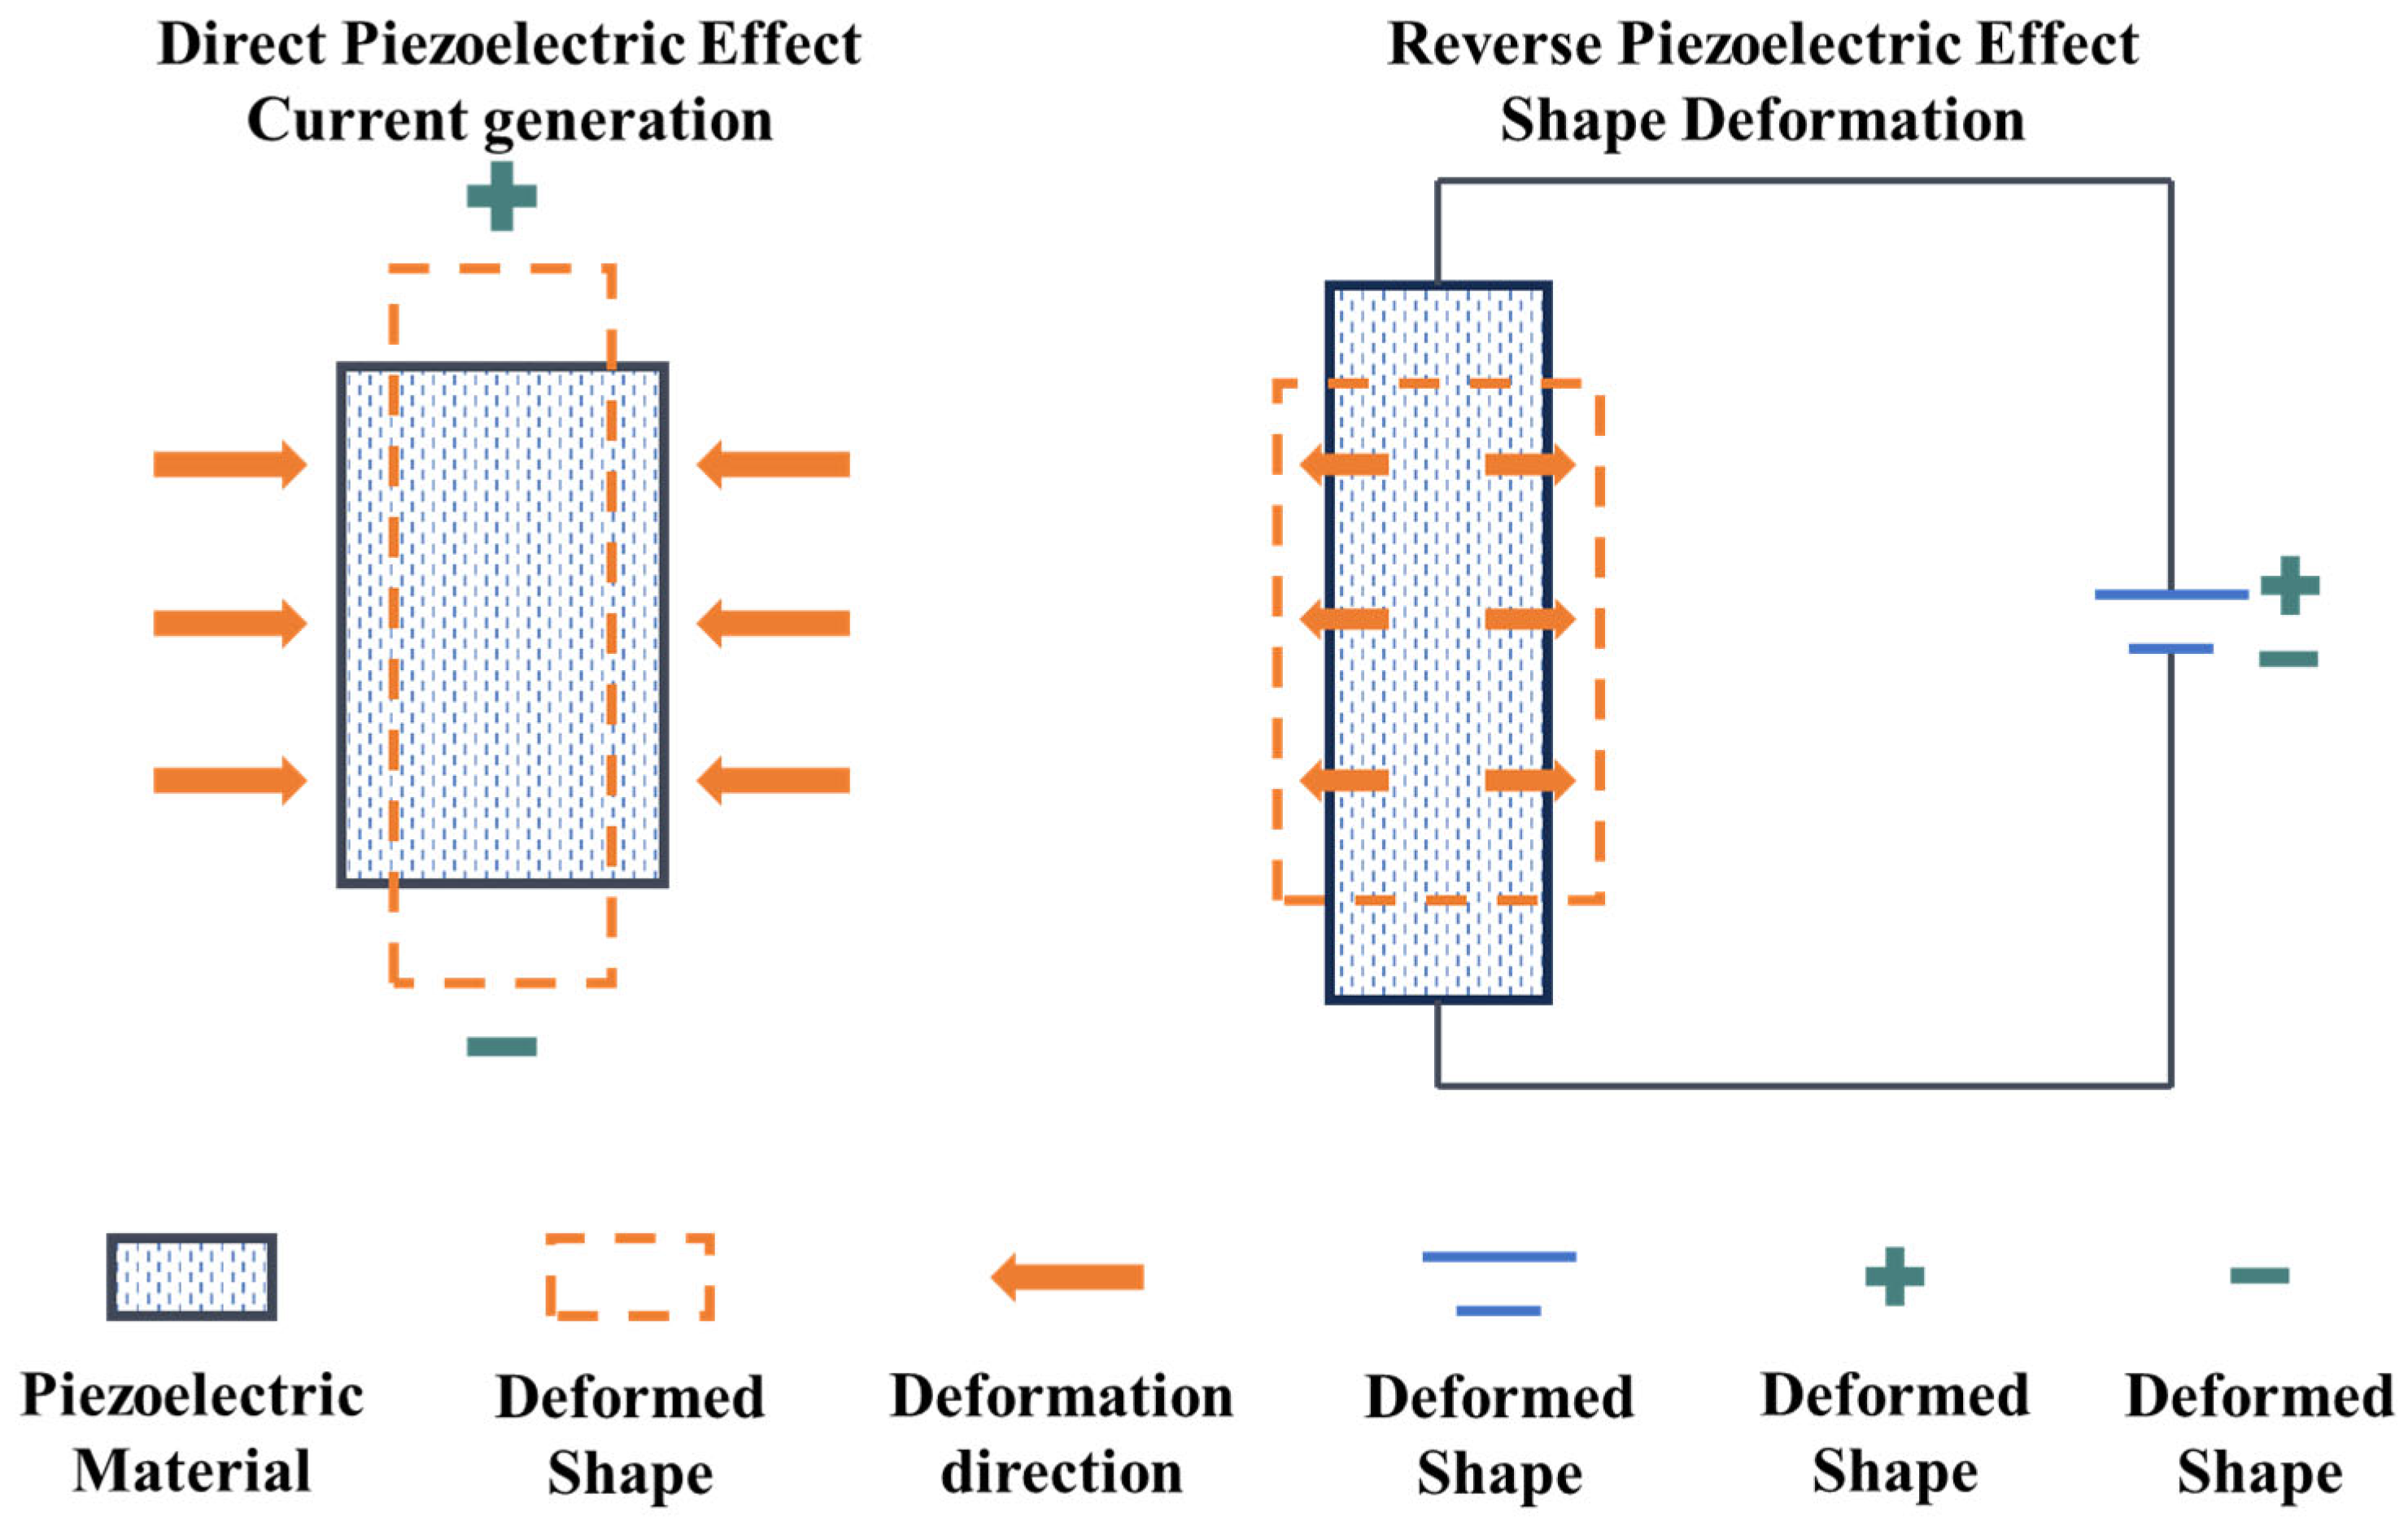
2.2. Acoustic Energy Harvesting Principle

Acoustic energy harvesting technology first collects and amplifies sound waves through resonant cavities or acoustic metamaterials. Then, the piezoelectric energy conversion mechanism transforms them into electrical energy. Finally, after rectification, voltage regulation, and energy storage, the AC electrical energy is supplied to power electronic devices. The conversion process of acoustic energy harvesting technology, from ambient energy to electrical output, is divided into three main stages: environmental excitation energy capture, conversion of mechanical vibration energy into electrical energy, and electrical energy output [26].
(1) Acoustic energy excitation
The key task of this stage is to capture mechanical energy from the external environment and convert it into mechanical vibration energy [27]. Compared with other environmental energy harvesting technologies (solar, wind, and hydropower), acoustic energy is less affected by weather and can be collected with fewer installation restrictions [28]. However, the disadvantage is that acoustic energy has low energy density and power, which means that when acoustic energy is converted into electrical energy, the power level cannot meet the needs of high-power applications [29]. To overcome the problem of low acoustic energy density, resonators or acoustic metamaterials are mainly used to collect and amplify environmental sound waves [30].
Resonators are commonly used in acoustic energy harvesters to amplify incident sound pressure and generate acoustic oscillations at their resonant frequency. One side of the resonator is connected to a diaphragm made of piezoelectric material, which vibrates together with the sound vibration [31], as shown in Figure 2. Schematic of the acoustic energy collector. Clever structural designs can enhance the conversion rate of acoustic energy to vibrational energy [32]. There are three types of resonators: Helmholtz resonators, quarter-wavelength resonators, and half-wavelength resonators [33], as shown in Figure 3. Schematic of resonators. (a) Helmholtz resonator. (b) Half-wavelength tube resonator. (c) Quarter-wavelength tube resonator. A Helmholtz resonator is a large-volume cavity connected to the external space through a narrow neck [34]. The bottom is usually flexible to enhance acoustic energy collection, thereby generating sufficient pressure differences with the ambient sound pressure [35]. A quarter-wavelength tube resonator uses one-third of the tube length near the open end as the neck, and the remaining part of the tube acts as a cavity, which can achieve amplification of incident sound pressure [36] When the tube length is equal to one-quarter of the incident sound wave’s wavelength, the acoustic system’s reactive part becomes zero, and acoustic resonance occurs. In the acoustic resonance state, the sound pressure gradually increases from the inlet to the cavity, and the pressure distribution within the sound cavity is almost uniform [37].
Acoustic metamaterials are composite systems used to focus or amplify sound pressure. They control and manipulate specific frequency sound waves in ways not observed- in nature [38]. Made of traditional materials like metal and plastic, they are formed into artificial periodic geometric structures that control sound waves [39]. Acoustic energy harvesters based on these metamaterials use the local resonance of sound waves within the metamaterial [40]. There are two main types: phononic crystals and sonic crystals [41]. Phononic crystals are artificial materials with periodic structures with elastic wave band gaps [42]. They are made of sound-scattering bodies embedded in a matrix material similar to scatterers. Their key ability is to confine sound waves of specific frequencies at defects within the periodic structure, amplifying them [43]. Sonic crystals, on the other hand, rely only on the longitudinal component of sound waves [44].
Both phononic and sonic crystals have band gaps that block elastic wave propagation at specific frequencies, allowing wave energy to be localized in the structure at defect band frequencies [45]. Defect bands are created by breaking the symmetry of the metamaterial and acting as narrow frequency passbands between band gaps [46]. In defect modes, sound transmission loss in acoustic metamaterials is almost zero, resulting in high sound transmission [47]. For acoustic energy harvesting, the energy conversion device should be located in the energy localisation area to convert acoustic energy into electrical energy efficiently.
(2) Electrical energy conversion
Various energy harvesting strategies utilizing electromagnetic, electrostatic, piezoelectric, triboelectric, thermoelectric, and thermoelectric conversion mechanisms at mesoscopic, micrometer, and nanometer scales have been proposed [48]. Among these, electrostatic, triboelectric, and electromagnetic harvesters generate electricity through varying capacitance, frictional contact, electrostatic induction, and magnetism, respectively [49]. Piezoelectric energy harvesting relies on the piezoelectric effect and the material’s inherent polarization [50]. Compared to electrostatic, electromagnetic, and triboelectric conversion, piezoelectric conversion, due to its higher electromechanical coupling coefficient and piezoelectric coefficient, results in durable, reliable piezoelectric generators that are more sensitive to minor strains, with approximately 3–5 times higher power density and voltage output [51].
The term “piezoelectric” originates from the Greek word for “pressure or squeezing”, referring to the characteristic of piezoelectric materials to generate an electric field when mechanical force is applied, a phenomenon known as the piezoelectric effect [52]. The piezoelectric effect is divided into the direct and converse effects [53]. In 1880, Pierre and Jacques Curie discovered that crystals like quartz and tourmaline could produce surface charges and voltage differences when mechanically stressed and deformed. A year later, using thermodynamic principles, Lippmann mathematically derived the converse piezoelectric effect. When an electric field is applied to piezoelectric materials, the internal electric dipoles are affected, causing mechanical deformation, known as the converse piezoelectric effect. By analyzing the free energy of piezoelectric materials, he demonstrated the symmetric relationship between electric fields and mechanical stresses in these materials, indicating that the direct and converse piezoelectric effects are interrelated [54], as shown in Figure 4. Principle of the piezoelectric effect:
The core of piezoelectric transducers lies in utilizing the piezoelectric effect of piezoelectric materials to convert mechanical vibration energy into electrical energy [55]. The ultimate goal of this stage is to maximize the conversion of mechanical energy into electrical energy. After capturing ambient sound wave energy and converting it into mechanical vibrations in the previous stage, these vibrations act on the piezoelectric material [56]. The vibrations generate mechanical stress and strain within the material. As mechanical stress and strain propagate through the piezoelectric material, they cause microscopic displacements in the atomic or molecular structure of the material [57]. These displacements lead to changes in the electric dipole moments within the piezoelectric material [58]. Under mechanical stress, the atoms or molecules in the piezoelectric material are reorganized due to changes in the electric dipole moments, causing positive and negative charges to concentrate in different regions of the material [59]. Finally, these charges are collected by metal electrodes and form a current in an external circuit. When mechanical stress is applied to the piezoelectric material, the internal electric dipoles are reorganized, thereby generating charges [60]. For example, when a sonar transmitter sends ultrasonic waves to the seabed in ultrasonic sensors, underwater sensors receive the sound wave signals to detect the seabed environment. At the same time, the piezoelectric transducer uses the energy from the received ultrasonic waves, converts it into mechanical vibrations, and acts on the piezoelectric material. Finally, the piezoelectric transducer converts these vibrations into electrical signals.
(3) Power output
In the previous stage, mechanical vibration energy is converted into electrical energy by an electrical energy generator, and the issue of electrical energy output and storage is addressed in this stage. Electrical energy is output from the system and enters the final application load, such as batteries, capacitors, sensors, and other electrical devices. Supercapacitors are employed as energy-harvesting devices in the battery-free underwater imaging system [61]. The remote acoustic projector transmits a 20 kHz sinusoidal acoustic signal via the downlink, where the acoustic energy is captured and converted into electrical energy through piezoelectric transducers. This harvested energy accumulates in the supercapacitor to power the battery-free backscatter sensor node. While a regulated voltage output could theoretically directly supply sensor electronics to initiate image acquisition and communication, practical scenarios often involve insufficient energy to sustain a full imaging cycle, particularly when sensors are positioned farther from the transmitter, where energy levels may fall below imaging requirements. To address this, a cold-start phase was designed, accounting for the minimum operating voltages of all components. The system activates subsequent circuitry only when the supercapacitor reaches an energy storage threshold of 7500 μF capacitance and a minimum voltage of 3.2 V.
However, electrical energy losses are inevitable during the output process, primarily in resistive losses and circuit losses [62]. Resistive losses are considered one of the main losses in the electrical energy output stage. They occur when current passes through wires, resistors, and other circuit components, and some electrical energy is converted into thermal energy due to internal resistance, resulting in energy loss [63]. Factors such as the material and cross-sectional area of the wires, the current’s magnitude, and the cables’ length all affect the efficiency of electrical energy output [64]. Therefore, selecting materials with excellent conductivity, using appropriately thick wires, and minimizing unnecessary wire length can effectively reduce resistive losses [65]. Circuit losses refer to energy losses caused by factors such as the non-ideal nature of components, leakage current, inductive reactance, and capacitive reactance in the entire circuit system. These losses are influenced by the characteristics of the components and the circuit layout [66].
Additionally, in the previous stage, specifically during converting mechanical vibrations into electrical energy, some energy loss is inevitable [67]. These include friction losses caused by friction between components in mechanical systems; damping losses caused by dampers absorbing vibration energy and generating heat in vibration systems; Ohmic losses, also known as resistive losses, which occur when energy is dissipated as heat due to the resistance of electrical conductors when current passes through them; and energy losses due to elastic or plastic deformation of mechanical structures when they are subjected to loads [68].

2.3. Materials for Acoustic Energy Harvesting

A critical factor enabling self-powered operation of underwater sensor arrays based on acoustic energy harvesting lies in the selection of piezoelectric transducer materials. Appropriate piezoelectric materials can significantly enhance the acoustic-to-electrical conversion efficiency, while structural optimization of the piezoelectric transducers amplifies their vibrational amplitude under acoustic stimulation. This synergistic approach induces greater mechanical deformation in the piezoelectric elements, thereby generating higher charge outputs to meet the energy demands of underwater sensor arrays.
Piezoelectric materials are active materials that generate electricity due to their non-centrosymmetric crystal structure when subjected to mechanical deformation, and the type of piezoelectric material significantly impacts the performance of piezoelectric energy harvesting [69]. In 1917, Paul Langevin discovered the use of quartz and Rochelle salt in ultrasonic underwater detection devices based on the converse piezoelectric effect. Although quartz has a very high mechanical quality factor, its low electromechanical coupling results in low mechanical underwater transmission power [70]. Rochelle salt, on the other hand, has an excellent electromechanical coupling coefficient and is easy to synthesize. Still, it has a narrow operating temperature range, and its performance is highly temperature-dependent [71]. Piezoelectric single-crystal materials achieve excellent coupling through uniform dipole alignment. Single crystals are anisotropic, exhibiting different material properties depending on the material’s cutting orientation and bulk or surface wave propagation direction. In the 1950s, it was discovered that polycrystalline BT exhibits piezoelectricity after electro-polarization and has excellent piezoelectric properties [72].
In many applications, single-crystal materials outperform polycrystalline piezoelectric ceramics. The electromechanical coupling coefficient of single-crystal piezoelectric materials is significantly higher than that of monolithic materials and can be several times larger than PZT in the highest-performance materials [73]. In 2016, Yang et al. systematically compared the key performance of vibration energy harvesters using PMN-PT, PZN-PT single crystals, and PZT ceramics, and the results showed that the performance of PZN-PT and PMN-PT single crystal generators was consistently superior to that of PZT-based harvesters [74]. However, the disadvantages of these materials are their high cost, low toughness, and high damping. They are inherently brittle and prone to cracking, cannot conform to curved surfaces, and are typically dense due to lead-based ceramics [75]. Researchers have designed composite piezoelectric devices to address the limitations of bulk piezoelectric ceramic materials, which consist of an active piezoelectric ceramic phase embedded in a polymer matrix. The resulting composite material has higher strength, flexibility, and greater robustness due to the polymer matrix protecting the fragile ceramic [76].
The discovery of lead zirconate titanate (PZT) was an essential milestone in the development of piezoelectric materials. It is typically doped with niobium or lanthanum to form soft and hard piezoelectric materials, respectively [77]. PZT has better stability at high temperatures and higher piezoelectric constants, further enhancing the performance of piezoelectric materials. It has become the most widely used piezoelectric ceramic material to date. PZT is commonly used in sensors and actuators because it can operate directly coupled without a bias voltage and output large voltages of around 50 V to 100 V [78]. Zhichao Zhang et al. proposed an innovative piezoelectric material strategy for acoustic energy harvesting based on PVDF/PU, fabricating aerogels composed of high-strength piezoelectric nanofibers via a decentralized freeze-casting method [79]. Under 200 Hz and 115 dB conditions, the open-circuit voltage and short-circuit current peaks during acoustic–electric conversion reached 48.2 V and 4.1 μA, respectively, with a power density of 0.232 mW/cm3. The material also exhibited excellent sound absorption, waterproofing, and thermal insulation properties, offering new insights for designing lightweight, flexible, 3D nanofiber-based acoustic–electric conversion materials. Suo Zhou et al. introduced a novel rotating piezoelectric ultrasonic actuator (PUA) based on PZT-5A piezoelectric ceramics featuring a sandwich-type piezoelectric composite structure [80]. The upper PZT ring was used for energy harvesting, while the lower ring generated ultrasonic vibrations. The upper ring was divided into 18 sectors, each sized λ/2 (λ being the ultrasonic wavelength), and alternately polarized along the height direction as positive (+) and negative (−) to enhance charge generation and accumulation. The lower ring was divided into two groups (A and B), each with 8 λ/2-sized sectors, producing orthogonal ultrasonic vibration modes. This design enabled efficient conversion of ultrasonic vibration energy into electricity. When the PUA is excited by a traveling ultrasound wave with amplitude 67 V and frequency 35.1 kHz, the maximum harvested power of each sector of the new PZT ring and λ/4 sector of the bottom PZT ring reaches 58 mW and 82.4 mW, respectively. Laiming Jiang et al. proposed a flexible ultrasonic energy harvester (PUEH) based on PZT/epoxy 1–3 composites, consisting of a 7 × 7 array connected by wavy copper wires and encapsulated in PDMS, ensuring good biocompatibility, flexibility, and energy conversion efficiency [81]. Experiments demonstrated that when driven by a 350 kHz sinusoidal signal (acoustic intensity ≈ 65 mW/cm2), the flexible PUEH delivered an output power density of 4.1 μW/cm2. In contrast, the wireless power transfer system generated a 2.1 Vpp output voltage and 4.2 μA RMS current—exhibiting superior output characteristics compared to existing ultrasonic energy harvesters. Even though 14 mm thick porcine tissue, the device maintained an output voltage of 0.91 Vpp, approximately 85% of the value observed in free-field conditions, highlighting its excellent penetration capability.
Despite PZT’s superior piezoelectric properties, its lead content poses inherent health risks when using PZT and other lead-based piezoelectric materials [82]. For water quality sensor systems, lead-containing materials can reduce biocompatibility. Research into lead-free ferroelectric materials has been revived with increasing concerns about lead toxicity [83]. Among lead-free alternatives, potassium sodium niobate (K0.5Na0.5NbO3, KNN)-based ferroelectric materials are auspicious for practical applications. A lead-free dual-frequency ultrasonic implant using a laminated porous and 1–3 type composite structure of SP-1–3 piezoelectric composite material was introduced, which significantly enhanced piezoelectric properties and energy harvesting efficiency. Experimental results showed that compared to the initially synthesized KNN piezoelectric material, the lead-free SP-1–3 composite material had a g33 value enhanced by more than three times (61.4 × 10⁻³ V m N−1), and the FOM harvesting performance was nearly doubled (17806 × 10−15 m2 N−1), far exceeding most other lead-free piezoelectric materials and even some lead-based counterparts [84].
Piezoelectric materials can be divided into five main categories, as shown in Table 1.

2.4. Wireless Sensing in Aquaculture Monitoring

Wireless sensor networks comprise many self-organizing sensors placed in monitoring areas [85]. These sensors enable real-time data collection, processing, and transmission. The information collected is then shown on a computer or sent to farmers as messages for real-time updates [86]. This real-time remote monitoring technology simplifies the information collection process, reduces human errors and time delays, and improves the amount and quality of data across both time and space [87].
An underwater communication system typically consists of a transmitter, a communication channel, and a receiver. The transmitter can send information by modulating the information signal onto a carrier signal. Current underwater communication technologies mainly include fiber optic communication, underwater acoustic communication, radio frequency (RF) communication, and optical visible light communication [88].
Among these technologies, RF communication faces serious signal attenuation in seawater due to its high conductivity, making it unsuitable for underwater ocean communication [89]. Fiber optic communication can achieve long-distance communication and provide high-speed data transmission. However, it has some obvious limitations in underwater applications. The need for a physical connection between the transmitter and receiver is inconvenient for mobile underwater vehicles [90]. Thick cables not only make installation difficult but also significantly affect the flexibility and maneuverability of submersibles. Although fiber optic communication still has value for some fixed underwater facilities, it is less practical for underwater equipment that requires high mobility [91].
Underwater acoustic communication is currently the most common method of underwater communication [92]. Since sound propagates with much lower loss in seawater than electromagnetic waves, underwater acoustic communication can achieve effective communication distances of several kilometers. In underwater acoustic communication systems, information (such as text, voice, and images) is first converted into electrical signals, then digitally encoded by an encoder, and transformed into acoustic signals by a transducer [93]. These acoustic signals carry the information through the seawater medium to the receiver, where the sensors convert the acoustic signals back into electrical signals and decode them to restore the original data. However, the propagation of sound waves in the ocean is affected by various factors, including changes in sound speed, multipath effects, and signal attenuation [94]. Sound speed is influenced by seawater temperature, pressure, and density, increasing by about 1.4 m/s for every 1 °C rise in temperature and about 17 m/s for every 1km increase in depth [95]. Moreover, the complex marine environment can cause signal reflection and refraction, leading to multipath effects that further degrade communication quality. Various environmental noises in seawater, such as wave noise, biological noise, and ship noise, also require the use of signal processors for filtering and amplifying the received signals [96].

3. Applications in Aquaculture Monitoring

As demand grows for aquatic products—a vital protein and nutrient source, particularly premium options—aquaculture has expanded rapidly. However, domestic, industrial, and agricultural pollutants like organic matter, chemicals, and excess nutrients threaten aquaculture sustainability. Maintaining optimal water quality through effective monitoring remains crucial for ensuring productivity and product standards [97]. Water quality control, management, and monitoring are crucial for aquatic ecosystems, agriculture, and food safety. Water quality data is primarily collected through manual on-site sampling, which involves data collection, analysis, and management. However, due to the large area and volume of water bodies, monitoring water quality parameters continuously in real time is challenging. Real-time sensor monitoring has been increasingly applied to efficiently collect data [98]. In this chapter, we will discuss monitoring physical parameters in aquaculture systems, such as pH, turbidity, dissolved oxygen, and salinity. We will explore both traditional and modern analytical techniques for the application and development of sensors for these parameters and summarize them in Table 2.

3.1. Dissolved Oxygen (DO)

Dissolved oxygen (DO) refers to oxygen dissolved in water in a molecular state [99]. The level of DO and the amount of oxygen consumed are directly related to the size of fish, feeding rates, activity levels, and pond temperatures [100]. Sources of DO include oxygen from the atmosphere dissolving into water when it is unsaturated and oxygen released by aquatic plants during photosynthesis. DO levels decrease with rising temperatures or increasing salinity. Maintaining optimal DO levels is crucial not only for fish respiration, growth, and development but also for their reproduction and survival. Prolonged exposure to low-DO environments can slow fish growth and cause weight loss. In aquaculture, when DO concentrations fall below 4 mg/L, fish will suffocate and die [101].
The iodometric method is the standard for DO measurement. It is based on a chemical reaction between DO in a water sample and reagents to produce iodine, and DO content is determined by titrating the released iodine [102] This method is highly accurate but cumbersome, making it suitable for high-precision laboratory analysis but not for online or real-time monitoring. The Clark OXYSENS method uses a semipermeable membrane to allow oxygen to diffuse into an electrolyte, which is reduced at the cathode. The resulting current is proportional to the oxygen concentration, allowing DO concentrations to be determined by measuring the current. This method is simple to operate and enables automatic and continuous monitoring. However, the electrodes and membranes are prone to aging. Algae, sulfides, and other substances in water samples can also clog the membrane and affect measurement results, so regular maintenance is required [103]. The Fluorescence Quenching method determines DO concentrations by measuring changes in the fluorescence intensity of certain fluorescent substances when they undergo quenching reactions with oxygen. The quenching process follows the Stern–Volmer equation, which allows DO concentrations to be calculated based on fluorescence intensity and oxygen partial pressure. This method is highly accurate, resistant to interference, and fast responding, making it suitable for real-time monitoring. However, it is expensive and requires precise control of environmental conditions such as temperature and pH [104].
Table 2. Water quality sensor application.
Monitoring the Water Quality IndexDesign ContentBased onAdvantagesApplicationsReferences
Dissolved Oxygen
(DO)
Three dissolved oxygen prediction models for Multi-layer perceptron neural networksMulti-universe Optimizer, Black Hole Algorithm, and Complex Evolutionary AlgorithmHigh stabilityThe weight and bias of the MLP neural network are optimized by algorithms to predict the level of DO.[105]
The DO concentration in coastal water was estimated by combining satellite remote sensing data and measured DO data.Satellite remote sensing data and field DO dataLarge-scale water quality
monitoring is more
cost-effective
Extensive water quality monitoring[106]
By collecting dissolved oxygen data,
combined with the information coefficient, the dissolved oxygen level is predicted.
Based on the wavelet transform (WT)High accuracyWater quality management and early warning system construction[107]
New flexible array dissolved oxygen sensor.Multi-cell array structure and flexible materialsHigh sensitivity, Stability
Wearability
Robot integration,
Water environment monitoring
[108]
TurbidityAn Internet of Things turbidity sensor based on the principle of light attenuation.Optical attenuation principle,
Calibration model
Stable performance, Strong adaptabilityAs part of the Internet of Things monitoring platform, to achieve dynamic monitoring of water quality.[109]
Turbidity monitoring of the San Francisco estuary using satellite data.Satellite remote sensing
technology
High accuracy, large rangeTurbidity monitoring designed for large areas of water.[110]
Integrating remote sensing technology and machine learning methods to monitor turbidity anomalies.Remote sensing technology,
Machine learning
TimelinessIt can generate turbidity anomaly maps under different hydrological conditions.[111]
pHLow-cost virtual pH sensorElectromagnetic field
variation
High accuracyPH monitoring designed for coastal waters.[112]
Self-referencing fiber-optic pH sensorEvanescent wave absorption principleHigh stability, reliability, and longevityOptical pH sensors designed for marine environments.[113]
Fast and stable optical pH sensor materialB-O bond covalently coupled indicatorDynamic range and
response time are optimized
PH monitoring designed for sea water.[114]
SalinityConical plastic multi-mode fiber optic sensorBased on the change in refractive index of the optical fiberHigh linearity and
sensitivity
It is suitable for continuous monitoring of water salinity changes.[115]
Low-cost graphene salinity sensorChanges in the resistance and capacitance characteristics of the solutionHigh linearity and
sensitivity
Salinity measurement designed for the ocean.[116]
Recently, some novel research projects are worth discussing. Fen Yang et al. introduced three dissolved oxygen (DO) prediction models based on multilayer perceptron (MLP) neural networks, namely, the multiverse optimizer (MVO), the black hole algorithm (BHA), and the complex evolutionary algorithm (SCE). By combining complex physical theories with computational intelligence methods, the algorithm optimizes the weights and biases of the MLP neural network to predict DO levels [105]. This approach demonstrates an innovative way of applying concepts from physics to water quality prediction, with high prediction accuracy and stability. However, due to the computational complexity, the time cost is significantly increased, and the model’s prediction performance may decline when data is insufficient or of poor quality. Yong Hoon Kim et al. used satellite data from NASA’s Moderate Resolution Imaging Spectroradiometer (MODIS) and Visible Infrared Imaging Radiometer Suite (VIIRS), as well as in situ monitoring data from Korea’s Marine Environment Monitoring System (K-MEMS), and first attempted to combine satellite remote sensing data with in situ DO data. A multiple regression model was used to estimate DO concentrations in coastal waters [106]. Compared with traditional in situ monitoring, satellite remote sensing reduces labor intensity and cost, making large-scale water quality monitoring more economical and efficient. However, since satellite remote sensing data mainly reflect the environmental conditions of surface waters, the model’s applicability may be limited in areas with significant vertical variations, such as deep-water zones. Chuang Xu et al. collected dissolved oxygen data from Zhangcun Station in the Dongjiang River Basin from 2011 to 2019 and used independent models such as multiple linear regression, support vector machines, artificial neural networks, random forests, and hybrid models based on wavelet transforms. The maximum information coefficient was used to select optimal input variables, and a grid search with five-fold cross-validation was used to optimize the parameters. Model performance was evaluated using indicators such as correlation coefficient, Nash–Sutcliffe efficiency, mean absolute error, and root mean square error [107]. Accurate prediction of dissolved oxygen levels provides a scientific basis for water quality management, the construction of early warning systems, and the planning and allocation of water resources. Xianbao Xu et al. introduced a novel flexible array dissolved oxygen sensor fabricated using a multi-electrolyte cell array structure and flexible materials featuring high sensitivity, stability, and wearability. Experiments verified the sensor’s performance in different water environments, and it was successfully integrated into a robotic fish, achieving three-dimensional monitoring of dissolved oxygen in aquatic environments [108]. This research provides new technical tools for water quality monitoring in aquaculture and promotes the development of underwater sensor technologies.

3.2. Turbidity

Turbidity indicates the amount of suspended sediment and is a key water quality parameter, especially for water transparency. It also correlates closely with other water quality parameters [117]. In ecosystems, increased turbidity can significantly reduce the survival of some plants and fish. High turbidity may signal harmful microbes and pollutants, blocking light and reducing photosynthetic efficiency, leading to lower DO levels. It can also stress fish, weakening their immunity and making them more disease-prone. Analyzing turbidity helps understand the distribution of sediments or total suspended solids in water, offering insights into pollutant deposition, decomposition, and diffusion [118]. Thus, monitoring spatial turbidity distribution is crucial for aquatic ecosystems and human activities.
However, turbidity is hard to measure absolutely due to various influencing factors. The most common measurement method is optical sensors, emitting light beams and detecting the received light [119]. More suspended particles lead to lighter scattering, absorption, and attenuation. Scattered light can be measured nephelometrically, with optical turbidimeters typically measuring light backscattering or attenuation at a 90° angle from the source. The placement and design of turbidimeters’ detectors affect readings, so different turbidity instruments often yield non-comparable results. Additionally, bubbles, gases, sensor dirt, or scratches on optical surfaces can cause deviations. The degree of light scattering depends on the quantity and nature (size, shape, density, color) of suspended particles like algae, clay, or sand [120]. Accurate turbidity measurement may be unattainable when particle characteristics vary significantly. J Trevathan et al. presented the design and calibration of an IoT turbidity sensor based on light attenuation, which assesses water turbidity by measuring suspended particle-induced light attenuation and uses a modified exponential model to describe the voltage–turbidity relationship, allowing turbidity parameter estimation via least squares [109]. The sensor has an accuracy of 2–10% in high turbidity (100–4000 NTU) and higher error rates in low turbidity (<100 NTU) but is generally stable. An alternative to optical sensors is remote sensing, which can obtain the spatial distribution of suspended sediments using satellite images based on water surface reflectance, influenced by parameters such as chlorophyll, suspended sediments, and dissolved organic matter. Dissolved and suspended sediment concentrations and total biological activity influence the natural color of water bodies, enabling optical satellite remote sensing of oceans, coasts, large lakes, and rivers. Christine M. Lee et al. used ESA’s Sentinel-2 satellite data to evaluate turbidity monitoring in the San Francisco Estuary and upstream delta. By comparing satellite-derived turbidity with in situ sensor data, they verified the accuracy of satellite remote sensing for turbidity. Results showed R2 values of 0.75 (FNU-measured sites) and 0.63 (NTU-measured sites), indicating satellite remote sensing is effective for large-area turbidity monitoring, especially in providing spatially continuous water quality information [110]. Anderson P. Souza et al. integrated remote sensing and machine learning, specifically One-Class SVM and Isolation Forest models, to detect turbidity anomalies in hydropower station reservoirs. Using in situ turbidity data from Três Marias Reservoir and Sentinel-2 imagery, they extracted pixel reflectance values via Google Earth Engine for preprocessing and model training [111]. The study showed that the method could identify high-turbidity areas and generate anomaly maps under different hydrological conditions, offering scientific support for water quality monitoring and management and aiding in a timely response to water resource-affecting anomalies.

3.3. pH

In simple terms, pH measures the acidity or alkalinity of a solution and is the negative logarithm of the concentration of hydrogen ions in the solution [121]. The mathematical expression is
p H = log [ H + ]
The pH scale ranges from 0 to 14, where values above 7 indicate alkalinity, and those below 7 indicate acidity. The lower the pH value, the stronger the acidity, and the higher the pH value, the stronger the alkalinity. Most aquatic organisms, including fish, shrimp, and other aquaculture species, thrive within a pH range of 6.5 to 8.5 [122]. If the pH drops below 6.5, the water becomes overly acidic, which can cause respiratory distress, metabolic disorders, and weakened immunity in fish, potentially leading to death. Since ammonia exists in water as both ionized ammonium (NH₄⁺) and un-ionized ammonia (NH₃), higher pH levels increase the proportion of the toxic un-ionized form, which can poison fish and even cause death [123]. With the intensifying issue of ocean acidification, precise pH monitoring in marine environments has become increasingly important.
Traditionally, pH is measured by detecting the potential difference between a working pH electrode and a reference electrode, with a direct correlation between the electrode voltage and the water sample’s pH [124]. This method has several drawbacks, such as instability of the reference electrode, susceptibility to environmental factors, and slow response times. Sandra Viciano-Tudela et al. proposed a low-cost virtual pH sensor based on electromagnetic field variations for monitoring pH in coastal waters [112]. Using two coils of different sizes as sensing elements, the sensor infers pH by measuring changes in the electromagnetic field caused by H⁺ ions. Tests with samples (pH 4 to 11) showed that after excluding pH 11 samples, the correct classification rate reached 88.9% using a probabilistic neural network. Wan-Har Chen et al. introduced a self-referenced optical fiber pH sensor to enhance stability in long-term deployment and dynamic marine environments [113]. This sensor eliminates needing an external reference electrode and uses an optimized sol–gel matrix to encapsulate a pH indicator, improving stability, reliability, and lifespan. Although it demonstrated good accuracy and response time, indicator leakage remains a challenge for long-term stability. Christoph Staudinger et al. studied fast and stable optical pH sensor materials for marine applications [114]. They developed and compared four generations of pH sensor materials, focusing on optimizing dynamic range, response time, cross-sensitivity to temperature and salinity, and long-term stability. The first generation employed physical adsorption of pH indicators in polyurethane hydrogels. In contrast, subsequent generations utilized cross-linked hydrophilic polymers with covalently bonded indicator dyes, thereby improving response time and stability. The fourth generation introduced a novel method of covalently coupling indicators via B-O bonds, simplifying synthesis, reducing costs, and showing low drift rates and optimal pKa values for seawater pH monitoring. In long-term tests at 10 °C, pH-3 and pH-4 materials exhibited very low drift rates, with the pH-4 material drifting at just 0.0021 pH units per day, demonstrating excellent long-term stability.

3.4. Salinity

Salinity is the total amount of dissolved salts in water, representing the weight of dissolved salts (mainly sodium chloride, magnesium chloride, magnesium sulfate, etc.) per kilogram of water [125]. Pure freshwater has a salinity of approximately 0‰, while typical seawater has a salinity of around 35‰. In aquaculture, different species have varying tolerances to salinity. Salinity levels that are either too high or too low can affect the growth, development, and reproduction of cultured species [126]. Salinity is also an important parameter of the aquatic environment, influencing dissolved oxygen, pH, and other chemical components, which can further affect the survival environment of aquaculture species [127]. Therefore, appropriate salinity levels can improve feed utilization and growth rates, enhancing economic benefits.
Electrical salinity sensors measure salinity based on the electrical conductivity, which depends on the chloride ion content in the water. However, this technology is susceptible to electrical interference and does not account for non-conductive substances that affect seawater density. Optical techniques are preferred alternatives due to their non-invasive nature, resistance to electromagnetic interference, high sensitivity, compact size, and low cost. H.A. Rahman et al. introduced a simple tapered plastic multimode fiber optic sensor for salinity detection based on sodium chloride (NaCl) solutions of varying concentrations [115]. The sensor detects salinity changes through variations in the fiber’s refractive index and shows a highly linear relationship (over 98%) between output voltage and salinity concentration from 0% to 12%. With high linearity and sensitivity, continuously monitoring salinity changes in water bodies. However, as it uses plastic fiber, it may be affected by environmental temperature and pressure. Anindya Nag et al. proposed a low-cost laser-induced graphene sensor system for salinity measurement and detection in marine applications [116]. Based on electrochemical impedance spectroscopy (EIS), the sensor uses polymer films to generate graphene sensors via laser ablation under specific conditions. When the sensor’s electrodes are exposed to different concentrations of saline solution, changes in the solution’s resistance and capacitance characteristics can be detected by measuring impedance, with changes in salinity detected through capacitive sensing. Experiments demonstrated that the sensor’s resistance is inversely proportional to the salinity concentration, and six repeated experiments showed a deviation of less than 2% in the sensor’s response, indicating high sensitivity and stability.

4. Discussion

4.1. Advantage

Ultrasonic energy harvesting technology simplifies the power supply for sensor arrays, eliminating the need for cables or battery replacements typically required for underwater equipment. Thus, it enables long-term, continuous detection and communication. Vehicles equipped with sonar transmitters can power the sensors by approaching the sensor array, and multiple nodes can be used for a power supply.
Ultrasound, with frequencies above 20 kHz, is inaudible to humans [128]. Piezoelectric transducers are superior to triboelectric and electromagnetic ones in ultrasonic energy harvesting. Electromagnetic devices need large-displacement or low-frequency vibrations for efficient power generation, while ultrasonic vibrations are small in amplitude and high in frequency [129]. Triboelectric devices rely on material contact and separation, which may reduce efficiency at high frequencies due to mechanical response limitations or increased wear [130]. In contrast, piezoelectric materials like PZT and PVDF respond well to the high-frequency mechanical vibrations of ultrasound, with high electromechanical conversion efficiency, making them suitable for ultrasonic applications [131]. They generate electricity through material deformation without physical friction, ensuring a longer service life.
Using active ultrasonic transmission as an underwater energy source is more stable and efficient than harvesting energy from solar, wind, or tidal sources. Ultrasound has low attenuation underwater. Solar energy faces severe underwater light attenuation, especially in turbid waters [132]. Wind-energy harvesting devices are restricted to above-water deployment and are affected by wind stability and typhoons [133]. In contrast, ultrasonic energy harvesting devices operate entirely underwater, thereby avoiding surface meteorological disturbances and integrating with sonar systems [23]. Moreover, when dissolved oxygen in seawater is low, ultrasound can enhance it. Jongbok Choi et al. found in a 20 kHz probe system that dissolved gases significantly impact sonoluminescence and sonochemical oxidation reactions [134]. Higher O2 proportions cause faster dissolved-oxygen concentration drops when there is a significant difference from atmospheric equilibrium. However, when oxygen levels are low, ultrasonic cavitation in water removes dissolved gases, leading to active gas exchange and O2 inflow.

4.2. Disadvantage

Although acoustic energy harvesting technology based on the piezoelectric effect principle provides a stable self-powering solution for underwater sensors, under far-field conditions at greater depths, the low energy density of underwater acoustic waves makes traditional piezoelectric structures difficult to generate effective vibrations, leading to a significant decline in electrical output power [135] The resonant frequency of piezoelectric materials must be highly matched with the acoustic wave frequency to maximize energy harvesting. In contrast, the challenges of variable frequency of underwater acoustic sources and immature dynamic adjustment mechanisms remain [136]. Piezoelectric acoustic transduction technology has made significant progress, with breakthroughs in the interpretation of physical mechanisms, material design, and structural optimization. Still, it faces core challenges: first, the contradictions in synergistic regulation of intrinsic properties of piezoelectric materials are prominent, with significant mutual exclusion effects among toughness, biocompatibility, and electromechanical conversion efficiency—notably lacking universal solutions for directional enhancement of high-precision electromechanical coupling coefficients [137]; second, the limited range of available materials constrains the performance ceiling of devices [138]; third, although numerous structural design methods for piezoelectric devices exist, structural optimization under complex working conditions still requires in-depth research [139]. Fourth, although acoustic waves possess the characteristic of low attenuation during underwater propagation, scattering occurs when they encounter suspended particles (e.g., sediment, plankton), bubbles, turbulence, or irregular interfaces. This scattering causes a portion of the energy to deviate from the original propagation direction. This effect is particularly significant in turbid waters, near-surface regions with bubble-rich layers, or areas abundant with marine life. Under these specific conditions, the scattering can impact the piezoelectric conversion efficiency [140].
Additionally, in aquaculture applications, sonar-emitted acoustic waves have inherent limitations. Waves with excessively high frequencies or acoustic pressure may disrupt the behavior of sensitive species such as fish fry, spawning individuals, or shrimp. Currently, there is no globally unified maximum safe acoustic pressure standard; however, guidelines set 180 dB (peak) as a strict upper limit, which imposes constraints on the energy conversion capacity of piezoelectric transducers [141].

4.3. Prospects

Maintaining real-time and continuous monitoring of underwater sensors for water quality requires stable self-powering. Analyzing the three stages of the piezoelectric principle–environmental energy harvesting, mechanical-vibration-to-electricity conversion, and power output-future improvements mainly focus on three aspects.
Firstly, the focus is on improving the efficiency of environmental energy harvesting. Enhancing the acquisition of acoustic energy through improved devices allows piezoelectric materials in transducers to deform more, boosting power output [142]. For example, Farzaneh Motaei et al. designed a tapered structure at the input end of phononic crystal fibers, focusing on sound waves and reducing leakage [143]. Finite element simulations showed a 2.3× increase in sound intensity. Combined with phononic crystals, the core displacement field amplitude rose from 0.7 to 18 nm. In experiments, the output voltage of tapered phononic crystal fibers was 1.8 mV, 125% higher than that of the bare case (0.8 mV), indicating that sound focusing and leakage suppression significantly enhance energy conversion efficiency. Tianrun Li et al. proposed a novel structure combining Helmholtz resonant cavities (HRC) and acoustic metamaterials (HAMs), enabling efficient sound energy harvesting in two bands [144]. In fixed-frequency experiments, at 381 Hz, HAM’s peak-to-peak power was 12.82 μW (12.7× higher than traditional acoustic metamaterials TAM’s 1.02 μW), and at 31 Pa input sound pressure, the output voltage reached 3.2 V. At 1526 Hz, HAM’s peak-to-peak power was 29.29 μW (4.4× higher than TAM’s 6.65 μW), and at 23.32 Pa input sound pressure, the output power was 110.24 μW, sufficient to power low-power sensors.
Secondly, the focus is on improving piezoelectric materials. Using new materials and optimizing transducer structures can generate greater vibrations or deformations under the same acoustic stimulation [145].
Thirdly, the focus is on reducing sensor system power consumption. Energy-saving operation methods and improved signal transmission can cut system power consumption. Sayed Saad Afzal et al. harvested energy from 20 kHz external sound waves via piezoelectric transducers, stored it in a supercapacitor, and powered the system using power management units [63]. Using ultralow-power monochrome CMOS sensors and RGB LED illumination, they achieved wireless data transmission via backscatter modulation. Results showed an average active imaging power of 276.31 μW, passive imaging at 111.98 μW, and backscatter communication at 24 μW, 3–5 orders of magnitude lower than traditional underwater communication modules (50–100 mW). This enabled continuous monitoring of aquatic plants and precise imaging of sea stars. Philipp Mayer et al. proposed self-sustaining underwater acoustic sensors based on event-driven architecture and microbial fuel cells, which wake up upon detecting acoustic events, significantly reducing power consumption [146]. In “always-on” mode, the system consumed 26.89 μW (total with microphone 62 μW), 1–2 orders lower than traditional methods, achieving self-sustainability through event-driven design, programmable acoustic feature extraction, and microbial fuel cell energy harvesting.
Additionally, by leveraging the characteristics of ultrasonic waves and integrating ultrasonic sensors, it is possible to monitor aquatic organisms in real time. When ultrasonic waves encounter interfaces with varying densities or acoustic impedances (e.g., fish, suspended particles), a portion of the energy is reflected as echoes. According to the Doppler effect, the frequency of these returning echoes shifts, and the echoes carry environmental information. Through signal processing steps such as filtering, gain adjustment, and spectral analysis, they can be converted into images or other data formats [147]. Surface-mounted sonar transmitters emit ultrasonic waves toward the seabed for self-powered water quality monitoring sensors. These waves reflect off fish, impurities, and particles to form echoes. While piezoelectric transducers convert the acoustic energy into electricity, ultrasonic sensors capture echo data. By analyzing echo intensity, time delay, attenuation rate, and other parameters, metrics such as fish size/quantity and water quality indices can be derived to evaluate aquaculture environmental conditions [148].

5. Conclusions

Acoustic energy harvesting technology enables water quality sensor systems to avoid the high costs and operational risks associated with traditional battery replacement, demonstrating significant advantages in underwater environmental monitoring. However, core challenges such as energy conversion efficiency and piezoelectric material performance still require resolution. This paper comprehensively reviews the overall architecture of acoustic energy harvesting systems, including acoustic energy harvesting principles, operating mechanisms of piezoelectric transducers, physical mechanisms of acoustic–piezoelectric conversion with fundamental operational modes, and wireless transmission technologies. Leveraging its low attenuation characteristics in underwater propagation, this technology emerges as an ideal energy source for self-powered underwater sensors. Conformal integration with shipborne sonar systems enables a stable energy supply through the utilization of vessel-generated acoustic signals, providing both reliable energy provision and enhanced system reliability. Current solutions employ collaborative designs of resonant cavities and acoustic metamaterials to amplify acoustic pressure on piezoelectric transducers at specific frequencies. The review examines wireless communication principles for underwater environments, comparing technical advantages and limitations. It summarizes major piezoelectric material types and their performance characteristics, analyzing structural configurations suitable for acoustic energy harvesting. Recent breakthroughs in lead-free designs and high-efficiency conversion architectures have improved both biocompatibility and energy conversion efficiency in these core components. The paper systematically evaluates the development status of water quality sensors for aquatic parameter detection and their applications in aquaculture monitoring. It provides a comprehensive analysis of advantages, limitations, and prospects for self-powered sensor systems employing acoustic energy harvesting technology.

Author Contributions

Conceptualization, X.X.; methodology, Z.Y.; validation, Z.Y. and R.Z.; formal analysis and investigation, J.Z. and L.M.; writing—original draft preparation, Z.Y.; writing—review and editing, F.L. and X.X. All authors have read and agreed to the published version of the manuscript.

Funding

This research received no external funding.

Data Availability Statement

Data are contained within the article.

Acknowledgments

This research is supported by the Guangdong Yangjiang Mudflat and Wetland Fishery Science and Technology Academy Project with Xinghan Chen from Yangjiang Polytechnic and the open project of the Key Laboratory of Equipment and Informatization in Environment Controlled Agriculture, Ministry of Agriculture and Rural Affairs (2011NYZD2301).

Conflicts of Interest

The authors declare no conflicts of interest.

References

  1. Terence, S.; Purushothaman, G. Systematic review of Internet of Things in smart farming. Trans. Emerg. Telecommun. Technol. 2020, 31, e3958. [Google Scholar] [CrossRef]
  2. Mizuta, D.D.; Froehlich, H.E.; Wilson, J.R. The changing role and definitions of aquaculture for environmental purposes. Rev. Aquac. 2023, 15, 130–141. [Google Scholar] [CrossRef]
  3. Ahmed, S.F.; Kumar, P.S.; Kabir, M.; Zuhara, F.T.; Mehjabin, A.; Tasannum, N.; Hoang, A.T.; Kabir, Z.; Mofijur, M. Threats, challenges and sustainable conservation strategies for freshwater biodiversity. Environ. Res. 2022, 214, 113808. [Google Scholar] [CrossRef] [PubMed]
  4. Yadav, N.K.; Patel, A.B.; Singh, S.K.; Mehta, N.K.; Anand, V.; Lal, J.; Dekari, D.; Devi, N.C. Climate change effects on aquaculture production and its sustainable management through climate-resilient adaptation strategies: A review. Environ. Sci. Pollut. Res. 2024, 31, 31731–31751. [Google Scholar] [CrossRef] [PubMed]
  5. Wang, C.; Li, Z.; Wang, T.; Xu, X.; Zhang, X.; Li, D. Intelligent fish farm—The future of aquaculture. Aquac. Int. 2021, 29, 2681–2711. [Google Scholar] [CrossRef]
  6. Prapti, D.R.; Mohamed Shariff, A.R.; Che Man, H.; Ramli, N.M.; Perumal, T.; Shariff, M. Internet of Things (IoT)-based aquaculture: An overview of IoT application on water quality monitoring. Rev. Aquac. 2022, 14, 979–992. [Google Scholar] [CrossRef]
  7. Farouk, M.I.H.Z.; Jamil, Z.; Latip, M.F.A. Towards online surface water quality monitoring technology: A review. Environ. Res. 2023, 238, 117147. [Google Scholar] [CrossRef]
  8. Islam, M.; Kashem, M.A.; Alyami, S.A.; Moni, M.A. Monitoring water quality metrics of ponds with IoT sensors and machine learning to predict fish species survival. Microprocess. Microsyst. 2023, 102, 104930. [Google Scholar] [CrossRef]
  9. Cuthbert, R.N.; Diagne, C.; Hudgins, E.J.; Turbelin, A.; Ahmed, D.A.; Albert, C.; Bodey, T.W.; Briski, E.; Essl, F.; Haubrock, P.J.; et al. Biological invasion costs reveal insufficient proactive management worldwide. Sci. Total Environ. 2022, 819, 153404. [Google Scholar] [CrossRef]
  10. Van Geest, M.; Tekinerdogan, B.; Catal, C. Design of a reference architecture for developing smart warehouses in industry 4.0. Comput. Ind. 2021, 124, 103343. [Google Scholar] [CrossRef]
  11. Luo, Y.; Abidian, M.R.; Ahn, J.-H.; Akinwande, D.; Andrews, A.M.; Antonietti, M.; Bao, Z.; Berggren, M.; Berkey, C.A.; Bettinger, C.J.; et al. Technology roadmap for flexible sensors. ACS Nano 2023, 17, 5211–5295. [Google Scholar] [CrossRef] [PubMed]
  12. Navarro-Segarra, M.; Tortosa, C.; Ruiz-Díez, C.; Desmaële, D.; Gea, T.; Barrena, R.; Sabaté, N.; Esquivel, J.P. A plant-like battery: A biodegradable power source ecodesigned for precision agriculture. Energy Environ. Sci. 2022, 15, 2900–2915. [Google Scholar] [CrossRef] [PubMed]
  13. Vasudevan, S.K.; Baskaran, B. An improved real-time water quality monitoring embedded system with IoT on unmanned surface vehicle. Ecol. Inform. 2021, 65, 101421. [Google Scholar] [CrossRef]
  14. Huang, Y.; Wang, X.; Xiang, W.; Wang, T.; Otis, C.; Sarge, L.; Lei, Y.; Li, B. Forward-looking roadmaps for long-term continuous water quality monitoring: Bottlenecks, innovations, and prospects in a critical review. Environ. Sci. Technol. 2022, 56, 5334–5354. [Google Scholar] [CrossRef]
  15. Zhao, T.; Xu, M.; Xiao, X.; Ma, Y.; Li, Z.; Wang, Z.L. Recent progress in blue energy harvesting for powering distributed sensors in ocean. Nano Energy 2021, 88, 106199. [Google Scholar] [CrossRef]
  16. Chen, X.; Wang, J.; Wang, Z.; Xu, H.; Liu, C.; Huo, B.; Meng, F.; Wang, Y.; Sun, C. Low-frequency mechanical energy in the environment for energy production and piezocatalytic degradation of organic pollutants in water: A review. J. Water Process Eng. 2023, 56, 104312. [Google Scholar] [CrossRef]
  17. Qin, W.; Liu, Q.; Wang, Y.; Xie, Z.; Zhou, Z. Increase output of vibration energy harvester by a different piezoelectric mode and branch structure design. J. Phys. D: Appl. Phys. 2022, 56, 034001. [Google Scholar] [CrossRef]
  18. Ali, M.; Bathaei, M.J.; Istif, E.; Karimi, S.N.H.; Beker, L. Biodegradable piezoelectric polymers: Recent advancements in materials and applications. Adv. Healthc. Mater. 2023, 12, 2300318. [Google Scholar] [CrossRef]
  19. Iqbal, M.; Khan, F. Hybrid acoustic, vibration, and wind energy harvester using piezoelectric transduction for self-powered wireless sensor node applications. Energy Convers. Manag. 2023, 277, 116635. [Google Scholar]
  20. Li, M.; Wang, M.; Ding, R.; Deng, T.; Fang, S.; Lai, F.; Luoi, R. Study of acoustic emission propagation characteristics and energy attenuation of surface transverse wave and internal longitudinal wave of wood. Wood Sci. Technol. 2021, 55, 1619–1637. [Google Scholar] [CrossRef]
  21. Ghosh, A. A comprehensive review of water based PV: Flotavoltaics, under water, offshore & canal top. Ocean Eng. 2023, 281, 115044. [Google Scholar]
  22. Li, J.; Li, Z.; Jiang, Y.; Tang, Y. Typhoon resistance analysis of offshore wind turbines: A review. Atmosphere 2022, 13, 451. [Google Scholar] [CrossRef]
  23. Zeng, F.; Wang, T. In-situ wave energy harvesting for unmanned marine devices: A review. Ocean Eng. 2023, 285, 115376. [Google Scholar] [CrossRef]
  24. Zou, H.X.; Li, M.; Zhao, L.C.; Gao, Q.H.; Wei, K.X.; Zuo, L.; Qian, F.; Zhang, W.M. A magnetically coupled bistable piezoelectric harvester for underwater energy harvesting. Energy 2021, 217, 119429. [Google Scholar] [CrossRef]
  25. Jean, F.; Khan, M.U.; Alazzam, A.; Mohammad, B. Advancement in piezoelectric nanogenerators for acoustic energy harvesting. Microsyst. Nanoeng. 2024, 10, 197. [Google Scholar] [CrossRef]
  26. Wu, D.; Guo, J. Optimal design method and benefits research for a regional integrated energy system. Renew. Sustain. Energy Rev. 2023, 186, 113671. [Google Scholar] [CrossRef]
  27. Sanislav, T.; Mois, G.D.; Zeadally, S.; Folea, S.C. Energy harvesting techniques for internet of things (IoT). IEEE Access 2021, 9, 39530–39549. [Google Scholar] [CrossRef]
  28. Rahman, A.; Farrok, O.; Haque, M.M. Environmental impact of renewable energy source based electrical power plants: Solar, wind, hydroelectric, biomass, geothermal, tidal, ocean, and osmotic. Renew. Sustain. Energy Rev. 2022, 161, 112279. [Google Scholar] [CrossRef]
  29. Yao, Y.; Pan, Y.; Liu, S. Power ultrasound and its applications: A state-of-the-art review. Ultrason. Sonochem. 2020, 62, 104722. [Google Scholar] [CrossRef]
  30. Xu, J.; Ye, Y.; Dong, T.; Yang, Z.; Pires, N.M.M.; Zhou, Y.; Tao, F.; Wang, J.; Zhang, J.; Luo, G.; et al. State of the Art of Low-Frequency Acoustic Modulation: Intensity Enhancement and Directional Control. Adv. Sci. 2025, 2410695. [Google Scholar] [CrossRef]
  31. Choi, J.; Jung, I.; Kang, C.Y. A brief review of sound energy harvesting. Nano Energy 2019, 56, 169–183. [Google Scholar] [CrossRef]
  32. Mir, F.; Mandal, D.; Banerjee, S. Metamaterials for acoustic noise filtering and energy harvesting. Sensors 2023, 23, 4227. [Google Scholar] [CrossRef] [PubMed]
  33. Magliacano, D.; Catapane, G.; Petrone, G.; Verdière, K.; Robin, O. Sound transmission properties of a porous meta-material with periodically embedded Helmholtz resonators. Mech. Adv. Mater. Struct. 2024, 31, 6748–6756. [Google Scholar] [CrossRef]
  34. Valière, J.C.; Prax, C. Dependence of the internal geometry for the calculation of the Helmholtz frequency in an axisymmetrical acoustic resonator. J. Acoust. Soc. Am. 2021, 150, 4053–4063. [Google Scholar] [CrossRef]
  35. Mahesh, K.; Ranjith, S.K.; Mini, R.S. A deep autoencoder based approach for the inverse design of an acoustic-absorber. Eng. Comput. 2024, 40, 279–300. [Google Scholar] [CrossRef]
  36. Zhou, S.; Jia, C.; Shu, G.; Guan, Z.; Wu, H.; Li, J.; Ou-Yang, W. Recent advances in TENGs collecting acoustic energy: From low-frequency sound to ultrasound. Nano Energy 2024, 129, 109951. [Google Scholar] [CrossRef]
  37. Li, B.; Zhou, Q.; Yuan, X.; Su, H.; Guo, Q. Influence of back pressure adjustment of porous media on cavity flow noise control. Phys. Fluids 2024, 36, 106115. [Google Scholar] [CrossRef]
  38. Liao, G.; Luan, C.; Wang, Z.; Liu, J.; Yao, X.; Fu, J. Acoustic metamaterials: A review of theories, structures, fabrication approaches, and applications. Adv. Mater. Technol. 2021, 6, 2000787. [Google Scholar] [CrossRef]
  39. Zarastvand, M.R.; Ghassabi, M.; Talebitooti, R. A review approach for sound propagation prediction of plate constructions. Arch. Comput. Methods Eng. 2021, 28, 2817–2843. [Google Scholar] [CrossRef]
  40. Lee, G.; Lee, S.J.; Rho, J.; Kim, M. Acoustic and mechanical metamaterials for energy harvesting and self-powered sensing applications. Mater. Today Energy 2023, 37, 101387. [Google Scholar] [CrossRef]
  41. Muhammad Lim, C.W. From photonic crystals to seismic metamaterials: A review via phononic crystals and acoustic metamaterials. Arch. Comput. Methods Eng. 2022, 29, 1137–1198. [Google Scholar] [CrossRef]
  42. Zhou, X.; Sun, Y.; Yang, S.; Bian, Z. Band gap manipulation on P-wave propagating in functionally graded phononic crystal by periodical thermal field. Int. J. Mech. Sci. 2021, 212, 106817. [Google Scholar] [CrossRef]
  43. Oudich, M.; Gerard, N.J.; Deng, Y.; Jing, Y. Tailoring structure-borne sound through bandgap engineering in phononic crystals and metamaterials: A comprehensive review. Adv. Funct. Mater. 2023, 33, 2206309. [Google Scholar] [CrossRef]
  44. Laude, V.; Iglesias Martínez, J.A.; Wang, Y.F.; Kadic, M. Effective anisotropy of periodic acoustic and elastic composites. J. Appl. Phys. 2021, 129, 215106. [Google Scholar] [CrossRef]
  45. Park, C.S.; Shin, Y.C.; Jo, S.H.; Yoon, H.; Choi, W.; Youn, B.D.; Kim, M. Two-dimensional octagonal phononic crystals for highly dense piezoelectric energy harvesting. Nano Energy 2019, 57, 327–337. [Google Scholar] [CrossRef]
  46. Chan, V.; Perlas, A. Basics of ultrasound imaging. Atlas of Ultrasound-Guided Procedures in Interventional Pain Management; Springer: New York, NY, USA, 2011; pp. 13–19. [Google Scholar]
  47. Gao, N.; Zhang, Z.; Deng, J.; Guo, X.; Cheng, B.; Hou, H. Acoustic metamaterials for noise reduction: A review. Adv. Mater. Technol. 2022, 7, 2100698. [Google Scholar] [CrossRef]
  48. Singh, J.; Kaur, R.; Singh, D. Energy harvesting in wireless sensor networks: A taxonomic survey. Int. J. Energy Res. 2021, 45, 118–140. [Google Scholar] [CrossRef]
  49. Wen, J.; He, H.; Niu, C.; Rong, M.; Huang, Y.; Wu, Y. An improved equivalent capacitance model of the triboelectric nanogenerator incorporating its surface roughness. Nano Energy 2022, 96, 107070. [Google Scholar] [CrossRef]
  50. Li, T.; Lee, P.S. Piezoelectric energy harvesting technology: From materials, structures, to applications. Small Struct. 2022, 3, 2100128. [Google Scholar] [CrossRef]
  51. Nguyen, Q.H.; Ta, Q.T.H.; Tran, N. Review on the transformation of biomechanical energy to green energy using triboelectric and piezoelectric based smart materials. J. Clean. Prod. 2022, 371, 133702. [Google Scholar] [CrossRef]
  52. Lay, R.; Deijs, G.S.; Malmström, J. The intrinsic piezoelectric properties of materials—A review with a focus on biological materials. RSC Adv. 2021, 11, 30657–30673. [Google Scholar] [CrossRef] [PubMed]
  53. Zhu, Z.; Rui, G.; Allahyarov, E.; Zhang, H.; Li, R.; Taylor, P.L.; Zhu, L. Mechanisms of direct and converse piezoelectricity in ferroelectric polymers. Polymer 2025, 325, 128290. [Google Scholar] [CrossRef]
  54. Owusu, F.; Venkatesan, T.R.; Nüesch, F.A.; Negri, R.M.; Opris, D.M. How to make elastomers piezoelectric? Adv. Mater. Technol. 2023, 8, 2300099. [Google Scholar] [CrossRef]
  55. Chen, L.; Liu, H.; Qi, H.; Chen, J. High-electromechanical performance for high-power piezoelectric applications: Fundamental, progress, and perspective. Prog. Mater. Sci. 2022, 127, 100944. [Google Scholar] [CrossRef]
  56. Jaffe, H. Piezoelectric ceramics. J. Am. Ceram. Soc. 1958, 41, 494–498. [Google Scholar] [CrossRef]
  57. Mahapatra, S.D.; Mohapatra, P.C.; Aria, A.I.; Christie, G.; Mishra, Y.K.; Hofmann, S.; Thakur, V.K. Piezoelectric materials for energy harvesting and sensing applications: Roadmap for future smart materials. Adv. Sci. 2021, 8, 2100864. [Google Scholar] [CrossRef]
  58. Zhang, J.H.; Li, Z.; Liu, Z.; Li, M.; Guo, J.; Du, J.; Cai, C.; Zhang, S.; Sun, N.; Li, Y.; et al. Inorganic Dielectric Materials Coupling Micro-/Nanoarchitectures for State-of-the-Art Biomechanical-to-Electrical Energy Conversion Devices. Adv. Mater. 2025, 2419081. [Google Scholar] [CrossRef]
  59. Qian, W.; Yang, W.; Zhang, Y.; Bowen, C.R.; Yang, Y. Piezoelectric materials for controlling electro-chemical processes. Nano-Micro Lett. 2020, 12, 149. [Google Scholar] [CrossRef]
  60. Pan, X.; Wu, Y.; Wang, Y.; Zhou, G.; Cai, H. Mechanical energy harvesting based on the piezoelectric materials: Recent advances and future perspectives. Chem. Eng. J. 2024, 497, 154249. [Google Scholar] [CrossRef]
  61. Afzal, S.S.; Akbar, W.; Rodriguez, O.; Doumet, M.; Ha, U.; Ghaffarivardavagh, R.; Adib, F. Battery-free wireless imaging of underwater environments. Nat. Commun. 2022, 13, 5546. [Google Scholar] [CrossRef]
  62. Chen, S.; Patil, S.A.; Brown, R.K.; Schröder, U. Strategies for optimizing the power output of microbial fuel cells: Transitioning from fundamental studies to practical implementation. Appl. Energy 2019, 233, 15–28. [Google Scholar] [CrossRef]
  63. Boettcher, S.W.; Oener, S.Z.; Lonergan, M.C.; Surendranath, Y.; Ardo, S.; Brozek, C.; Kempler, P.A. Potentially confusing: Potentials in electrochemistry. ACS Energy Lett. 2020, 6, 261–266. [Google Scholar] [CrossRef]
  64. Jiang, L.; Zhang, H.; Xia, R.; Zhou, J.; Liu, S.; Ding, Y. Research on Identification Method of Cable Cross-Sectional Loss Rates Based on Multiple Magnetic Characteristic Indicators. J. Nondestruct. Eval. 2024, 43, 64. [Google Scholar] [CrossRef]
  65. Ujah, C.O.; Popoola, A.P.I.; Popoola, O.M. Review on materials applied in electric transmission conductors. J. Mater. Sci. 2022, 57, 1581–1598. [Google Scholar] [CrossRef]
  66. Nesser, H.; Lubineau, G. Strain sensing by electrical capacitive variation: From stretchable materials to electronic interfaces. Adv. Electron. Mater. 2021, 7, 2100190. [Google Scholar] [CrossRef]
  67. Huang, X.; Yang, B. Towards novel energy shunt inspired vibration suppression techniques: Principles, designs and applications. Mech. Syst. Signal Process. 2023, 182, 109496. [Google Scholar] [CrossRef]
  68. Akande, I.; Fajobi, M.; Odunlami, O.; Oluwole, O. Exploitation of composite materials as vibration isolator and damper in machine tools and other mechanical systems: A review. Mater. Today Proc. 2021, 43, 1465–1470. [Google Scholar] [CrossRef]
  69. Sezer, N.; Koç, M. A comprehensive review on the state-of-the-art of piezoelectric energy harvesting. Nano Energy 2021, 80, 105567. [Google Scholar] [CrossRef]
  70. Waqar, M.; Wu, H.; Chen, J.; Yao, K.; Wang, J. Evolution from lead-based to lead-free piezoelectrics: Engineering of lattices, domains, boundaries, and defects leading to giant response. Adv. Mater. 2022, 34, 2106845. [Google Scholar] [CrossRef]
  71. Wei, X.K.; Domingo, N.; Sun, Y.; Balke, N.; Dunin-Borkowski, R.E.; Mayer, J. Progress on emerging ferroelectric materials for energy harvesting, storage and conversion. Adv. Energy Mater. 2022, 12, 2201199. [Google Scholar] [CrossRef]
  72. Yang, X.; Yang, Z.; Wang, X.; Guo, Y.; Xie, Y.; Yao, W.; Kawasaki, H. Piezoelectric nanomaterials for antibacterial strategies. Appl. Mater. Today 2024, 40, 102419. [Google Scholar] [CrossRef]
  73. Safaei, M.; Sodano, H.A.; Anton, S.R. A review of energy harvesting using piezoelectric materials: State-of-the-art a decade later (2008–2018). Smart Mater. Struct. 2019, 28, 113001. [Google Scholar] [CrossRef]
  74. Yang, Z.; Zu, J. Comparison of PZN-PT, PMN-PT single crystals and PZT ceramic for vibration energy harvesting. Energy Convers. Manag. 2016, 122, 321–329. [Google Scholar] [CrossRef]
  75. Baidya, K.; Roy, A.; Das, K. A review of polymer-matrix piezoelectric composite coatings for energy harvesting and smart sensors. J. Coat. Technol. Res. 2024, 21, 55–85. [Google Scholar] [CrossRef]
  76. Wu, H.; Zhuo, F.; Qiao, H.; Kodumudi Venkataraman, L.; Zheng, M.; Wang, S.; Huang, H.; Li, B.; Mao, X.; Zhang, Q. Polymer-/ceramic-based dielectric composites for energy storage and conversion. Energy Environ. Mater. 2022, 5, 486–514. [Google Scholar] [CrossRef]
  77. Zak, A.K.; Yazdi, S.T.; Abrishami, M.E.; Hashim, A.M. A review on piezoelectric ceramics and nanostructures: Fundamentals and fabrications. J. Aust. Ceram. Soc. 2024, 60, 723–753. [Google Scholar]
  78. Chen, Z.; Liang, R.; Zhang, C.; Zhou, Z.; Li, Y.; Liu, Z.; Dong, X. High-performance and high-thermally stable PSN-PZT piezoelectric ceramics achieved by high-temperature poling. J. Mater. Sci. Technol. 2022, 116, 238–245. [Google Scholar] [CrossRef]
  79. Zhang, Z.; Li, Z.; Li, Q.; Liu, X.; Gong, J.; Li, H. A PVDF/PU-based composite 3D flexible piezoelectric nanofiber aerogel for acoustic energy harvesting and noise reduction. Chem. Eng. J. 2025, 507, 159836. [Google Scholar] [CrossRef]
  80. Zhou, S.; Hou, L.; Wang, G.; Zhou, Y.; Li, G.; Jiang, Y. Ultrasound vibration energy harvesting from a rotary-type piezoelectric ultrasonic actuator. Mech. Syst. Signal Process. 2023, 197, 110337. [Google Scholar] [CrossRef]
  81. Jiang, L.; Yang, Y.; Chen, R.; Lu, G.; Li, R.; Li, D.; Humayun, M.S.; Shung, K.K.; Zhu, J.; Chen, Y.; et al. Flexible piezoelectric ultrasonic energy harvester array for bio-implantable wireless generator. Nano Energy 2019, 56, 216–224. [Google Scholar] [CrossRef]
  82. Bell, A.J.; Comyn, T.P.; Stevenson, T.J. Expanding the application space for piezoelectric materials. APL Mater. 2021, 9, 010901. [Google Scholar] [CrossRef]
  83. Zhang, S.; Malič, B.; Li, J.-F.; Rödel, J. Lead-free ferroelectric materials: Prospective applications. J. Mater. Res. 2021, 36, 985–995. [Google Scholar] [CrossRef]
  84. Wang, Q.; Zhang, Y.; Xue, H.; Zeng, Y.; Lu, G.; Fan, H.; Jiang, L.; Wu, J. Lead-free dual-frequency ultrasound implants for wireless, biphasic deep brain stimulation. Nat. Commun. 2024, 15, 4017. [Google Scholar] [CrossRef]
  85. Al-Sulaifanie, A.I.; Al-Sulaifanie, B.K.; Biswas, S. Recent trends in clustering algorithms for wireless sensor networks: A comprehensive review. Comput. Commun. 2022, 191, 395–424. [Google Scholar] [CrossRef]
  86. Eitzinger, A.; Cock, J.; Atzmanstorfer, K.; Binder, C.R.; Läderach, P.; Bonilla-Findji, O.; Bartling, M.; Mwongera, C.; Zurita, L.; Jarvis, A. GeoFarmer: A monitoring and feedback system for agricultural development projects. Comput. Electron. Agric. 2019, 158, 109–121. [Google Scholar] [CrossRef]
  87. Rao, A.S.; Radanovic, M.; Liu, Y.; Hu, S.; Fang, Y.; Khoshelham, K.; Palaniswami, M.; Ngo, T. Real-time monitoring of construction sites: Sensors, methods, and applications. Autom. Constr. 2022, 136, 104099. [Google Scholar] [CrossRef]
  88. Chen, L.K.; Shao, Y.; Di, Y. Underwater and water-air optical wireless communication. J. Light. Technol. 2022, 40, 1440–1452. [Google Scholar] [CrossRef]
  89. Aman, W.; Al-Kuwari, S.; Muzzammil, M.; Rahman, M.M.; Kumar, A. Security of underwater and air–water wireless communication: State-of-the-art, challenges and outlook. Ad Hoc Netw. 2023, 142, 103114. [Google Scholar] [CrossRef]
  90. Yu, J.; Wu, Y. High-speed optical fiber communication in China. ACS Photonics 2022, 10, 2128–2148. [Google Scholar] [CrossRef]
  91. Ali, M.F.; Jayakody, D.N.; Chursin, Y.A.; Affes, S.; Dmitry, S. Recent advances and future directions on underwater wireless communications. Arch. Comput. Methods Eng. 2020, 27, 1379–1412. [Google Scholar] [CrossRef]
  92. Islam, K.Y.; Ahmad, I.; Habibi, D.; Waqar, A. A survey on energy efficiency in underwater wireless communications. J. Netw. Comput. Appl. 2022, 198, 103295. [Google Scholar] [CrossRef]
  93. Zhao, Y.; Chen, Y.; Huang, J.; Zhou, Z.; Zhang, F. Photoacoustic communication system based on detecting laser-generated sound by optical fiber underwater acoustic sensor. Opt. Lasers Eng. 2024, 177, 108134. [Google Scholar] [CrossRef]
  94. Noufal, K.; Sanjana, M.; Latha, G.; Ramesh, R. Influence of internal wave induced sound speed variability on acoustic propagation in shallow waters of North West Bay of Bengal. Appl. Acoust. 2022, 194, 108778. [Google Scholar] [CrossRef]
  95. Azeez, A.; Revichandran, C.; Muraleedharan, K.R.; John, S.; Seena, G.; Nair, R.C.; Manju, K.G. Sound speed variation in the coastal waters off Cochin and signature of subsurface maxima. Ocean Dyn. 2021, 71, 923–933. [Google Scholar]
  96. Zhu, S.; Zhang, G.; Wu, D.; Jia, L.; Zhang, Y.; Geng, Y.; Liu, Y.; Ren, W.; Zhang, W. High Signal-to-Noise Ratio MEMS Noise Listener for Ship Noise Detection. Remote Sens. 2023, 15, 777. [Google Scholar] [CrossRef]
  97. Su, X.; Sutarlie, L.; Loh, X.J. Sensors, biosensors, and analytical technologies for aquaculture water quality. Research 2020, 2020, 8272705. [Google Scholar] [CrossRef]
  98. Kwon, D.Y.; Kim, J.; Park, S.; Hong, S. Advancements of remote data acquisition and processing in unmanned vehicle technologies for water quality monitoring: An extensive review. Chemosphere 2023, 343, 140198. [Google Scholar] [CrossRef]
  99. Zhang, M.; Guo, W.; Chen, Y.; He, D.; Isaev, A.B.; Zhu, M. Dissolved oxygen in aeration-driven piezo-catalytic for antibiotics pollutants removal in water. Chin. Chem. Lett. 2023, 34, 108229. [Google Scholar] [CrossRef]
  100. Hallinan, B.D.; Tettelbach, S.T.; Volkenborn, N.; Doherty, O.W.; Allam, B.; Gobler, C.J. Warming and hypoxia reduce the performance and survival of northern bay scallops (Argopecten irradians irradians) amid a fishery collapse. Glob. Change Biol. 2023, 29, 2092–2107. [Google Scholar]
  101. Wang, B.; Guo, Q.; Luo, Z.; Zhuang, J.; Wang, C.; Li, Z.; Li, H.; Han, Q.; Cao, J.; Wang, H.; et al. The effect of varying dissolved oxygen levels on Cryptocaryoniasis in cage-farmed Larimichthys crocea. Aquaculture 2025, 594, 741373. [Google Scholar] [CrossRef]
  102. Anconi, A.C.S.A.; Brito, N.C.S.; Nunes, C.A. Determination of peroxide value in edible oils based on Digital Image Colorimetry. J. Food Compos. Anal. 2022, 113, 104724. [Google Scholar] [CrossRef]
  103. Wolfbeis, O.S. Luminescent sensing and imaging of oxygen: Fierce competition to the Clark electrode. BioEssays 2015, 37, 921–928. [Google Scholar] [CrossRef] [PubMed]
  104. Grasso, G.; Onesto, V.; Forciniti, S.; D’amone, E.; Colella, F.; Pierantoni, L.; Famà, V.; Gigli, G.; Reis, R.L.; Oliveira, J.M.; et al. Highly sensitive ratiometric fluorescent fiber matrices for oxygen sensing with micrometer spatial resolution. Bio-Des. Manuf. 2024, 7, 292–306. [Google Scholar] [CrossRef]
  105. Yang, F.; Moayedi, H.; Mosavi, A. Predicting the degree of dissolved oxygen using three types of multi-layer perceptron-based artificial neural networks. Sustainability 2021, 13, 9898. [Google Scholar] [CrossRef]
  106. Kim, Y.H.; Son, S.; Kim, H.C.; Kim, B.; Park, Y.G.; Nam, J.; Ryu, J. Application of satellite remote sensing in monitoring dissolved oxygen variabilities: A case study for coastal waters in Korea. Environ. Int. 2020, 134, 105301. [Google Scholar] [CrossRef]
  107. Xu, C.; Chen, X.; Zhang, L. Predicting river dissolved oxygen time series based on stand-alone models and hybrid wavelet-based models. J. Environ. Manag. 2021, 295, 113085. [Google Scholar] [CrossRef]
  108. Xu, X.; Wang, B.; Du, Z.; Bai, Z.; Wang, S.; Wang, C.; Li, D. A novel nonplanar multi-chamber flexible array dissolved oxygen sensor for aquaculture robotic fish. Comput. Electron. Agric. 2025, 230, 109903. [Google Scholar] [CrossRef]
  109. Trevathan, J.; Read, W.; Sattar, A. Implementation and calibration of an IoT light attenuation turbidity sensor. Internet Things 2022, 19, 100576. [Google Scholar] [CrossRef]
  110. Lee, C.M.; Hestir, E.L.; Tufillaro, N.; Palmieri, B.; Acuña, S.; Osti, A.; Bergamaschi, B.A.; Sommer, T. Monitoring turbidity in San Francisco Estuary and Sacramento–San Joaquin delta using satellite remote sensing. JAWRA J. Am. Water Resour. Assoc. 2021, 57, 737–751. [Google Scholar] [CrossRef]
  111. Souza, A.P.; Oliveira, B.A.; Andrade, M.L.; Starling, M.C.V.; Pereira, A.H.; Maillard, P.; Nogueira, K.; dos Santos, J.A.; Amorim, C.C. Integrating remote sensing and machine learning to detect turbidity anomalies in hydroelectric reservoirs. Sci. Total Environ. 2023, 902, 165964. [Google Scholar] [CrossRef]
  112. Natkunarajah, K.; Masilamani, K.; Maheswaran, S.; Lothenbach, B.; Amarasinghe, D.; Attygalle, D. Analysis of the trend of pH changes of concrete pore solution during the hydration by various analytical methods. Cem. Concr. Res. 2022, 156, 106780. [Google Scholar] [CrossRef]
  113. Li, H.; Cui, Z.; Cui, H.; Bai, Y.; Yin, Z.; Qu, K. A review of influencing factors on a recirculating aquaculture system: Environmental conditions, feeding strategies, and disinfection methods. J. World Aquac. Soc. 2023, 54, 566–602. [Google Scholar] [CrossRef]
  114. Chen, H.; Luo, D. Application of haematology parameters for health management in fish farms. Rev. Aquac. 2023, 15, 704–737. [Google Scholar] [CrossRef]
  115. El-Khoury, M.; Roziere, E.; Grondin, F.; Cortas, R.; Chehade, F.H. Experimental evaluation of the effect of cement type and seawater salinity on concrete offshore structures. Constr. Build. Mater. 2022, 322, 126471. [Google Scholar] [CrossRef]
  116. Yue, G.H.; Ma, K.Y.; Xia, J.H. Status of conventional and molecular breeding of salinity-tolerant tilapia. Rev. Aquac. 2024, 16, 271–286. [Google Scholar] [CrossRef]
  117. Zhang, K.; Ye, Z.; Qi, M.; Cai, W.; Saraiva, J.L.; Wen, Y.; Liu, G.; Zhu, Z.; Zhu, S.; Zhao, J. Water quality impact on fish behavior: A review from an aquaculture perspective. Rev. Aquac. 2025, 17, e12985. [Google Scholar] [CrossRef]
  118. Sun, R.; Zhou, S.; Cheng, L. Ultra-low frequency vibration energy harvesting: Mechanisms, enhancement techniques, and scaling laws. Energy Convers. Manag. 2023, 276, 116585. [Google Scholar] [CrossRef]
  119. Lone, S.A.; Lim, K.C.; Kaswan, K.; Chatterjee, S.; Fan, K.P.; Choi, D.; Lee, S.; Zhang, H.; Cheng, J.; Lin, Z.H. Recent advancements for improving the performance of triboelectric nanogenerator devices. Nano Energy 2022, 99, 107318. [Google Scholar] [CrossRef]
  120. Matos, T.; Martins, M.; Henriques, R.; Goncalves, L. A review of methods and instruments to monitor turbidity and suspended sediment concentration. J. Water Process Eng. 2024, 64, 105624. [Google Scholar] [CrossRef]
  121. Guo, Z.; Ouyang, W.; He, M.; Peng, S.; Hu, J.; Lin, C. Involving degradation products provides a new perspective of diffuse pollution assessment of atrazine with a modified mass balance approach. J. Hazard. Mater. 2025, 487, 137169. [Google Scholar] [CrossRef]
  122. Chen, K.; Wang, X.; Wang, C. High-Precision monitoring system for turbidity of drinking water by using scattering method. IEEE Sens. J. 2023, 23, 29525–29535. [Google Scholar] [CrossRef]
  123. Safar, Z.; Chassagne, C.; Rijnsburger, S.; Sanz, M.I.; Manning, A.J.; Souza, A.; van Kessel, T.; Horner-Devine, A.; Flores, R.; McKeon, M.; et al. Characterization and classification of estuarine suspended particles based on their inorganic/organic matter composition. Front. Mar. Sci. 2022, 9, 896163. [Google Scholar] [CrossRef]
  124. Saha, A.; Yermembetova, A.; Mi, Y.; Gopalakrishnan, S.; Sedaghat, S.; Waimin, J.; Wang, P.; Glassmaker, N.; Mousoulis, C.; Raghunathan, N.; et al. Temperature self-calibration of always-on, field-deployed ion-selective electrodes based on differential voltage measurement. ACS Sens. 2022, 7, 2661–2670. [Google Scholar] [CrossRef] [PubMed]
  125. Viciano-Tudela, S.; Parra, L.; Sendra, S.; Lloret, J. A low-cost virtual sensor for underwater ph monitoring in coastal waters. Chemosensors 2023, 11, 215. [Google Scholar] [CrossRef]
  126. Chen, W.H.; Dillon, W.D.; Armstrong, E.A.; Moratti, S.C.; McGraw, C.M. Self-referencing optical fiber pH sensor for marine microenvironments. Talanta 2021, 225, 121969. [Google Scholar] [CrossRef]
  127. Staudinger, C.; Strobl, M.; Breininger, J.; Klimant, I.; Borisov, S.M. Fast and stable optical pH sensor materials for oceanographic applications. Sens. Actuators B Chem. 2019, 282, 204–217. [Google Scholar] [CrossRef]
  128. Rahman, H.; Harun, S.; Yasin, M.; Phang, S.; Damanhuri, S.; Arof, H.; Ahmad, H. Tapered plastic multimode fiber sensor for salinity detection. Sens. Actuators A Phys. 2011, 171, 219–222. [Google Scholar] [CrossRef]
  129. Nag, A.; Mukhopadhyay, S.C.; Kosel, J. Sensing system for salinity testing using laser-induced graphene sensors. Sens. Actuators A Phys. 2017, 264, 107–116. [Google Scholar] [CrossRef]
  130. Moyano, D.B.; Paraiso, D.A.; González-Lezcano, R.A. Possible effects on health of ultrasound exposure, risk factors in the work environment and occupational safety review. Healthcare 2022, 10, 423. [Google Scholar] [CrossRef]
  131. Maridevaru, M.C.; Lu, H.; Roy, S.; Yan, Y.; Wang, F.; Soe, S.K.; Ullah, Z.; Sang, H.; Shang, J.; Guo, B. Development of Polymer-Based Piezoelectric Materials for the Bone Tissue Regeneration. Macromol. Biosci. 2025, 2500031. [Google Scholar] [CrossRef]
  132. Ali, M.F.; Jayakody, D.N.K.; Li, Y. Recent trends in underwater visible light communication (UVLC) systems. IEEE Access 2022, 10, 22169–22225. [Google Scholar] [CrossRef]
  133. Abaei, M.M.; Kumar, S.; Arzaghi, E.; Golestani, N.; Abdussamie, N.; Garaniya, V.; Salehi, F.; Asadnia, M.; Hunter, T.S.; Pichard, A.; et al. Developing offshore renewable energy systems in Australia: Existing regulatory challenges and requirements for reliability assurance. Ocean Coast. Manag. 2024, 257, 107316. [Google Scholar] [CrossRef]
  134. Choi, J.; Son, Y. Effect of dissolved gases on sonochemical oxidation in a 20 kHz probe system: Continuous monitoring of dissolved oxygen concentration and sonochemical oxidation activity. Ultrason. Sonochem. 2023, 97, 106452. [Google Scholar] [CrossRef] [PubMed]
  135. Roszkiewicz, A.; Garlińska, M.; Pregowska, A. Advancements in Piezoelectric-Enabled Devices for Optical Communication. physica status solidi (a) 2025, 222, 2400298. [Google Scholar] [CrossRef]
  136. Liu, T.; Mao, Y.; Dou, H.; Zhang, W.; Yang, J.; Wu, P.; Li, D.; Mu, X. Emerging Wearable Acoustic Sensing Technologies. Adv. Sci. 2025, 12, 2408653. [Google Scholar] [CrossRef]
  137. Hagelauer, A.; Ruby, R.; Inoue, S.; Plessky, V.; Hashimoto, K.Y.; Nakagawa, R.; Verdu, J.; de Paco, P.; Mortazawi, A.; Piazza, G.; et al. From microwave acoustic filters to millimeter-wave operation and new applications. IEEE J. Microw. 2022, 3, 484–508. [Google Scholar] [CrossRef]
  138. Turner, B.L.; Senevirathne, S.; Kilgour, K.; McArt, D.; Biggs, M.; Menegatti, S.; Daniele, M.A. Ultrasound-powered implants: A critical review of piezoelectric material selection and applications. Adv. Healthc. Mater. 2021, 10, 2100986. [Google Scholar] [CrossRef]
  139. Chen, J.; Qiu, Q.; Han, Y.; Lau, D. Piezoelectric materials for sustainable building structures: Fundamentals and applications. Renew. Sustain. Energy Rev. 2019, 101, 14–25. [Google Scholar] [CrossRef]
  140. Fan, J.; Wang, F. Review of ultrasonic measurement methods for two-phase flow. Rev. Sci. Instrum. 2021, 92, 091502. [Google Scholar] [CrossRef]
  141. Casali, J.G. Sound and noise: Measurement and design guidance. In Handbook of Human Factors and Ergonomics; John Wiley & Sons: Hoboken, NJ, USA, 2021; pp. 457–493. [Google Scholar]
  142. Ahmed, R.; Mir, F.; Banerjee, S. A review on energy harvesting approaches for renewable energies from ambient vibrations and acoustic waves using piezoelectricity. Smart Mater. Struct. 2017, 26, 085031. [Google Scholar] [CrossRef]
  143. Motaei, F.; Bahrami, A. Acoustic energy harvesting using phononic crystal fiber with conical input. Sci. Rep. 2024, 14, 12354. [Google Scholar] [CrossRef] [PubMed]
  144. Li, T.; Wang, Z.; Xiao, H.; Yan, Z.; Yang, C.; Tan, T. Dual-band piezoelectric acoustic energy harvesting by structural and local resonances of Helmholtz metamaterial. Nano Energy 2021, 90, 106523. [Google Scholar] [CrossRef]
  145. Lee, J.H.; Cho, K.H.; Cho, K. Emerging trends in soft electronics: Integrating machine intelligence with soft acoustic/vibration sensors. Adv. Mater. 2023, 35, 2209673. [Google Scholar] [CrossRef] [PubMed]
  146. Mayer, P.; Magno, M.; Benini, L. Self-sustaining acoustic sensor with programmable pattern recognition for underwater monitoring. IEEE Trans. Instrum. Meas. 2019, 68, 2346–2355. [Google Scholar] [CrossRef]
  147. Wang, X.; Gao, Y.; Liu, C.; Wang, Y.; Liu, A.; Yang, W. Cordless Miniature Robots from Centimeter to Nanometer Scale: Recent Progress and Future Challenges in Biomedicine Field. Adv. Mater. Technol. 2024, 10, 2401223. [Google Scholar] [CrossRef]
  148. Li, D.; Du, Z.; Wang, Q.; Wang, J.; Du, L. Recent advances in acoustic technology for aquaculture: A review. Rev. Aquac. 2024, 16, 357–381. [Google Scholar] [CrossRef]
Figure 1. Self-powered wireless sensing system.
Inventions 10 00041 g001
Figure 2. Schematic of the acoustic energy collector.
Inventions 10 00041 g002
Figure 3. Schematic of resonators. (a) Helmholtz resonator. (b) Half-wavelength tube resonator. (c) Quarter-wavelength tube resonator.
Inventions 10 00041 g003
Figure 4. Principle of the piezoelectric effect.
Inventions 10 00041 g004
Table 1. Classification of piezoelectric materials.
TypeMaterialsAdvantageDisadvantageRef
Single-crystal
material
Quartz
lithium niobate
(LiNbO3)
Lithium tantalate
(LiTaO3)
Low loss;
The electromechanical
coupling coefficient is
large;
Excellent piezoelectric
properties
Production is difficult and expensive;
Brittleness height
[73]
Polycrystalline
materials
(piezoelectric
ceramics)
PZTEasy to manufacture and
low cost;
High coupling;
High energy conversion rate
Easy to age, performance declines with time;
Very brittle, unable to absorb large strains without damage;
The performance is slightly lower than that of single-crystal materials
[74]
Relaxation ferroelectric materialsPVDFHigh dielectric constant;
High electromechanical
coupling coefficient;
Strong electrostrictive
effect;
High temperature sensitivity;
Preparation complexity
[75]
Polymer materialsPolyvinylidene
fluoride (PVDF)
Good flexibility, light weight; Easy to process,
strong adaptability;
High flexibility;
The piezoelectric properties are low;
Poor thermal stability;
The electromechanical coupling coefficient is low
[76]
Composite materialEpoxy matrix
composite;
PVDF-based
composite
Can combine the advantages of a variety of materials;
Specific performance
requirements can be
achieved by changing
material composition and structural design
The preparation process is
complex;
It is difficult to optimize all desired performance simultaneously
[77]
Disclaimer/Publisher’s Note: The statements, opinions and data contained in all publications are solely those of the individual author(s) and contributor(s) and not of MDPI and/or the editor(s). MDPI and/or the editor(s) disclaim responsibility for any injury to people or property resulting from any ideas, methods, instructions or products referred to in the content.

