1. Introduction
In an increasingly globalized world, English has established itself as the primary language for international communication, attracting learners from various linguistic backgrounds. Language learning encompasses not only grammar and vocabulary, but also accent and pronunciation, which significantly affect communicative competence and speech standardization [
1]. However, regional accents, which are often influenced by a speaker’s native language, introduce challenges in achieving clear and comprehensible English. Recent advances in deep learning technology have fueled the development of sophisticated speech analysis systems, offering potential for improving language-learning outcomes through enhanced pronunciation feedback [
2,
3]. Furthermore, pronunciation is a fundamental component of effective communication, yet it remains one of the most challenging aspects for language learners. Nonnative speakers often substitute phonemes with those familiar from their native languages, producing distinct accents that can impede mutual understanding [
4]. Addressing pronunciation through targeted learning tools not only enhances learners’ speech intelligibility but also fosters confidence and fluency in language use [
5]. Convolutional neural networks (CNNs) in particular have proven to be effective at feature extraction and classification tasks within speech recognition [
3,
6]. These models can discern intricate patterns in audio data, making them highly suitable for accent recognition and pronunciation analysis. Nevertheless, the majority of studies focus on major English accents, such as American and British, with limited exploration and application for a broader array of nonnative accents [
4,
5,
7]. Machine learning techniques, including mel-frequency cepstral coefficients (MFCCs) and spectrogram-based feature extraction, have shown promise in classifying and assessing nonnative pronunciation [
6,
8]. Such approaches enable the more precise identification of speech characteristics, contributing to personalized feedback systems designed to support accent improvement and language learning. Deep learning-powered speech analysis systems offer a refined approach to evaluating pronunciation and accent, providing feedback with greater accuracy. By utilizing models trained on diverse linguistic data, these systems offer feedback tailored to learners’ unique needs, encouraging an iterative learning process [
7,
9]. This focus on accent adaptation and enhancement is crucial for supporting language acquisition and reducing communication barriers among nonnative speakers. Despite substantial progress, current speech recognition and analysis systems encounter limitations, particularly in handling a wide range of accents with the same efficacy as native accents [
5]. Most models are optimized for standard American and British English, leading to an underrepresentation of nonnative accents [
10]. Additionally, noise sensitivity and variations in pronunciation reduce the effectiveness of these systems in real-world scenarios [
11,
12].
In a study by Ensslin et al. [
6], deep learning was investigated for speech accent detection within video games, with a focus on sociolinguistic aspects, such as stereotypical accent usage and related social judgments. AlexNet was trained on the speech accent archive (SAA) data and applied to audio from a video game. To optimize the model, experiments were conducted with varying parameters, including epochs, batch sizes, time windows, and frequency filters, which resulted in an optimal test accuracy of 61%. Following training, a 75% accuracy was achieved on the SAA data and a 52.7% accuracy on game audio samples, where the accuracy improved to 60% in low-noise conditions. Limitations in speech analysis systems, which are typically optimized for American and British English, were addressed by Upadhyay and Lui [
3]. A model capable of classifying nonnative accents was developed. Audio signals were pre-processed and converted to MFCCs. Four classification methods were tested: Random Forest, Gradient Boosting, CNN, and multi-layer perceptron (MLP). Among these methods, the CNN model demonstrated the highest accuracy, where it achieved rates between 80% and 88% and significantly outperformed traditional approaches.
Foreign-accented English classification was explored by Russell and Najafian [
5] to determine speakers’ countries of origin. A corpus of 30 speakers from six countries was developed, and MFCC features were used with a deep belief network (DBN) classifier. After noise cancellation and normalization, the DBN model, consisting of two hidden layers with 1000 nodes, achieved a 90.2% accuracy for two accents and 71.9% for six accents, which outperformed conventional classifiers, like SVM, k-NN, and random forest. The pronunciation quality in English learners was assessed by Nicolao et al. [
11] using deep neural network features and phoneme-specific discriminative classifiers. A system was introduced to provide phoneme-level scoring based on teacher-annotated error patterns. The learner pronunciation was compared with a reference, and pronunciation scores were generated based on phoneme duration and similarity.
For mobile-assisted pronunciation learning, the smartphone-assisted pronunciation learning technique (SAPT) was proposed by Lee et al. [
10]. Pronunciation errors were detected, and words were recommended for practice. Processing was offloaded to an internet of things (IoT) system to address the constraints of low-computation devices. Through a seven-step process, user speech was analyzed, phoneme correlations were evaluated, and practice words were suggested. Finally, pronunciation variation across English varieties was addressed by Kasahara et al. [
9]. A structure-based method to predict pronunciation distances was proposed. Support vector regression (SVR) and Bhattacharyya distances (BDs) were used to represent pronunciation differences. Local contrasts and phonetic class features were identified as significant contributors to accurate pronunciation distance predictions, as indicated by high correlation scores. In [
12], MALL was proposed as a tool to enhance student motivation and readiness, promoting flexibility and engagement in language learning for achieving positive outcomes. However, the study faced limitations, including a restricted sample from Indian universities, hardware constraints affecting speaking and listening tasks, and a narrow focus on English. Liu et al. [
13] proposed a knowledge-based intelligence program to address pronunciation challenges. The proposed methods achieved significant accuracy in classifying correct and incorrect pronunciations. However, the study’s limitations include a small dataset and its generalizability to other phonemes and real-world contexts. Recently, Rukwong and Pongpinigpinyo [
14] introduced an innovative approach to computer-assisted pronunciation training (CAPT) for Thai vowel recognition, leveraging CNN and acoustic features such as mel-spectrograms. Their system effectively addresses key challenges in Thai vowel pronunciation training, including the reliance on expert intervention and the complexity of traditional manual methods. While the system demonstrated an impressive accuracy of 98.61%, its limitations include a reliance on a narrowly focused dataset of standard Thai speakers in controlled environments, raising concerns about its adaptability and robustness in diverse real-world scenarios.
Recent advancements in MALL have increasingly leveraged deep learning techniques to enhance pronunciation assessment. For example, systems using CNNs have demonstrated a strong capability in extracting hierarchical acoustic features, such as spectrograms and MFCCs [
15,
16,
17,
18], leading to the improved classification accuracy of accents and pronunciation errors. However, many existing studies primarily focus on broad accent classification or overall pronunciation scoring without integrating personalized, context-aware feedback mechanisms. Multi-feature fusion with fuzzy inference [
19]: Unlike prior works that often relied on a single feature type or straightforward classification, our system uniquely combines multiple complementary acoustic features, including spectrograms, MFCCs, and formant frequencies, with a fuzzy inference system (FIS). This integration enables context-aware, interpretable, and nuanced feedback tailored to the learner’s specific pronunciation challenges, especially for minimal pair discrimination. Real-time mobile implementation: While many previous models have demonstrated strong performances offline or in desktop environments, our work emphasizes a real-time, mobile-friendly architecture. This practical focus supports accessible and immediate feedback for learners, promoting effective self-directed practice outside traditional classroom settings. Targeted support for Chinese-accented English: Our study specifically addressed the pronunciation challenges faced by Chinese-accented English learners by including carefully selected standard words and minimal pairs known to be problematic. This targeted approach enhances the relevance and effectiveness of the feedback, distinguishing it from more general accent recognition systems. This advances the field by offering a comprehensive, multi-feature, and context-aware system optimized for mobile use and focused on the particular needs of a specific learner group.
3. Results
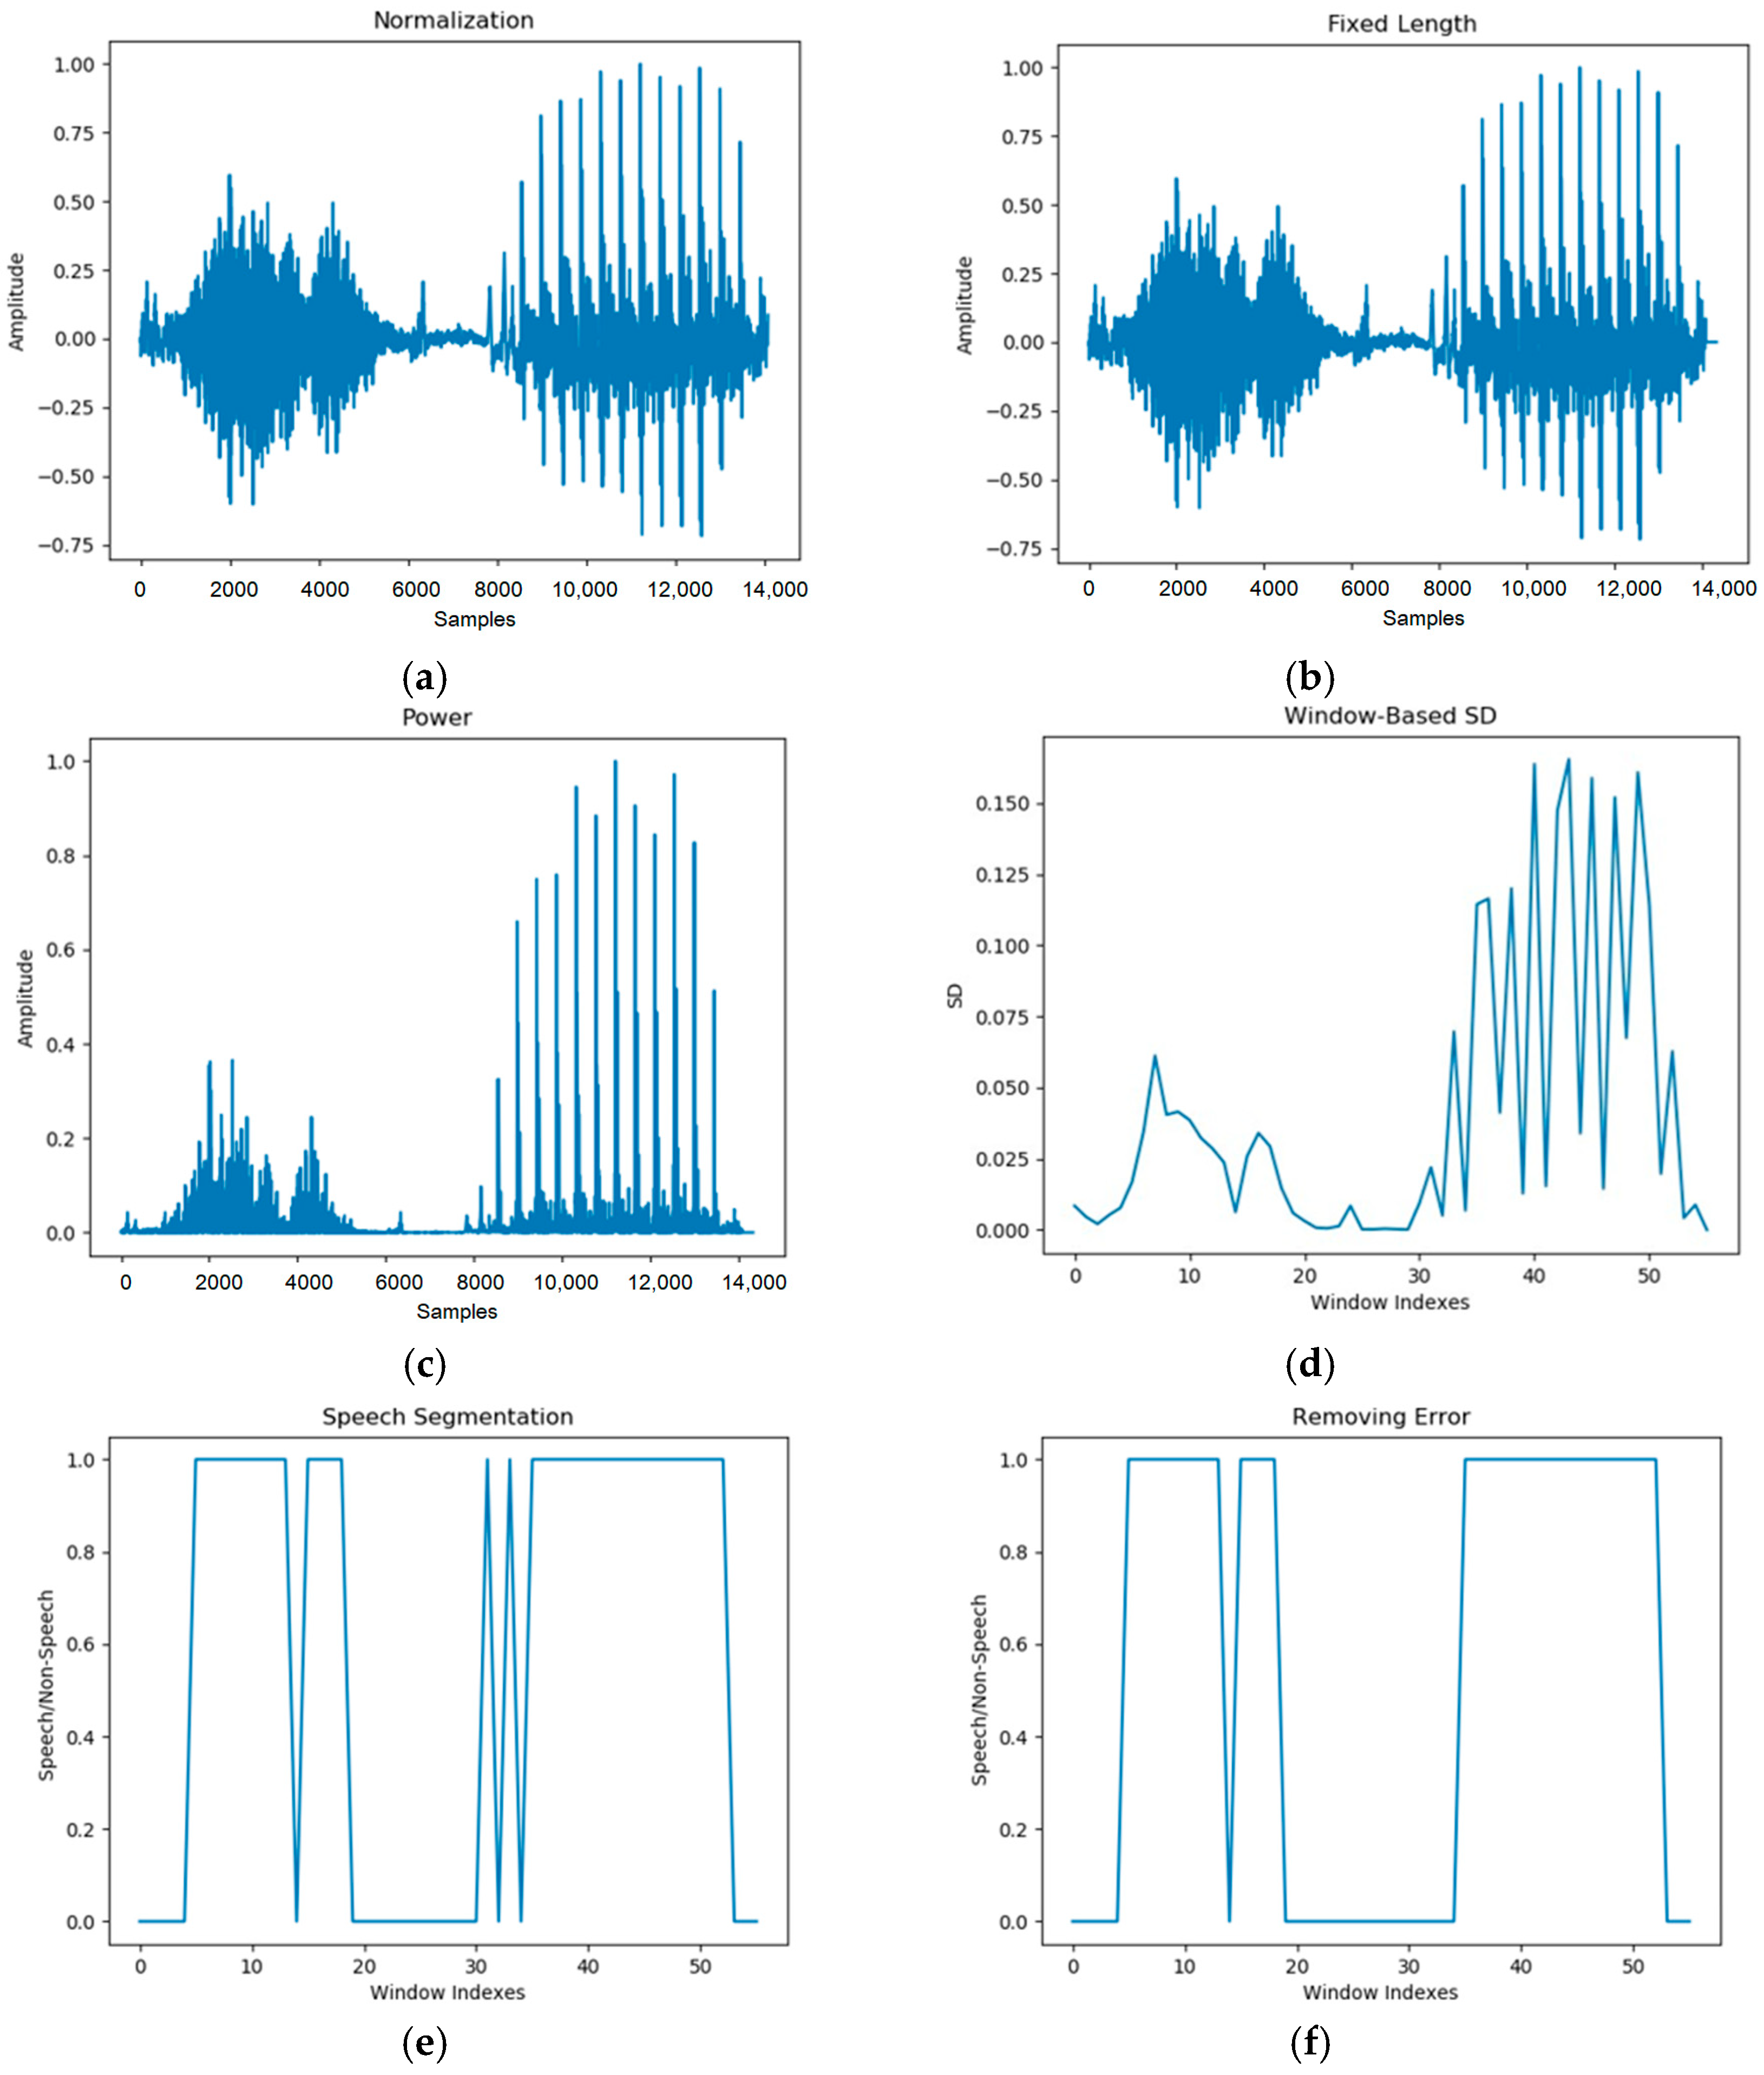
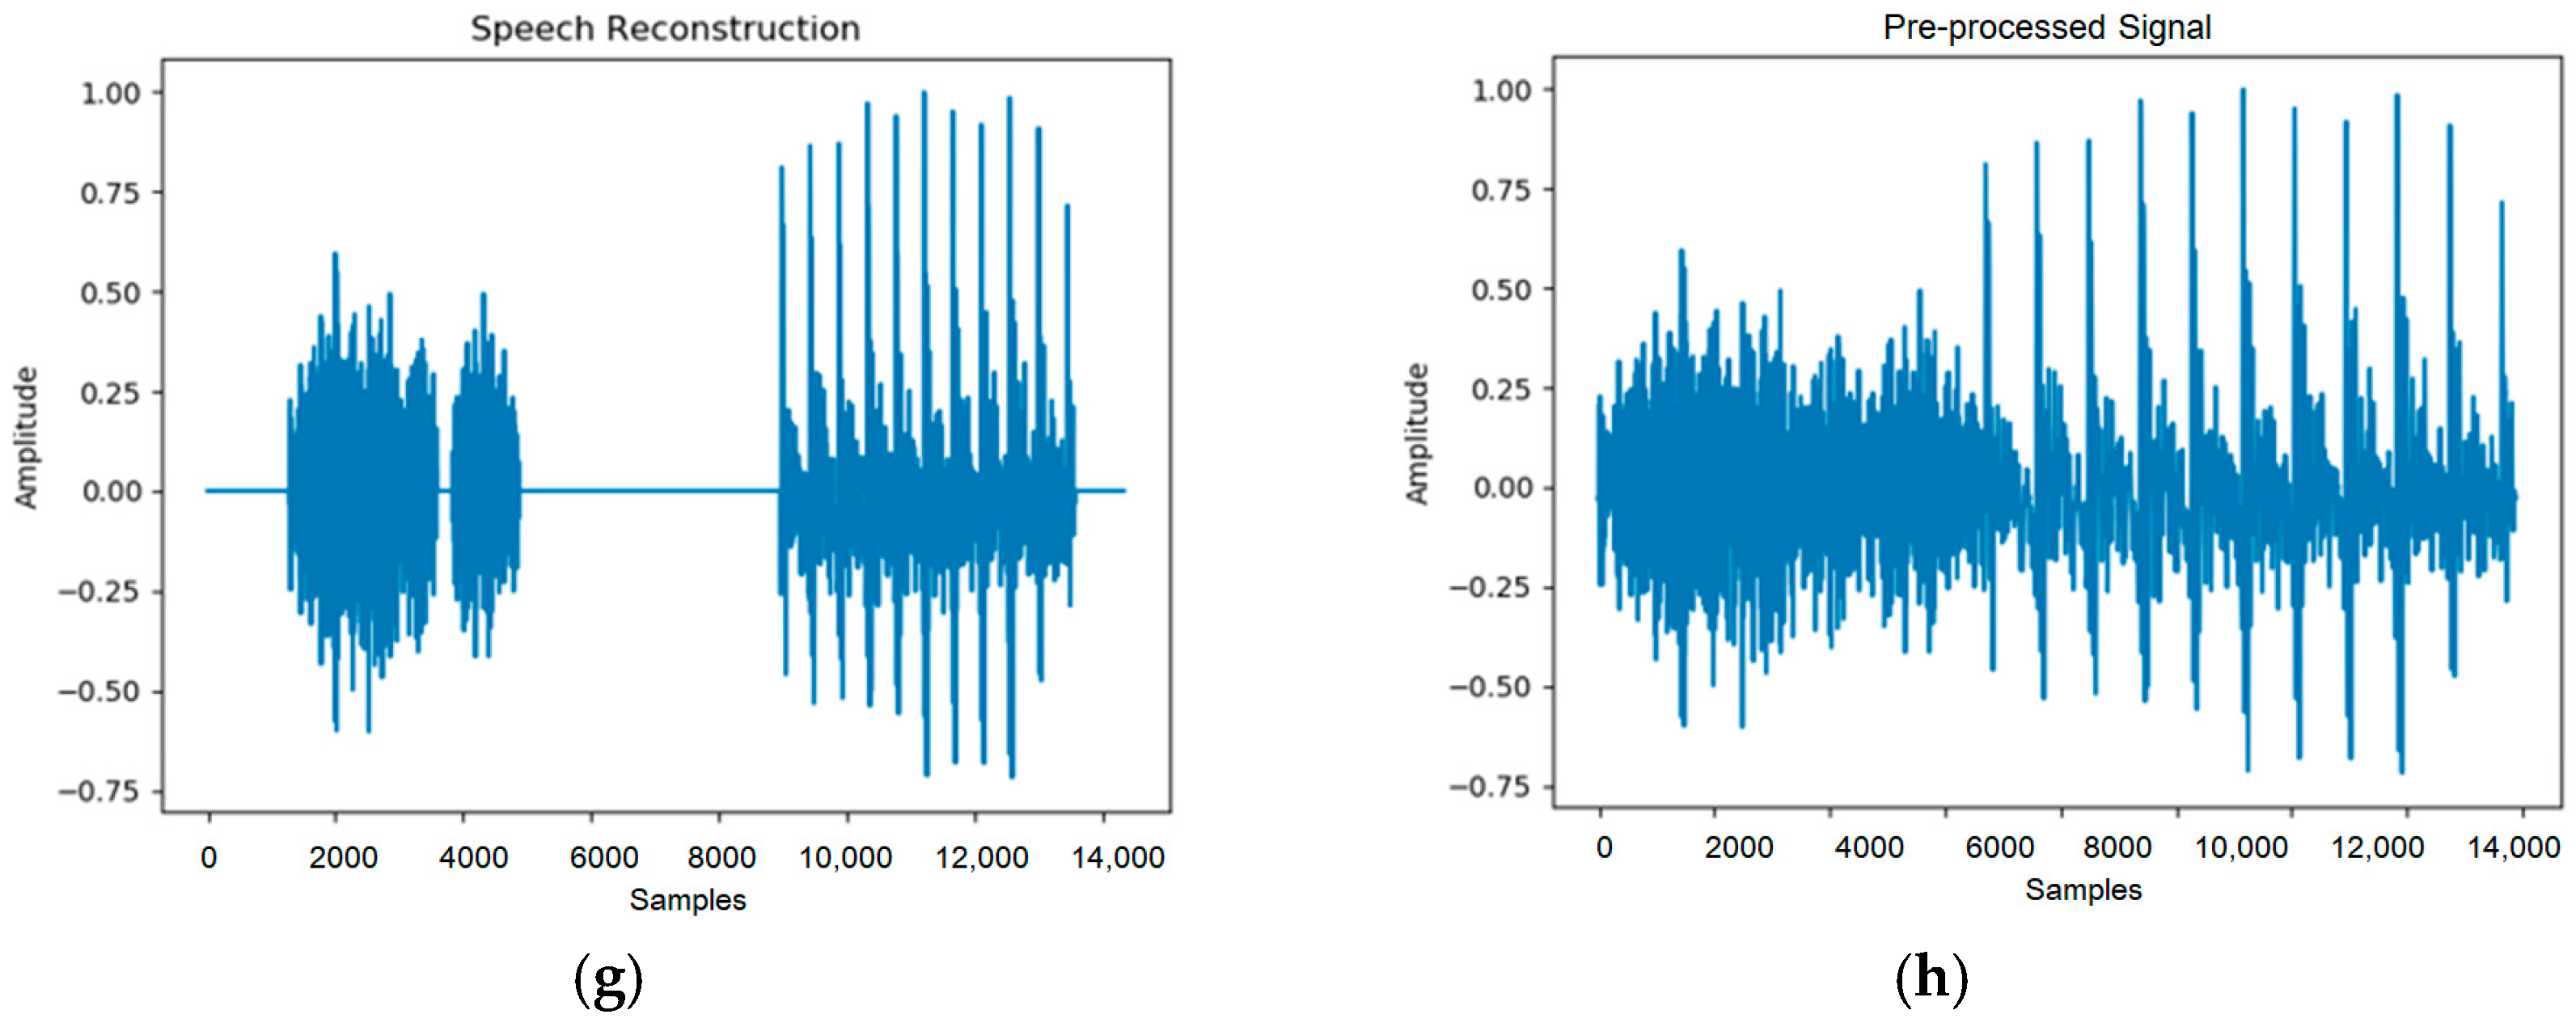
The pre-processing phase was essential for enhancing the quality and consistency of audio signals before feature extraction and classification.
Figure 3 shows the pre-processing stages, where the original audio signal underwent transformations, such as zero-mean normalization, fixed-length segmentation, and noise removal, to improve the clarity and uniformity.
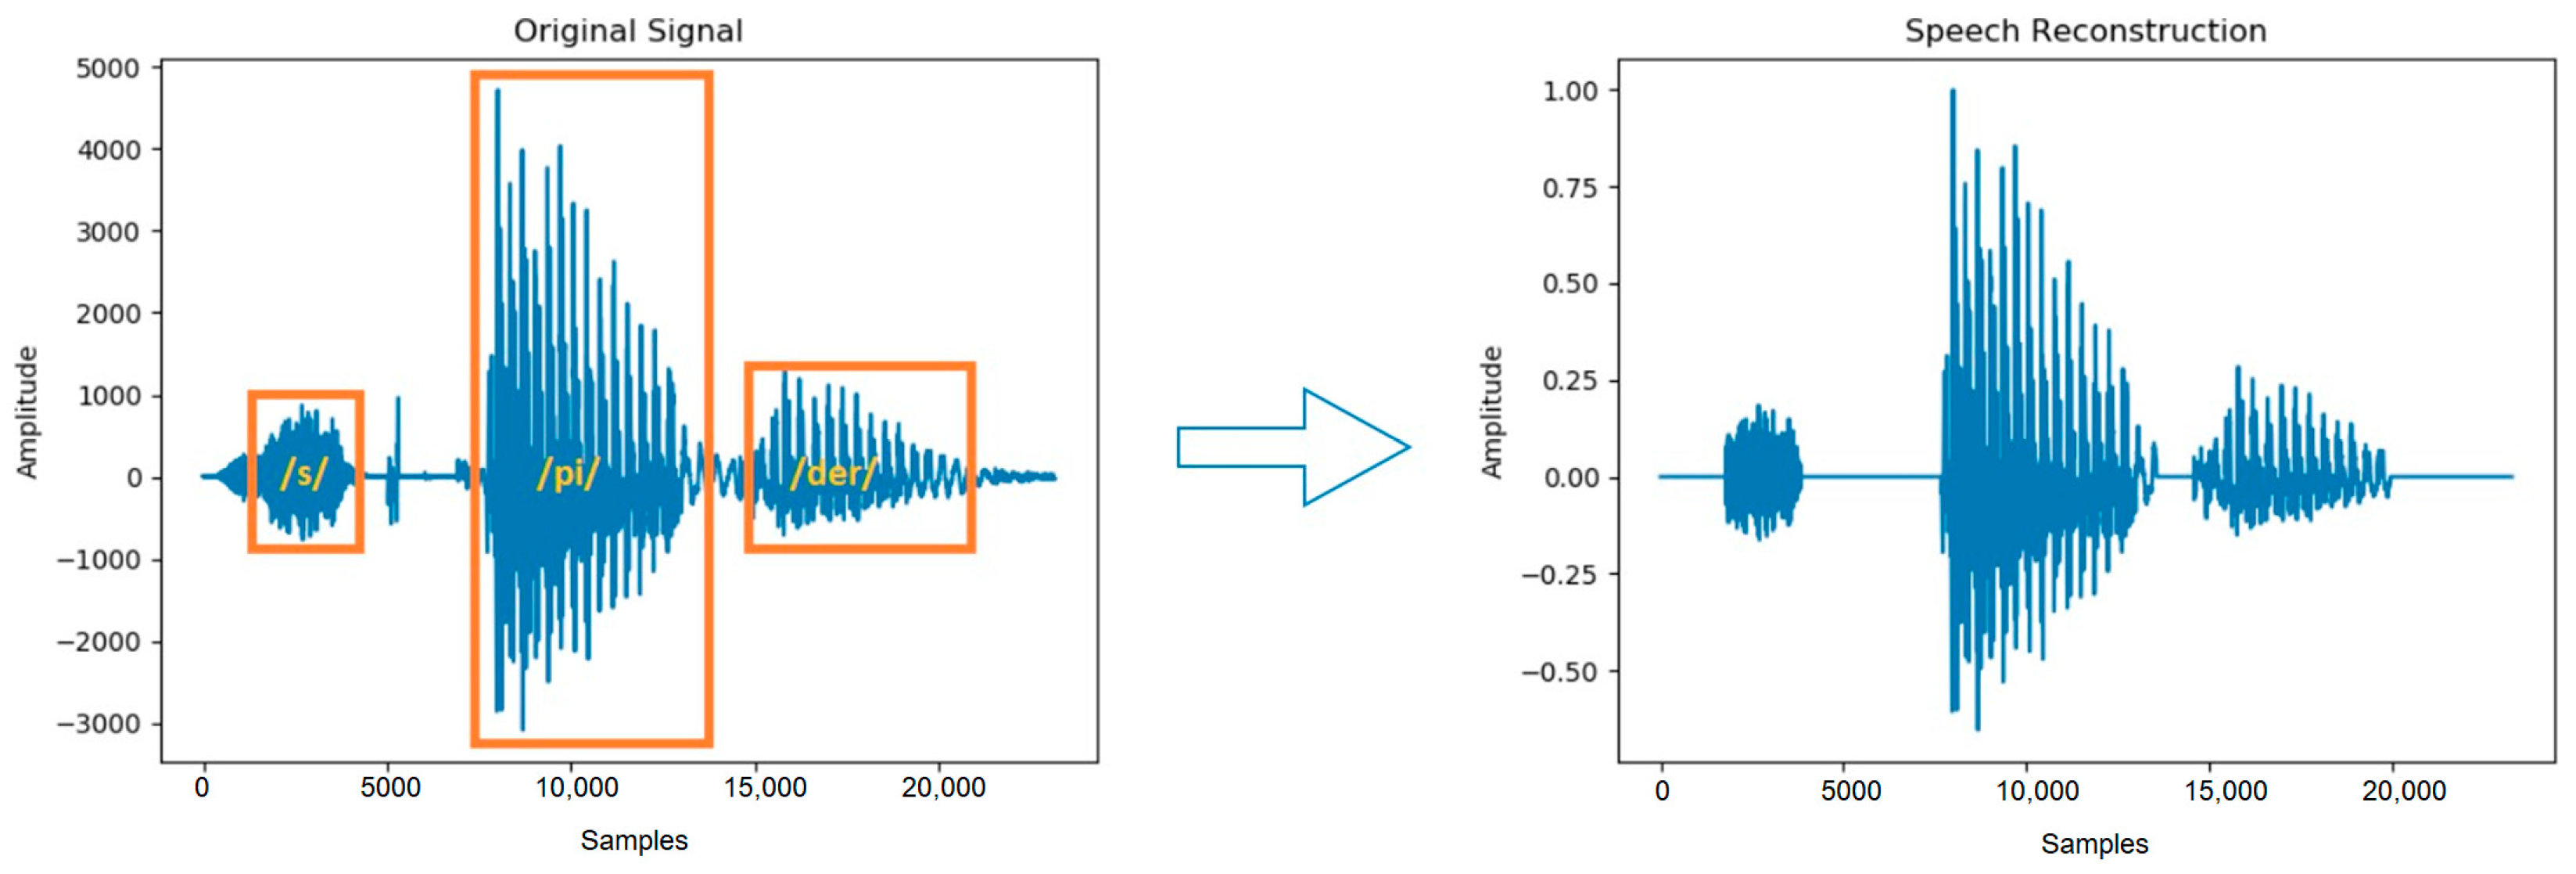
Figure 4 highlights the impact of pre-processing on the audio signal, illustrating significant improvements in clarity and consistency. These enhancements directly affect the quality of the extracted features, which form the basis of the classification model. In
Figure 4 (left), the symbols /s/, /pi/, and /der/ represent the segmented phonetic components of the spoken word “spider.” Linguistically, the word is divided into these three parts corresponding to its phonemic and syllabic structure: the initial fricative /s/; the stressed syllable /pi/, /pa
I/; and the final syllable /der/, /dər/.
Figure 4 (right) illustrates the segmented speech and non-speech parts that are processed as input for the subsequent feature extraction phase, such as MFCCs and spectrogram analysis.
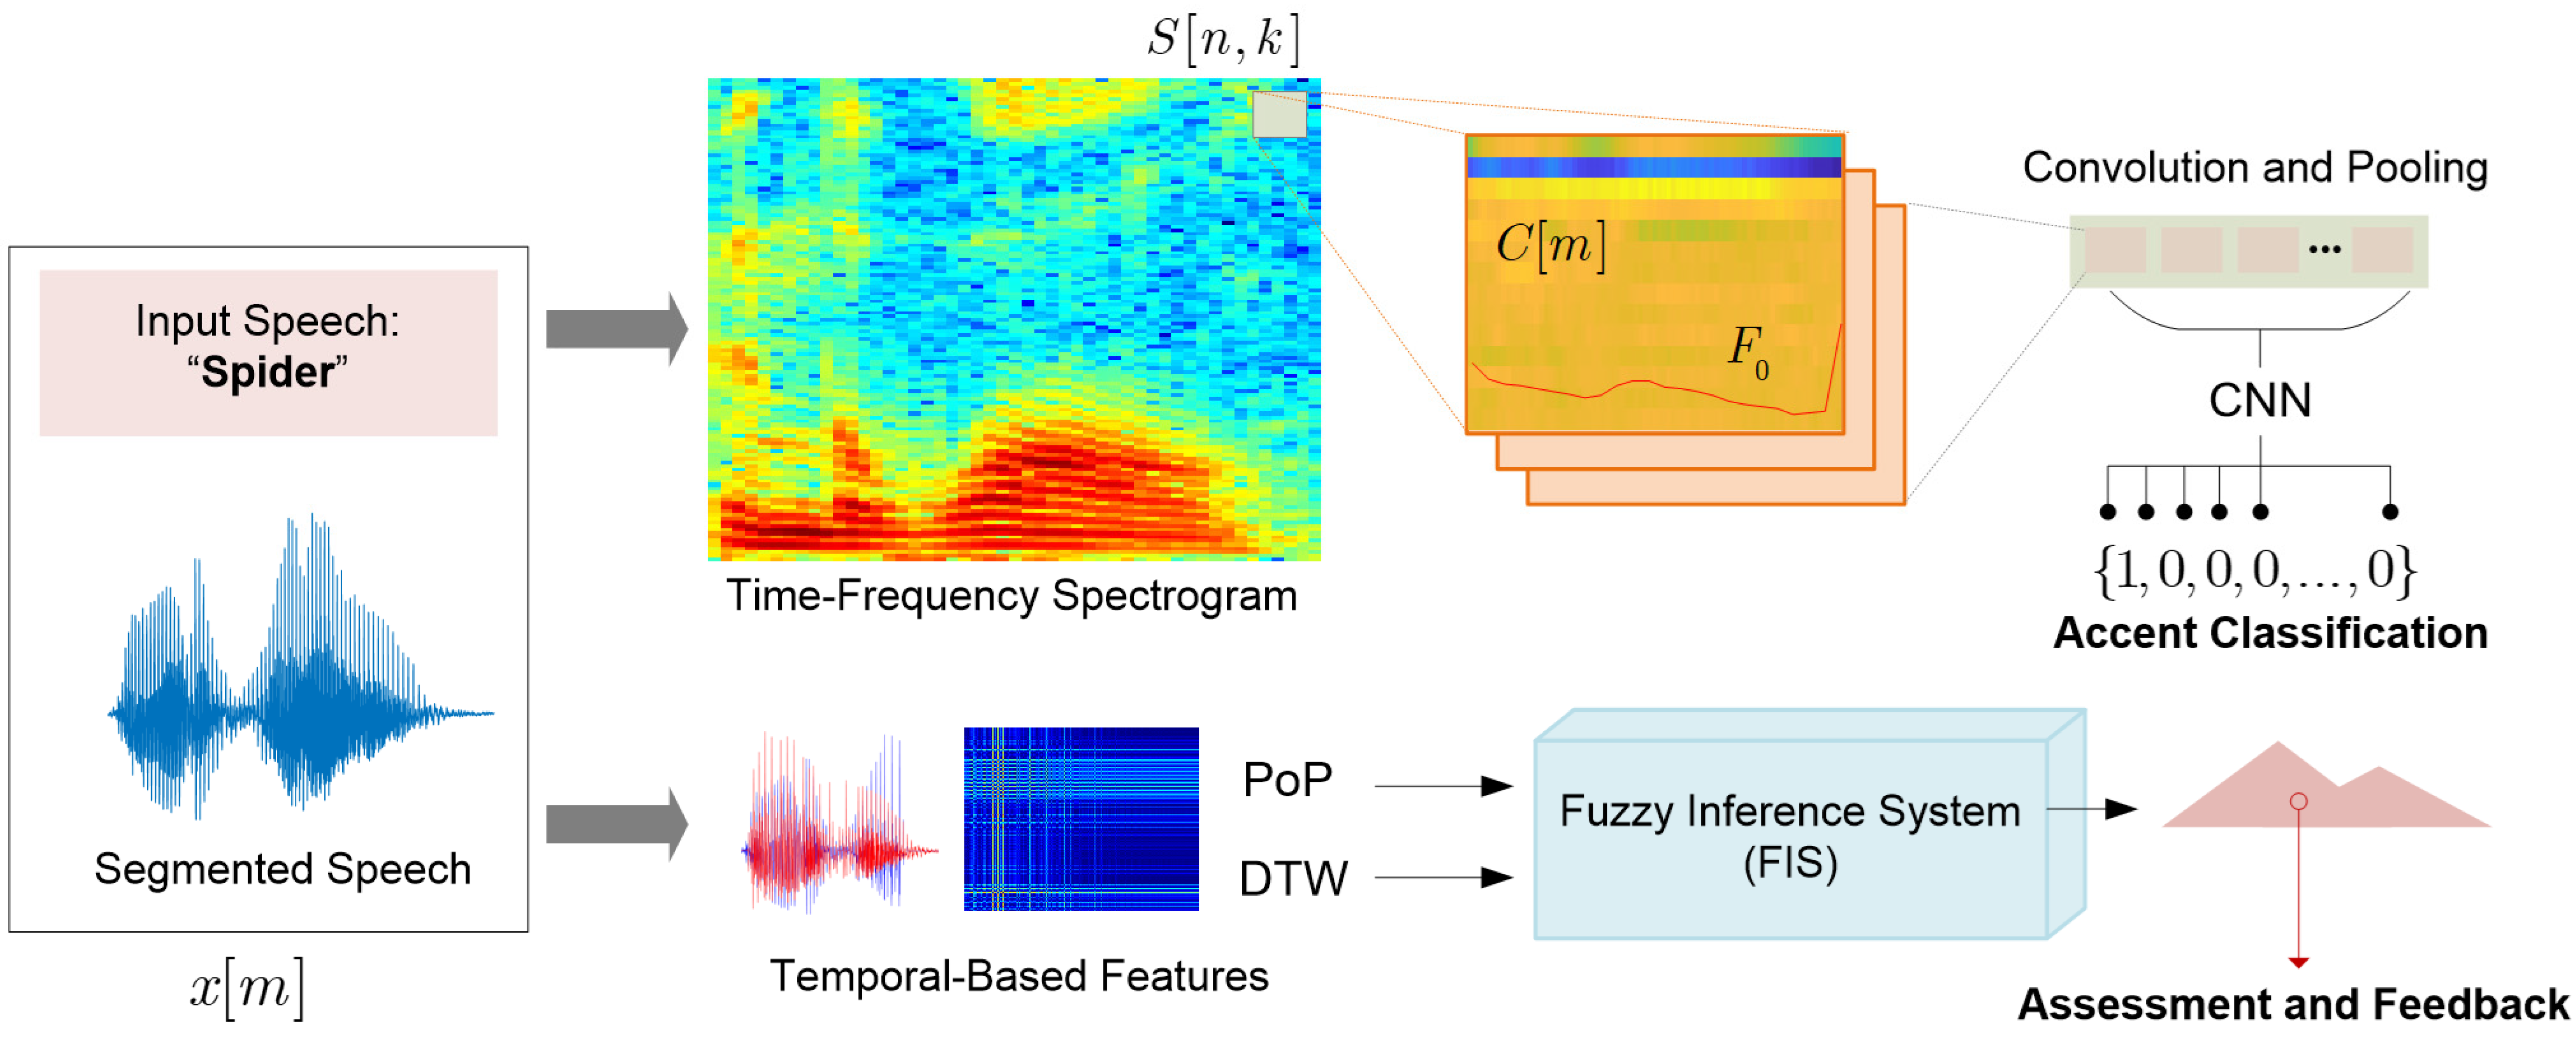
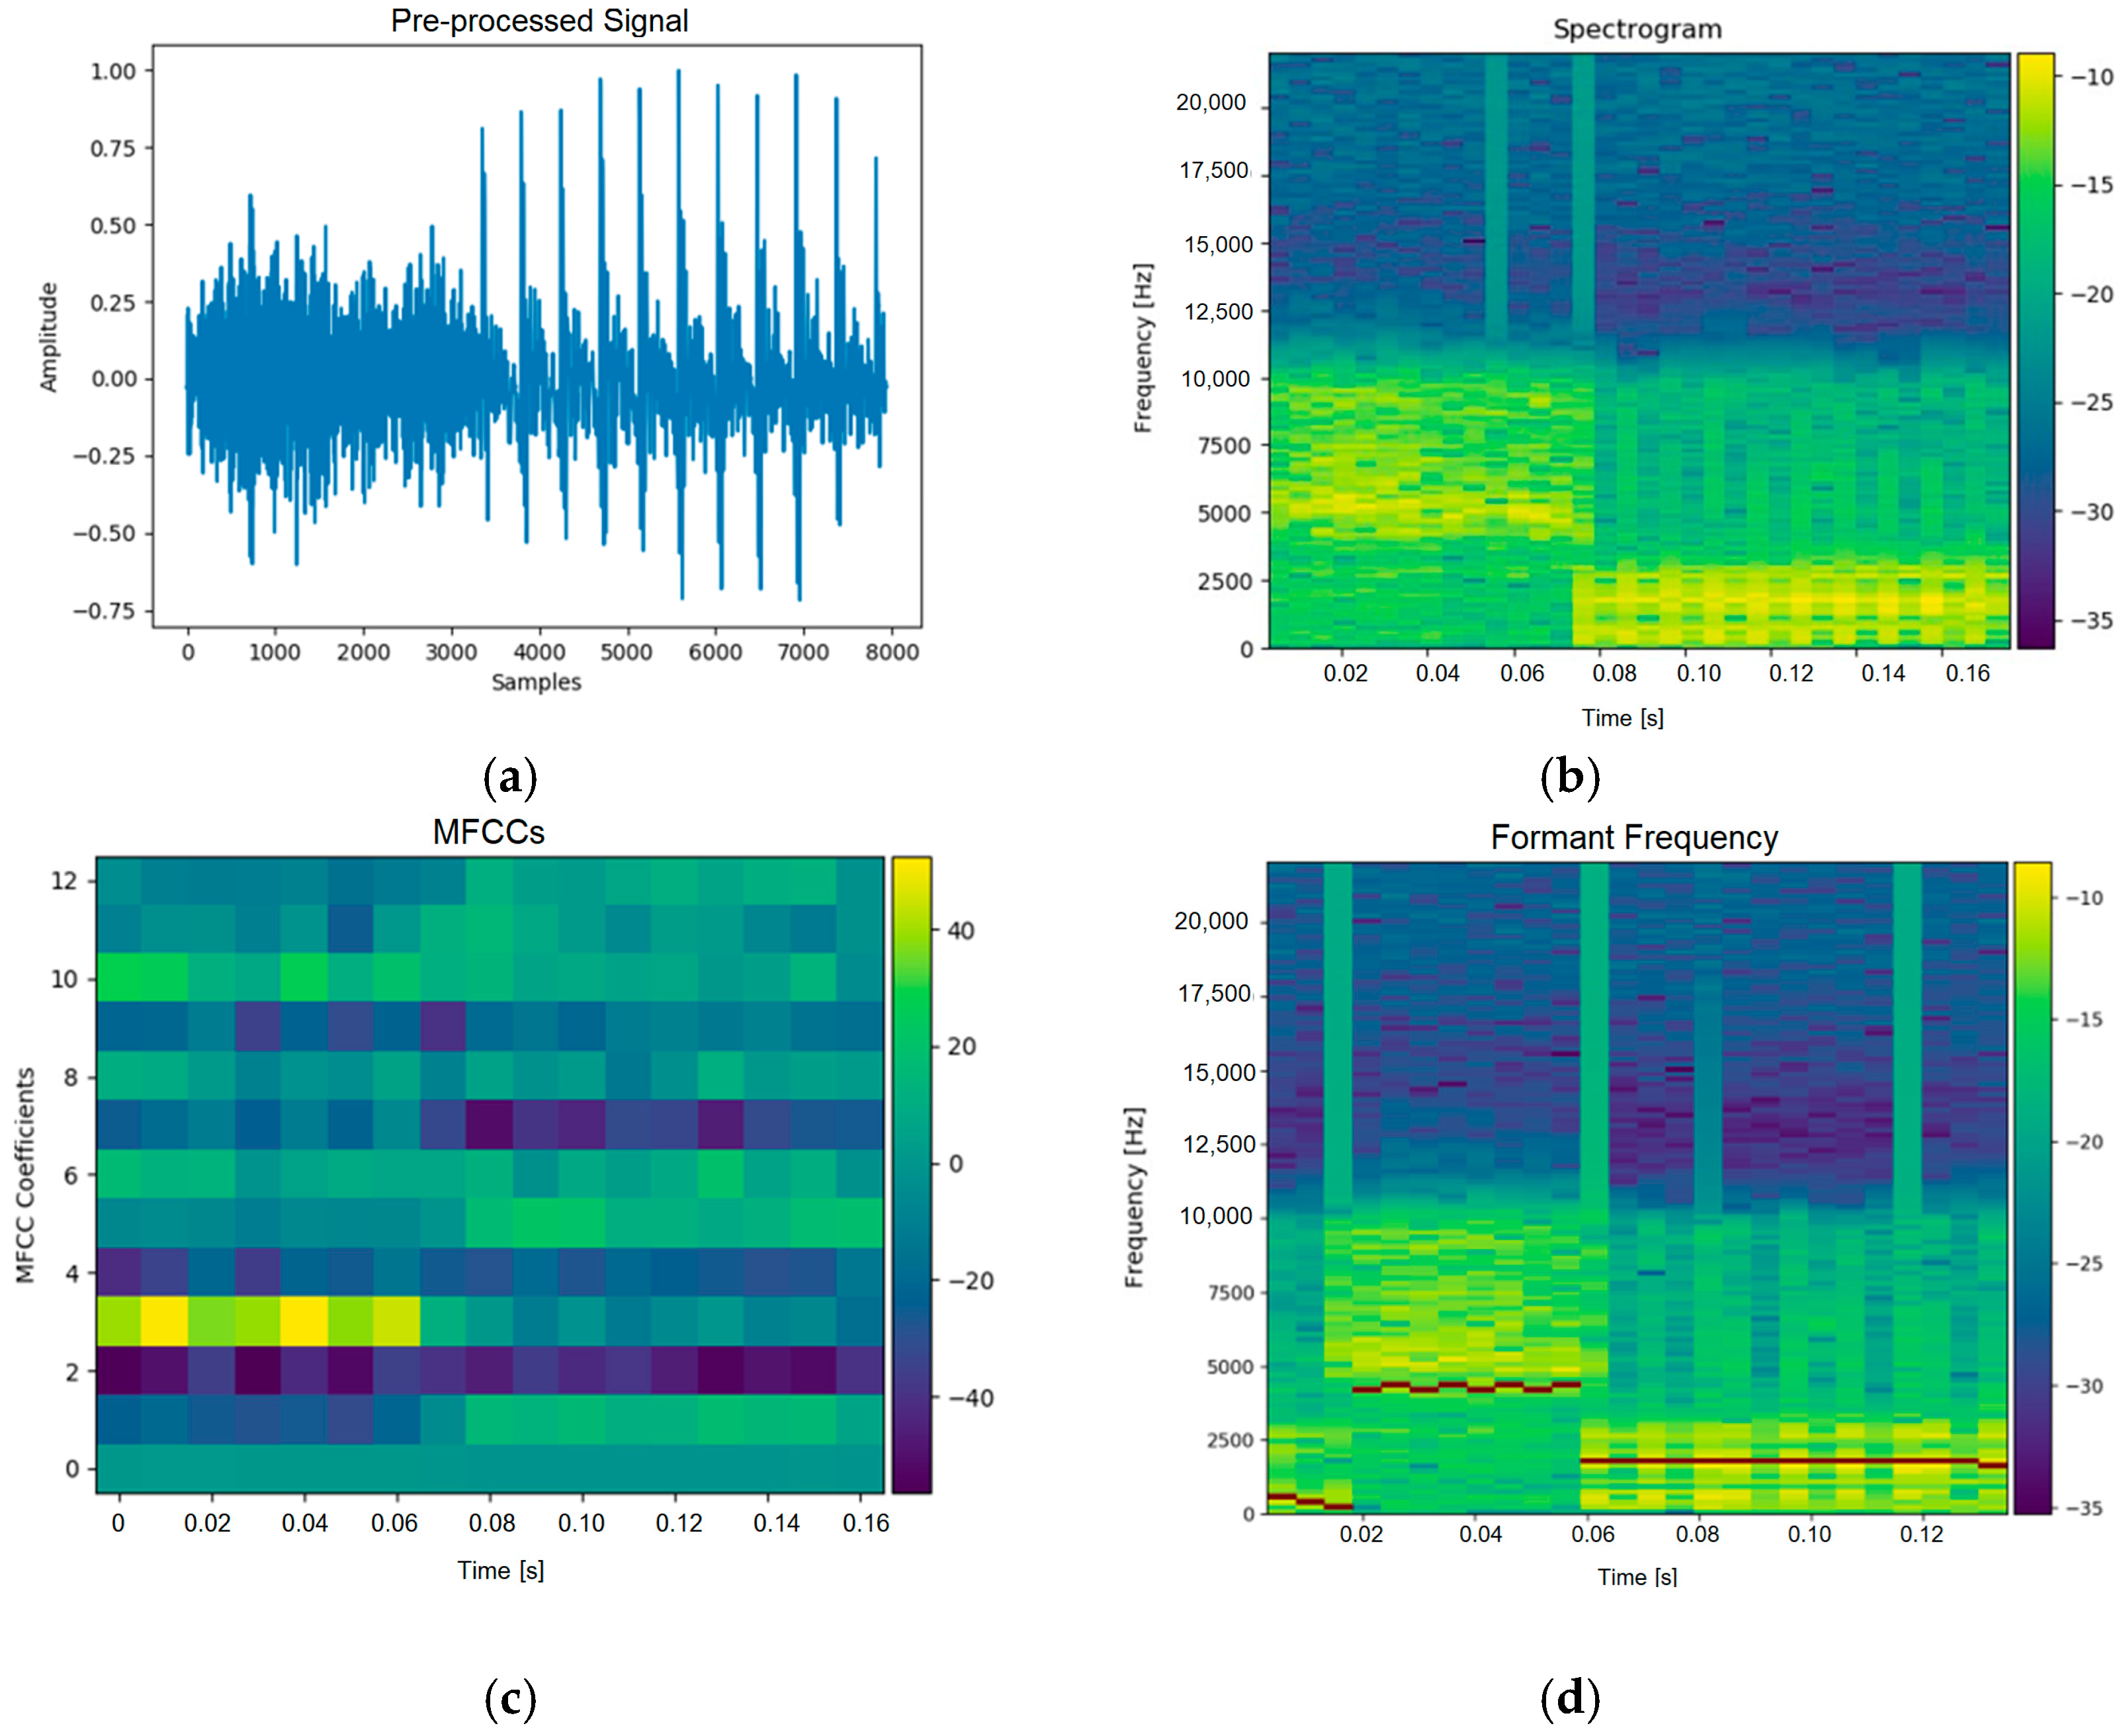
Figure 5 provides an overview of the extracted features used for classification, including spectrograms, MFCCs, and formant frequencies. These features serve as critical inputs for the CNN model and contribute to its high classification accuracy, as demonstrated in [
19]. The proposed method involves a feature extraction procedure aimed at identifying salient characteristics from a pre-processed signal to form a two-dimensional array with unique properties. These two-dimensional representations—spectrogram and MFCC—are then used as input data for the CNN model, both as array data and image data, and formatted with a resolution of 640 × 480 pixels.
3.1. Data Preparation
The dataset used in this study was sourced from the OSCAAR (Open Super-large Crawled Aggregated coRpus) [
22], which contains a scripted reading scenario. In this scenario, participants clearly enunciated a scripted list of words one at a time. This dataset proved valuable during the pre-processing step, where we segmented individual word utterances from the original speech recording. The segmentation produced a collection of word-level utterances, which were then used for further feature extraction and analysis.
In addition to the Hoosier Database of Native and Nonnative Speech for Children [
23], this database includes digital audio recordings of both native and nonnative English speakers reading words, sentences, and paragraphs, providing a diverse range of speech samples for our study. The Hoosier Database consists of 27 speakers, representing the aforementioned seven native language backgrounds. These speakers produced a total of 1139 recordings across the various tasks listed in
Table 3 and
Table 4.
This study also included a group of Chinese-accented subjects who participated in the experiment. A total of 50 participants were selected (25 male and 25 female), with ages that ranged from 18 to 30 years. None of the subjects had any prior background in English proficiency tests. The audio signals were recorded in a soundproof studio, which ensured a high signal-to-noise ratio (SNR) of 60 dB or higher, in line with the standard for high-quality studio sound recordings. The recordings were captured at the School of Foreign Languages, Dali University, where all participants gave their informed consent to take part in the study. The inclusion of this additional accent category served two primary purposes: first, to explore the development of a system designed to help native Chinese speakers learn other languages, and second, to investigate how variations in the dataset may influence the performance of deep learning models. This research aimed to measure the impacts of these differences on the model’s accuracy and robustness. The participants were selected from a group of native Chinese individuals with no history of exposure to environments that might influence their pronunciation, such as attending international schools from a young age or engaging in prolonged daily interactions with foreigners. For the recordings, a sampling rate of 44,100 Hz was used. The recordings were made in a mono-channel configuration, with a 16-bit resolution, which ensured high-quality, precise sound capture.
3.2. Model Training and Test Results
The approach employed in this study leveraged deep learning techniques to develop a reference-based model for word pronunciation. This model functioned as a classifier to analyze, assess, and classify pronunciation accuracy from a speech or word input. The proposed method utilized a CNN model to achieve this task. The data used to train the deep learning model consisted of the extracted features from the pronunciation audio of words or speech, which were represented through corresponding spectrograms, MFCCs, and formant frequencies. The CNN model was trained with different feature sets, including MFCCs, spectrograms, and formant frequencies. According to the CNN architecture in
Table 2, the first convolutional layer was pre-processed or resized from the original high-resolution feature maps (640 × 400) down to around 62 × 46 spatial dimensions after applying the 3 × 3 filters. The MFCCs were resized to smaller matrices, with the tested dimensions including 28 × 28, 64 × 48, and 128 × 48, as shown in
Table 5 and
Table 6, to select a size that balanced the feature detail and computational feasibility. The CNN architecture started with two convolutional layers of filter sizes 3 × 3 and filter counts 32 and 64, which operated on this resized input. Subsequent the max-pooling layers (2 × 2) reduced the spatial dimensions progressively: from 62 × 46 to 60 × 44 to 30 × 22 to 28 × 20 to 14 × 10.
The results, summarized in
Table 5, highlight the effectiveness of the MFCCs and spectrograms, where the test accuracies peaked at 73.89% and 74.27%, respectively. As demonstrated by previous research, MFCCs can achieve high precision when used for accent classification. In this study, we aimed to investigate how the chosen dataset and pre-processing methods impacted the classification results across eight distinct accent classes.
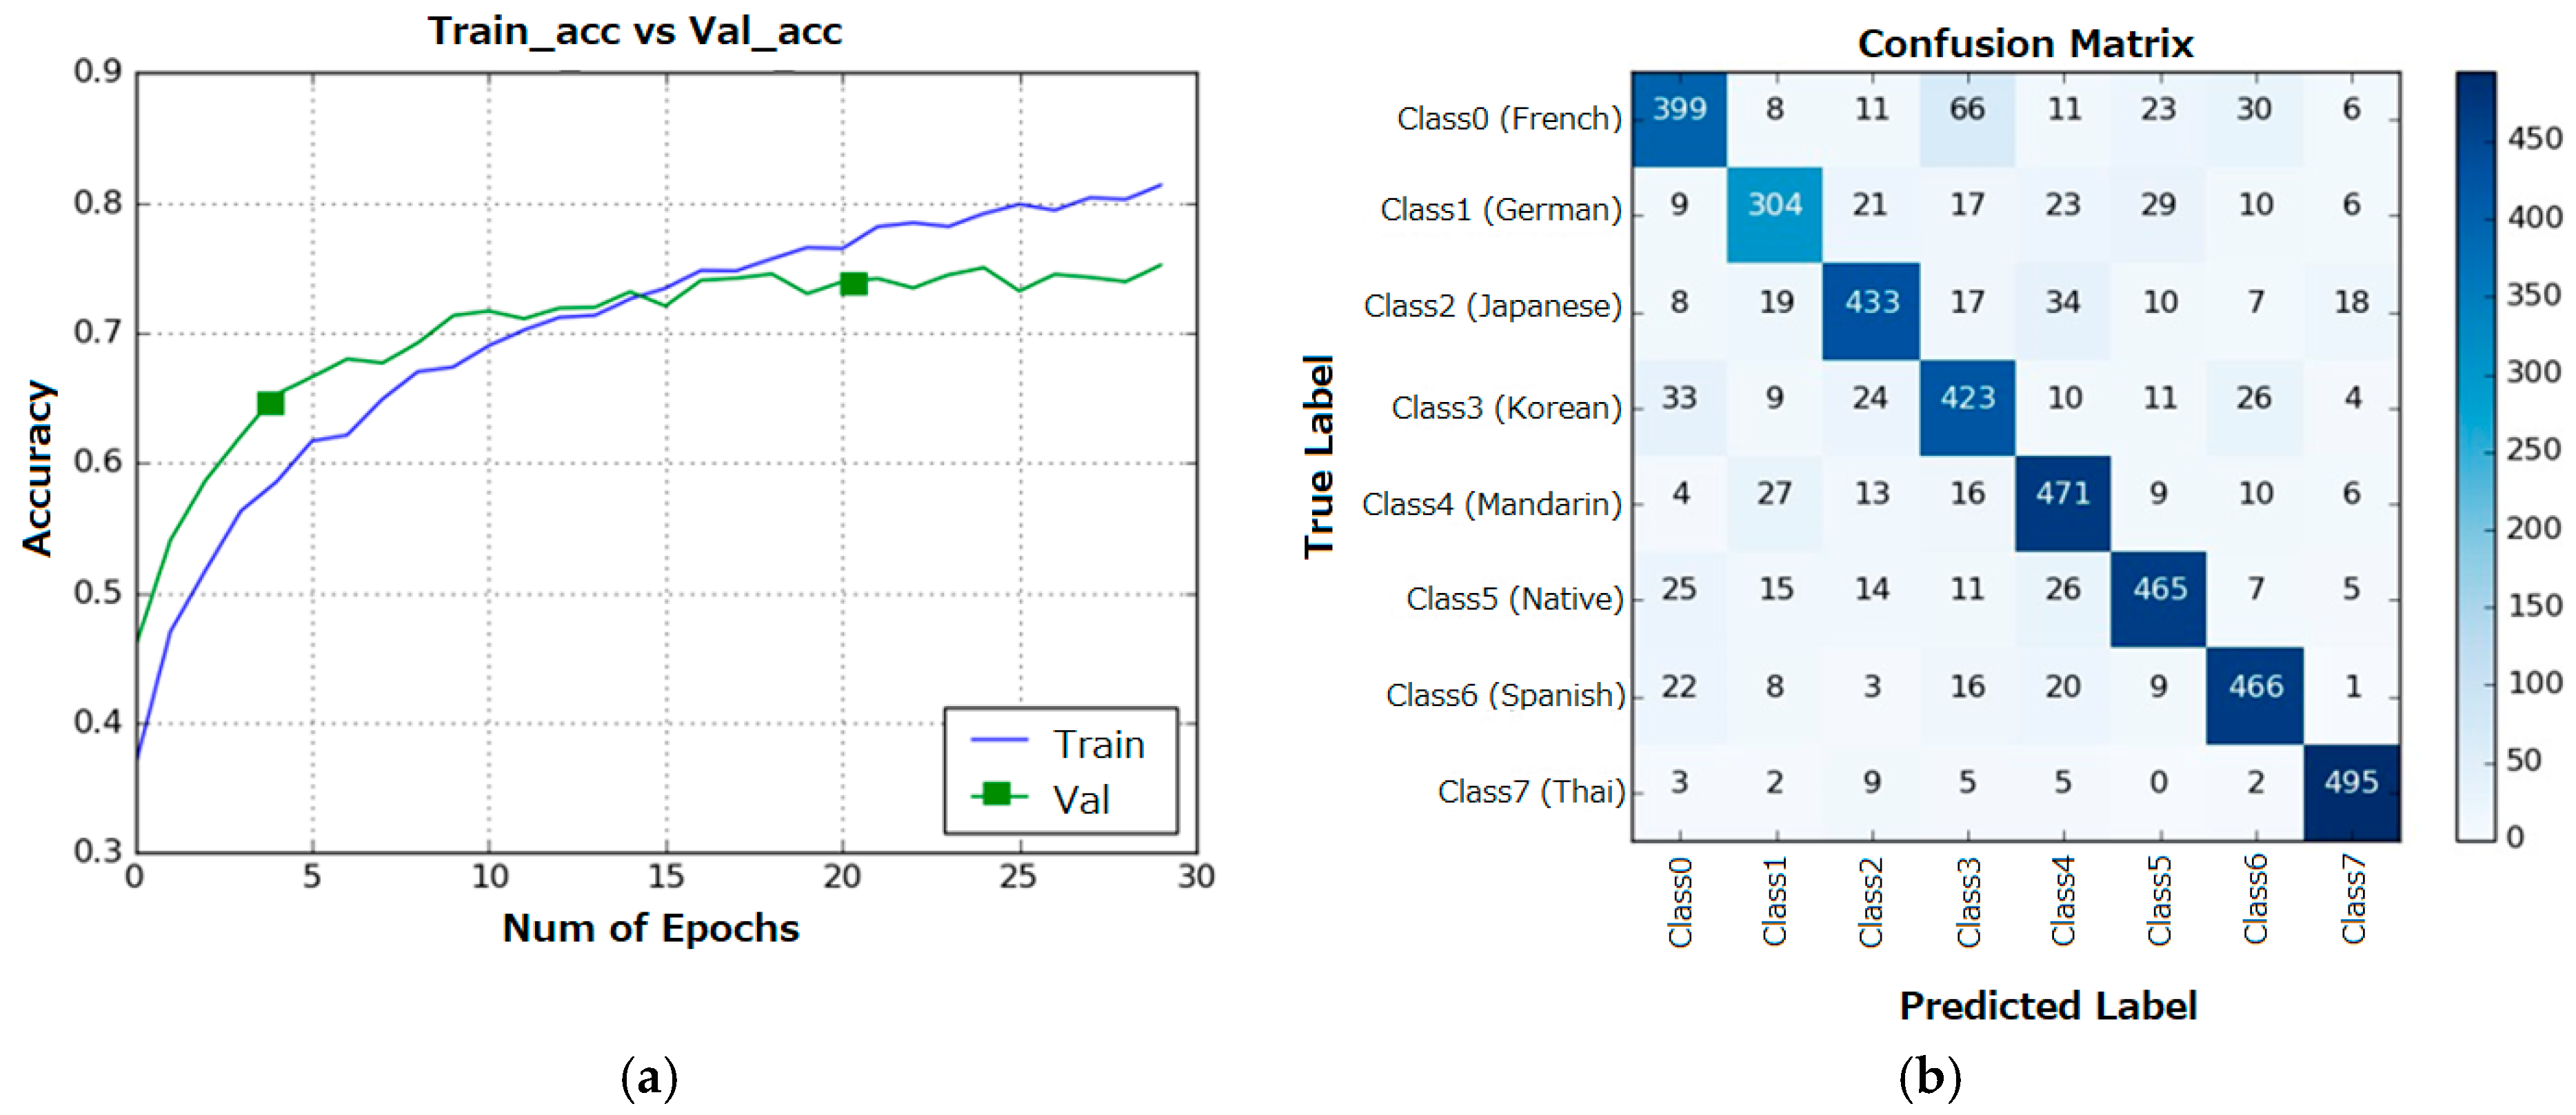
Figure 6a illustrates the average accuracy across all parameters during the training of the classification model using the MFCC dataset with a 0.005 threshold over 30 epochs. After the 15th epoch, the model began to overfit: while the training accuracy continued to improve, the testing accuracy plateaued and remained stagnant.
Figure 6b presents the confusion matrix for the MFCC-based model. The distribution of correctly predicted accents was relatively uniform across the different accent classes, where most classes had a prediction frequency that exceeded 300 instances in the test dataset. This discrepancy is attributed to the unequal distribution of data, as the German-accented speech data were approximately 20% fewer than other accent data, which led to a slight imbalance in the predictions. The spectrogram-based model demonstrated superior performance, where it achieved a peak test accuracy of 79% when optimized network parameters were applied, as shown in
Table 5. This underscores the ability of spectrograms to capture more detailed temporal and frequency-related information, which provided a more comprehensive representation of the speech signal compared with the MFCCs alone.
In
Table 6, the highest precision achieved by the model was 0.829, while the lowest precision across all parameters derived from MFCC-based data was 0.7878. These results indicate that the spectrogram approach consistently outperformed the MFCC method.
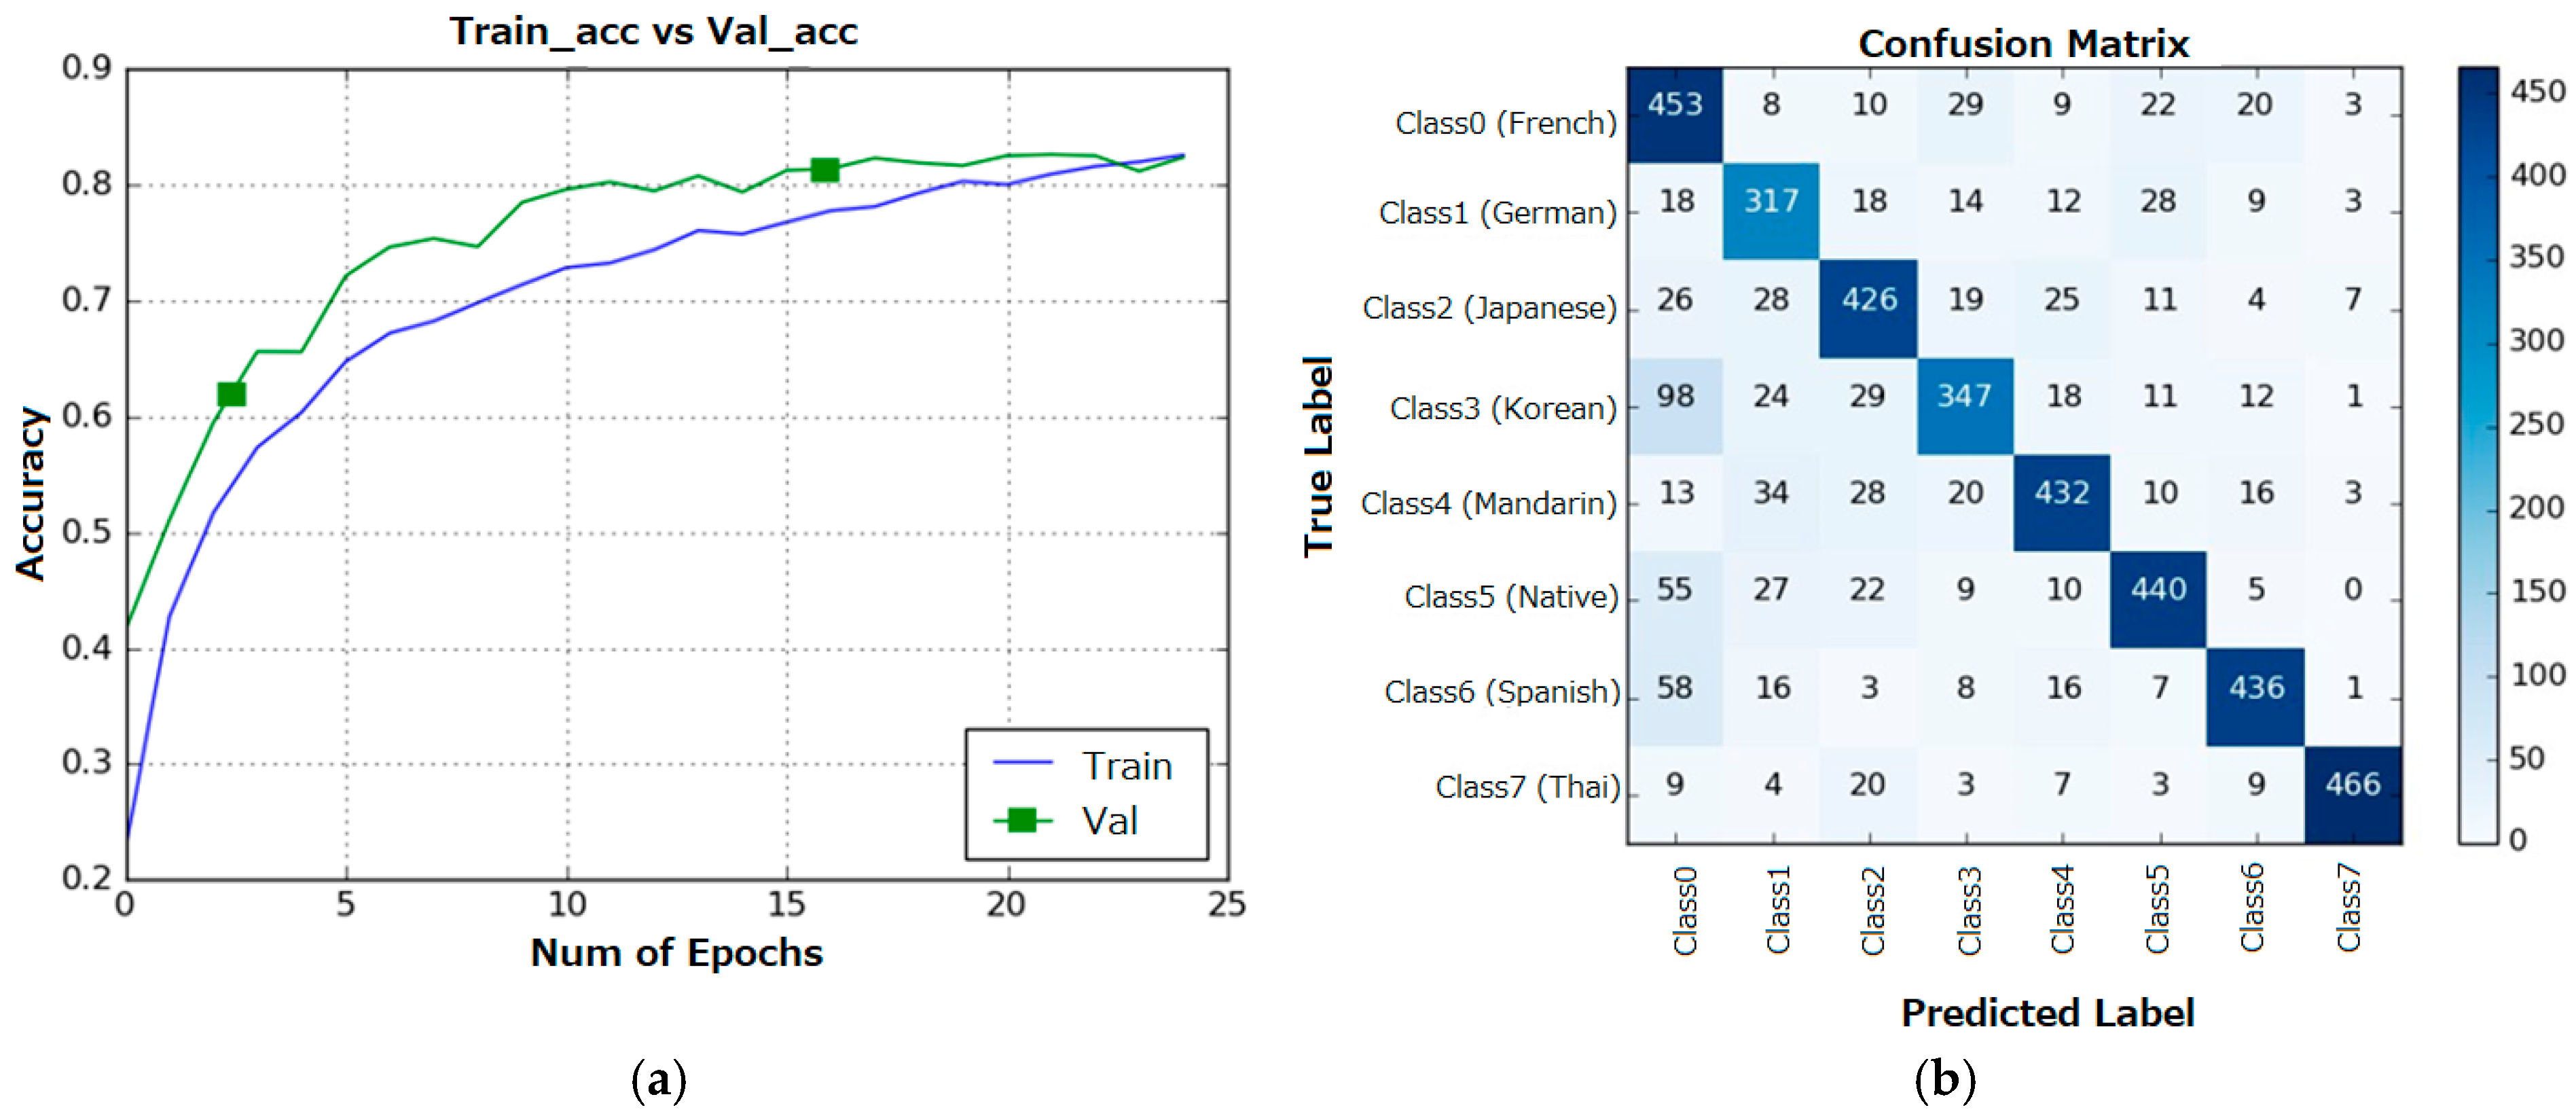
Figure 7a illustrates the average accuracy across all parameters while training the classification model using the spectrogram dataset with a threshold of 0.005 and 30 epochs. After approximately the 24th epoch, the accuracy stabilized and ceased to improve.
Figure 7b shows the prediction map for all classes from the classification model trained using spectrograms. The pattern was consistent across all classes, with a very high prediction rate, except for the German accent, which showed a lower accuracy. The highest classification accuracy, approximately 87%, was achieved by combining the MFCCs and spectrograms. This approach leveraged both the frequency emphasis from the MFCCs and the temporal detail from the spectrograms, which optimized the model’s classification capabilities for accent detection.
To design the assessment process, a fuzzy inference system (FIS) based on Scikit-Fuzzy 0.5.0 was implemented [
24]. The subjects were asked to select words from a curated vocabulary list, which included standard words that represented commonly used English words that covered a broad range of phonetic contexts and phonetic contrast pairs specifically designed to target known pronunciation challenges for Chinese-accented English learners. Upon selection, the subject pronounced the chosen word through the MALL system. The system processed the recorded speech input by extracting the key acoustic features for evaluation.
3.3. Period of Phonetic (PoP)
The PoP approach begins by segmenting the phonetic components of the sample signal using a pre-processing method. The resulting PoP value represents the phoneme duration (in seconds) of each segmented part of the sample signal as compared with each corresponding template segment. During the segmentation process, a single threshold was insufficient to achieve optimal segmentation results. Therefore, an adaptive thresholding method was employed, which spanned values from 0.001 to 0.017. The PoP values were constrained within a range of 0 to 1 s. The PoP was converted into five fuzzy sets, namely, poor, mediocre, average, decent, and good, since its value could distinguish the range of similarity better. Thus, the normalized PoP score,
pnorm, for the entire utterance could be computed using
where
is the duration of the
i-th phonetic segment in the subject’s utterance,
is the duration of the
i-th phonetic segment in the dataset’s template, and
is the total number of phonetic segments in the word. The final PoP score indicates a closer duration match in percentage from 0 to a 100% perfect match.
3.4. Dynamic Time Warping (DTW)
DTW is used to extract features from the speech features (spectrogram, MFCCs, and formant frequency) of both the template and sample signals [
25]. DTW measures the similarity between the temporal sequences of the signals, producing a normalized distance value. The normalized DTW distance indicates the degree of similarity, where lower distances correspond to better alignment. These distances were mapped onto fuzzy sets, including poor, average, and good, as shown in
Table 7. For all the feature types, after computing the local distance matrix
D(
i,
j), DTW found the minimal cumulative distance alignment path using the standard DTW recursion:
where
d(
xi,
yj) is the distance measure between feature vectors
xi as input features and
yj as template features, commonly the Euclidean distance, and
D = Σ
d(
xin,
yjn):
n = 1, 2, …,
P, where
P is the length of the warping path. The final normalized DTW distance,
dnorm, could be defined as
where min(
Dk) and max(
Dk) are the minimum and maximum DTW distances for features
k∈{spec, MFCC, formant}, respectively.
3.5. Knowledge Base
The proposed system features a server monitoring interface, as shown in
Figure 8, which presents an overview of the entire process. From Equations (4) and (6), both the PoP and DTW measurements were mapped and evaluated by comparing the subject’s pronunciation against the template pronunciations stored in the training dataset, which contained high-quality native speaker exemplars for each word. This template matching ensured that the assessments were grounded in authentic pronunciation standards, which enabled precise identification of the timing and acoustic deviations. These fuzzy-mapped inputs were fed into the fuzzy inference system (FIS), which applied a set of IF–THEN fuzzy rules in its knowledge base to interpret the combined phoneme duration and alignment quality. The IF–THEN fuzzy rules are shown in
Table 7 and represent a matrix of DTW values and PoP values. The fuzzy output from the FIS was then defuzzified to produce a continuous soft-decision pronunciation score. In
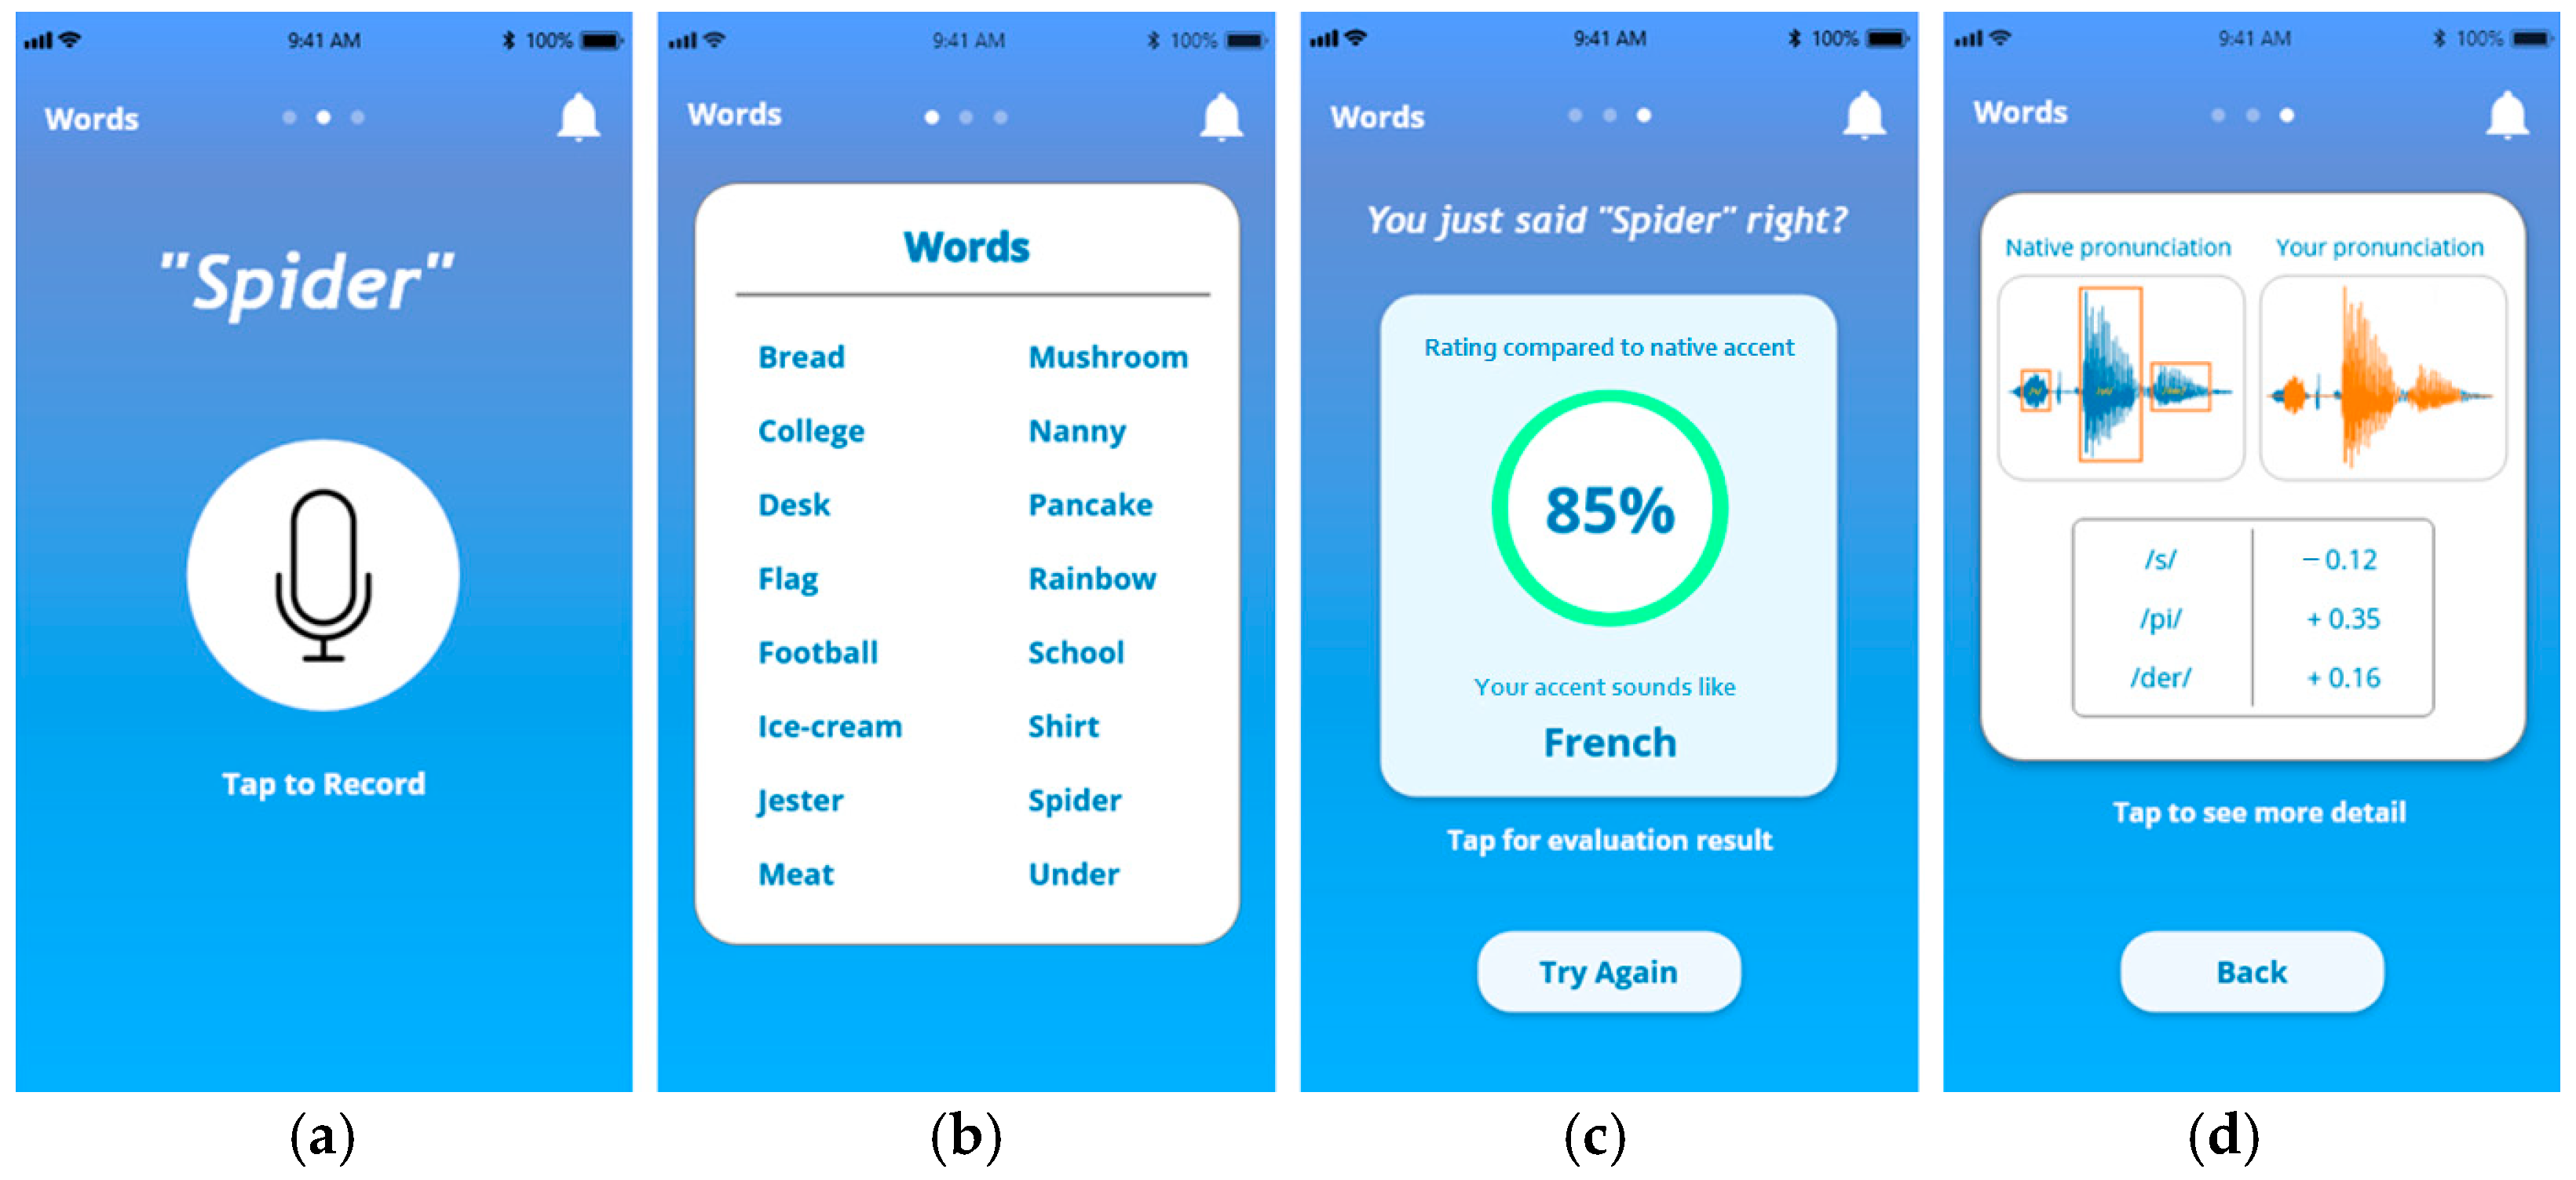
Figure 9c, the score obtained from the evaluation is shown. The fuzzy centroid estimation method, also known as the center of area (COA), is used to determine the feedback result.
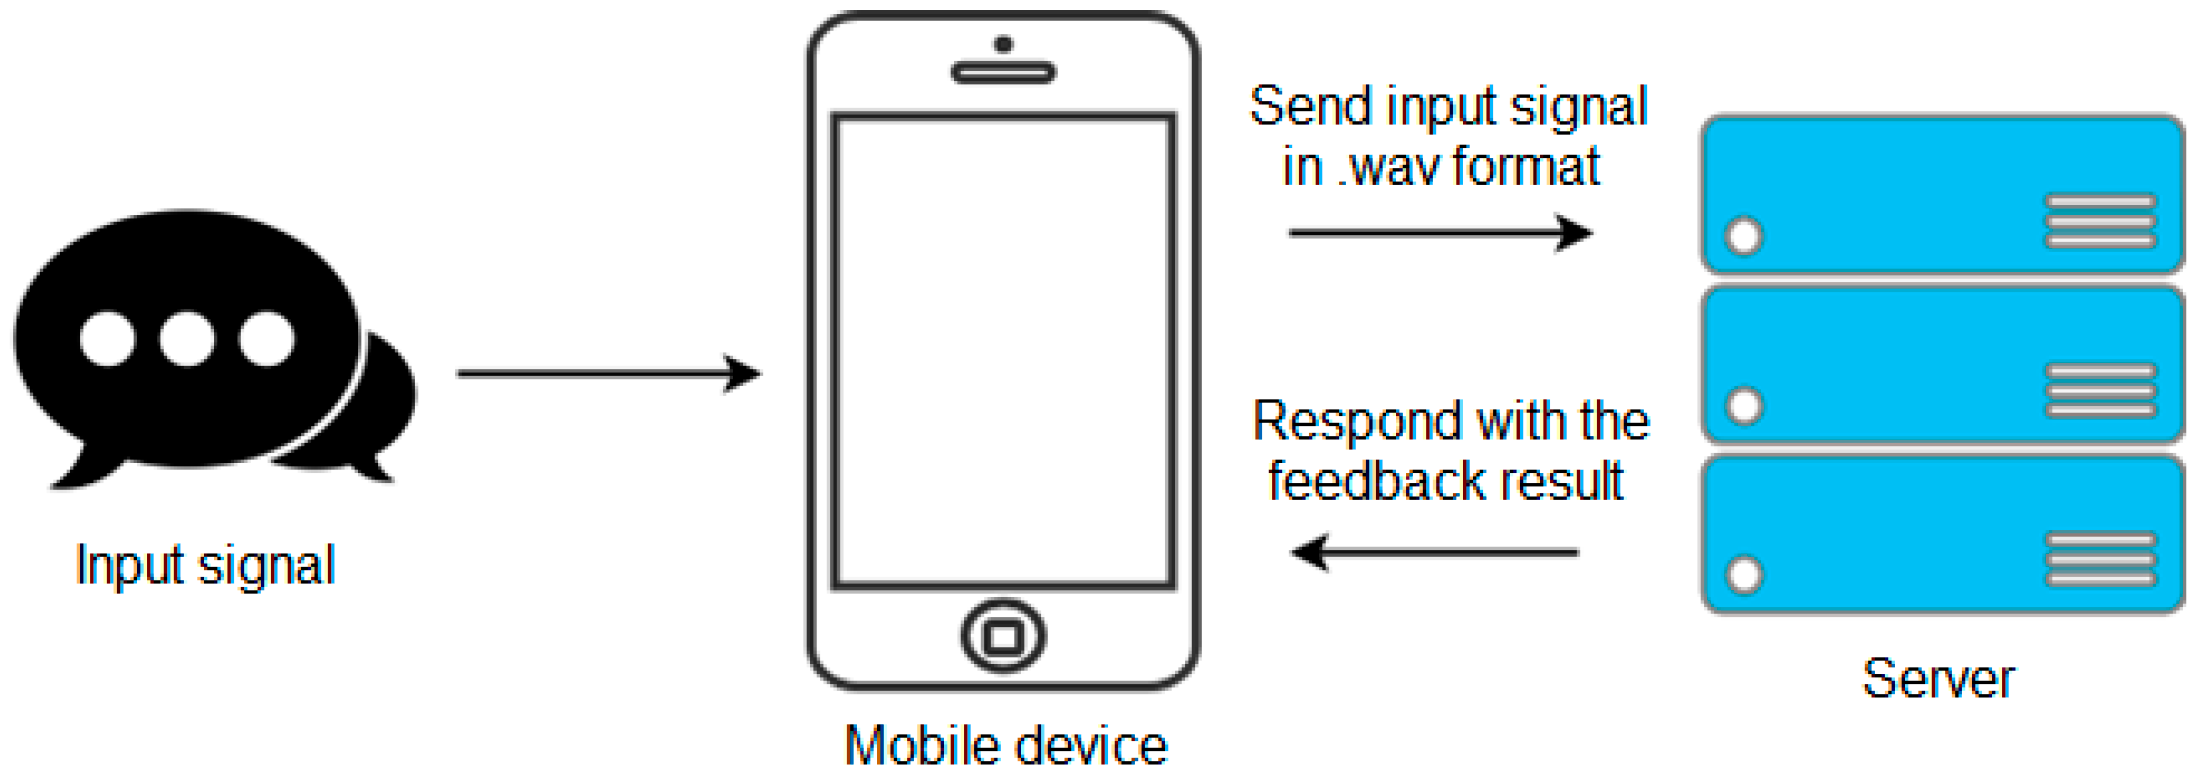
3.6. Mobile-Assisted Language Learning (MALL)
To implement a mobile platform interface showcasing the system’s workflow, we utilized the React Native framework, a hybrid mobile development framework that enables efficient development while ensuring compatibility with both Android and iOS platforms.
Figure 10a presents the main page, where users can interact with the MALL system by pressing the microphone button to record audio. The recorded audio is automatically sent to the server for processing.
Figure 10b displays the list of available words that can be assessed using the proposed method.
Figure 11 illustrates the results of the 10 selected subjects chosen from a total of 50 participants, who were tasked with pronouncing 10 of the 16 words with five trials per word. The scores ranged from 55 to 80, compared with the native speakers’ scores, which ranged from 80 to 100. The standard deviations are represented by the error bars. Notably, all the selected subjects had studied in an international program, which may have contributed to their relatively high initial scores.
Before using the MALL proposed system, the subjects’ pronunciation correctness was significantly lower, with scores that trailed the native speech data by 5% to 20%. After utilizing the MALL system, which provided real-time feedback and detailed pronunciation assessments, all the subjects showed notable improvement in their pronunciation accuracy. The increased scores highlight the system’s effectiveness in bridging the gap between nonnative and native pronunciation, demonstrating its potential as a powerful tool for language learning and accent refinement. To enhance the phonetic coverage and address specific challenges faced by Chinese-accented English learners, additional vocabulary was selected with a focus on known pronunciation difficulties. This selection emphasizes minimal pairs and words that contrast frequently problematic sounds for Chinese speakers, including the following:
The /l/ versus /r/ distinction, which is often merged in many Chinese dialects.
Final consonant sounds (e.g., -s, -t, and -d endings), which are commonly omitted or altered.
Consonant clusters, such as /str/, /spr/, and /spl/, which are absent in Mandarin and many other Chinese dialects.
Interdental fricatives /θ/ and /ð/, which are often substituted with /s/, /z/, /d/, or /t/.
Vowel length and tense/lax contrasts, e.g., /i:/ versus /I/ and /u:/ versus /ʊ/.
Minimal pairs of words differing by only a single phoneme and yielding different meanings are employed extensively in language instruction and phonetic research. These pairs highlight critical phonetic distinctions that are often problematic due to differences in phoneme inventories and constraints between English and various Chinese dialects, as shown in
Table 8. This targeted focus enhanced the system’s ability to accurately classify and assess pronunciation errors that are common among Chinese-accented English speakers, thereby improving the precision and effectiveness of pronunciation training.
4. Discussion
Although CNNs are traditionally associated with spatial data, their adaptability to sequential data, like speech, has been increasingly demonstrated. By leveraging convolutional filters, CNNs effectively capture local spatial–temporal speech features, which are vital for detailed and accurate pronunciation analysis. In addition, CNNs offer significant advantages in computational efficiency compared with alternative architectures, such as recurrent neural networks (RNNs), including long short-term memory (LSTM) networks. The inherently sequential nature of RNNs results in slower training times and higher computational costs, which are often compounded by challenges like vanishing gradients. Conversely, CNNs enable the parallel processing of input data, allowing for faster convergence and the more efficient utilization of computational resources, a crucial consideration for real-time feedback in mobile platforms. Numerous studies have confirmed that CNN-based models outperform other deep learning frameworks in extracting meaningful speech representations [
26,
27], thereby validating their suitability for applications focused on pronunciation assessment.
This study made several significant contributions to the field of MALL and pronunciation analysis. First, we demonstrated that combining multiple complementary feature extraction methods, such as spectrograms, MFCCs, and formant frequencies, achieved a superior accent classification accuracy compared with single-feature approaches. Second, we introduce a novel integration of fuzzy inference systems with deep learning models to provide interpretable feedback that accommodates natural speech variability. Third, our system provides sophisticated pronunciation assessment accessible outside traditional learning environments, addressing a critical gap in self-directed language learning. Fourth, our experimental results confirm that this approach led to measurable improvements in pronunciation accuracy (5% to 20%), which validated the practical effectiveness.
Table 9 presents a performance comparison of different pronunciation assessment models. The proposed system demonstrated a robust performance, where it achieved accuracies that ranged from 82.41% to 90.52%, precisions between 81.46% and 90.09%, and recalls from 82.08% to 90.68%. This high level of performance was attributed to the integration of CNNs for feature extraction and FIS for decision-making. The CNN effectively captured local temporal patterns in speech, while the FIS provided context-aware assessments that accommodated the natural variability inherent in human speech. The combination of these methods enabled nuanced, interpretable feedback, which made the system particularly well-suited for real-time mobile applications focused on minimal pair practice. In comparison, traditional Goodness of Pronunciation (GoP) systems [
28] achieve accuracies ranging from 81.67% to 87.60%, with precisions between 82.49% and 89.19% and recalls between 80.43% and 89.36%. When combined with Dynamic Time Warping (DTW) [
29], GoP systems achieve an accuracy range of 80.26% to 87.27%, though detailed precision and recall metrics are not provided. In contrast, the spectrogram + FIS system achieved accuracies between 79.86% and 81.48%, with precisions that ranged from 75.65% to 79.23% and recalls between 76.10% and 80.13%. Although effective for extracting acoustic features, this approach did not fully leverage advanced temporal modeling or phoneme-level feedback, which made it less effective compared with the proposed method. The MFCCs + FIS system showed improved performance, with accuracies that ranged from 78.36% to 84.71%, precisions from 78.18% to 83.26%, and recalls from 79.47% to 82.29%. By combining MFCCs with FIS, this approach improved the system’s ability to capture detailed phoneme-level features and account for temporal variations, though it still did not achieve the same level of accuracy and recall as the proposed CNN + FIS system.
In summary, the proposed CNN + FIS system outperformed other models in terms of both accuracy and recall, demonstrating the efficacy of combining deep learning for feature extraction with fuzzy inference for decision-making. The integration of CNNs and FIS offers a promising solution for addressing these limitations and providing more precise, real-time feedback for pronunciation improvement.
4.1. Comparison of Study Findings with Existing Literature
The findings of this study align closely with existing research on the application of deep learning techniques in speech analysis, particularly within MALL contexts. The high accuracy rates achieved by the CNN model in this study are consistent with prior work that emphasized CNNs’ effectiveness in speech classification tasks. For example, Lesnichaia et al. [
17] demonstrated that CNNs excel at managing complex speech patterns and distinguishing subtle pronunciation variations due to their capacity to extract hierarchical features from input data. Similarly, Mikhailava et al. [
18] highlighted the robustness of CNN models in handling sparse and crowd-sourced speech data, further validating their applicability in diverse linguistic settings. The use of spectrograms and MFCCs as input features corroborates established literature on the effectiveness of combining time–frequency representations with perceptually relevant spectral data. Sejdic et al. [
4] demonstrated that the integration of MFCCs with spectrograms significantly enhances the classification performance, as the two feature types provide complementary information. This study confirmed these findings, showing that the combination of spectrograms and MFCCs increased the model accuracy to approximately 87%, which outperformed the individual contributions of each feature set.
Furthermore, the inclusion of formant frequencies added phonetic depth to the analysis, particularly for distinguishing vowel sounds. This finding aligns with Kasahara et al. [
9], who emphasized the importance of formant frequencies in differentiating phonetic elements. While formants alone did not achieve the accuracy of spectrograms or MFCCs, their integration into a multi-feature approach enhanced the overall robustness, reinforcing the argument that combining diverse features yields more comprehensive results. The application of fuzzy logic for pronunciation assessment represents a novel contribution to the fuzzy logic in managing uncertainty in speech-processing tasks [
19]. The FIS implemented in this study facilitated flexible, interpretable pronunciation feedback, making it well-suited for user-centric language-learning applications. By enabling context-aware evaluations, the system provided a more nuanced alternative to rigid scoring mechanisms. In summary, this study validated and extended the existing literature by demonstrating that a well-integrated approach, i.e., combining CNN models, multi-feature extraction methods, and fuzzy logic assessment, can substantially enhance pronunciation analysis.
4.2. System Potential and Challenges in Practical Application
The system developed in this study demonstrated significant potential for enhancing language learning by providing personalized feedback and real-time pronunciation analysis. By leveraging deep learning models, such as CNNs, the system effectively classifies accents and delivers targeted improvement recommendations. The mobile-assisted approach enhances accessibility, enabling users to practice pronunciation anytime and anywhere, thereby supporting the democratization of language education [
30].
However, challenges persist in real-world deployment. One primary concern is the system’s performance in noisy environments, which can impact the accuracy of speech recognition and classification. While pre-processing techniques, such as noise reduction and signal normalization, help mitigate these issues, achieving consistent performance across varied real-world scenarios remains complex.
Another challenge involves addressing the variability in user accents and speech rates, requiring the model to handle diversity effectively to provide reliable feedback [
31]. Incorporating advanced data augmentation techniques and expanding the training dataset to include more diverse accents could further improve the model performance in this regard. User engagement and feedback interpretability are also critical considerations. Ensuring users understand and act on the system’s feedback necessitates clear, intuitive interfaces, which illustrate how processed results and detailed analyses are presented. Overcoming these challenges is essential for the practical adoption and sustained use of pronunciation learning tools.
4.3. Importance of Improved Pronunciation Feedback
The proposed system demonstrates remarkable accuracy in classifying nonnative English accents. By leveraging spectrograms and MFCCs as core features, the model achieved classification accuracies that exceeded more than 80%, aligning with prior studies that emphasized the effectiveness of these features in speech analysis. The integration of adaptive thresholding and advanced feature extraction techniques bolstered the model’s robustness, which enabled reliable differentiation across eight accent classes, including a newly introduced class of Chinese-accented English speakers. This outcome validates the system’s potential for practical applications in accent classification, which is comparable with findings in the existing literature on robust speech systems.
The study highlighted the complementary effectiveness of spectrograms, MFCCs, and formant frequencies in accent classification. The spectrogram-based features, which are known for capturing intricate temporal and frequency nuances, delivered superior classification performance compared with the MFCCs alone. Additionally, the integration of DTW enhanced the system’s ability to align the speech features across varying speaking speeds, which improved the identification of subtle pronunciation variations. These findings underscore the importance of combining diverse feature extraction methods for higher accuracy and consistency in pronunciation analysis.
The system’s real-time feedback mechanism inspired by neural and cognitive processes of the human brain significantly contributed to users’ improvement in pronunciation skills [
32]. By offering detailed assessments and visual feedback on phoneme accuracy and intonation patterns, users could iteratively refine their pronunciation [
33]. The experimental results revealed that the subjects improved their pronunciation correctness by 5% to 20% after using the system, corroborating neuroscientific findings on the auditory cortex’s role in processing time–frequency representations, similar to those in spectrograms [
34,
35]. This study effectively bridged cognitive neuroscience principles with technological applications to facilitate impactful language-learning outcomes.
4.4. Limitations and Future Directions
A primary limitation of the system lies in its adaptability to different languages. Although the model was trained on a diverse dataset encompassing various English accents, its performance may not be as robust for languages with significantly different phonetic structures, such as Mandarin or Thai. The system’s reliance on feature extraction methods optimized for English pronunciation, such as MFCCs and spectrograms, could restrict its effectiveness for languages requiring distinct acoustic emphases [
17]. Additionally, the feedback mechanism, which was fine-tuned for English-specific pronunciation nuances, may need reconfiguration to cater to other languages. Addressing these challenges would necessitate adapting feature extraction techniques and retraining the model on multilingual datasets to broaden its applicability beyond English [
30].
Another limitation was related to the dataset’s scale and diversity, which could impact the generalizability of the model’s performance. While the dataset includes a variety of English accents, its relatively constrained size andcontrolled recording conditions may not fully represent real-world scenarios [
18]. Incorporating larger datasets with more speakers and a broader range of pronunciation variations, including data from nonnative speakers with varying proficiency levels, would improve the model’s robustness and practical utility [
32]. Expanding the dataset to include recordings from diverse languages, dialects, and real-life settings is a critical step for future research [
31].
Deploying deep learning models, such as CNNs, on mobile platforms also presents challenges related to processing power and energy consumption. Mobile devices, while convenient for language learning, often have limited computational resources compared with desktops. Running complex models on mobile devices can lead to increased battery usage and longer response times, potentially affecting the user interface and experience. Techniques such as model pruning, quantization, and cloud-based processing could help optimize the model for mobile use, balancing resource efficiency and model complexity.


 ,
, 


