Article

Intelligent Damage Prediction During Vehicle Collisions Based on Simulation Datasets

School of Automotive and Transportation Engineering, Liaoning University of Technology, 169 Shiying Street, Guta District, Jinzhou 121001, China
*
Author to whom correspondence should be addressed.
Inventions 2025, 10(3), 40; https://doi.org/10.3390/inventions10030040
Submission received: 18 April 2025 / Revised: 21 May 2025 / Accepted: 25 May 2025 / Published: 28 May 2025

Abstract

Accurate prediction of vehicle damage in collision scenarios is crucial for enhancing road safety. However, traditional collision simulation methods are computationally intensive and time consuming. In this study, we proposed an intelligent damage prediction model that significantly reduces the computational time required for collision simulations by leveraging collision simulation datasets in conjunction with the random forest (RF) algorithm. A finite element model for vehicle collision simulation was first established. Subsequently, a dataset comprising 160 collision scenarios was generated by systematically varying the collision object, angle, offset, and speed, ensuring comprehensive coverage of vehicle damage data. The dataset was employed to construct an RF-based prediction model to estimate vehicle collision damage. Validation trials demonstrated that the proposed model achieved a mean absolute percentage error of 20.09% compared with 33.18% of a support vector machine regression (SVMR) model. The root-mean-square error of the proposed model was 33.94, whereas that of the SVMR model was 68.16. Compared with the SVMR model, the proposed RF model exhibited superior fitting performance, with reduced dispersion between the predicted and actual values. This enhanced model offers rapid damage prediction for trajectory planning systems and adaptive restraint systems in autonomous vehicles, ultimately contributing to enhanced road safety.

1. Introduction

The rapid advancement of vehicle intelligence has yielded significant progress in the automotive sector [1]. The development of vehicle intelligence relies on integrating advanced driver-assistance systems [2] and autonomous driving technologies [3], with the latter emerging as a prominent research focus. Ensuring optimal safety performance remains a critical objective in autonomous driving. Accurate and real-time prediction of vehicle damage in unavoidable collision scenarios is essential for enhancing road safety. Such predictions influence the safety systems of autonomous vehicles during collisions, particularly pre-collision trajectory planning systems and adaptive restraint systems during a collision. By providing data-driven insights, damage prediction models can enhance the effectiveness of these safety mechanisms [4].
Collision simulation uses computer software and mathematical models to digitally model interactions between two or more objects during a collision. This field is based on the principles of physical mechanics, utilizing advanced mathematical models to replicate various physical phenomena, including displacement, speed, acceleration changes, and energy transformations during collisions. The international academic community has recently conducted extensive research on vehicle collision simulation. Specifically, Fang et al. [5] analyzed vehicle collisions on steep slopes, investigating the relationship between vehicle speed and collision deformation. Lee et al. [6] developed a part-level collision simulation model to assess rear-end collision performance in the early stages of vehicle design. Sheikh et al. [7] proposed an autonomous vehicle collision avoidance model for different ramp merge scenarios to mitigate collision risks in ramp merge areas.
Recent advancements in vehicle collision damage research have increasingly leveraged deep learning algorithms to analyze structural damage sustained during collisions. These algorithms process large datasets to intelligently classify damage types, assess severity, and predict deformation patterns. In a seminal study, Deva Hema et al. [8] proposed an optimized deep learning framework using an enhanced long short-term memory model to enhance the effectiveness of collision risk prediction systems. This framework integrates a convolutional neural network-based feature extraction mechanism to extract high-value features. Similarly, Farhat et al. [9] introduced a multi-access-edge-computing-based cooperative collision avoidance system that continuously processes traffic and hazard data from roadside multi-access edge computing servers, providing targeted risk alerts to nearby vehicles. Additionally, Zulherman et al. [10] implemented a deep Q-network with imbalanced classification to identify single-vehicle motorcycle collisions (fatal and non-fatal) to reduce fatality rates in such incidents. In the research of result prediction, random forest excels in pattern prediction with strong anti-overfitting ability, high-dimensional data handling capacity, automatic feature importance evaluation, and parallel training for efficient capture of complex nonlinear patterns. The random forest machine learning technique was used by Zhu et al. [11] to classify and predict the lithium plating of LIBs. Li et al. [12] developed an improved random forest model for concrete face rockfill dam deformation prediction and health monitoring. The random forest algorithm was used by Gaaloul et al. [13] to develop a predictive baseline model for normal PV system behavior with high accuracy. However, there are still few studies on the combination of vehicle collision damage and random forest.
In the research of multi-scenario vehicle collisions, despite advancements in collision simulation, existing systems for traditional vehicles encounter computational efficiency and realism limitations, which curtail the learning efficacy. Furthermore, current structural damage prediction models often utilize PC Crash [14] to generate multi-scenario datasets, relying on mathematical and physical modeling modules—integral software components—to analyze vehicle motion and interactions in traffic accidents. While this approach allows for precise accident simulations in a short time, its output typically quantifies overall damage rather than providing detailed data on specific damage locations or vehicle operating conditions. Consequently, the approach lacks the precision needed for decision-support data references.
In view of the time-consuming nature of traditional collision simulations and the limitation that fast simulation methods fail to provide local damage results, it is imperative to establish a dataset through finite element simulations and then integrate machine learning methods to predict vehicle collision outcomes. Based on crash simulation datasets and the random forest (RF) algorithm, the proposed collision damage prediction model directly forecasts the damage extent using existing datasets, drastically reducing the computational time required for collision simulations. The ability of the model to predict the damage extent to critical occupant safety-related areas of the host vehicle under current collision conditions is noteworthy. Further research on this model may enhance the accuracy of decision-making data, offering valuable insights into autonomous driving systems in unavoidable collision scenarios. Mitigating damage in critical areas during vehicle collisions can contribute to enhanced road safety.

2. Implementation and Reliability Verification of Finite Element Model for Collision Simulation

2.1. Implementation of Collision Simulation Models

This study used a Ford Taurus model provided by the National Highway Traffic Safety Administration (NHTSA) as the experimental object. The length, width, and height of the vehicle were 4350, 1720, and 1610 mm, respectively. The model was imported into HyperMesh 2020, a finite element preprocessing software, for geometric preprocessing to enhance collision realism. This process involved eliminating overlapping surfaces, reconstructing missing surfaces, and simplifying or repairing non-load-bearing small holes. Subsequently, mesh generation was conducted, material parameters were assigned to each component, constraints, loads, and contact modes were defined, and a K-file was generated for the specific working condition of the model. This K-file was then imported into LS-DYNA R11, a renowned explicit dynamics simulation software, for further analysis. Various calculation forms and computational parameters were selected within the LS-DYNA interface to meet specific simulation requirements. Following the computational process, result files were obtained and subsequently analyzed in HyperView 2020, a powerful post-processing software for visualizing simulation results, to visualize the collision dynamics and extract critical damage data.
In problems such as automotive crash analysis, most element properties are shell elements. Since the collision process involves high-speed dynamics, the strain rate effect of materials is significant. The material model MAT24 (segmented elastoplastic material) was selected, which can define the strain rate effect through stress-strain curves or strain rate effect functions, enabling relatively accurate simulation of material performance during high-speed vehicle collisions. Components such as the engine, transmission, and steering knuckle undergo minimal deformation during collisions and were modeled as rigid bodies.

2.2. Reliability Verification

Verifying the reliability of the simulation results is essential to ensure that the established collision simulation model accurately represents real-world collision scenarios. This verification involves assessing multiple factors, including variations in total vehicle mass stemming from mass scaling, changes in hourglass energy caused by diminished integration elements, and overall energy fluctuations.
During collision simulation, the principle of mass conservation must be maintained. However, because LS-DYNA employs an explicit integration method for computational solving, mass scaling is applied to facilitate stable calculations. This adjustment alters the mass of specific vehicle components, and excessive alterations in component masses can reduce computational accuracy, considerably affecting the precision of the simulation. Moreover, energy conservation within an isolated system is imperative. However, phenomena such as hourglassing can cause energy fluctuations during collisions. These fluctuations should remain within acceptable limits to prevent substantial deviations in the overall energy.
A detailed analysis of the mass growth percentage and energy variation curves generated in the HyperGraph module revealed that the mass growth percentage was 0.84% (<5%) [15], falling within the specified range for total vehicle mass change. At collision onset, the total energy was 1.35 × 10⁸, and at the collision termination moment, the energy was 1.37 × 10⁸, resulting in a 2% variation. This variation fell within the acceptable upper limit, and the proportion of hourglass energy remained below the permissible threshold. Additionally, during the collision, the kinetic energy of the model decreased while its internal energy increased, with these variations complementing each other. Consequently, the collision model was deemed acceptable.

3. Establishment of Collision Damage Datasets

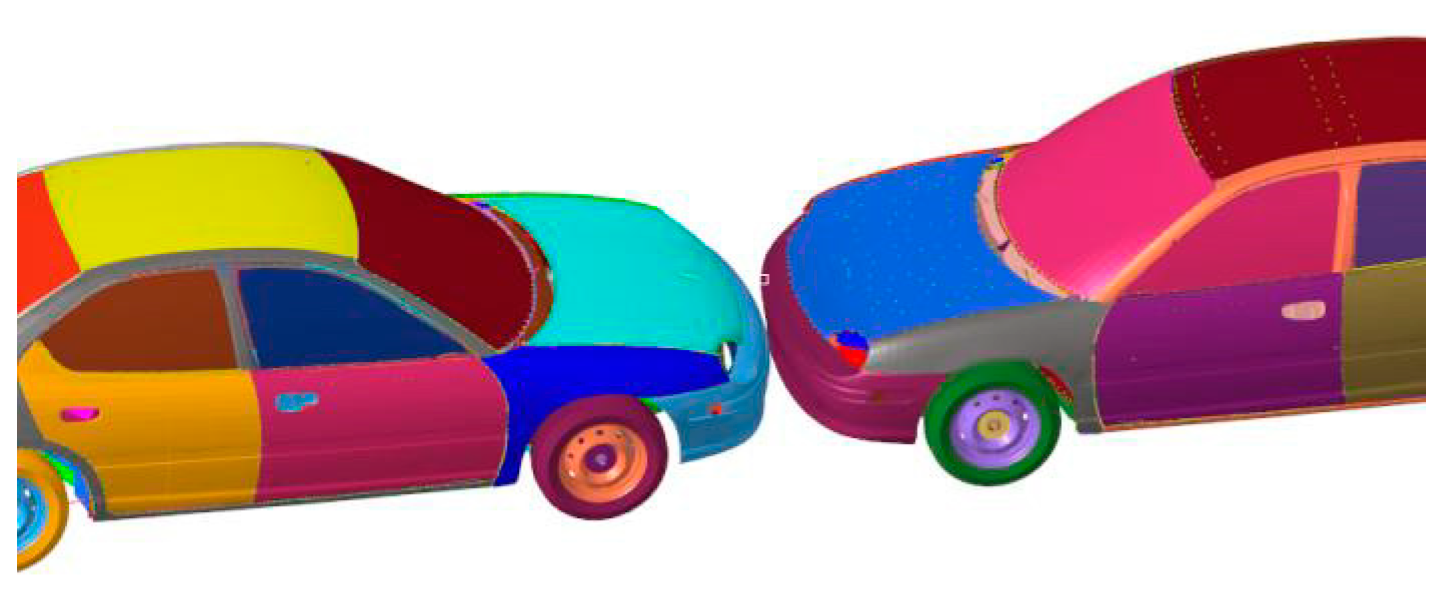
3.1. Setting of Collision Scenarios

A total of four different collision scenarios were established (as shown in Table 1). All scenarios had initial speeds of 5–100 km/h, resulting in 20 distinct collision models and their corresponding K-files. Schematic diagrams of different scenarios are shown in Figure 1, Figure 2, Figure 3 and Figure 4.

3.2. Selection of Dataset Points

To establish a comprehensive understanding of vehicle damage under various collision scenarios, 160 distinct vehicle collision models were generated by varying factors such as collision objects, angles, offsets, and speeds. However, to specifically assess occupant injury risks, selecting key points on the body of the vehicle that are critical for passenger safety as the foundational dataset points is essential.

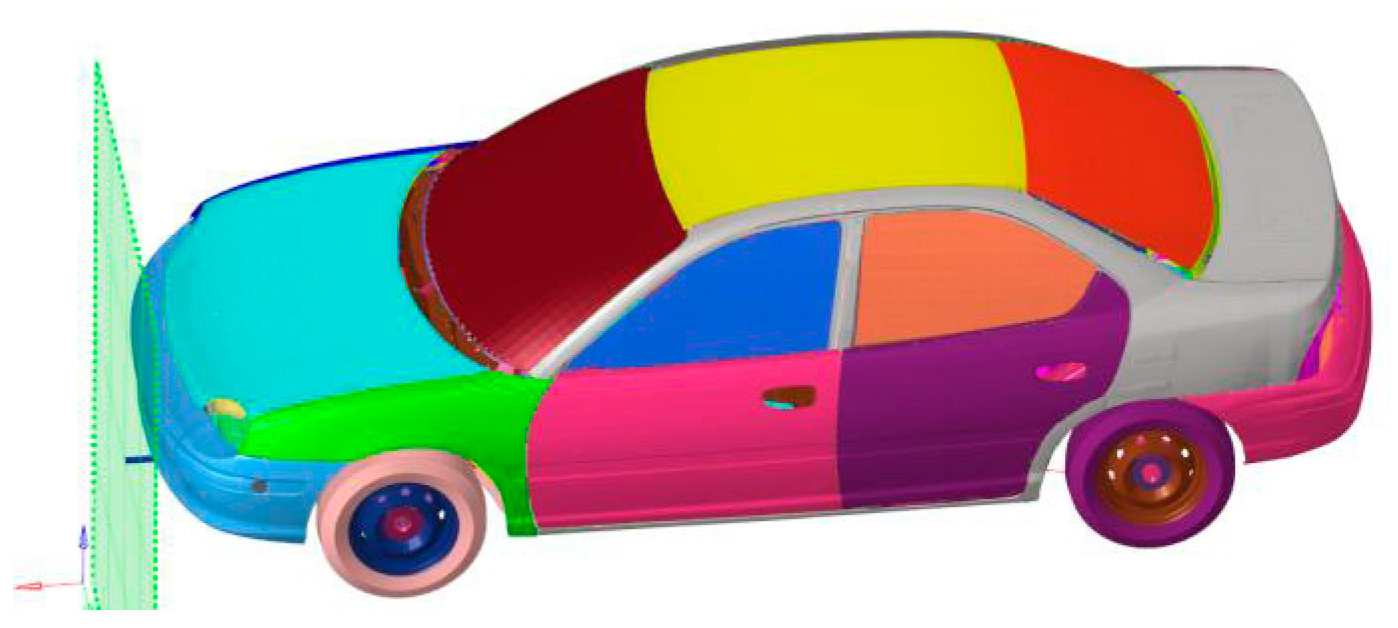
3.2.1. Damage Points on Energy-Absorbing Components

In automotive safety design, manufacturers integrate energy-absorbing components to mitigate the impact of collisions on occupants. These components, including the front longitudinal beam assembly, absorb and disperse collision energy through deformation. Consequently, these regions are the primary observation points for vehicle deformation and are well suited for selecting key data points to monitor collision damage, as illustrated in Figure 5.

3.2.2. Damage Points on Cab-Related Components

Cab deformation directly impacts driver safety. Therefore, pivotal elements, such as the front pillar, angle with the upper side rail, center and rear pillars, and panel front rail, are identified as the key data points for evaluating collision damage, as illustrated in Figure 6.

3.3. Extraction of Collision Damage Datasets

The post-collision displacement of the vehicle in the system coordinate frame is defined by selecting 24 critical points on the vehicle as foundational data points for this dataset (Figure 7). The forward direction of the vehicle is defined as X+, the left side direction is Y+, and the direction perpendicular to the ground upward is Z+.
As the displacement data are established in the system coordinate frame, the data do not directly quantify vehicle damage. Notably, the smaller the node displacement value, the larger the displacement relative to the entire vehicle, indicating a higher degree of damage to the vehicle itself. Specific numerical values need to be obtained through calculation. Consequently, a coordinate transformation is required. Specifically, the displacement of a point in the spatial coordinates of the vehicle, before and after the collision, is denoted as Δ x , Δ y , and Δ z . These values indicate the displacement of that point during the collision, serving as a measure of collision damage. A reference point, P , less affected by deformation on the non-collision side, is selected for the collision analysis. Spatial coordinate P before and after the collision is recorded as P 0 X 0 , Y 0 , Z 0 and P 1 X 1 , Y 1 , Z 1 , respectively. Similarly, the initial and post-collision positions of the selected damage data point ( R ) are R 0 x 0 , y 0 , z 0 and R 1 x 1 , y 1 , z 1 . The relative spatial position of R with respect to P before the collision is defined as R 0 P 0 . If the vehicle undergoes rotation by an angle α along the x-axis during the collision, the position of R 1 relative to P 1 , without accounting for the rotation, is denoted as R 1 * . The corrected x-axis coordinate, x 1 * , of R 1 * is calculated as follows:
x 1 * = x 1 X 1 2 + y 1 Y 1 2 × sin α + arctan x 1 X 1 y 1 Y 1
Similarly, component y 1 * is given by the following:
y 1 * = x 1 X 1 2 + y 1 Y 1 2 × cos α + arctan x 1 X 1 y 1 Y 1
Finally, the relative displacement of the point on the vehicle relative to the body can be expressed as follows:
Δ x = x 1 * X 1 ( x 0 X 0 )
Δ y = y 1 * Y 1 ( y 0 Y 0 )
Δ z = z 1 z 0
A total of 160 collision simulation models were executed under varying operating conditions. After calculations and coordinate transformations, the displacement data of each point relative to the vehicle body were obtained, forming the collision damage dataset. Due to space constraints, only a subset of the dataset is presented in this paper. Table 2 presents the input values for the selected operating conditions. Here, 1 indicates a collision between the vehicle and the rigid wall, while 0 indicates a collision between two vehicles. The collision angle refers to the angle between the centerline of the target vehicle and the axis of the colliding object. The collision offset is the perpendicular distance between the center of the target vehicle and the axis of the collision object. Negative and positive values indicate the left and right sides, respectively. Table 3 presents the part of the corresponding output values for the cases enumerated in Table 2.

4. Collision Damage Prediction Model

4.1. RF Algorithm

RF is an ensemble learning method that enhances prediction accuracy by combining multiple decision trees [11,12,13,16]. RF is an extension of classification trees originating from the Bagging algorithm. The RF algorithm comprises multiple unpruned decision trees. The fundamental principle involves using bootstrap techniques, where k subsets are randomly drawn with replacements from the original. Each k training set is used to construct k decision trees, collectively forming an RF, which is used for classification or regression on a test set [17]. The crux of the RF algorithm is the decision trees, which are constructed from distinct data subsets. Optimal data partitioning is crucial because each tree must identify the optimal split at each node [18].
We constructed a decision tree-based RF regression prediction model using the Python 3.10 library and Scikit-learn package. The model was trained, validated, and then applied to predict vehicle collision based on the previously generated damage dataset. Figure 8 illustrates the fundamental steps involved in establishing the model.

4.2. RF Prediction Model

4.2.1. Correction of Abnormal Data

When handling large datasets, data anomalies are inevitable and can substantially reduce the accuracy of predictive models. Addressing such irregularities systematically is imperative for ensuring computational accuracy. These anomalies may include missing values in continuous datasets, sudden spikes in smooth data, or abrupt fluctuations resembling sharp waves. For instance, the displacement data for point 7 under different speed conditions exhibit a clear anomaly in the ninth set of speed conditions, as shown in Figure 9.
When the dataset is large, handling abnormal data in computational results is relatively straightforward. This is because a small number of abnormal data typically has negligible impact and can often be disregarded. However, in smaller datasets, each data point exerts a great influence on the results, necessitating a more meticulous approach to managing abnormal data. The horizontal method [19] is a common approach used to address abnormal data, which estimates the expected value of an abnormal data point by comparing results derived from two models operating under similar conditions. This study employed the horizontal method to address the abnormal data present in the dataset.

4.2.2. Data Normalization

Although the RF algorithm demonstrates a high tolerance for faults and variability, inconsistencies in the dataset can increase error rates. Data normalization helps to reduce computational complexity, simplify calculations, and accelerate model convergence. Typically, data scaling is performed within the range of 0–1. Section 4.2.2 describes the normalization of the collision angle, speed, and offset.
Collision angles in vehicle collision scenarios range from 0 to 360°. In symmetrical angle ranges, normalization is typically performed using sine and cosine functions as follows:
θ = s i n θ θ = c o s θ
Similarly, collision speed and offset are normalized using the min–max method as follows:
v = v v m i n v m a x v m i n t = t t m i n t m a x t m i n
where t represents the pre-normalized offset distance and t denotes the normalized offset distance, t m a x and t m i n denote the maximum and minimum offset distances, respectively, v and v represent the initial and normalized collision speeds under the given operating condition, respectively, and v m a x and v m i n denote the maximum and minimum initial collision speeds, respectively.

4.2.3. Training and Test Sets

Collision damage dataset D was segmented into two subsets: training set D 1 and test set D 2 . To evaluate model performance, 10 data groups were considered exclusively for testing. The remaining 150 data groups were divided into 80% for the training set and 20% for the test set.

4.2.4. Parameter Setting and Construction of RF Model

Let the number of trees in the RF be N t r e e , the number of features considered for node splitting be M t r y , and the minimum node size be N m i n . A bootstrap sample D i of size K is drawn from the training set D 1 . This set is then used to generate tree T i , with the splitting behavior based on the M t r y index. The process terminates when the terminal nodes reach the threshold of the minimum node, N m i n . For a new input variable x , if y i x is the prediction result of the N t r e e i tree in the RF, the overall prediction result of the model is given by the following:
Y N t r e e x = 1 N t r e e i = 1 N t r e e y i x × 100 %
A vehicle collision damage prediction model has been developed incorporating the collision dataset with the RF algorithm.

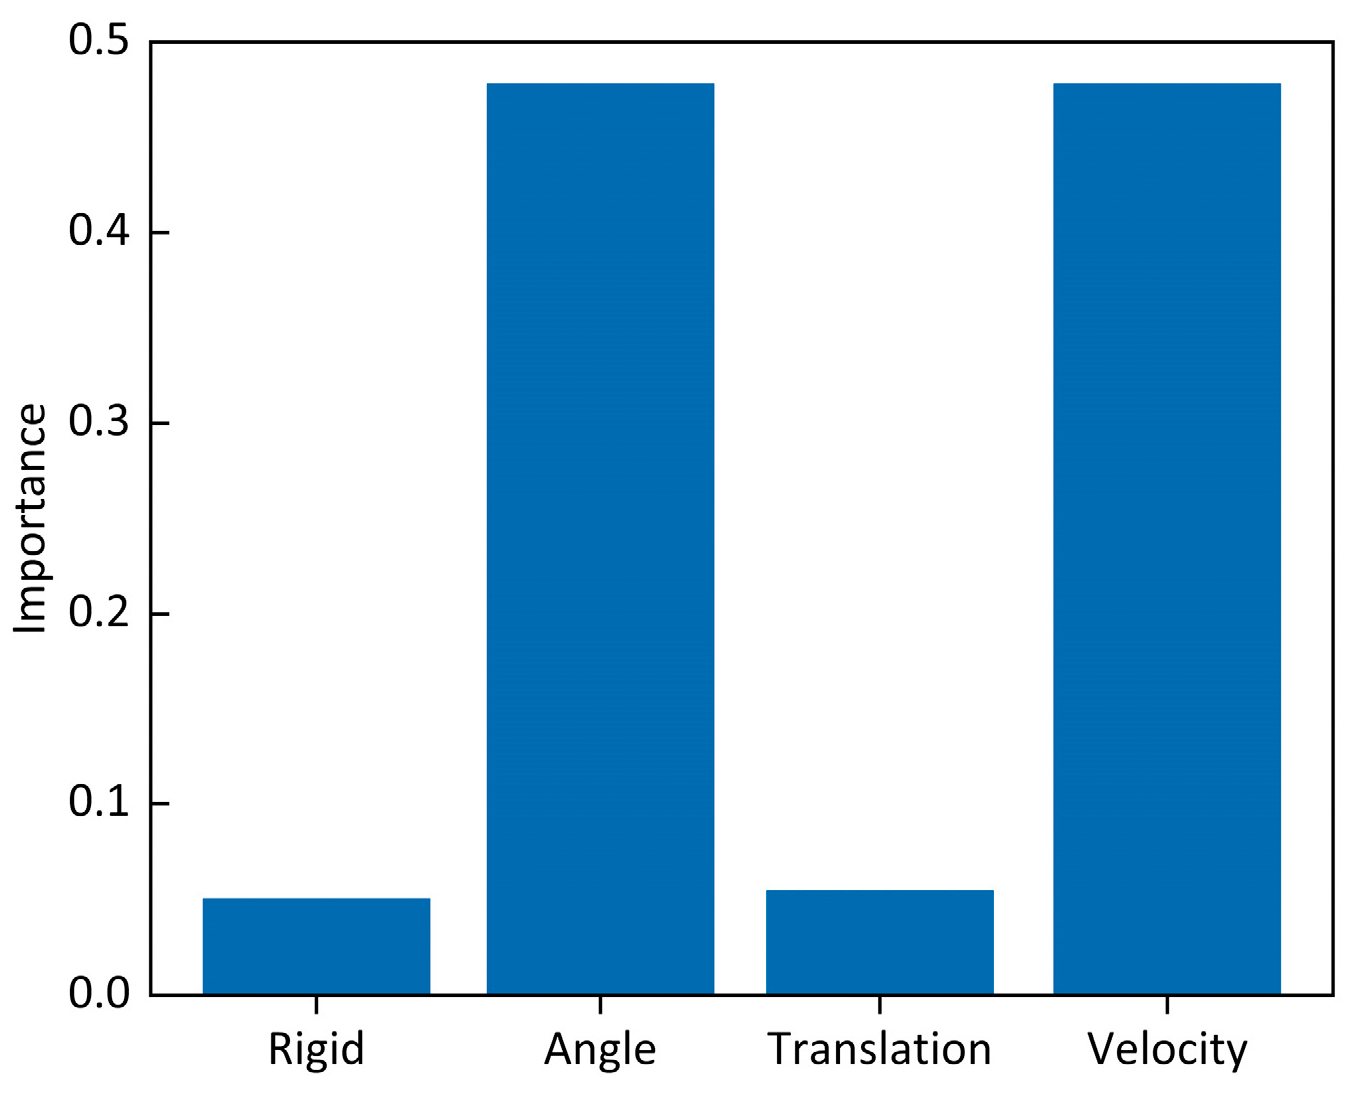
4.2.5. Analysis of Characteristic Variable Importance

Four characteristic variables were selected to configure different operating conditions. Although these variables exhibited high correlations with collision damage, the impact of additional variables and the predictive performance of the model remained uncertain. Arbitrarily increasing input variables might compromise the reliability of the model. Therefore, assessing the importance of the characteristic variables was crucial for determining their significance to the model. The evaluation was conducted using the Gini index and prediction accuracy methods, obtaining the results shown in Figure 10.
As shown in Figure 10, the most significant factors in predicting collision damage were the collision speed, angle, offset, and object. These factors were previously selected as key characteristic variables. Future analyses should incorporate additional variables, such as the mass and width of the collision object, which can be determined using the same method because they are also critical factors.

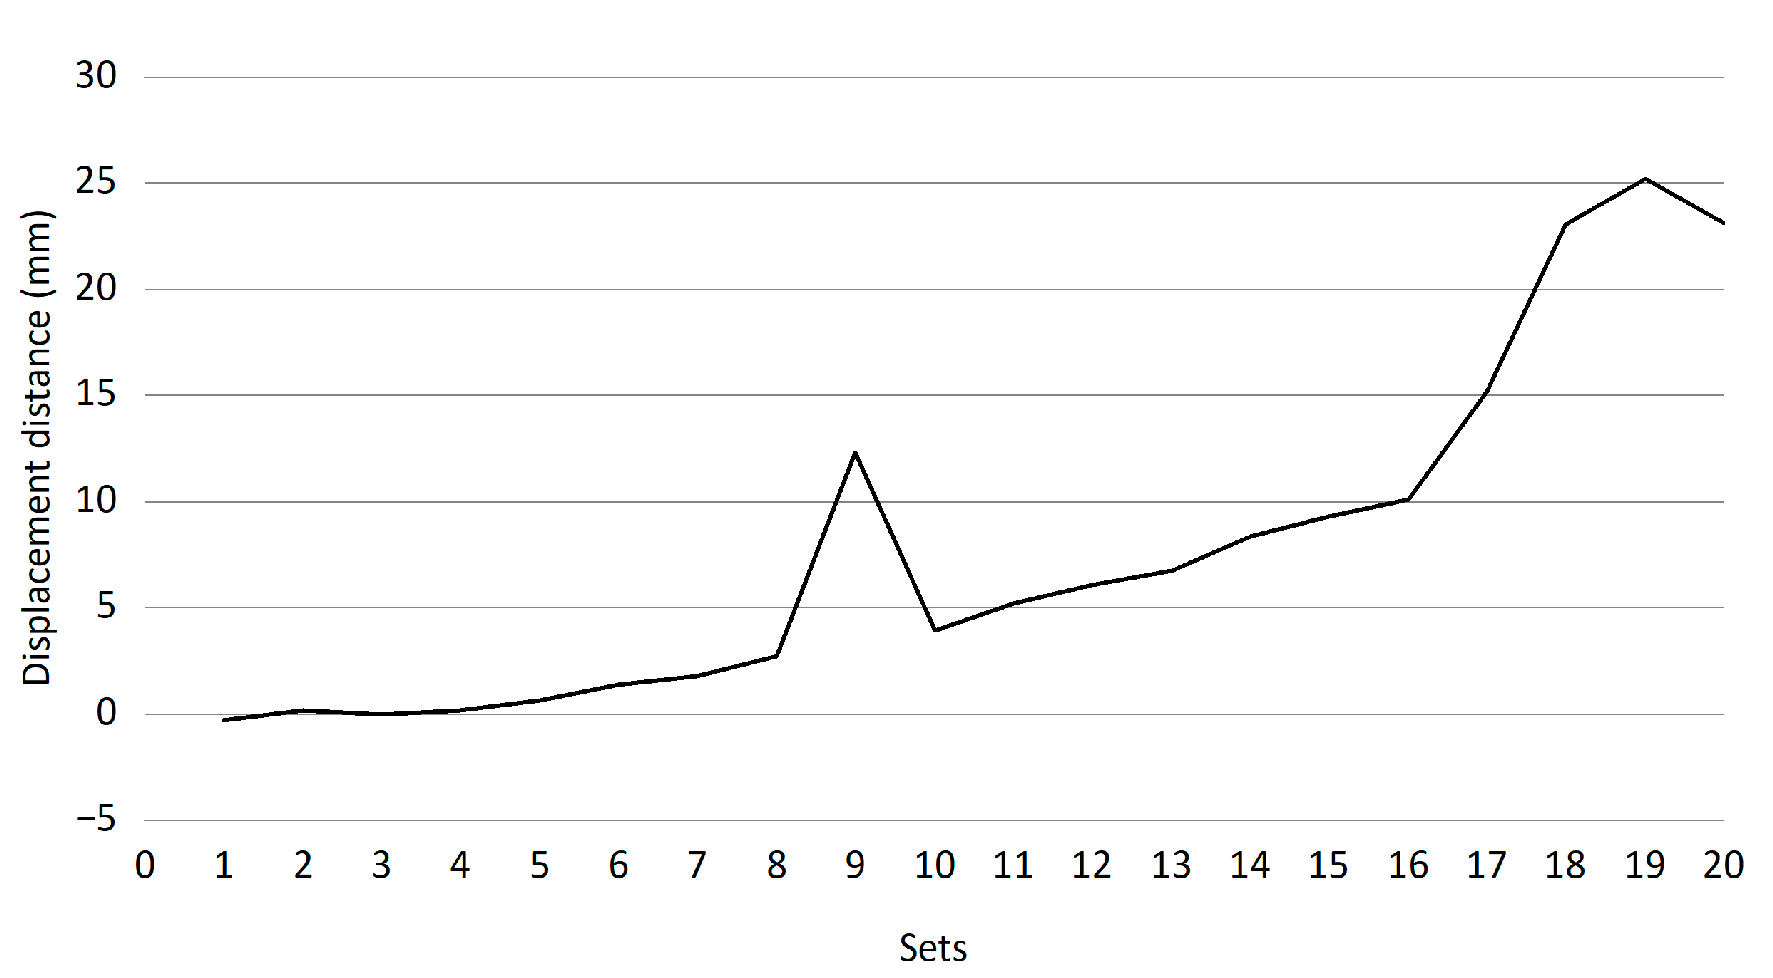
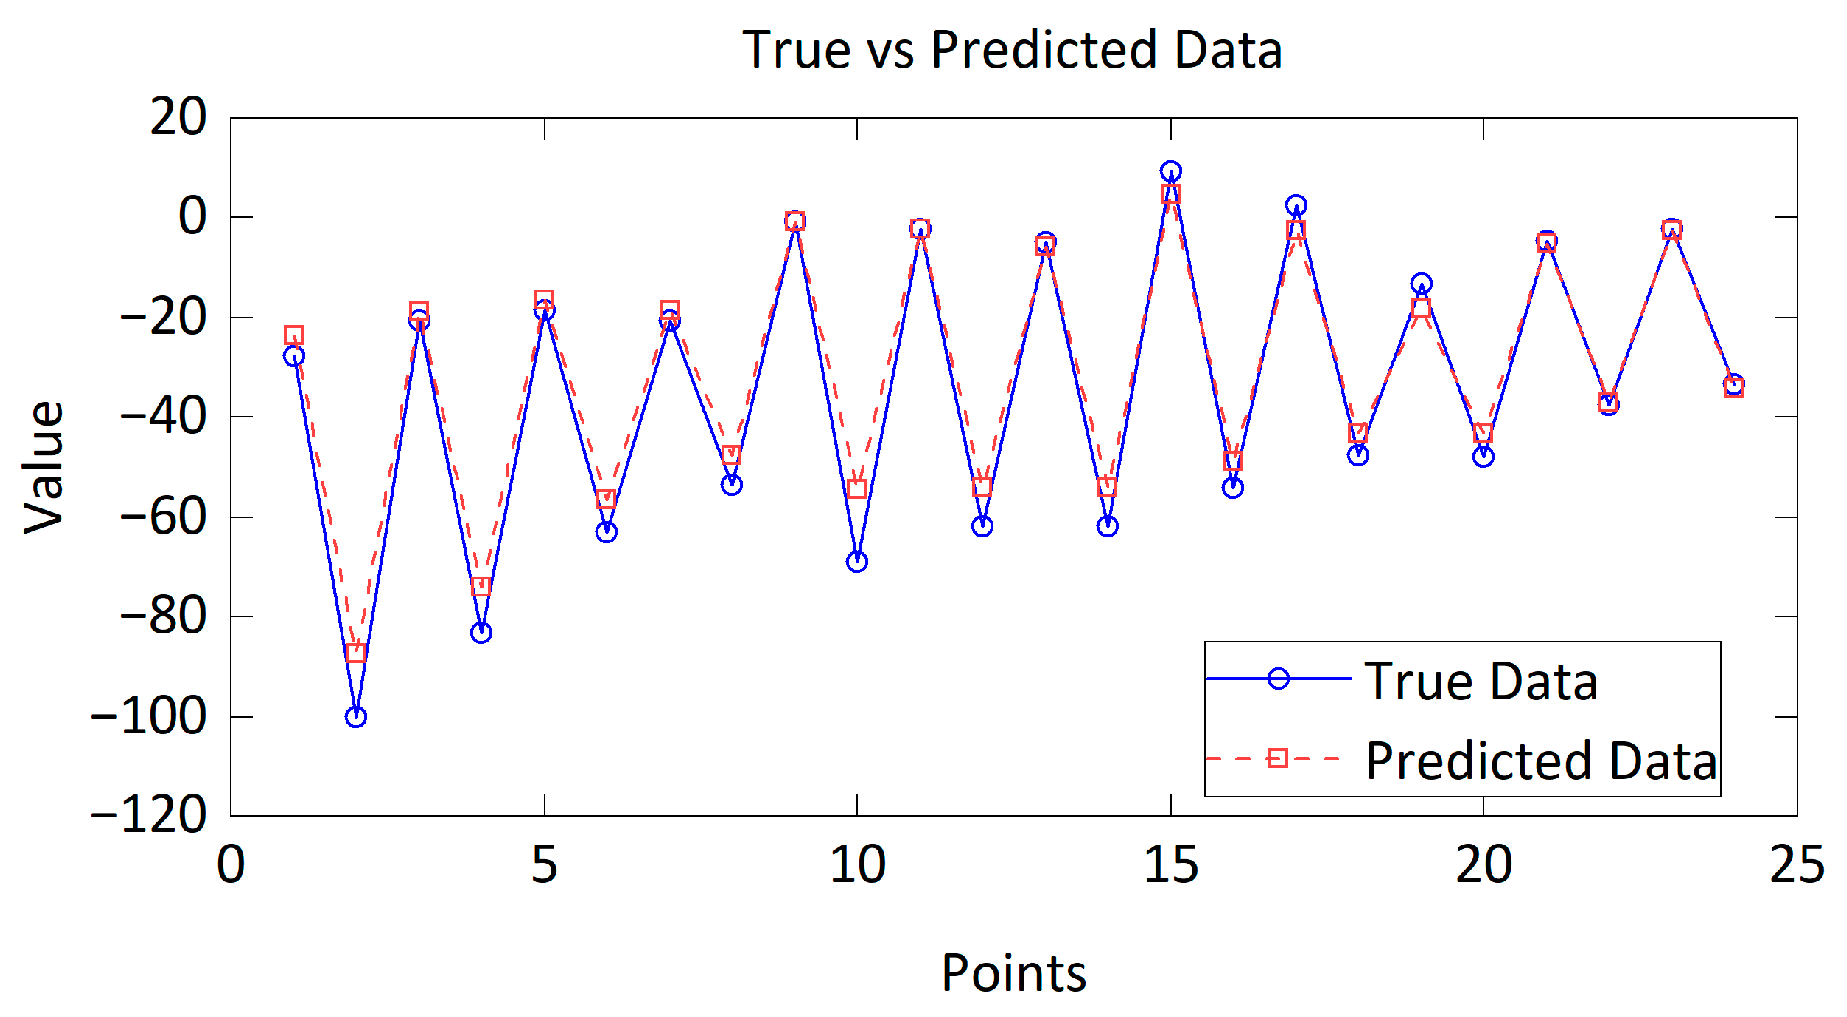
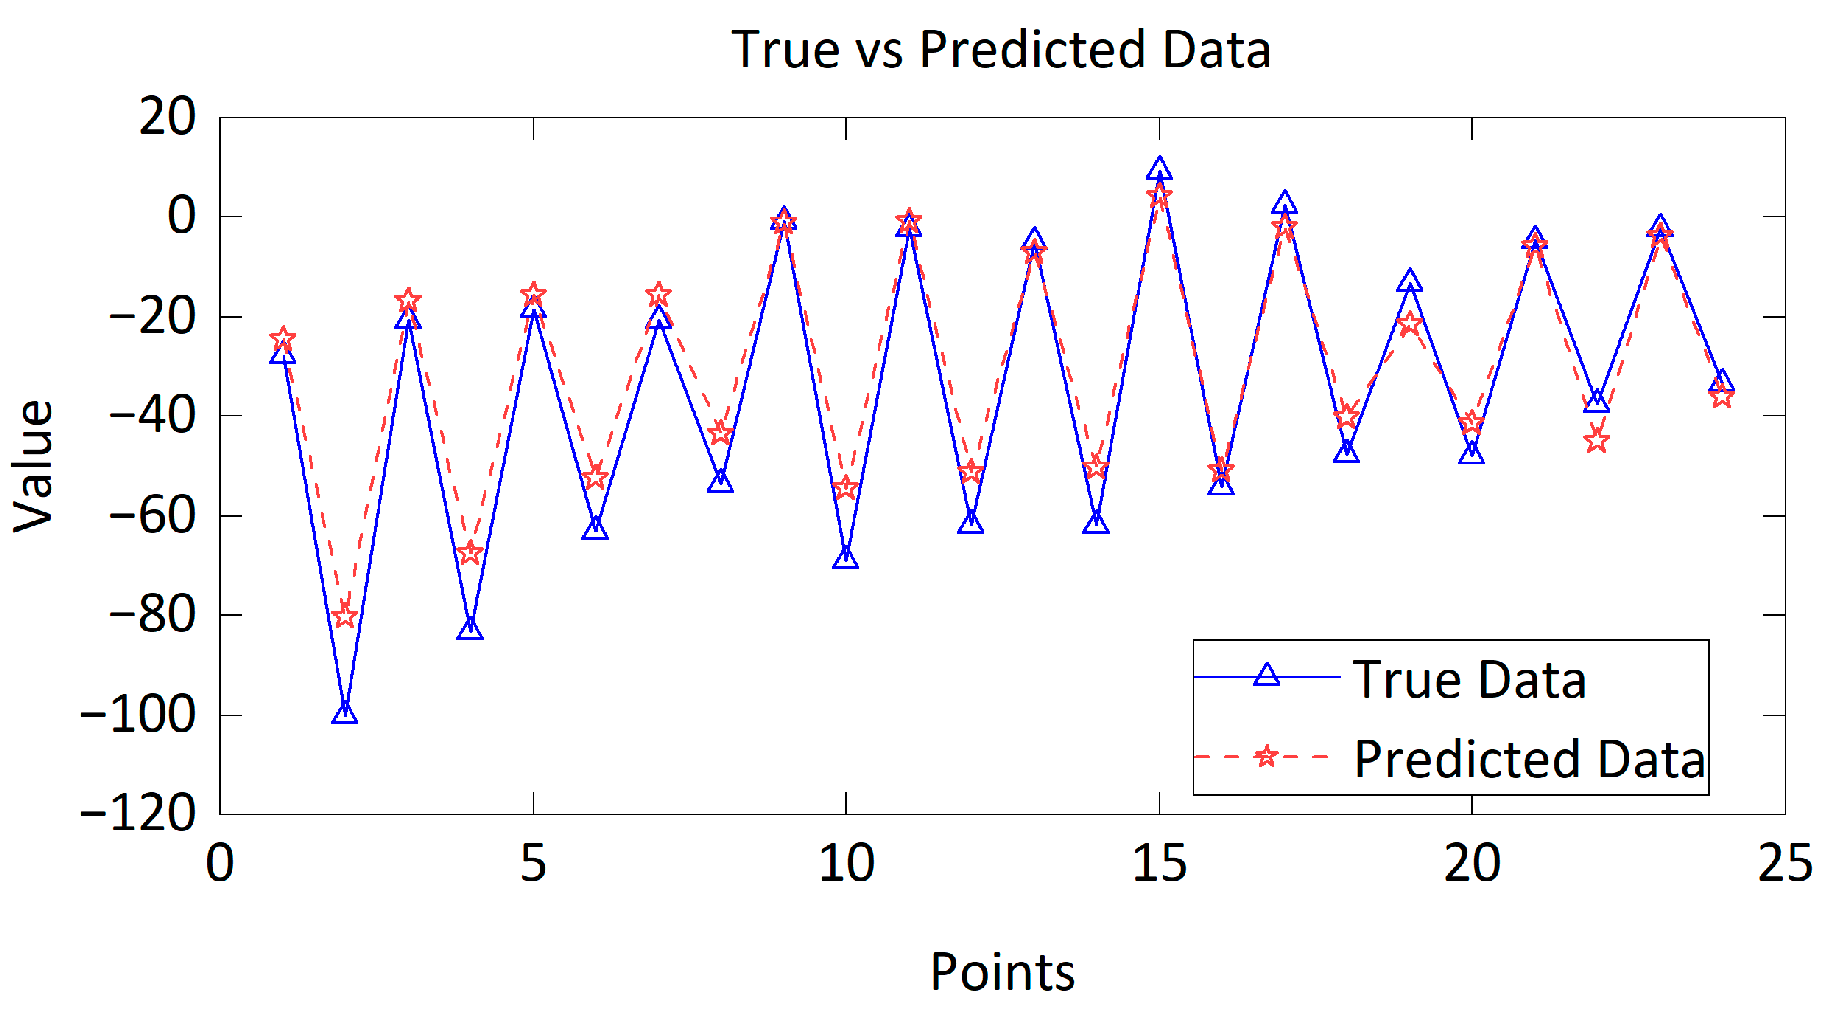
4.3. Analysis of Prediction Results

The performance of the model was evaluated using collision damage data from a frontal collision with a rigid wall at 25 km/h. To verify the effectiveness, a support vector machine regression (SVMR) model [20] was employed for comparison. The conditions and input variables in the SVMR model were identical to those in the RF algorithm. The penalty and kernel function parameters were selected using the grid search method [21], obtaining values of 5 and 0.25, respectively. Figure 11 (Supplementary Materials File S1) and Figure 12 (Supplementary Materials File S2) present the predicted and actual results of the models.
The displacement values at various points are listed in Table 4, and they were calculated using collision simulation and the RF prediction and SVMR models.
As the predicted values differed from the simulation results, the performance of these models was assessed using the mean absolute percentage error (MAPE) and root−mean−square error (RMSE). MAPE is calculated as follows:
M A P E = 1 N i = 1 N p i p i p i × 100 %
where N is the total number of samples in the dataset and p i and p i are the simulated and predicted collision damage values at the i -th point, respectively, for i = 1 ,   2 ,   ,   N . MAPE evaluates the fitting performance of the model. A lower MAPE indicates higher prediction accuracy and better fitting performance, while a higher MAPE suggests poor model fitting. RMSE is calculated as follows:
R M S E = 1 N i = 1 N P i P i 2
where N is the number of samples and P i and P i represent the simulated and predicted values at the i -th point, respectively, for i = 1 ,   2 ,   ,   N . RMSE measures the dispersion between the predicted and simulated values, with lower values indicating reduced dispersion and enhanced model prediction accuracy.
By applying these measures to the data listed in Table 4, the RF model exhibited a MAPE of 20.09% and RMSE of 33.94, whereas the SVMR model exhibited a MAPE of 33.18% and RMSE of 68.16. These findings indicate that the RF model achieves higher prediction accuracy and better adaptability in estimating collision damage. Key advantages of the proposed RF model include its simplicity, rapid computation speed, minimal critical parameters, and consistent prediction performance.

5. Conclusions

We demonstrate that the proposed RF collision damage prediction model achieves higher accuracy in predicting damage values at critical vehicle points following a collision than the conventional SVMR model. The predictions are based on collision speed, offset, angle, and object. Thus, in practical applications, potential damages can be readily predicted by establishing a vehicle model database; this, in turn, provides precise reference data for trajectory planning and adaptive restraint systems in autonomous vehicles. The proposed model can contribute theoretically and practically to reducing vehicle damage in unavoidable collisions and enhancing autonomous driving safety.
In response to the limited input variables in the model, subsequent research will expand it by incorporating additional features (e.g., vehicle mass, bumper hardness) to retrain and rigorously validate the model for enhanced prediction accuracy.

Supplementary Materials

The following supporting information can be downloaded at: https://www.mdpi.com/article/10.3390/inventions10030040/s1, File S1: True values and errors for RF model; File S2: True values and errors for SVMR model.

Author Contributions

Conceptualization, C.L. and L.H.; methodology, S.L. and X.L.; software, S.L. and X.A.; validation, X.A. and S.L.; formal analysis, C.L.; writing—original draft preparation, X.L. and S.L.; writing—review and editing, C.L. and S.L.; supervision, C.L. and L.H.; funding acquisition, C.L. All authors have read and agreed to the published version of the manuscript.

Funding

This research was funded by the 2023 Fundamental Research Project (No. JYTMS20230832) of the Educational Department of Liaoning Province.

Data Availability Statement

Data are contained within the article and Supplementary Materials.

Acknowledgments

The authors would like to thank Engineer Guan Zhen from Jinheng Automotive Safety System Co., Ltd. for his support of this project in the industry−academia collaboration.

Conflicts of Interest

The authors declare no conflicts of interest.

Nomenclature

t pre-normalized offset distance N t r e e number of trees in random forest
t normalized offset distance M t r y number of features considered for node splitting
t m a x maximum offset distance N m i n minimum node size
t m i n minimum offset distance N number of samples
v initial collision speed p i simulated collision damage value at i -th point
v normalized collision speed p i predicted collision damage value at i -th point
v m a x maximum initial collision speed P i simulated value at i -th point
v m i n minimum initial collision speed P i predicted value at i -th point

References

  1. Wang, Y.; Zhang, F.; Feng, Q.; Kang, K. Strategic analysis of intelligent connected vehicle industry competitiveness: A comprehensive evaluation system integrating rough set theory and projection pursuit. Complex Intell. Syst. 2024, 10, 7033–7038. [Google Scholar] [CrossRef]
  2. Aleksa, M.; Schaub, A.; Erdelean, I.; Wittmann, S.; Soteropoulos, A.; Fürdös, A. Impact analysis of advanced driver assistance systems (ADAS) regarding road safety—Computing reduction potentials. Eur. Transp. Res. Rev. 2024, 1, 39. [Google Scholar] [CrossRef]
  3. Ding, S.; Qu, J. Research on multi-tasking smart cars based on autonomous driving systems. Comput. Sci. 2023, 4, 292. [Google Scholar] [CrossRef]
  4. Wang, Q.; Gan, S.; Chen, W.; Li, Q.; Nie, B. A data-driven, kinematic feature-based, near real-time algorithm for injury severity prediction of vehicle occupants. Accid. Anal. Prev. 2021, 156, 106149. [Google Scholar] [CrossRef] [PubMed]
  5. Fang, X.; Wang, B.; Liu, H.; Zhao, K. Model construction and simulation analysis of vehicle collision on steep road section in mountainous area. Green Connected Automated Transportation and Safety. In Proceedings of the 11th International Conference on Green Intelligent Transportation Systems and Safety, Singapore, 17–19 October 2022; pp. 333–348. [Google Scholar]
  6. Lee, J.; Kim, H.K.; Heo, S.J.; Lee, S.J. Equivalent stiffness modeling method of a battery system for evaluating vehicle rear-end collision performance. Int. J. Automot. Technol. 2023, 24, 1325–1330. [Google Scholar] [CrossRef]
  7. Sheikh, M.S.; Peng, Y. A collision avoidance model for on-ramp merging of autonomous vehicles. J. Civ. Eng. 2023, 27, 1323–1326. [Google Scholar] [CrossRef]
  8. Deva Hema, D.; Rajeeth Jaison, T. Efficient collision risk prediction model for autonomous vehicle using novel optimized LSTM based deep learning framework. Int. J. Intell. Transp. Syst. Res. 2024, 22, 352–354. [Google Scholar] [CrossRef]
  9. Farhat, W.; Ben Rhaiem, O.; Faiedh, H.; Souani, C. A novel cooperative collision avoidance system for vehicular communication based on deep learning. Int. J. Inf. Technol. 2024, 16, 1661–1664. [Google Scholar] [CrossRef]
  10. Zulherman, D.; Yang, J.; Shimizu, K.; Yokota, Y. Deep Q-learning network-based imbalanced classification for fatality prediction of single-vehicle motorcycle crashes. Int. J. Intell. Transp. Syst. Res. 2025, 23, 175–191. [Google Scholar] [CrossRef]
  11. Zhu, G.; Chen, J.; Liu, X.; Sun, T.; Lai, X.; Zheng, Y.; Guo, Y.; Bhagat, R. Intelligent lithium plating detection and prediction method for Li-ion batteries based on random forest model. Green Energy Intell. Transp. 2025, 4, 100167. [Google Scholar] [CrossRef]
  12. Li, Y.L.; Yin, Q.G.; Zhang, Y.; Zhou, H. Deformation prediction model of concrete face rockfill dams based on an improved random forest model. Water Sci. Eng. 2023, 16, 390–398. [Google Scholar] [CrossRef]
  13. Gaaloul, Y.; Bel Hadj Brahim Kechiche, O.; Oudira, H.; Chouder, A.; Hamouda, M.; Silvestre, S.; Kichou, S. Faults detection and diagnosis of a Large-Scale PV system by analyzing power losses and electric indicators computed using random forest and KNN-Based prediction models. Energies 2025, 18, 2482. [Google Scholar] [CrossRef]
  14. Grigorie, L.D.; Dima, D.S.; Romanescu, A.E.; Marin, M. Reconstruction of rollover collision using PC Crash 11.1 and 3D scanner. In The 30th SIAR International Congress of Automotive and Transport Engineering: Science and Management of Automotive and Transportation Engineering; Springer Nature: Berlin/Heidelberg, Germany, 2020; pp. 265–272. [Google Scholar]
  15. Tianbo, W.; Guofu, T.; Tao, W. Simulation analysis of side impact safety of a passenger car. J. Auto Sci. Technol. 2021, 1, 82–86. [Google Scholar]
  16. Shinagam, R.K.; Maruvada, T.; Janjeti, S.; Talari, R.M.D.; Shinaga, R.V. Development of a machine learning algorithm for efficient localization of damage in a composite structure using random forest technique. IJST-T Civ. Eng. 2024, 48, 4793–4799. [Google Scholar] [CrossRef]
  17. Assou, S.; Tourbier, Y.; Gstalter, E.; Charrier, M.; Dessombz, O.; Jézéquel, L. A reduced model using random forest: Application on car crash optimization. SeMA J. 2021, 78, 193–195. [Google Scholar] [CrossRef]
  18. Mejbel, B.G.; Sarow, S.A.; Al-Sharify, M.T.; Al-Haddad, L.A.; Ogaili, A.A.F.; Al-Sharify, Z.T. A data fusion analysis and random forest learning for enhanced control and failure diagnosis in rotating machinery. J. Fail. Anal. Prev. 2024, 24, 2979–2985. [Google Scholar] [CrossRef]
  19. Puxing, L.; Hong, Z.; Xiaolei, W. Application of safety level approach on deliberation of structural strength criteria of lifeboat in SOLAS. J. Ship Eng. 2018, 40, 6–11. [Google Scholar]
  20. Rama Krishna, S.; Sathish, J.; Tarun, M.; Sruthi Jones, V.; Raghu Vamsi, S.; Janu Sree, S. A support vector machine-based intelligent system for real-time structural health monitoring of port tower cranes. J. Fail. Anal. Prev. 2024, 24, 2543–2549. [Google Scholar] [CrossRef]
  21. Kashifi, M.T.; Al-Sghan, I.Y.; Rahman, S.M.; Al-Ahmadi, H.M. Spatiotemporal grid-based crash prediction—Application of a transparent deep hybrid modeling framework. Neural Comput. Appl. 2022, 34, 20655–20678. [Google Scholar] [CrossRef]
Figure 1. Frontal collision of vehicle with rigid wall.
Inventions 10 00040 g001
Figure 2. Frontal collision of two vehicles.
Inventions 10 00040 g002
Figure 3. Frontal offset collision of two vehicles.
Inventions 10 00040 g003
Figure 4. Side collision of two vehicles.
Inventions 10 00040 g004
Figure 5. Selection of front longitudinal beam points.
Inventions 10 00040 g005
Figure 6. Schematic of component positions.
Inventions 10 00040 g006
Figure 7. Vehicle relative displacement.
Inventions 10 00040 g007
Figure 8. Flowchart of RF algorithm prediction.
Inventions 10 00040 g008
Figure 9. Displacement data anomaly.
Inventions 10 00040 g009
Figure 10. Importance of characteristic variables.
Inventions 10 00040 g010
Figure 11. True values and errors for RF model.
Inventions 10 00040 g011
Figure 12. True values and errors for SVMR model.
Inventions 10 00040 g012
Table 1. Collision scenarios.
No.Collision Scenario
1Frontal Collision (100%) of Vehicle with Rigid Wall
2Frontal Collision (100%) of Two Vehicles
3Frontal Collision (50%) of Two Vehicles
4Side Collision of Two Vehicles
Table 2. Input values.
Collision ObjectCollision AngleCollision Offset (mm)Collision Speed (km/h)
1002.5
1007.5
00012.5
00017.5
00−50022.5
00−50027.5
090032.5
090037.5
Table 3. Output values (mm).
12345624
−2.141.02−35.82−2.020.49−35.52−50.56
−2.550.52−39.88−2.330.44−39.44−45.4
−22.196.98−62.01−18.16−0.14−51.66−26.66
−51.338.11−78.68−39.87−7.28−63.87−27.99
−42.9818.67−94.59−32.661.76−71.77−50.86
−79.6931.62−127.44−46.7−6.81−75.3−50.15
−34.88−82.347−65.496−34.03−72.563−66.232−122.02
−43.975−97.68−57.338−43.679−85.5−60.643−43.325
Table 4. Predicted values by various algorithms.
PointSimulated Displacement (mm)Predicted Displacement by RF (mm)Predicted Displacement by SVMR (mm)
1−27.79−23.61−24.63
2−100.03−87.38−80.27
3−20.72−18.78−16.91
4−83.1−73.96−67.64
5−18.43−16.55−15.62
6−63.08−56.63−52.48
7−20.54−18.63−15.58
8−53.63−47.48−43.39
9−0.81−0.71−1.02
10−69.12−54.52−54.57
11−2.15−2.22−0.72
12−62.01−54.17−51.18
13−4.95−5.712−7.09
14−61.74−54.04−50.16
159.284.654.30
16−54.15−48.9−50.76
172.39−2.66−2.07
18−47.74−43.12−40.18
19−13.2−18.38−21.47
20−47.8−43.30−41.28
21−4.48−5.19−5.81
22−37.44−37.05−45.04
23−2.21−2.56−3.81
24−33.47−34.2−36.15
Disclaimer/Publisher’s Note: The statements, opinions and data contained in all publications are solely those of the individual author(s) and contributor(s) and not of MDPI and/or the editor(s). MDPI and/or the editor(s) disclaim responsibility for any injury to people or property resulting from any ideas, methods, instructions or products referred to in the content.

