1. Introduction
The discovery of the rechargeable LiCoO
2 cathode for lithium-ion batteries (LIBs) at the end of the 1970s [
1] ushered in a new era of portable clean energy storage. Since then, LIBs have been adapted and utilized extensively, powering everything from portable devices to vehicles to sectors of the power grid. However, the limited storage capacity of the LIBs has spurred intense interest in the cheaper sodium-ion batteries (SIBs). A key factor in this connection is the choice of the anode material because the widely used graphite anode in commercial LIBs possesses a relatively low capacity of 372 mAh∙g
−1, and it also has a very limited capacity for storing Na ion [
2,
3]. Further improvements in performance of Li/Na-ion batteries call for a search for other advanced electrode materials for both the cathode and the anode.
In order to ameliorate the deficiencies of the graphite anode, materials beyond graphene provide a promising new pathway. In this connection, two-dimensional transition metal dichalcogenides (2D-TMDs) have gained attention as a possible replacement for graphite as the anode material due to their large surface to volume ratio, which is predicted to provide high Li and Na capacities [
4,
5] and low diffusion barriers to enable high cycling rates [
6,
7]. 2D-TMDs, with the general formula MX
2, where M denotes a transition metal atom (e.g., Mo or W) and X a chalcogen atom (S, Se, or Te), are layered materials composed of planar sheets with strong in-plane bonds and layers bonded weakly by van der Waals interactions, facilitating the isolation of single or few layers similar to graphene. The coordination of the chalcogens to the metal atoms can either be trigonal-prismatic or octahedral, producing semiconducting or metallic behavior, respectively. The metallic 1T phase of MoS
2 has shown promise as an anode material due to its high electrical conductivity that promotes the performance of the battery and eliminates the use of conductive additives [
8].
This paper discusses experiments performed on a 1T-MoS2 anode, along with parallel first-principles calculations based on the density functional theory (DFT). We systematically studied the intercalation of Li and Na into a 1T-MoS2 matrix for various concentrations. For low Na or Li concentration, AXMoS2 (A = Li, Na) shows good conductivity with a relatively large electrode voltage. At x = 1, 1T-MoS2 develops a band gap concomitant with the appearance of a Jahn–Teller distortion driven by changes in d-electron count, which can be mitigated via disorder to restore the good conductivity of the anode. For x > 1, the anode is always found to be metallic, and here we introduce a Na multilayer model to understand this high-capacity regime.
2. Materials and Methods
Computational—The ab initio calculations were performed using the pseudopotential projected augmented wave method [
9] implemented in the Vienna ab initio simulation package [
10,
11] with an energy cutoff of 400 eV for the plane-wave basis set. Exchange-correlation effects were treated using the generalized gradient approximation (GGA) [
12], and van der Waals corrections were included using the DFT-D2 method of Grimme [
13], where a 14 × 14 × 7 Γ-centered k-point mesh was used to sample the Brillouin zone. A large enough vacuum of 15 Å in the z direction was used to ensure negligible interaction between the periodic images of the Na layer doubled MoS
2 thin film. All the structures were relaxed using a conjugate gradient algorithm with an atomic force tolerance of 0.01 eV/Å and a total energy tolerance of 10
−6 eV.
Experimental—MoO3 (18 mg, Fisher Scientific, Hampton, NH, USA), thioacetamine (21 mg, Sigma-Aldrich, St. Louis, MO, USA), and urea (0.15 g, Sigma-Aldrich, USA) were dissolved in ethanol (15 mL) and stirred for 1 h. Then the solution was transferred to a Teflon-lined stainless-steel autoclave. The autoclave was kept in a furnace for 16 h at 200 °C. After cooling to room temperature, the product was washed with ethanol a few times and dispersed in ethanol for future use.
Structural and Physical Characterization—The morphology of the as-prepared MoS2 was characterized by scanning electron microscopy (SEM) (Hitachi S4800) and transmission electron microscopy (TEM) (JEOL 1010). Raman spectroscopy was carried out on a Thermo Scientific DXR with 532 nm laser excitation. The set up for the in-situ Raman is a three-electrode cell with optical window from EL-CELL.
Electrochemical Measurement—Standard CR2025-type coin cells were assembled to measure the electrochemical performance of the as-synthesized metallic MoS2. The metallic MoS2 electrodes were directly assembled into the coin cells in an argon filled glove-box, using 1M NaPF6 dissolved in ethylene carbonate (EC) and dimethyl carbonate (DMC) (1:1 vol/vol) as an electrolyte. Cyclic voltammetry (CV) and electrochemical impedance spectra (EIS) were measured using a biologic SP-150. Galvanostatic charge–discharge tests were performed on a multichannel battery testing system (Land CT2001A).
3. Results and Discussion
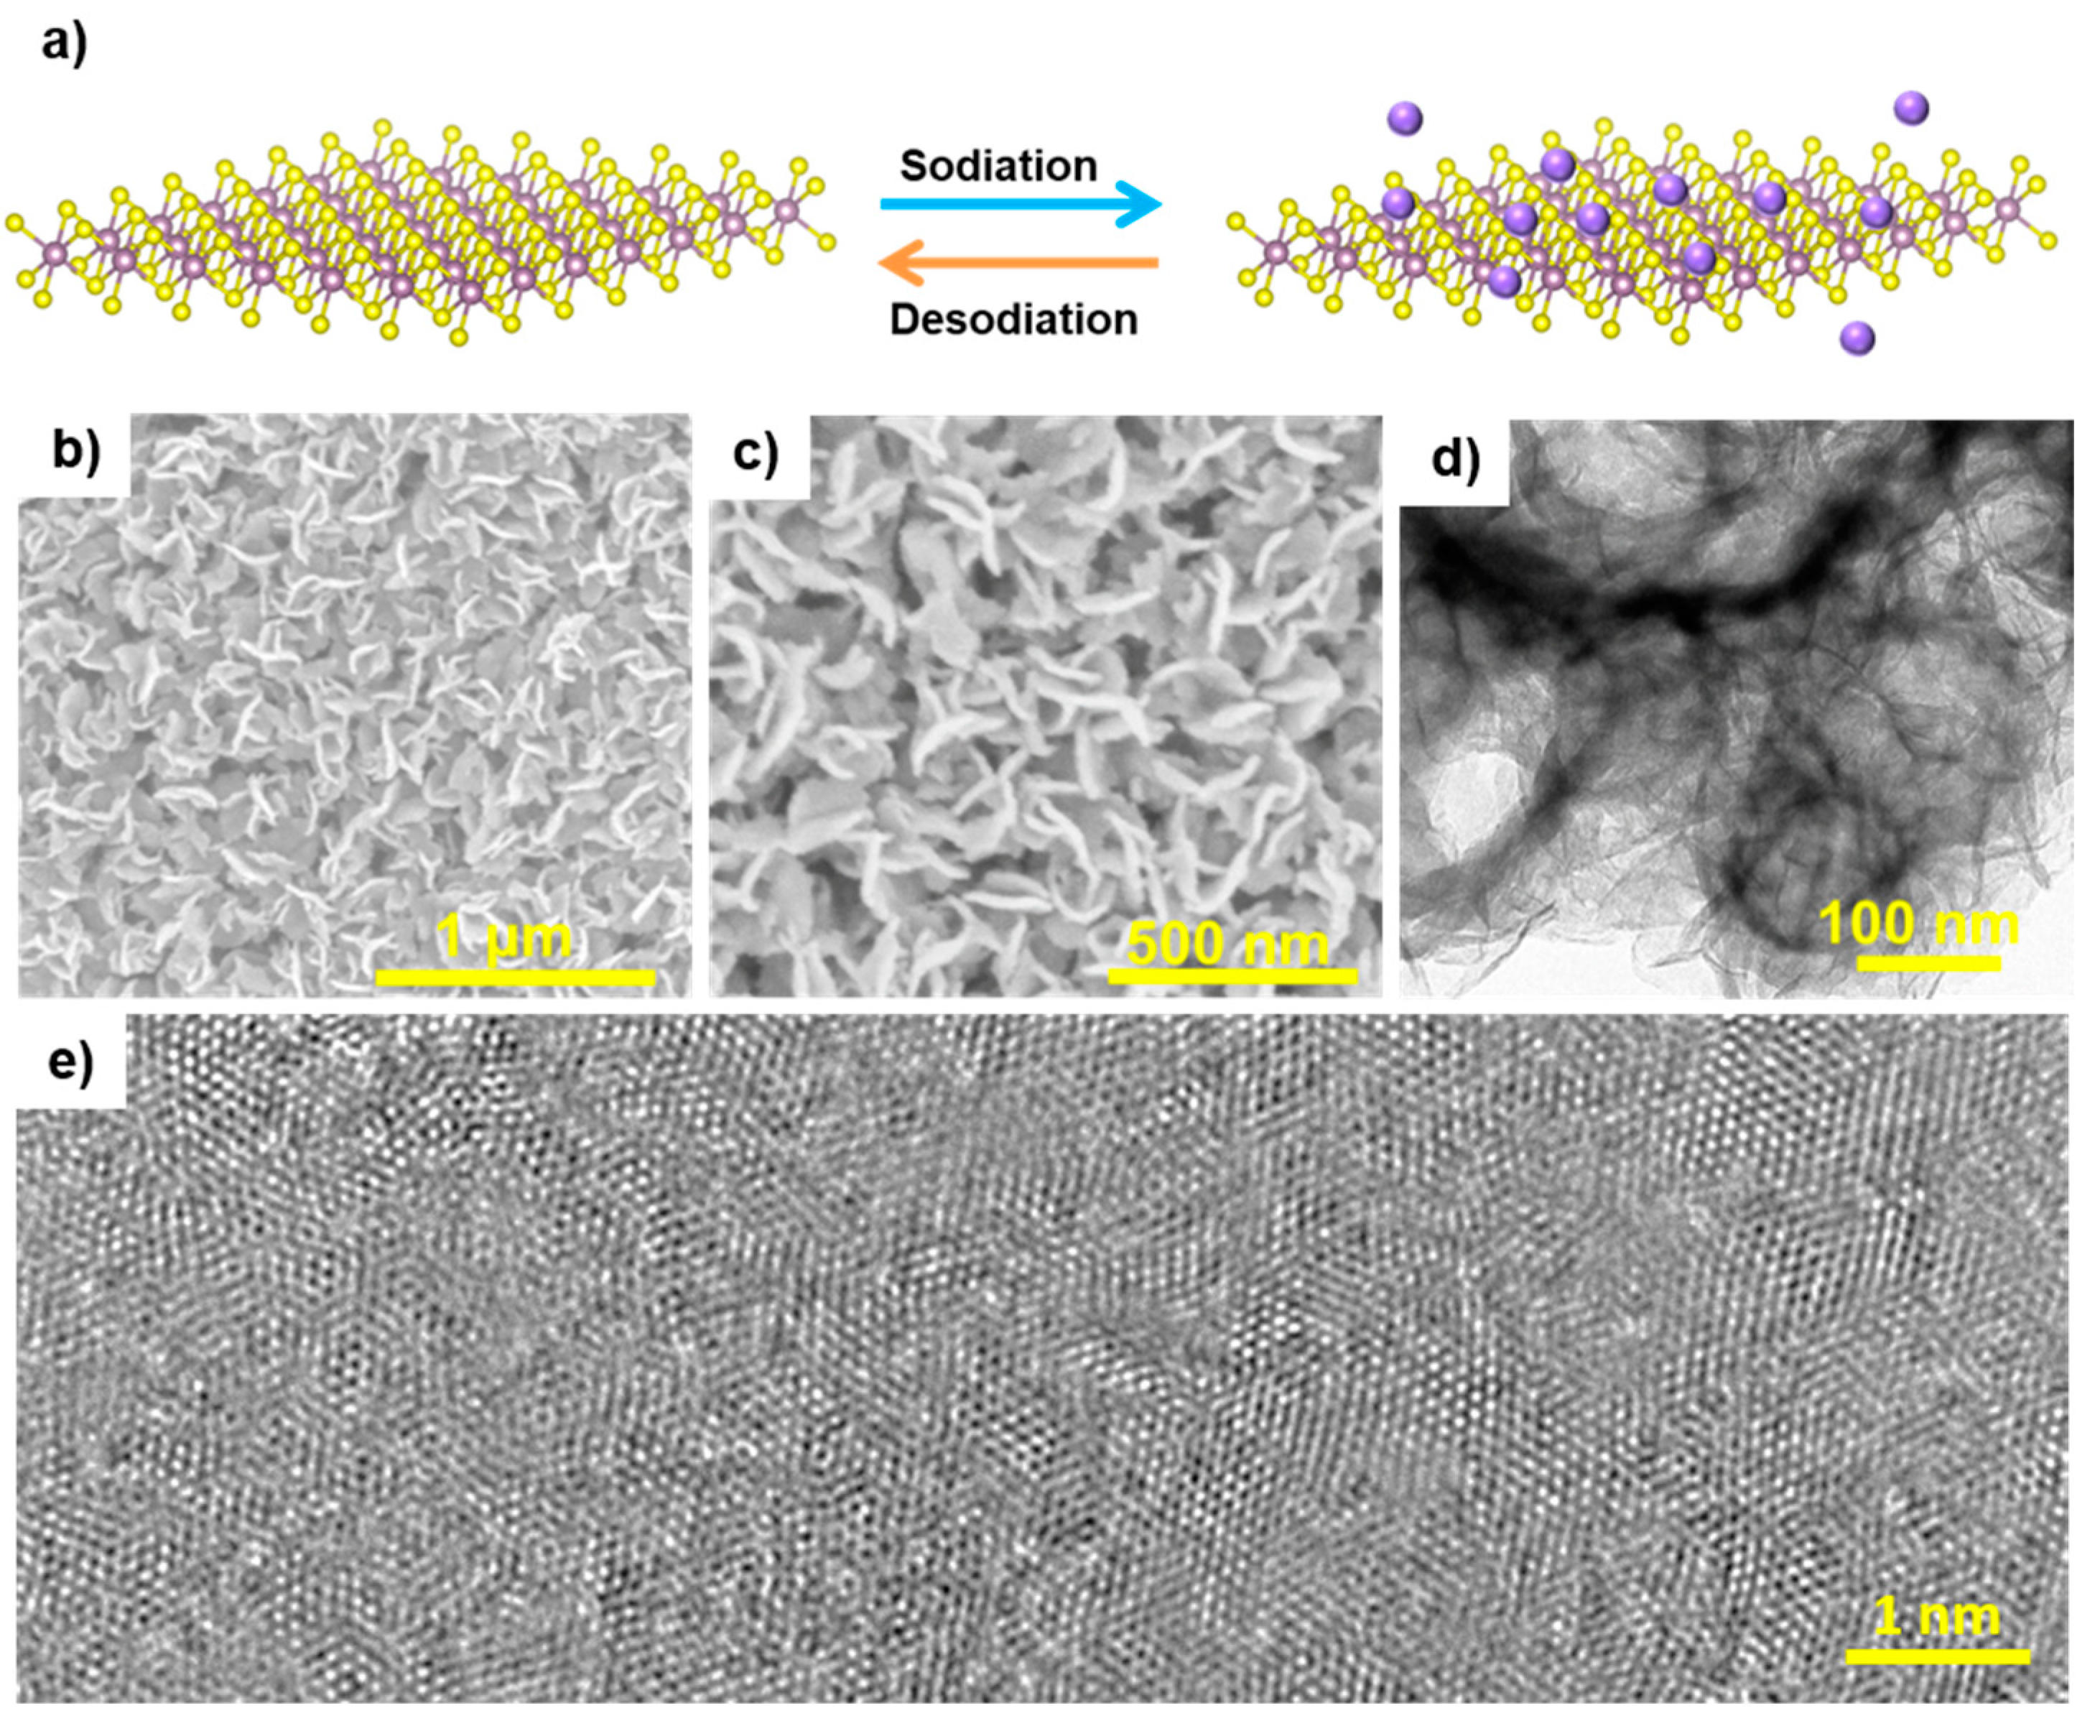
Figure 1a shows a schematic of the sodiation–desodiation process of a 1T-MoS
2 electrode prepared following the method described in Ref. [
8]. The morphology of this electrode has been characterized by scanning electron microscopy (SEM) and transmission electron microscopy (TEM).
Figure 1b,c is the SEM images of 1T-MoS
2, which show the presence of lamellar structures with a vertically arrayed structure. The formation of an open structure of 1T-MoS
2 nanosheets favors the accessibility of the Na ions. Moreover, the TEM image (
Figure 1d) shows that 1T-MoS
2 nanosheets are uniformly distributed in agreement with the SEM results (
Figure 1d). Finally,
Figure 1e provides a high resolution TEM image of the atomic lattice.
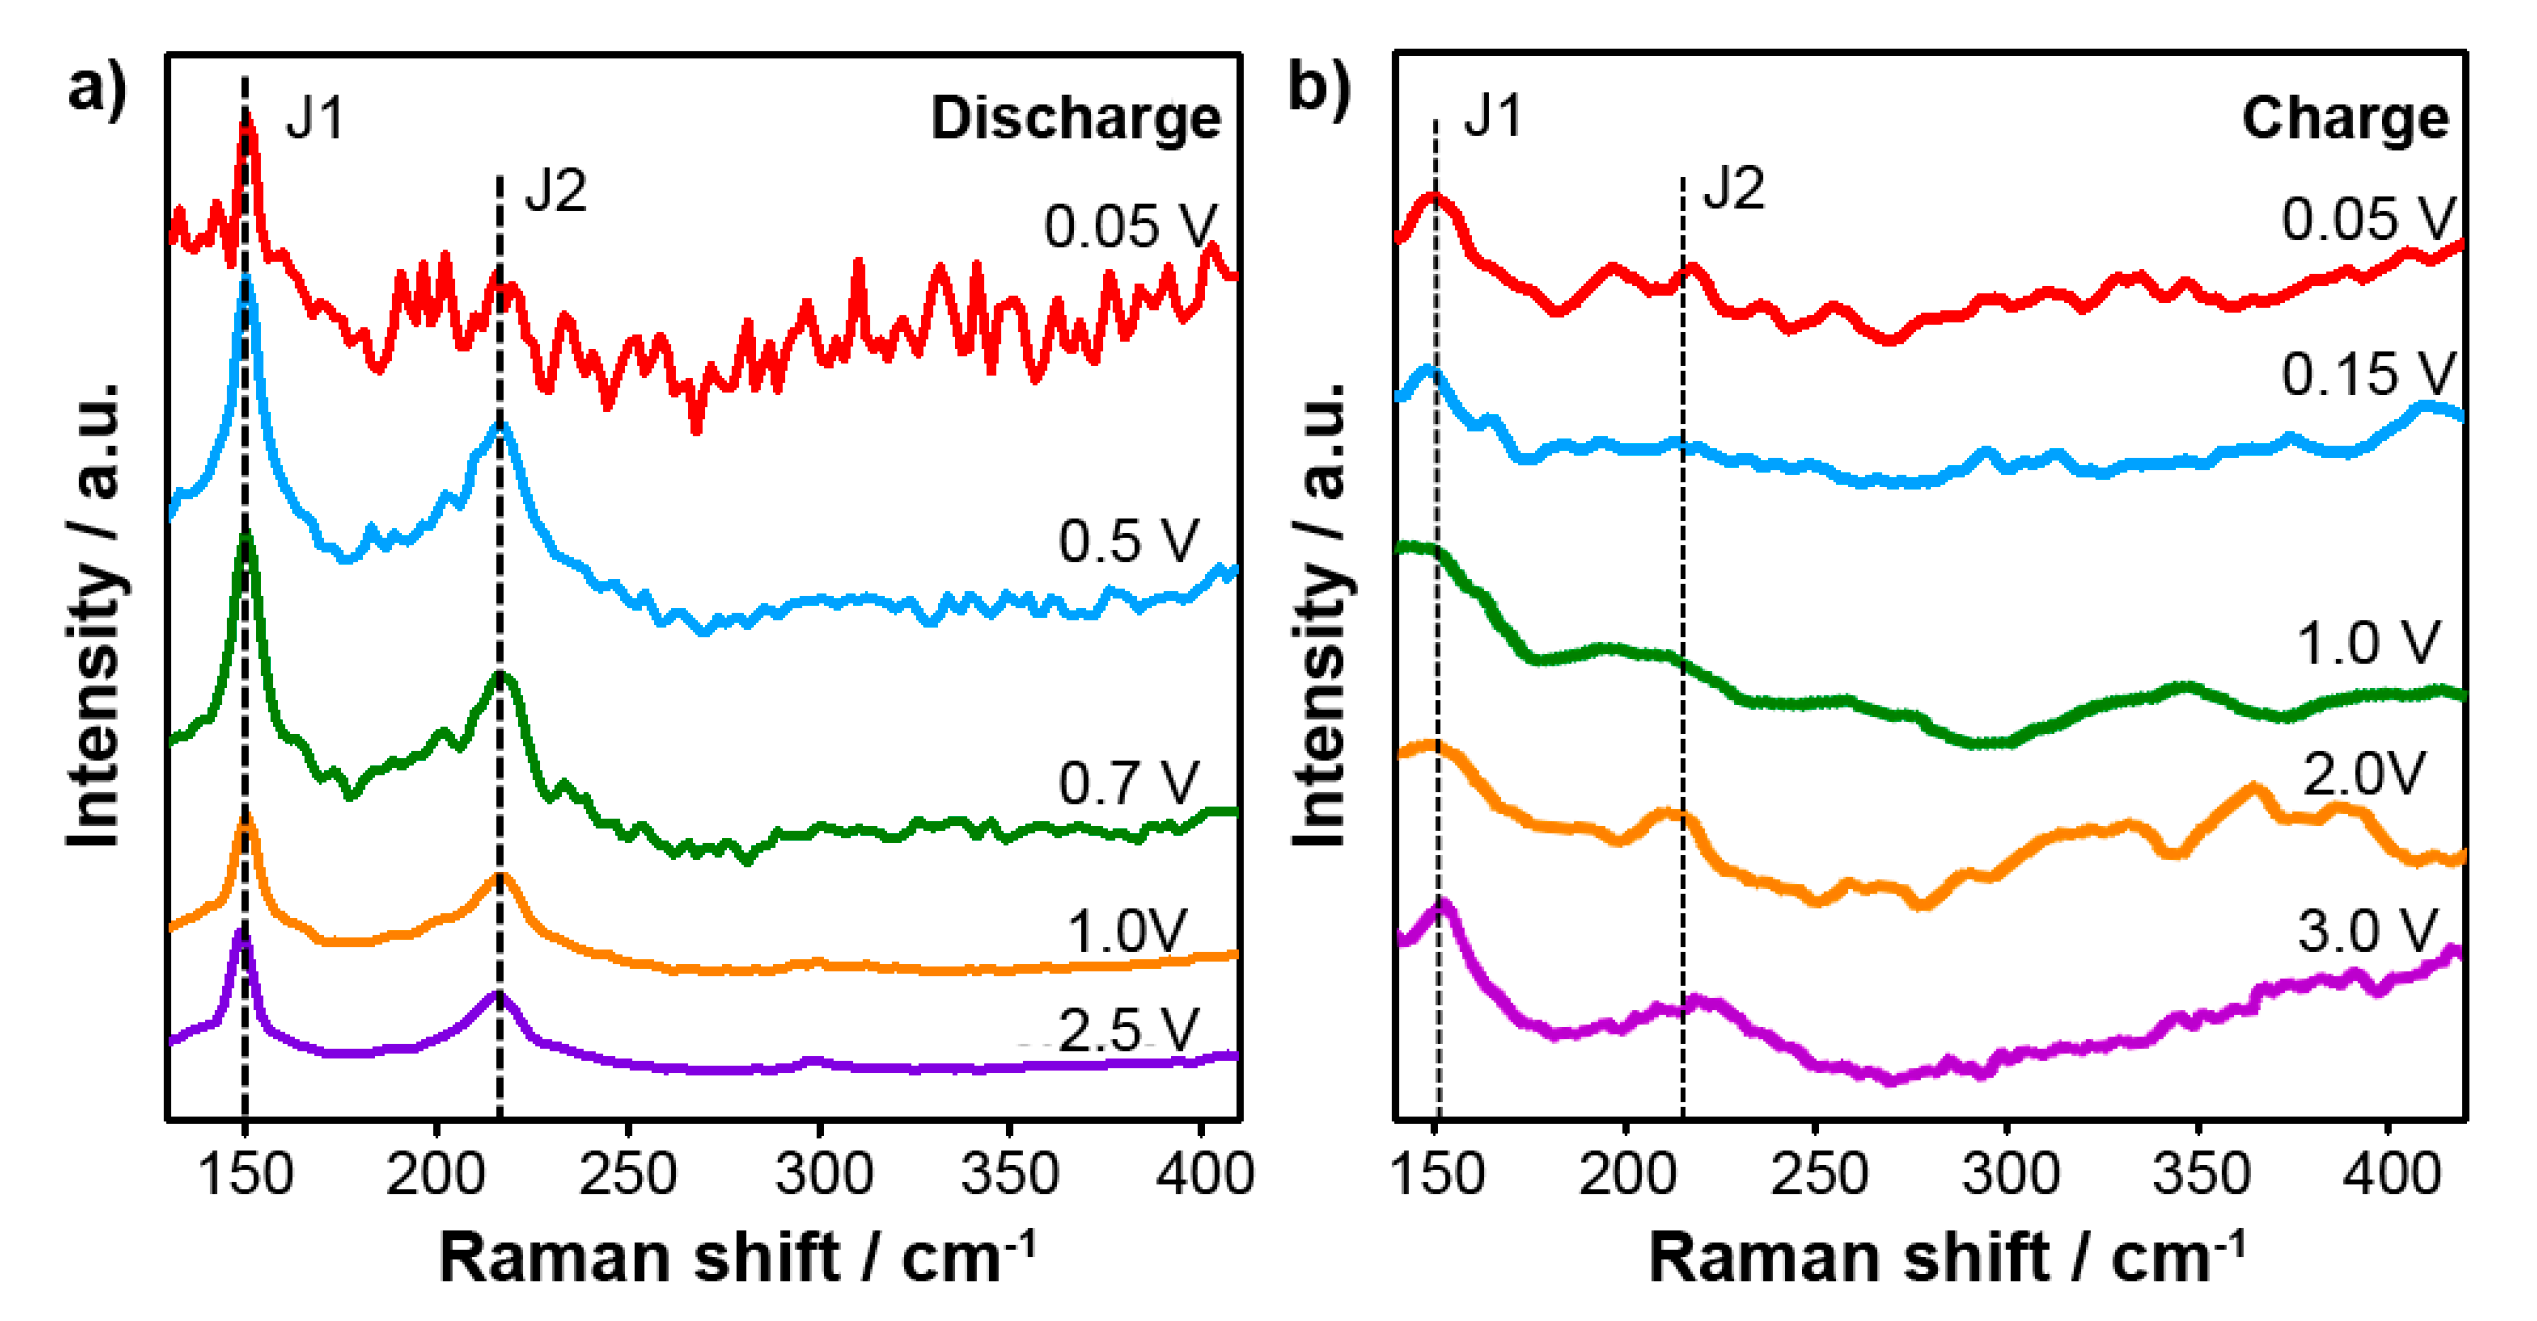
In-situ Raman spectroscopy in a specially designed cell with an optical window provides further insight into intercalation mechanism of Na ion.
Figure 2a shows the in-situ Raman spectra collected at various cut-off potentials during the first discharge process. The two major peaks at 150 cm
−1 (J1) and 220 cm
−1 (J2) can be seen, which originate from the phononic modes of the metallic 1T-MoS
2 [
14,
15,
16]. When discharging the cell from 2.5 V to 0.05 V, the J1 and J2 Raman peaks remain without the appearance of any other significant features, suggesting that the 1T-MoS
2 structural phase does not change.
Figure 2b presents the Raman spectra during charging from 0.05 V to 3.0 V. Again, the J1 and J2 peaks are clearly seen, confirming the stability of the metallic 1T-MoS
2 anode during charging. Beyond the robust presence of the J1 and J2 peaks, other weak peaks can be seen in the Raman spectra during charge/discharge in
Figure 2. We believe that these spectral features are due to the electrolyte or background, but further study is needed to determine their origin. The composition of the electrolyte is 1M NaPF
6 dissolved in ethylene carbonate (EC) and dimethyl carbonate (DMC) (1:1 vol/vol).
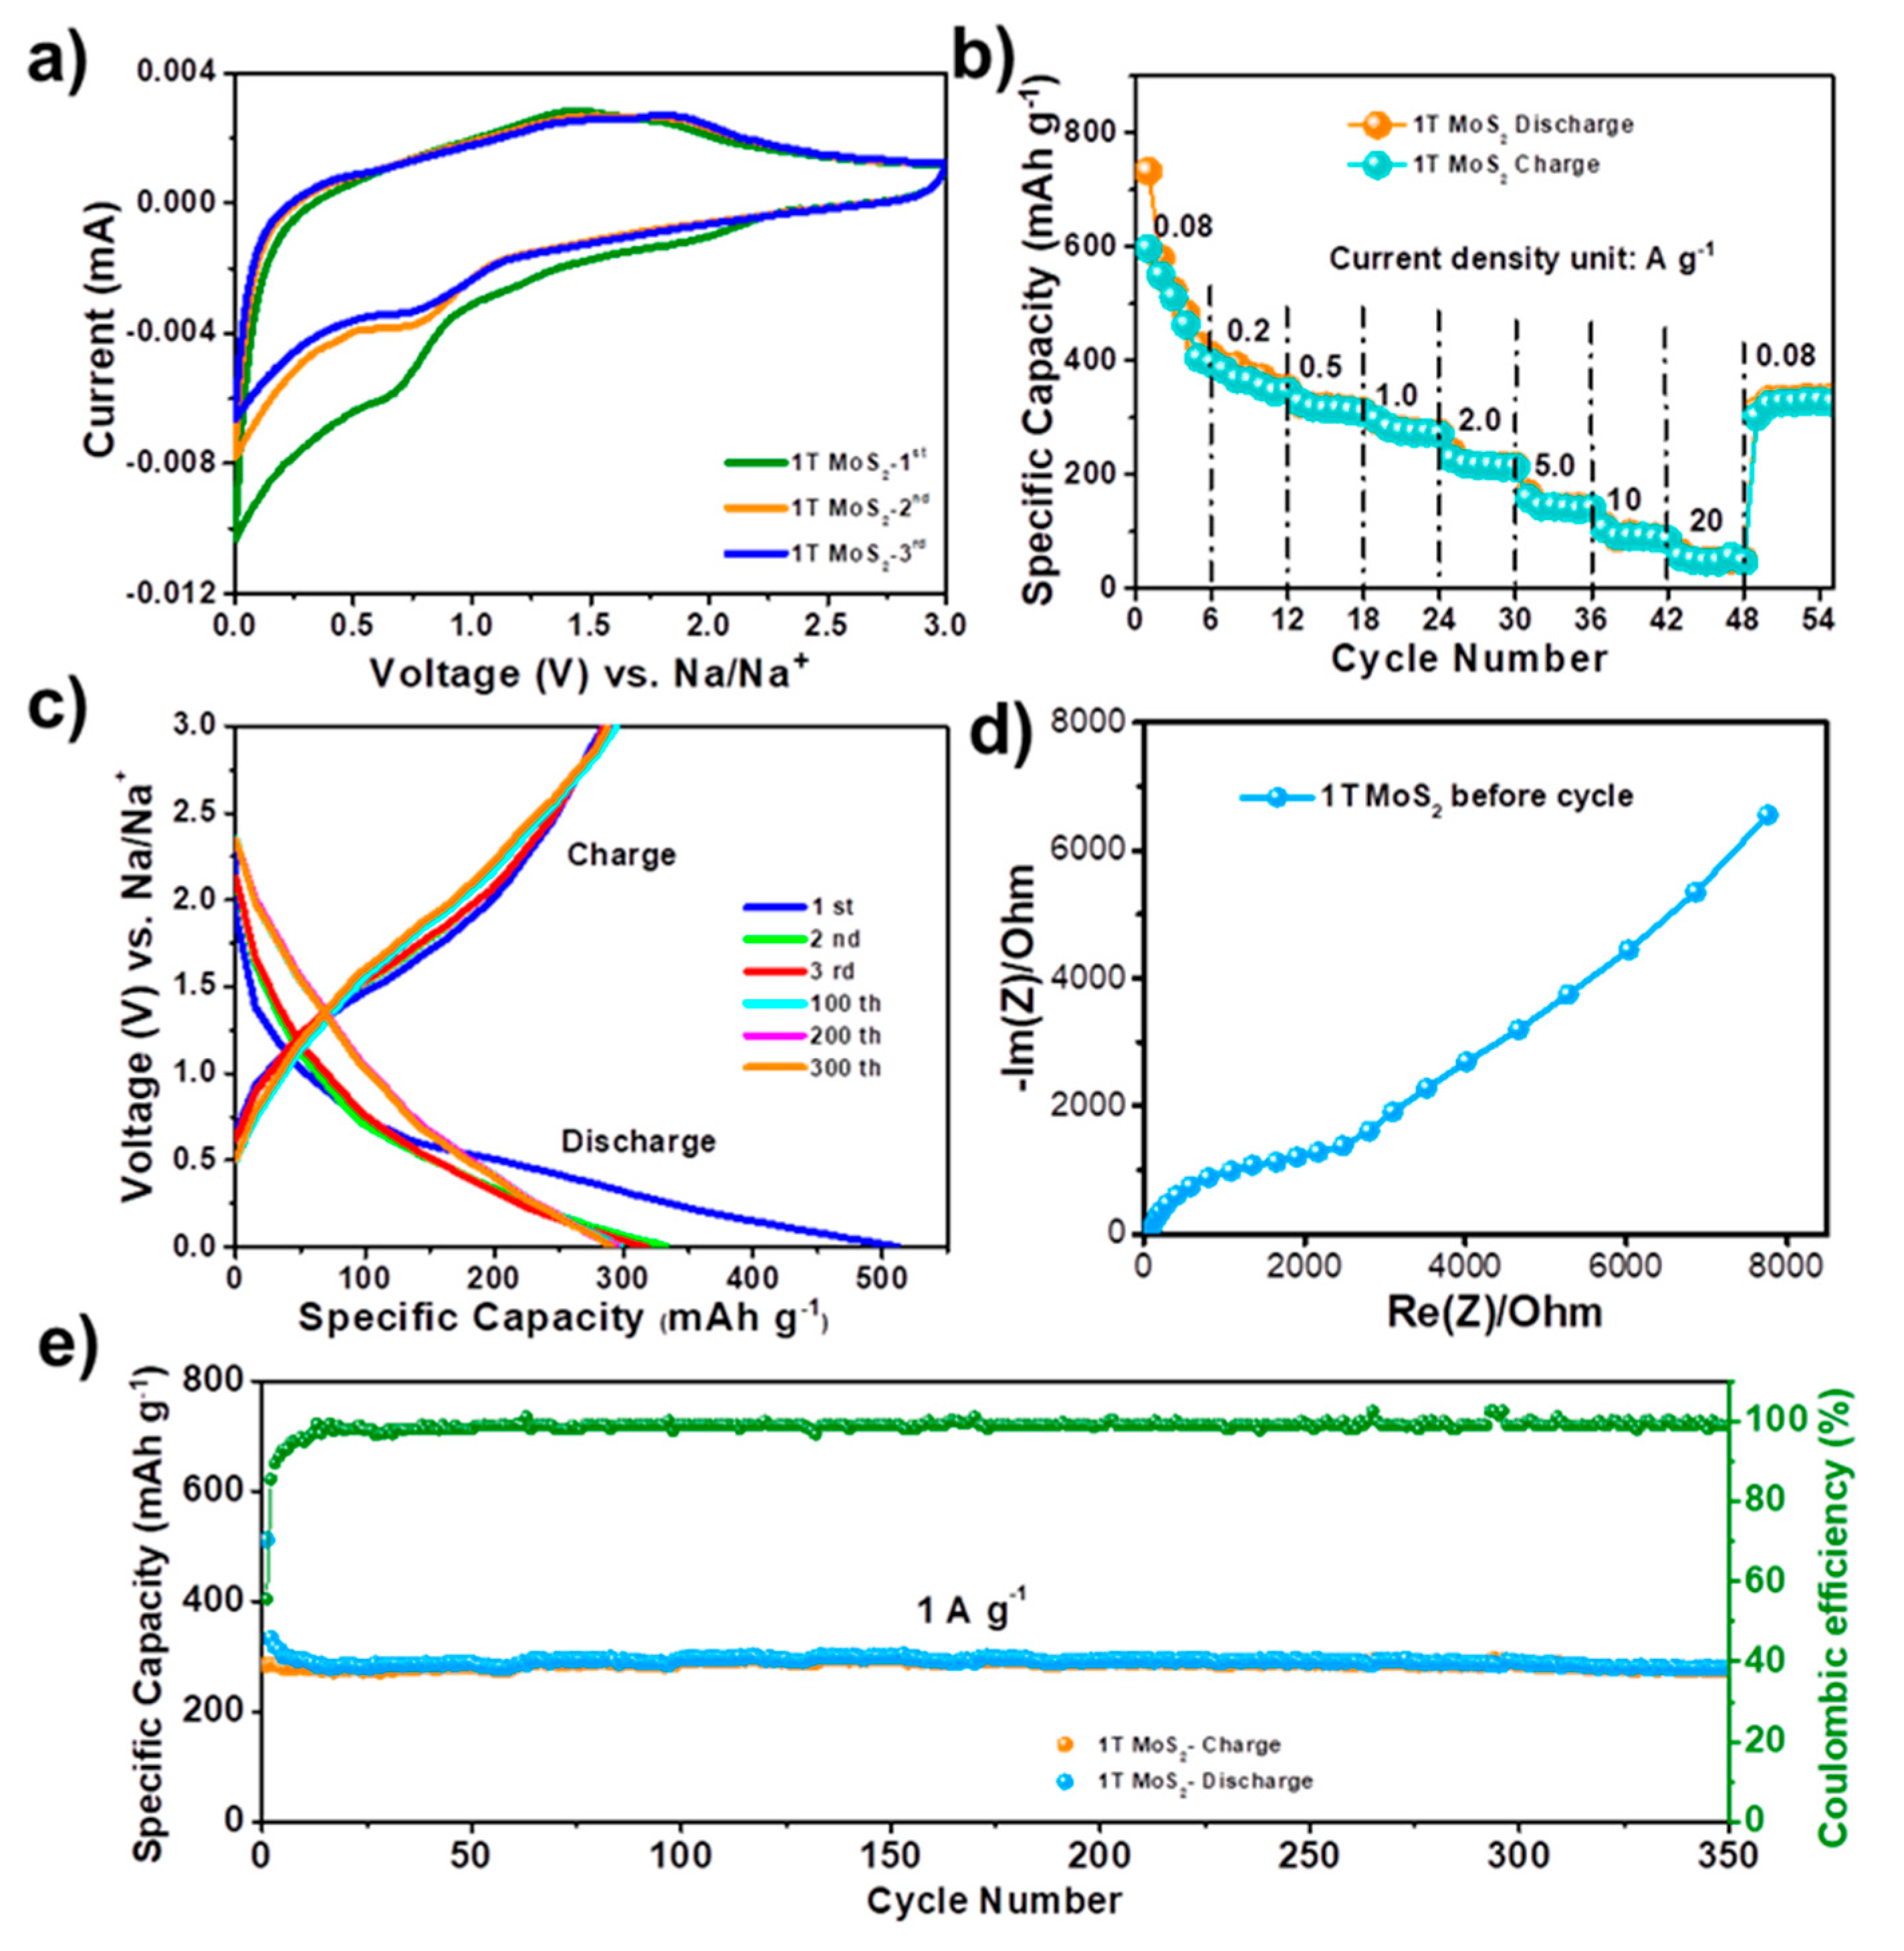
Figure 3 displays the electrochemical performance of the 1T-MoS
2 for Na ion storage. Due to its good electronic conductivity, 1T-MoS
2 can be directly coated on the stainless-steel current collector to work as anode without conductive additive and binder.
Figure 3a shows the cyclic voltammetry (CV) curves of 1T-MoS
2 anode in initial three cycles at a scan rate of 0.1 mV∙s
−1 between 0.01 and 3.0 V (vs. Na
+/Na). The first cycle is clearly different from the second and third cycles due to the formation of an irreversible solid-electrolyte-interface (SEI) film.
Figure 3b shows the rate performance of the battery. The reversible capacity is 597, 384, 326, 297, 228, 159, 106, and 56 mAh∙g
−1 at current densities of 0.08, 0.2, 0.5, 1.0, 2.0, 5.0, 10, and 20 A∙g
−1, respectively. The 1T-MoS
2 electrode can reach a reversible capacity of 330 mAh∙g
−1 when the current density goes back to 80 mA∙g
−1 even after cycling at high current densities.
Figure 3c gives galvanostatic charge–discharge profiles of the 1T-MoS
2 anode in different cycles at the current density of 1 A∙g
−1. The initial coulombic efficiency is 57%, which is associated with SEI formation in the first cycle.
Figure 3d shows the Nyquist plot of the battery. The cycling performance of 1T-MoS
2 under the high current density of 1 A∙g
−1 maintain 394 mAh∙g
−1 after 350 cycles as illustrated in
Figure 3d.
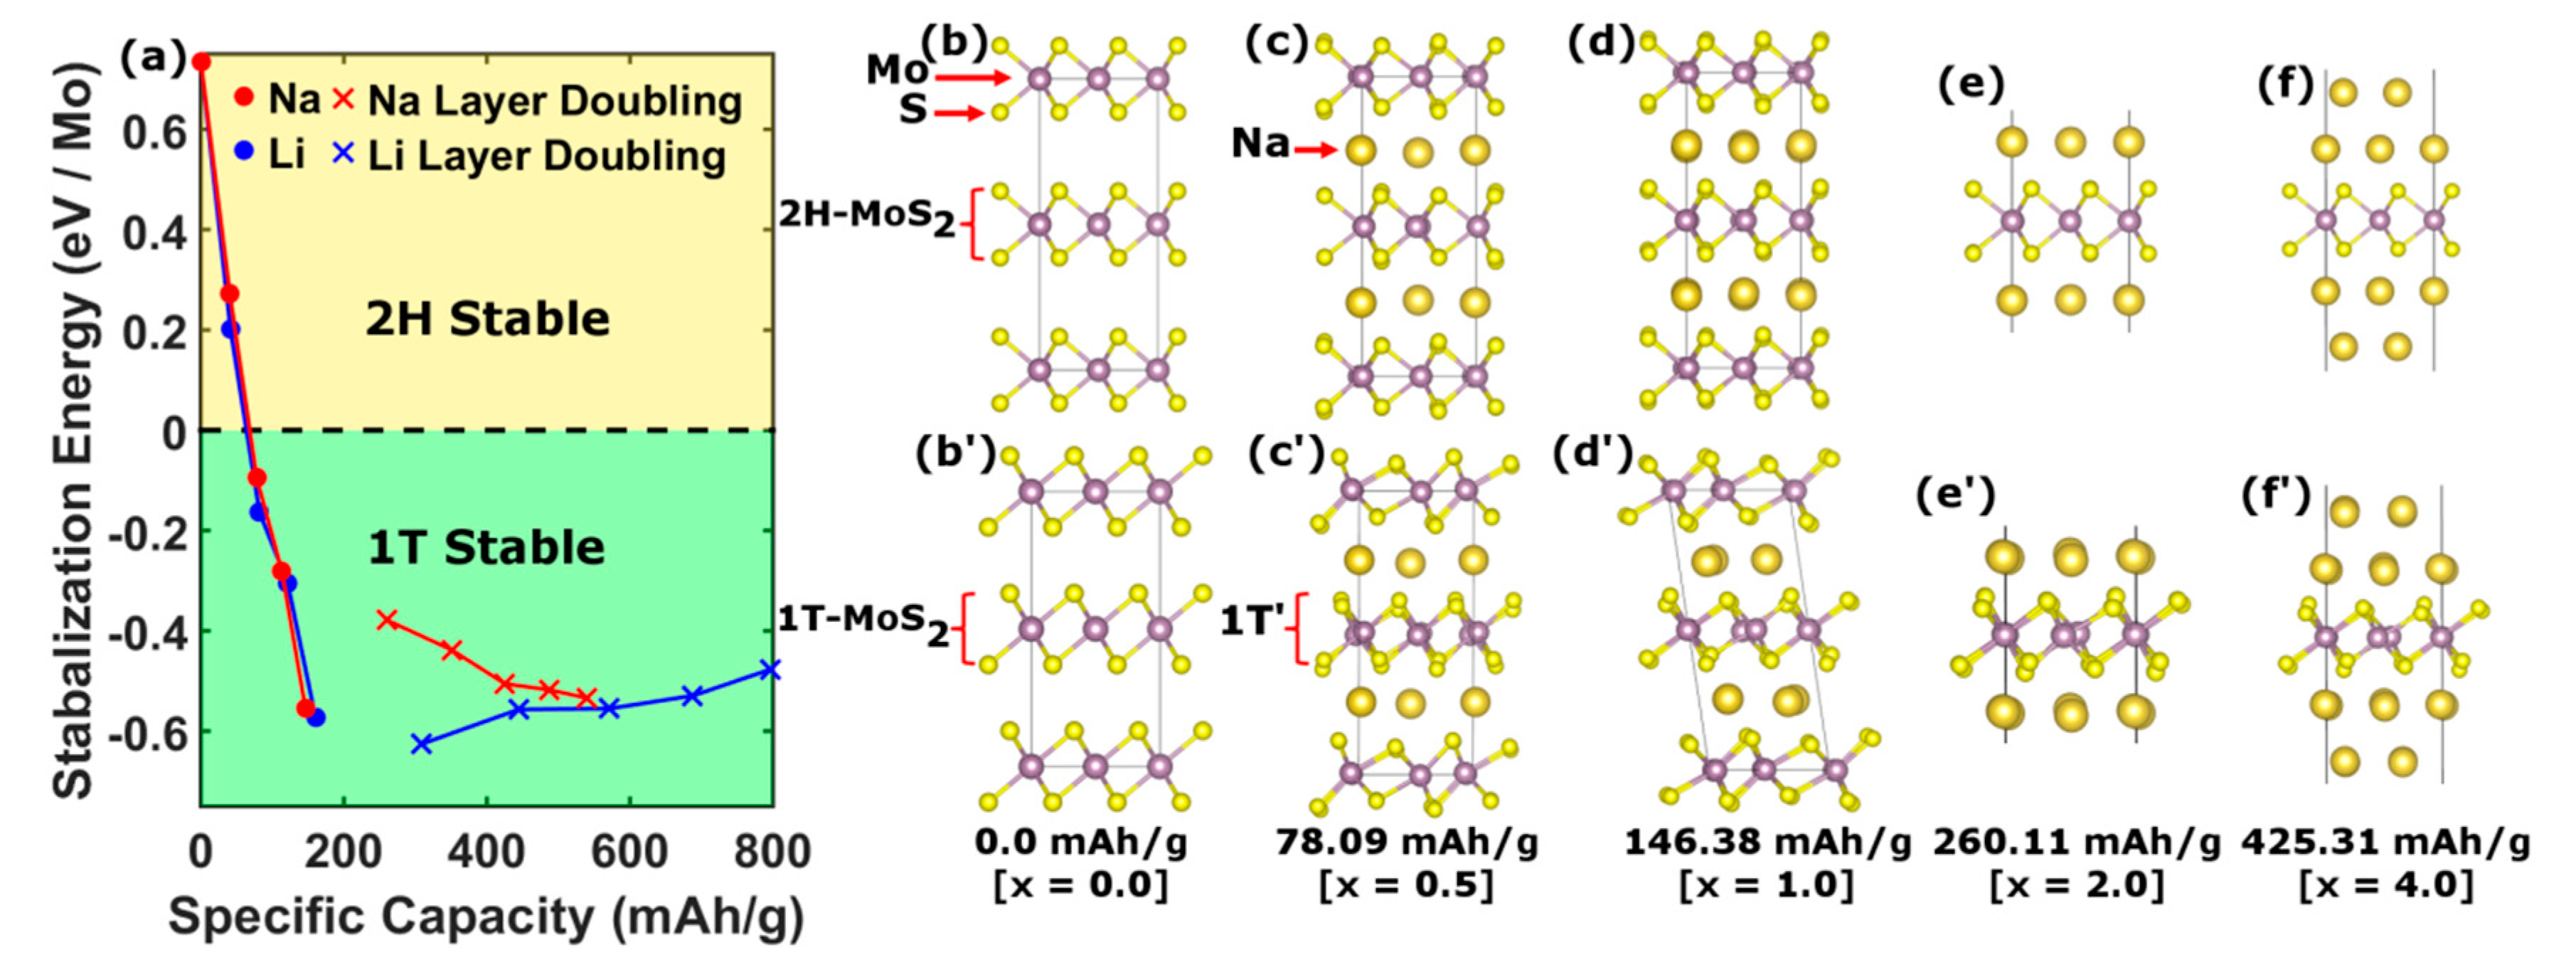
One of the main theoretical questions surrounding the use of TMDs as anode material in Na ion batteries is the phase stability of the 2D framework under intercalation. For this purpose, we examine the consequences of using 1T-MoS2 over the conventional 2H phase for various concentrations of Na ion via ground state, first-principles calculations to address the structural and electronic stabilities of these phases.
For specific capacities over the range 0–146 mAh∙g
−1, we considered a 4 × 4 supercell of A-A stacked pristine 1T- and 2H-MoS
2 structures, as shown in
Figure 4b’,b respectively, where the Mo atom (purple sphere) in the 2H structure is trigonal-prismatically coordinated with S (yellow sphere), while in the 1T phase it is octahedrally coordinated. Under intercalation, the structures are relaxed upon Na (Li) ion insertion by minimizing the total energy (
Figure 4c,d,c’,d’), as in [
17].
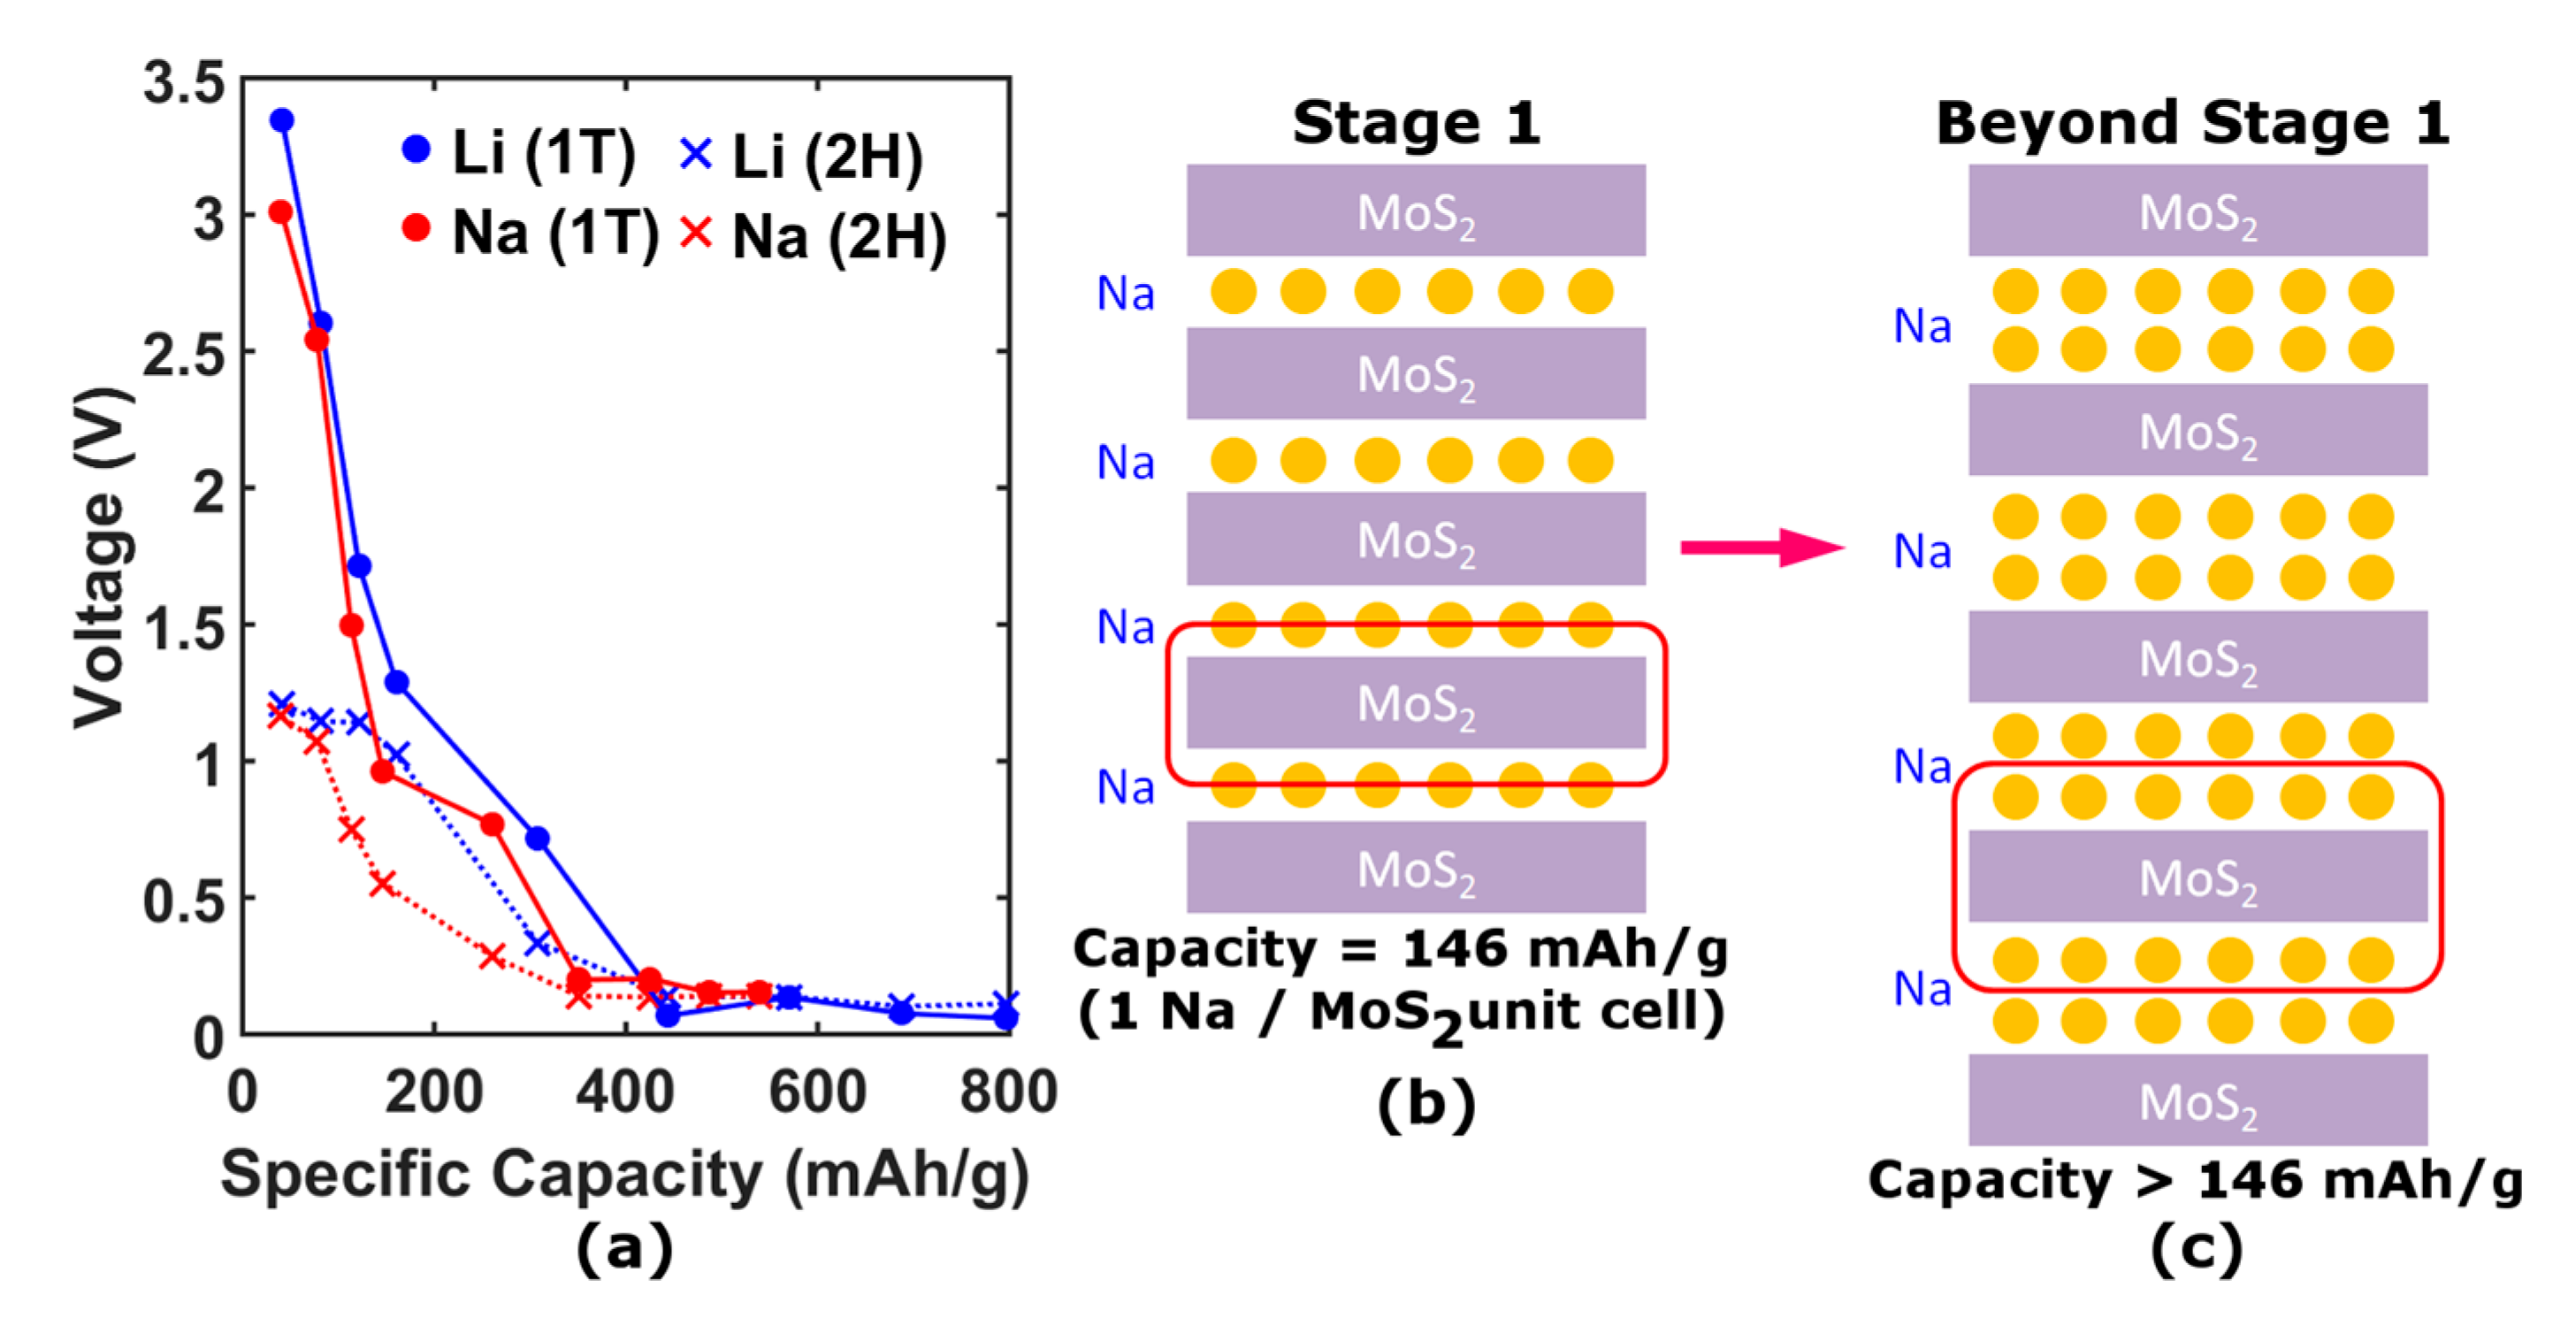
For specific capacities greater than 146 mAh∙g
−1, the MoS
2 unit cell must contain more than one Na atom. By considering the transition from the usual stage 1 arrangement (
Figure 5b) to a configuration with multiple layers of Na between the MoS
2 sheets [
18] (
Figure 5c), capacities greater than 146 mAh∙g
−1 can be achieved. Furthermore, in the presence of extra Na layers, the MoS
2 sheets only weakly interact through van der Waals inter-sheet forces. Thus, this regime can be modeled by considering just a single MoS
2 sheet with successive layers of Na, as shown in
Figure 4e,f,e’,f’. The enhancement in capacity has previously been explained by a redox process wherein the Na
xMoS
2 compound is decomposed into metallic Mo and a hexagonal Na
xS complex [
19]. However, due to the persistence of the J1 and J2 peaks in the Raman spectra (
Figure 2) and the continued high capacity cycling as seen in
Figure 3c, this redox process can be ruled out in favor of an intercalation mechanism.
In order to compare the structural stability of the 2H and 1T phases, we calculated the stabilization energy defined as the difference in total energies per molybdenum atom, E
s = E
2H − E
1T as a function of ion intercalation.
Figure 4a compares the stabilization energies so obtained for both Na (red) and Li (blue) intercalation. The stability of the 2H phase is seen to decrease with ion concentration up to stage 1. In contrast, the stabilization energy for the 1T phase is found to increase with Na concentration, becoming the ground state for specific capacities above 51.98 mAh∙g
−1. This result suggests that 1T-MoS
2 is an attractive anode material since it avoids complications derived from structural phase transitions under cycling.
Physically, the stabilization of the 1T phase is mainly driven by a buckling of the Mo layer. The ground state coordination of the transition metals in TMDs varies systematically with d electron count. For instance, Group 4 metals are all octahedrally coordinated and Group 5 metals mostly have octahedral structures, although some are trigonal-prismatically coordinated. For Group 6 metals, however, the trigonal coordination is dominant with few octahedral exceptions. Group 7 metals form distorted octahedra, where the distortion is characterized by the transition metal slipping off the center of the regular octahedra in such a manner as to form infinite one-dimensional diamond chains. This phase is designated as 1T’ [
20]. Therefore, as Na ions are introduced into the 1T-MoS
2 matrix, electronic carriers accumulate in the Mo d-t
2g states, effectively changing the d-electron count. This intercalation thus transforms Mo from a Group 6 to an effective Group 7 transition metal, thereby inducing Mo-Mo buckling characteristic of the 1T’ phase. As elucidated by Kertesz and Hoffmann [
21], the 1T’ phase of ReS
2 is described by a Jahn–Teller distortion in analogy to the degenerate orbitals in C
4H
4. Here, the experimental stabilization of the 1T’ phase is confirmed by the presence of the J1 and J2 peaks in the Raman spectra (
Figure 2), which originate from the phononic modes of the one-dimensional diamond chains [
14,
15,
16]. These modes are continually observed up to high capacity, confirming the robustness of the 1T’ structure.
Figure 5a shows the calculated voltage measured with respect to bulk Na (Li) as a function of specific capacity for each structural phase. Both phases generally exhibit trends in voltage-capacity curves similar to those seen in experiments, although the 1T’ phase exhibits a larger initial voltage in agreement with experiment. In the high capacity regime, the voltage is found to level out and become marginal, indicating negligible formation energy gained per additional Na atom as in the experiment, validating the Na multi-layer model. We also found a sensitive dependence of the voltage on the in-plane Mo-Mo buckling.
Figure 6 shows the site-projected density of states (DOS) for various Na concentrations in the 2H and 1T phases. As expected, the 2H phase is initially semiconducting with a band gap of 1.0 eV. Doped electrons introduced by Na filling in the conduction band of the pristine material follow a simple rigid band model. The metallic character of the states is maintained up through high Na concentrations. The DOS in the 1T’ phase retains a predominant metallic character except at a few particular fillings such as x = 1 due to a reorganization of the t
2g states induced by the Jahn–Teller distortion. However, this band gap is not robust against disorder effects present in the real material, leaving the macroscopic system mostly metallic over the full range of Na concentrations. The observed good electron transport in the anode is thus explained by the predominantly metallic character of the material.

 ,
, 