1. Introduction
High precision measurements of soft X-rays represent still today a very big challenge; nevertheless, such kind of measurements are strongly demanded in many fields of fundamental science, from particle and nuclear physics to quantum mechanics, as well as in astronomy and in several applications using synchrotron light sources or X-ray Free Electron Lasers (X-FEL) beams, in biology, medicine and industry. For several of these applications, in particular for nuclear physics experiments like those involving the measurement of exotic atoms’ radiative transitions, the detection of photons isotropically emitted from extended (non point-like) targets is required. Among the typically used solid state large area spectroscopic detectors, the Silicon Drift Detectors (SDDs), recently employed by the SIDDHARTA experiment [
1] for exotic atoms’ transition lines measurements at the
collider of the INFN National Laboratories of Frascati [
2] represent the best options for wide and isotropic targets, in terms of energy resolution. The intrinsic resolution of such kind of detectors is nevertheless limited to ≃120 eV FWHM at 6–8 keV by the Fano Factor, making them unsuitable for those cases in which the photon energy has to be measured with a precision below 1 eV.
The superconducting microcalorimeters’ Transition Edge Sensors (TES), recently developed at NIST [
3], represent a real possibility to obtain few eV FWHM at 6 keV; however, these kinds of detectors still have some limitations: a very small active area, prohibitively high costs of the complex cryogenic system needed to reach the operational temperature of ≃50 mK, and a response function which is still not properly under control.
A further alternative is represented by Bragg spectroscopy, one of the best established high resolution X-ray measurement techniques, where the X-ray energy spectrum can be otained exploiting photon reflection on crystals following the Bragg rule
, where
n is an integer number (order of reflection),
is the photon wavelength,
d is the crystal lattice constant and
is the photon impinging angle on the crystal surface. If a monochromatic parallel X-ray beam has to be measured, the spectrum is obtained by several measurements with different
values around the nominal Bragg angle
; on the contrary, if one needs to measure a polychromatic or isotropic beam of photons, the spectrum is obtained in one shot with a single
using a position detector. In the first case, higher resolutions can be obtained with the drawback of a longer data taking; in the second case, in which the measurements presented in this work fall into, the faster exposure time is balanced by a higher background due to the beam divergence and the source size. As a consequence, when the photons emitted from extended isotropic sources (like a gaseous or liquid target) have to be measured, this method has been until now ruled out by the constraint to reduce the dimension of the target to a few tens of microns [
4,
5].
Experiments performed in the past at the Paul Scherrer Institute (PSI), measuring pionic atoms [
6,
7], pioneered the possibility to combine Charged Coupled Device detectors (CCDs) with silicon crystals, but the energy range achievable with that system was limited to few keV due to the crystal structure, and the silicon low intrinsic reflection efficiency required the construction of a very large spectrometer. The possibility to perform other fundamental measurements, like the precision determination of the
mass measuring the radiative kaonic nitrogen transitions at the
collider [
8], has been also investigated, but the estimated efficiency of the proposed spectrometer was not sufficient to reach the required precision.
In the last several decades, the development of the Pyrolitic Graphite mosaic crystals [
9,
10,
11] renewed the interest in Bragg spectrometers as possible candidates also for millimetric isotropic sources’ X-ray measurements. Mosaic crystals consist of a large number of nearly perfect small pyrolitic graphite crystallites, randomly misoriented around the lattice main direction; the FWHM of this random angular distribution is called mosaicity (
) and it makes it possible that even a photon not reaching the crystal with the exact Bragg energy-angle relation can find a properly oriented crystallite and be reflected [
12]. This, together with a lattice spacing constant of 3514 Å, enables them to be highly efficient in diffraction in the 2–20 keV energy range, for the
reflection order, while higher energies can be reached at higher reflection orders.
From the definition of mosaicity, it follows that those photons which find a properly oriented crystallite in the inner part of the crystal are reflected on the position detector slightly shifted with respect to the one coming from a surface crystallite; as a consequence of this unfocusing process, the peak resolution is worsened with respect to a standard non-mosaic crystal. For the same principle, for a given mosaicity, the thickness of the graphite crystal plays a fundamental role; for higher thickness, the reflection efficiency is enhanced at the expence of the peak resolution. This interplay between the above mentioned parameters has been investigated in the past with single or double crystal spectrometers providing parallel and monochromatic sources of few tens of microns. However, in spite of the results published and available in literature [
12,
13,
14,
15,
16], it is still useful and intereresting to investigate how thickness and mosaicity influence the spectrometer response when almost millimetric sources are used.
Thanks to two different production mechanisms, Pyrolitic Graphite crystals can be obtained with different mosaicity and divided into two main families: Higly Annealed Pyrolitic Graphite crystals (HAPG) and Highly Oriented Pyrolitic Graphite (HOPG), showing lower and higher mosaicities, with consequently higher and lower resolutions, respectively. Both of these crystal types can be realised with different ad hoc geometries, making them suitable to be used in the Von Hamos configuration [
17], combining the dispersion of a flat crystal with the focusing properties of cilindrically bent crystals.
Von Hamos spectrometers have been extensively used in the past providing very promising results in terms of spectral resolution [
4,
16,
18] but all of the available works in literature report measurements for effective source dimensions of some tens of microns or parallel and monochromatic beams; these configurations are achieved either with microfocused X-ray tubes, or with a set of slits and collimators placed before the target to minimize the activated area. Possible spectrometer versions based on a full-cylinder geometry, to be used with a pixelated area detector instead of a monodimensional strip detector, are also possible; this may lead to an increase in both spectral resolution, thanks to a better integration of the bent lines produced by the crystal, and overall efficiency, thanks to a higher solid angle acceptance, but the effect of a hundred of microns source size are still to be tested [
19].
In this work, we compare the response of three different thickness 206.7 mm curvature radius HAPG crystals and of two different mosaicity (HAPG and HOPG) 100 m thickness 103.4 mm curvature radius crystals to Cu(K) and Fe(K) lines, respectively. The resulting peak resolutions and reflection efficiencies will be discussed.
3. Results
In this section, we present the spectra obtained for the Cu(K
) and Fe(K
) lines (see
Table 1); for each measurement, the corresponding geometrical parameters are listed in
Table 2, where
is the central Bragg angle value used for the calculation. The crystal curvature radius is chosen in order to make a compromise between the energy resolution and the signal rate, since higher
leads to longer paths meaning better resolution but higher X-ray absorption from the air. Slits’ positions
and
are chosen such as to have a vertical dispersion at the HAPG/HOPG position smaller than the crystal size (30 mm). The typical fitting function for peaks obtained with micrometric sources is a Lorentzian, which can be used to take into account the natural lineshape of the atomic transitions and, in case, the mosaic spread of a crystal; however, in our analysis, we carefully checked our spectra and fitted them either with a Lorentzian, a Gaussian, and a convolution of the 2 (Voigt function), and we concluded that, in our case, in which the dimension of the source is not a few microns anymore, the Gaussian shape better reproduces the broadening induced by the bigger source size. In the following subsections, the presented spectra are then fitted with Gaussian functions; for each acquired spectra, since the angular separation between Cu and Fe K
lines is very small (
(Cu)
,
(Fe)
), a linearity regime is assumed between the pixel position on the strip detector and the X-ray energy. The calibration is then obtained by a linear interpolation of the peak mean values obtained by the fits of the position spectra; this linear function is then used to convert position spectra into energy spectra. For each plot, the rate reported in the yellow box is calculated as the sum of the integrals of the K
peaks divided by the data acquisition (DAQ) time (1 h DAQ for all the reported measurement).
3.1. Reflection Efficiency and Resolution for Different HAPG Thickness
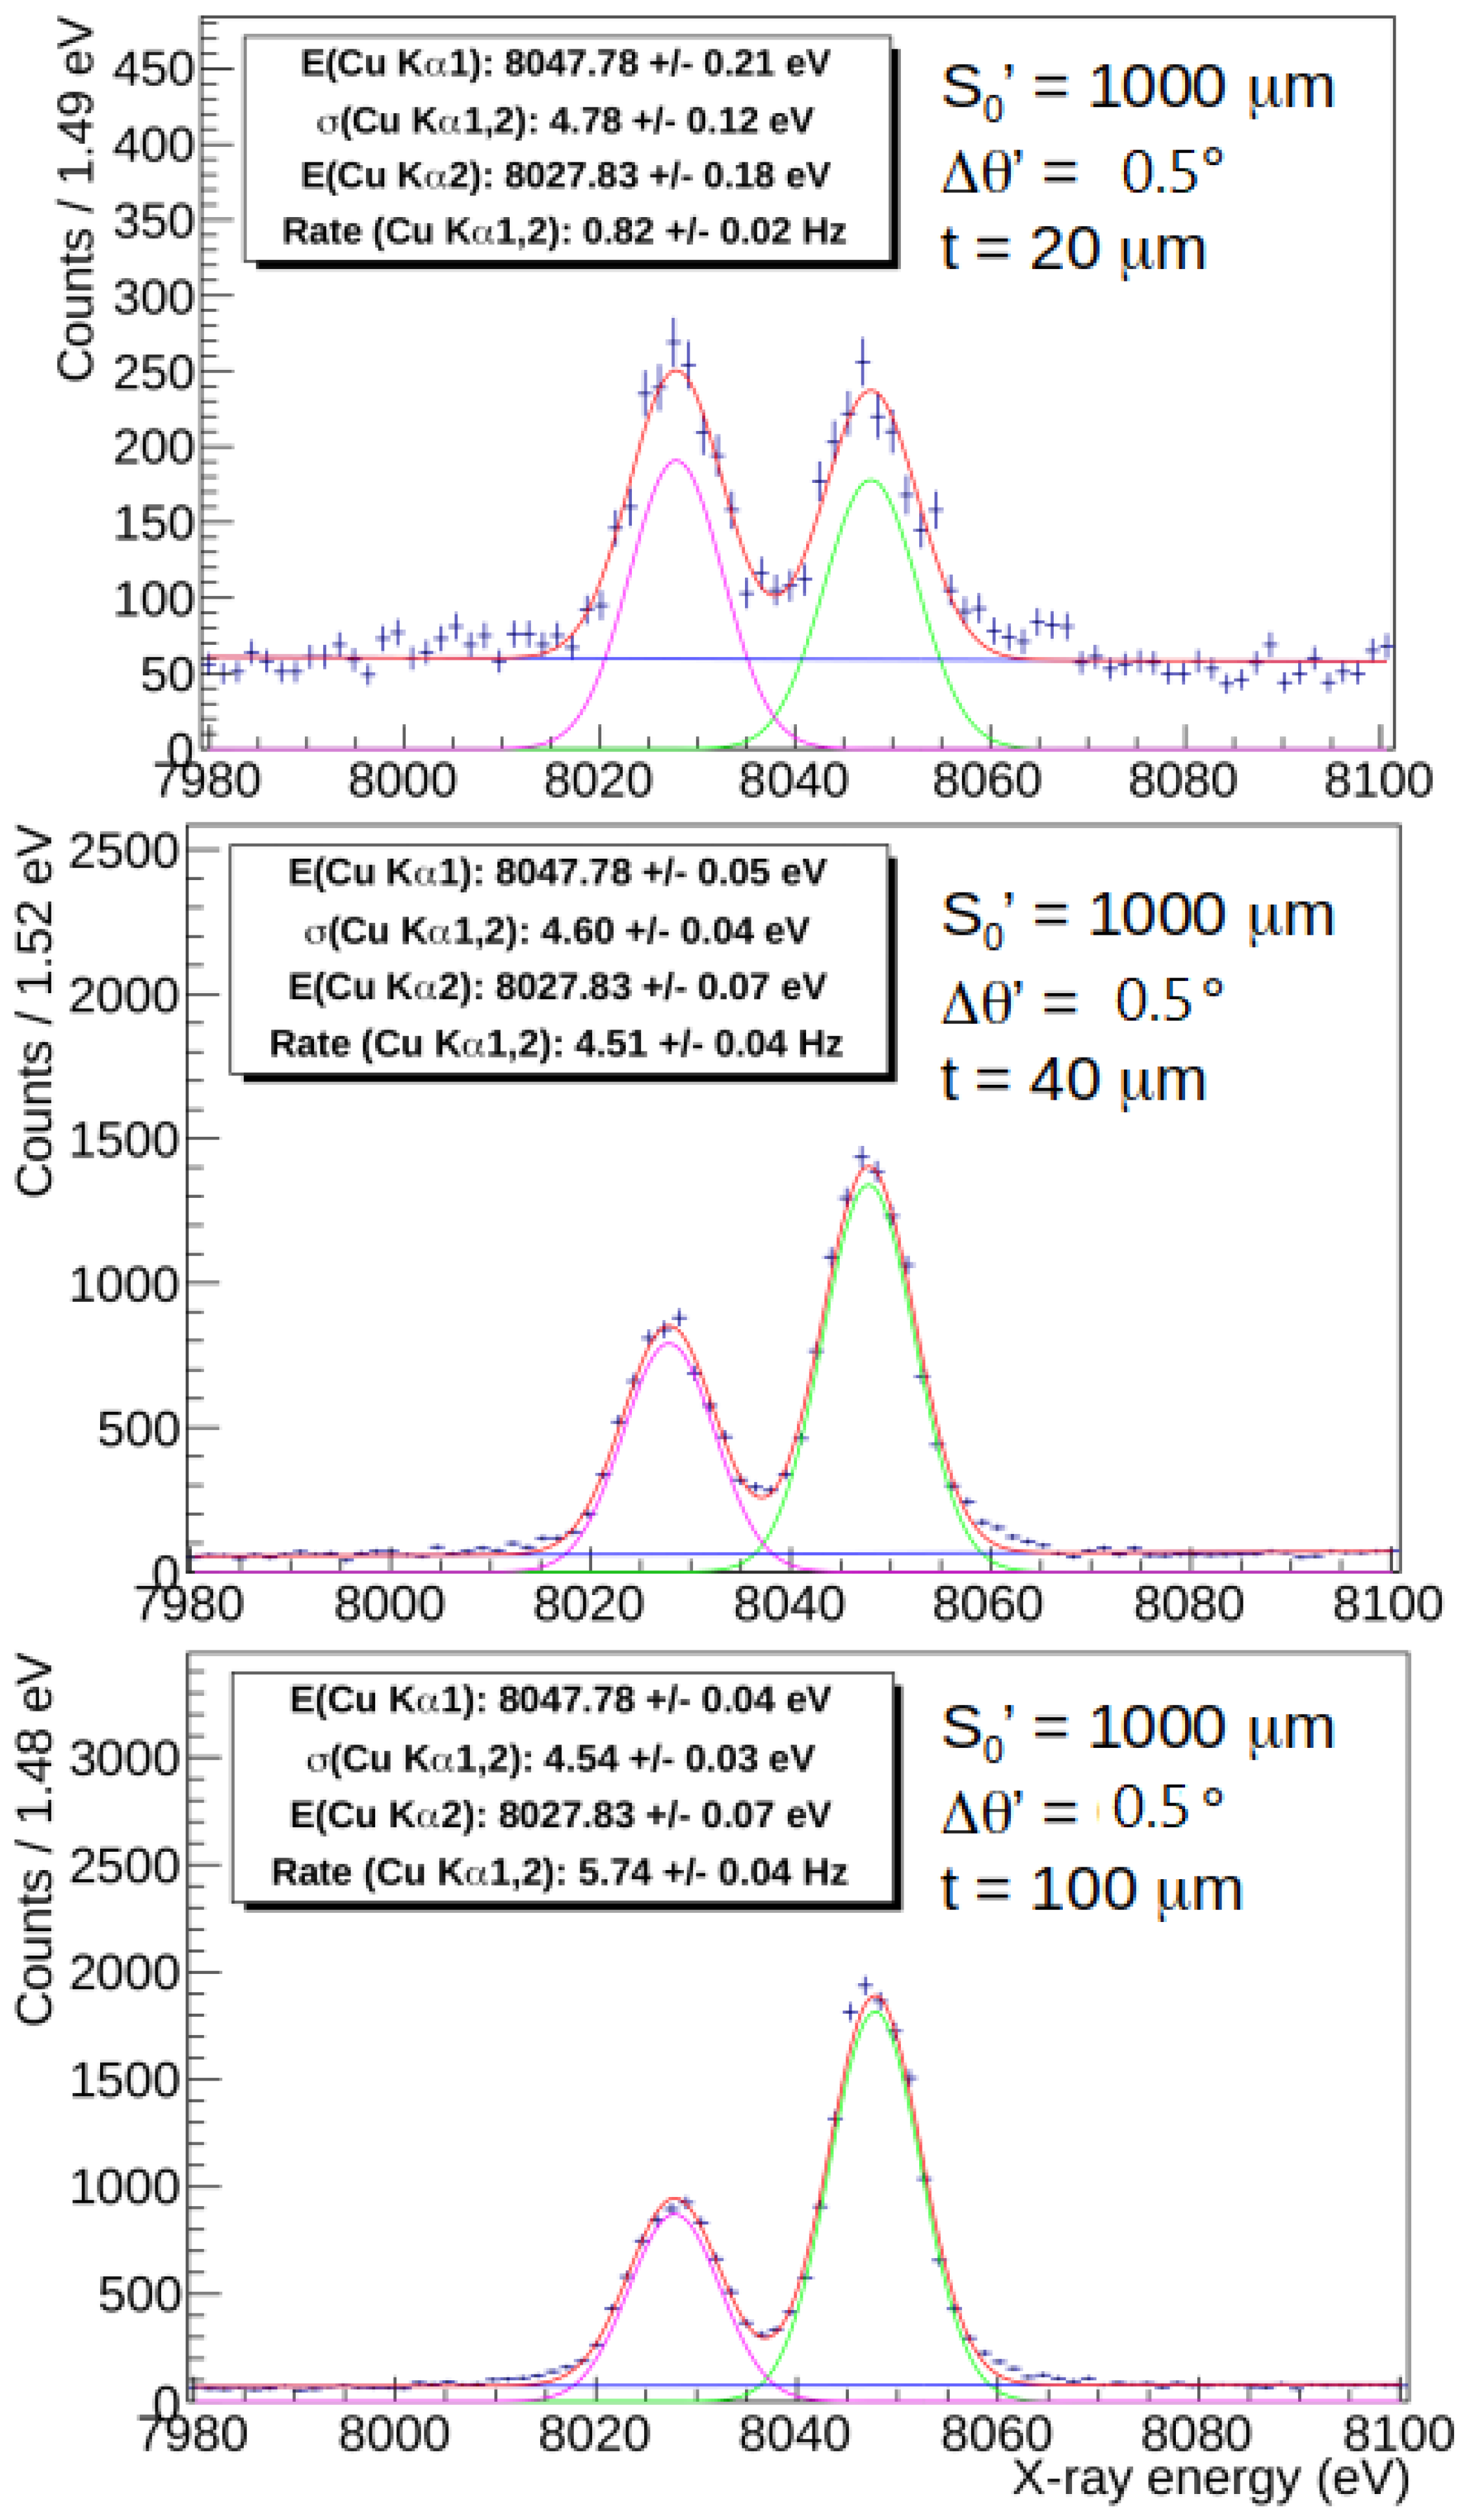
We present the results obtained from several measurements of the Cu(K
lines, using three different 206.7 mm curvature radius HAPG crystal of 20
m, 40
m, and 100
m thickness, all having a mosaicity, measured and declared by the producer, of
. As an example, we show the comparison spectra obtained for each crystal for
and with effective source sizes of 1000
m in
Figure 4, while, for the other source sizes, the results are summarized in
Table 3. In the figure, the three spectra for the 20
m, 40
m and 100
m cases are shown in the upper, middle and lower panels, respectively. For each measurement, the data taking time is one hour and the fitting function is a double Gaussian with common
for the Cu lines and a polynomial for the background.
3.2. Reflection Efficiency and Resolution for Different Crystal Mosaicities
An effect similar to the one due to the crystal thickness is played by the mosaicity: for a given thickness, an increase in the mosaicity leads to a higher reflectivity because of a higher probability to find a properly oriented crystallite but, as a drawback, a defocusing effect in the reflection plane is induced [
4]. We present the results obtained from several measurements of the Fe(K
) lines, using two different 103.4 mm curvature radius crystal of mosaicity
(HAPG) and
(HOPG); for each one, the data taking time is one hour and the fitting function is a double Gaussian with common
for the Cu lines and a polynomial for the background. Unlike the measurements in
Section 3.1, in this case, it was not possible to obtain spectra for the same
for each
value because of the geometrical limitations imposed by the Von Hamos configuration. For example, to have
m and
, slit
aperture should be only 2
m, while to have
m and
, slit
aperture should be only 7
m; for both values, not only is the rate not sufficient to acquire meaningful 1 h data taking spectra, but they are also below the error on the
induced by the
x and
z position of the slits.
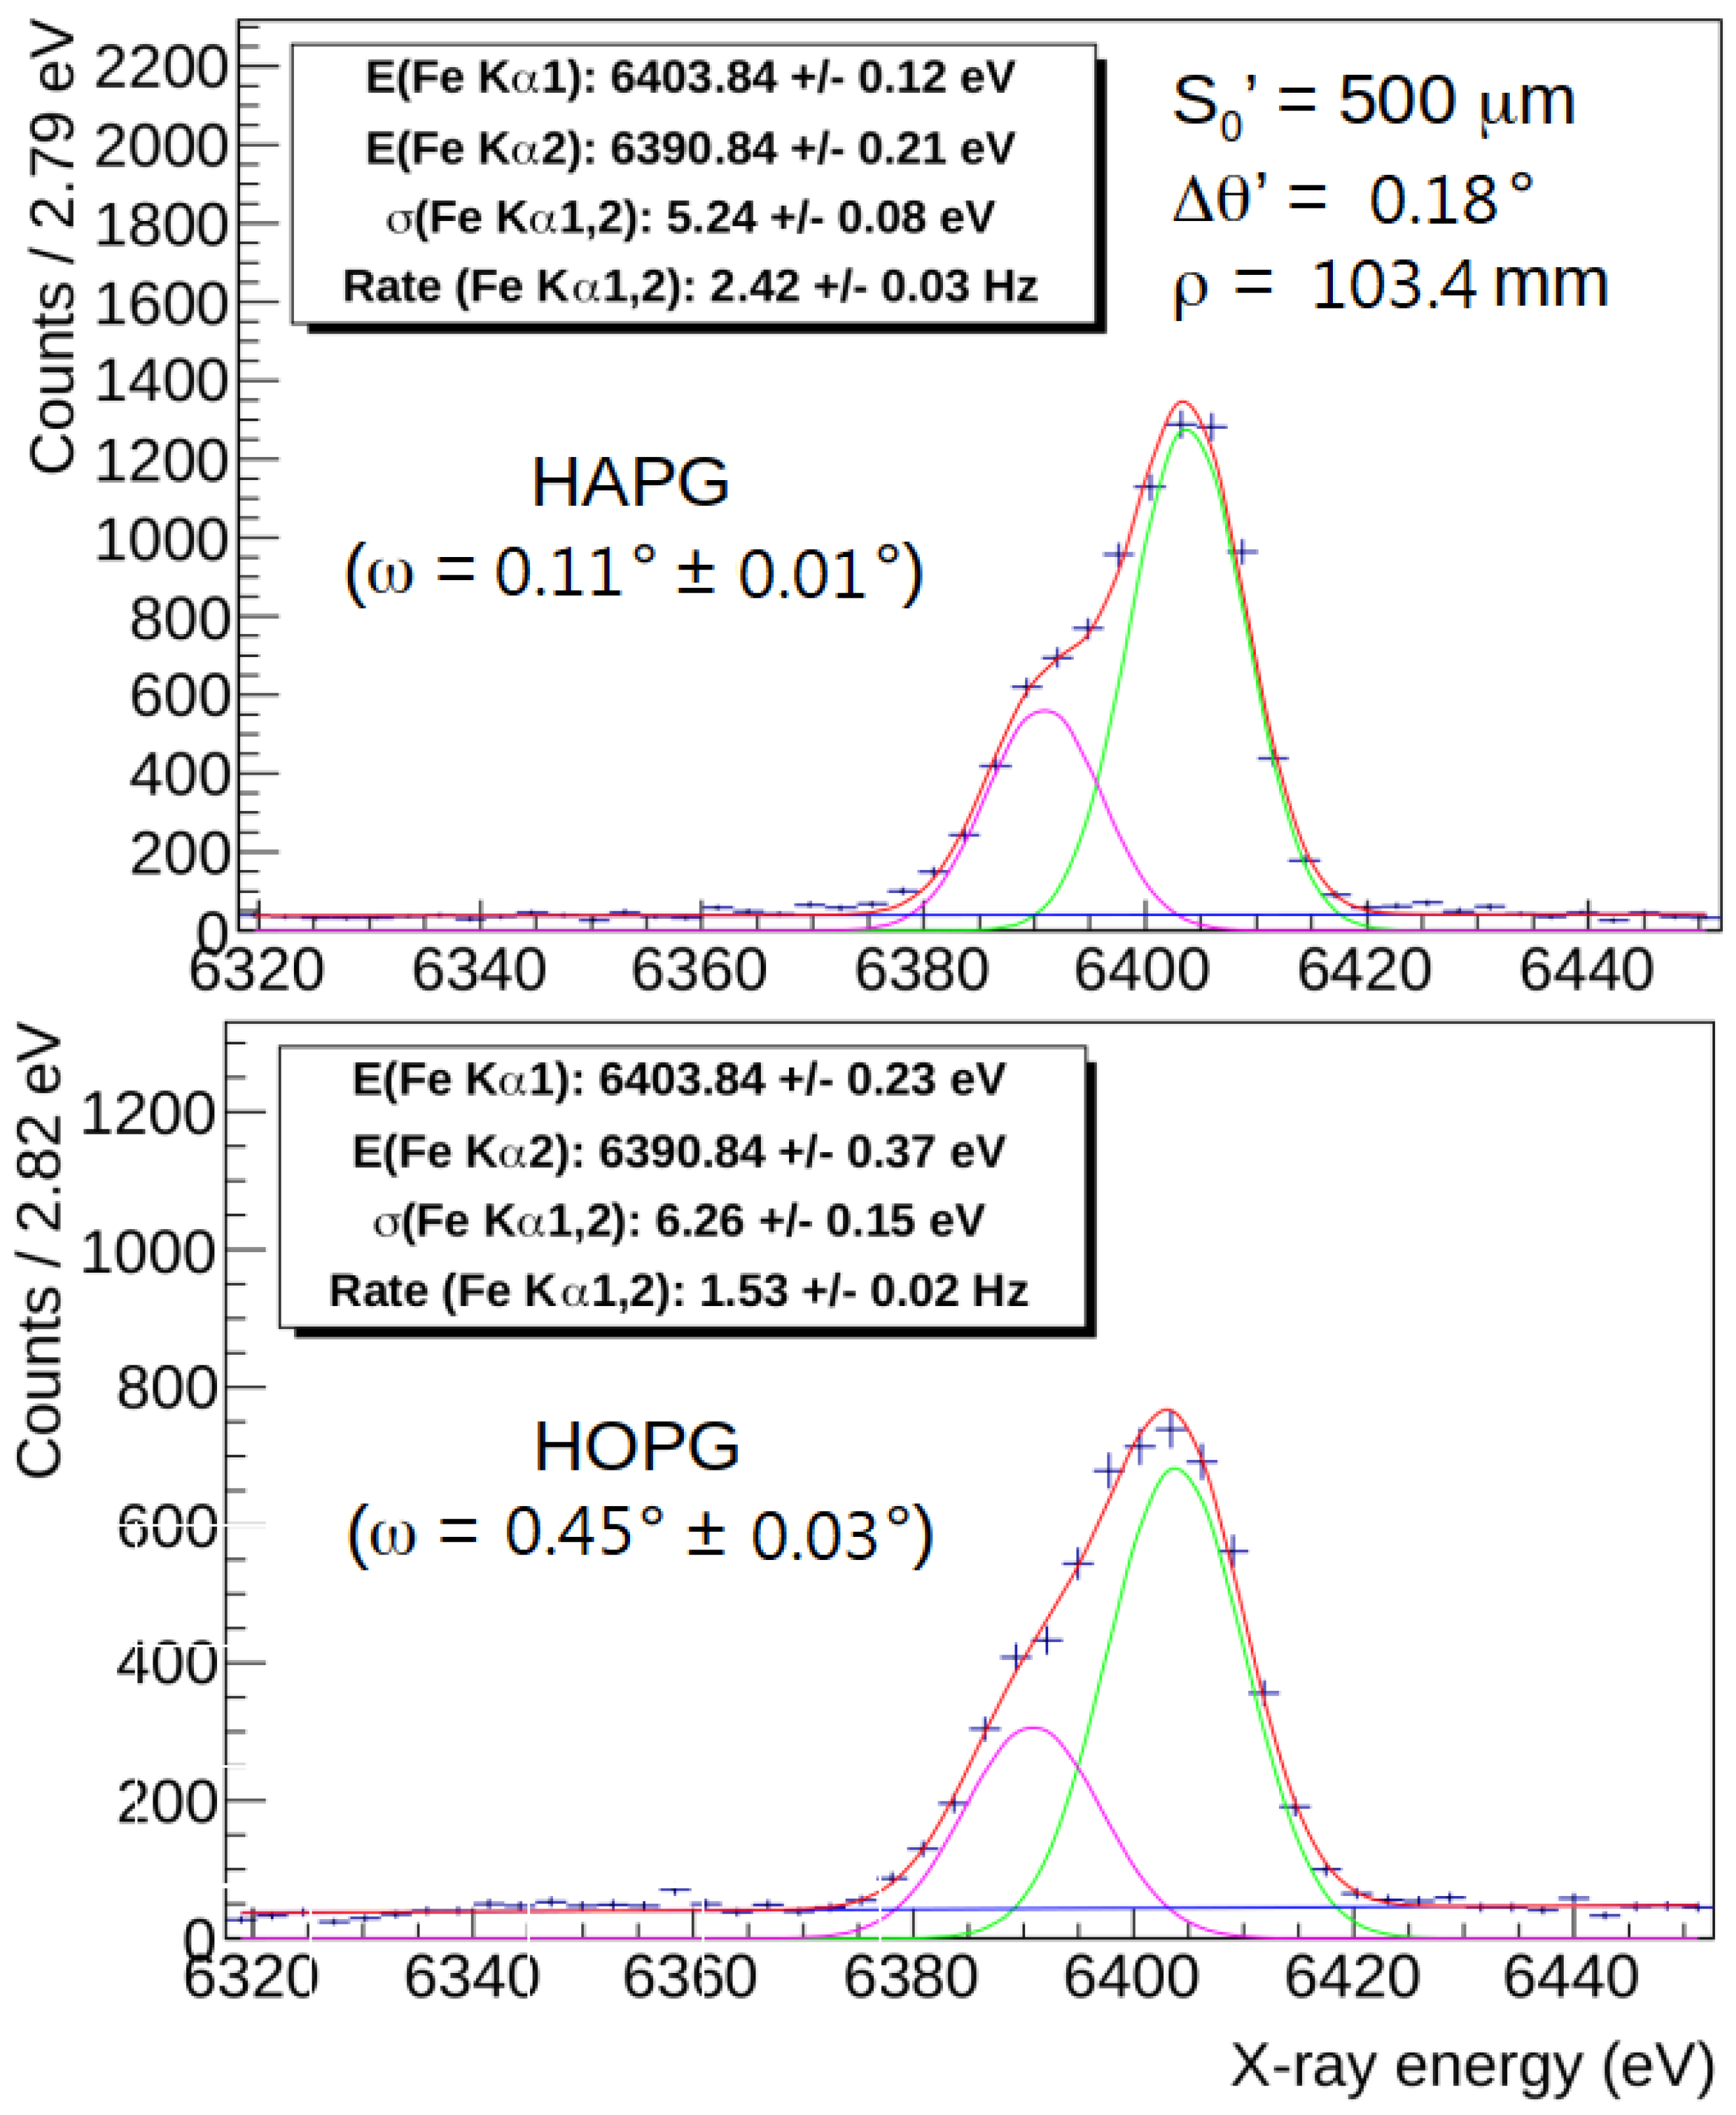
As an example, the comparison spectra obtained for the two type of crystal for
and
combination are presented in
Figure 5, where the HAPG and HOPG spectra are shown in the upper and lower panels, respectively. The results obtained for difference
combinations are reported in
Table 3.
The obtained peak precisions, resolutions and total rates obtained in the different measurements are summarized in
Table 3.
4. Discussion
The different thickness measurements show that, for a given
effective source size, the resolution worsening effect induced by the crystal thickness is not predominant anymore; on the contrary, the resolution broadening induced by the source size is more important. This is a very important result to be taken into account when X-rays emitted from extended isotropic sources have to be measured. It has to be noticed that the correct ratio between K
and K
, both in Copper and Iron, is 100:51; this ratio is somehow reversed in the spectra obtained with thin crystals (see
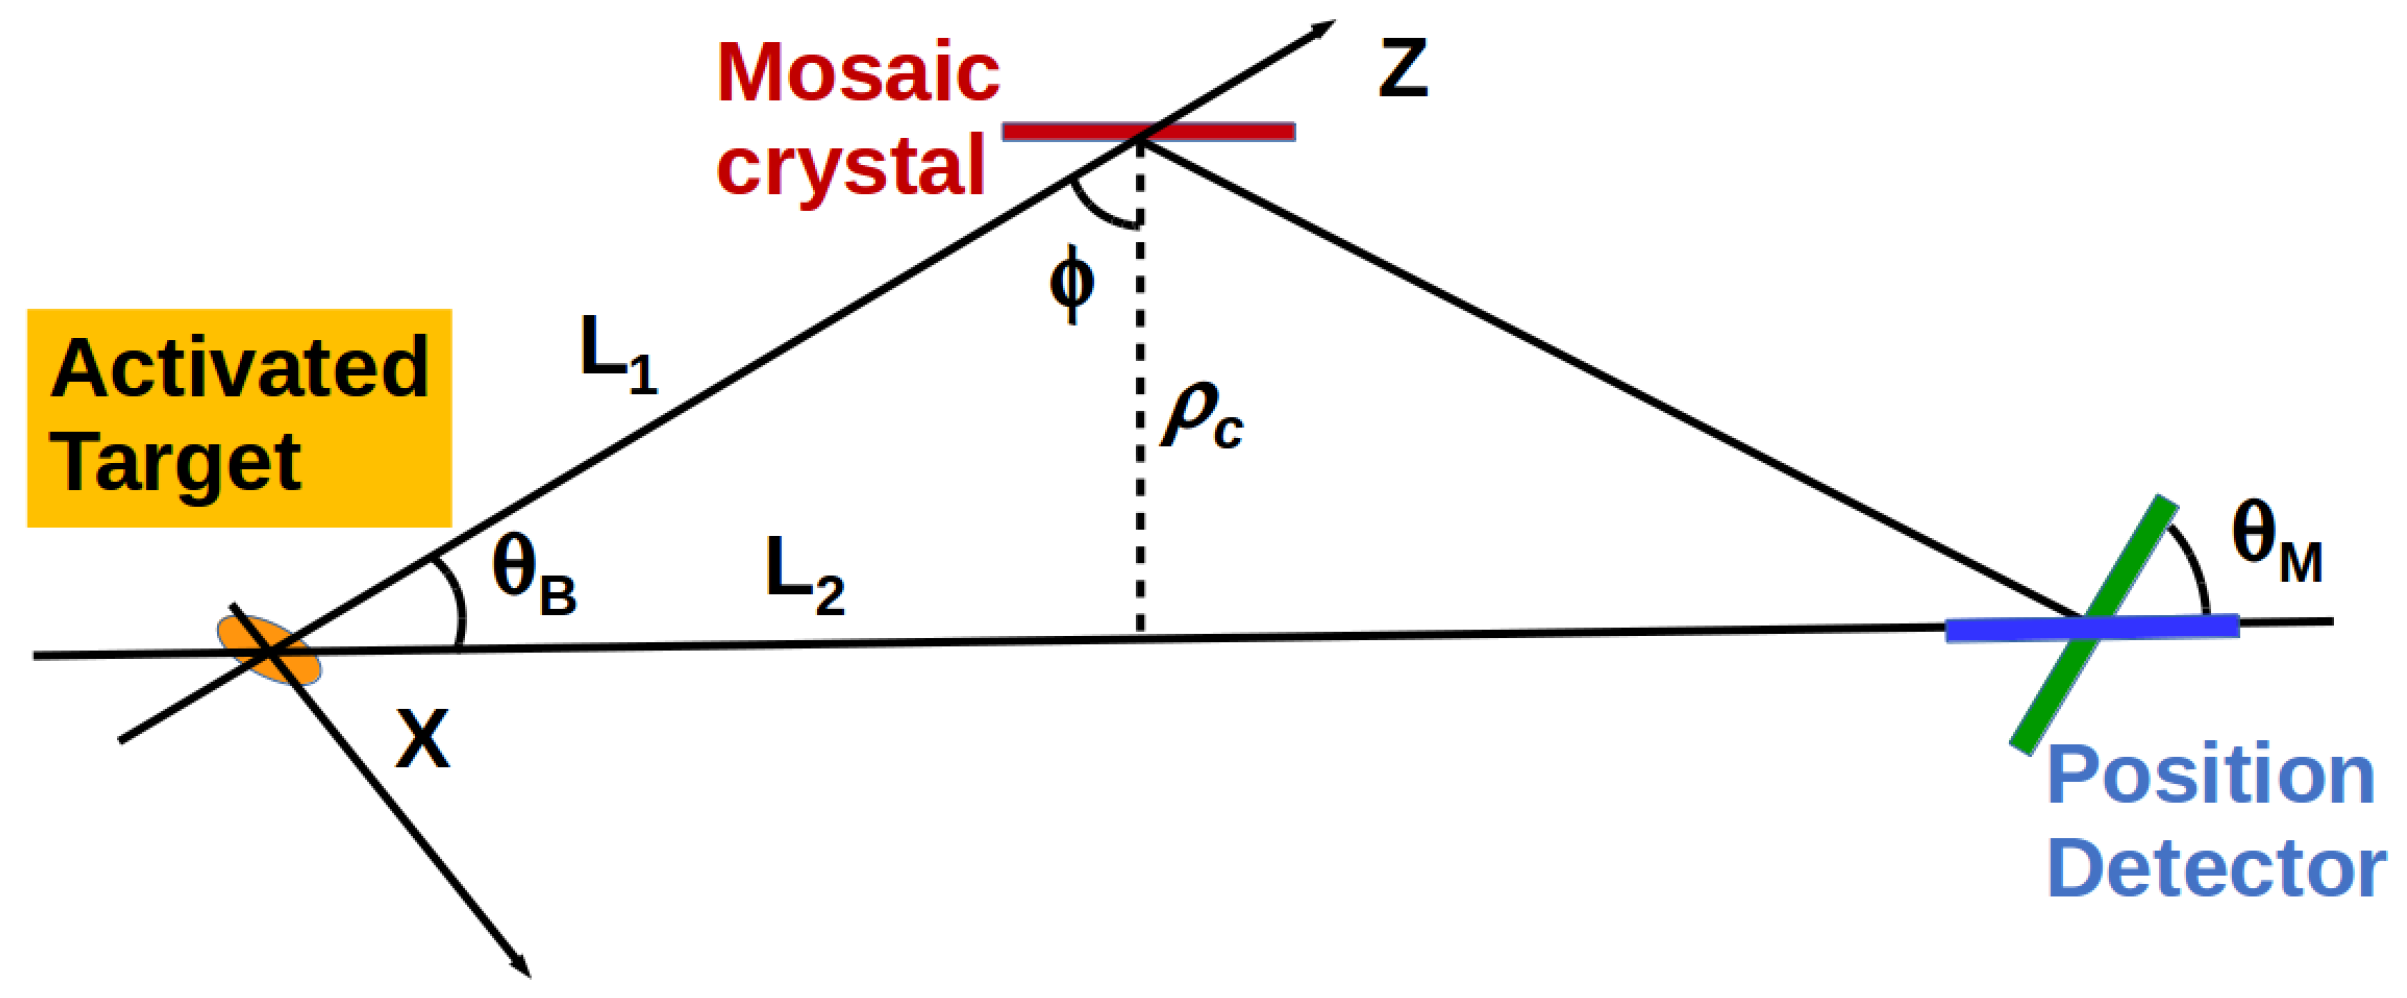
Figure 4, top pad). This effect may be better explained using
Figure 1 and
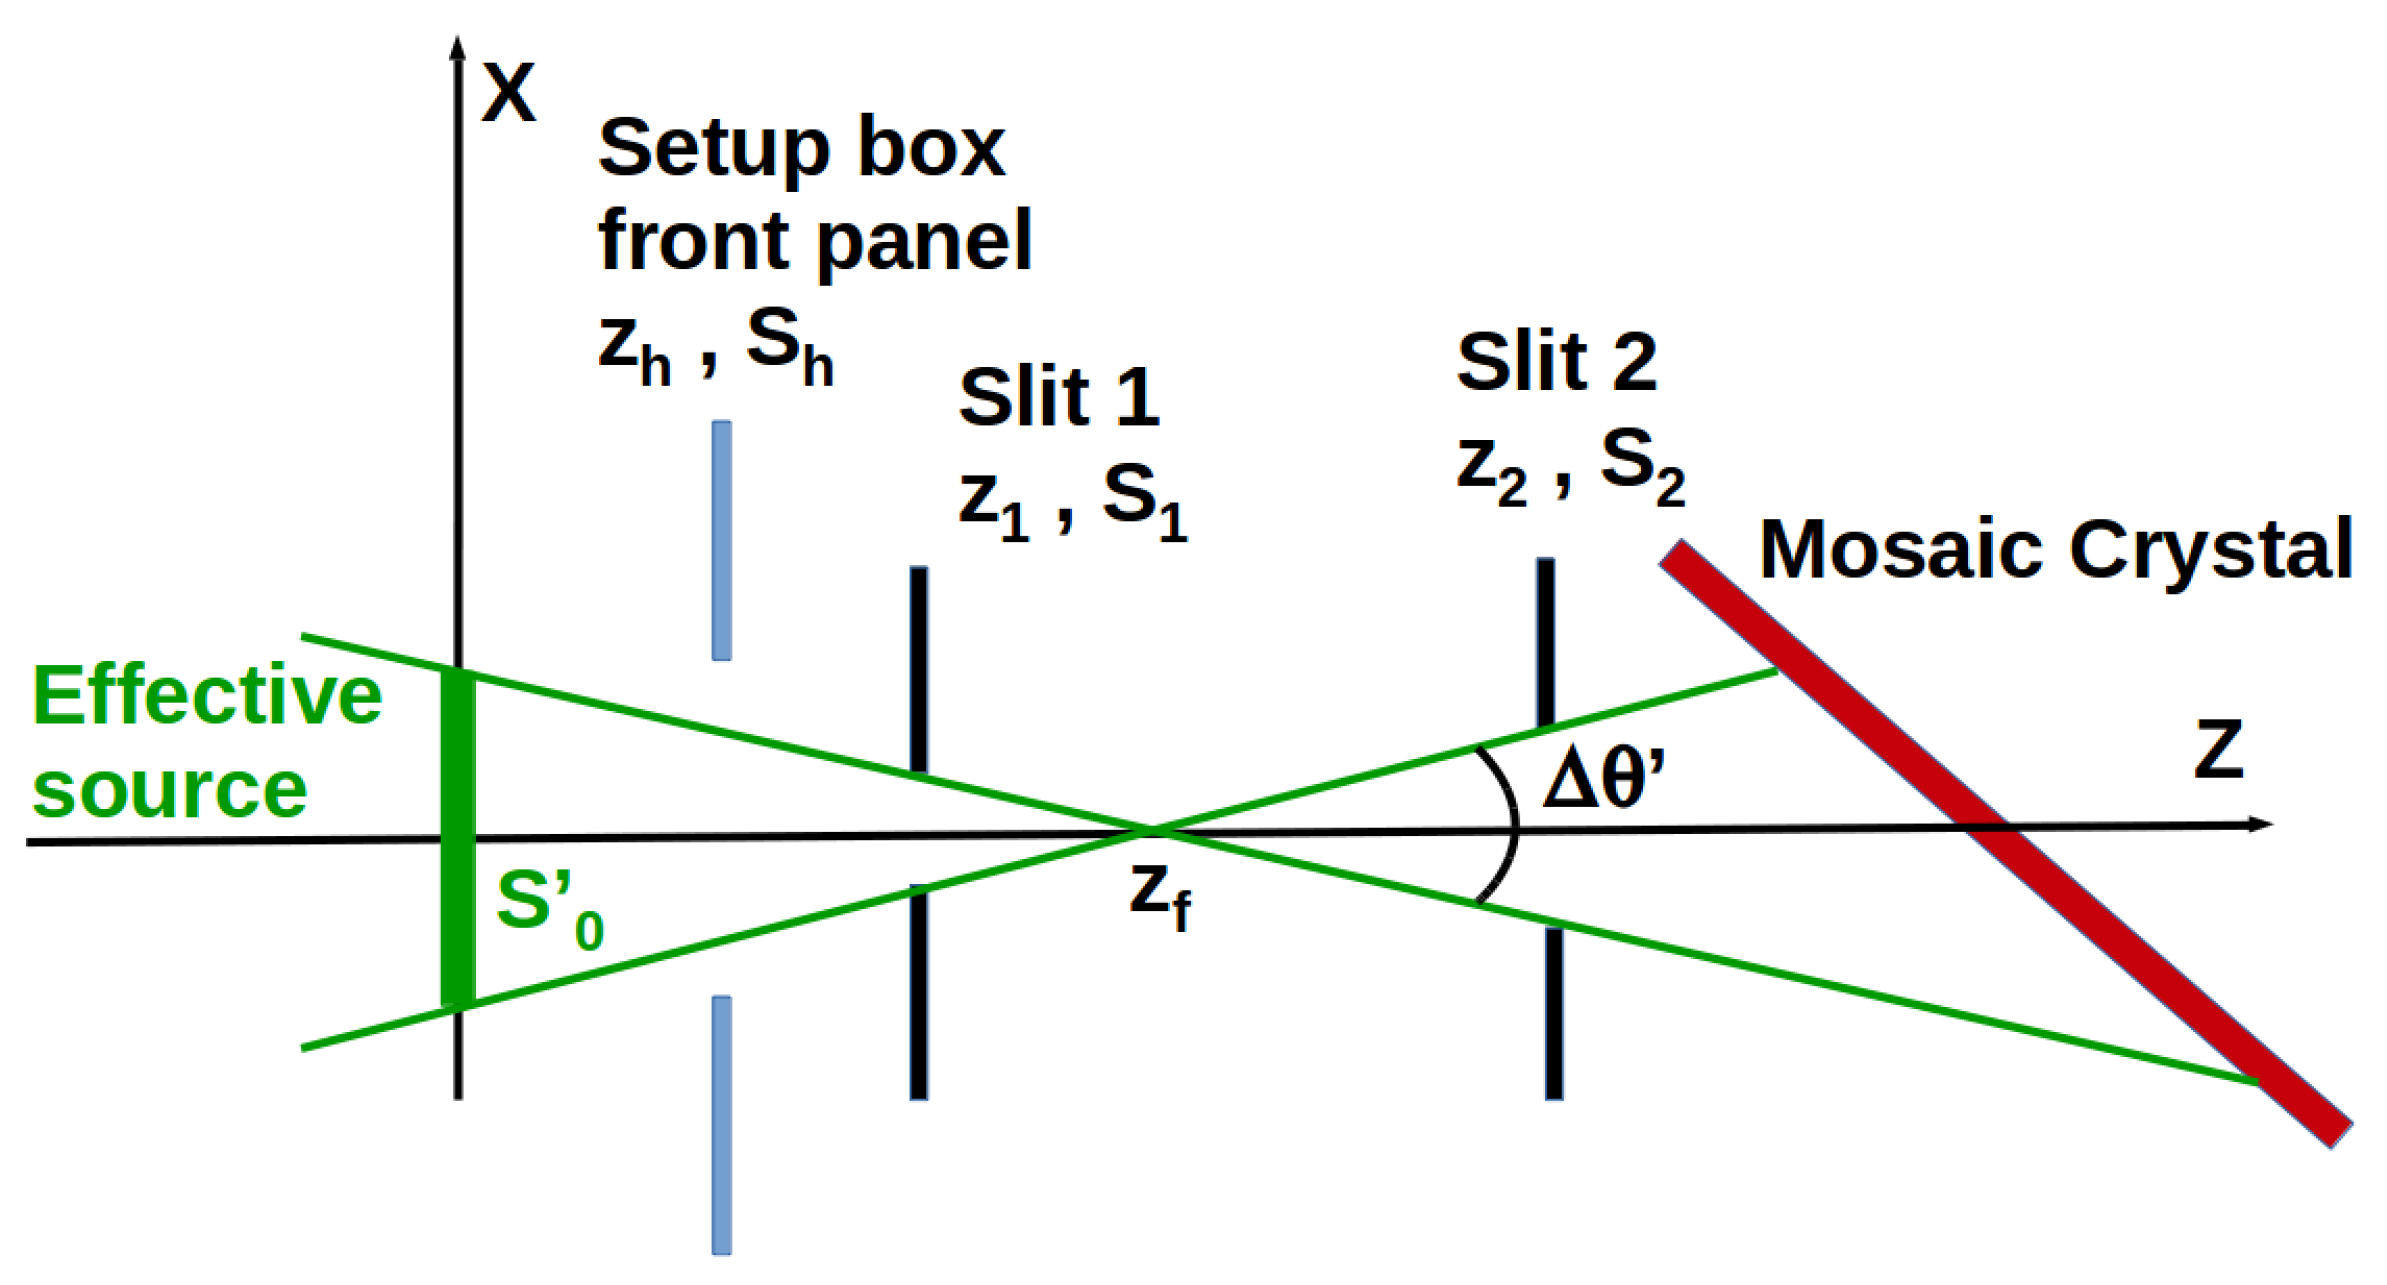
Figure 2. The setup is prepared in order to have a nominal Bragg angle (
in
Figure 1) tuned between the K
and K
peaks, around which the angular acceptance
of
Figure 2 is defined. If the crystal is a bit mispositioned (not centered) with respect to this nominal direction, it could result in a setup more aligned around one of the two peaks, in this case around K
. Consequently, the probability to find properly oriented microcrystallites for K
is lowered.
Concerning the mosaicity influence on the reflectivity and the resolution, a more detailed discussion can be carried out starting from the measurements. From the spectra, it is evident how, with the higher mosaicity of the HOPG crystal with respect to the HAPG, one causes a peak broadening, leading, in some cases, even to a non-separation of the two peaks, consistent with the expectation; on the contrary, the reason why there is not a corresponding increase in the measured rate is not intuitive and needs to be more carefully motivated.
We can start from the assumption that, for the same crystal thickness and dimensions, the amount of inner crystallites is always of the same order of magnitude regardless of the mosaicity value; then, according to what is available in literature [
12,
13,
14,
15,
16] and what is declared by the crystal producers [
10], the orientation distribution can be described with a Lorentzian, normalized to unity, of the form:
where
is the crystal mosaicity
. For each
value (see
Figure 2), for a single photon energy, the number of the properly oriented crystallites is given by:
For each measured spectrum, almost the 100% of the Fe(K
photons will be in the interval
being
= Fe(K
)−5
and
= Fe(K
)+5
, where now
is the Gaussian peak resolution obtained from the fits; this will correspond to a
interval of
being
and
where
d is the graphite lattice parameter and
is the Å
conversion factor. The final number of properly oriented crystallites will then be:
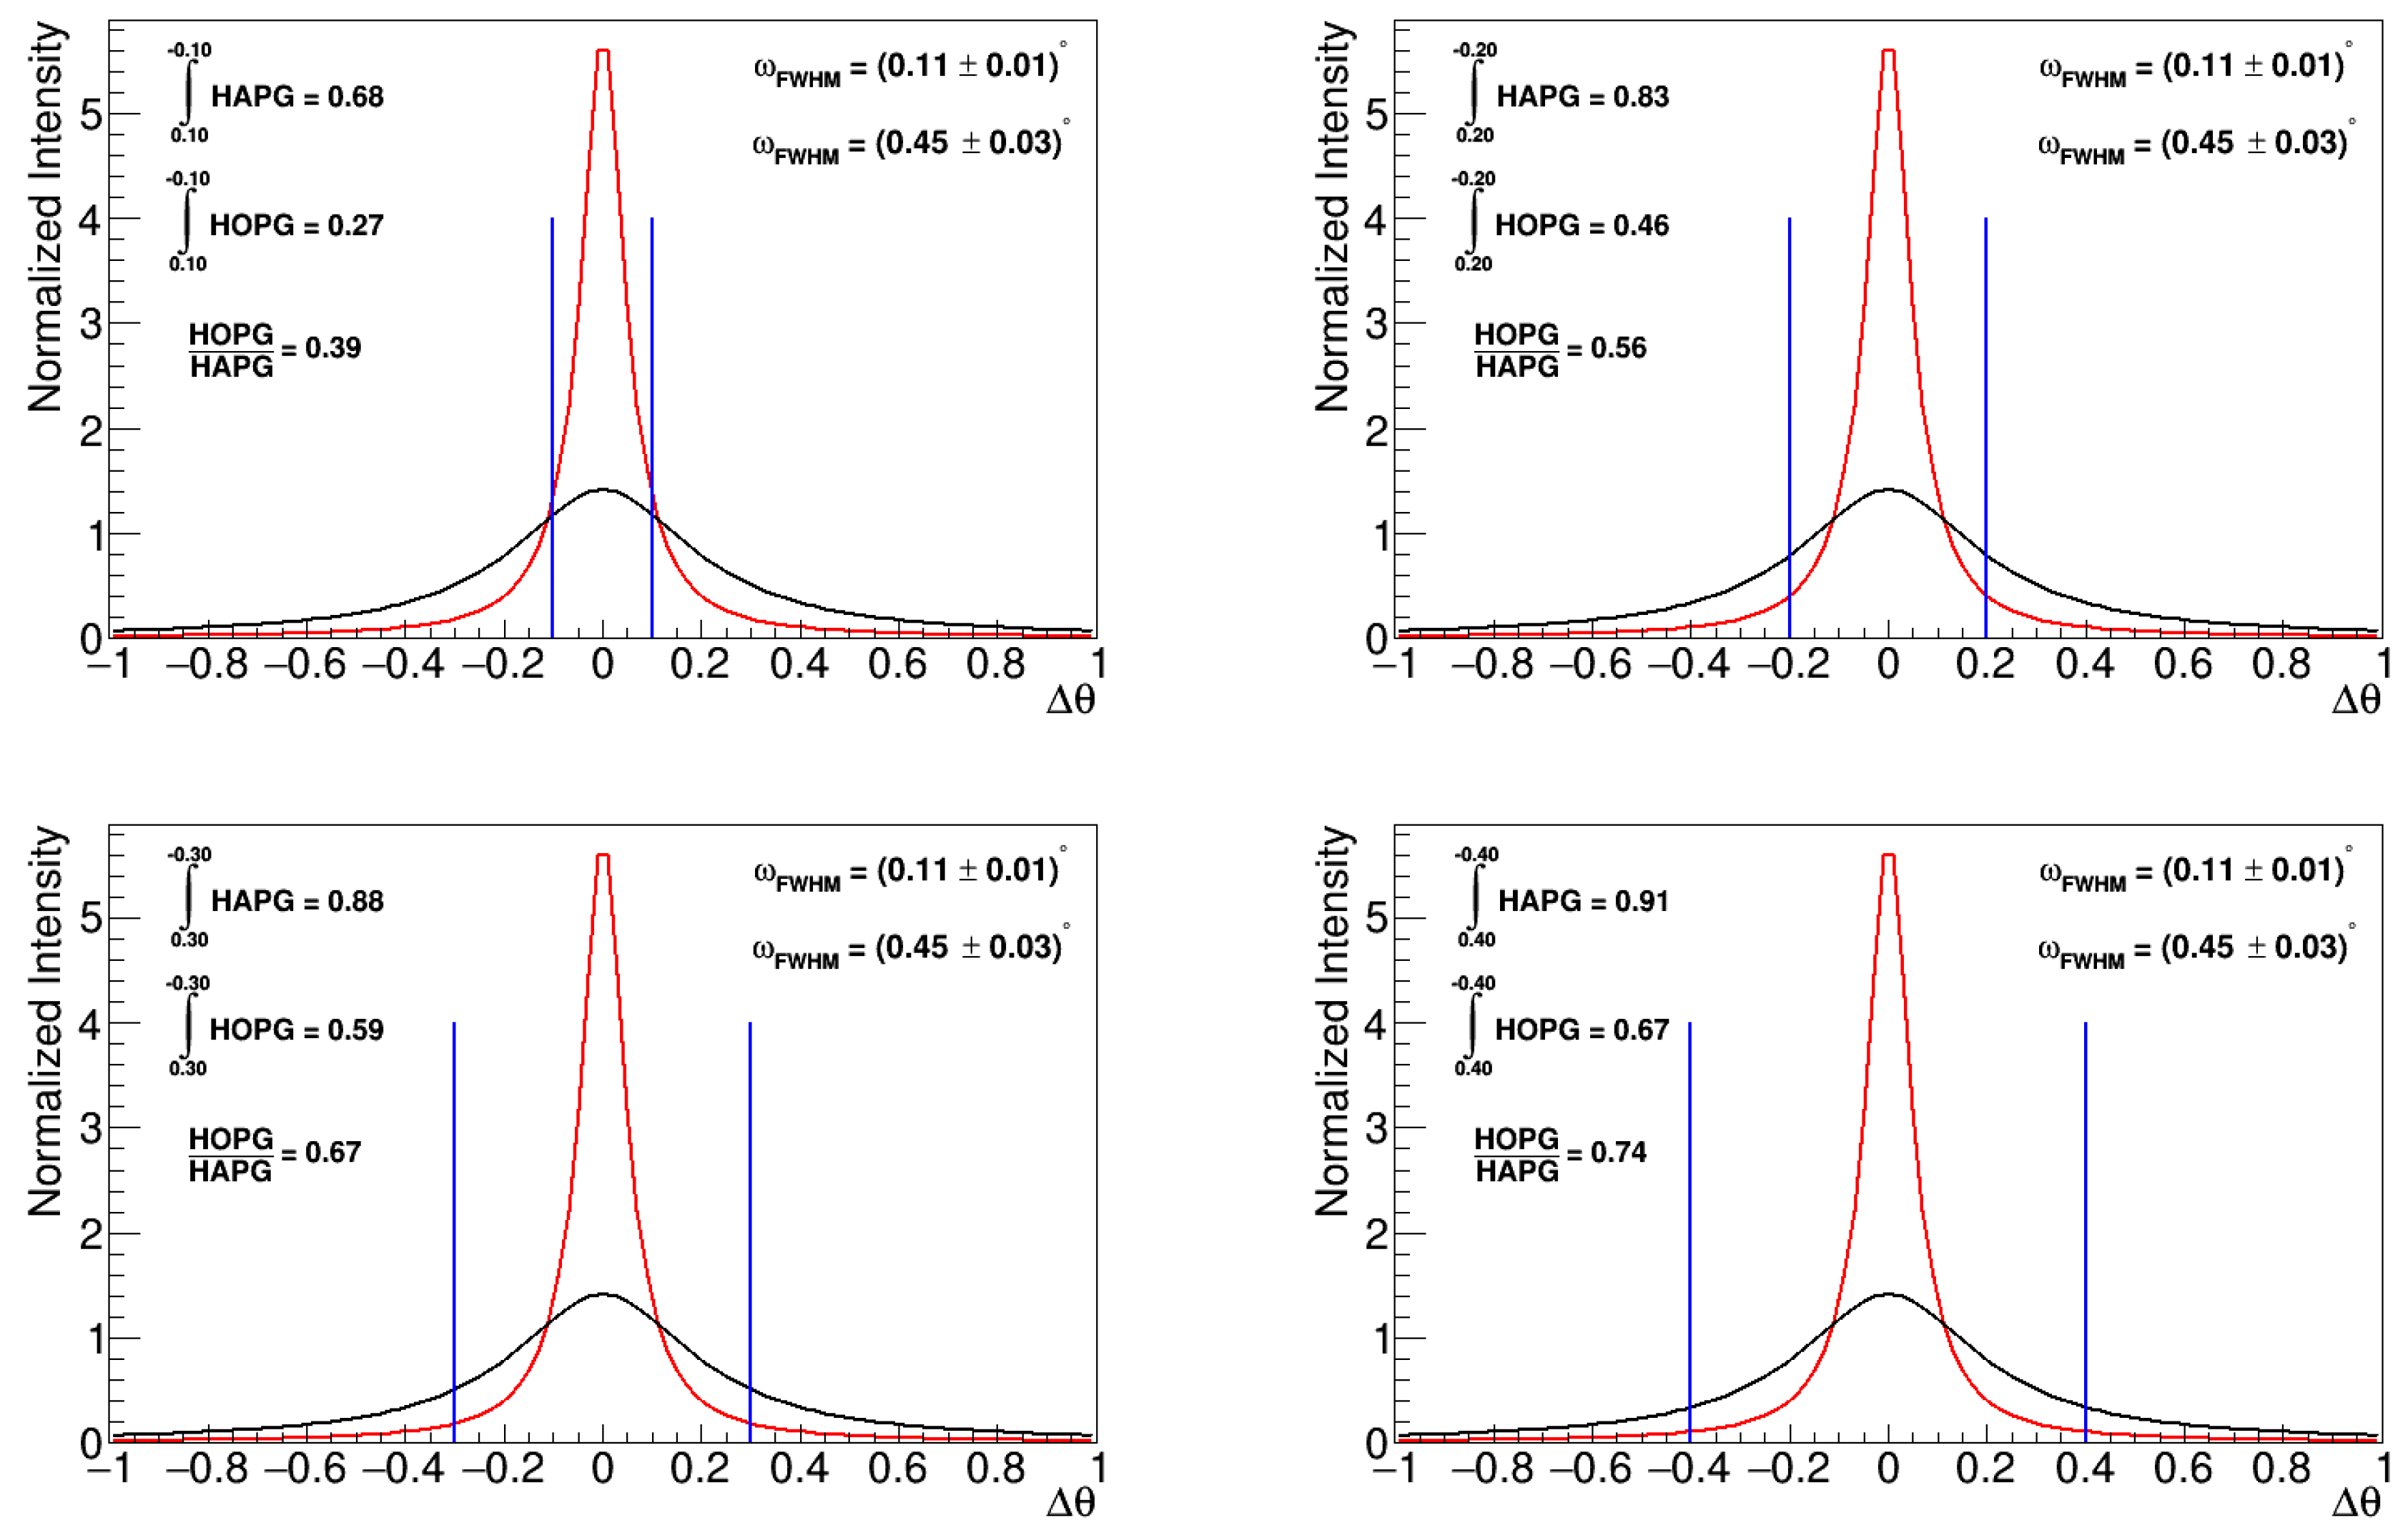
The situation is shown in
Figure 6, where the orientation distributions for the HAPG and HOPG are shown in each panel in red and black, respectively. The distributions are peaked around
, which represents the nominal Bragg angle; the integrals of the two Gaussians are then reported for various intervals and show how the ratio between the HOPG and HAPG number of properly oriented crystallite is changing. As a consequence, in the case of the Fe(K
lines, which are only 13 eV or 0.035
distant, the expected ratio is actually matching the expected values.
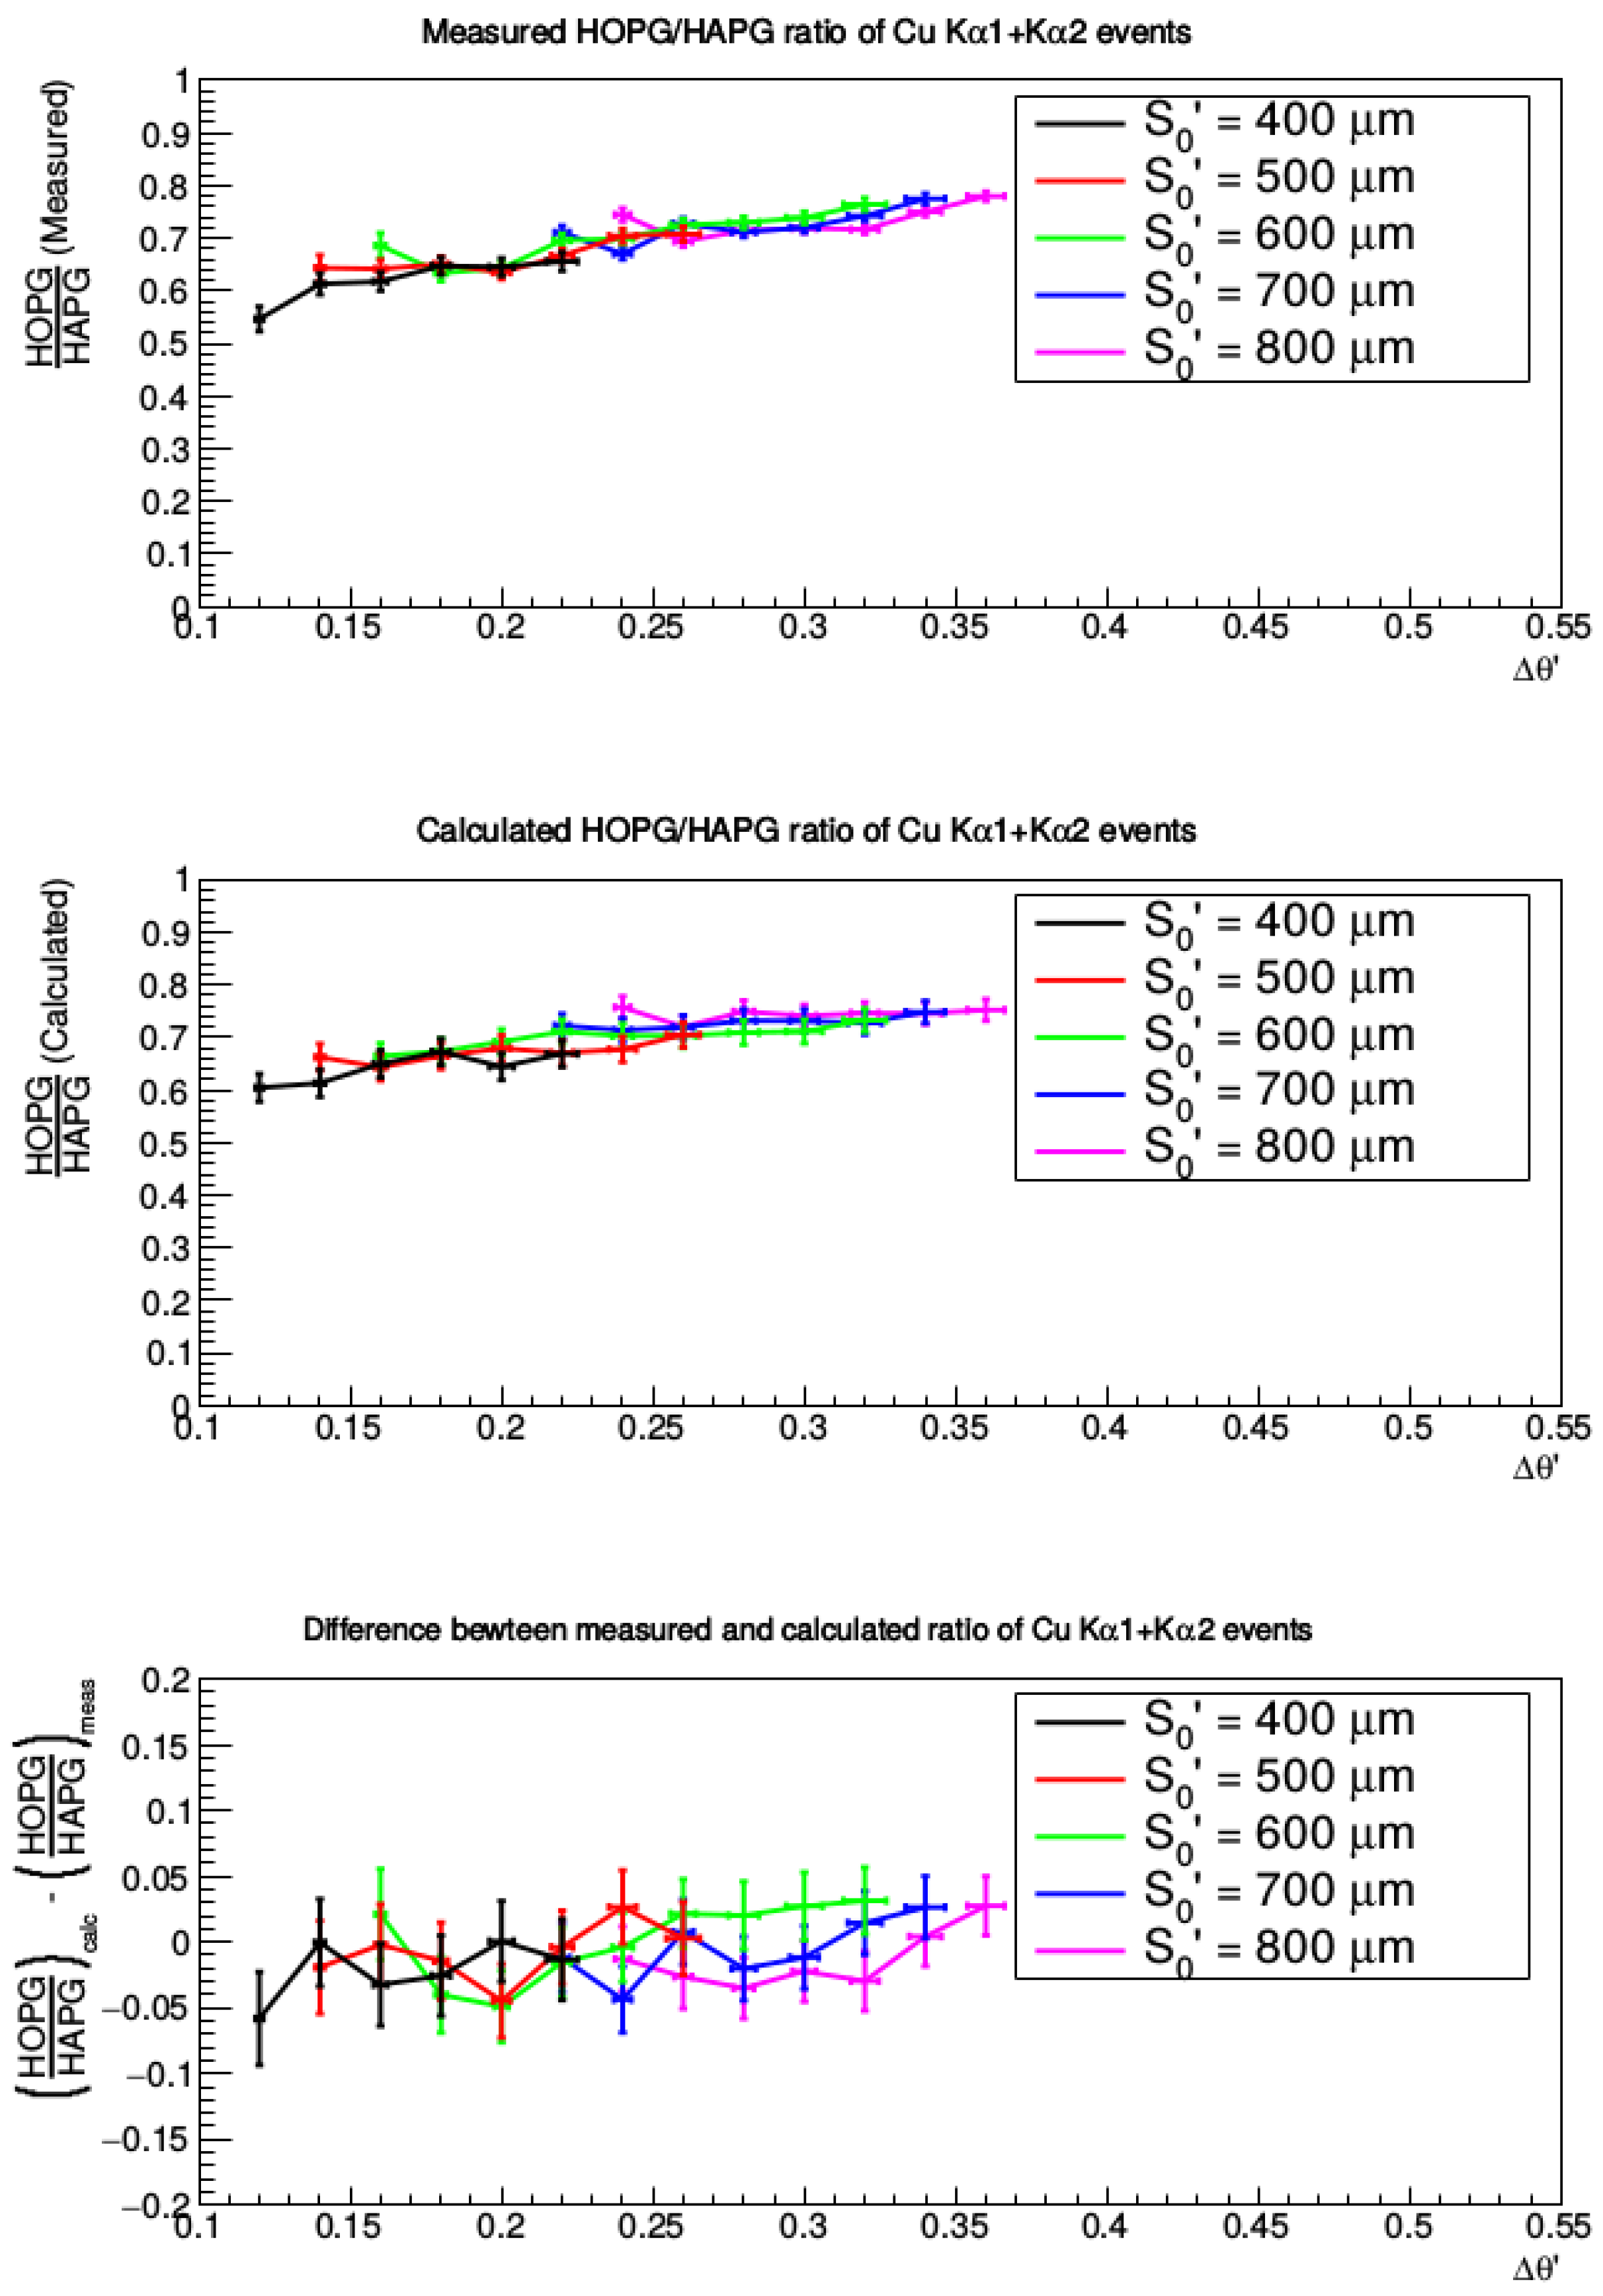
This description is reproducing the experimental data well, as shown in
Figure 7, where, in the upper panel, the measured ratios for each
pairs are shown, while, in the middle panel, the corresponding calculated integral ratios are reported. In the bottom pad, the difference between the previous two is reported to show how much the calculated values differ from the measured ones. The errors on the measured points are obtained propagating the errors on the peak fitting parameters, while the errors on the calculated ones take into account the errors on the crystal mosaicities declared by the producer. The errors are then propagated in the difference plot.
5. Conclusions
In this work, we presented the measurements of the Cu(K) and the Fe(K) lines performed with different mosaicity, thickness and curvature radius crystals in order to investigate the influence of the above mentioned parameters on the peak resolution and on the reflection efficiency. The different thickness measurements show that, for a given effective source size, the resolution worsening effect induced by the crystal thickness is not predominant anymore with respect to the effect induced by the wider source size; therefore, higher thickness values ensure higher reflectivities leading to more precise determinations of the peak positions. This is a very important result to be taken into account when X-rays emitted from extended isotropic sources have to be measured.
Concerning the mosaicity influence on the reflectivity and the resolution, a more detailed discussion was carried out starting from the measurements. On one side, we confirmed that the higher mosaicity of the HOPG crystal with respect to the HAPG one causes a peak broadening, leading in some cases even to a non-separation of the two peaks; on the other side, we measured a higher number of reflected photons using the HAPG crystal with respect to using the HOPG one. We provided a semi-quantitative explanation of this behaviour, which is in good agreement with the measured ratios.
The proposed spectrometer shows promising results for future experiments in which, like for example in the case of exotic atoms’ transitions measurements, X-rays are emitted from a wide and diffused source. In these kinds of experiments, for a given spectrometer geometry, a proper choice of the crystal in terms of thickness and mosaicity becomes a crucial parameter to be set based on the main goals of the measurement and on the experimental conditions, like, for instance, the source emission rate and the solid angle acceptance. The correct combination of crystal parameters may in fact be chosen in order to obtain the desired combination of peak resolution and precision position determination. In the future, the possibility to use pixelated area detectors in a full-cylinder crystal configuration like the one mentioned in the Introduction, instead of linear strip detectors, will be also investigated; this may lead to an increase in both spectral resolution, thanks to a better integration of the bent lines produced by the crystal, and overall efficiency, thanks to a higher solid angle acceptance.

 ,
, 


