Article

Temperature Effects on the HOPG Intercalation Process

1
Department of Physics, Politecnico di Milano, p.za Leonardo da Vinci 32, I-20133 Milano, Italy
2
Department of Materials Science, Università Milano-Bicocca, v. R. Cozzi 55, I-20125 Milano, Italy
3
Department of Physics, Università di Roma Tor Vergata, v. della Ricerca Scientifica 1, I-00133 Roma, Italy
*
Author to whom correspondence should be addressed.
Condens. Matter 2019, 4(1), 23; https://doi.org/10.3390/condmat4010023
Submission received: 15 December 2018 / Revised: 4 February 2019 / Accepted: 10 February 2019 / Published: 14 February 2019

Abstract

:
Graphite intercalation via chemical strategies is a common procedure to delaminate stratified crystals and obtain a suspension of graphene flakes. The intercalation mechanism at the molecular level is still under investigation in view of enhancing graphene production and reducing damage to the original pristine crystal. The latter, in particular, can undergo surface detriment due to both blister evolution and carbon dissolution. The role of the electrolyte temperature in this process has never been investigated. Here, by using an in-situ atomic force microscopy (AFM) apparatus, we explore surface morphology changes after the application of fast cyclic-voltammetries at 343 K, in view of de-coupling the crystal swelling phenomenon from the other electrochemical processes. We find that blisters do not evolve as a consequence of the increasing temperature, while the quality of the graphite surface becomes significantly worse, due to the formation of some adsorbates on possible defect sites of the electrode surface. Our results suggest that the chemical baths used in graphite delamination must be carefully monitored in temperature for avoiding undesired electrode detriment.

1. Introduction

Graphene production requires efficient methods and procedures that can ensure a large number of high-quality flakes [1,2,3,4]. One of these methods prescribes diluted acid media [5]. Despite being more environmentally friendly than pure acids, using diluted acids results in important drawbacks, for the maintenance of the electrode, due to their water content. At potentials higher than the oxygen evolution reaction value, the anions carry water molecules inside the stratified structure of graphite [6]. As a consequence, gas evolution, which usually occurs at the electrode/electrolyte interface, also starts inside the layers underneath. The entrapped gas swells the surface and creates blisters [7,8]. Additionally, as recently observed by the authors, a carbon dissolution process affects the graphite terraces, [9]. The overall picture of the blistering process was described for the first time by Hathcock and co-workers at the middle of the 1990s [10]. Nonetheless, the intercalation mechanism at the molecular-scale level is still under investigation. The target of this new research effort lies in the possibility of driving anion intercalation by preventing the crystal detriment described above. In particular, blister evolution timing has been recently measured [9] and the electrochemical (EC) parameters that influence the graphite surface swelling have been summarized in a new blister evolution-diagram [11]. In these works, the role of both electrolyte pH and cyclic-voltammetry (CV) scan speed in promoting the graphite surface blistering at room temperature is discussed. It is worth noting that, to the best of our knowledge, the possible effects of temperature on anion graphite intercalation and blister growth have never been considered. Some studies regarding electrodes in the cathodic regime [3], Li-batteries applications [12], Li diffusion rate in graphite [13] and intercalation [14], aging of electrodes [15], and the role of organic solvents [16] have been performed (refer to the review reported in [17] for a brief history on thermoelectrochemistry), but the role of temperature within the Hathcock model is still missing.
In this work, we apply an in-situ atomic force microscopy (AFM) apparatus to explore the highly oriented pyrolite graphite (HOPG) morphology after the application of an increasing EC potential (CV) when immersed inside a hot (namely, 343 K) acid electrolyte. The temperature value is chosen according to the maximum operation parameters of batteries that exploit graphite as electrodes [18]. We find that blister growth is not influenced by the explored temperature interval, while the graphite surface quality is significantly compromised. This result suggests that the EC bath temperature must be controlled in order to avoid chemical reactions between carbon atoms and electrolyte anions during the intercalation process.

2. Results and Discussion

The carbon Pourbaix diagram as a function of both pH and applied EC potential [19] is reported in Figure 1.
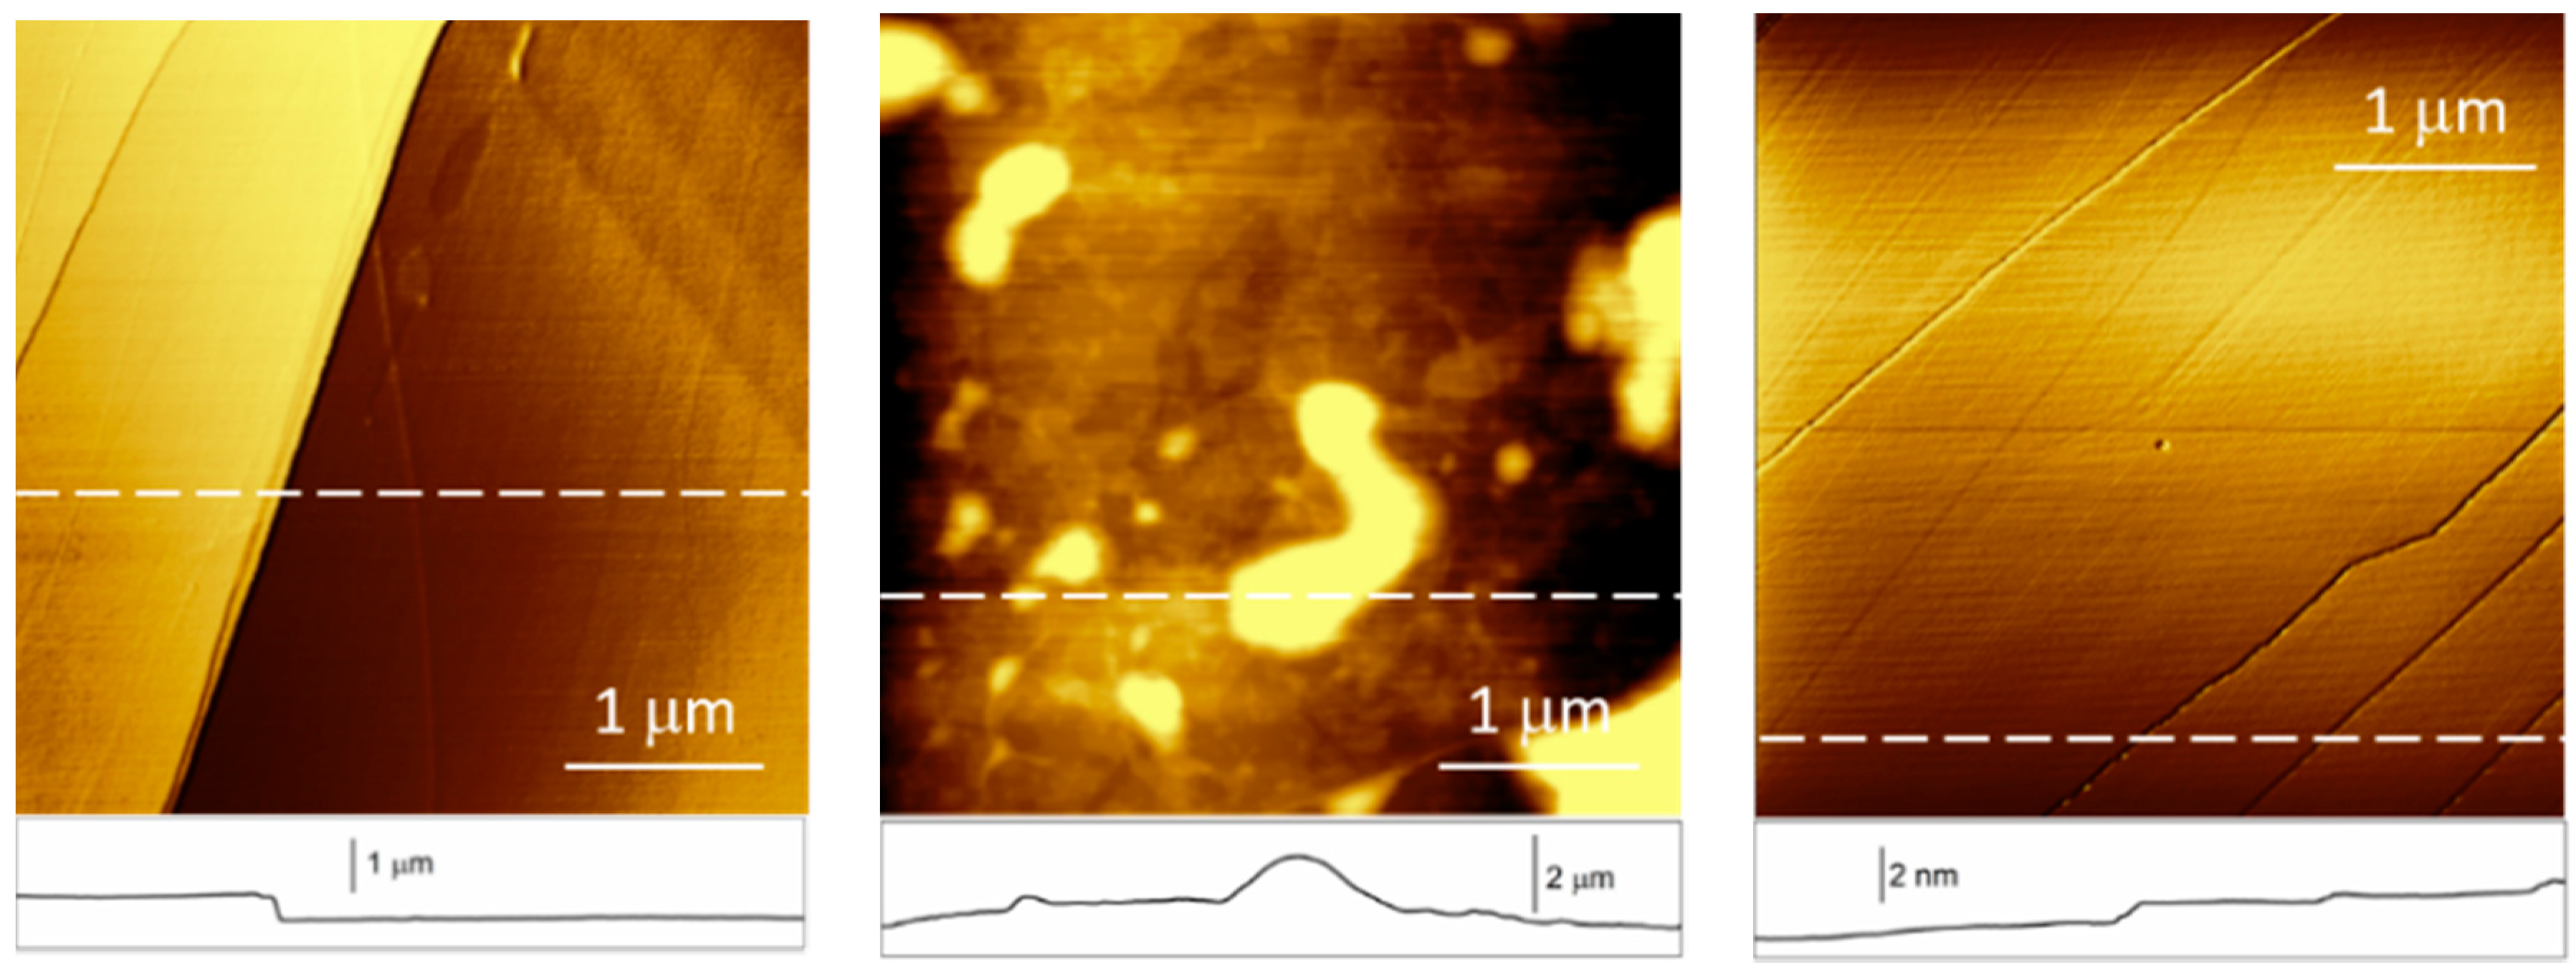
The shaded area indicates the HOPG stability region, while areas where carbon coordinates in solution with both oxygen and hydrogen (e.g., H2CO3 or CH3OH, etc.), demonstrating a partial dissolution of the electrode surface, are labeled with capital letters. CO2 and CH4 are reported in italics, showing regions where these gases are developed. Dash-dot lines [(a) and (b)] enclose the water stability region; (a) corresponds to the lower limit (hydrogen evolution reaction, HER), while (b) indicates the upper limit (oxygen evolution reaction, OER). In the figure, we add the CV paths (vertical black lines) exploited here to prepare the samples and study the blister evolution at different conditions. The CV (vscan = 25 mV/s) acquired at pH = −0.3 (I) starts at a traditional value of 1.0 V and reaches the massive intercalation region at about 2.1 V [7], while the CV at pH = 7 (II), being acquired in an area where bicarbonate ions are present, starts from the open circuit value (OCP) and ends at 2.1 V. The I-CV reaches a region where, due to the solvated anion intercalation [6,10], CO2 evolves both on the surface and on the graphite layers underneath. The pristine HOPG surface morphology (see Figure 2a) is then damaged by blisters that swell the uppermost graphite layers (Figure 2b).
Conversely, the surface morphology acquired in-situ after the II-CV (vscan = 25 mV/s) is almost unaffected (Figure 2c), despite the relatively high EC potential applied to the electrode. Apart from panel (b), where blisters damage the surface with big structures, the comparable morphology between panels (a) and (c) is also confirmed by a roughness estimation. If the latter is defined as the hill-to-valley mean distance in morphology profiles, the pristine HOPG (Figure 2a) shows a roughness of about 2 Å, like the graphite surface studied in panel (c) after the II-CV. The blister formation and growth mechanism have been widely studied and discussed [6,7,8,9,10]. Quite recently, the authors succeeded in describing the EC conditions required to develop blisters (evolution-diagram) at room temperature [11]. In view of observing blisters on the HOPG surface, the electrode must be kept at an EC potential above the OER value within a minimum time interval of about Δt = 4 s [9]. As a countercheck, we have already seen that if the CV scan rate is set to v0 = 600 mV/s, the I-CV is able to intercalate anions while preserving the graphite morphology [20]. In the blister-evolution diagram reported in reference 11, we observe that the CV scan rate, set at v0, represents a critical condition; a slight rate reduction implies the evolution of blisters on the electrode surface. Being a border parameter, I-CV at 600 mV/s allows an analysis of the effect of temperature on the surface blistering. Generally speaking, a change in the electrolyte temperature also modifies the equilibrium conditions of the Pourbaix diagram. In particular, the oxygen reduction frontier (b-line in Figure 1) follows the Nernst equation:
E O 2 / H 2 O = 1.3 0.06 × T 298 × pH
The slope of the b-line changes as a function of the temperature, reducing (expanding) the CO2 region at lower (higher) pH values with respect to 0. When the pH is (close to) zero, as in our I-CV case, the water stability upper limit is almost unaffected by temperature variations, opening the possibility to explore the role of T only in the blister chemical reactions.
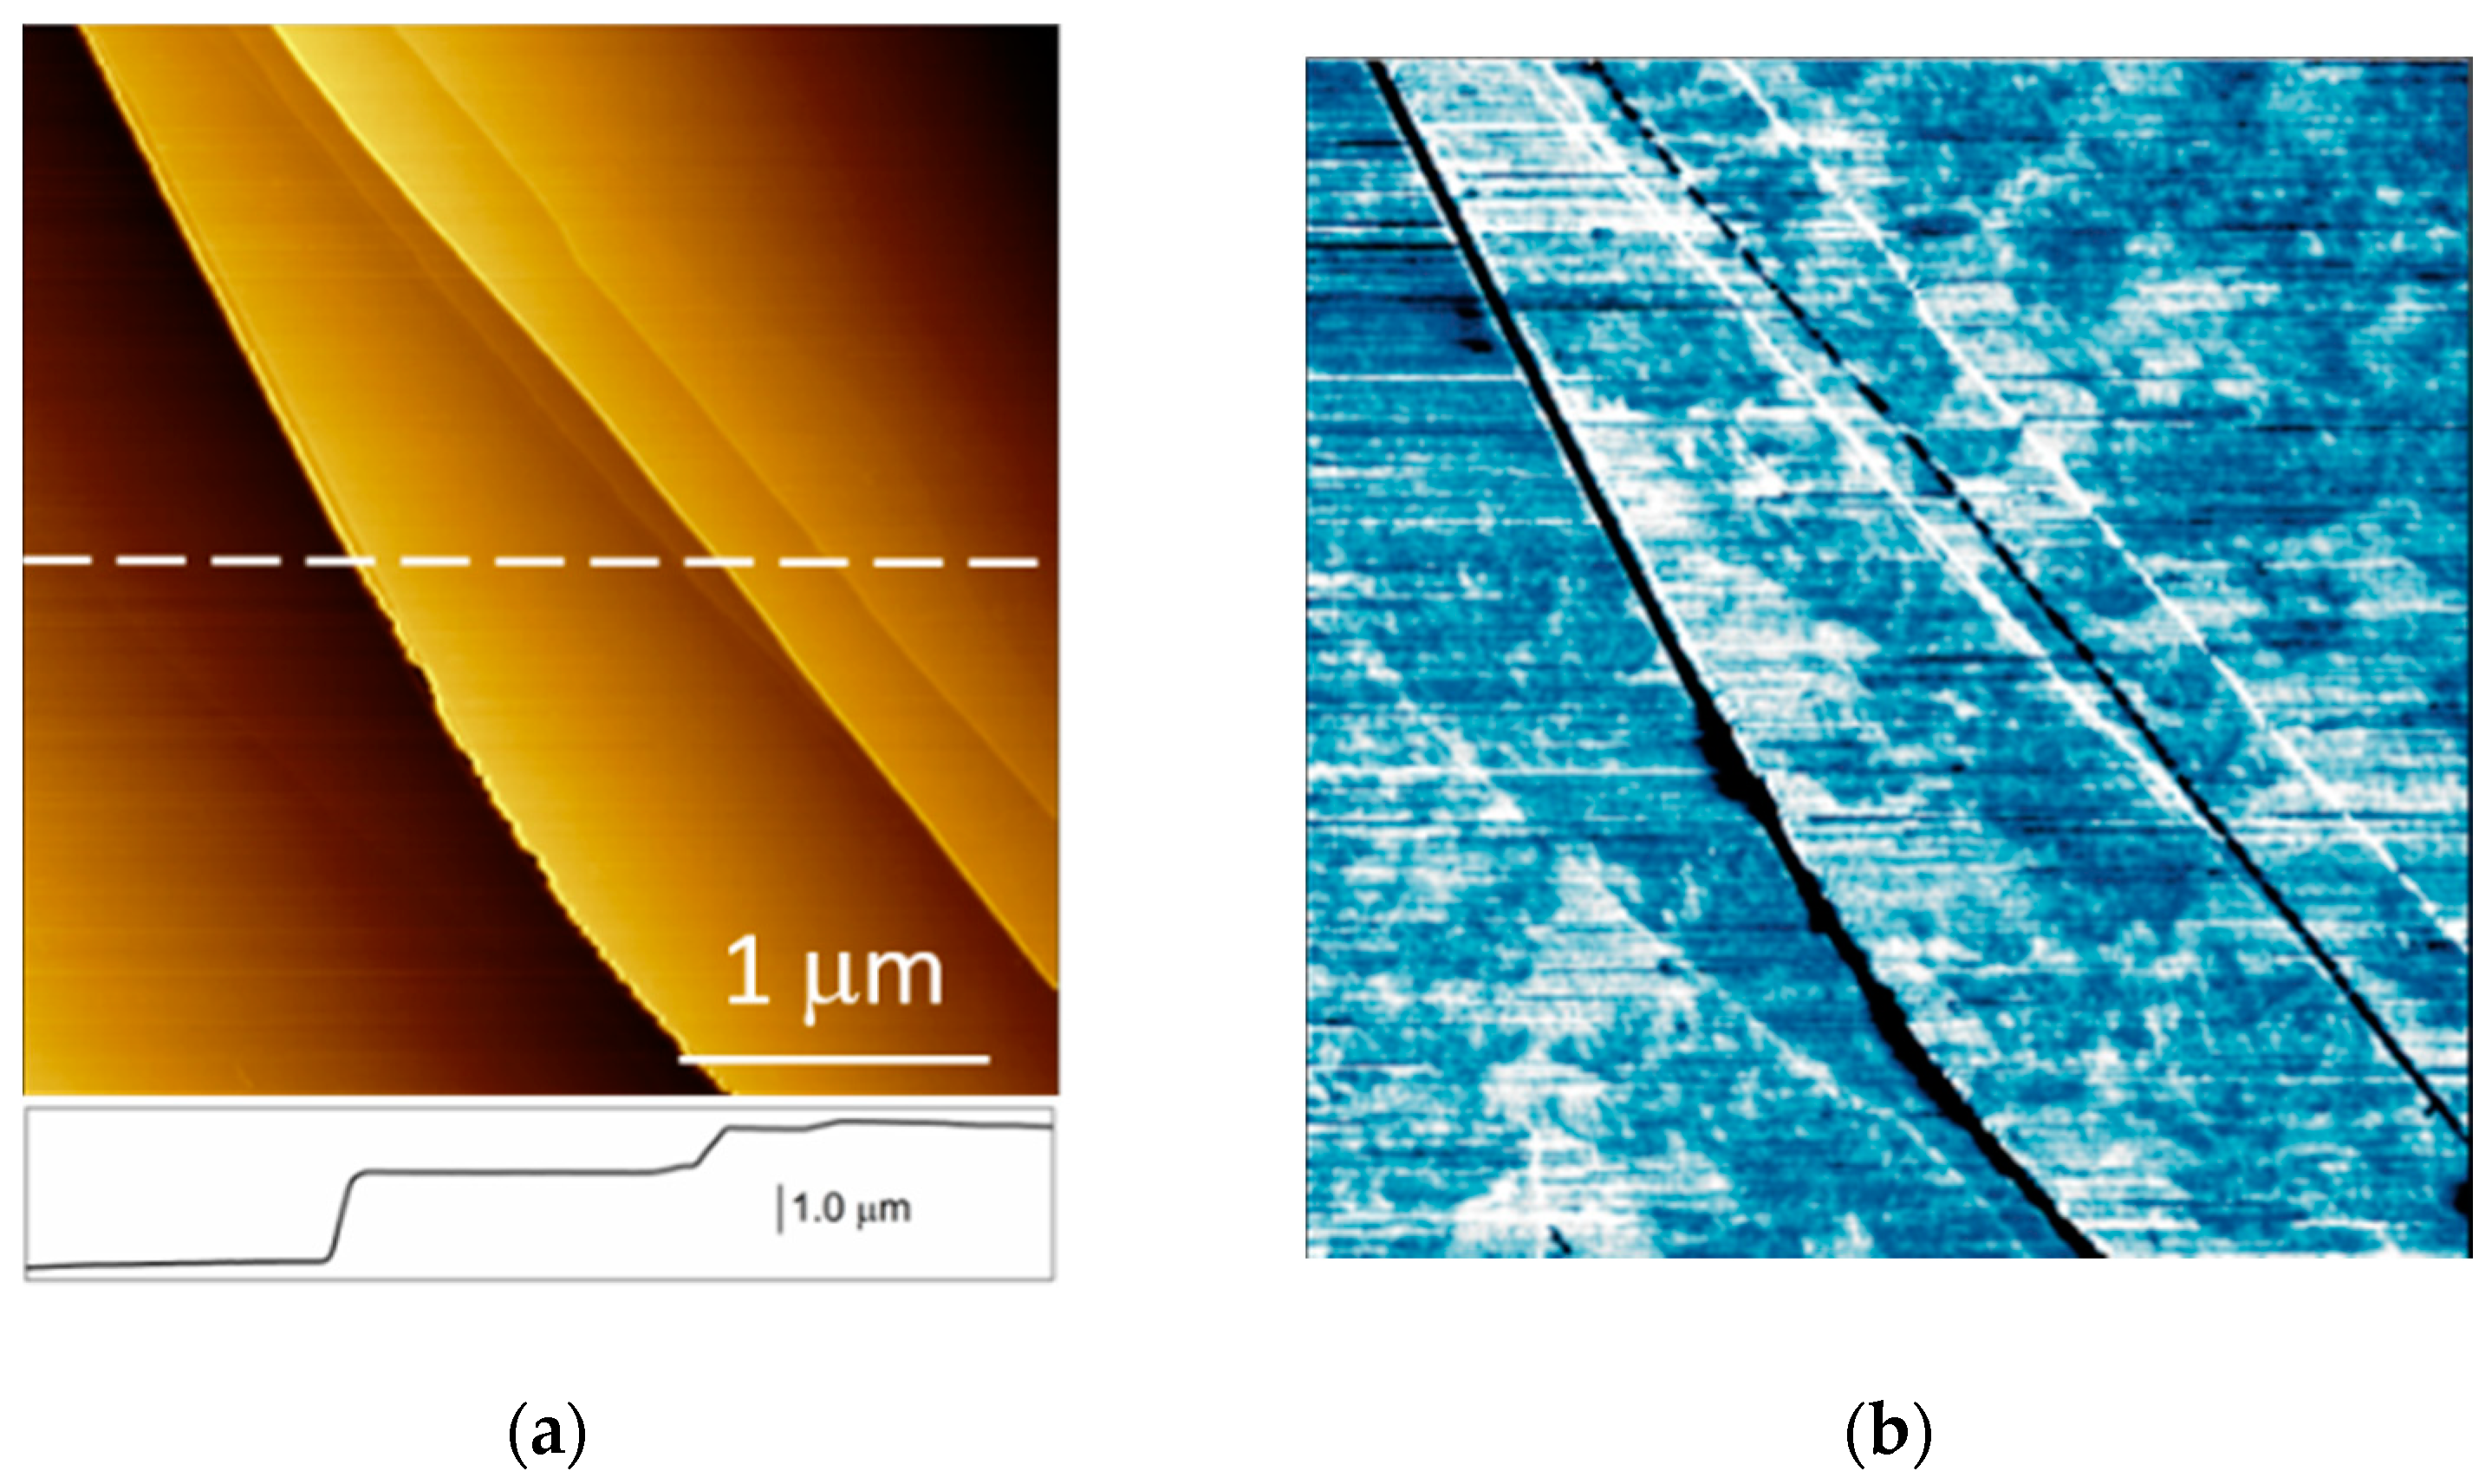
With this aim, a new sample was prepared and immersed inside the electrolyte solution, whose temperature was increased up to 343 K, where the HOPG underwent a single CV scan (v0 = 600 mV/s). The surface morphology, acquired in-situ, is reported in Figure 3a.
Here, sharp step edges are easily observed in close agreement with the pristine graphite (Figure 2a). No evidence of any blister is found by exploring different areas of the electrode surface. This result confirms that the key parameter in blister evolution is the time persistence of the electrode at high EC potentials. Nonetheless, a closer inspection of the HOPG surface reveals something new with respect to the analysis performed at room temperature (RT) [9] and at the same high scan rate [11]. In that case, in fact, the application of high voltages for less than Δt = 4 s induces a carbon dissolution reaction, where graphite terraces are peeled off layer-by-layer. Here, after the CV at 343 K, terraces appear affected by adsorbates, which probably sit on defect sites, such as hollows and cracks, of the surface electrode. Adsorbates are better highlighted by the phase-contrast image reported in Figure 3b (see the darker regions, which correspond to a drop of the phase value with respect to that one of the pristine highly oriented pyrolytic graphite) [21]. In fact, as the phase contrast is sensitive to the local chemical properties of the surface [22], we are able to highlight many discontinuities, not easily discernible in the morphology image (Figure 3a). The surface roughness is also increased with respect to the pristine HOPG by a factor of 2/2.5. We think that chemical reactions between the carbon atoms and the electrolyte anions can preferentially occur in surface hollows and cracks, where different graphite edge-planes are exposed to the hot liquid environment.
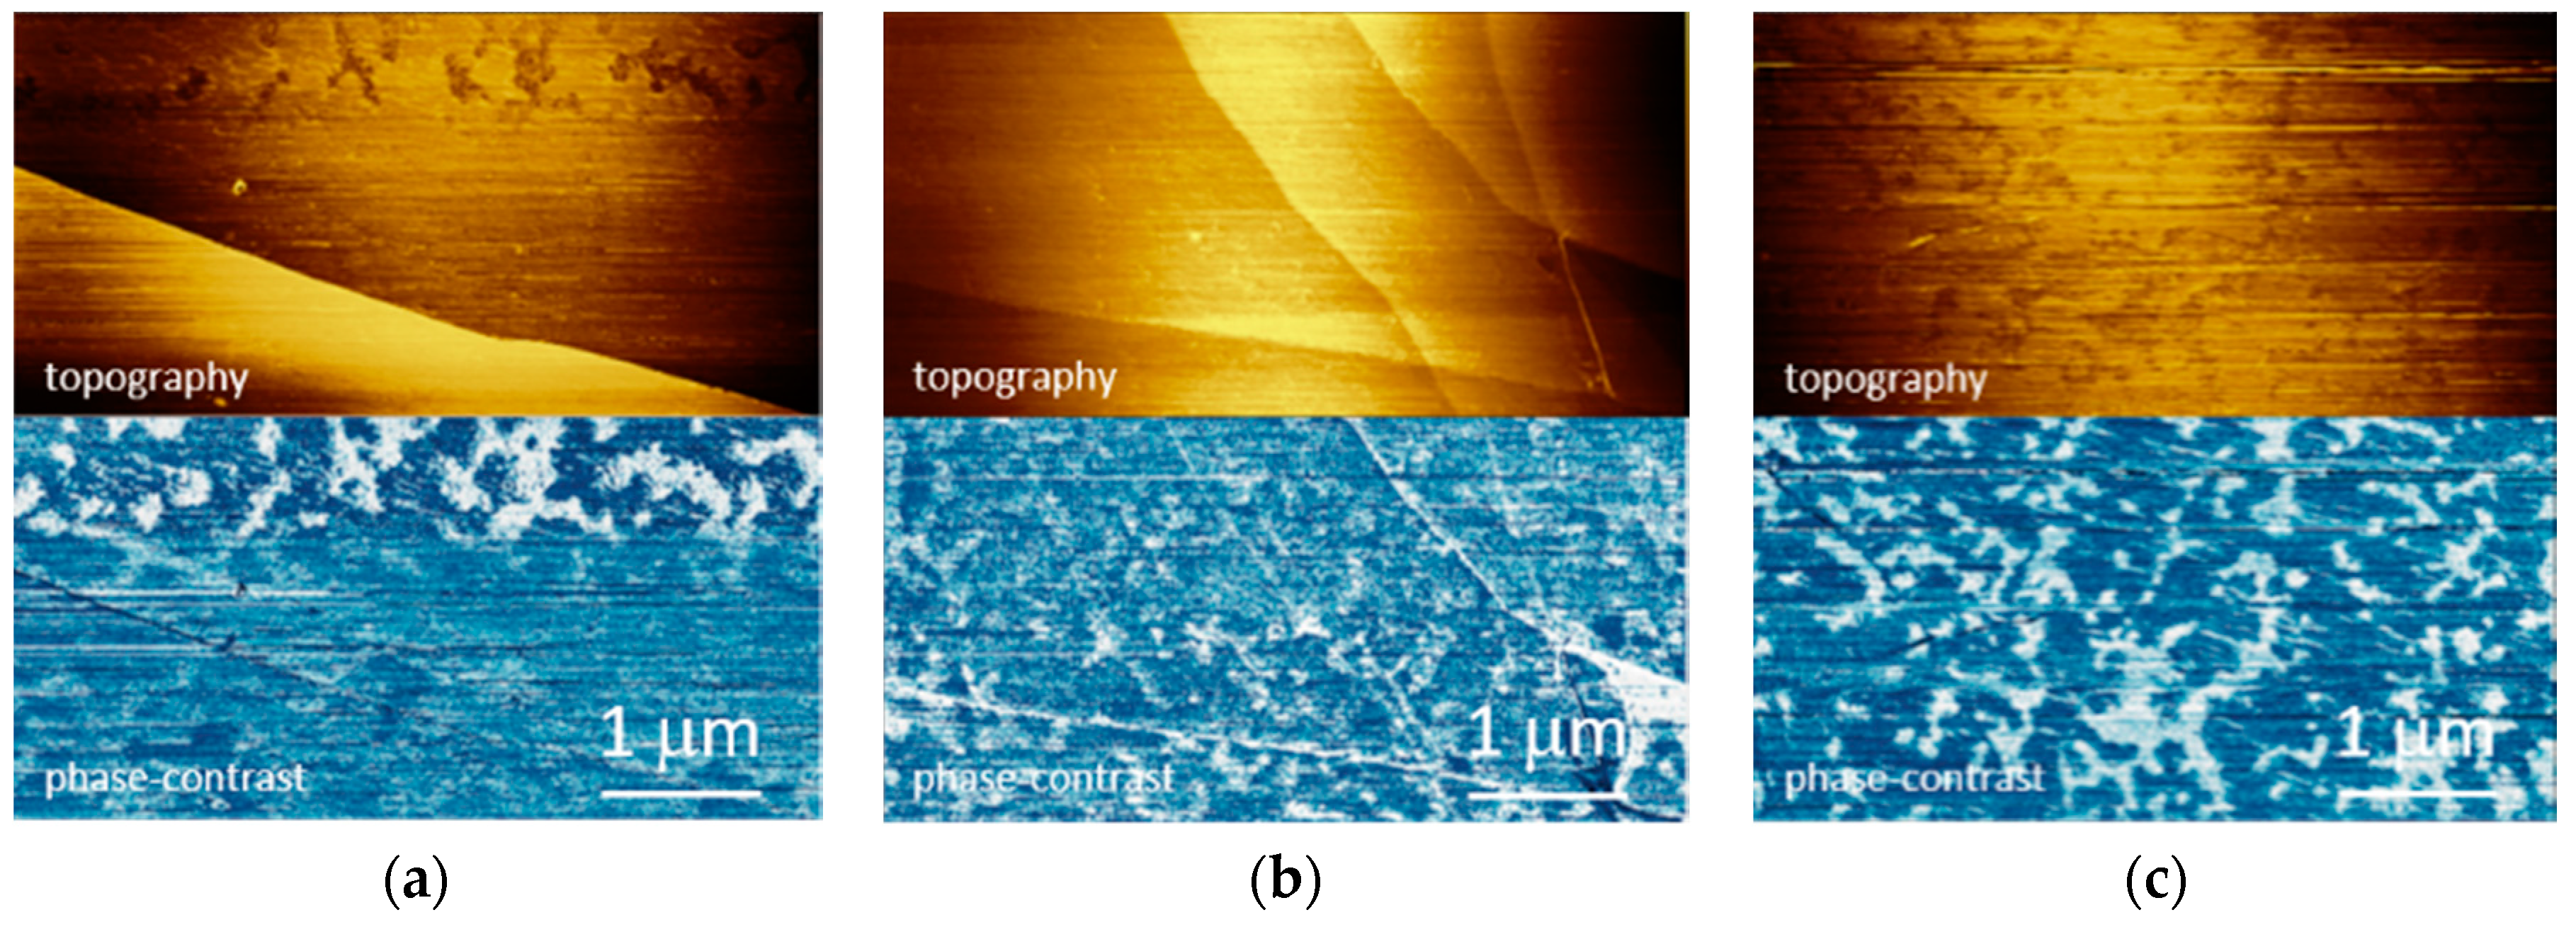
The overall picture that arises from data reported in Figure 3 is confirmed in each experiment performed on HOPG immersed inside a hot acid electrolyte. Nonetheless, the AFM scan is not easy in these experimental conditions; the high temperature induces a mechanical drift of the sample whose surface, due to the presence of adsorbates, can get the tip dirty, leading to a decrease in contrast decreasing and the presence of scrapes in the image. In Figure 4, for example, we report other sample scans where the phase-contrast panels always confirm the presence of adsorbates.

3. Materials and Methods

A z-grade HOPG (Optigraph) sample was used as the working electrode (WE). The specimen was exfoliated by an adhesive tape before each experiment. The three-electrode electrochemical cell exploits a Pt wire as both counter (CE) and reference (RE) electrode. The latter is not properly considered a reference electrode, but its stability (within few tens of millivolt) and potential shift (about 0.7 V) with respect to a standard hydrogen electrode (SHE) has been checked. All the reported EC potential values both in the text and in the figures are always referred to the SHE. The acid electrochemical solution was prepared by diluting sulfuric acid with type 1 water (Merck–Millipore). The 1 M electrochemical solutions (pH = −0.3) were purified by bubbling pure Ar gas for several hours. To change the electrolyte temperature, the WE was placed on a Peltier junction driven by a current generator. A thermocouple was immersed inside the electrolyte to monitor, in real time, the temperature changes. A Keysight 5500 in-situ AFM system was exploited in these experiments. All the images were collected in tapping mode.

4. Conclusions

An in-situ AFM was used to study morphological changes occurring at the graphite surface when the electrode is kept at high anodic potentials inside a hot (343 K) diluted (1 M) acid solution. Generally, when graphite reaches a potential above the oxygen evolution reaction (OER) at RT, gases are developed that swell the stratified crystal and form blisters. The role of temperature in this process has never been considered. Interestingly, we find that blistering is not affected by the temperature variation within the explored interval. Conversely, we observe many adsorbates on the graphite terraces (never reported during analysis at RT) as enhanced by the phase-contrast image, which is sensitive to local chemical changes. An explanation of the chemical origin of these compounds is desired in the future. Nonetheless, the collected results suggest to adopt a strict control of the EC cell temperature during solvated anion intercalation, in order to avoid a wide chemical detriment of the electrode surface.

Author Contributions

Conceptualization, G.B. and R.Y.; methodology, G.B.; investigation, R.Y.; data curation, C.G., M.Z. and L.D.; writing—original draft preparation, G.B.; writing—review and editing, C.G., M.Z. and L.D. The authors are grateful to C. Hogan (Istituto di Struttura della Materia-CNR; ISM-CNR) for useful discussions.

Funding

This research received no external funding.

Conflicts of Interest

The authors declare no conflict of interest.

References

  1. Shi, P.C.; Guo, J.P.; Liang, X.; Cheng, S.; Zheng, H.; Wang, Y.; Chen, C.H.; Xiang, H.F. Large-scale production of high-quality graphene sheets by a non-electrified electrochemical exfoliation method. Carbon 2018, 126, 507–513. [Google Scholar] [CrossRef]
  2. Hofmann, M.; Chiang, W.-Y.; Nguyễn, T.D.; Hsieh, Y.-P. Controlling the properties of graphene produced by electrochemical exfoliation. Nanotechnology 2015, 26, 335607. [Google Scholar] [CrossRef] [PubMed] [Green Version]
  3. Kamali, A.R.; Fray, D.J. Large-scale preparation of graphene by high temperature insertion of hydrogen into graphite. Nanoscale 2015, 7, 11310–11320. [Google Scholar] [CrossRef] [PubMed] [Green Version]
  4. Nuvoli, D.; Valentini, L.; Alzari, V.; Scognamillo, S.; Bon, S.B.; Piccinini, M.; Illescas, J.; Mariani, A. High concentration few-layer graphene sheets obtained by liquid phase exfoliation of graphite in ionic liquid. J. Mater. Chem. 2011, 21, 3428–3431. [Google Scholar] [CrossRef]
  5. Yang, S.; Ricciardulli, A.G.; Liu, S.; Dong, R.; Lohe, M.R.; Becker, A.; Squillaci, M.A.; Samorì, P.; Müllen, K.; Feng, X. Ultrafast Delamination of Graphite into High-Quality Graphene Using Alternating Currents. Angewandte Chem. 2017, 56, 6669–6675. [Google Scholar] [CrossRef] [PubMed]
  6. Goss, C.A.; Brumfield, J.C.; Irene, E.A.; Murray, R.W. Imaging the incipient electrochemical oxidation of highly oriented pyrolytic graphite. Anal. Chem. 1993, 65, 1378–1389. [Google Scholar] [CrossRef]
  7. Bussetti, G.; Yivlialin, R.; Alliata, D.; Li Bassi, A.; Castiglioni, C.; Tommasini, M.; Casari, C.S.; Passoni, M.; Biagioni, P.; Ciccacci, F.; et al. Disclosing the Early Stages of Electrochemical Anion Intercalation in Graphite by a Combined Atomic Force Microscopy/Scanning Tunneling Microscopy Approach. J. Phys. Chem. C 2016, 120, 6088–6093. [Google Scholar] [CrossRef]
  8. Alliata, D.; Kötz, R.; Haas, O.; Siegenthaler, H. In Situ AFM Study of Interlayer Spacing during Anion Intercalation into HOPG in Aqueous Electrolyte. Langmuir 1999, 15, 8483–8489. [Google Scholar] [CrossRef]
  9. Yivlialin, R.; Bussetti, G.; Magagnin, L.; Ciccacci, F.; Duò, L. Temporal analysis of blister evolution during anion intercalation in graphite. Phys. Chem. Chem. Phys. 2017, 19, 13855–13859. [Google Scholar] [PubMed]
  10. Hathcock, K.W.; Brumfield, J.C.; Goss, C.A.; Irene, E.A.; Murray, R.W. Incipient Electrochemical Oxidation of Highly Oriented Pyrolitic Graphite: Correlation between Surface Blistering and Electrolyte Anion Intercalation. Anal. Chem. 1995, 67, 2201–2206. [Google Scholar] [CrossRef]
  11. Yivlialin, R.; Magagnin, L.; Duò, L.; Bussetti, G. Blister evolution time invariance at very low electrolyte pH: H2SO4/graphite system investigated by electrochemical atomic force microscopy. Electrochim. Acta 2018, 276, 352–361. [Google Scholar] [CrossRef]
  12. Rodrigues, M.-T.F.; Sayed, F.N.; Gullapalli, H.; Ajayan, P.M. High-temperature solid electrolyte interphases (SEI) in graphite electrodes. J. Power Sources 2018, 381, 107–115. [Google Scholar] [CrossRef]
  13. Kulova, T.L.; Skundin, A.M.; Nizhnikovskii, E.A.; Fesenko, A.V. Temperature effect on the lithium diffusion rate in graphite. Russ. J. Electrochem. 2006, 42, 259–262. [Google Scholar] [CrossRef]
  14. Levi, M.D.; Wang, C.; Aurbach, D.; Chvoj, Z. Effect of temperature on the kinetics and thermodynamics of electrochemical insertion of Li-ions into a graphite electrode. J. Electroanal. Chem. 2004, 562, 187–203. [Google Scholar] [CrossRef]
  15. Leng, F.; Tan, C.M.; Pecht, M. Effect of Temperature on the Aging rate of Li Ion Battery Operation above Room Temperature. Sci. Rep. 2015, 5, 12967. [Google Scholar] [CrossRef] [PubMed]
  16. Pereira-Ramos, J.-P.; Messina, R.; Piolet, C.; Devynck, J. Investigation of lithium intercalation materials with organic solvent and molten salts as electrolytes at temperatures between 60 and 175 °C. J. Power Sources 1987, 20, 221–230. [Google Scholar] [CrossRef]
  17. Gründler, P. History of Modern Thermoelectrochemistry. In In-Situ Thermoelectrochemistry. Monographs in Electrochemistry; Springer: Berlin/Heidelberg, Germany, 2015. [Google Scholar]
  18. Khateeb, S.A.; Farid, M.M.; Selman, J.R.; Al-Hallaj, S. Design and simulation of a lithium-ion battery with a phase change material thermal management system for an electric scooter. J. Power Sources 2004, 128, 292–307. [Google Scholar] [CrossRef]
  19. Varcoe, J.R.; Atanassov, P.; Dekel, D.R.; Herring, A.M.; Hickner, M.A.; Kohl, P.A.; Kucernak, A.R.; Mustain, W.E.; Nijmeijer, K.; Scott, K.; et al. Anion-exchange membranes in electrochemical energy systems. Energy Environ. Sci. 2014, 7, 3135–3191. [Google Scholar] [CrossRef] [Green Version]
  20. Jagadeesh, M.S.; Calloni, A.; Denti, I.; Goletti, C.; Ciccacci, F.; Duò, L.; Bussetti, G. The effect of cyclic voltammetry speed on anion intercalation in HOPG. Surf. Sci. 2019, 681, 111–115. [Google Scholar] [CrossRef]
  21. Jagadeesh, M.S.; Bussetti, G.; Calloni, A.; Yivlialin, R.; Brambilla, L.; Accogli, A.; Gibertini, E.; Alliata, D.; Goletti, C.; Ciccacci, F.; et al. Incipient Anion Intercalation of Highly Oriented Pyrolitic Graphite Close to the Oxygen Evolution Potential: A Combined X-ray Photoemission and Raman Spectroscopy Study. J. Phys. Chem. C 2019, 123, 1790–1797. [Google Scholar] [CrossRef]
  22. Bussetti, G.; Campione, M.; Riva, M.; Picone, A.; Raimondo, L.; Ferraro, L.; Hogan, C.; Palummo, M.; Brambilla, A.; Finazzi, M.; et al. Stable Alignment of Tautomers at Room Temperature in Porphyrin 2D Layers. Adv. Funct. Mater. 2014, 24, 958–963. [Google Scholar] [CrossRef]
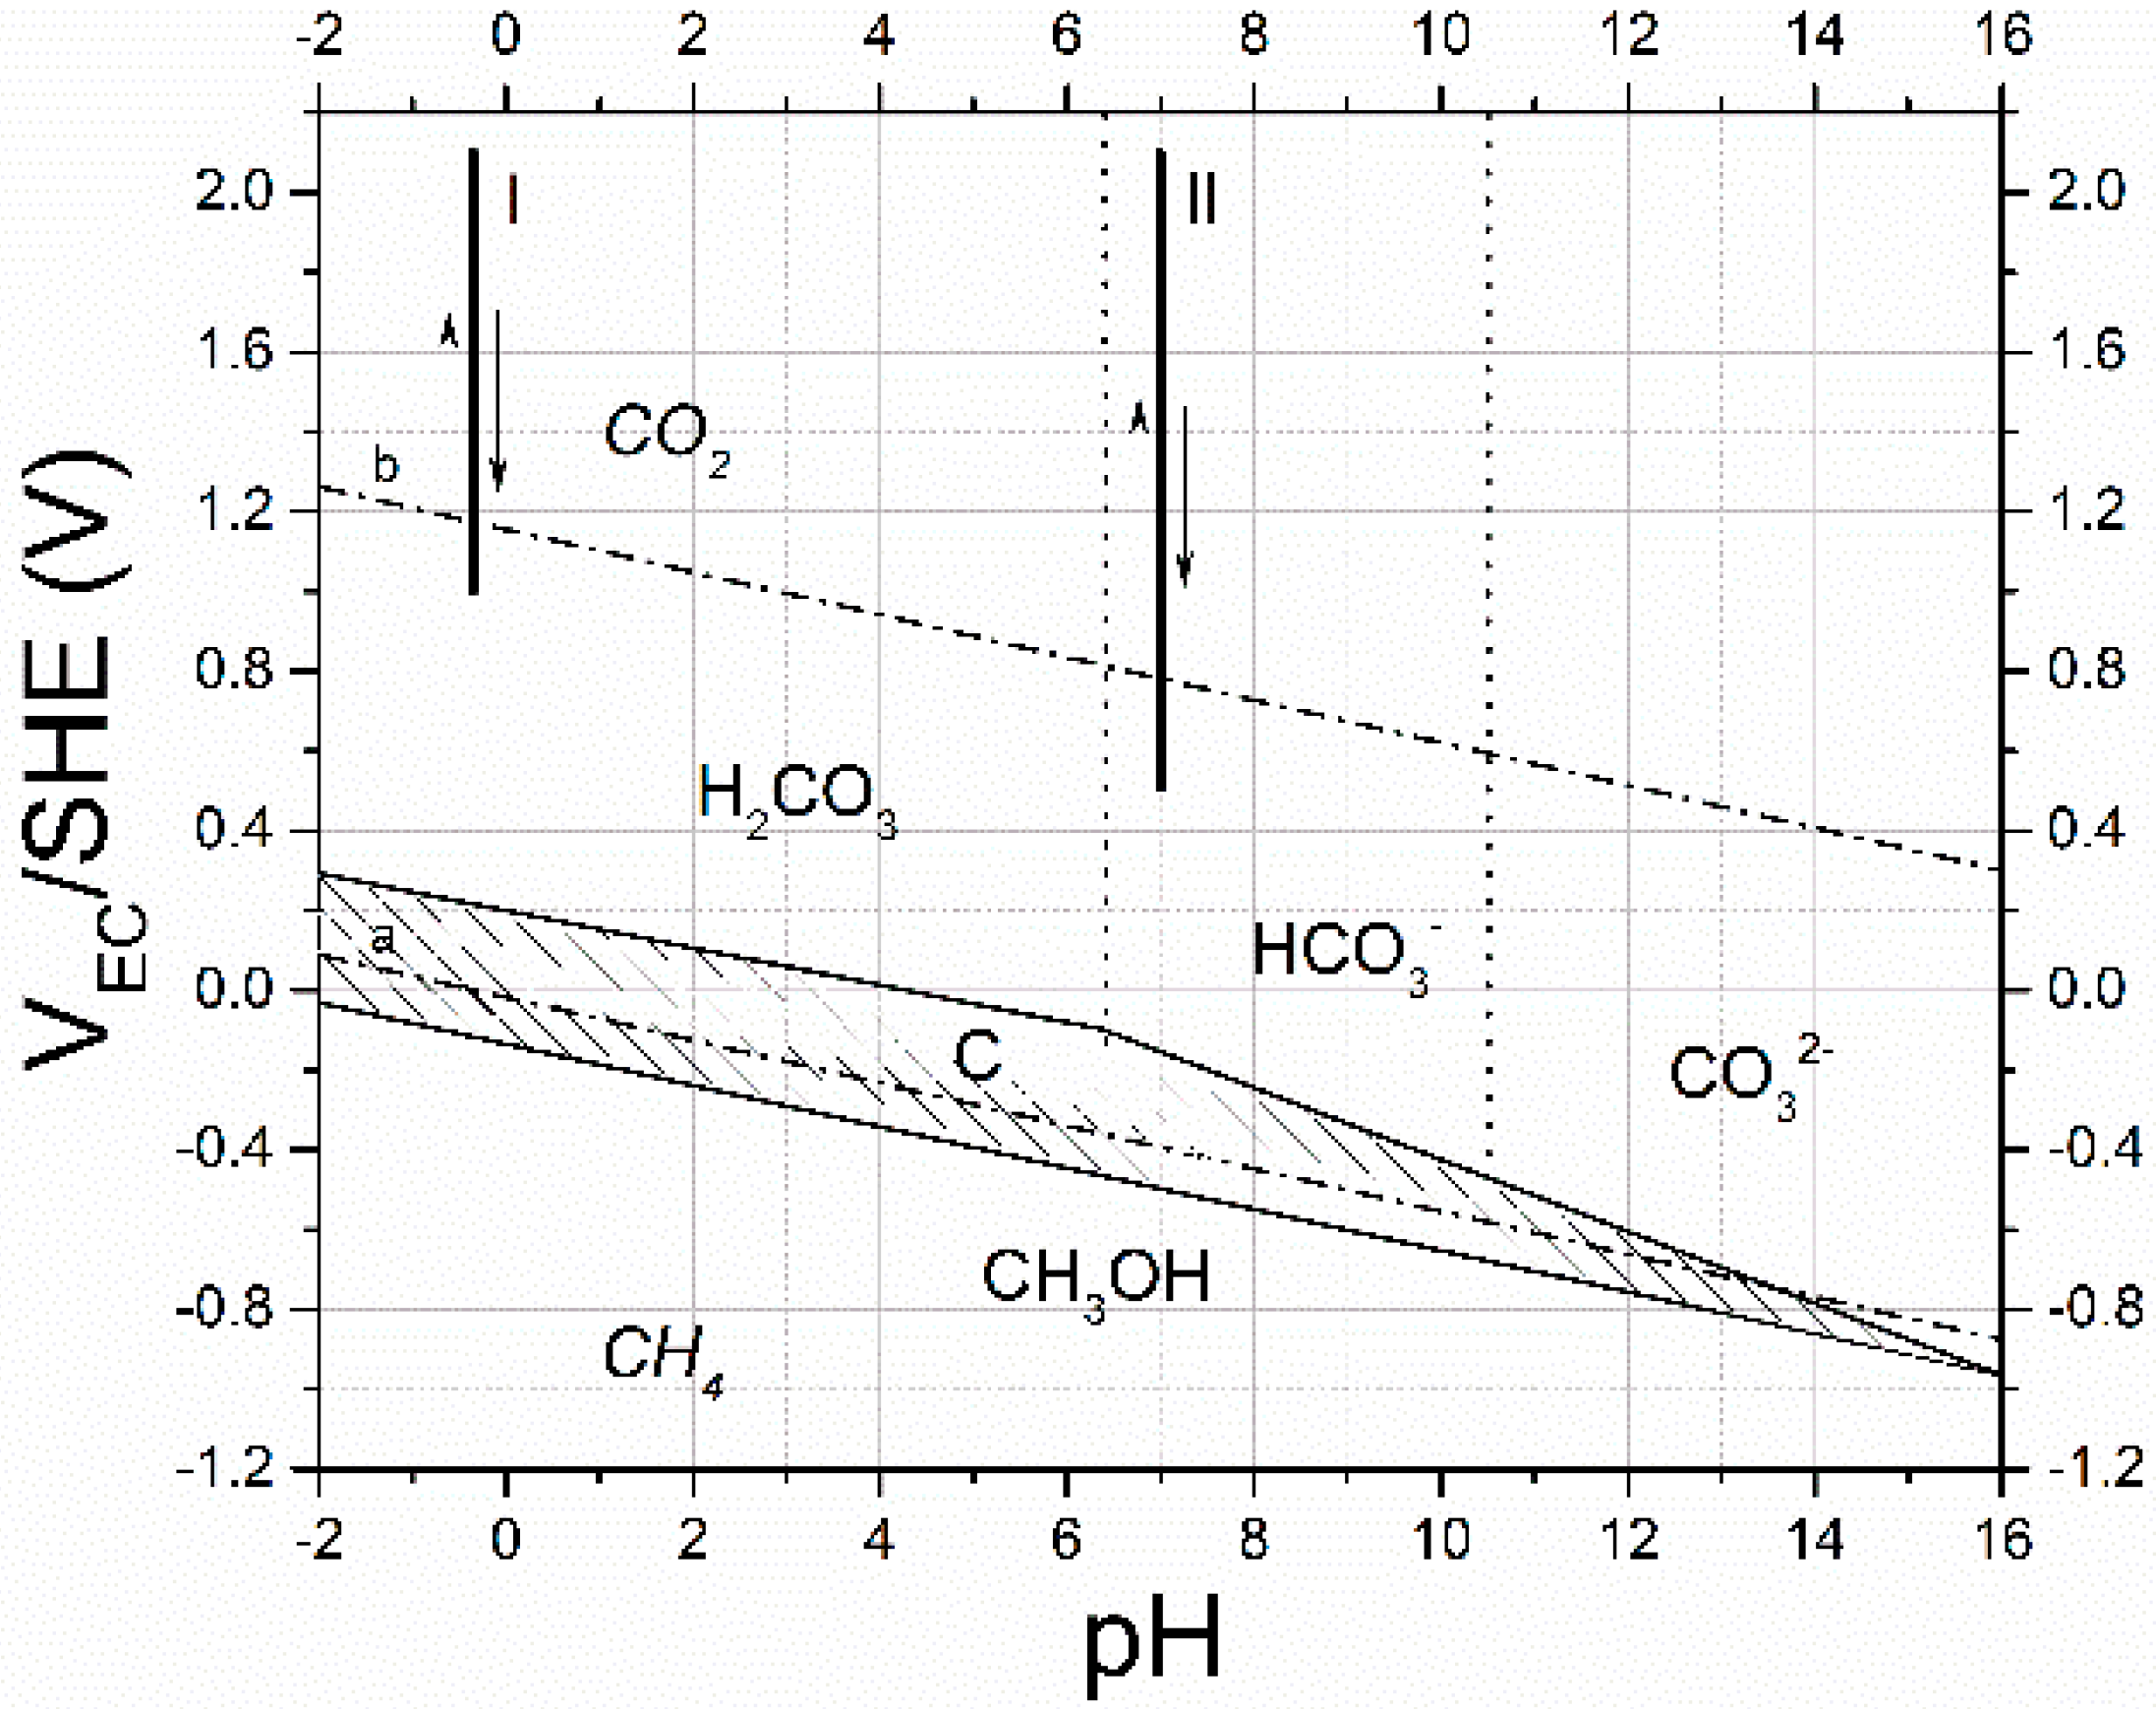
Figure 1. Pourbaix diagram of carbon (see text for details). The vertical black thick lines represent the scanned regions by cyclic-voltammetries (see arrows) during the preparation of the samples.
Condensedmatter 04 00023 g001
Figure 2. In-situ atomic force microscopy (AFM) images (a) of the pristine graphite, (b) after the I-CV and (c) after the II-CV.
Condensedmatter 04 00023 g002
Figure 3. (a) In-situ AFM image of the HOPG surface morphology after a CV at v0 = 600 mV/s inside a hot (343 K) electrolyte. (b) Phase-contrast image of a graphite terrace. Darker regions correspond to adsorbates, which probably sit in defect sites of the electrode surface.
Condensedmatter 04 00023 g003
Figure 4. In-situ AFM images (topography and phase-contrast) of three different sample (panels ac) scans (after a CV at v0 = 600 mV/s, electrolyte at 343 K). The presence of adsorbates is enhanced by the phase-contrast images.
Condensedmatter 04 00023 g004