Article

Using Muscle Element Fingerprint Analysis (EFA) to Trace and Determine the Source of Hypophthalmichthys nobilis in the Yangtze River Basin

1
East China Sea Fisheries Research Institute, Chinese Academy of Fishery Sciences, Shanghai 200090, China
2
School of Environment and Architecture, University of Shanghai for Science and Technology, Shanghai 200093, China
*
Authors to whom correspondence should be addressed.
Fishes 2024, 9(8), 316; https://doi.org/10.3390/fishes9080316
Submission received: 5 July 2024 / Revised: 7 August 2024 / Accepted: 7 August 2024 / Published: 9 August 2024

Abstract

:
Hypophthalmichthys nobilis are widely distributed in the Yangtze River basin and its related lakes. They are an important economic fish species and are a famous cultured species known as the “Four Famous Domestic Fishes” in China. Currently, with the fishing ban in the Yangtze River basin, fishing for H. nobilis in the natural water bodies of the Yangtze River basin has been completely prohibited. In order to identify the sources of H. nobilis appearing in the market, further control and accountability is necessary to trace the sources of H. nobilis in the Yangtze River basin and its related water bodies. Therefore, this study identified and traced different sources of H. nobilis through muscle element fingerprint analysis (EFA). The results show that H. nobilis from different stations have characteristic element compositions. The characteristic element of H. nobilis from Wuhan (WH) is Pb, which is significantly higher than that in other stations; the characteristic element from Anqing (AQ) is Hg, which is significantly higher than that in other stations; and the characteristic element from Taihu (TH) is Al, which is significantly higher than that in other water areas. Multivariate analysis selected different spatial distribution patterns in four discriminative element ratios (Pb/Ca, Cr/Ca, Na/Ca, and Al/Ca) in the muscle of H. nobilis in the Yangtze River basin and its related lakes. This study suggests that the screened discriminative elements can be used to visually distinguish different sources of H. nobilis and to quickly trace and verify the origin of newly emerging samples. Therefore, the use of selected discriminative element fingerprint features to trace the origin of new samples has been proven to be feasible. By further discriminating and verifying the muscle element fingerprints of new samples, the discrimination rate is high. Therefore, a multivariate analysis of muscle element fingerprints can be used for tracing the origins of samples of unknown origin in market supervision.
Key Contribution: Hypophthalmichthys nobilis is an important fishery resource in the Yangtze River basin and its related lakes. With the implementation of the Yangtze River Fishing Ban policy, it is necessary to trace and determine the source of H. nobilis that appear in the market. This study is based on an analysis of differences in element fingerprints in muscle samples. Using discriminant methods in a multivariate analysis, 4 different element ratios were selected from 19 element ratios to trace the different sources of H. nobilis. A positive control (PC) validation analysis was conducted to demonstrate the effectiveness of the four selected element ratios’ compositions in distinguishing and tracing the sources of H. nobilis in the Yangtze River basin. This discrimination method can be used to trace the origin of H. nobilis in the market, which can meet the discrimination needs for unknown source samples of H. nobilis in market supervision and has important application value.

1. Introduction

Hypophthalmichthys nobilis is an economically important fish species in China, widely distributed in the major water systems in the eastern part of China [1]. H. nobilis is mainly cultured in the middle and lower reaches of the Yangtze River and the eastern and southern coastal areas of China, such as Hubei, Jiangxi, Guangdong, Hunan, Jiangsu, and Anhui provinces [2]. In the 1970s, the United States introduced H. nobilis, and it is now widely distributed in the Mississippi River basin [3]. H. nobilis is one of the important “Four Famous Domestic Fishes” in China, which are the main freshwater aquaculture fishes, and it is the significant stocked fish and pond culture species, with high economic value, high protein, and low fat content, and is an important dietary source for humans [1]. In recent years, with the impact of environmental pollution, engineering construction, and overfishing, the fishery resources in the Yangtze River have continued to decline. In order to better protect the aquatic resources in the Yangtze River and its related water bodies, the “Ten-Year Fishing Ban” was implemented on 1 January 2020, prohibiting the fishing of natural H. nobilis resources in the main stream and the important tributaries of the Yangtze River. As a result, the natural catching of H. nobilis has decreased. Some traders, in pursuit of profit, are resorting to illegal fishing of H. nobilis in the natural water bodies of the Yangtze River. Therefore, it is crucial for the management and accountability of illegal fishing activities to discriminate and trace the origin of H. nobilis found in the market.
Currently, there are various methods for discriminating and tracing aquatic species from different sources, such as a single method based on individual morphological characteristics [4], otolith morphology [5], genetic sequences [6], fatty acid composition [7], isotope differences [8], and element fingerprint analysis (EFA) [9], or a combination of these methods for discrimination [10,11]. EFA has been proven to be a very useful technology for distinguishing biological species or populations and has been widely applied in studies related to the geographical tracing of aquatic species and safety assessments of aquatic products [9,12,13,14]. The elements in EFA can come from otoliths, the whole body, and muscles, etc. [5,15,16]. In the past, otoliths’ EFAs have commonly been used in various ecological studies of fish [17,18,19,20], especially in studies related to the life history [21,22]. This method typically requires complex sample preparation procedures and advanced instrument equipment [23]. The selection of samples should take into account species differences, detection costs, and method sensitivity. For H. nobilis in this study, with its larger size reaching a maximum length of 146 cm and typically around 60 cm in length, using their whole bodies for samples poses challenges due to the large sample size [1]. Obtaining otoliths from H. nobilis is difficult due to their hard skulls, which results in high processing and time costs. Therefore, to facilitate the determination of the source of unknown origin H. nobilis samples in market supervision, this study selected the muscle tissue of H. nobilis from different sources and analyzed their element fingerprint patterns to trace the origins of different H. nobilis samples.
In recent years, EFA has been applied to the identification of illegally sourced aquatic products in the market and the differentiation of water products from different sources [24,25,26]; hence, in this study, for the traceability determination of aquatic products in the market, a simpler method was chosen by using only a part of the fish’s muscles instead of their whole bodies or small otoliths as experimental materials. The aim of this study is to distinguish H. nobilis samples from different sources in the Yangtze River basin and its related lakes using an EFA of their muscle. By proposing a more convenient, cost-effective, and less sample-consuming method, the results of this study can guide the traceability discrimination of suspicious samples in market monitoring by collecting a small amount of local muscle samples, and are expected to provide the technology and methods for the traceability and management of illegal fishing of this species in future market supervision.

2. Materials and Methods

2.1. Sampling Sites, Sample Collection, and Processing

From September to December 2023, seventeen individuals of H. nobilis were selected from three stations in the Yangtze River basin: Wuhan (WH), Anqing (AQ), and Taihu (TH) (Figure 1, Table 1). To authenticate the new source samples, five individuals were randomly selected from AQ as positive controls (PC-AQ). The gill nets with different mesh size (from 3 cm to 21 cm) were set up for sampling and the samples were collected after placing for 12 h. Upon boarding the ship, fish samples were labeled with sampling point coordinates and placed in plastic bags. The samples were then frozen at −20 °C until they were processed in the laboratory.
In the laboratory, all samples were thawed. Standard lengths were measured in centimeters, and fresh weights were measured in grams (±0.1 g). In all of the samples, the dissection tools and sample processing devices were rinsed six times with Milli-Q water (Millipore Corp., Burlington, MA, USA), dissected with stainless steel surgical knives and scissors, and the dorsal muscles were taken from the anterior, middle, and posterior regions of the fish’s back, mixed together, and cut into small pieces for thorough drying. After 24 h of freeze-drying at −48 °C, the samples were ground into fine powder using a tissue grinder and immediately placed into a desiccator before analysis.
Each dry sample (0.5 ± 0.005 g) was placed in a digestion tube, and 10 mL of purified HNO3 (MOS Reagent, Sinopharm Chemical Reagent Co., Ltd., Shanghai, China) was added and left to stand for 3 h. Then, 2 mL of purified HClO4 was added to each tube. Finally, an electric hot plate was used to digest all samples at 150 °C and the fully digested samples were quantitatively transferred to a 100 mL calibration flask containing Milli-Q water [15].

2.2. Elemental Analysis

Total concentrations of 20 elements in pre-digested samples were measured using the instruments and methods of ICP-OES (Agilent, 720ES) for the elements of potassium (K), sodium (Na), and calcium (Ca), and ICP-MS (Agilent, 7700) for the elements of mercury (Hg), lead (Pb), chromium (Cr), cadmium (Cd), copper (Cu), zinc (Zn), nickel (Ni), arsenic (As), magnesium (Mg), iron (Fe), aluminum (Al), manganese (Mn), molybdenum (Mo), strontium (Sr), barium (Ba), titanium (Ti), and vanadium (V) [27,28,29]. The calibration standard solutions consist of different certified reference materials, including mixed element material of Cd, Pb, Cr, Cu, Zn, Ni, As, Mg, Fe, Al, Mn, Sr, Ba, Ti and V (GSB 04-1767-2004), and the single element materials of Hg (GSB 04-1729-2004), Na (GSB 04-1738-2004), K (GSB 04-1733-2004), Ca (GSB 04-1720-2004) and Mo (GSB 04-1737-2004) from the National Nonferrous Metals and Electronic Materials Analysis and Testing Center, National Standard (Beijing) Inspection and Certification Co., Ltd., China. All these analyses were repeated three times.

2.3. Data Analysis

The content of Ca is moderate, and showed no significant differences among different groups, which was used to do a sort of normalization to eliminate individual differences among different stations. The raw data on the content of the 19 elements were divided by the content of Ca to obtain the data on the ratios of the 19 elements to Ca, which were expressed on this basis [26]. One-way analysis of variance (ANOVA) was performed on the elemental ratios from different stations in order to test the differences between the groups at a significance level of α = 0.05 for each element [30]. The multivariate analysis models were then used to detect spatial patterns in these three stations [31]. First, a principal component analysis (PCA) was applied to detect the overall pattern of elemental variation. A stepwise linear discriminant analysis (LDA) was applied to develop a set of discriminant functions that were derived from the 19 elements ratios that were able to discriminate between different groups. The discriminative element ratios selected through stepwise discrimination are used for traceability discrimination of new source samples. Hierarchical cluster analysis (HCA) was applied to further explore the reasons for the elemental composition differences in muscles of H. nobilis from different stations [32,33]. Statistical analysis was performed using the software IBM SPSS Statistics 25.0.

3. Results

3.1. Elemental Fingerprints Composition

The non-parametric tests were conducted on the 19 element ratios in the muscle of H. nobilis from different stations in the Yangtze River basin to analyze the overall differences in elemental composition among them. The results showed that there were significant differences (p < 0.05) in the four element ratios (Hg/Ca, Pb/Ca, Al/Ca, and Mn/Ca) in the muscle of H. nobilis among the three groups, while the differences in the remaining 15 elements ratios were not significant (p > 0.05) (Table 2).
A one-way ANOVA was performed on the 19 element ratios in the muscle of H. nobilis to compare the differences in elemental composition among the three groups. Significant differences (p < 0.05) were observed in the ratios of two elements (Hg, Pb) between WH and AQ groups, two elements (Pb and Al) between the WH and TH groups, and three elements (Hg, Al, and Mn) between AQ and TH groups. The four element ratios (Hg/Ca, Pb/Ca, Al/Ca, and Mn/Ca) with significant differences identified among the three stations were selected for quantitative analysis (Figure S1). Looking at the differences in element ratios among different groups, the Hg/Ca ratios in AQ was significantly higher than that in other groups, the Pb/Ca ratios in WH were significantly higher than that in other groups, and the Al/Ca ratios in TH were significantly higher than that in other groups (p < 0.05). Mn/Ca ratios in WH showed no significant difference with that in AQ and TH, respectively (p > 0.05). Therefore, the Hg/Ca, Pb/Ca, and Al/Ca ratios can be used as characteristic indicators for the AQ, WH, and TH groups, respectively.

3.2. Principal Component Analysis (PCA)

To screen and determine the main characteristic elemental indicators in the composition of H. nobilis groups from different stations, PCA was performed on the ratios of 19 elements. A total of five principal components (PC1 to PC5) were derived (Table 3).
As shown in Table 3, the top five indicators contributing to PC1 were K, Zn, Na, Mg, and Mo, while the top five indicators contributing to PC2 were Cd, Ni, Cu, As, and Mn, and the top three indicators contributing to PC3 were Al, Cr, and Pb. It was observed that the top five elemental indicators in PC1 did not show significant differences among the samples from different stations. PC2 only showed a significant difference in the element ratios of Mn between AQ and TH. On the other hand, Al in PC3 was significantly different between TH and WH, as well as TH and AQ, while Pb was significantly different between WH and AQ, as well as WH and TH (Table 2 and Table 3).
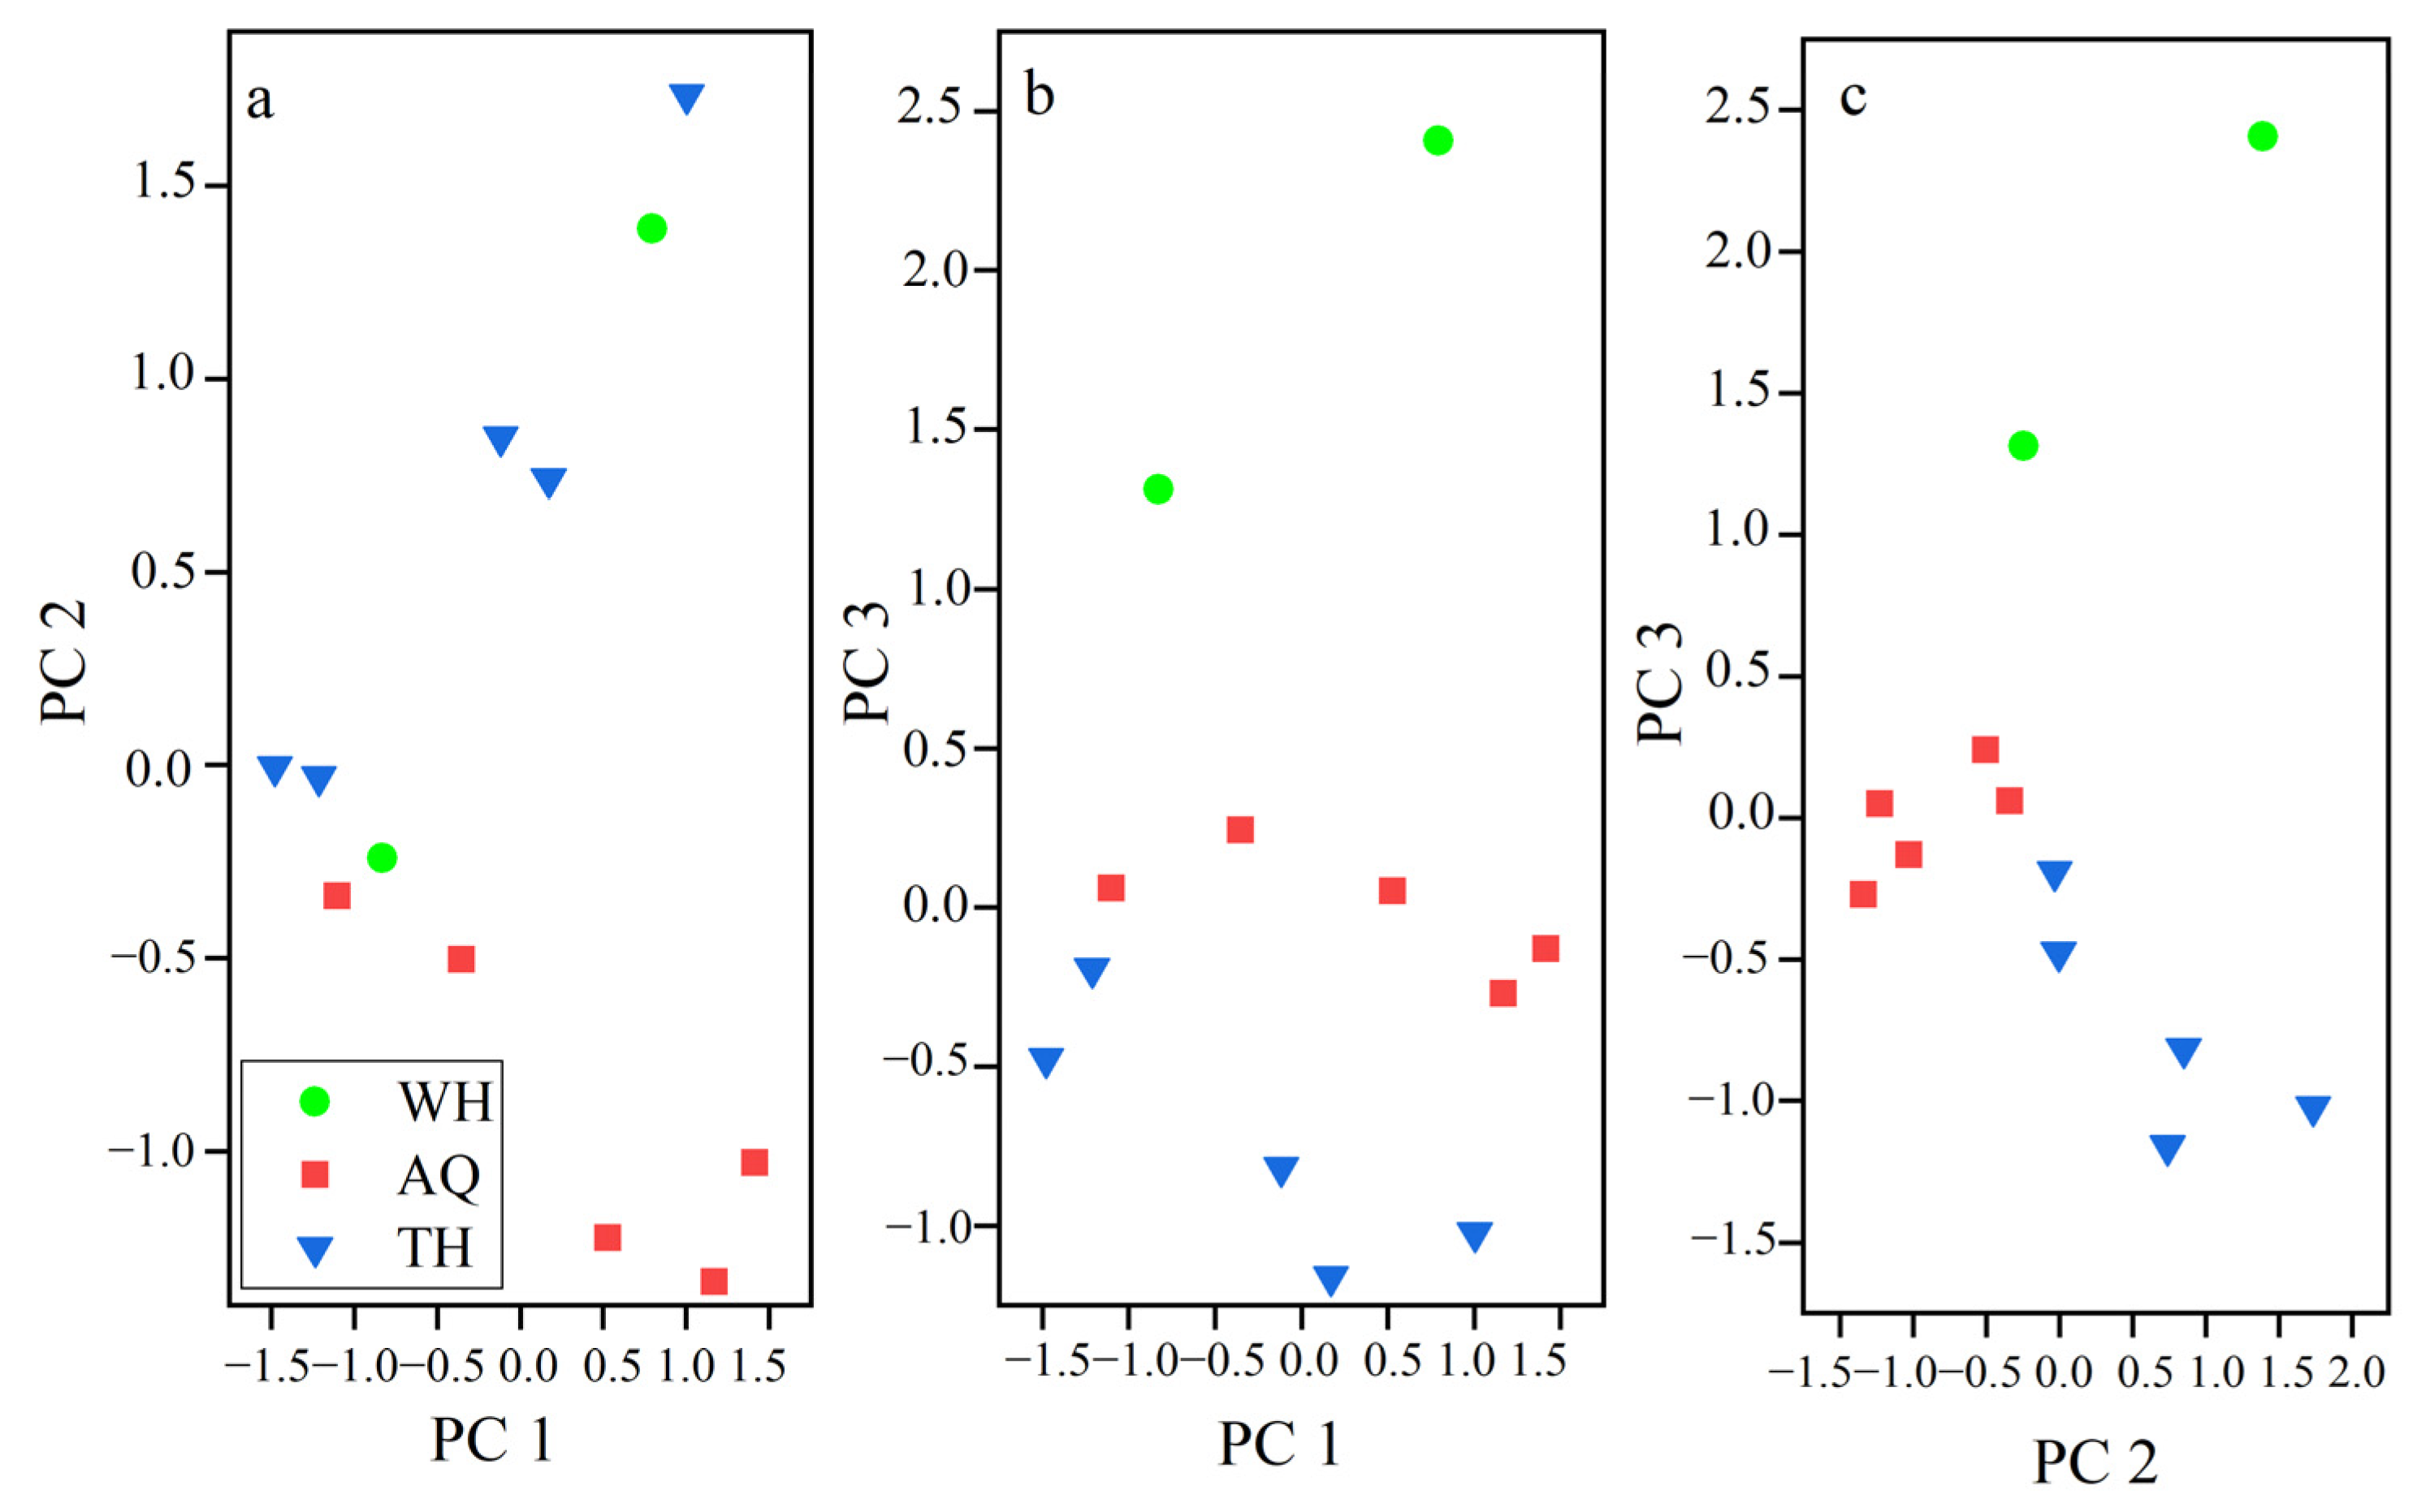
In the scatter plot formed by PC1 and PC2 (Figure 2a), the main elemental indicators from different stations were close to each other, with only a few elemental indicators showing differences. As indicated by the main elemental indicators in PC2, Mn showed no significant difference between WH and AQ, as well as between WH and TH, so the scatter plot formed by PC1 and PC2, the elemental composition of WH, merged with AQ and TH (Figure 2a). As there were no significant differences for the main elemental indicators of Pb and Al in PC3 between AQ and the other groups, in the scatter plot formed by PC1 and PC3, the elemental composition in AQ was distributed between WH and TH (Figure 2b). On the other hand, Mn in PC2 from AQ and TH, Pb in PC3 from WH and the other two stations, and Al in PC3 from TH and the other two stations showed significant differences. Therefore, on the scatter plot composed of PC 2 and PC 3, there are more differences in the elemental composition of the three groups, each of which is relatively concentrated and distinct (Figure 2c). It can be seen that through the scatter plots formed by PC1 and PC2, as well as PC1 and PC3, the three groups could not be effectively distinguished as the main elements (K, Zn, Fe, Mg, and Na) in PC1 showed no significant differences among the different groups, indicating overall similarity in the elemental composition of H. nobilis muscle from different stations. However, through the scatter plots formed by PC2 and PC3, a preliminary differentiation in the three groups could be made, primarily because the main elements Mn in PC2, and Pb and Al in PC3, showed certain differences among the three groups. Especially in terms of the composition of minority elements in PC3, there are significant differences between Pb in WH and Al in TH compared to the other two stations, indicating that the differences between samples from different stations are mainly manifested in the few characteristic elements in PC3.

3.3. Discriminant Element Screening

LDA was conducted on the composition of 19 elemental ratios in H. nobilis muscle from different stations in the Yangtze River basin, resulting in a discriminative equation with four elemental coefficients as independent variables, including four elemental ratios of Pb/Ca, Cr/Ca, Na/Ca, and Al/Ca (Table 4). From the discriminant coefficients of each element ratio, it can be seen that Pb/Ca had the largest coefficient in WH, while Al/Ca had the largest coefficient in TH, indicating that Pb and Al were the main differential elements among the three stations.
The results of the stepwise discriminant analysis showed an overall discriminant success rate of 100.00% among the 12 individuals of H. nobilis from the three stations. The results of the cross-validation were consistent with the stepwise discriminant results (Table S1). The three groups in the discriminant analysis scatterplot were scoped with circles, which showed that the elemental composition of H. nobilis in the three groups can be clearly distinguished (Figure S2).
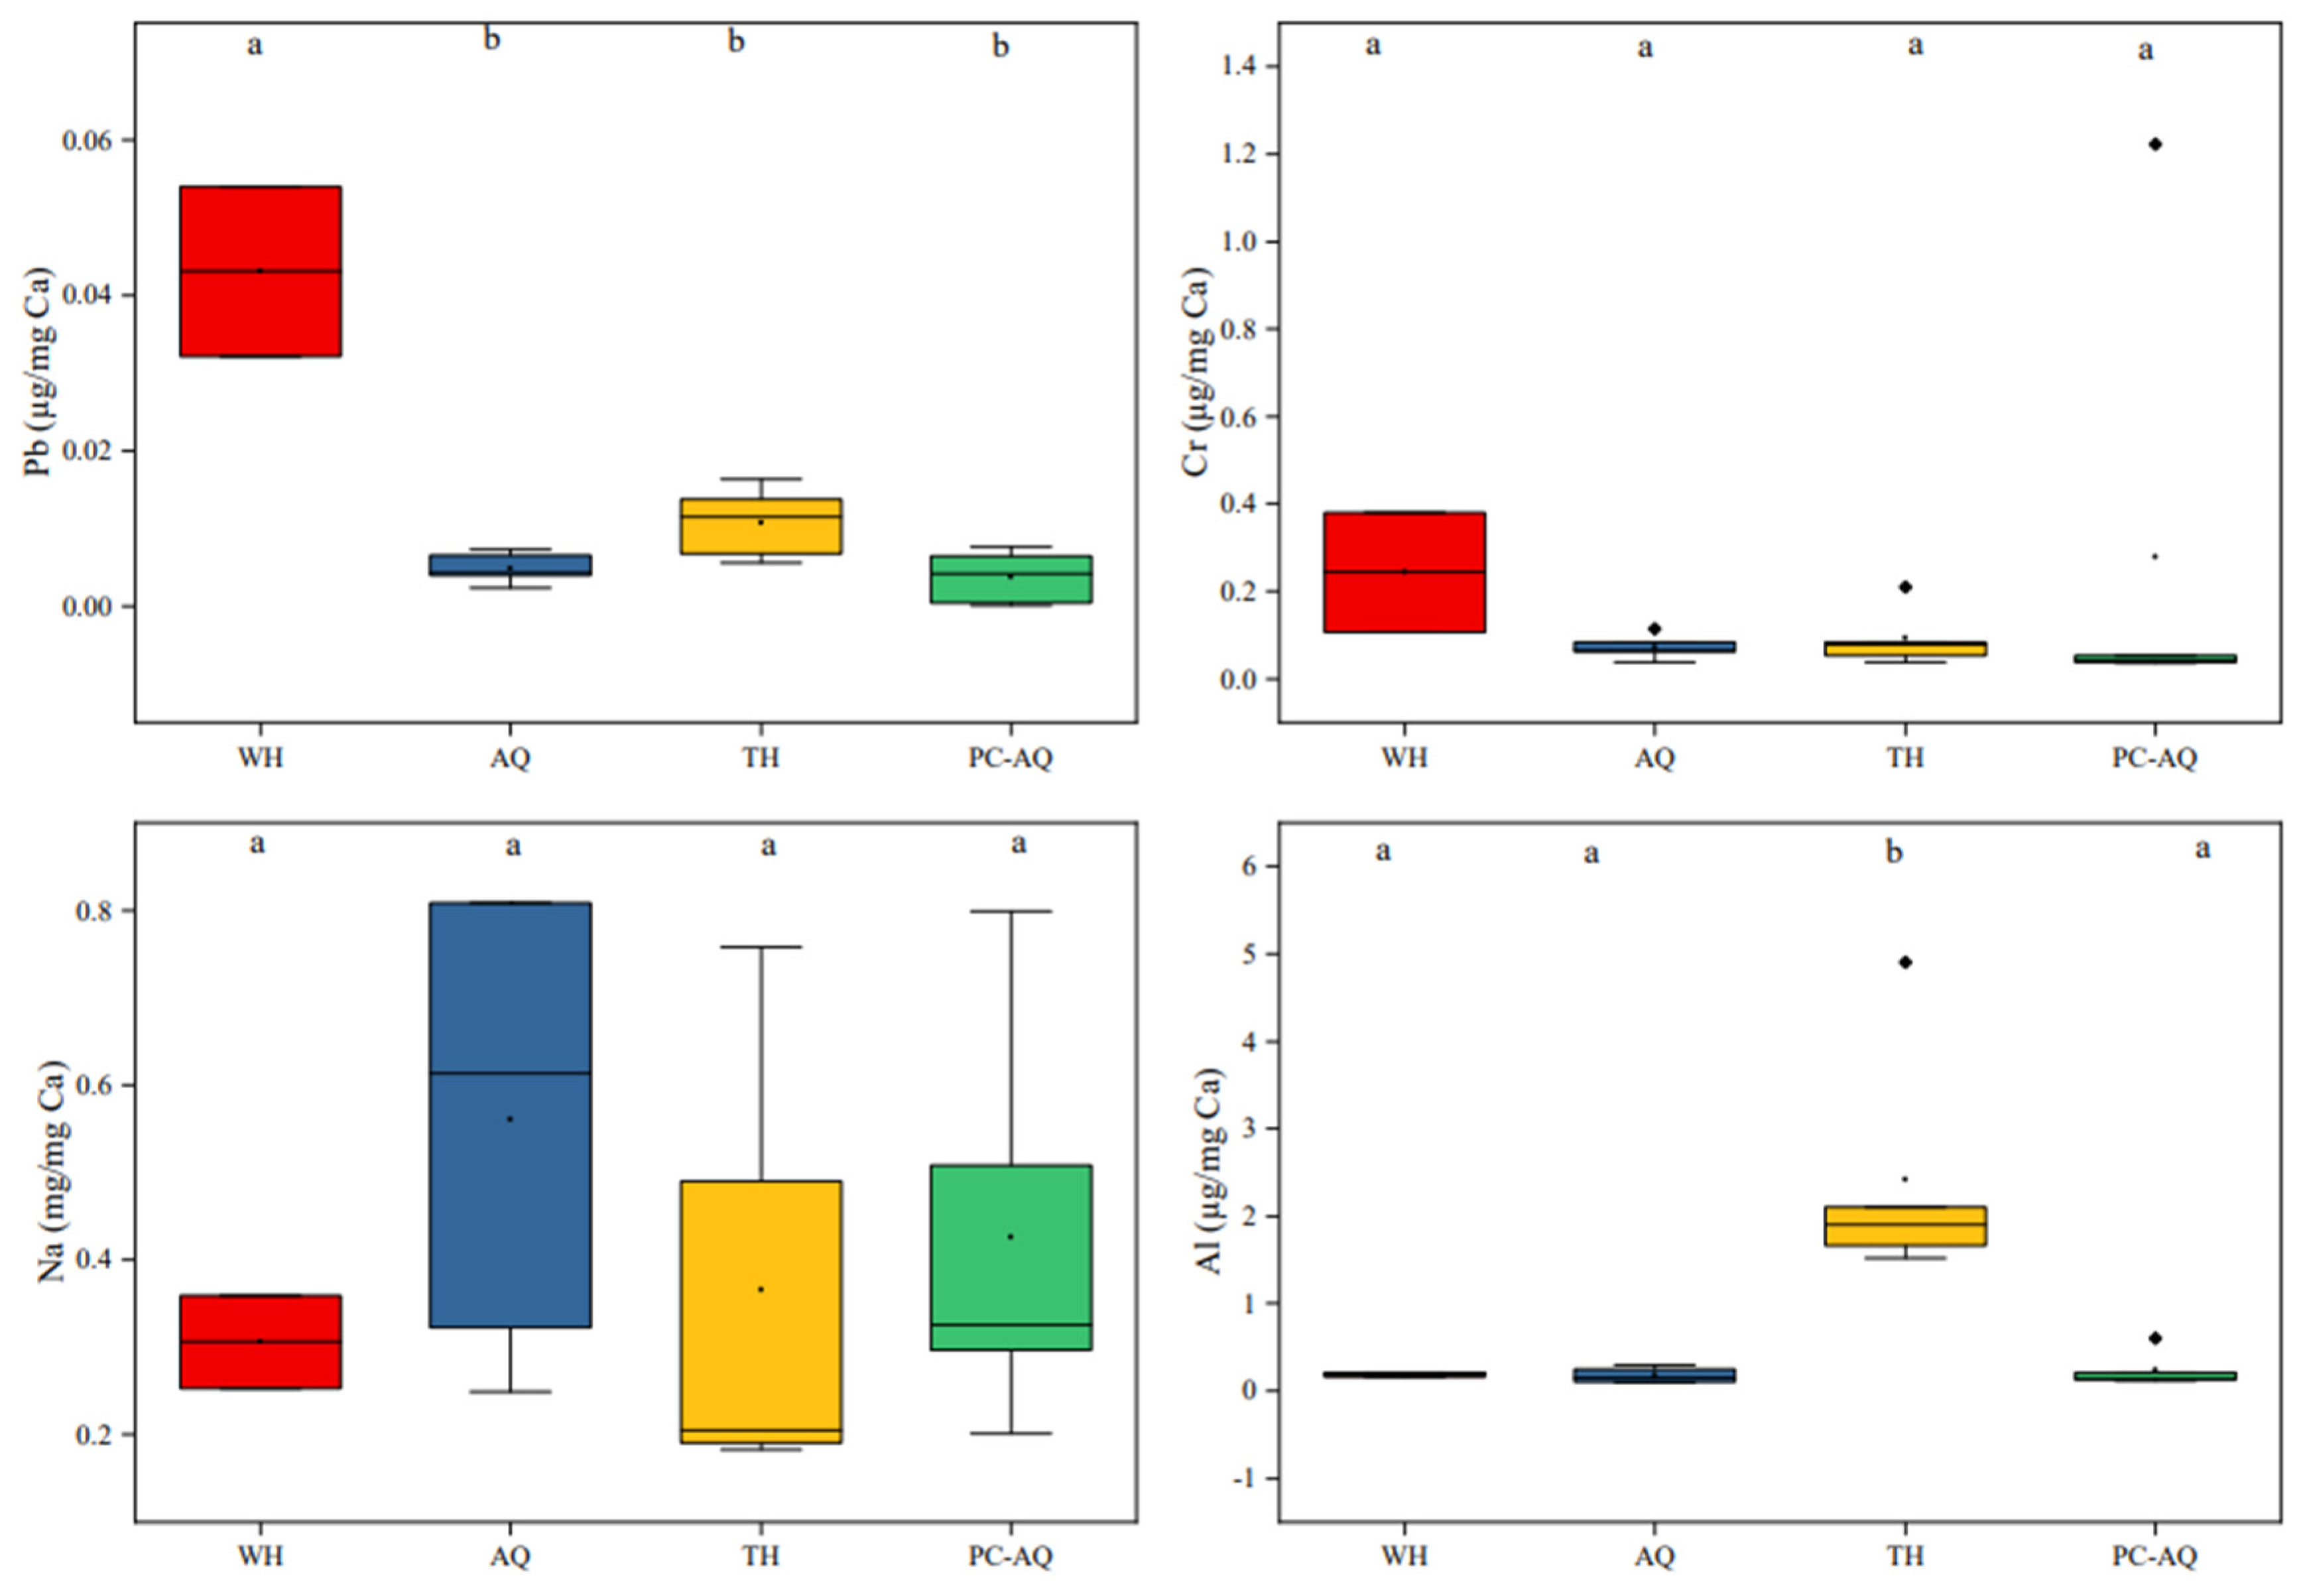
In order to further confirm whether the four selected discriminative element ratios can be used to determine the unknown source samples, the positive controls of PC-AQ, and the elements ratios from three stations of WH, AQ, and TH were analyzed (Figure 3). The Pb/Ca ratios in WH were significantly higher than that in other groups, the Al/Ca ratios in TH were significantly higher than that in other groups, and the Cr/Ca and Na/Ca ratios showed no significant differences among these four groups. As shown in Figure 3, Pb/Ca showed a significant difference between PC and WH, while Al/Ca showed a significant difference between PC and TH. However, there are no significant differences in these four element ratios between PC and AQ, and it can be seen that the distribution of these four elements ratios is similar between PC and AQ, and it can be preliminarily inferred that the PC and AQ groups have similar sources.

3.4. Traceability and Verification Analysis

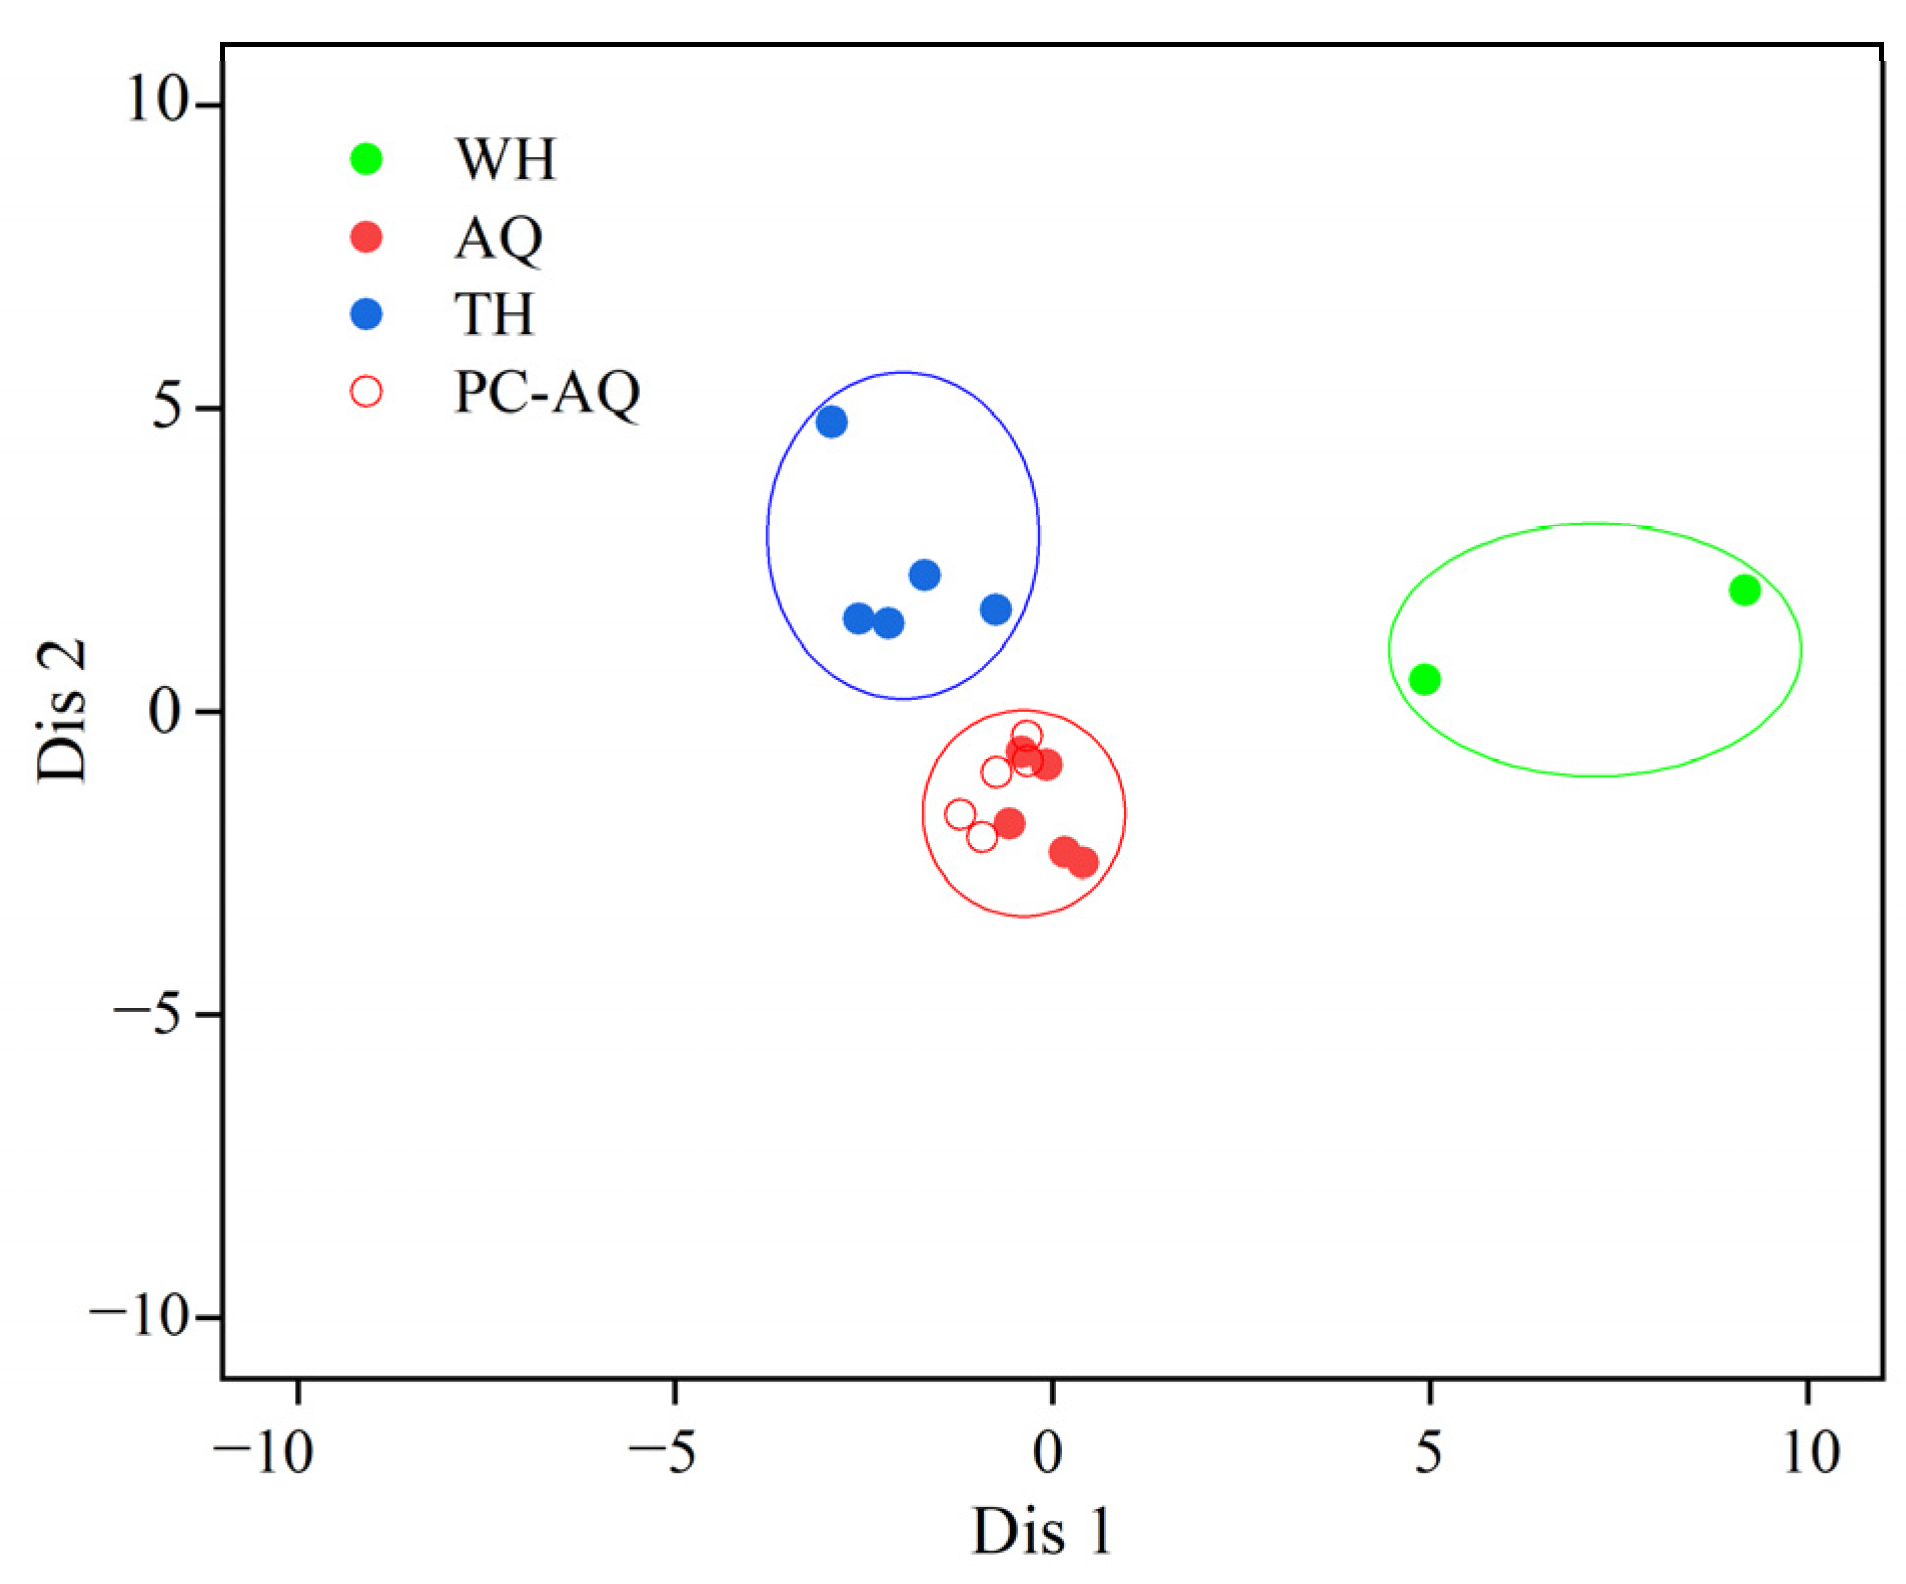
In order to further verify the source of the newly collected samples, the LDA of the four discriminant element ratios of H. nobilis muscle from three stations in the Yangtze River basin and the PC-AQ group were performed, and scatter plots of discrimination are shown in Figure 4.
Figure 4 clearly shows that the PC-AQ group and AQ group are fused into one group, so the PC-AQ group were included into the AQ group for further verification in the subsequent discriminant analysis, and the overall discriminant success rate of the total samples from AQ was obtained to be 100.00% (Table 5). The results showed that, with the addition of the PC group, the overall discrimination success rate of 17 H. nobilis individuals from the three stations was still 100.00%. The results of cross verification were consistent with the results of stepwise discrimination (Table 5). It can be seen that the new samples can be effectively traced by these four discriminant element ratios that have been screened.

4. Discussion

Due to the large size of H. nobilis, having an average standard length of 64.94 cm and the average wet weight of 4811.75 g, it is difficult to obtain their whole bodies and otoliths [1,34,35], which is also due to the presence of incomplete individuals on the market, and it is not suitable to obtain whole body and otolith samples. In this study, based on the biological characteristics and ecological habits of H. nobilis [1], muscle tissue was selected as the research material to analyze the elemental composition of H. nobilis from different stations in the Yangtze River basin.
There are various discrimination and identification methods for samples from different sources or populations, including individual morphology, otolith morphology, isotopes, fatty acids, molecular methods, etc. [4,5,6,7,8]. However, the above methods have some shortcomings in the discrimination and traceability analysis for different sources of H. nobilis in this study. For example, all samples in this study are of the same species, and therefore using molecular analysis methods [36] to identify population differences are not entirely effective due to the similarities in the same species. Traditional otolith microchemistry analysis can differentiate fish populations from different regions and is relatively stable and unaffected by external factors [5]. However, this method is usually applied to the study of the habitat connectivity of species from different sources [37,38], while the present work mainly investigates the differences between species from different sources for traceability research. Moreover, the cost of otolith detection is high, and complicated pretreatment is needed [39]. In contrast, EFA used in this study provides a more accurate indicator for distinguishing river sections based on the accumulation of elements in muscles from the environment during growth [40]. Additionally, the cost of muscle element analysis is lower, requiring only simple pre-treatments [12]. In this study, based on the stability of element accumulation in muscles and the unique advantages of EFA in sample processing and analysis, EFA was applied to trace and determine the source of samples from different stations.
In order to further explore the reasons for the successful use of the muscle EFA method to trace and verify the sources of different H. nobilis samples, the HCA was conducted on the identified four discriminative element ratios in the muscles of H. nobilis from different stations. The results showed the minimum distance was 0.042 between WH and AQ, while the maximum distance was 5.005 between WH and TH (Table S2). The cluster dendrogram showed that the difference between WH and AQ was relatively small, while TH exhibited greater differences from the other two stations (Figure S3). It is possibly due to the fact that WH and AQ are sections of the Yangtze River that are open and interoperable with each other, with fewer differences, whereas TH is a relatively closed lake with greater differences from the other two stations (Figure 1). In terms of the reasons for the differences, we can discuss them through the elemental content characteristics of the watersheds. Some studies pointed out that Pb pollution is mainly distributed in the middle reaches of the Yangtze River [41,42], so the Pb contents in the muscle of H. nobilis from WH in the middle reaches of the Yangtze River is greater than that from the other two stations. The reason for the higher Al content in TH may be the developed Al industry in Wuxi and the surrounding areas, with bauxite smelters and Al manufacturing plants around the TH watershed, discharging industrial wastewater with a high Al content [43,44]. The study of the source distribution and composition of heavy metals in the sediments of the lower Yangtze River and estuaries showed that the concentration of Hg in AQ section is relatively high compared to the other two stations [45]. Through above analysis, it was found that the differences between samples from different sources are related to the ecological habits of H. nobilis and the geographical distribution of the key element composition in different stations. Although there is a certain correlation between the element contents and the pollution status of the corresponding water bodies. However, considering the elements distribution represents a long-term accumulation effect that is relatively stable and will not show significant changes. Given the stability of the long-term accumulated background values formed in different sections of the Yangtze River, using the discriminant elements selected from different sites in this study for source tracing remains effective and has practical value.
Overall, in this study, the EFA method was used to determine and trace the origin of H. nobilis from different sources. This is closely related to the geographical distribution characteristics of the sampling stations for H. nobilis in the Yangtze River basin, the biological and ecological habits of H. nobilis, and the stability of accumulated discriminative elements in H. nobilis muscles. On this basis, a series of methods such as one-way ANOVA, PCA, LDA, and HCA in multivariate analyses were used to screen out a few key discriminant elements for traceability and validation of H. nobilis samples from different sources, ensuring the credibility and effectiveness of the discriminant results. At the same time, by selecting a small number of key discriminative elements from multiple elemental compositions and successfully applying them to the discriminative verification of new source samples, the simplicity of the analysis method and its operability in market supervision applications are ensured, which has important practical value.

5. Conclusions

This study utilized multidimensional statistical analysis to investigate the differences of 19 element ratios in the muscle of H. nobilis from different stations in the Yangtze River basin. This study successfully identified the main elements in the muscle tissues from three stations and selected four differential elements for further analysis and verification, demonstrating the feasibility and effectiveness of using muscle element fingerprints to differentiate H. nobilis from different sources. The results of the present work indicate that Al, Mn, Hg, and Pb are the main differential elements in the muscle of H. nobilis from three stations, with Pb and Al being the primary elements used to distinguish H. nobilis from different sources. The results of this study provide technical support and a theoretical basis for the source identification of H. nobilis from different stations in the Yangtze River basin.

Supplementary Materials

The following supporting information can be downloaded at: https://www.mdpi.com/article/10.3390/fishes9080316/s1. Table S1: Results of discriminant analysis for 19 element ratios in the muscle of H. nobilis from three stations in the Yangtze River basin; Table S2: Euclidean distance among 4 discriminant elements ratios in the muscles of H. nobilis from three stations in the Yangtze River basin. Figure S1: Element to Ca ratios of H. nobilis muscle from three stations in the Yangtze River basin (WH, AQ, and TH). WH: Wuhan; AQ: Anqing; TH: Taihu. Different letters (a, b) denote significant differences between groups of samples; Figure S2: Scatter plot of scores based on the first two canonical discriminant functions for the 19 elements ratios in the muscles of H. nobilis from three stations in the Yangtze River basin; Figure S3: Clustering dendrogram for 4 discriminant elements ratios in the muscles of H. nobilis from three stations in the Yangtze River basin. Samples from AQ station include AQ group and PC-AQ group.

Author Contributions

Conceptualization and writing—original draft, C.S. and C.Y.; writing—review and editing, C.S., C.Y., F.Z. and H.T.; investigation and methodology, J.X. and X.H.; resources and funding acquisition, C.S., F.Z. and P.Z.; validation and supervision, H.T. and P.Z. All authors have read and agreed to the published version of the manuscript.

Funding

This research was supported by the National Key R&D Program Key Special Project (2022YFF0608203) and Central Public-interest Scientific Institution Basal Research Fund, CAFS (2023TD14).

Institutional Review Board Statement

The experiments comply with current laws in China. All the samples in this study were obtained from legal commercial fisheries, and the samples were dead when they were obtained.

Data Availability Statement

The data presented in this study are available in the article. Further information is available upon request from the corresponding author.

Acknowledgments

The authors acknowledge researcher Yang, J. and associate researcher Jiang, T. from the Key Laboratory of Fishery Ecological Environment Assessment and Resource Conservation in the Middle and Lower Reaches of the Yangtze River, Chinese Academy of Fishery Sciences for providing the experimental materials.

Conflicts of Interest

The authors declare no conflicts of interest.

References

  1. Zhuang, P.; Zhang, T.; Li, S.F.; Ni, Y.; Wang, Y.H.; Deng, S.M.; Zhang, L.Z.; Ling, J.Z.; Hu, F.; Yang, G.; et al. Fishes of the Yangtze Estuary; China Agriculture Press: Beijing, China, 2018; pp. 124–127. [Google Scholar]
  2. Wang, D.; Wu, F.X.; Song, D.D.; Gao, H.Q. China Fisheries Statistical Yearbook, Compiled by Fishery and Fisheries Administration of the Ministry of Agriculture and Rural Affairs, National Aquatic Technology Promotion Station and China Fisheries Society Compile; China Agriculture Press: Beijing, China, 2023; p. 30. [Google Scholar]
  3. Farrington, H.L.; Edwards, C.E.; Guan, X.; Carr, M.R.; Baerwaldt, K.; Lance, R.F. Mitochondrial Genome Sequencing and Development of Genetic Markers for the Detection of DNA of Invasive Bighead and Silver Carp (Hypophthalmichthys nobilis and H. molitrix) in Environmental Water Samples from the United States. PLoS ONE 2015, 10, e0117803. [Google Scholar] [CrossRef] [PubMed]
  4. Kumar, R.; Jaiswar, A.K.; Sharma, R.; Prasad, L. Quantification of morphological variations among populations of Channa gachua (Hamilton, 1822) from different geographical locations in India. Indian J. Fish. 2020, 67, 114–119. [Google Scholar] [CrossRef]
  5. Milosevic, D.; Bigovic, M.; Mrdak, D.; Milasevic, I.; Piria, M. Otolith morphology and microchemistry fingerprints of European eel, Anguilla anguilla (Linnaeus, 1758) stocks from the Adriatic Basin in Croatia and Montenegro. Sci. Total Environ. 2021, 786, 147478. [Google Scholar] [CrossRef]
  6. Astorga, M.P.; Valenzuela, A.; Segovia, N.I.; Poulin, E.; Vargas-Chacoff, L.; Gonzalez-Wevar, C.A. Contrasting Patterns of Genetic Diversity and Divergence Between Landlocked and Migratory Populations of Fish, Evaluated Through Mitochondrial DNA Sequencing and Nuclear DNA Microsatellites. Front. Genet. 2022, 13, 854362. [Google Scholar] [CrossRef]
  7. Biton-Porsmoguer, S.; Bou, R.; Lloret, E.; Alcaide, M.; Lloret, J. Fatty acid composition and parasitism of European sardine (Sardina pilchardus) and anchovy (Engraulis encrasicolus) populations in the northern Catalan Sea in the context of changing environmental conditions. Conserv. Physiol. 2020, 8, coaa121. [Google Scholar] [CrossRef]
  8. Xuan, Z.Y.; Wang, W.X. Trace elemental and stable isotopic signatures to reconstruct the large-scale environmental connectivity of fish populations. Mar. Ecol. Prog. Ser. 2024, 730, 95–111. [Google Scholar] [CrossRef]
  9. Bai, S.Y.; Qin, D.L.; Chen, Z.X.; Wu, S.; Tang, S.Z.; Gao, L.; Wang, P. Geographic origin discrimination of red swamp crayfish Procambarus clarkia from different Chinese regions using mineral element analysis assisted by machine learning techniques. Food Control 2022, 138, 109047. [Google Scholar] [CrossRef]
  10. Ben Ghorbel, M.; Mejri, M.; Adjibayo, H.M.F.; Chalh, A.; Quignard, J.P.; Trabelsi, M.; Bouriga, N. Use of otolith microchemical and morphological analyses for stock discrimination of Sarpa salpa on two Tunisian islands, Djerba and Kerkennah. J. Mar. Biol. Assoc. UK 2024, 104, e33. [Google Scholar] [CrossRef]
  11. Ricardo, F.; Lopes, M.L.; Mamede, R.; Domingues, M.R.; da Silva, E.F.; Patinha, C.; Calado, R. Combined Use of Fatty Acid Profiles and Elemental Fingerprints to Trace the Geographic Origin of Live Baits for Sports Fishing: The Solitary Tube Worm (Diopatra neapolitana, Annelida, Onuphidae) as a Case Study. Animals 2024, 14, 1361. [Google Scholar] [CrossRef] [PubMed]
  12. Duarte, B.; Duarte, I.A.; Caçador, I.; Reis-Santos, P.; Vasconcelos, R.P.; Gameiro, C.; Tanner, S.E.; Fonseca, V.F. Elemental fingerprinting of thornback ray (Raja clavata) muscle tissue as a tracer for provenance and food safety assessment. Food Control 2022, 133, 108592. [Google Scholar] [CrossRef]
  13. Mamede, R.; Duarte, I.A.; Cacador, I.; Tanner, S.E.; Silva, M.; Jacinto, D.; Fonseca, V.F.; Duarte, B. Elemental fingerprinting of sea urchin (Paracentrotus lividus) gonads to assess food safety and trace its geographic origin. J. Food Compos. Anal. 2022, 114, 104764. [Google Scholar] [CrossRef]
  14. Ricardo, F.; Mamede, R.; Bruzos, A.L.; Díaz, S.; Thébault, J.; da Silva, E.F.; Patinha, C.; Calado, R. Assessing the elemental fingerprints of cockle shells (Cerastoderma edule) to confirm their geographic origin from regional to international spatial scales. Sci. Total Environ. 2022, 814, 152304. [Google Scholar] [CrossRef] [PubMed]
  15. Lai, J.; Zhao, L.J.; Fan, Y.C.; Qu, X.C.; Liu, D.Y.; Guo, Z.L.; Wang, Y.H.; Liu, Q.; Chen, Y.S. Using whole body elemental fingerprint analysis to distinguish different populations of Coilia nasus in a large river basin. Biochem. System. Ecol. 2015, 60, 249–257. [Google Scholar] [CrossRef]
  16. Davis, R.P.; Boyd, C.E.; Godumala, R.; Mohan, A.B.C.; Gonzalez, A.; Duy, N.P.; Sasmita, P.G.; Ahyani, N.; Shatova, O.; Wakefield, J.; et al. Assessing the variability and discriminatory power of elemental fingerprints in whiteleg shrimp Litopenaeus vannamei from major shrimp production countries. Food Control 2022, 133, 108589. [Google Scholar] [CrossRef]
  17. Campana, S.E.; Chouinard, G.A.; Hanson, J.M.; Fréchet, A.; Brattey, J. Otolith elemental fingerprints as biological tracers of fish stocks. Fish. Res. 2000, 46, 343–357. [Google Scholar] [CrossRef]
  18. Gillanders, B.M.; Kingsford, M.J. Elemental fingerprints of otoliths of fish may distinguish estuarine ‘nursery’ habitats. Mar. Ecol. Prog. Ser. 2000, 201, 273–286. [Google Scholar] [CrossRef]
  19. D’Avignon, G.; Rose, G.A. Otolith elemental fingerprints distinguish Atlantic cod spawning areas in Newfoundland and Labrador. Fish. Res. 2013, 147, 1–9. [Google Scholar] [CrossRef]
  20. Avigliano, E.; Domanico, A.; Sánchez, S.; Volpedo, A.V. Otolith elemental fingerprint and scale and otolith morphometry in Prochilodus lineatus provide identification of natal nurseries. Fish. Res. 2017, 186, 1–10. [Google Scholar] [CrossRef]
  21. Coussau, L.; Robert, D.; Sirois, P. Spatiotemporal variability in otolith elemental fingerprint and the potential to determine deepwater redfish (Sebastes mentella) origins and migrations in the Estuary and Gulf of St. Lawrence, Canada. Fish. Res. 2023, 265, 106739. [Google Scholar] [CrossRef]
  22. Bassi, L.; Tremblay, R.; Morissette, O.; Sirois, P. Otolith elemental fingerprints reveal source-sink dynamics between two Greenland halibut nurseries in the St. Lawrence Estuary and Gulf. Mar. Ecol. Prog. Ser. 2024, 731, 217–229. [Google Scholar] [CrossRef]
  23. Khan, S.; Schilling, H.T.; Khan, M.A.; Patel, D.K.; Maslen, B.; Miyan, K. Stock delineation of striped snakehead, Channa striata using multivariate generalised linear models with otolith shape and chemistry data. Sci. Rep. 2021, 11, 8158. [Google Scholar] [CrossRef]
  24. Mamede, R.; Santos, A.; Díaz, S.; da Silva, E.F.; Patinha, C.; Calado, R.; Ricardo, F. Elemental fingerprints of bivalve shells (Ruditapes decussatus and R. philippinarum) as natural tags to confirm their geographic origin and expose fraudulent trade practices. Food Control 2022, 135, 108785. [Google Scholar] [CrossRef]
  25. Mamede, R.; Duarte, I.A.; Caçador, I.; Reis-Santos, P.; Vasconcelos, R.P.; Gameiro, C.; Canada, P.; Ré, P.; Tanner, S.E.; Fonseca, V.F.; et al. Elemental Fingerprinting of Wild and Farmed Fish Muscle to Authenticate and Validate Production Method. Foods 2022, 11, 3081. [Google Scholar] [CrossRef]
  26. Mamede, R.; Santos, A.; da Silva, E.F.; Patinha, C.; Calado, R.; Ricardo, F. New evidence of fraudulent mislabeling and illegal harvesting of Manila clams (philippinarum) through elemental fingerprints of their shells and chemometric analyses. Food Control 2024, 163, 110501. [Google Scholar] [CrossRef]
  27. Orlowski, G.; Niedzielski, P.; Karg, J.; Proch, J. Colour-assisted variation in elytral ICP-OES-based ionomics in an aposematic beetle. Sci. Rep. 2020, 10, 22262. [Google Scholar] [CrossRef] [PubMed]
  28. Di Donato, F.; Gornati, G.; Biancolillo, A.; D’Archivio, A.A. ICP-OES analysis coupled with chemometrics for the characterization and the discrimination of high added value Italian Emmer samples. J. Food Compos. Anal. 2021, 98, 103842. [Google Scholar] [CrossRef]
  29. Lossow, K.; Schlörmann, W.; Tuchtenhagen, M.; Schwarz, M.; Schwerdtle, T.; Kipp, A.P. Measurement of trace elements in murine liver tissue samples: Comparison between ICP-MS/MS and TXRF. J. Trace Elem. Med. Bio. 2023, 78, 127167. [Google Scholar] [CrossRef]
  30. Güven, G. Testing the equality of treatment means in one-way ANOVA: Short-tailed symmetric error terms with heterogeneous variances. Hacet. J. Math. Stat. 2022, 51, 1736–1751. [Google Scholar] [CrossRef]
  31. Zhao, H.Y.; Wang, F.; Yang, Q.L. Origin traceability of peanut kernels based on multi-element fingerprinting combined with multivariate data analysis. J. Sci. Food Agr. 2020, 100, 4040–4048. [Google Scholar] [CrossRef]
  32. Quinn, G.P.; Keough, M.J. Experimental Design and Data Analysis for Biologists; Cambridge University Press: Cambridge, UK, 2002. [Google Scholar]
  33. Legendre, P.; Legendre, L. Numerical Ecology; Elsevier: Amsterdam, The Netherlands, 2012. [Google Scholar]
  34. Anderson, C.L.; Whitledge, G.W.; Rude, N.P.; Lamer, J.T. Using Otolith Chemistry to Determine Early Life Environments and Movement of the Emerging Bigheaded Carp Population in Pools 16–19 of the Upper Mississippi River. N. Am. J. Fish. Manag. 2023, 43, 126–140. [Google Scholar] [CrossRef]
  35. Whitledge, G.W.; Knights, B.; Vallazza, J.; Larson, J.; Weber, M.J.; Lamer, J.T.; Phelps, Q.E.; Norman, J.D. Identification of Bighead Carp and Silver Carp early-life environments and inferring Lock and Dam 19 passage in the Upper Mississippi River: Insights from otolith chemistry. Biol. Invasions 2019, 21, 1007–1020. [Google Scholar] [CrossRef]
  36. Domínguez-Contreras, J.F.; Jiménez-Rosenberg, S.P.A.; Reguera-Rouzaud, N.; Sánchez-Velasco, L.; Díaz-Viloria, N.; Domínguez-Contreras, J.F.; Jiménez-Rosenberg, S.P.A.; Reguera-Rouzaud, N.; Sánchez-Velasco, L.; Díaz-Viloria, N. Molecular identification and first morphological description of the Colorado snapper Lutjanus colorado (Perciformes: Lutjanidae) larvae. J. Fish Biol. 2023, 102, 1481–1491. [Google Scholar] [CrossRef] [PubMed]
  37. Jiang, T.; Liu, H.B.; Hu, Y.H.; Chen, X.B.; Yang, J. Revealing Population Connectivity of the Estuarine Tapertail Anchovy Coilia nasus in the Changjiang River Estuary and Its Adjacent Waters Using Otolith Microchemistry. Fishes 2022, 7, 147. [Google Scholar] [CrossRef]
  38. Xuan, Z.Y.; Jiang, T.; Liu, H.B.; Yang, J. Otolith microchemistry and microsatellite DNA provide evidence for divergence between estuarine tapertail anchovy (Coilia nasus) populations from the Poyang Lake and the Yangtze River Estuary of China. Reg. Stud. Mar. Sci. 2022, 56, 102649. [Google Scholar] [CrossRef]
  39. Li, Y.; Chen, J.; Feng, G.; Yang, J.; Zhao, F.; Shen, C.; Song, C.; Jiang, T. Otolith Microchemistry Assessment: Evidence of Migratory Coilia nasus of Yangtze River Living in the Shengsi Sea Area. Fishes 2022, 7, 172. [Google Scholar] [CrossRef]
  40. Lehel, J.; Plachy, M.; Palotás, P.; Bartha, A.; Budai, P. Possible Metal Burden of Potentially Toxic Elements in Rainbow Trout (Oncorhynchus mykiss) on Aquaculture Farm. Fishes 2024, 9, 252. [Google Scholar] [CrossRef]
  41. Liu, P.C.; Ma, Z.H.; Wei, P.G.; Zhao, Y.X.; Liu, H.L. Progress of Researches on Heavy Metal Pollution Characteristics and Comprehensive Prevention and Control in the Yangtze River Basin. Ecol. Environ. Monitor. Three Gorge 2018, 3, 33–37. [Google Scholar]
  42. Guo, J.; Wang, K.; Yu, Q.; Duan, X.; Liu, S.; Chen, D. Pollution characteristics of the heavy metals and their potential ecological risk assessment in nearshore sediments of the middle reaches of the Yangtze River. Acta Sci. Circum. 2021, 41, 4625–4636. [Google Scholar]
  43. Pan, L.; Zhang, R.B.; Pan, Z.X.; Xi, D.G.; Wang, L.Y. Process for Deep Nitrogen and Phosphorus Removal of Tail water from Sewage Treatment Facilities in the Taihu Lake Basin. China Environ. Prot. Ind. 2020, 2, 50–52. [Google Scholar]
  44. Wu, K.Q.; Meng, Y.H.; Gong, Y.; Wu, L.L.; Liu, W.W.; Ding, X.L. Drinking water elements constituent profiles ansd health risk assessment in Wuxi, China. Environ. Monit. Assess. 2022, 194, 106. [Google Scholar] [CrossRef]
  45. Liu, P.; Wu, Q.M.; Hu, W.Y.; Tian, K.; Huang, B.; Zhao, Y.C. Comparison of heavy metals in riverine and estuarine sediments in the lower Yangtze River: Distribution, sources, and ecological risks. Environ. Technol. Innov. 2023, 30, 103076. [Google Scholar] [CrossRef]
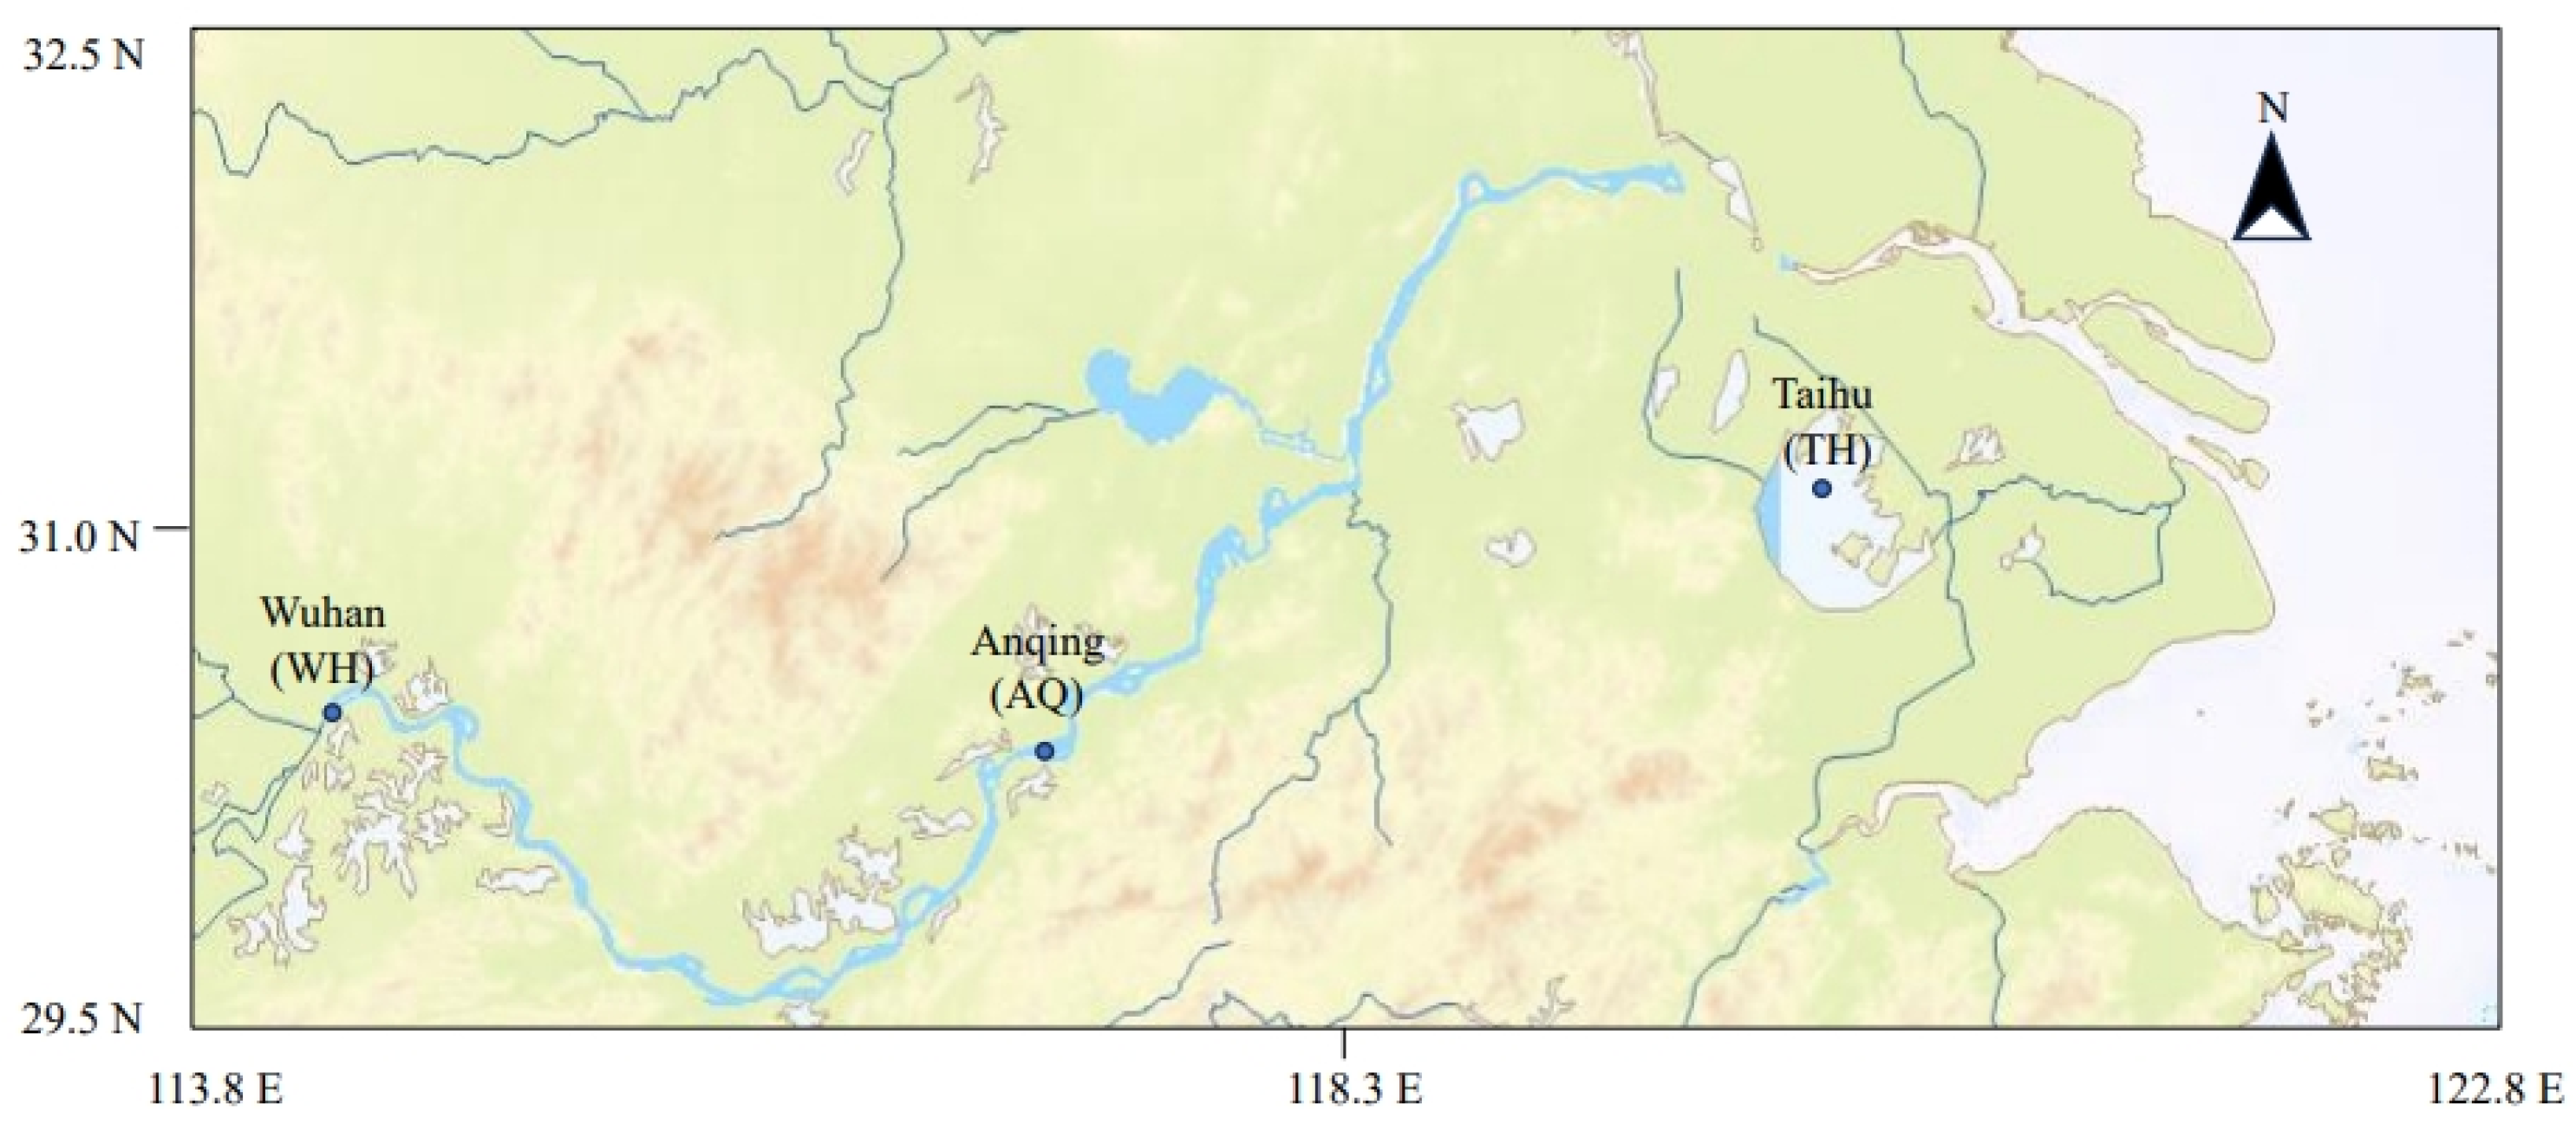
Figure 1. H. nobilis sampling stations.
Fishes 09 00316 g001
Figure 2. Scatter diagram of PC1 and PC2 (a), and PC1 and PC3 (b), and PC2 and PC3 (c) of 19 element ratios in the muscles of H. nobilis from three stations in the Yangtze River basin.
Fishes 09 00316 g002
Figure 3. Element to Ca ratios of H. nobilis muscle from three stations in the Yangtze River basin (WH, AQ, and TH) and the positive control of AQ (PC-AQ). Different colors of red, blue, yellow and green represent different groups of WH, AQ, TH and PC-AQ, respectively. The horizontal line in the box is the median, and that at the ends of the vertical line segment on the upper and lower sides of the box shows the maximum and minimum, respectively. The empty box (□) represents the average value, and the solid diamond (♦) represents the extreme value. Different letters (a, b) denote significant differences between groups of samples.
Fishes 09 00316 g003
Figure 4. Scatter plot of scores based on the first two canonical discriminant functions for four groups of WH, AQ, TH, and PC-AQ.
Fishes 09 00316 g004
Table 1. Basic parameters of H. nobilis samples from three stations in the Yangtze River basin.
GroupsStationsCollection MonthNumberStandard Length (cm)Wet Weight (g)
WHWuhanNovember264.90 ± 4.104927.0 ± 1105.9
AQAnqingSeptember570.08 ± 2.305648.0 ± 497.3
THTaihuDecember565.16 ± 8.204912.0 ± 1711.1
PC-AQAnqingSeptember559.61 ± 5.533760.0 ± 1435.6
Table 2. The 19 element ratios in the muscle of H. nobilis from different stations in the Yangtze River basin (mean ± SD).
IndexWHAQTH95% Confidencep
Hg/Ca0.0250 ± 0.0071 a0.0860 ± 0.0483 b0.0100 ± 0.0071 a0.0139~0.07440.011
Pb/Ca0.0400 ± 0.0141 a0.0040 ± 0.0055 b0.0120 ± 0.0045 b0.0041~0.02320.019
Cr/Ca0.2450 ± 0.1909 a0.0720 ± 0.0303 a0.0920 ± 0.0683 a0.0474~0.17100.218
Cd/Ca0.7000 ± 0.7495 a0.3380 ± 0.1853 a0.9380 ± 0.6492 a0.3008~0.99590.227
Cu/Ca0.4600 ± 0.3677 a0.2420 ± 0.0746 a0.3920 ± 0.1417 a0.2311~0.45060.300
Zn/Ca6.7850 ± 0.2758 a9.1340 ± 3.0404 a6.5100 ± 2.8400 a5.8488~9.44950.304
Ni/Ca0.0350 ± 0.0071 a0.0280 ± 0.0045 a0.0400 ± 0.0187 a0.0258~0.04250.289
As/Ca0.200 ± 0.1697 a0.0940 ± 0.0241 a0.1360 ± 0.0602 a0.0814~0.17690.516
Na/Ca0.3050 ± 0.0778 a0.5600 ± 0.2651 a0.3660 ± 0.2552 a0.2783~0.59500.252
Mg/Ca0.2300 ± 0.0424 a0.3480 ± 0.1596 a0.3040 ± 0.1974 a0.2087~0.41130.755
K/Ca3.3750 ± 1.4354 a4.3580 ± 2.2346 a2.8900 ± 1.6509 a2.3950~4.77000.421
Fe/Ca0.0150 ± 0.0071 a0.0140 ± 0.0055 a0.0160 ± 0.0055 a0.0117~0.01830.832
Al/Ca0.1850 ± 0.0354 a0.1800 ± 0.0925 a2.4180 ± 1.4107 b0.2029~0.02380.017
Mn/Ca1.1750 ± 0.0495 ab2.8080 ± 1.418 a0.5260 ± 0.1673 b0.6951~2.47490.014
Mo/Ca0.1250 ± 0.0495 a0.1100 ± 0.0557 a0.0420 ± 0.0192 a0.0500~0.11840.056
Sr/Ca3.4550 ± 1.9445 a3.9280 ± 1.5340 a2.2260 ± 0.4769 a2.2500~4.03000.167
Ba/Ca0.4300 ± 0.2687 a1.2600 ± 0.6401 a1.1360 ± 0.6241 a0.6732~1.46680.224
Ti/Ca5.3250 ± 0.3606 a5.2300 ± 0.1037 a4.5520 ± 1.0059 a4.5066~5.42000.384
V/Ca0.0150 ± 0.0212 a0.0120 ± 0.0045 a0.0220 ± 0.0130 a0.0093~0.02400.421
Note: The unit for K, Na, Mg, and Fe to Ca is mg/mg, the unit for Cd to Ca is ng/mg, and the unit for the remaining elements to Ca is µg/mg. In the same line, different letters (a, b) after standard deviation denote significant differences between groups of samples from different stations (p < 0.05).
Table 3. Principal component matrix and contribution of 19 element ratios in the muscles of H. nobilis from three stations in the Yangtze River basin.
VariablePrincipal Component
12345
Hg/Ca0.679−0.7030.037−0.020−0.036
Pb/Ca−0.2430.4520.5950.2450.453
Cr/Ca0.5010.6010.5980.063−0.130
Cd/Ca0.2960.895−0.183−0.0340.103
Cu/Ca0.5340.7530.196−0.099−0.254
Zn/Ca0.876−0.233−0.1200.0830.205
Ni/Ca0.3850.775−0.2440.2520.242
As/Ca0.5220.7390.360−0.098−0.168
Na/Ca0.826−0.227−0.2090.399−0.053
Mg/Ca0.8240.006−0.2960.468−0.052
K/Ca0.921−0.1520.0040.260−0.105
Fe/Ca0.7730.409−0.173−0.3370.008
Al/Ca0.0940.696−0.6000.332−0.039
Mn/Ca0.657−0.7290.073−0.0010.012
Mo/Ca0.779−0.2940.5000.069−0.070
Sr/Ca0.747−0.3600.301−0.292−0.133
Ba/Ca0.504−0.321−0.568−0.4710.153
Ti/Ca0.533−0.0280.151−0.2010.767
V/Ca0.3800.611−0.191−0.605−0.102
Characteristic Value7.4265.5812.2371.5431.091
Contribution Rate39.08529.37111.7738.1225.740
Cumulative Contribution39.08568.45680.22988.35294.092
Table 4. Classification function coefficient of 19 element ratios in the muscles of H. nobilis from three stations in the Yangtze River basin.
Discriminative ElementsWHAQTH
Pb/Ca19,468.8625120.551780.090
Cr/Ca1369.079348.93147.029
Na/Ca293.63491.81610.597
Al/Ca−174.431−47.715−3.683
Constant−586.832−45.315−5.429
Table 5. Results of the discriminant verification analysis for H. nobilis from different sources in the Yangtze River basin using the four discriminant element ratios in the muscles.
MethodGroupsPrediction CategoryDiscriminant Accuracy (%)Comprehensive Discrimination Rate (%)
WHAQ + PC-AQTH
Stepwise DiscriminationWH200100.00100.00
AQ + PC-AQ0100100.00
TH005100.00
Cross VerificationWH200100.00100.00
AQ + PC-AQ0100100.00
TH005100.00
Disclaimer/Publisher’s Note: The statements, opinions and data contained in all publications are solely those of the individual author(s) and contributor(s) and not of MDPI and/or the editor(s). MDPI and/or the editor(s) disclaim responsibility for any injury to people or property resulting from any ideas, methods, instructions or products referred to in the content.