Article

Effects of Substituting Fishmeal (FM) Diet with a Diet of FM Plus Soy Protein Concentrate (SPC) Supplemented with Essential Amino Acids on the Growth and Gonadal Development of the Olive Flounder (Paralichthys olivaceus)

1
Genetics and Breeding Research Center, National Institute of Fisheries Science, Geoje 53334, Republic of Korea
2
Department of Convergence Interdisciplinary Education of Maritime & Ocean Contents, Korea Maritime and Ocean University, Busan 49112, Republic of Korea
3
Aquafeed Research Center, National Institute of Fisheries Science, Pohang 37517, Republic of Korea
*
Author to whom correspondence should be addressed.
Fishes 2024, 9(12), 521; https://doi.org/10.3390/fishes9120521
Submission received: 20 November 2024 / Revised: 13 December 2024 / Accepted: 17 December 2024 / Published: 19 December 2024

Abstract

Numerous studies have explored alternative protein sources to fishmeal (FM) to enhance fish diets, yet limited research exists on their effects on maturation. This study assessed the impact of replacing FM with soy protein concentrate (SPC) supplemented with lysine and methionine on growth and gonadal development in olive flounder (Paralichthys olivaceus). Three diets were tested: a control (Con) diet with 60% FM and two diets replacing FM with 25% (LF1) and 50% (LF2) SPC. Fish were fed to apparent satiation twice daily for 12 months. Growth performance and feed intake were not significantly different between groups. However, the gonadosomatic index varied with diet. Muscle composition and amino acid levels were similar across treatments, though n-3 fatty acids were higher in Con. Spermatogonia was increased, and spermatogenesis was impaired in SPC groups. At 12 months, oocytes in Con diets had absorbed yolk globules, whereas this was absent in SPC groups. Growth-related genes in the brain (growth hormones and insulin-like growth factor) were increased with higher SPC, while follicle-stimulating and luteinizing hormones decreased. Estrogen receptor α levels were elevated in SPC groups. Vitellogenin gene expression in gonads was highest in Con, while liver expression peaked in LF2. The expression of digestive enzymes, chymotrypsin2, and trypsin2 was highest in LF2, while lipase genes were lower. In summary, up to 50% FM replacement with SPC, with amino acid supplementation, supported growth performance and muscle composition without adverse effects on growth in olive flounder but influenced gonadal development.
Key Contribution: Effect of substituting fishmeal with the soy protein concentrate supplemented with EAA in the diet on the growth, gonadal development, and expression of digestive-related genes of olive flounder in the long-term (12-month) trial.

1. Introduction

Artificial breeding of olive flounder (Paralichthys olivaceus) in the Republic of Korea (henceforth, Korea) was first started in 1982 [1]. Since then, this species has become popular in the country, accounting for about 50% (39,931 metric tons) of total aquaculture production (79,651 metric tons) in 2023 [2,3]. As a carnivorous fish, olive flounder requires more than 50% protein in the diet [4,5]. Therefore, feed is an important part of the farming of this species, as it provides the protein necessary for growth, and it makes up 30–35% of the total operational costs [3,6,7].
Fishmeal (FM) has been the main protein source used in fish feeds [6,8,9] because it is a palatable and high-quality protein source [10,11]. Furthermore, FM represents a significant protein source for olive flounder [3,6]. However, its cost has steeply increased due to decreases in fish catch commonly used for FM [12,13,14,15]. Therefore, many studies have attempted to identify appropriate FM replacements [6,9,16,17,18,19].
Soybean meal (0.64 USD/kg) is less expensive than FM (2.15 USD/kg) [20] but has problems in that it contains non-starch polysaccharides, which are disadvantageous for digestion, and high levels of antinutritional factors such as trypsin inhibitors [19,21,22]. To address these problems, soy protein concentrate (SPC; 1.08 USD/kg), a product of the soybean flake leaching process [20,23,24], could be utilized as a substitute. SPC contains more readily digested amino acids (AAs) and lower levels of antinutritional factors compared to soybean meal [19]. In a previous study, it was possible to replace up to 30% FM with SPC without AA supplementation in a 60% FM-based diet without compromising the growth of olive flounder for 20 weeks [25]. However, Deng et al. [16] reported that SPC is not an effective substitute for FM in this species due to its unbalanced and poor nutritional profile. Generally, as plant protein sources are likely to lack limiting AAs, such as arginine, lysine, and methionine, the substitution of FM in the diet with an alternative plant protein could be improved by supplementation with these AAs. In a 10-week feeding experiment, Li et al. [19] found that up to 40% FM could be substituted with SPC supplemented with limiting AAs (lysine and methionine) in a 68% FM-based diet without deterioration of growth of starry flounder (Platichthys stellatus). In addition, up to 50% FM could be replaced with SPC with lysine and methionine supplementation in a 64% FM-based diet without compromising growth performance in the common sole (Solea solea) [26]. Nevertheless, the majority of preceding studies examining the replacement of dietary FM with SPC have been conducted over relatively brief periods (≤20 weeks) [20,25,26].
The study of fish maturation is a topic that has been the subject of considerable research [10,25,27]. Maturation hormones, such as follicle-stimulating hormone (FSH), luteinizing hormone (LH), and estrogen receptor (ER), are produced in the brain. FSH regulates gonadal development, and LH mainly regulates gonadal maturation [28]. ER is taken up by oocytes and used as a nutrient for embryonic development after fertilization [25,29]. Vitellogenin (VIT) is synthesized after 17β-estradiol binds to the ER in the liver, is absorbed by oocytes, and is used as a nutrient for embryonic development after fertilization [25]. However, there have been few reports regarding the maturation of fish associated with dietary FM replacement with alternative sources [25,27]. Furthermore, most previous studies of dietary FM replacement with alternative proteins correlated with maturation have been performed for short periods (≤16 weeks) [15,16,27]. However, the effects of a low-FM diet on gonad maturation in fish should be confirmed in long-term feeding trials (≥16 weeks) [25].
The objective of this study was to perform a long-term (12 months) trial to investigate the effects of the replacement of FM with SPC in the diet supplemented with limiting AAs on the gonadal development and growth of the olive flounder.

2. Materials and Methods

2.1. Experimental Conditions and Fish

Olive flounder (mean ± SE initial body weight 727.76 ± 7.89 g) were transferred from the Genetics and Breeding Research Center (National Fisheries Research Institute, Geoje-si, Gyeongsangnam-do, Republic of Korea) to the Feed Research Center (National Fisheries Research Institute, Pohang-si, Gyeongsangbuk-do, Republic of Korea). The fish were allowed to acclimate to the experimental conditions for 2 weeks and fed the control (Con) diet (crude protein: 53.85%, crude lipid: 9.25%). After this acclimatization period, 900 experimental fish were randomly transferred into nine 8-ton flow-through tanks (water volume: 5 tons) (100 fish/tank; n = 3 tanks per treatment). The water source was sand-filtered seawater. Water temperature ranged from 10.83 °C to 23.22 °C (mean ± SD 16.53 ± 5.61 °C), and dissolved oxygen (8.52 ± 1.00 mg/L; mean ± SD) was directly supplied to each tank through an oxygen generator. Throughout the 12-month feeding trial, dead fish were removed immediately from each tank, and their body length and weight were determined.

2.2. Experimental Diet

Three isonitrogenous (53.00%) and isoenergetic (3.93 kcal/g diet) experimental diets were formulated (Table 1). The Con diet consisted of 60% low-temperature FM, while the LF1 and LF2 diets were formulated to match the FM content of the Con diet, with 25% and 50% FM replaced with SPC supplemented with lysine (LF1; 0.38%, LF2; 0.75%) and methionine (LF1; 0.15%, LF2; 0.29%), respectively (MP Biomedicals, Irvine, CA, USA). All feeds fulfilled the dietary nutrient requirements of olive flounder [5,30].
The ingredients of the experimental diets were stored in a freezer at −20 °C until use, after which they were thoroughly blended with water at a ratio of 5:1. The pressure control of the experimental feeds was dependent on the screw speed (rpm/min), barrel temperature (115–130 °C), conditioner temperature (80 °C), and steam (31.6 kg/h). The feed rate (50 kg/h) of the extruder (ATX-II twin screw extruder; Fesco, Dangu, Republic of Korea) was maintained, with the pressure set at low (885 rpm/min) and high (708 rpm/min) levels. The speeds of the discs (rpm/min) and rotors (rotor, rpm/min) of the air classifier mill (XP 50; KMTECH, Guri-si, Gyeonggi-do, Republic of Korea) were adjusted as appropriate to ensure optimal performance. All experimental diets were extruded as pellets on a biweekly basis and stored in a freezer at −20 °C until use. The fish were fed the experimental diets twice a day (08:00 and 17:00) until they appeared satiated for a period of 12 months.

2.3. Measurement of Growth and Biological Indices

All live fish from each tank were subjected to a 24 h starvation period and subsequently anesthetized using 50 ppm 2-phenoxyethanol (Sigma, St. Louis, MO, USA) prior to measurement. The number of live fish and their weight were recorded for each tank, enabling the calculation of survival and weight gain. To ascertain the biological indices (CF, VSI, HSI, and GSI), six fish were randomly selected from each tank at the outset, after four months, and at the conclusion of the 12-month experimental period. These samples were utilized to calculate the viscerosomatic index (VSI), hepatosomatic index (HSI), and gonadosomatic index (GSI). The biological indices were calculated using the following equations:
Specific Growth Rate (SGR, %/day) = (Ln final weight − Ln initial weight) × 100/day feeding trial
Daily Feed Intake (%/day) = feed consumption × 100/(initial fish weight + final fish weight + dead fish weight)
Feed Efficiency (FE) = weight gain/feed consumption
Protein Efficiency Ratio (PER) = weight gain/protein consumption
Protein Retention (PR, %) = protein gain × 100/protein consumption
Condition Ractor (CF, g/cm3) = body weight (g) × 100/body length (cm)3
Viscerosomatic Index (VSI, %) = visceral weight × 100/body weight
Hepatosomatic Index (HSI, %) = liver weight ×100/body weight
Gonadosomatic Index (GSI, %) = gonad weight × 100/body weight.

2.4. Biochemical Composition of the Experimental Diets and Proximate Composition of the Fish

The main ingredients (FM and SPC) and the experimental diets were homogenized, and the biochemical compositions were determined both before and after the production of the diets. Prior to sampling, all live fish from each tank were deprived of food for a period of 24 h. To ascertain the biochemical composition, six fish from each tank were randomly selected at the outset, after four months, and at the conclusion of the 12-month experimental period. Following homogenization, the biochemical compositions were determined. The proximate composition of the samples was analyzed in accordance with the AOAC standard method [32]. The crude protein and crude lipid contents were determined using the Kjeldahl method (Kjeltec 2100 Distillation Unit; Foss Tecator, Hillerød, Denmark) and an ether extraction method (Soxtec TM 2043 Fat Extraction System; Foss Tecator, Hillerød, Denmark), respectively. The moisture content was determined by oven drying for 6 and 24 h at 105 °C, respectively, for the analysis of the main ingredients and experimental diets and for the fish samples. The ash content was determined by placing the samples in a muffle furnace at 550 °C for 4 h.
The AA profiles of the experimental diets and the dorsal muscle of olive flounder were hydrolyzed by the addition of 20 mL of 6 N hydrochloric acid (HCl) at 110 °C for a period of 24 h in a dry oven. The solution was filtered through a glass filter and concentrated under vacuum at 55 °C to completely evaporate the hydrochloric acid and water. The sample was dissolved with sodium citrate buffer (pH 2.20) in a 25 mL flask, filtered with a 0.45 µm membrane filter, and analyzed using an automated amino acid analyzer (Biochrom 30+; Biochrom Ltd., Cambridge, UK).
The total lipids of the experimental diets and dorsal muscle were extracted with a chloroform and methanol mixture (2:1) to methylate the fatty acids (FAs) with a 14% BF-methanol (Sigma-Aldrich, St. Louis, MO, USA) solution. The resulting FAs were then analyzed. The samples were analyzed by gas chromatography (Trace 1310; Thermo Scientific, Waltham, MA, USA) with a capillary column (SPTM-2560, 100 m × 0.25 mm; Supelco Inc., Bellefonte, PA, USA) as the detector. A mixture of 37 fatty acids (PUFA 37 Component FAME Mix; Supelco Inc.) was employed as the standard for fatty acid analysis. The methods and procedures utilized for the analysis of the samples were consistent with those previously described by [8].

2.5. Histology of Male and Female Gonads

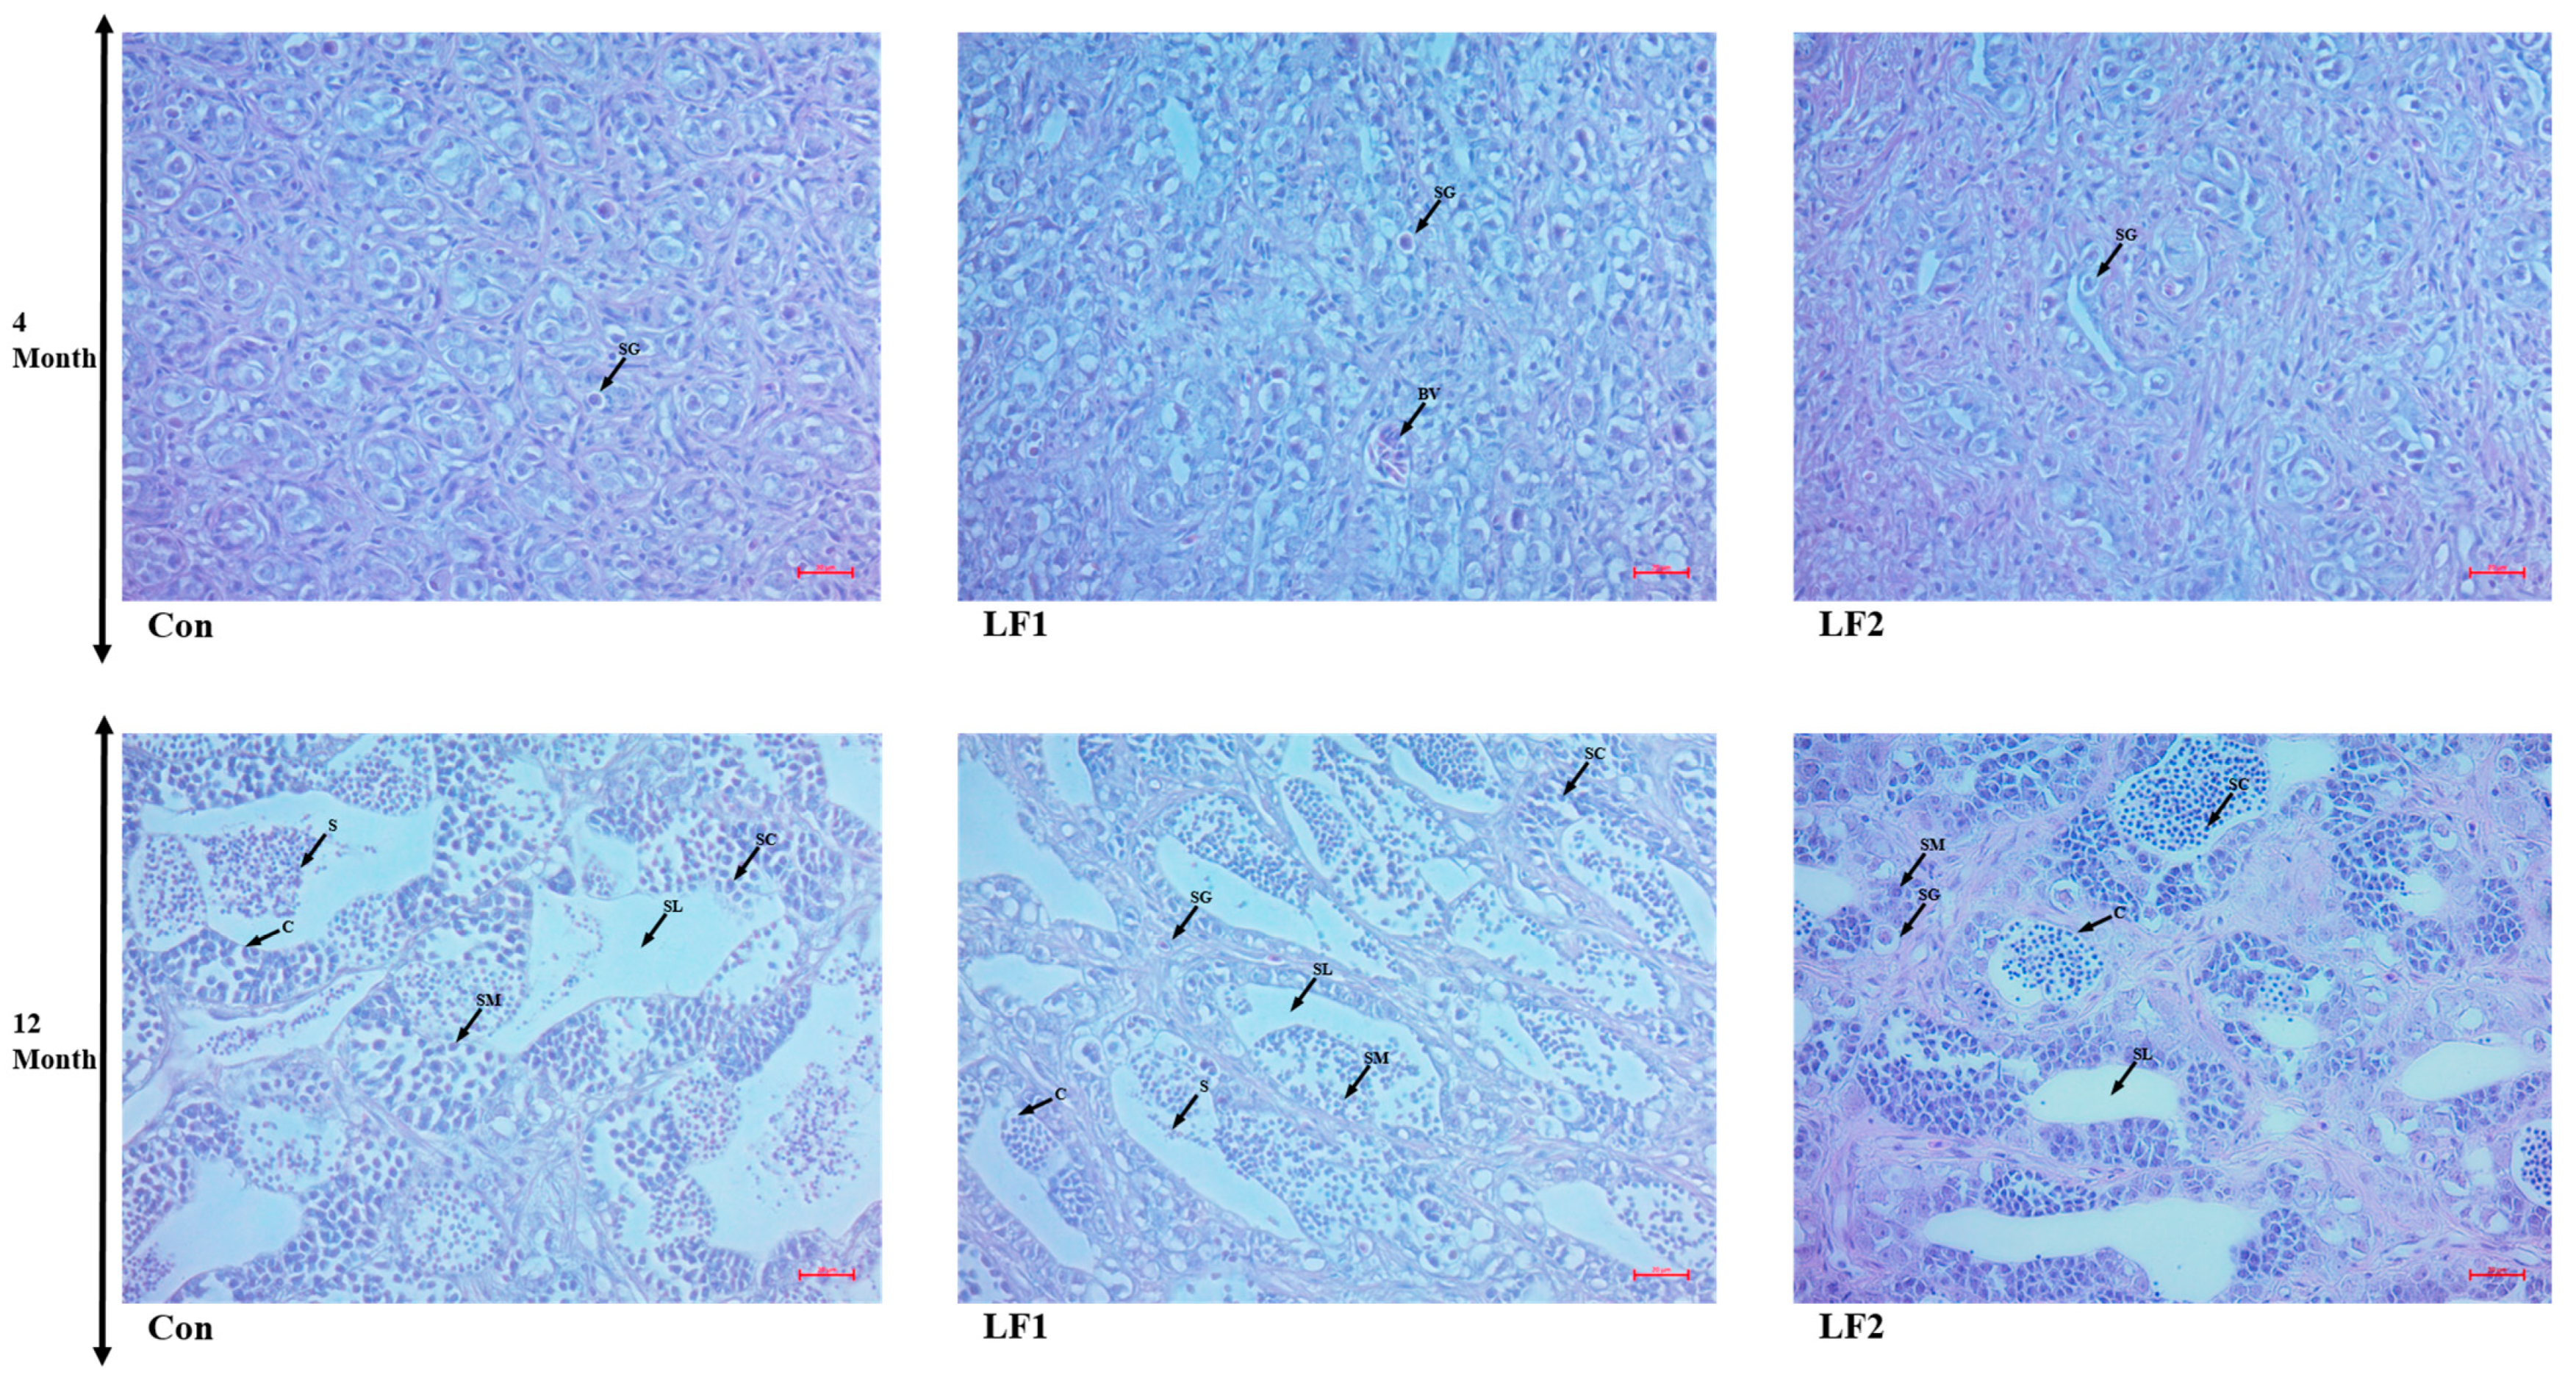
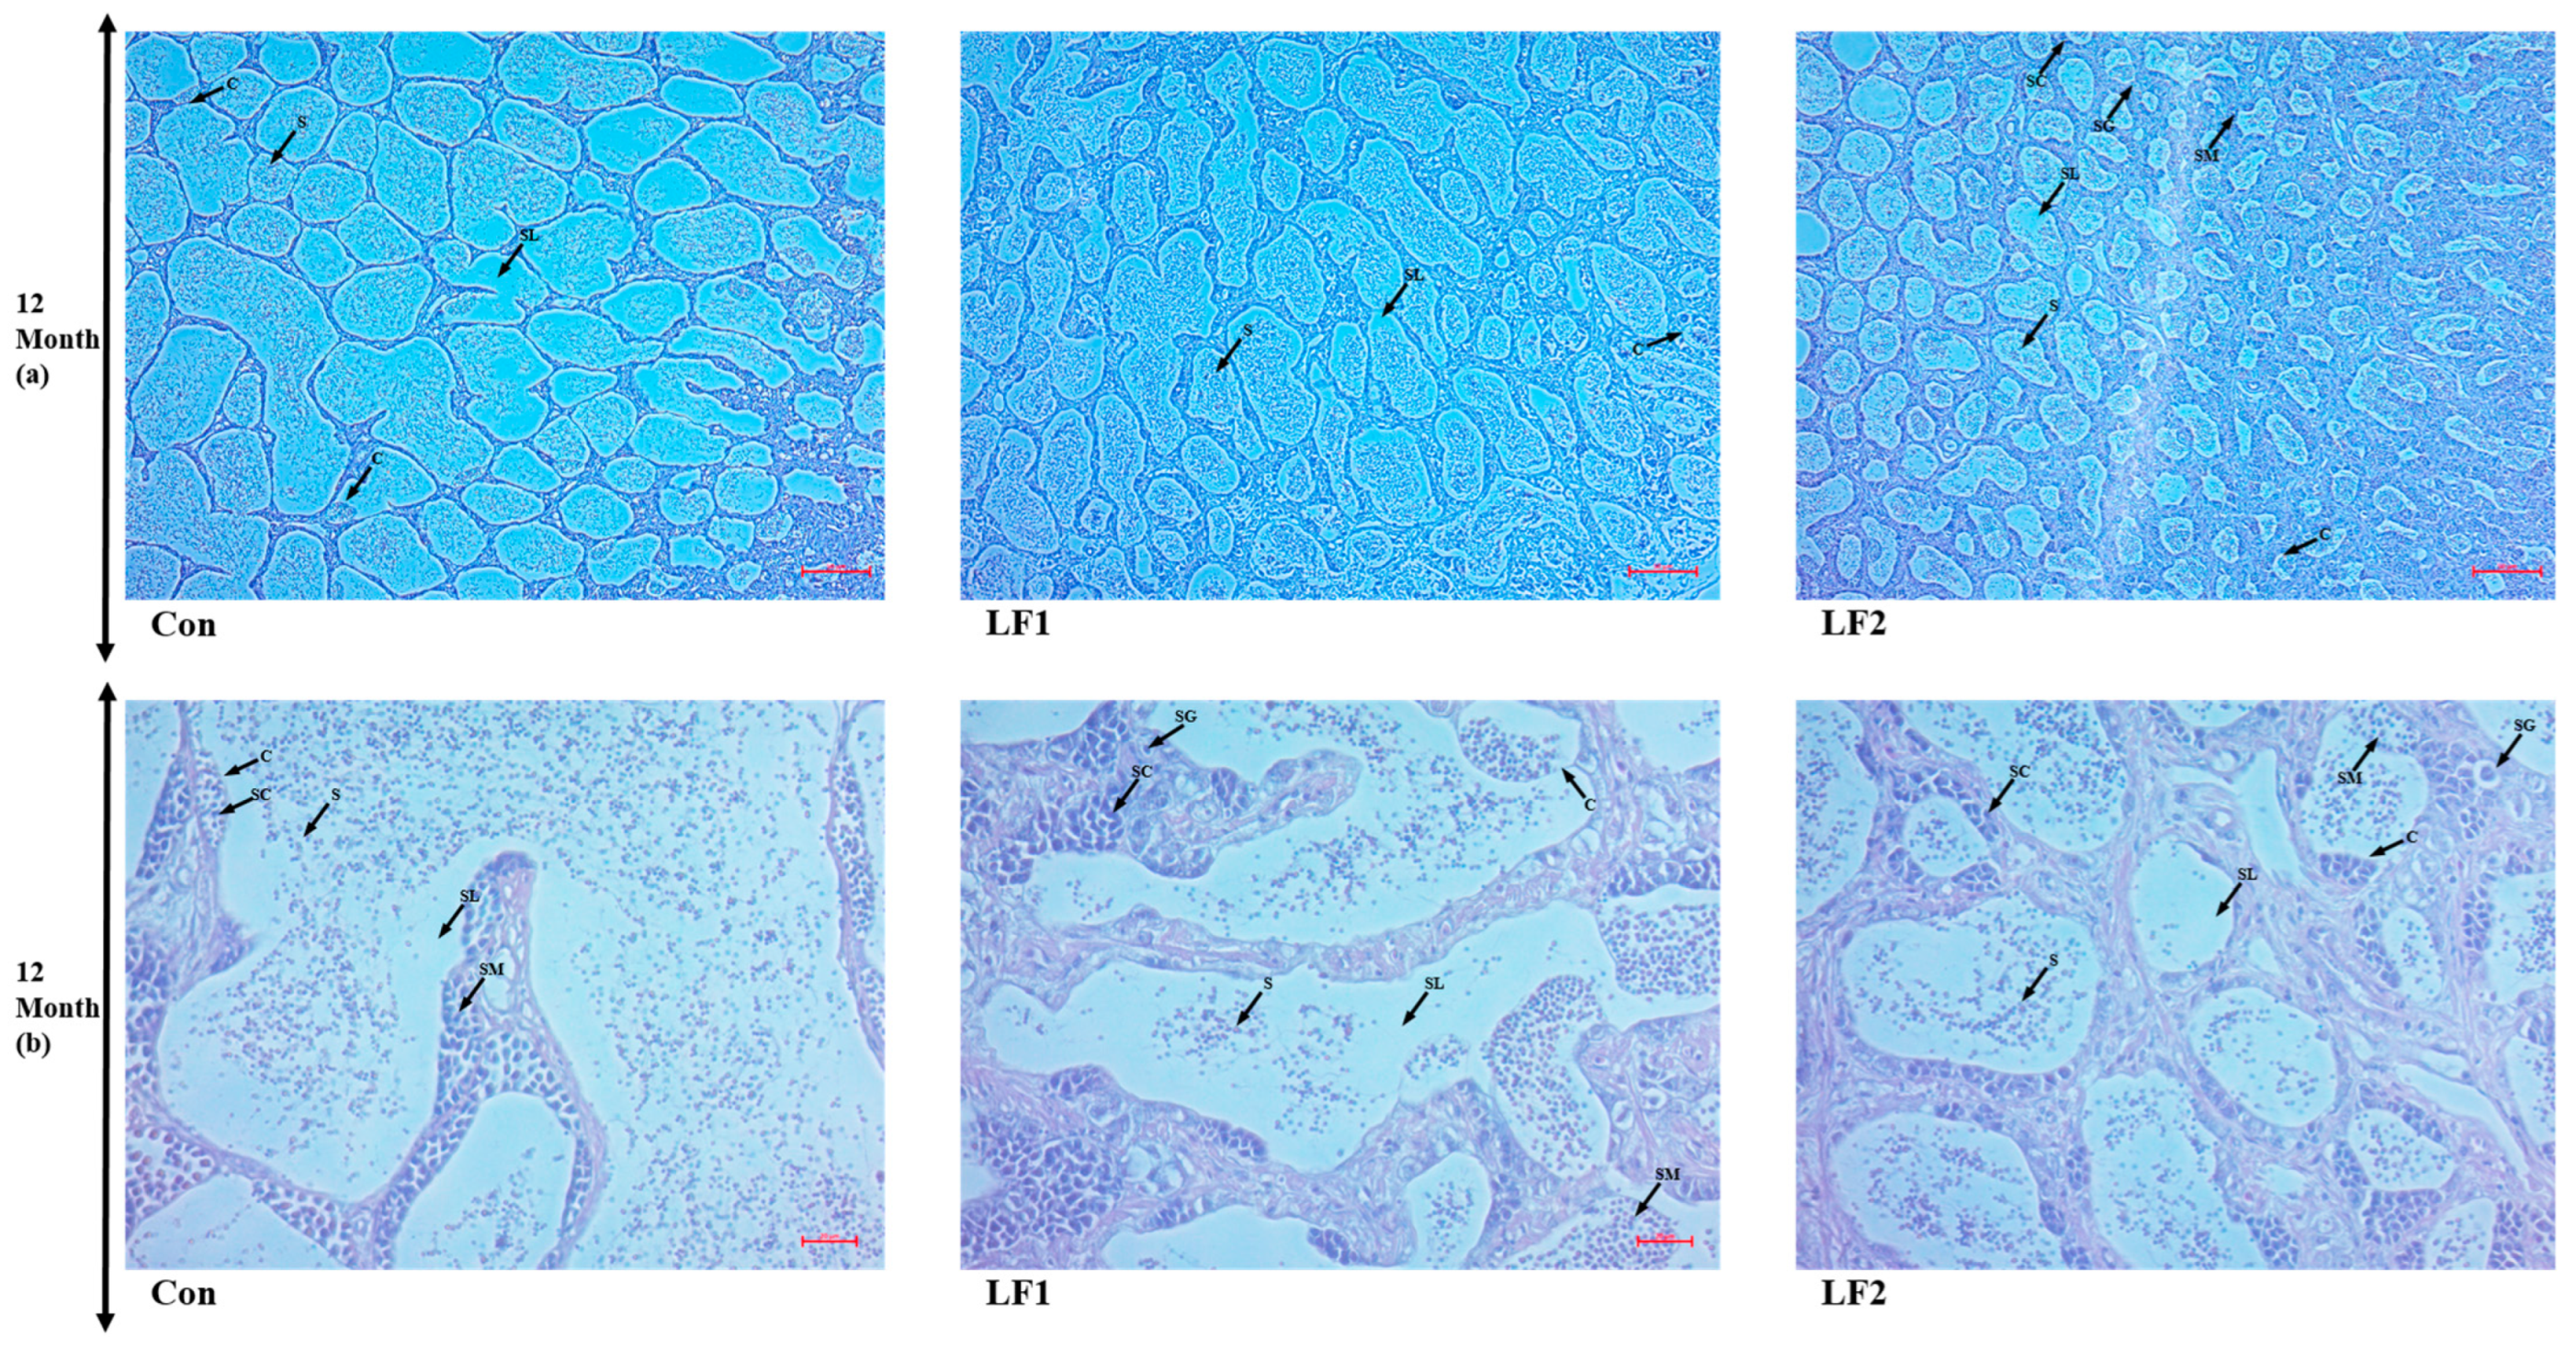
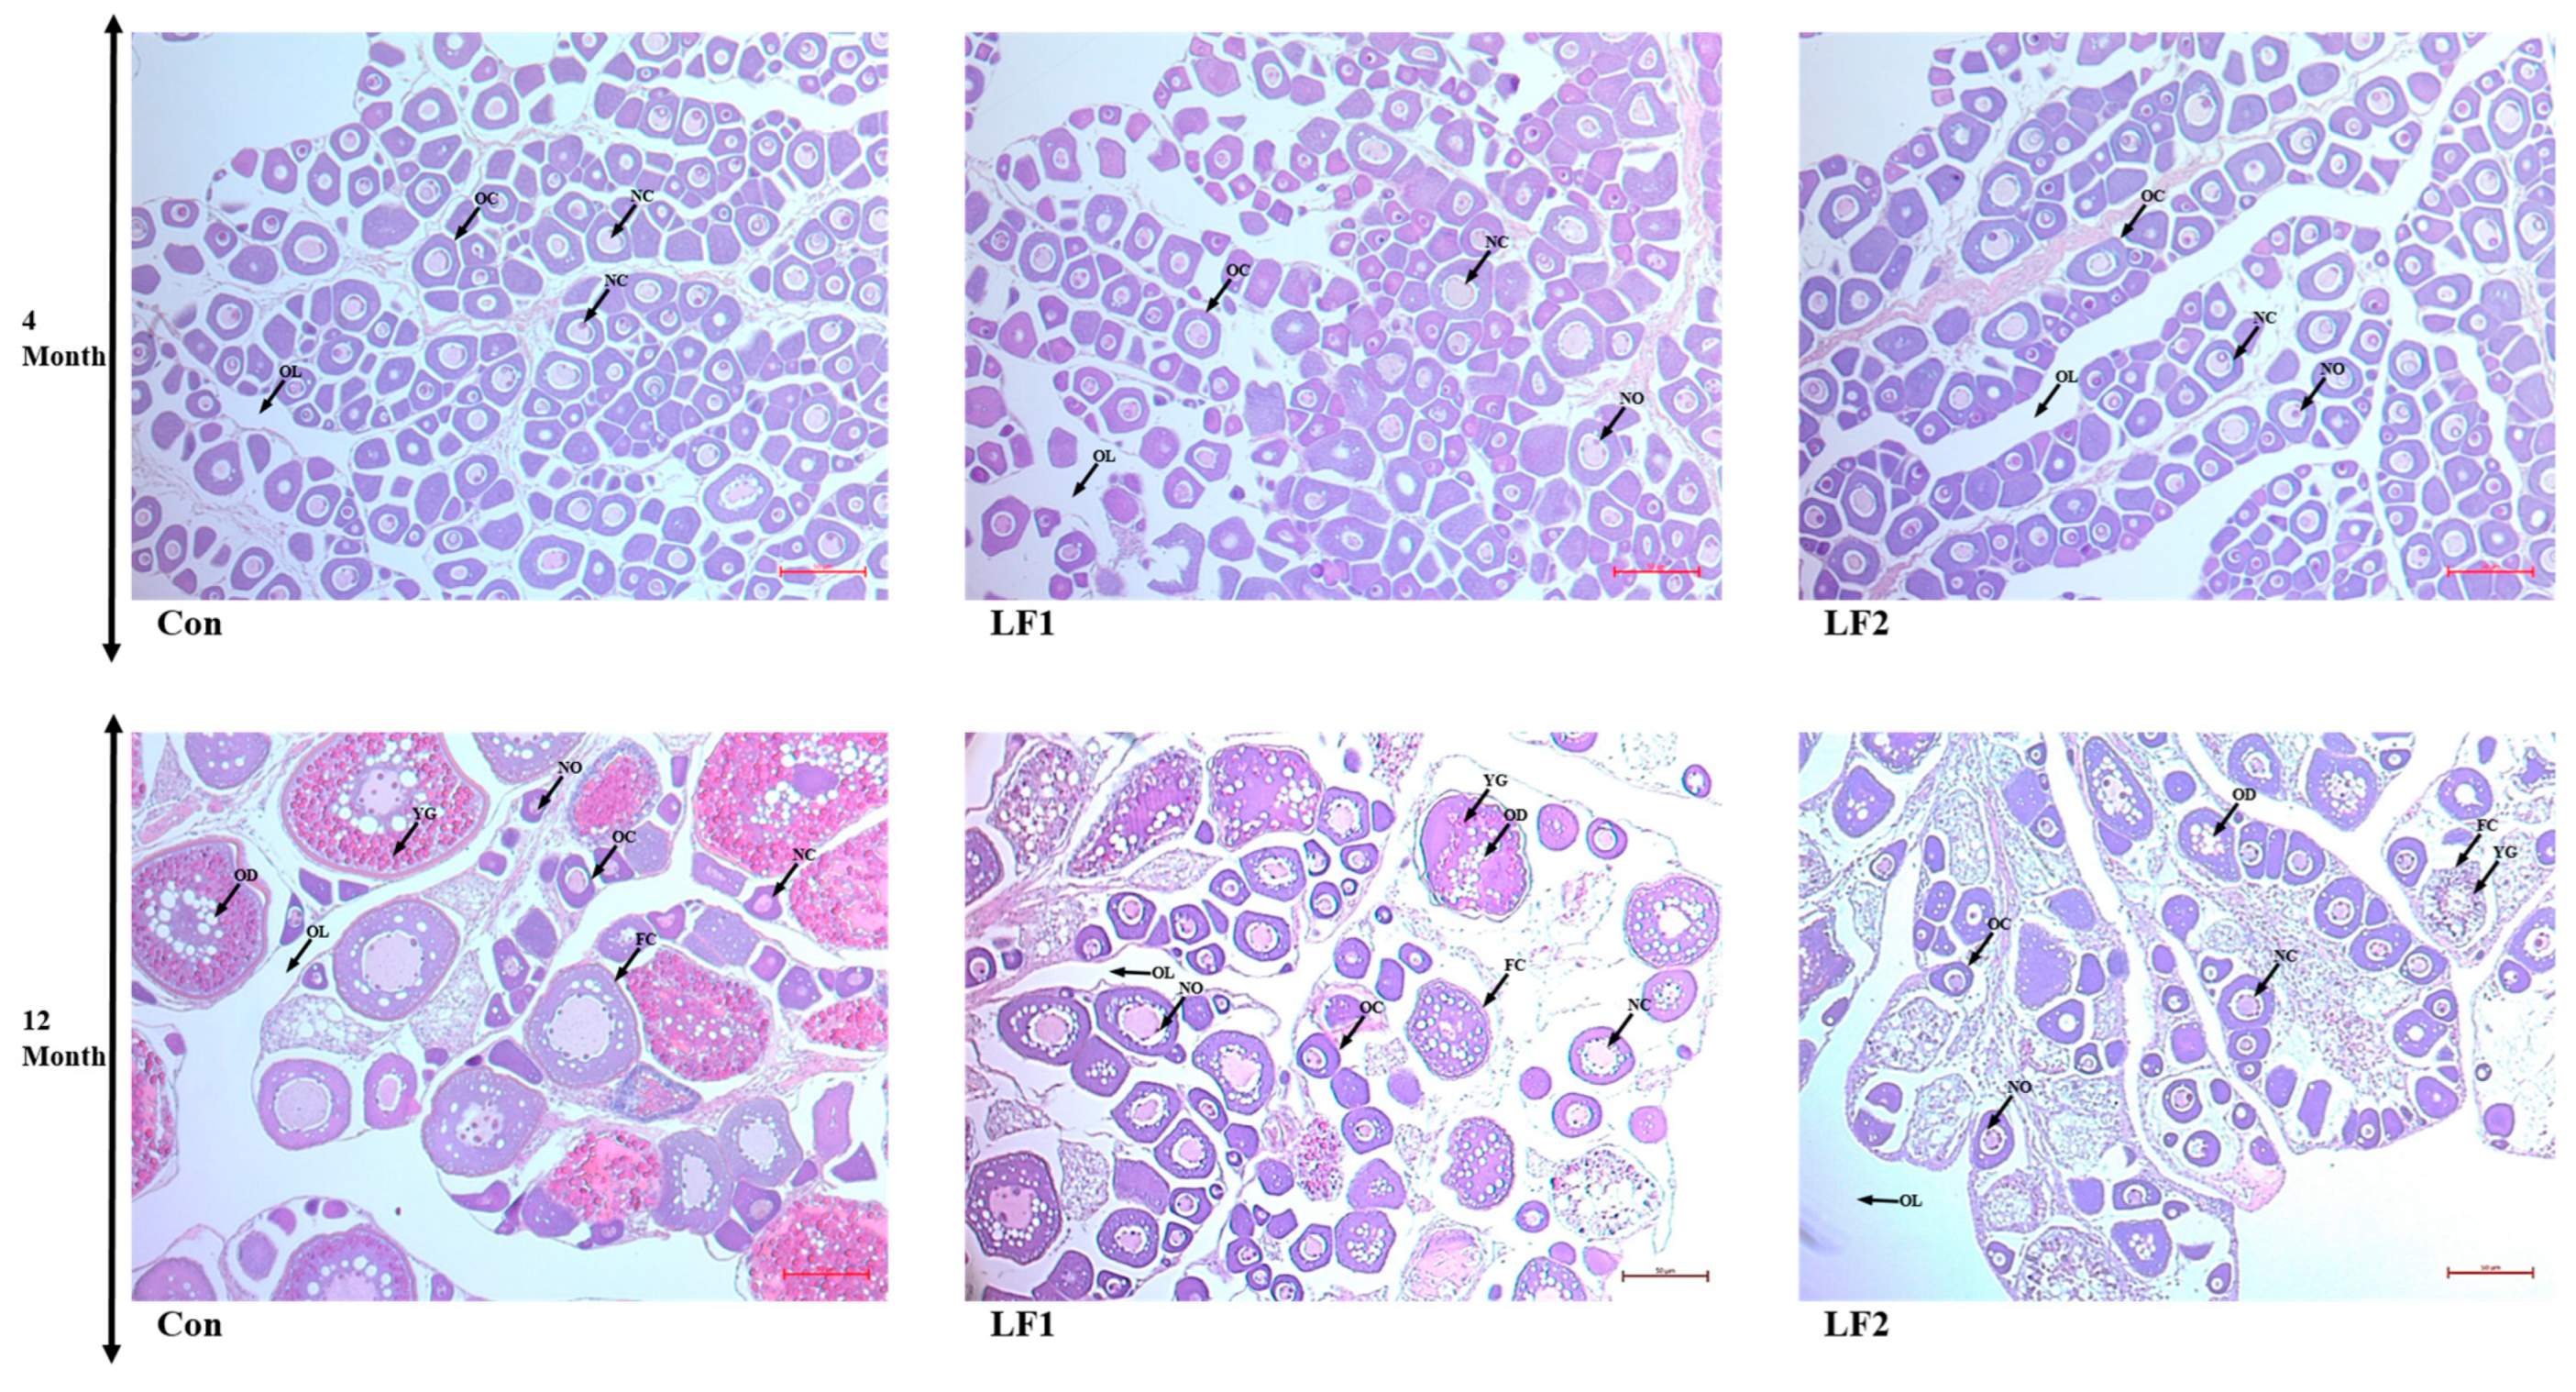
To examine gonadal development, male and female gonads were sampled at 4 and 12 months and fixed in 10% formalin (Sigma) for 24 h. The solution was exchanged twice, and the specimens were stored in 70% ethanol. The fixed tissues were embedded in paraffin to prepare tissue blocks for histological analysis. The tissues were cut into sections 4 µm thick, placed on glass slides, and deparaffinized using xylene. The gonadal tissues were stained with hematoxylin and eosin (BBC Ciochemical, Mount Vernon, WA, USA), and male and female gonads were distinguished. In males, six testes were randomly selected for each group and examined at 100× and 400× magnification (Carl Zeiss, Göttingen, Germany). In females, six ovaries were randomly selected for each group and examined at 200× magnification (Carl Zeiss). The sections were observed and photographed using Zen program v. 3.7 (Carl Zeiss, Göttingen, Germany).

2.6. Quantitative Real-Time PCR

The brains, gonads, livers, and middle intestines of six randomly selected fish from each tank were sampled, immersed in five volumes of Trizol reagent (Ambion, Carlsbad, CA, USA), and stored at −80 °C until use. The stored tissue was thawed before RNA extraction and reverse-transcribed to cDNA using RT & GO master mix (MP Biomedicals). The concentration of cDNA used in the analyses was 100 ng/µL.
The 18S rRNA gene (GenBank, EF126037.1) of olive flounder showed more stable results than other housekeeping genes, so we selected it as a control housekeeping gene. The primers used for mRNA gene expression analysis are shown in Table 2. The levels of expression of growth (GH and IGF) and maturation-related (FSH, LH, ERα, and ERβ) genes in the brain, VIT genes in the liver and gonads, and digestive enzyme-related (amylase, chymotrypsin2, trypsin2, trypsin3, and lipase) genes in the middle intestine were examined. cDNA (100 ng/µL) was subjected to real-time PCR with an initial denaturation step of 2 min at 98 °C followed by 40 amplification cycles of denaturation at 98 °C for 10 s, annealing at 60 °C for 10 s, and extension at 68 °C for 30 s.

2.7. Statistical Analysis

Statistical analyses were performed using one-way ANOVA and Duncan’s multiple range test [33] in SPSS version 24.0 (SPSS Inc., Chicago, IL, USA). All values are expressed as the mean ± SE of triplicate samples. In all analyses, p < 0.05 was taken to indicate statistical significance. SE was used for differences between statistical analyses in results, and SD for general differences such as water temperature and dissolved oxygen.

3. Results

3.1. AA and FA Profiles of the Experimental Diets

The AA profiles of the experimental diets are presented in Table 3. Contents of the essential AAs (EAAs) histidine and phenylalanine and the nonessential AAs (NEAAs) glutamic acid and proline increased with increased substitution of dietary FM with SPC, while the levels of other EAAs and NEAAs decreased. Arginine and lysine contents in the experimental diets seemed to fulfill the dietary requirements (2.04–2.10% and 1.50–2.10% of the diet, respectively) of olive flounder [34,35]. However, methionine levels in all diets, including the Con diet, were below the dietary requirement (1.44–1.49% of the diet) [36].
The FA profiles of the experimental diets are presented in Table 4. FAs were not detected in SPC. The total content of saturated FAs (∑SFA) increased with increasing dietary FM substitution with SPC, but the total levels of monounsaturated FAs (∑MUFA) and n-3 highly unsaturated FAs (∑n-3 HUFA) decreased. The ∑n-3 HUFA content in the Con and LF1 diets satisfied the dietary requirements of olive flounder, but that of ∑n-3 HUFA in the LF2 diet was below the requirement [4].

3.2. Growth Performance

Survival and growth performance are presented in Table 5. Survival at 4 months ranged from 94.7% to 96.3%, and at 12 months, it ranged from 89.67% to 91.33% and was not significantly influenced by dietary replacement. Weight gain at 4 months ranged from 390.8 to 442.3 g/fish, and at 12 months, it ranged from 1171.89 to 1240.32 g/fish. SGR at 4 months was 0.31–0.34%/day, and at 12 months, it ranged from 0.30% to 0.31%/day. Growth performance was not significantly affected by dietary treatment.

3.3. Feed Availability and Biological Indices

The data regarding feed availability (DFI, FE, PER, and PR) and biological indexes (CF, HSI, VSI, and GSI) are presented in Table 6. The results of the four-month DFI ranged from 0.44% to 0.48% per day and were not affected by dietary treatment. The feed efficiency (FE) was observed to be in the range of 0.63–0.70, while the protein efficiency ratio (PER) ranged from 1.16 to 1.32, and the protein retention (PR) ranged from 37.36 to 42.90%. The feed availability indices remained unaltered in response to the dietary treatment. The results of the 12-month DFI ranged from 0.44% to 0.46%/day, with FE at 0.64–0.66 and PER at 1.07–1.23. The aforementioned parameters exhibited no statistically significant influence from the treatment. However, there was a significant difference in PR between the LF2 and Con diets, with the former exhibiting a higher PR. No significant differences were observed between the LF1 and LF2 diets.
The results of the four-month CF ranged from 1.04 to 1.16 g/cm3, the VSI was 3.45–3.99%, the HSI was 1.44–1.57%, and the GSI of males ranged from 0.15% to 0.17% and for females ranged from 1.09% to 1.27%. The results of the 12-month CF ranged from 1.20 to 1.23 g/cm3, VSI was 5.78–6.16%, and HSI was 1.98–2.20%. No significant effects of treatment were observed for any of these parameters. However, at the 12-month mark, fish of both sexes fed the Con diet exhibited significantly higher GSI than those fed the LF1 and LF2 diets.

3.4. Proximate Composition of Dorsal Muscle

The proximate compositions of the dorsal muscle of fish are presented in Table 7. The results of the 4-month moisture content ranged from 71.95% to 72.87%, crude protein was 21.91–22.44%, and ash was 1.50% to 1.57%. The results of the 12-month moisture content ranged from 73.42% to 73.52%, crude protein was 23.07–23.44%, and ash content was 1.41–1.52%. These parameters were not significantly affected by substitution. However, crude lipid content was significantly higher in LF2 fish versus the other groups.

3.5. AA and FA Profiles of Dorsal Muscle

The AA and FA profiles of the dorsal muscle of fish are presented in Table 8 and Table 9. With the exception of aspartic acid, cysteine, and proline, AA levels were not significantly influenced by treatment. Regarding FAs, ∑SFA and ∑MUFA were also not significantly affected, while ∑n-3 HUFAs, including eicosapentaenoic acid (EPA; C20:5n-3) and docosahexaenoic acid (DHA; C22:6n-3), were significantly higher in the Con group than the other groups.

3.6. Histology of Gonads

Fish that were fed substitution diets showed no differences in spermatogonia at 4 months (Figure 1). However, the proportion of spermatogonia increased at 12 months compared to 4 months. Increasing replacement with SPC reduced the proportion of spermatogonia due to the dysfunction of the transformation of spermatogonia to spermatozoa (Figure 2). There were no differences in the oocytes of fish fed the experimental diets at 4 months (Figure 3). Ovaries were enlarged in Con fish at 12 months because oocytes absorbed yolk globules. This did not occur, and the oocytes decreased in size in the treatment groups.

3.7. Analysis of Gene Expression

Expression of growth-related genes in the brain of olive flounder are presented in Figure 4. The expressions of growth hormone (GH) and insulin growth factor (IGF) genes in the brains of fish fed the LF2 diet were significantly higher than those in the Con and LF1 groups.
Expression of sex maturation-related genes in the brain of olive flounder are presented in Figure 5. Regarding the expression of genes related to sex maturation, the levels of FSH and LH in the brain were significantly higher in Con fish than in the other groups. Expression of estrogen receptor genes in the brain and gonad of olive flounder are presented in Figure 6. The levels of ERα were significantly higher in both treatment groups vs. controls; that of ERβ was significantly higher in LF2 fish vs. controls (with no differences between treatment diets).
Vitellogenin gene expression in the gonad and liver of olive flounder are presented in Figure 7. VIT expression in the gonad was significantly higher in controls than in the other groups; however, in the liver, they were significantly higher in LF2 fish than in the other groups.
Expression of digestive enzyme-related genes in the middle intestine of olive flounder are presented in Figure 8. Finally, regarding genes related to digestive enzymes, amylase expression in the middle intestine was not significantly affected by treatment, whereas chymotrypsin2, trypsin2, trypsin3, and lipase were significantly higher in LF2, LF1, and Con fish, respectively, than in the remaining groups of each comparison.

4. Discussion

SPC is gaining traction as an alternative source of protein to FM for addition to commercial fish diets, overcoming the problems associated with the increasing cost of FM and poor digestibility of soybean [19,20,37]. Weight gain and SGR of olive flounder fed the LF1 and LF2 diets were comparable to those fed the Con diet, indicating that 50% FM could be substituted with SPC supplemented with limiting AAs (lysine and methionine) in the 60% FM-based diet without compromising growth performance. This is in line with previous studies on gilthead seabream (Sparus aurata L.) [9] and starry flounder (Platichthys stellatus) [19].
Arginine (2.04–2.10% of the diet) [34] and lysine (1.50–2.10% of the diet) [35] requirements in the diet of olive flounder were met in all experimental diets in the present study. However, methionine levels (1.17–1.37% of the diet) in all experimental diets, including the Con diet, were slightly lower than requirements (1.44–1.49% of the diet in the presence of 0.06% cysteine) [36]. Previous studies have demonstrated that cysteine supplementation can spare about 40–50% of the dietary methionine requirement for Catla catla [38] and stinging catfish (Heteropneustes fossilis) [39]. Therefore, the relatively high (0.28–0.61%) cysteine content in the diets used in this study was able to lower the dietary methionine requirement of olive flounder. Increased substitution of dietary FM with SPC increased ∑SFA but decreased ∑MUFA and ∑n-3 HUFA. ∑n-3 HUFA is crucial for the optimal growth and health of fish [40]. The Con and LF1 diets satisfied the dietary ∑n-3 HUFA requirement of olive flounder (8.16–10.20% of total FA) [4], but the LF2 diet had a slightly low ∑n-3 HUFA content. Nevertheless, this does not have a negative effect on growth performance as it does for P. olivaceus, in line with previous studies [39,40].
Replacement of 50% FM in the diet with SPC supplemented with limiting AAs did not affect the DFI, FE, and PER of olive flounder. This is partially in line with [41], who reported that the growth performance and FE of red sea bream (Pagrus major) fed a similar percentage of an SPC-based diet with AA supplementation (for 60 days) were higher than in fish fed the same diet without supplementation; however, the latter fish had similar parameters after 153 days of feeding. In another study, the DFI, FE, and PER of black sea bream (Acanthopagrus schlegelii) fed a diet with a replacement of 40% FM with SPC were comparable to fish fed a 60% FM-based diet [42]. In another study, there were no differences in growth or FE between gilthead seabream fed a 60% FM-based diet or the same diet in which up to 40% FM was replaced by SPC supplemented with methionine for 10 weeks [9]. Similarly, in [19], there were no changes in the DFI of starry flounder fed a diet with substitution of up to 60% FM by SPC with AA supplementation compared to fish fed a control diet of 68% FM. In this study, CF, VSI, or HSI did not decrease in treatment groups with supplementation, in line with previous studies on olive flounder [39] and yellow croaker (Larimichthys crocea) [20]. However, we found that GSI results at 12 months were higher in both sexes fed the control diet. This may have been due to ∑n-3 HUFA levels and ER gene expression, which are very important for growth and maturation [43,44,45,46]. Changes in dietary FA profile affect steroid production in the African catfish (Clarias gariepinus) [27], and adding appropriate amounts of n-3 or n-6 ∑HUFA is important for improving egg quality [45]. VIT production is induced via the ER and accumulates in egg yolk [25,29]. However, ref. [25] reported no differences in the GSI of female olive flounder fed a 63% FM-based diet or diets with replacement of 20% and 30% FM with SPC. This may have been due to the difference in size of the fish between that study (initial weight 150 g) and ours (initial weight 727 g), as female olive flounder can reach maturity in the second year of life [47].
In this study, AA and FA profiles of dorsal muscles were found to be affected by dietary treatment, which is in line with several previous studies [16,19,24,41,44,48,49,50]. In this study, the proximate lipid composition of olive flounder was not influenced by dietary treatment, but high levels of crude lipid were found in the dorsal muscles of LF2 fish, probably due to the high level of protein in that diet. Similarly, in a previous study, the crude protein and total lipid compositions of rainbow trout (Oncorhynchus mykiss) differed in fish fed different FM or plant protein diets [48]. Similar findings have been reported in common sole [26].
Regarding gonads, as noted in the results, there were no differences at 4 months, but the substitute diet resulted in a greater proportion of spermatogonia and abnormal transformation from spermatogonia to spermatozoa at 12 months; in addition, oocytes failed to absorb yolk globules in such fish. Maturation is influenced by photoperiod and water temperature [47,51], and gonadal development in olive flounder occurs in the spring [52]. October was the fourth month of this experiment, so there were no differences in the histological results at that time point, only after a year [25,53]. In addition, the GSI and ∑n-3 HUFA levels of dorsal muscle were lower in LF2 fish than in controls, while, as already noted, the crude lipid level was lower in controls. Ref. [44] reported that mature fish utilize fat absorbed from digestion, leading to a decrease in their body fat. ∑n-3 HUFA is essential for both maturation [44] and oocyte development [54]. Previous studies have shown that dietary and muscle ∑n-3 HUFA levels play important roles in the maturation of gilthead sea bream [43] and Atlantic salmon (Salmo salar) [45].
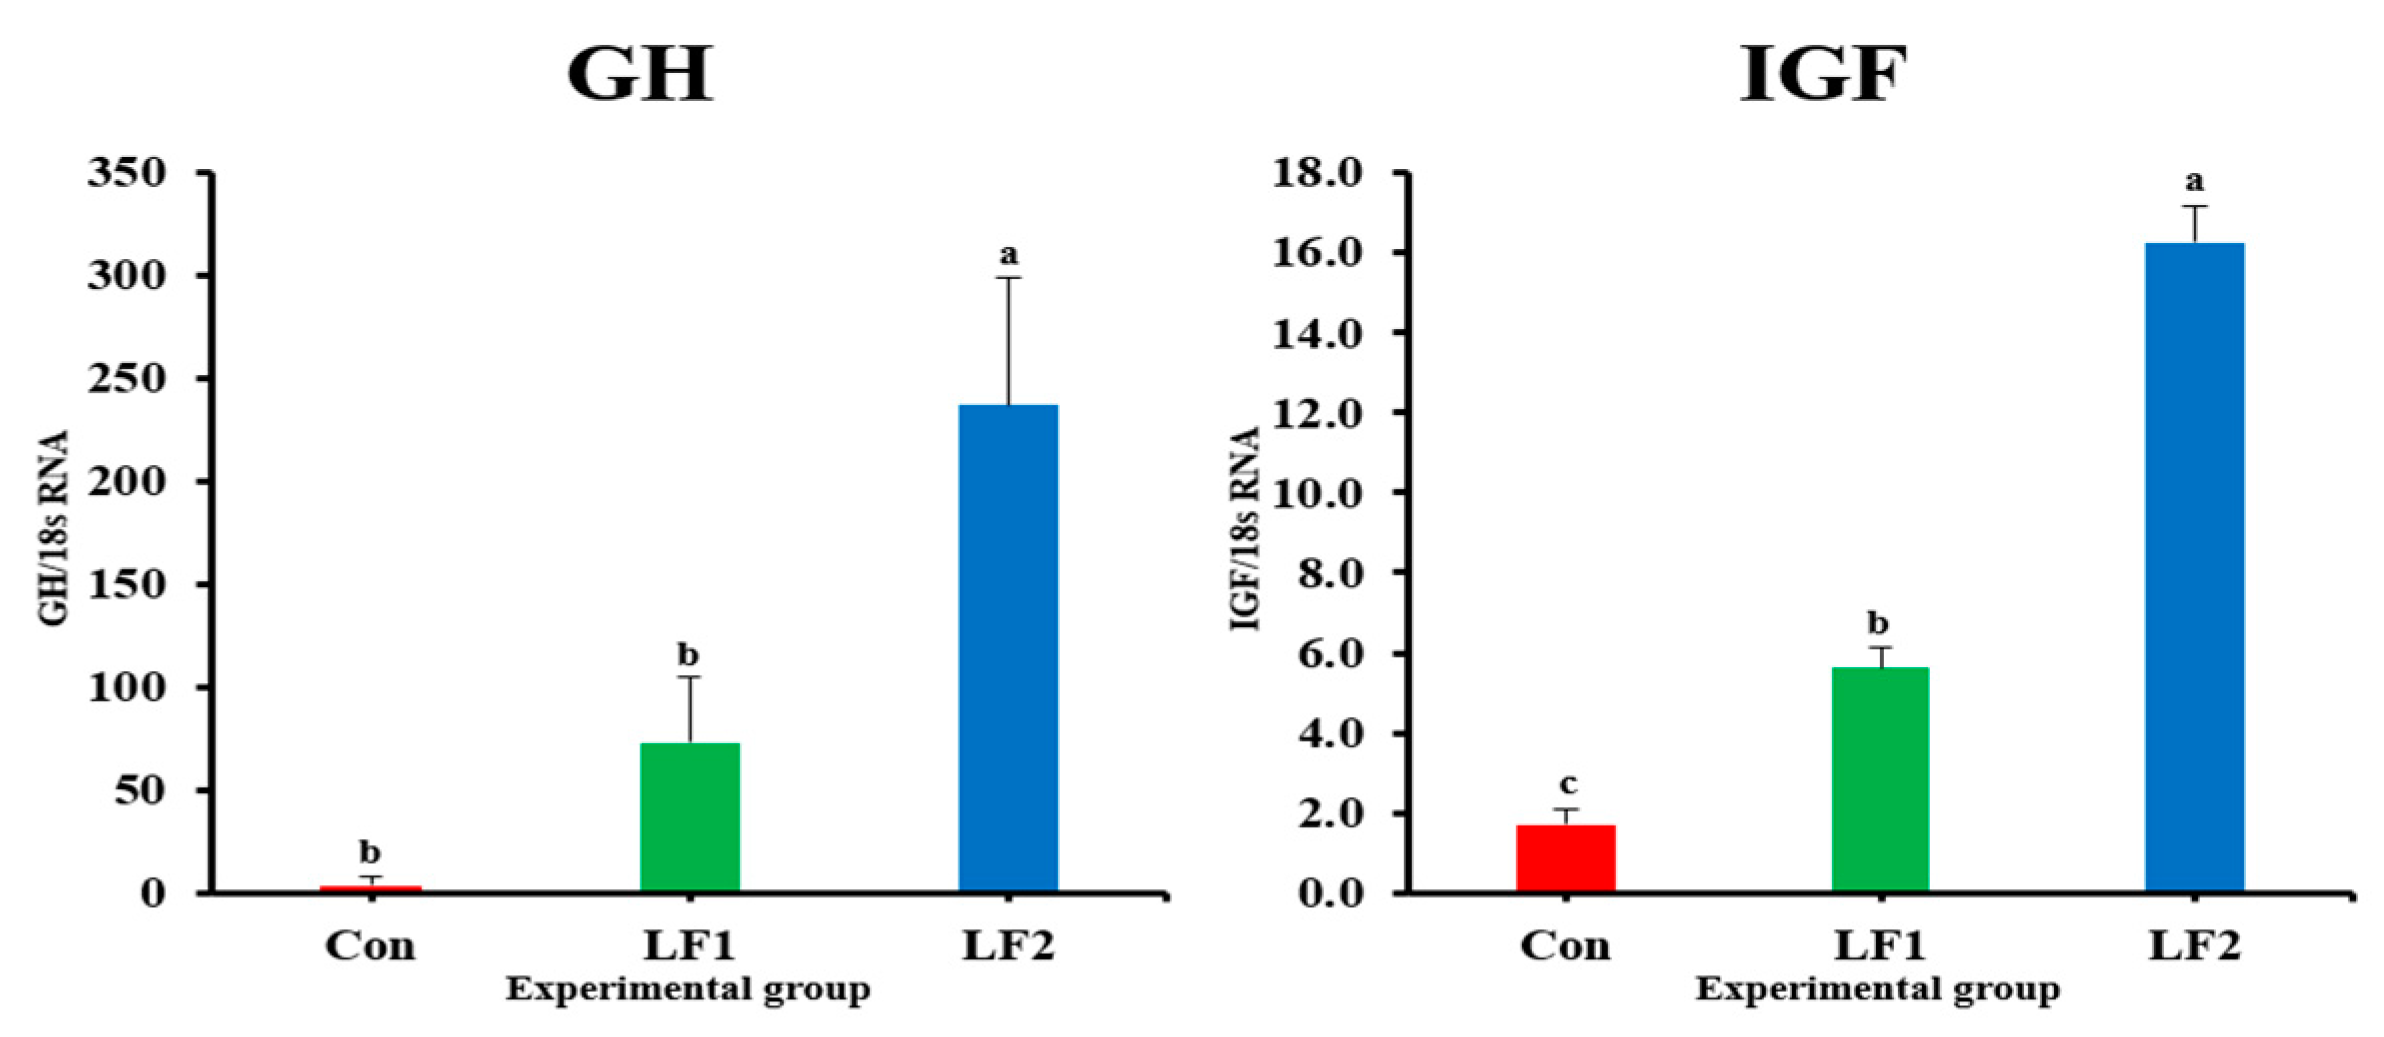
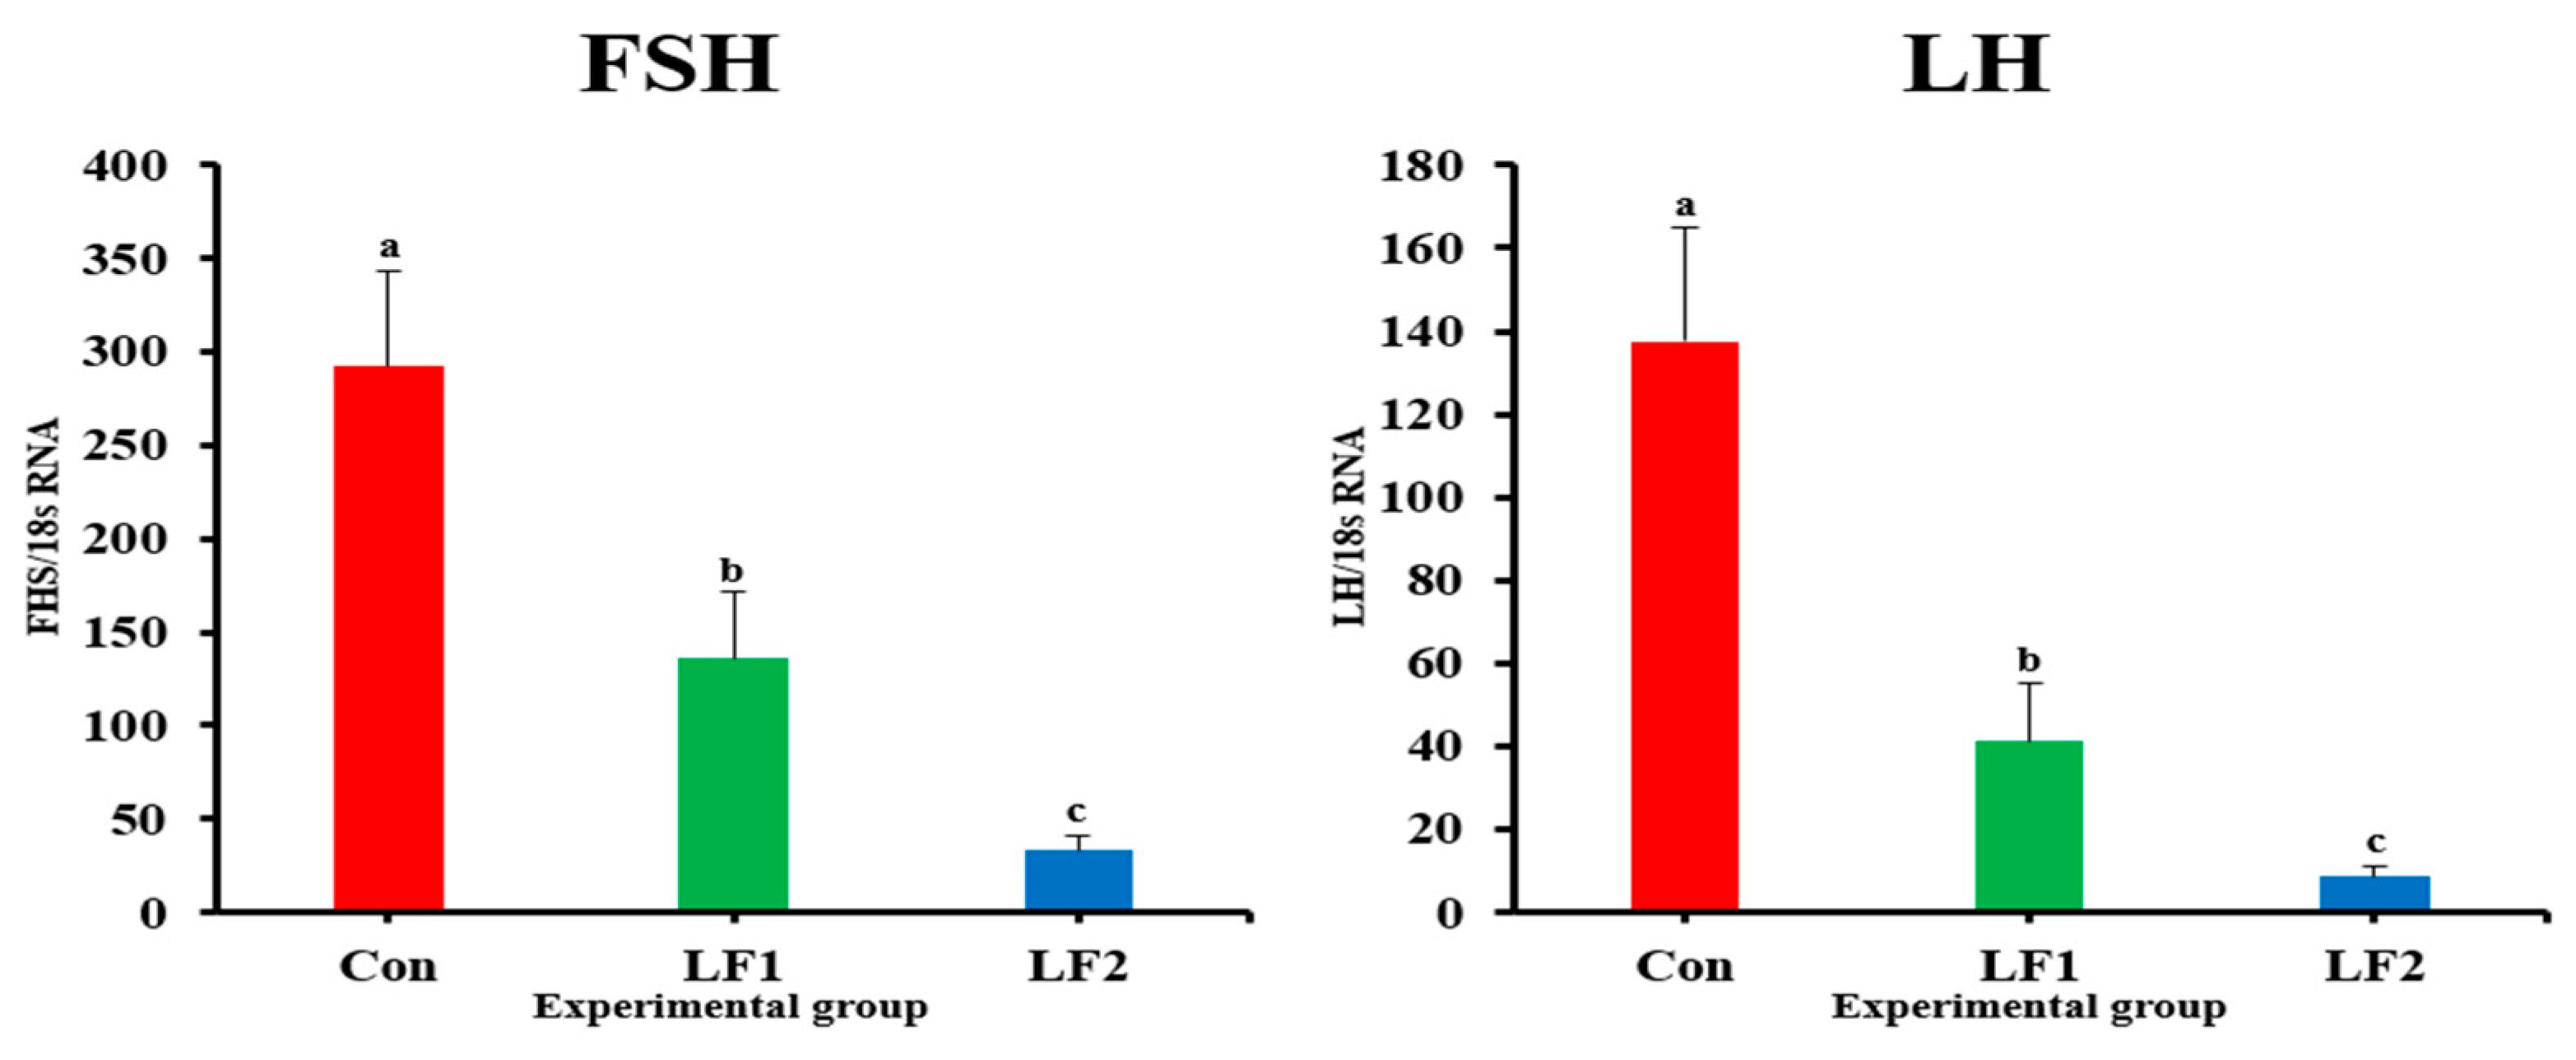
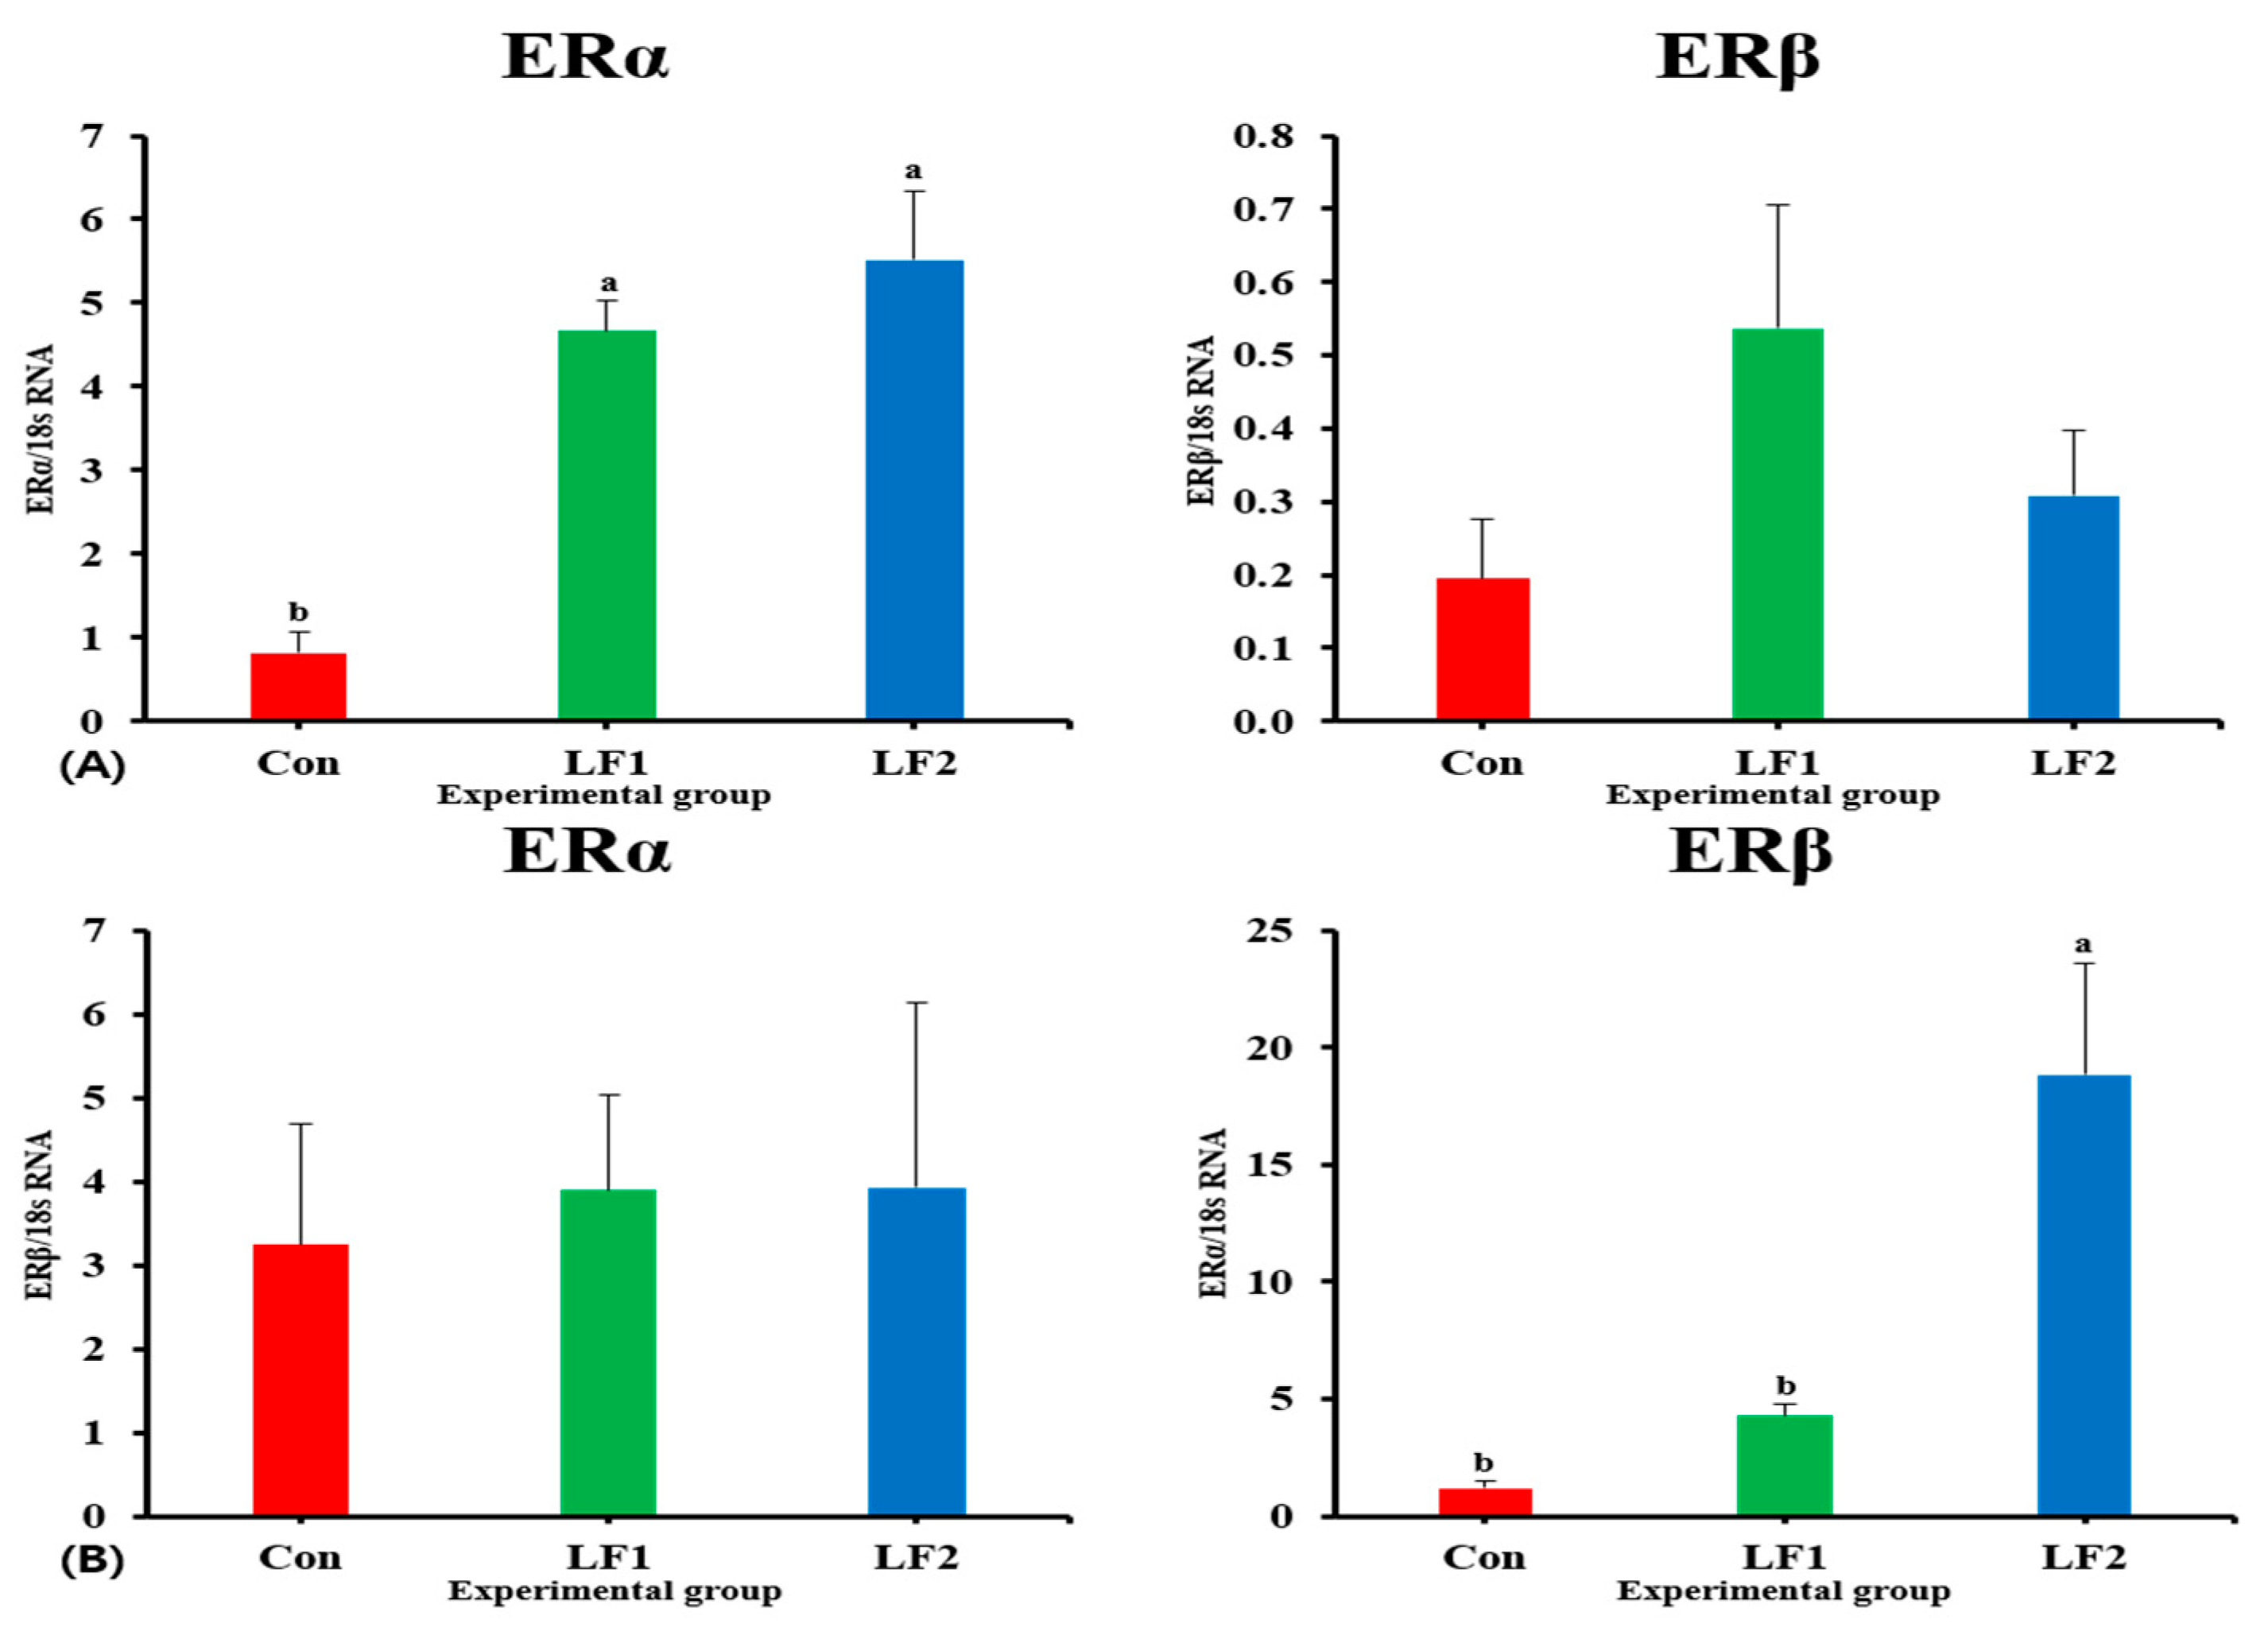
The expression levels of genes that encode growth hormones (GH and IGF) in fish fed the LF2 diet were higher than in controls. However, maturity-related genes showed the opposite trend. Previous studies have shown that growth slows down during maturation [44,55] and maturation-related gene expression suppresses growth-related gene expression [25]. Maturation occurs along the brain–pituitary–gonad axis, and maturation-related genes are expressed in the brain [28,54]. The expressions of FSH, LH, ERα, and ERβ affect ovarian development and act as part of a positive steroid feedback loop [25,28,56]. FSH induces gonadal growth, and LH mainly regulates gonadal maturation [28,57,58]. The low levels of maturation-related indicators (GSI and results of histological analysis) appeared to be related to decreased FSH and LH gene expression in fish, which is a consequence of increased dietary FM replacement by SPC. ER is involved in the production of VIT and plays an important role in its accumulation in the egg yolk [25,29]. GH and E2 gene expression occur at the same time [55], and the ER is a receptor of E2 [
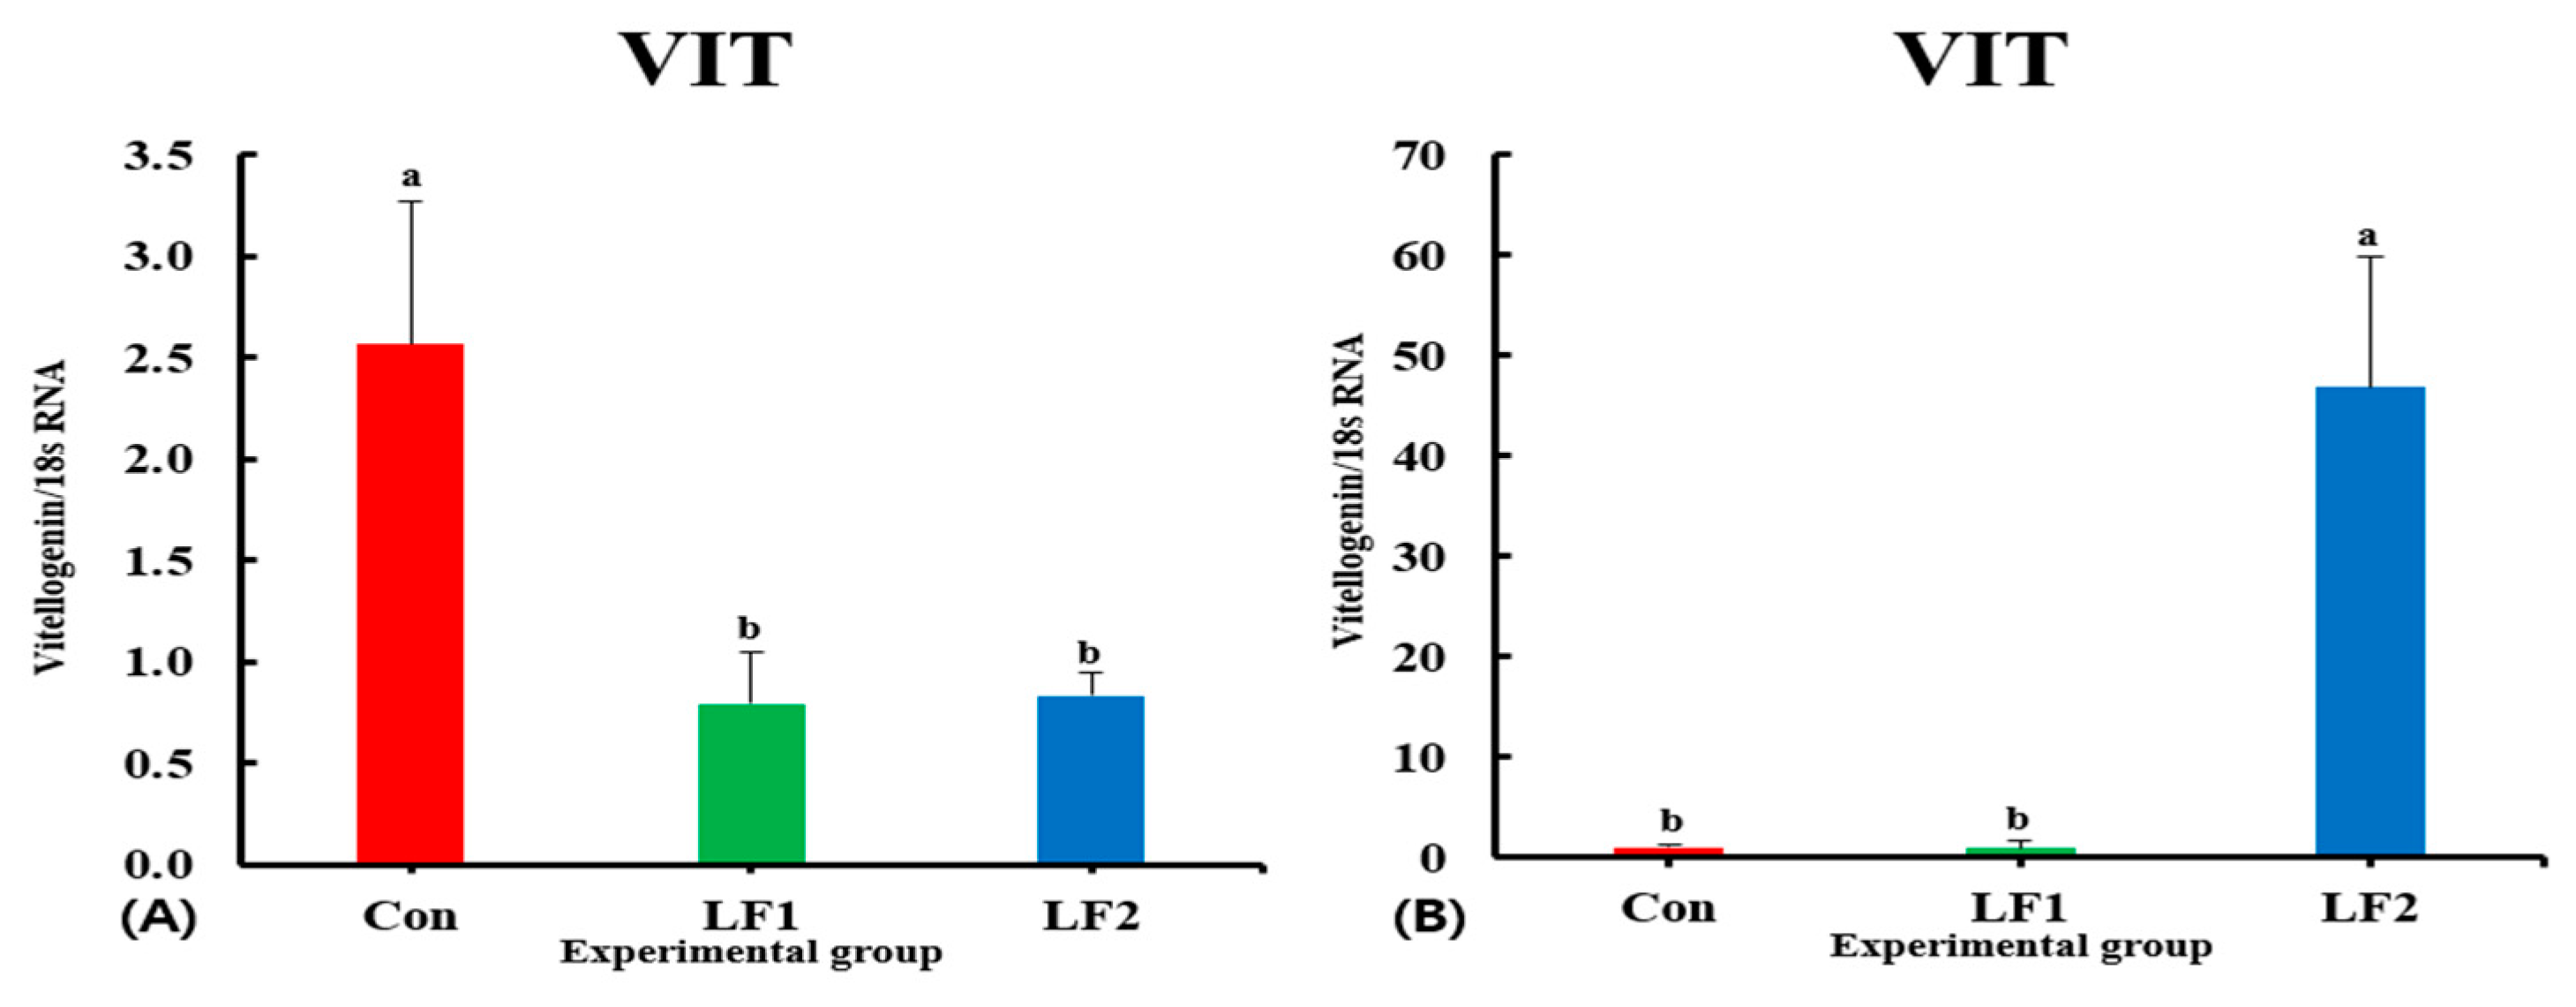
25]. This explains the highest level of ER gene expression in the LF2 diet group. VIT is produced in the liver and absorbed by oocytes, and it is used as a nutrient for embryonic development after fertilization [25]. Gonadal VIT gene expression level was highest in the Con group, in line with two previous studies [25,44]. However, the expression of the VIT gene in the liver was highest in LF2 fish. Ref. [59] reported that VIT expression in the liver was highest at the late-VIT (LV) stage and was highest in the ovary at the post-VIT (PV) stage in turbot (Scophthalmus maximus). The fish in the Con group would have been considered to be in the PV stage, LF1 fish would be in the LV stage, and LF2 fish would be in the early VIT (EV) stage. VIT gene expression in the ovary, but not in the liver, was the same as in [59]. This may have been due to the influence of ER gene expression, which was highest in the LF2 group. ER gene expression is significantly higher at the beginning of the reproduction cycle in rainbow trout [60]. Based on these results, we assume that increased dietary FM replacement with SPC made it more difficult for fish to digest lipids and accumulate liver-produced VIT in the oocytes or delayed the timing of VIT production relative to the Con diet group.
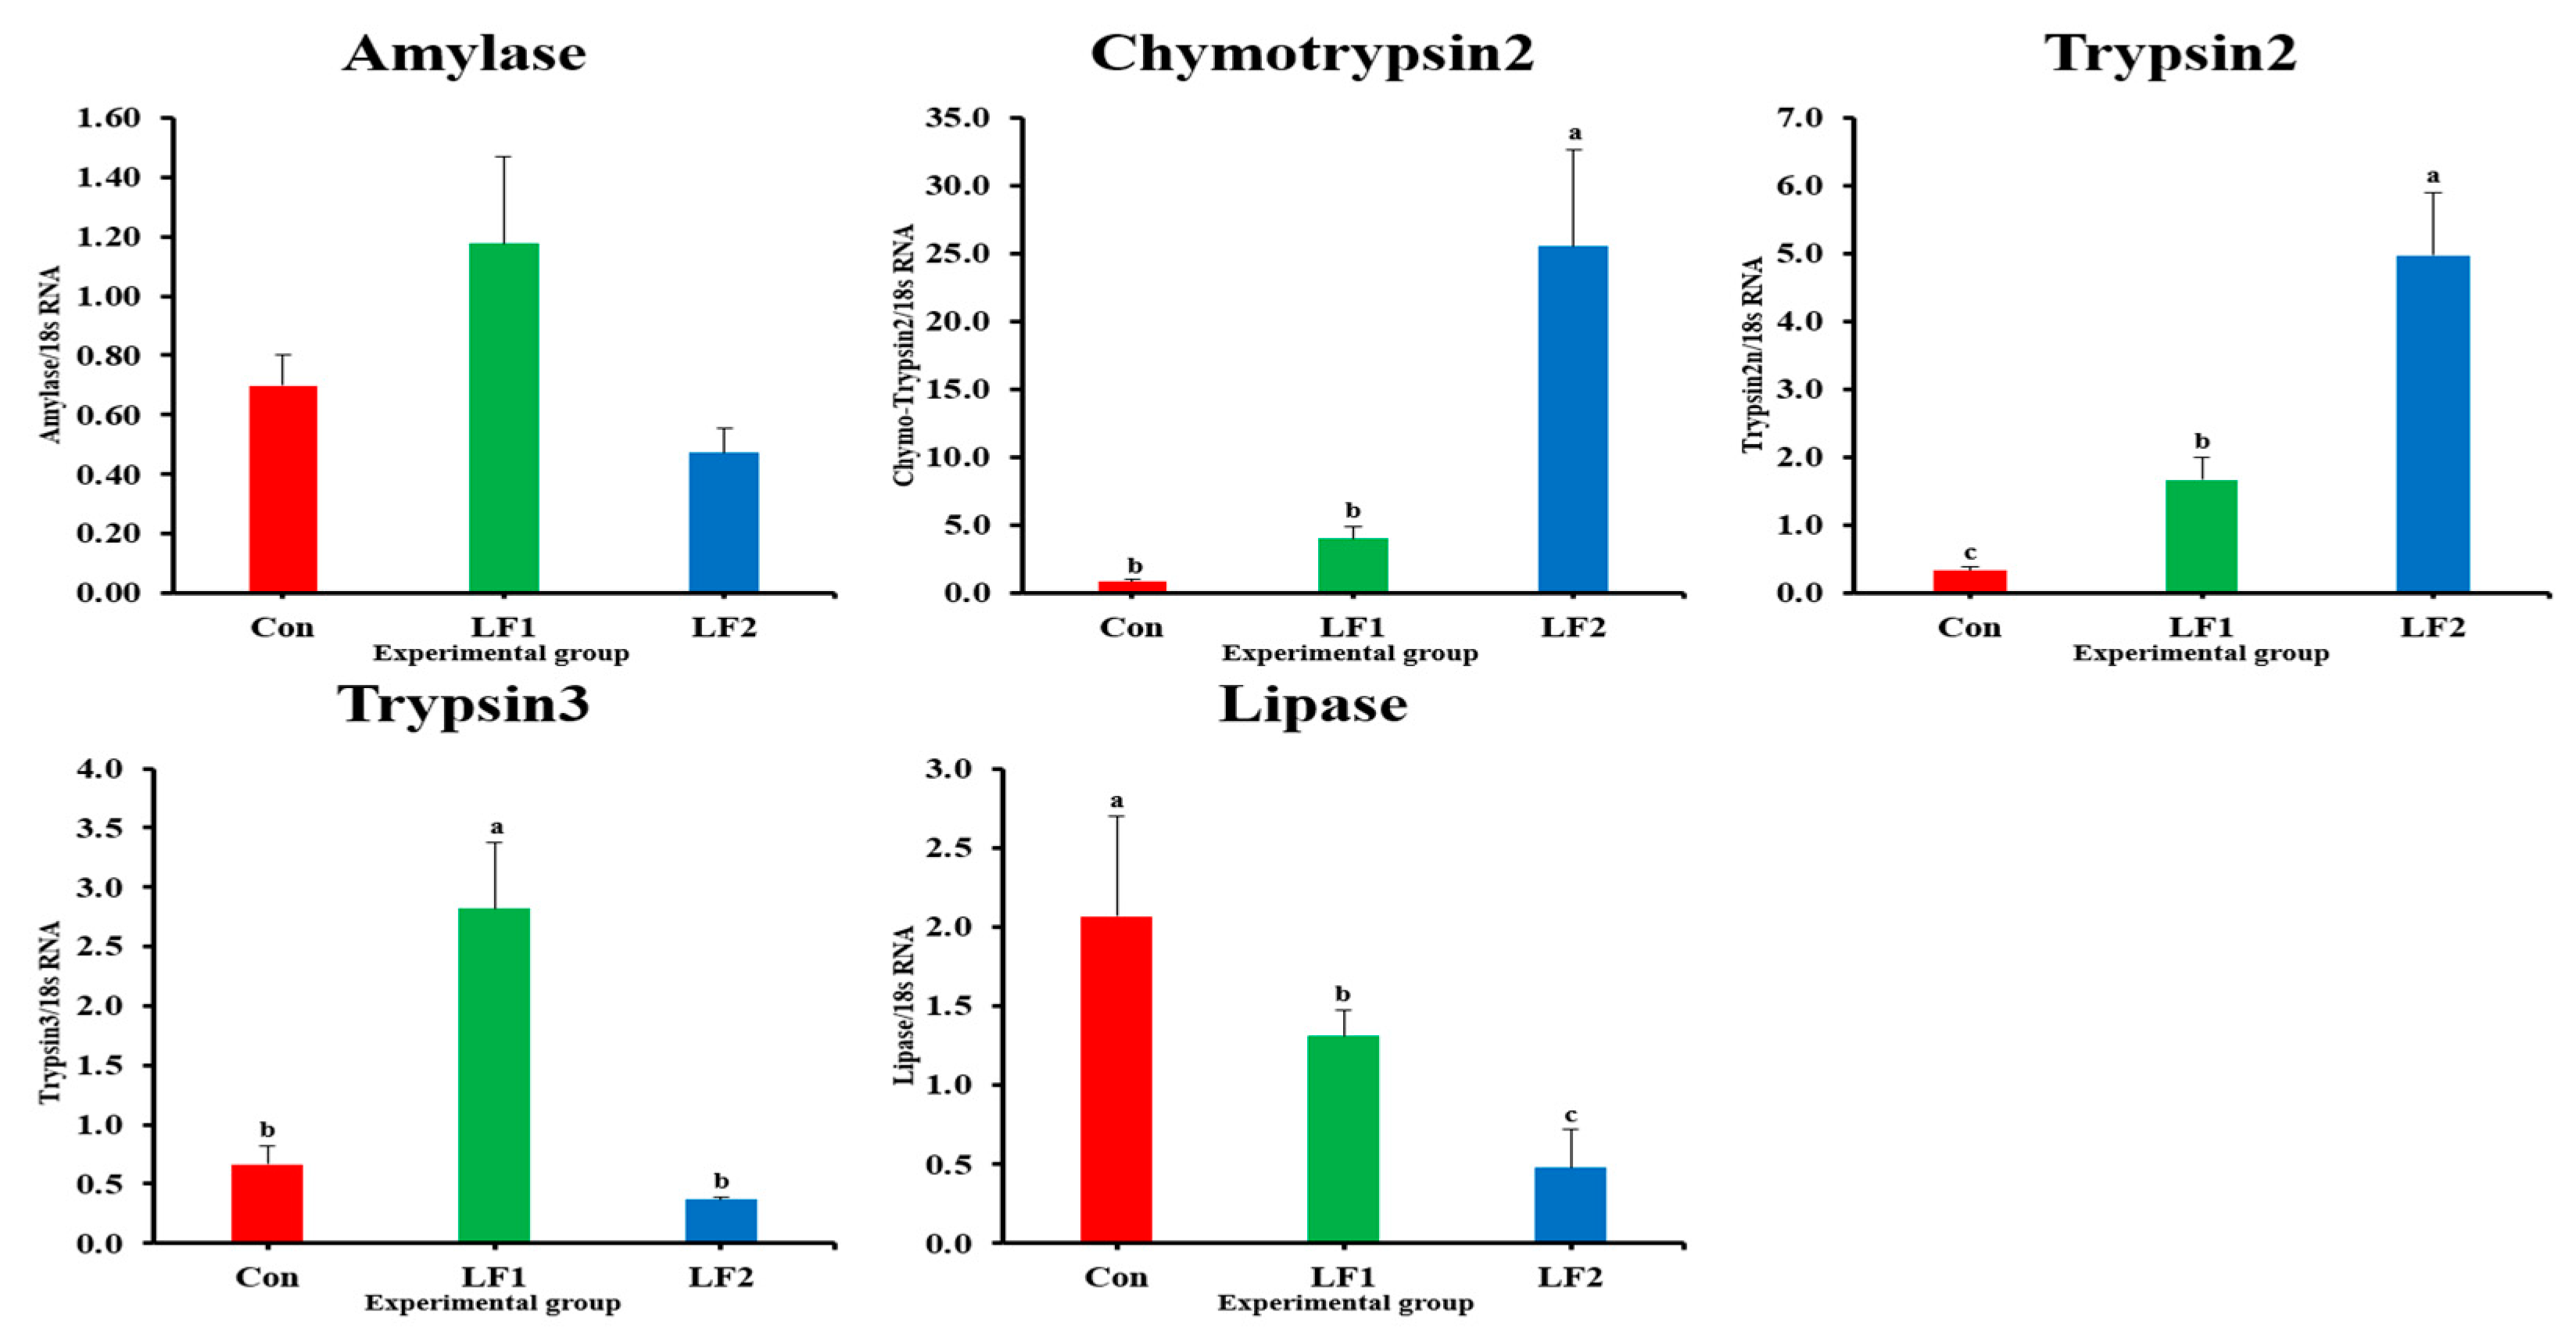
The expression levels of the chymotrypsin2 and trypsin2 genes in the middle intestine increase with an increase in replacement with SPC in this study. Similarly, ref. [19] reported such an increase in the trypsin enzyme. Two previous studies of proteolytic enzymes showed that 40% dietary FM replacement with SPC increased the activities of pepsin and trypsin in rainbow trout and starry flounder [19,61]. However, the apparent digestibility coefficient (ADC) of protein decreases with increased dietary FM replacement with SPC [16]. However, despite the difference in the amounts of digestive enzymes in the intestine and ADC results, there was no difference in the crude protein content in the dorsal muscle [16,19]. It has been postulated that an imbalance in the amino acid content of the diet may result in a reduction in the digestive rate [16]. However, this has not been demonstrated to affect growth in this study, and numerous previous studies have indicated that such an imbalance does not influence digestive processes [16,21,47,61]. Nevertheless, previous studies suggest that the trace level of trypsin inhibitor present in SPC may stimulate the production of protein digestive enzymes [19,61]. Therefore, the high levels of chymotrypsin2 and trypsin2 gene expression in LF2 fish would increase the digestibility of SPC in the diet. However, the expression of the lipase gene was lowest in LF2 fish, similar to reports on juvenile hybrid grouper (Epinephelus fuscoguttatus♀ × E. lanceolatus♂) [62]. Fat absorbed through digestion triggers maturation in fish [25,43]. Therefore, the lowest expression of the lipase gene in the LF2 group may have been related to maturation. It is imperative to assess the complexity of the individual and the subsequent generation that provides the feed.
Prior research has indicated that the supplementation of FM with heated soybeans in African catfish diets has resulted in reduced fertilization, hatching, and survival rates [61]. The quality of dietary protein has been demonstrated to influence ovarian size and the viability of eggs produced [27,63,64]. This assessment should be conducted in order to determine the feasibility of replacing FM with SPC through future verification.

5. Conclusions

Up to 50% dietary FM can be replaced by SPC in diets supplemented with AAs without adverse effects on growth performance, feed availability except for PR, and biological indices in olive flounder. However, indicators related to maturation decreased with increasing dietary FM replacement with SPC. Therefore, given the uncertain correlation between maturation and alternative protein sources in the diet, further comprehensive study is recommended.

Author Contributions

Conceptualization, H.C.K.; methodology, J.-W.P., S.-M.J. and H.C.K.; investigation, S.H.L. and Y.J.S.; data curation, Y.J.S., M.J., S.-M.J. and D.L.; writing—original draft preparation, S.H.L.; writing—review and editing, S.H.L. and J.K.; supervision, H.C.K.; project administration, H.C.K.; funding acquisition, H.C.K. All authors have read and agreed to the published version of the manuscript.

Funding

This work was supported by the National Institute of Fisheries Science, Ministry of Oceans and Fisheries, Korea (R2024032).

Institutional Review Board Statement

The feeding trial and handling and sampling of the experimental fish were carried out per the ethical guidelines of the Aquafeed Research Center (National Institute of Fisheries Science), and the animal study protocol was approved by the Animal Experiment Ethics Committee of National Institute of Fisheries Science (Ref No. 2022-NIFS-IACUC-6).

Informed Consent Statement

Not applicable.

Data Availability Statement

Data are contained within the article.

Conflicts of Interest

The authors declare no conflicts of interest.

References

  1. Park, J.; Lee, D.; Jung, H.S.; Kim, J.; Yang, H.; Kim, H.; Lee, J. Estimation of genetic parameter for growth traits of olive flounder Paralichthys olivaceus on the 8th generation of selective breeding using multiple traits animal model. Korean J. Fish. Aquat. Sci. 2022, 55, 549–556. [Google Scholar] [CrossRef]
  2. KOSIS. Korean Statistical Information Service 2024. Available online: https://kosis.kr/statisticsList/statisticsListIndex.do/ (accessed on 22 February 2024).
  3. Lee, S.H.; Park, J.; Jeong, M.; Lee, D.; Kim, J.; Kim, H. Effects of Substituting Fishmeal with Soy Protein Concentrate Supplemented with Essential Amino Acids in the Olive Flounder (Paralichthys olivaceus) Diet on the Expression of Genes Related to Growth, Stress, Immunity, and Digestive Enzyme. Animals 2024, 14, 3039. [Google Scholar] [CrossRef] [PubMed]
  4. Kim, K.; Lee, S. Requirement of dietary n-3 highly unsaturated fatty acids for juvenile flounder (Paralichthys olivaceus). Aquaculture 2004, 229, 315–323. [Google Scholar] [CrossRef]
  5. Lee, S.; Cho, S.H.; Kim, K. Effects of dietary protein and energy level on growth and body composition of juvenile flounder Paralichthys olivaceus. J. World Aquac. Soc. 2000, 31, 306–315. [Google Scholar] [CrossRef]
  6. Hur, S.; Lee, J.; Lee, S.; Jeong, S.; Kim, K. Effects of worm-based extruded pellets on growth performance of olive flounder Paralichthys olivaceus in commercial aquafarms. Korean J. Fish. Aquat. Sci. 2022, 55, 533–540. [Google Scholar] [CrossRef]
  7. Lovell, T. Nutrition and Feeding of Fish; Van Nostrand Reinhold: New York, NY, USA, 1989. [Google Scholar]
  8. Jeong, S.; Kim, N.; Hur, S.; Lee, S.; Bae, J.; Kim, K. Effect of dietary inclusion of black soldier fly larvae Hermetia illucens meal on growth performance of starry flounder Platichthys stellatus and feed value. Korean J. Fish. Aquat. Sci. 2023, 56, 373–379. [Google Scholar] [CrossRef]
  9. Kokou, F.; Rigos, G.; Kentouri, M.; Alexis, M. Effects of DL-methionine-supplemented dietary soy protein concentrate on growth performance and intestinal enzyme activity of gilthead sea bream (Sparus aurata L.). Aquac. Int. 2016, 24, 257–271. [Google Scholar] [CrossRef]
  10. Deng, J.; Mai, K.; Ai, Q.; Zhang, W.; Xu, W.; Liufu, Z. Effects of dietary protein sources on feed intake, growth and plasma thyroid hormones levels of Japanese flounder (Paralichthys olivaceus). Aquac. Int. 2011, 19, 1061–1074. [Google Scholar] [CrossRef]
  11. Ha, M.S.; Lee, K.W.; Kim, J.; Yun, A.; Jeong, H.S.; Lee, M.J.; Baek, S.I.; Cho, S.H.; Kim, K.W.; Lim, S.G.; et al. Dietary substitution effect of fish meal with chicken byproduct meal on growth, feed utilization, body composition, haematology and non-specific immune responses of olive flounder (Paralichthys olivaceus). Aquac. Nutr. 2020, 27, 315–326. [Google Scholar] [CrossRef]
  12. Hardy, R.W. Utilization of plant proteins in fish diets: Effects of global demand and supplies of fishmeal. Aquac. Res. 2010, 41, 770–776. [Google Scholar] [CrossRef]
  13. Index Mundi. Soybean Meal Production by Country in 1000 MT. Available online: https://www.indexmundi.com/agriculture/?commodity=soybean-meal&graph=production (accessed on 23 February 2023).
  14. Index Mundi. Fish-Meal Monthly Price. Available online: https://www.indexmundi.com/commodities/?commodity=fish-meal&months=300&currency=krw (accessed on 23 February 2023).
  15. Khosravi, S.; Bui, H.T.D.; Herault, M.; Fournier, V.; Kim, K.; Lee, B.; Kim, K.W.; Lee, K. Supple mentation of protein hydrolysates to a low-fishmeal diet improves growth and health status of juvenile olive flounder, Paralichthys olivaceus. J. World Aquac. Soc. 2018, 49, 897–911. [Google Scholar] [CrossRef]
  16. Deng, J.; Mai, K.; Ai, Q.; Zhang, W.; Wang, X.; Xu, W.; Liufu, Z. Effects of replacing fish meal with soy protein concentrate on feed intake and growth of juvenile Japanese flounder, Paralichthys olivaceus. Aquaculture 2006, 258, 503–513. [Google Scholar] [CrossRef]
  17. Jeong, H.S.; Choi, D.G.; Lee, K.W.; Cho, S.H.; Lim, S.G.; Lee, B.J.; Hur, S.W.; Son, M.H.; Lee, S.H.; Kim, K.W. Attractiveness of various crude feed ingredients to juvenile olive flounder (Paralichthys olivaceus, Temminck & Schlegel) and its application to aquaculture. Aquac. Res. 2020, 51, 4517–4532. [Google Scholar] [CrossRef]
  18. Kim, J.; Baek, S.I.; Cho, S.H.; Kim, T.H. Evaluating the efficacy of partially substituting fish meal with unfermented tuna by-product meal in diets on the growth, feed utilization, chemical composition and non-specific immune responses of olive flounder (Paralichthys olivaceus). Aquac. Rep. 2022, 24, 101150. [Google Scholar] [CrossRef]
  19. Li, P.Y.; Wang, J.Y.; Song, Z.D.; Zhang, L.M.; Zhang, H.; Li, X.X.; Pan, Q. Evaluation of soy protein concentrate as a substitute for fishmeal in diets for juvenile starry flounder (Platichthys stellatus). Aquaculture 2015, 448, 578–585. [Google Scholar] [CrossRef]
  20. Chen, Z.; Ibrahim, U.B.; Yu, A.; Wang, L.; Wang, Y. Dried porcine soluble benefits to increase fish meal replacement with soy protein concentrate in large yellow croaker Larimichthys crocea diet. J. World Aquac. Soc. 2022, 54, 1162–1178. [Google Scholar] [CrossRef]
  21. Médale, F.; Boujard, T.; Vallée, F.; Blanc, D.; Mambrini, M.; Roem, A.; Kaushik, S.J. Voluntary feed intake, nitrogen and phosphorus losses in rainbow trout (Oncorhynchus mykiss) fed increasing dietary levels of soy protein concentrate. Aquat. Living Resour. 1998, 11, 239–246. [Google Scholar] [CrossRef]
  22. Peisker, M. Manufacturing of soyprotein concentrate foranimal nutrition. In Feed Manufacturing in the Mediterranean Region. Improving Safety: From Feed to Food; Cahiers Options Méditerranéennes; n. 54; CIHEAM Zaragoza: Zaragoza, Spain, 2001; pp. 103–107. Available online: https://om.ciheam.org/article.php?IDPDF=1600017 (accessed on 15 October 2021).
  23. Freitas, L.E.L.; Nunes, A.J.P.; do Carmo Sá, M.V. Growth and feeding responses of the mutton snapper, Lutjanus analis (Cuvier 1828), fed on diets with soy protein concentrate in replacement of Anchovy fish meal. Aquac. Res. 2011, 42, 866–877. [Google Scholar] [CrossRef]
  24. Ngandzali, B.O.; Zhou, F.; Xiong, W.; Shao, Q.J.; Hu, J.Z. Effect of dietary replacement of fish meal by soybean protein concentrate on growth performance and phosphorus discharging of juvenile black sea bream, Acanthopagrus schlegelii. Aquac. Nutr. 2011, 17, 526–535. [Google Scholar] [CrossRef]
  25. Park, S.; Seo, B.S.; Park, H.S.; Lee, B.; Hur, S.; Nam, T.; Lee, K.; Lee, S.; Choi, Y.H. Effect of fishmeal content in the diet on the growth and sexual maturation of olive flounder (Paralichthys olivaceus) at a typical fish farm. Animals 2021, 11, 2055. [Google Scholar] [CrossRef] [PubMed]
  26. Saleh, N.E.; Mourad, M.M.; El-Banna, S.G.; Abdel-Tawwab, M. Soybean protein concentrate as a fishmeal replacer in weaning diets for common sole (Solea solea) post-larvae: Effects on the growth, biochemical and oxidative stress biomarkers, and histopathological investigations. Aquaculture 2021, 544, 737080. [Google Scholar] [CrossRef]
  27. Nyina-wamwiza, L.; Defreyne, P.S.; Ngendahayo, L.; Milla, S.; Mandiki, S.N.M.; Kestemont, P. Effects of partial or total fish meal replacement by agricultural by-product diets on gonad maturation, sex steroids and vitellogenin dynamics of African catfish (Clarias gariepinus). Fish Physiol. Biochem. 2012, 38, 1287–1298. [Google Scholar] [CrossRef]
  28. Mateos, J.; Mananos, E.; Carrillo, M.; Zanuy, S. Regulation of follicle-stimulating hormone (FSH) and luteinizing hormone (LH) gene expression by gonadotropin-releasing hormone (GnRH) and sexual steroids in the Mediterranean Sea bass. Comp. Biochem. Physiol. Part B Biochem. Mol. Biol. 2002, 132, 75–86. [Google Scholar] [CrossRef] [PubMed]
  29. Mommsen, T.P.; Walsh, P.J. 5 Vitellogenesis and oocyte assembly. Fish Physiol. 1988, 11, 347–406. [Google Scholar] [CrossRef]
  30. Kim, K.W.; Wang, X.J.; Bai, S.C. Optimum dietary protein level for maximum growth of juvenile olive flounder Paralichthys olivaceus (Temminck et Schlegel). Aquac. Res. 2002, 33, 673–679. [Google Scholar] [CrossRef]
  31. Garling, D.L.; Wilson, R.P. Optimum dietary protein to energy ratios for channel catfish fingerlings, Ictalurus punctatus. J. Nutr. 1976, 106, 1368–1375. [Google Scholar] [CrossRef] [PubMed]
  32. AOAC. Official Methods of Analysis, 15th ed.; Association of Official Analytical Chemists Inc.: Rockville, MD, USA, 1990. [Google Scholar]
  33. Duncan, D.B. Multiple range and multiple F test. Biometrics 1955, 11, 1–42. [Google Scholar] [CrossRef]
  34. Alam, M.S.; Teshima, S.; Koshio, S.; Ishikawa, M. Arginine requirement of juvenile Japanese flounder Paralichthys olivaceus estimated by growth and biochemical parameters. Aquaculture 2002, 205, 127–140. [Google Scholar] [CrossRef]
  35. Forster, I.; Ogata, H.Y. Lysine requirement of juvenile japanese flounder Paralichthys olivaeus and juvenile red sea bream Pagrus major. Aquaculture 1998, 161, 131–142. [Google Scholar] [CrossRef]
  36. Alam, M.S.; Teshima, S.; Ishikawa, M.; Koshio, S. Methionine requirement of juvenile Japanese flounder Paralichthys olivaceus. J. World Aquac. Soc. 2000, 31, 618–626. [Google Scholar] [CrossRef]
  37. Kim, M.; Shin, J.; Lee, C.; Lee, B.; Hur, S.W.; Lim, S.; Lee, K. Evaluation of a mixture of plant protein source as a partial fish meal replacement in diets for juvenile olive flounder Paralichthys olivaceus. Korean J. Fish. Aquat. Sci. 2019, 52, 374–381. [Google Scholar] [CrossRef]
  38. Zehra, S.; Khan, M.A. Total sulphur amino acid requirement and maximum cysteine replacement value for methionine for fingerling Catla catla (Hamilton). Aquac. Res. 2016, 47, 304–317. [Google Scholar] [CrossRef]
  39. Farhat; Khan, M.A. Total sulfur amino acid requirement and cystine replacement value for fingerling stinging catfish, Heteropneustes fossilis (Bloch). Aquaculture 2014, 426, 270–281. [Google Scholar] [CrossRef]
  40. Baek, S.I.; Jeong, H.S.; Cho, S.H. Replacement effect of fish meal by plant protein sources in olive flounder (Paralichthys olivaceus) feeds with an addition of jack mackerel meal on growth, feed availability, and biochemical composition. Aquac. Nutr. 2023, 2023, 7965258. [Google Scholar] [CrossRef] [PubMed]
  41. Choi, J.; Aminikhoei, Z.; Kim, K.; Lee, S. Growth and fatty acid composition of juvenile olive flounder Paralichthys olivaceus fed diets containing different levels and ratios of eicosapentaenoic acid and docosahexaenoic acid. Fish. Aquat. Sci. 2014, 17, 95–103. [Google Scholar] [CrossRef]
  42. Takagi, S.; Shimeno, S.; Hosokawa, H.; Ukawa, M. Effect of lysine and methionine supplementation to a soy protein concentrate diet for red sea bream Pagrus major. Fish. Sci. 2001, 67, 1088–1096. [Google Scholar] [CrossRef]
  43. Fernandez-Palacios, H.; Izquierdo, M.S.; Robaina, L.; Valencia, A.; Salhi, M.; Vergara, J.M. Effect of n-3 HUFA level in broodstock diets on egg quality of gilthead seabream (Sparus aurata L.). Aquaculture 1995, 132, 325–337. [Google Scholar] [CrossRef]
  44. Johnson, R.B. Lipid deposition in oocytes of teleost fish during secondary oocyte growth. Rev. Fish. Sci. 2009, 17, 78–89. [Google Scholar] [CrossRef]
  45. Norrgård, J.R.; Bergman, E.; Greenberg, L.A.; Schmitz, M. Effects of feed quality and quantity on growth, early maturation and smolt development in hatchery-reared landlocked Atlantic salmon Salmo salar. J. Fish Biol. 2014, 85, 1192–1210. [Google Scholar] [CrossRef]
  46. Rowe, D.K.; Thorpe, J.E.; Shanks, A.M. Role of fat stores in the maturation of male Atlantic salmon (Salmo salar) parr. Can. J. Fish. Aquat. Sci. 1991, 48, 405–413. [Google Scholar] [CrossRef]
  47. de Francesco, M.; Parisi, G.; Médale, F.; Lupi, P.; Kaushik, S.J.; Poli, B.M. Effect of long-term feeding with a plant protein mixture based diet on growth and body/fillet quality traits of large rainbow trout (Oncorhynchus mykiss). Aquaculture 2004, 236, 413–429. [Google Scholar] [CrossRef]
  48. Furuita, H.; Tanaka, H.; Yamamoto, T.; Suzuki, N.; Takeuchi, T. Effects of high levels of n–3 HUFA in broodstock diet on egg quality and egg fatty acid composition of Japanese flounder, Paralichthys olivaeus. Aquaculture 2002, 210, 323–333. [Google Scholar] [CrossRef]
  49. Li, R.; Cho, S.H.; Kim, T. Effect of replacing dietary fish meal protein with combined animal meals on the growth performance of olive flounder (Paralichthys olivaceus). Aquac. Rep. 2023, 32, 101712. [Google Scholar] [CrossRef]
  50. Niu, K.; Khosravi, S.; Kothari, D.; Lee, W.; Lim, J.; Lee, B.; Kim, K.; Lim, S.; Lee, S.; Kim, S. Effects of dietary multi-strain probiotics supplementation in a low fishmeal diet on growth performance, nutrient utilization, proximate composition, immune parameters, and gut microbiota of juvenile olive flounder (Paralichthys olivaceus). Fish Shellfish Immunol. 2019, 93, 258–268. [Google Scholar] [CrossRef] [PubMed]
  51. Falcón, J.; Migaud, H.; Muñoz-Cueto, J.A.; Carrillo, M. Current knowledge on the melatonin system in teleost fish. Gen. Comp. Endocrinol. 2010, 165, 465–482. [Google Scholar] [CrossRef] [PubMed]
  52. Yones, A.M.; Metwalli, A.A.; Al-Jilany, S.S.A. Effect of artificial diets on growth performance body composition and gonad maturation of mullet (Lizq ramada). Int. J. Fish. Aquac. Res. 2016, 2, 28–49. [Google Scholar]
  53. Kim, H.C.; Lee, C.H.; Hur, S.P.; Kim, B.H.; Park, J.Y.; Lee, Y.D. Possible involvement of photoperiodic regulation in reproductive endocrine system of female olive flounder Paralichthys olivaceus. Dev. Reprod. 2015, 19, 11–17. [Google Scholar] [CrossRef] [PubMed]
  54. Kim, B.; Lee, C.; Hur, S.; Hur, S.; Kim, D.; Suh, H.; Kim, S.; Lee, Y. Long photoperiod affects gonadal development in olive flounder Paralichthys olivaceus. Dev. Reprod. 2013, 17, 241–246. [Google Scholar] [CrossRef] [PubMed]
  55. Very, N.M.; Sheridan, M.A. The role of somatostatins in the regulation of growth in fish. Fish Physiol. Biochem. 2002, 27, 217–226. [Google Scholar] [CrossRef]
  56. Paterni, I.; Granchi, C.; Katzenellenbogen, J.A.; Minutolo, F. Estrogen receptors alpha (ERα) and beta (ERβ): Subtype-selective ligands and clinical potential. Steroids 2014, 90, 13–29. [Google Scholar] [CrossRef]
  57. Du, J.; Lee, Y.; Yueh, W.; Chang, C. Seasonal profiles of brain and pituitary gonadotropin-releasing hormone and plasma luteinizing hormone in relation to sex change of protandrous black porgy, Acanthopagrus schlegeli. Biol. Reprod. 2005, 72, 922–931. [Google Scholar] [CrossRef] [PubMed]
  58. Shearer, K.D.; Swanson, P. The effect of whole body lipid on early sexual maturation of 1 + age male chinook salmon (Oncorhynchus tshawytscha). Aquaculture 2000, 190, 343–367. [Google Scholar] [CrossRef]
  59. Xue, R.; Wang, X.; Xu, S.; Liu, Y.; Feng, C.; Zhao, C.; Liu, Q.; Li, J. Expression profile and localization of vitellogenin mRNA and protein during ovarian development in turbot (Scophthalmus maximus). Comp. Biochem. Physiol. Part B Biochem. Mol. Biol. 2018, 226, 53–63. [Google Scholar] [CrossRef] [PubMed]
  60. Nagler, J.J.; Cavileer, T.D.; Verducci, J.S.; Schultz, I.R.; Hook, S.E.; Hayton, W.L. Estrogen receptor mRNA expression patterns in the liver and ovary of female rainbow trout over a complete reproductive cycle. Gen. Comp. Endocrinol. 2012, 178, 556–561. [Google Scholar] [CrossRef] [PubMed]
  61. Dabrowski, K.; Poczyczynski, P.; Kock, G.; Berger, B. Effect of partially or totally replacing fish meal protein by soybean meal protein on growth, food utilization and proteolytic enzyme activities in rainbow trout (Salmo gairdneri). New in vivo test for exocrine pancreatic secretion. Aquaculture 1989, 77, 29–49. [Google Scholar] [CrossRef]
  62. Chen, Y.; Liu, W.; Ma, J.; Wang, Y.; Huang, H. Comprehensive physiological and transcriptomic analysis revealing the responses of hybrid grouper (Epinephelus fuscoguttatus♀ × E. lanceolatus♂) to the replacement of fish meal with soy protein concentrate. Fish Physiol. Biochem. 2020, 46, 2037–2053. [Google Scholar] [CrossRef] [PubMed]
  63. Adewumi, A.A. The growth and gonadal maturation of the African catfish, Clarias gariepinus (Burchell) broodstock fed differently heated soybean-based diets. Aquac. Nutr. 2006, 12, 267–274. [Google Scholar] [CrossRef]
  64. Fontaínhas-fernandes, A.; Monteiro, M.; Figuiredo, A.; Gomes, E.; Coimbra, J.; Reis-henriques, M.A. Partial or total replacement of fish meal by plant protein affects gonadal development and plasma 17β-estradiol levels in female Nile tilapia. Aquac. Int. 2000, 8, 299–313. [Google Scholar] [CrossRef]
Figure 1. Hematoxylin and eosin-stained gonads of male olive flounder fed the experimental diets. (BV, blood vessel; C, cyst; SC, spermatocyte; SG, spermatogonium; SL, seminal lobule; S, sperm; SM, spermatid. Scale bars = 20 µm).
Fishes 09 00521 g001
Figure 2. Hematoxylin and eosin-stained gonads of male olive flounder fed the experimental diets. (C, cyst; SC, spermatocyte; SG, spermatogonium; SL, seminal lobule; S, sperm; SM, spermatid. Magnification = (a) 100×, (b) 400×. Scale bars = (a) 50 µm, (b) 20 µm).
Fishes 09 00521 g002
Figure 3. Hematoxylin and eosin-stained gonads of male olive flounder fed the experimental diets. (FC, follicular cell; NC, nucleus; NO, nucleolus; OC, oocyte; OD, oil droplet; OL, ovarian lumen; YG, yolk globule. Scale bars = 50 µm).
Fishes 09 00521 g003
Figure 4. Expression of growth-related genes in the brain of olive flounder (GH: p < 0.00; IGF: p < 0.00). GH, growth hormone; IGF, insulin-like growth factor.
Fishes 09 00521 g004
Figure 5. Expression of sex maturation-related genes in the brain of olive flounder (FSH: p < 0.03; LH: p < 0.00). FSH, follicle-stimulating hormone; LH, luteinizing hormone.
Fishes 09 00521 g005
Figure 6. Expression of estrogen receptor genes in the brain and gonad of olive flounder [{(A), ERα: p < 0.00; ERβ: p > 0.07}, {(B), ERα: p > 0.29; ERβ: p < 0.03}]. (A) Gene expression in the brain. (B) Gene expression in the gonad. ERα, estrogen receptor α; ERβ, estrogen receptor β.
Fishes 09 00521 g006
Figure 7. Vitellogenin gene expression in the gonad and liver of olive flounder (gonad: p < 0.00; liver: p < 0.00). (A) Gene expression in the gonad. (B) Gene expression in the liver. VIT, vitellogenin.
Fishes 09 00521 g007
Figure 8. Expression of digestive enzyme-related genes in the middle intestine of olive flounder (amylase: p > 0.30; chymotrypsin2: p < 0.00; trypsin2: p < 0.00; trypsin3: p < 0.00; lipase: p < 0.00).
Fishes 09 00521 g008
Table 1. Ingredient and proximate compositions of the experimental diets (%, DM basis).
Experimental Diet
ConLF1LF2
Ingredient (%, DM)
Low-temperature fishmeal (LT FM) a60.0045.0030.00
Soy protein concentrate (SPC) b 9.0018.00
Wheat gluten9.5014.2519.00
Wheat flour15.5015.5015.5
Starch5.603.932.26
Fish oil4.906.257.60
Monocalcium phosphate (MCP) c 1.052.10
Vitamin C0.500.500.50
Mineral premix d2.002.002.00
Vitamin premix e1.001.001.00
Betaine0.500.500.50
Choline0.500.500.50
Lysine (99%) 0.380.75
Methionine (99%) 0.150.29
Nutrients (%, DM)
Dry matter96.3396.7596.33
Crude protein53.8553.0552.76
Crude lipid9.259.5110.59
Ash13.2512.6910.83
Carbohydrate f23.5024.7025.80
Gross energy (GE) (kcal/g) g3.933.974.10
a Low-temperature fishmeal (LT FM) (crude protein: 72.0%, crude lipid: 12.0%, ash: 11.0%) was purchased from FF Skagen (Havnevagtvej, Skagen, Denmark) [USD 1.75/kg FM; 1 USD = 1300 KRW]. b Soy protein concentrate (SPC) (crude protein: 67.2%, crude lipid: 1.0%, ash: 6.3%) was purchased from ADM (Quincy, IL, USA) (USD 1.05/kg SPC). c Monocalcium phosphate (MCP) was purchased from Kunmin Chuan Jin Nuo Chemical Co., Ltd. (Kunming, Yunnan, China). d Mineral premix (g/kg mix): NaCl, 43.3; MgSO4·7H2, 136.5; NaH2 PO4·2H2O, 86.9; KH2PO4, 239; CaHPO4, 135.3; ferric citrate, 29.6; ZnSO4·7H2O, 21.9; Ca-lactate, 304; CuCl, 0.2; AlC3·6H2O, 0.15; KI, 0.15; MnSO4·H2O, 2.0; CoCl2·6H2O, 1.0. e Vitamin premix (g/kg mix): L-ascorbic acid, 121.2; DL-α-tocopherol acetate, 18.8; thiamine hydrochloride, 2.7; riboflavin, 9.1; pyridoxine hydrochloride, 1.8; niacin, 36.4; Ca-D-pantothenate, 12.7; myo-inositol, 181.8; D-biotin, 0.27; folic acid, 0.68; p-aminobenzoic acid, 18.2; menadione, 1.8; retinyl acetate, 0.73; cholecalciferol, 0.003. f Carbohydrate was calculated by the difference [100 − (crude protein + crude lipid + ash)]. g Gross energy (GE) (kcal/g) was calculated by the difference [100 − (crude protein + crude lipid + ash)] and 4 kcal/g for crude protein and carbohydrate, and 9 kcal/g for lipid [31].
Table 2. Oligonucleotide primers used for quantitative real-time PCR.
TargetSequence (5′-3′)GenBank
GHF.P = 5′-GGAGGATCAACGTCTTCTCAA-3′D29737.1
R.P = 5′-ACTGCGGCTGTTACTTATTCA-3′
IGFF.P = 5′-CGGCGCCTGGAGATGTACTG-3′AF016922.2
R.P = 5′-TGTCCTACGCTCTGTGCCCT-3′
FSHF.P = 5′-AGCTTCGACTGTCGTCCAAC-3′AB042422.1
R.P = 5′-TGTTTAGCCGGACCTGTTTC-3′
LHF.P = 5′-CCGACGTGTCTTCTCATCAA-3′AB042423.1
R.P = 5′-TGTTGAGGAAGGGGATCTTG-3′
VITF.P = 5′-TGAGCTCTTTGAGTACAGCG-3′AB200267.1
R.P = 5′-TCCTCTCTGGATGTTCAGCA-3′
ERαF.P = 5′-ATGCTGGAGACTATCACTGACG-3′AB070629.1
R.P = 5′-TGTCTGATGTGGGAGAGCAG-3′
ERβF.P = 5′-ACCATCCAGGGAAACTCATC-3′AB070630.1
R.P = 5′-GGCACATGTTGGAGTTTAGG-3′
Trypsin2F.P = 5′-ATCGTCGGAGGGTATGAGTG-3′AB029751
R.P = 5′-CATCCAGAGACTGTGCACATG-3′
Trypsin3F.P = 5′-TATGAGTGCACGCCCTACTC-3′AB029752
R.P = 5′-GTTCTCACAGTCCCTCTCAGAC-3′
Chymotrypsin2F.P = 5′-ACTACACCGGCTTCCACTTC-3′AB029754
R.P = 5′-GAACACCTTGCCAACCTTCATG-3′
LipaseF.P = 5′-ATGGGAGAAGAAAATATCTTATTTTTGA-3′HQ850701
R.P = 5′-TACCGTCCAGCCATGTATCAC-3′
AmylaseF.P = 5′-CACTCTTCATGTGGAAGCTGGTTC-3′KJ908179
R.P = 5′-CCATAGTTCTCAATGTTGCCACTGC-3′
18SF.P = 5′-ATGGCCGTTCTTAGTTGGTG-3′EF126037.1
R.P = 5′-CACACGTGATCCAGTCAGT -3′
The amplification efficiency of nearly 99% was demonstrated as a result of triplicate real-time PCR analysis. ERα, estrogen receptor α; ERβ, estrogen receptor β; FSH, follicle-stimulating hormone; GH, growth hormone; IGF, insulin-like growth factor; LH, luteinizing hormone; VIT, vitellogenin.
Table 3. Amino acid profiles of the experimental diets (% of diet).
Experimental Diet
FMSPCRequirementConLF1LF2
Essential amino acid (EAA) (%)
Arginine3.664.552.04–2.10 a2.942.722.63
Histidine1.341.64 0.961.151.21
Isoleucine2.893.11 2.232.162.10
Leucine4.745.03 3.943.753.63
Lysine5.074.131.50–2.10 b3.633.363.24
Methionine1.770.671.44–1.49 c1.371.231.17
Phenylalanine2.533.21 2.262.282.32
Threonine2.582.49 2.171.921.77
Valine3.383.19 2.672.452.35
∑EAA d27.9628.02 22.1721.0220.42
Nonessential amino acid (NEAA) (%)
Alanine4.012.71 3.172.662.30
Aspartic acid5.907.26 4.484.083.85
Cysteine0.350.590.06 c0.610.300.28
Glutamic acid8.9612.78 9.7611.1411.93
Glycine4.292.76 3.352.822.44
Proline2.183.31 3.093.553.93
Serine2.263.17 2.262.212.19
Tyrosine1.771.93 1.561.481.46
∑NEAA e33.1538.45 28.2828.2428.38
a Arginine, b lysine, and c methionine were obtained from [33,34,35], respectively. d ∑EAA: Total content of essential amino acids. e ∑NEAA: Total content of nonessential amino acids.
Table 4. Fatty acid profiles of the experimental diets (% of total fatty acids).
Experimental Diet
FMSPCConLF1LF2
C14:05.93 3.483.192.62
C16:024.19 20.5120.2918.71
C18:04.91 19.7722.2624.76
C20:01.53
C22:01.94
∑SFA a38.49 43.7645.7446.09
C17:1n-7 4.864.654.29
C18:1n-9 2.852.802.70
C24:1n-91.52
∑MUFA b1.52 7.717.456.99
C18:2n-611.86 17.8321.0326.04
C18:3n-6 2.933.133.52
C20:2n-63.79
C20:3n-6 1.81
C20:4n-64.42
C20:5n-312.06
C22:2n-60.09 6.846.504.97
C22:6n-316.95 11.7810.837.78
∑n-3 HUFA c33.43 11.7810.837.78
Unknown13.97 7.345.324.61
a ∑SFA: Total content of saturated fatty acids. b ∑MUFA: Total content of monounsaturated fatty acids. c ∑n-3 HUFA: Total content of n-3 highly unsaturated fatty acids.
Table 5. Survival, weight gain, and specific growth rate of olive flounder fed the experimental diets for 4 and 12 months.
Experimental DietInitial Weight (g/Fish)Final Weight (g/Fish)Survival (%)Weight Gain (g/Fish)SGR (%/Day) a
4th monthCon721.40 ± 6.951102.03 ± 28.8096.3 ± 1.79380.63 ± 24.950.31 ± 0.02
LF1729.40 ± 5.631104.75 ± 90.1094.7 ± 4.09375.30 ± 86.240.34 ± 0.05
LF2732.50 ± 3.611117.80 ± 24.4796.3 ± 2.49385.30 ± 24.290.31 ± 0.02
p-value>0.90>0.89<0.05>0.90>0.05
12th monthCon721.40 ± 6.951995.02 ± 67.4889.67 ± 1.251240.32 ± 53.430.31 ± 0.07
LF1729.40 ± 5.631923.73 ± 44.4290.33 ± 0.471176.60 ± 35.580.30 ± 0.07
LF2732.50 ± 3.611917.27 ± 87.6091.33 ± 0.941171.89 ± 73.810.30 ± 0.07
p-value>0.90>0.05>0.62>0.87>0.05
a Specific growth rate (SGR, %/day) = (Ln final weight of fish − Ln initial weight of fish) × 100/days of feeding trial.
Table 6. Daily feed intake (DFI), feed efficiency (FE), protein efficiency ratio (PER), protein retention (PR), condition factor (CF), viscerosomatic index (VSI), hepatosomatic index (HSI), and gonadosomatic index (GSI) of olive flounder fed the experimental diets for 4 and 12 months.
Experimental DietDFI (%/Day) aFE bPER cPR (%) dCF (g/cm3) eVSI (%) fHSI (%) gGSI (%) h
MaleFemale
4th monthCon0.48 ± 0.020.63 ± 0.021.16 ± 0.0537.36 ± 1.511.04 ± 0.253.99 ± 0.571.47 ± 0.280.17 ± 0.031.27 ± 0.06
LF10.46 ± 0.000.70 ± 0.071.32 ± 0.1442.62 ± 3.701.16 ± 0.283.59 ± 0.261.57 ± 0.340.15 ± 0.021.09 ± 0.03
LF20.45 ± 0.010.69 ± 0.021.30 ± 0.0442.90 ± 1.261.04 ± 0.083.45 ± 0.361.44 ± 0.150.17 ± 0.021.26 ± 0.11
p-value>0.05>0.05>0.50>0.90>0.60>0.80>0.90>0.90>0.50
12th monthCon0.46 ± 0.010.64 ± 0.011.07 ± 0.1128.31 ± 2.32 b1.23 ± 0.156.16 ± 0.752.10 ± 0.372.35 ± 0.40 a5.54 ± 0.96 a
LF10.43 ± 0.030.66 ± 0.001.07 ± 0.2529.18 ± 4.97 ab1.21 ± 0.106.16 ± 1.912.20 ± 0.950.74 ± 0.05 b4.23 ± 0.84 b
LF20.44 ± 0.020.66 ± 0.031.23 ± 0.0232.89 ± 0.78 a1.20 ± 0.105.78 ± 1.221.98 ± 0.591.17 ± 0.58 b2.67 ± 0.56 c
p-value>0.50>0.05>0.30<0.04>0.60>0.06>0.30<0.00<0.00
Values (mean ± SE, n = 3) in the same column sharing the same superscript letter are not significantly different (p < 0.05). a Daily feed intake (DFI, %/day) = feed consumption × 100/(initial fish weight + final fish weight + dead fish weight). b Feed efficiency (FE) = weight gain of fish/feed consumption. c Protein efficiency ratio (PER) = weight gain of fish/protein consumption. d Protein retention (PR, %) = protein gain of fish × 100/protein consumption. e Condition factor (CF, g/cm3) = body weight of fish (g) × 100/total length of fish (cm)3. f Viscerosomatic index (VSI, %) = viscera weight of fish × 100/body weight of fish. g Hepatosomatic index (HSI, %) = liver weight of fish × 100/body weight of fish. h Gonadosomatic index (GSI, %) = gonad weight × 100/body weight of fish.
Table 7. Proximate composition of the dorsal muscle of olive flounder fed the experimental diets for 12 months (%, wet weight).
Experimental DietMoistureCrude ProteinCrude LipidAsh
4th monthCon72.87 ± 0.0222.44 ± 0.242.37 ± 0.40 b1.57 ± 0.01
LF172.69 ± 0.3322.26 ± 0.502.61 ± 0.03 b1.55 ± 0.03
LF271.95 ± 0.0921.91 ± 0.054.44 ± 0.15 a1.50 ± 0.01
p-value>0.11>0.44<0.04>0.32
12th monthCon73.52 ± 0.3023.07 ± 0.260.83 ± 0.12 b1.52 ± 0.02
LF173.42 ± 0.4923.44 ± 0.410.59 ± 0.09 c1.50 ± 0.03
LF273.46 ± 0.3823.41 ± 0.271.08 ± 0.04 a1.41 ± 0.02
p-value>0.52>0.63<0.04>0.32
Values (mean ± SE, n = 3) in the same column sharing the same superscript letter are not significantly different (p < 0.05). a Specific growth rate (SGR, %/day) = (Ln final weight of fish − Ln initial weight of fish) × 100/days of feeding trial.
Table 8. Amino acid compositions of the dorsal muscle of olive flounder fed the experimental diets for 12 months (% of dorsal muscle).
Experimental Dietp-Value
ConLF1LF2
Essential amino acid (EAA, %)
Arginine1.35 ± 0.011.35 ± 0.021.32 ± 0.01>0.42
Histidine0.57 ± 0.010.58 ± 0.010.57 ± 0.00>0.42
Isoleucine1.10 ± 0.001.10 ± 0.021.09 ± 0.01>0.90
Leucine1.89 ± 0.021.88 ± 0.031.86 ± 0.03>0.94
Lysine2.18 ± 0.012.17 ± 0.042.15 ± 0.03>0.83
Methionine0.57 ± 0.010.56 ± 0.020.56 ± 0.03>0.84
Phenylalanine0.94 ± 0.000.93 ± 0.020.92 ± 0.02>0.44
Threonine 1.07 ± 0.011.07 ± 0.021.05 ± 0.01>0.70
Valine1.31 ± 0.011.22 ± 0.021.20 ± 0.02>0.70
Nonessential amino acid (NEAA) (%)
Alanine1.36 ± 0.021.36 ± 0.001.35 ± 0.02>0.90
Aspartic acid2.36 ± 0.01 b2.36 ± 0.03 b2.39 ± 0.02 a<0.00
Cysteine0.21 ± 0.00 a0.17 ± 0.02 a0.07 ± 0.01 b<0.00
Glutamic acid3.47 ± 0.023.45 ± 0.043.38 ± 0.03>0.43
Glycine1.00 ± 0.051.04 ± 0.031.01 ± 0.01>0.63
Proline0.53 ± 0.03 b0.58 ± 0.02 ab0.62 ± 0.01 a<0.05
Serine0.98 ± 0.010.97 ± 0.010.95 ± 0.01>0.22
Tyrosine0.82 ± 0.000.82 ± 0.020.80 ± 0.01>0.63
Values (mean ± SE, n = 3) in the same row sharing the same superscript letter are not significantly different (p < 0.05).
Table 9. Fatty acid profiles of the dorsal muscle of olive flounder fed the experimental diets for 12 months (% of total fatty acids).
Experimental Dietp-Value
ConLF1LF2
C14:02.03 ± 0.201.68 ± 0.211.02 ± 0.72>0.44
C16:023.56 ± 0.0315.78 ± 0.9813.44 ± 0.76>0.43
C18:05.00 ± 0.034.93 ± 0.085.20 ± 0.48>0.44
∑SFA a30.59 ± 0.1722.39 ± 10.9620.55 ± 0.92>0.05
C16:1n-72.78 ± 0.342.28 ± 0.292.18 ± 0.05>0.40
C17:1n-70.50 ± 0.360.70 ± 0.030.53 ± 0.38>0.43
C18:1n-91.92 ± 0.111.72 ± 0.191.42 ± 0.15>0.39
C18:1n-912.63 ± 0.9812.04 ± 1.3713.77 ± 064>0.41
C24:1n-91.26 ± 1.170.65 ± 0.221.32 ± 1.17>0.41
∑MUFA b19.09 ± 2.0517.39 ± 1.6219.12 ± 1.69>0.10
C18:2n-610.82 ± 0.61 c13.11 ± 0.30 b15.82 ± 0.21 a<0.01
C18:3n-32.02 ± 0.171.97 ± 0.202.23 ± 0.09>0.40
C20:2n-60.31 ± 0.220.62 ± 0.030.43 ± 0.31>0.40
C20:3n-6 0.13 ± 0.18
C20:3n-30.34 ± 0.21
C20:5n-35.24 ± 0.09 a4.80 ± 0.18 b4.53 ± 0.23 c<0.01
C22:6n-325.04 ± 0.3 a24.10 ± 1.10 b21.72 ± 0.94 c<0.01
∑n-3 HUFA c30.50 ± 0.43 a29.56 ± 0.79 b21.72 ± 0.75 c<0.01
Unknown6.65 ± 2.307.65 ± 0.536.50 ± 1.91
a ∑SFA: total content of saturated fatty acids. b ∑MUFA: total content of monounsaturated fatty acids. c ∑n-3 HUFA: total content of n-3 highly unsaturated fatty acids. Values (mean ± SE, n = 3) in the same row sharing the same superscript letter are not significantly different (p < 0.05).
Disclaimer/Publisher’s Note: The statements, opinions and data contained in all publications are solely those of the individual author(s) and contributor(s) and not of MDPI and/or the editor(s). MDPI and/or the editor(s) disclaim responsibility for any injury to people or property resulting from any ideas, methods, instructions or products referred to in the content.

