
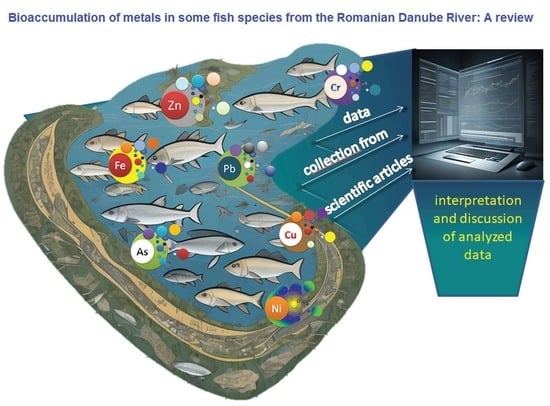
Bioaccumulation of Metals in Some Fish Species from the Romanian Danube River: A Review

 ,
,  , and
, and
Abstract
1. Introduction
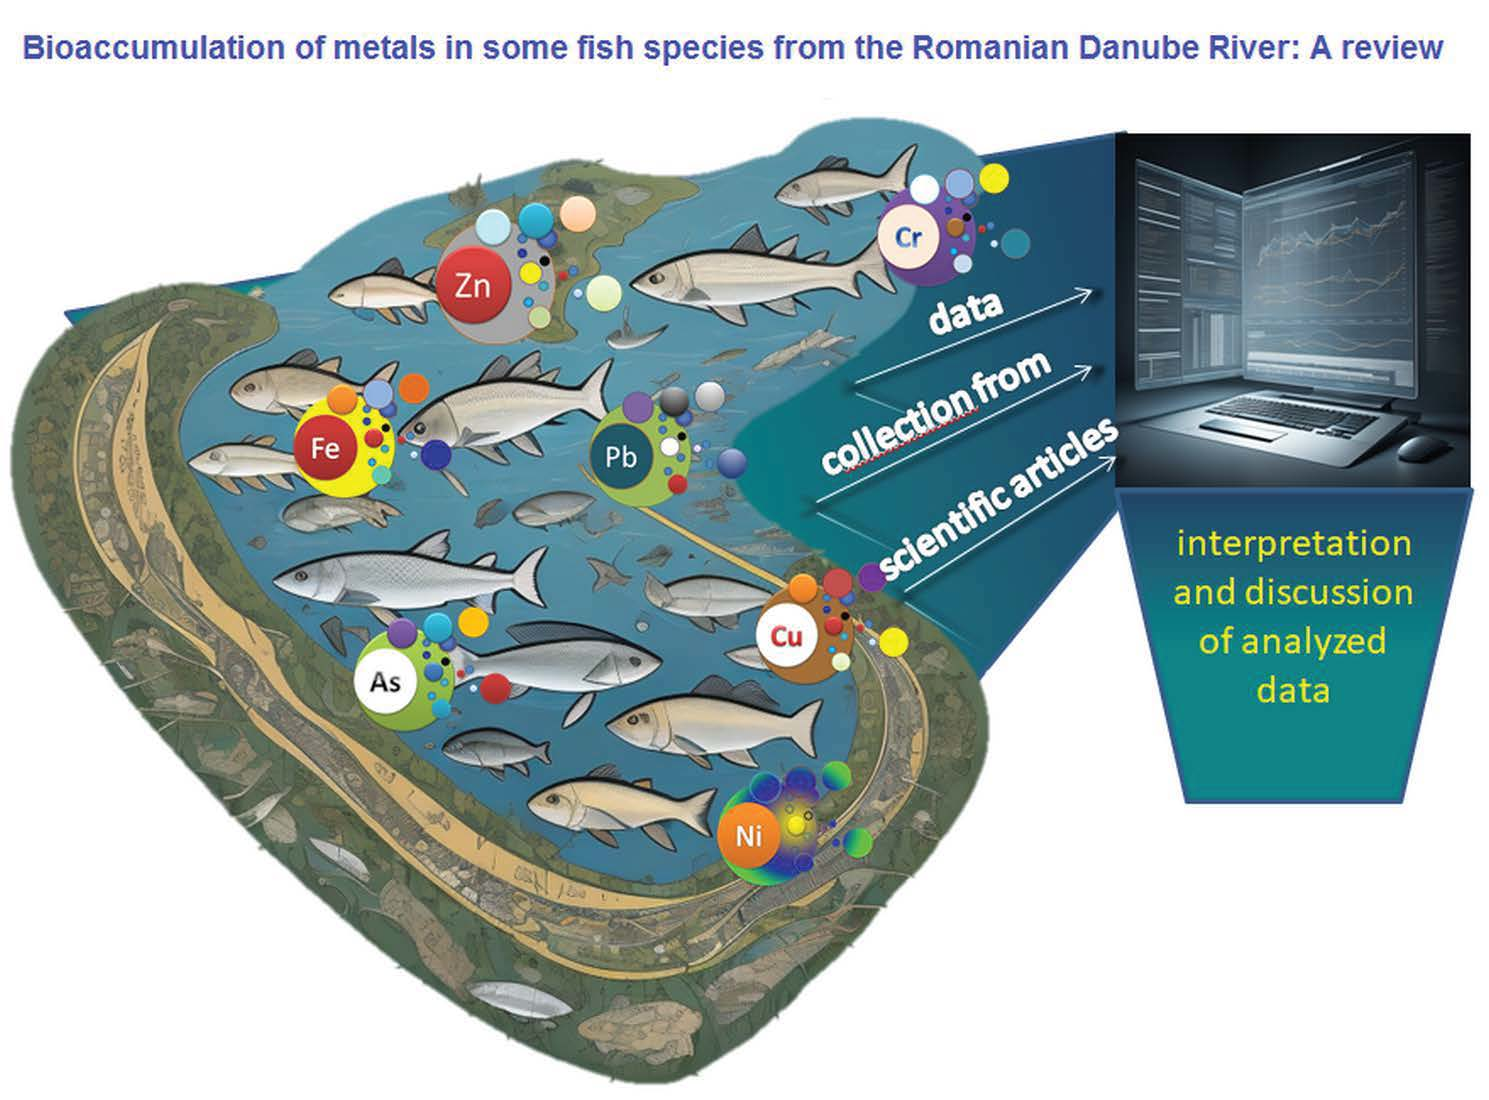
1.1. Effect of Metals on Fish due to Exposure
1.2. Effect of Metals on the Human Population
2. Materials and Methods
3. Results
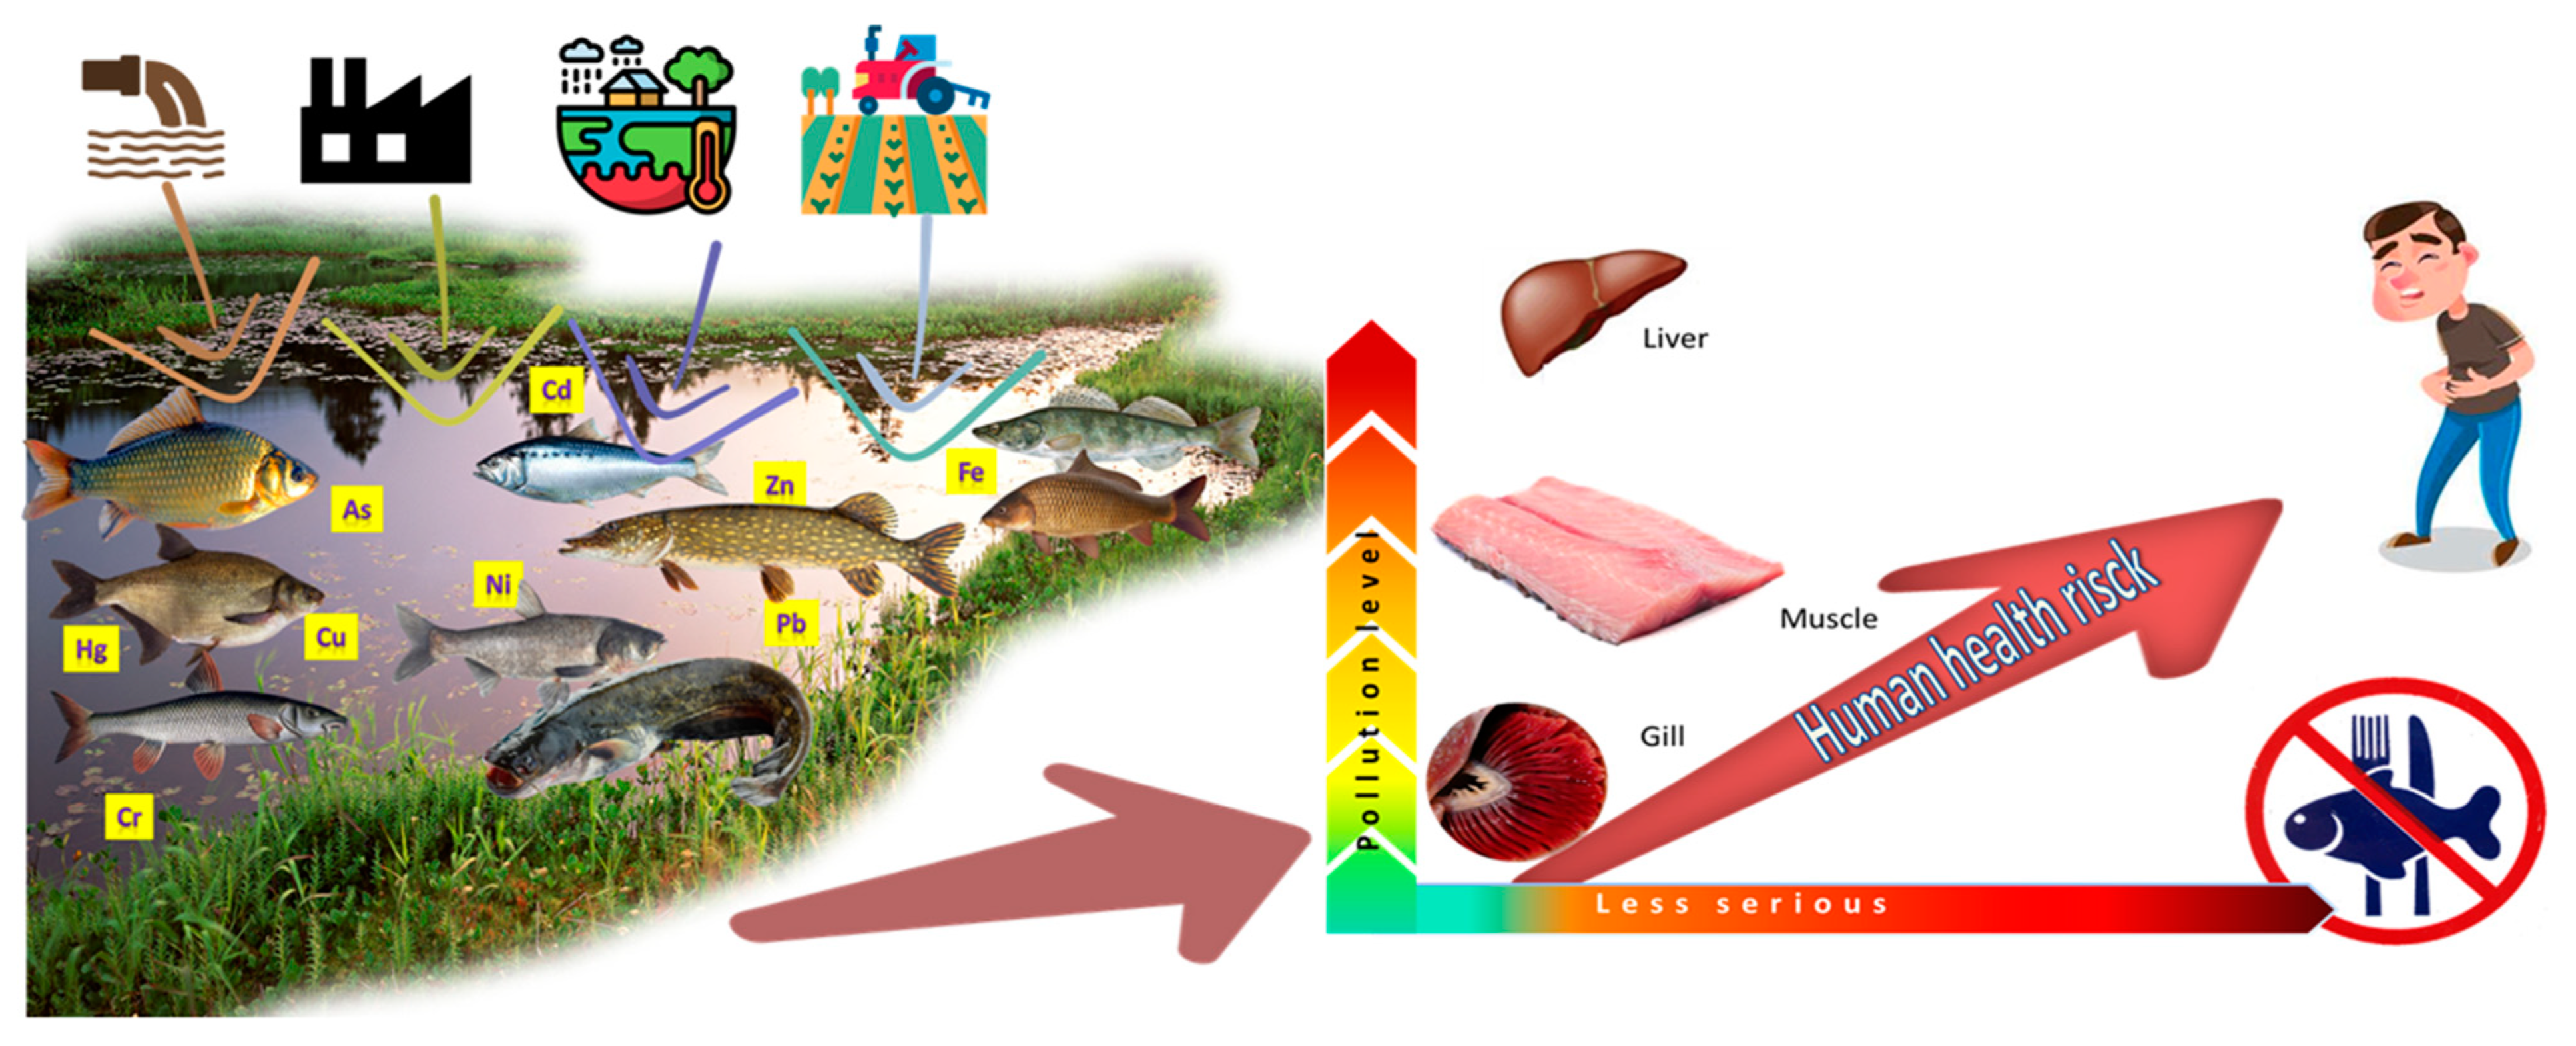
3.1. Sediments

| Years | As | Cd | Cr | Cu | Fe | Hg | Ni | Pb | Zn | Ref. | |
|---|---|---|---|---|---|---|---|---|---|---|---|
| Sector I | 2002 | 5.08 | 2.84 | 51.8 | 23.9 | - | 0.18 | 46.8 | - | - | [3] |
| 14.73 | 4.03 | 112.5 | 36.8 | - | 0.3 | 116.4 | - | - | |||
| 2012 | 8.9 | 0.61 | - | 35.95 | 16,104 | 0.69 | - | 32.58 | 139.4 | [66] | |
| 2013 | 13.89 | 1.69 | - | 50.93 | 17,530 | 0.8 | - | 64.92 | 270.4 | [68] | |
| Sector II | 2002 | 12.68 | 3.2 | 105.9 | 41 | - | 0.27 | 99.9 | 40.9 | 389.5 | [3] |
| 3.15 | 3.79 | 68 | 45.3 | - | 0.19 | 69.9 | 25.8 | 285.7 | |||
| 9.24 | 2.98 | 93.3 | 57.6 | - | 0.23 | 74.5 | 43.6 | 307.8 | |||
| 2020 | - | - | - | - | 15.36 | - | - | - | - | [71] | |
| 2022 | 17.8 | - | 183 | 56 | - | - | 97 | - | 328 | [69] | |
| Sector III | 2002 | 3.16 | 2.12 | 71.1 | 31.6 | - | 0.19 | 59.2 | 28 | 197.5 | [3] |
| 0.99 | 2.91 | 30.6 | 17.8 | - | <0.06 | 23.7 | 2.85 | 49.4 | |||
| 2020 | 7.3–8 | 1 | 60–96 | 12.9–29.4 | - | 0.04–0.005 | 38.6–21.4 | 15.3–17.9 | 59.2–59.7 | [70] | |
| 8.49–12.9 | 0.24–0.3 | 64–65.9 | 23.3–29.2 | - | 0.16–0.25 | 37.4–38.4 | 14.2–18.4 | 60–78.8 | |||
| - | 0.27–0.4 | 59.4–74.9 | 26.3–29.8 | - | 0.05–0.06 | 32.4–39 | - | - | |||
| Sector IV | 2011–2017 | - | 0.38 | 38.94 | 35.18 | - | - | 37.9 | 20.2 | 94.91 | [72] |
| - | - | 42.28 | 38.56 | - | - | 33.83 | - | 98.37 | [73] | ||
| - | - | 42.77 | 27.27 | - | - | 32.54 | - | 95.63 | |||
| - | - | 44.72 | 38.76 | - | - | 40.11 | - | 103.39 | |||
| - | - | 40.46 | 40.98 | - | - | 35.83 | - | 105.46 | |||
| - | - | 33.12 | 34.39 | - | - | 34.73 | - | 100.85 | |||
| - | - | 36.69 | 26.43 | - | - | 32.46 | - | 95.72 | |||
| - | - | 37.42 | 31.61 | - | - | 35.1 | - | 98.71 | |||
| - | - | 32.1 | 31.42 | - | - | 34.6 | - | 106.35 | |||
| - | - | 27.12 | 24.85 | - | - | 32.26 | - | 89.33 | |||
| - | - | 30.47 | 27.73 | - | - | 27.48 | - | 88.87 | |||
| - | - | 28.83 | 30.69 | - | - | 30.4 | - | 97.55 | |||
| - | - | 29.77 | 34.12 | - | - | 34.08 | - | 103.9 | |||
| - | - | 32.16 | 35.96 | - | - | 34.28 | - | 104.72 | |||
| - | - | 24.89 | 30.03 | - | - | 33.89 | - | 92.85 | |||
| - | - | 43.76 | 26.16 | - | - | 33.49 | - | 89.83 | |||
| - | - | 41.71 | 25.58 | - | - | 31.7 | - | 83.99 | |||
| - | 0.434 | 29.44 | 34.24 | - | - | 36.52 | 14.45 | 104.3 | [74] | ||
| - | 0.368 | 30.64 | 32.17 | - | - | 35.93 | 14.47 | 98.3 | |||
| - | 0.396 | 33.55 | 33.23 | - | - | 42.18 | 16.94 | 112 | |||
| - | 0.401 | 29.8 | 31.93 | - | - | 34.41 | 17.37 | 101 | |||
| 2018 | - | 0.3 | - | 4.3 | - | - | 16.03 | 5.9 | 58.84 | [50] | |
| 2019 | - | 0.59 | - | 10.31 | - | - | 20.17 | 6.02 | 78.69 | ||
| 2020 | 5.5–7.68 | - | 30–41.7 | 28.9–52.2 | - | 0.067–0.1 | 32.1–47.7 | 20.1–26.9 | 70.1–102 | [70] | |
| Sector V | 1950 | - | <0.5 | 50 | 38 | - | - | 56 | 36 | 90 | [75] |
| 1995–1997 | - | 0.5–10 | 18–101 | 2.0–51.0 | - | - | 6.0–78 | 5.0–68 | 6–119 | [76] | |
| 2003–2009 | - | <0.5–1.5 | 7.5–61.9 | 14.8–194 | - | - | 19–111 | 7.5–51.3 | 29.8–218 | [77] | |
| - | 0.115–1.9 | 20–124 | 3.5–94 | - | - | 11–72.0 | 1.0–73 | 17–202 | [76] | ||
| 2007–2012 | - | 6.12–8.26 | 88.1–134.2 | - | - | - | 54.6–79.1 | 7.16–13.99 | 164.2–204.7 | [78] | |
| - | 4.16–7.81 | 67.2–93.1 | - | - | - | 31.2–67.1 | 6.22–7.61 | 131.2–171.2 | |||
| - | 4.97–7.88 | 71.5–117.6 | - | - | - | 48.1–69.1 | 6.81–7.89 | 158.2–187.5 | |||
| - | 4.26–6.81 | 44.9–58.6 | - | - | - | 33.3–54.6 | 7.14–12.2 | 148.2–197.9 | |||
| - | 2.12–4.92 | 29.4–47.9 | - | - | - | 27.1–46 | 5.18–7.31 | 122.1–168.3 | |||
| - | 3.47–4.99 | 38.5–52.4 | - | - | - | 28.3–49.5 | 6.02–8.99 | 139.1–178.5 | |||
| 2012–2013 | - | BDL | 7.62–32.5 | 4.65–45.9 | - | - | 10.8–49.8 | 4.76–41.3 | 17.7–93.1 | [53] | |
| - | 0.59 | - | 10.72 | - | - | 29.12 | 8.96 | 118.54 | [50] | ||
| - | 0.74 | - | 17.39 | - | - | 27.88 | 12.57 | 120.76 | |||
| - | 0.5 | - | 12.58 | 22.31 | 8.49 | 87.43 | |||||
| - | 0.5 | - | 12.54 | - | - | 20.53 | 7.93 | 84.15 | |||
| - | 0.46 | - | 7.6 | - | - | 14 | 5.17 | 62.39 | |||
| - | 0.57 | - | 11.81 | - | - | 19.99 | 7.28 | 84.65 | |||
| - | 0.54 | - | 10.24 | - | - | 22.09 | 21.14 | 77.64 | |||
| - | 0.54 | - | 7.89 | - | - | 16.28 | 4.84 | 64.48 | |||
| - | 0.76 | - | 13.42 | - | - | 23.9 | 7.55 | 146.23 | |||
| - | 0.53 | - | 6.68 | - | - | 24.83 | 7.83 | 85.4 | |||
| - | 0.63 | - | 9.79 | - | - | 24.76 | 6.84 | 96.11 | |||
| - | 0.75 | - | 16.64 | - | - | 28.35 | 8.29 | 121.38 | |||
| - | 0.57 | - | 15.17 | - | - | 38.81 | 8.11 | 117.01 | |||
| - | 0.53 | - | 9.42 | - | - | 16.94 | 5.34 | 69.97 | |||
| 2019 | - | 0.65 | - | 11.65 | - | - | 19.33 | 6.05 | 84.21 | ||
| - | 0.99 | - | 25.01 | - | - | 35.8 | 13.78 | 177.33 | |||
| - | 0.63 | - | 8.97 | - | - | 16.04 | 6.41 | 73.57 | |||
| - | 0.57 | - | 10.08 | - | - | 24.58 | 5.7 | 95.67 | |||
| - | 0.41 | - | 7.55 | - | - | 19.09 | 4.17 | 71.27 | |||
| - | 0.46 | - | 7.47 | - | - | 17.65 | 5.68 | 63.21 | |||
| - | 0.78 | - | 19.47 | - | - | 28.49 | 10.35 | 131.5 | |||
| - | 0.46 | - | 9.29 | - | - | 17.4 | 4.31 | 66.06 | |||
| - | 0.65 | - | 17.18 | - | - | 27.41 | 8.33 | 121.05 | |||
| - | 0.72 | - | 27.5 | - | - | 50.46 | 14.64 | 161.24 | |||
| - | 0.77 | - | 20.75 | - | - | 32.55 | 9.87 | 146.53 | |||
| - | 0.82 | - | 23.29 | - | - | 39.03 | 9.9 | 154.34 | |||
| - | 0.48 | - | 9.29 | - | - | 25.85 | 6.76 | 81.26 | |||
| - | 0.52 | - | 10.07 | - | - | 28.13 | 8.01 | 86.43 |
3.2. Water
| Years | As | Cd | Cr | Cu | Fe | Hg | Ni | Pb | Zn | Ref. | |
|---|---|---|---|---|---|---|---|---|---|---|---|
| Sector I | 2012 | 0.004 | ND | - | 0.004 | 0.33 | ND | - | ND | 0.032 | [66] |
| 2013 | 0.006 | ND | - | 0.004 | 0.41 | ND | - | ND | 0.063 | [68] | |
| 2011–2013 | 0.001 | 0.00004 | 0.002 | 0.006 | 0.26 | 0.0001 | 0.0014 | 0.0006 | 0.02 | [80] | |
| 0.0006 | 0.00002 | 0.009 | 0.006 | 0.21 | 0.0001 | 0.003 | 0.0005 | 0.02 | |||
| 2010–2012 | - | 0.002 | - | 1.8 | - | - | - | - | 1.82 | [81] | |
| - | - | - | 3.17 | - | - | - | - | 1.35 | |||
| - | 0.008 | - | 1.46 | - | - | - | 2.76 | 0.78 | |||
| 2020 | 0.09 | 0.004 | - | - | 0.766 | 0.011 | - | 0.21 | 21.4 | [71] | |
| 0.12 | 0.009 | - | - | 0.821 | 0.017 | - | 0.24 | 18.5 | |||
| 0.12 | 0.008 | - | - | 0.685 | 0.012 | - | 0.28 | 20.1 | |||
| 0.14 | 0.012 | - | - | 0.801 | 0.014 | - | 0.21 | 18.5 | |||
| 0.1 | 0.014 | - | - | 0.804 | 0.011 | - | 0.21 | 17.9 | |||
| 0.11 | 0.008 | - | - | 0.792 | 0.009 | - | 0.22 | 19.1 | |||
| 0.09 | 0.011 | - | - | 0.803 | 0.01 | - | 0.22 | 19.7 | |||
| 0.11 | 0.042 | - | - | 0.911 | 0.009 | - | 0.22 | 19.4 | |||
| 0.14 | 0.088 | - | - | 2.193 | 0.015 | - | 0.31 | 18.1 | |||
| 2011–2013 | 0.002 | 0.00002 | 0.007 | 0.006 | 0.08 | 0.00001 | 0.0009 | 0.0005 | 0.009 | [80] | |
| Sector IV | 2010 | - | 18.4 | - | 112.3 | - | - | - | 21.44 | 47.14 | [82] |
| - | - | 1.13 | 4.14 | - | - | 2.78 | - | 12.5 | [73] | ||
| - | - | 1.09 | 4.12 | - | - | 2.5 | - | 11.95 | |||
| - | - | 1.12 | 4.18 | - | - | 2.44 | - | 12.18 | |||
| - | - | 1.21 | 4.79 | - | - | 2.6 | - | 13.14 | |||
| - | - | 0.77 | 3.52 | - | - | 1.75 | - | 15.62 | |||
| - | - | 0.71 | 3.49 | - | - | 1.76 | - | 15.94 | |||
| - | - | 0.64 | 3.92 | - | - | 1.96 | - | 16.4 | |||
| - | - | 0.63 | 3.26 | - | - | 1.7 | - | 15.12 | |||
| - | - | 0.61 | 3.43 | - | - | 1.84 | - | 16.07 | |||
| - | - | 0.63 | 3.14 | - | - | 1.63 | - | 14.03 | |||
| - | - | 0.69 | 3.27 | - | - | 1.9 | - | 15.76 | |||
| - | - | 0.64 | 3.29 | - | - | 1.62 | - | 15.11 | |||
| - | - | 0.52 | 3.06 | - | - | 1.78 | - | 15.76 | |||
| - | - | 0.6 | 3.51 | - | - | 1.61 | - | 16.45 | |||
| - | - | 1.13 | 5.2 | - | - | 2.57 | - | 11.28 | |||
| - | - | 0.93 | 4.03 | - | - | 2.38 | - | 10.6 | |||
| - | 0.067 | 0.718 | 3.1 | - | - | 1.82 | 0.784 | 23 | [74] | ||
| - | 0.067 | 0.89 | 3.31 | - | - | 1.94 | 0.781 | 22.1 | |||
| - | 0.065 | 0.867 | 3.2 | - | - | 1.74 | 0.884 | 23.7 | |||
| - | 0.063 | 0.848 | 3.26 | - | - | 1.7 | 0.917 | 23.3 | |||
| Sector V | 2007–2012 | - | 6.62–10.5 | 43.1–81.2 | - | - | - | 49.6–78.9 | 7.76–11.2 | 161.2–209.8 | [78] |
| - | 4.26–8.41 | 31.0–64.2 | - | - | - | 41.2–59.1 | 6.11–7.52 | 138.2–188.7 | |||
| - | 6.26–8.41 | 35.2–73.1 | - | - | - | 43.4–71.2 | 6.83–8.91 | 146.9–179.6 | |||
| - | 4.71–8.46 | 30.1–48.2 | - | - | - | 40–59.1 | 6.81–8.96 | 124.5–181.9 | |||
| - | 3.5–6.46 | 20.6–37.0 | - | - | - | 27.9–46.6 | 6.24–7.21 | 100.2–164.0 | |||
| - | 3.6–7.32 | 29.4–44.6 | - | - | - | 36.2–52.8 | 6.23–7.81 | 117.7–179.3 | |||
| - | 8.3 | 81.24 | - | - | - | 86.18 | 42.61 | 333.78 | [79] | ||
| - | 7.11 | 26 | - | - | - | 104.28 | 21.39 | 144.56 | |||
| - | 7.8 | 28.59 | - | - | - | 67.97 | 24.33 | 230.59 | |||
| - | 5.82 | 56.8 | - | - | - | 64.05 | 9.29 | 175.95 | |||
| - | 8.67 | 72.56 | - | - | - | 38.16 | 48.04 | 249.58 | |||
| - | 6.33 | 32.67 | - | - | - | 31.67 | 34.67 | 124.5 | |||
| - | 6.27 | 47.67 | - | - | - | 27.15 | 36.02 | 165.54 | |||
| - | 5.8 | 28.65 | - | - | - | 47.9 | 8.23 | 167.95 | |||
| - | 9.13 | 71.81 | - | - | - | 41.1 | 32.52 | 310.79 | |||
| - | 9.33 | 35 | - | - | - | 89.67 | 28.22 | 178.89 | |||
| - | 7.69 | 47.67 | - | - | - | 39.5 | 29.35 | 187.15 | |||
| - | 9.26 | 29.4 | - | - | - | 35.85 | 6.81 | 128.35 | |||
| - | 10.47 | 55.39 | - | - | - | 98.55 | 35.99 | 312.02 | |||
| - | 9.5 | 56.67 | - | - | - | 92.33 | 11.33 | 197.33 | |||
| - | 10.09 | 61.27 | - | - | - | 88.82 | 23.21 | 182.27 | |||
| - | 6.6 | 56.23 | - | - | - | 48.7 | 7.31 | 125.58 | |||
| - | 11.05 | 73.12 | - | - | - | 54.95 | 39.37 | 209.12 | |||
| - | 8 | 47.33 | - | - | - | 41.17 | 17 | 172 | |||
| - | 7.28 | 41.72 | - | - | - | 85.38 | 32.11 | 161.4 | |||
| - | 4.21 | 58.5 | - | - | - | 47.8 | 6.93 | 150.6 | |||
| - | 15.7 | - | 93.5 | - | - | - | 14.31 | 32.58 | [82] | ||
| 2 | 0.2 | 1.4 | - | - | 0.21 | 2 | 1.6 | 1.2 | [83] | ||
| 2.1 | 0.19 | 1.3 | - | - | 0.22 | 2.1 | 1.5 | 1.3 | |||
| 1.9 | 0.21 | 1.2 | - | - | 0.2 | 2.3 | 1.76 | 1.1 | |||
| 2.2 | 0.055 | - | - | - | 0.2 | 2.1 | 1.5 | 1.2 | |||
| 2.4 | 0.056 | - | - | - | 0.16 | 2.1 | 1.5 | 1.3 | |||
| 2.3 | 0.054 | - | - | - | 0.18 | 2.3 | 1.5 | 1.1 | |||
| 2.9 | 0.28 | - | - | - | 0.2 | 2 | 1.5 | - | |||
| 2.8 | 0.11 | - | - | - | 0.16 | 2.1 | 1.5 | - | |||
| 2.7 | 0.21 | - | - | - | 0.18 | 2.3 | 1.5 | - | |||
| 2018 | - | 0.243 | - | 5.7 | 722.65 | - | 7.2 | 3.67 | 16.27 | [84] | |
| - | 0.158 | - | 9.59 | 1244.7 | - | 5.65 | 2.76 | 38.9 | |||
| - | 0.4 | <1.3 | <1–2.9 | - | - | <1 | <0.75 | <2.1–14.9 | [85] | ||
| 2020 | - | 0.4–0.9 | <1.3 | 0.9–1.3 | - | - | <1–1.2 | <0.75 | <2.1–6.3 | ||
| 2021 | - | 0.4–0.8 | <1.3 | 0.9–2.8 | - | - | 0.9–1.8 | <0.75–1.1 | 3.3–11.6 |
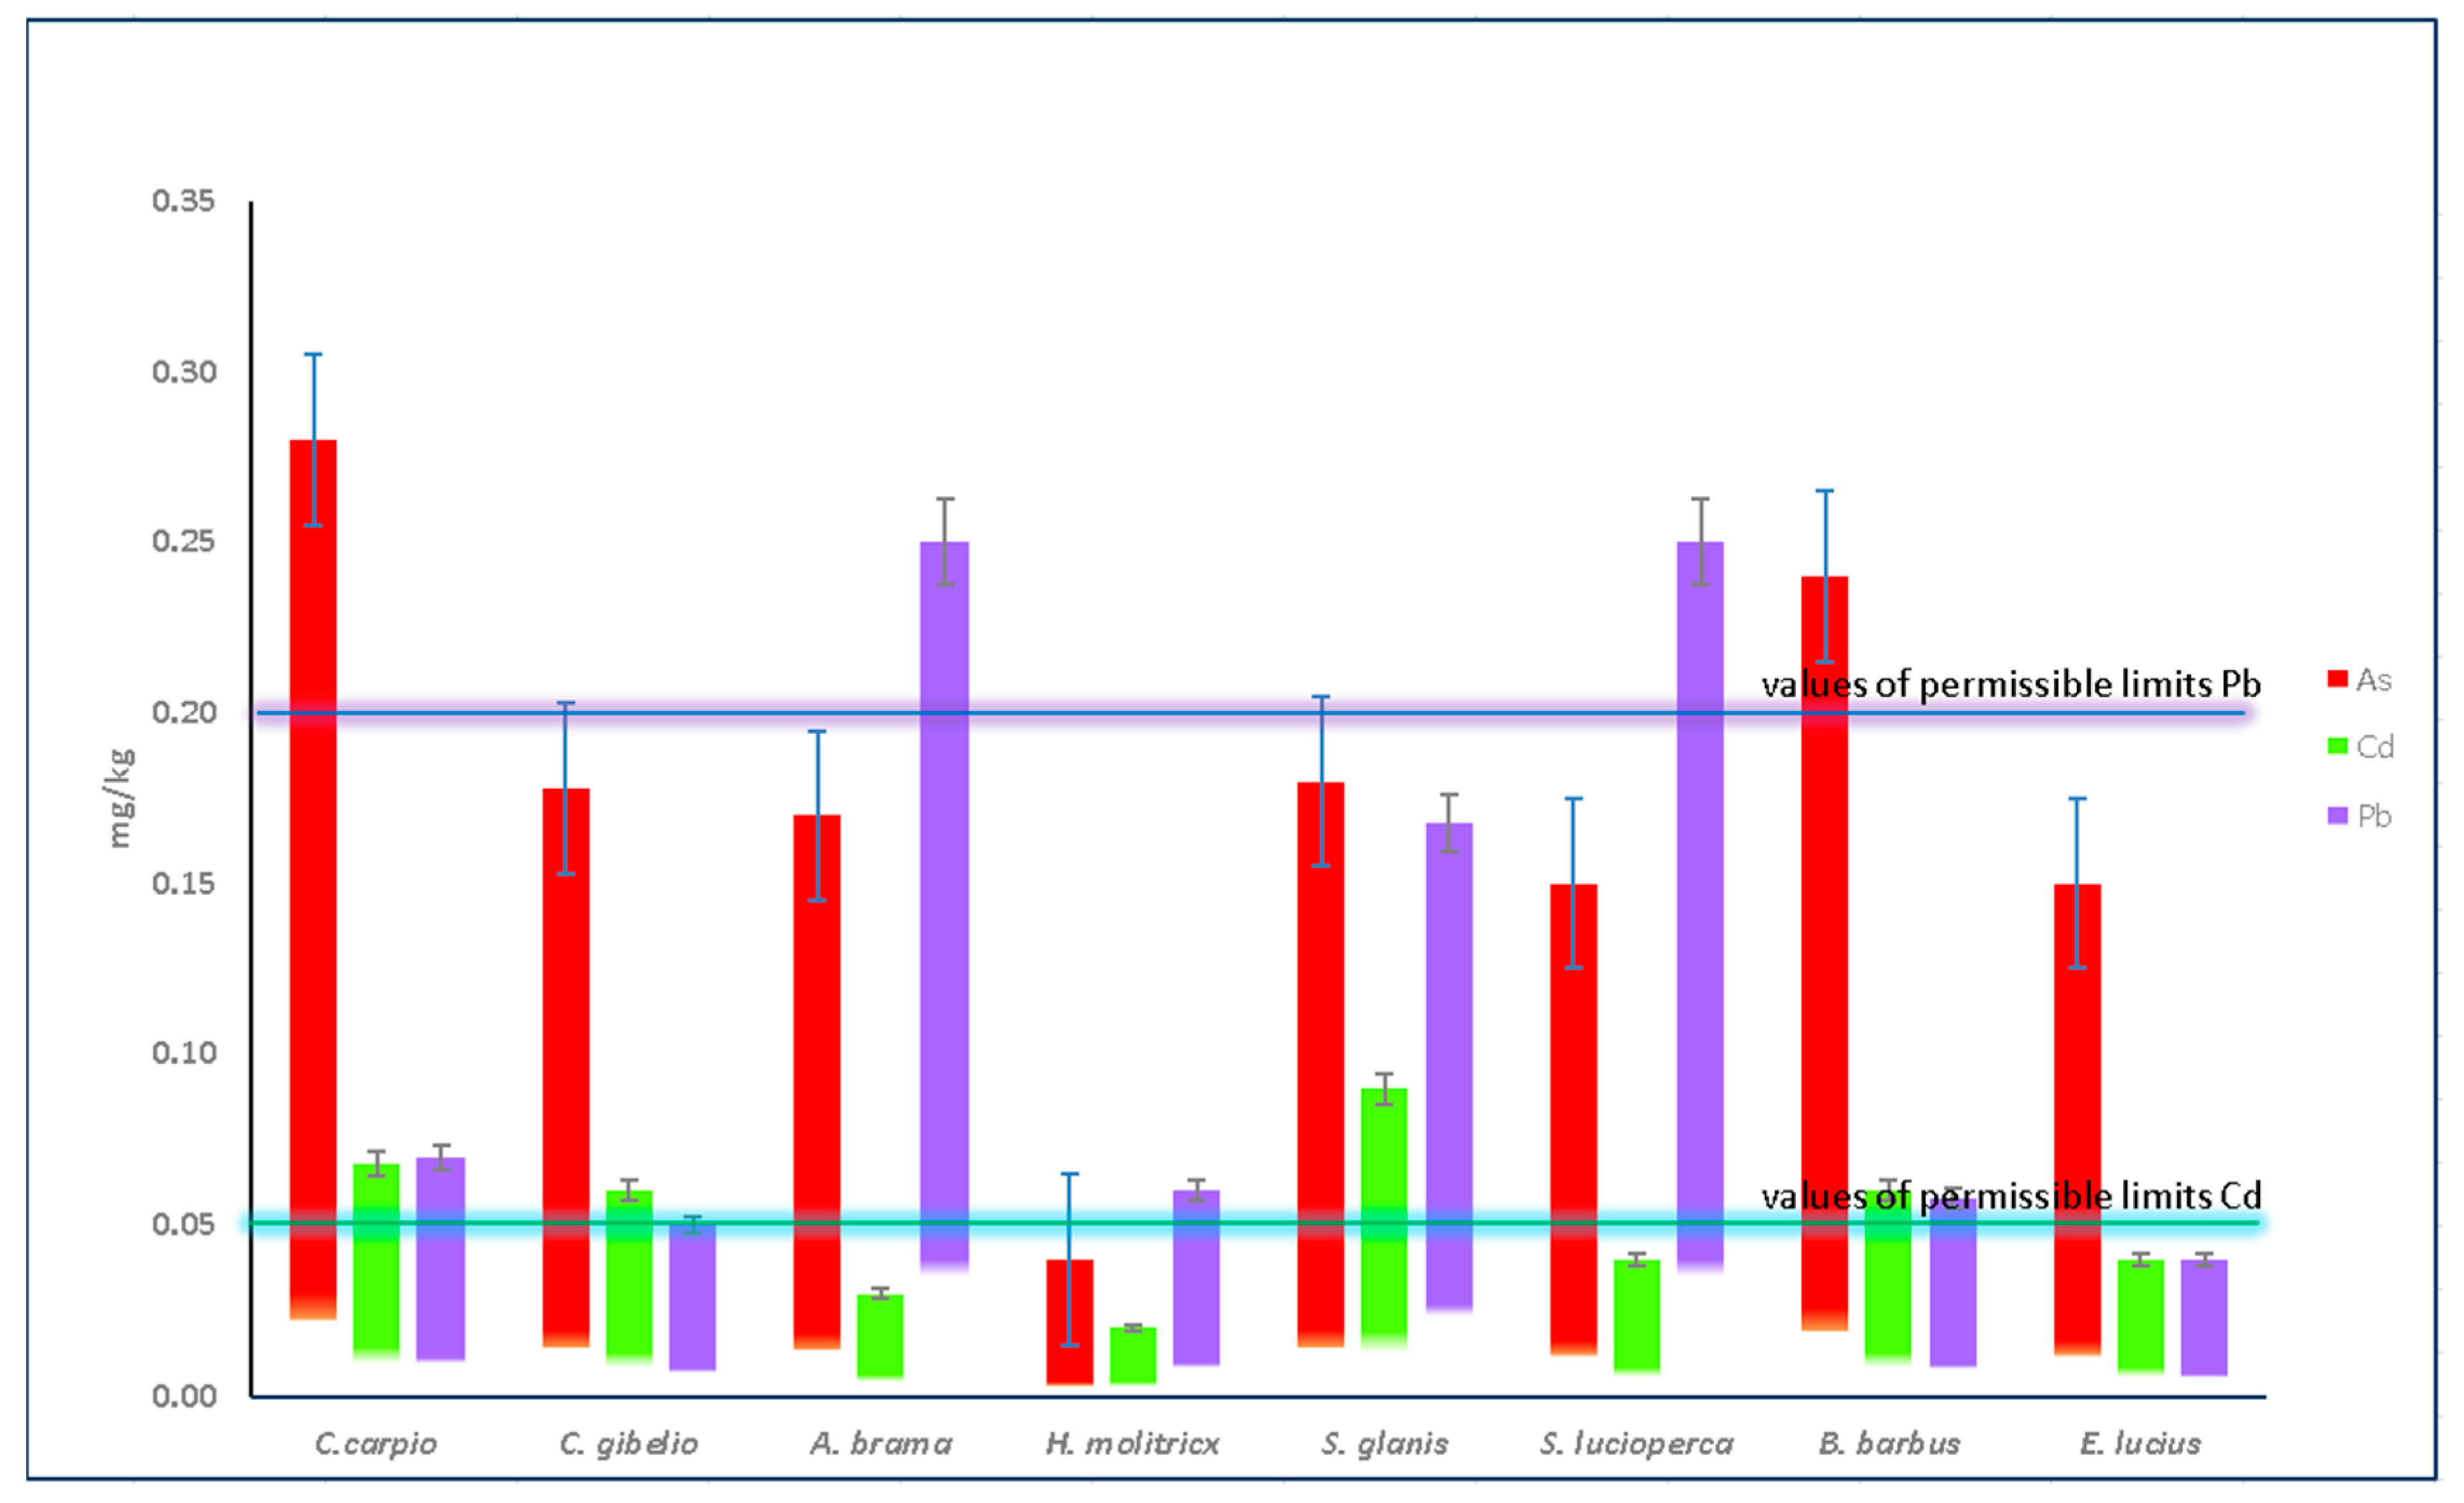
3.3. Fish Tissues
4. Discussion
5. Conclusions
Author Contributions
Funding
Acknowledgments
Conflicts of Interest
References
- Goyer, R.; Golub, M.; Choudhury, H.; Hughes, M.; Kenyon, E.; Stifelman, M. Issue Paper on the Human Health Effects of Metals; U.S. Environmental Protection Agency, Risk Assessment Forum: Washington, DC, USA, 2004.
- Tuzen, M. Toxic and essential trace elemental contents in fish species from the Black Sea, Turkey. Food Chem. Toxicol. 2009, 47, 1785–1790. [Google Scholar] [PubMed]
- Milenkovic, N.; Damjanovic, M.; Ristic, M. Study of heavy metal pollution in sediments from the Iron Gate (Danube River), Serbia and Montenegro. Pol. J. Environ. Stud. 2005, 14, 781–787. [Google Scholar]
- Vuković, Ž.; Vuković, D.; Radenković, M.; Stanković, S. A new approach to the analysis of the accumulation and enrichment of heavy metals in the Danube River sediment along the Iron Gate reservoir in Serbia. J. Serb. Chem. Soc. 2012, 77, 381–392. [Google Scholar]
- Vuković, D.; Vuković, Ž.; Stanković, S. The impact of the Danube Iron Gate Dam on heavy metal storage and sediment flux within the reservoir. Catena 2014, 113, 18–23. [Google Scholar]
- Akan, J.C.; Mohmoud, S.; Yikala, B.S.; Ogugbuaja, V.O. Bioaccumulation of Some Heavy Metals in Fish Samples from River Benue in Vinikilang, Adamawa State, Nigeria. Am. J. Anal. Chem. 2012, 3, 727–736. [Google Scholar]
- Wei, Y.; Zhang, J.; Zhang, D.; Tu, T.; Luo, L. Metal concentrations in various fish organs of different fish species from Poyang Lake, China. Ecotoxicol. Environ. Saf. 2014, 104, 182–188. [Google Scholar]
- Varola, M.; Sünbül, M.R. Environmental contaminants in fish species from a large dam reservoir and their potential risks to human health. Ecotoxicol. Environ. Saf. 2019, 169, 507–515. [Google Scholar] [CrossRef]
- Dehn, L.A.; Follmann, E.H.; Thomas, D.L.; Sheffield, G.G.; Rosa, C.; Duffy, L.K.; O’Hara, T.M. Trophic relationships in an Arctic food web and implications for trace metal transfer. Sci. Total Environ. 2006, 362, 103–123. [Google Scholar] [CrossRef]
- Bibi, M.; Hashmi, M.Z.; Malik, R.N. The level and distribution of heavy metals and changes in oxidative stress indices in humans from Lahore district, Pakistan. Hum. Exp. Toxicol. 2016, 35, 78–90. [Google Scholar] [CrossRef]
- Janjić, J.; Ivanović, J.; Marković, R.; Starčević, M.; Bošković, M.; Đorđević, V.; Baltić, Ž.M. Metal concentration in muscle tissue of carp and pike from different fish ponds in Belgrade area. J. Agric. Sci. Technol. 2015, 5, 429–436. [Google Scholar]
- Noël, L.; Chekri, R.; Millour, S.; Merlo, M.; Leblanc, J.; Guérin, T. Distribution and relationships of As, Cd, Pb, and Hg in freshwater fish from five French fishing areas. Chemosphere 2013, 90, 1900–1910. [Google Scholar] [PubMed]
- Verep, B.; Multu, C.; Apaydin, G.; Cevik, U. The trace element analysis in freshwater fish species, water and sediments in Iyidere Stream (Rize-Turkey). Pak. J. Biol. Sci. 2012, 15, 658–665. [Google Scholar]
- Bawuro, A.A.; Voegborlo, R.B.; Adimado, A.A. Bioaccumulation of heavy metals in some tissues of fish in Lake Geriyo, Adamawa State, Nigeria. J. Environ. Public Health 2018, 2018, 1854892. [Google Scholar] [PubMed]
- Dural, M.; Goksu, M.Z.L.; Ozak, A.A. Investigation of heavy metal levels in economically important fish species captured from the Tuzla Lagoon. Food Chem. 2007, 102, 415–421. [Google Scholar]
- Lana, R.; Vavrova, M.; Navratil, S.; Brabencova, E.; Vecerek, V. Organochlorine pollutants in chub, Leuciscus cephalus, from the Svratka River, Czech Republic. Bull. Environ. Contam. Toxicol. 2010, 84, 726–730. [Google Scholar] [PubMed]
- Farombi, E.O.; Adelowo, O.A.; Ajimoko, Y.R. Biomarkers of oxidative stress and heavy metal levels as indicators of environmental pollution in African catfish (Clarias gariepinus) from Nigeria Ogun River. Int. J. Environ. Res. Public Health 2007, 4, 158–165. [Google Scholar] [PubMed]
- Drąg-Kozak, E.; Łuszczek-Trojnar, E.; Socha, M.; Bojarski, B. Effects of Melatonin on Cadmium Accumulation and Haematological Parameters in Cadmium Intoxicated Prussian Carp (B.). Ann. Anim. Sci. 2021, 21, 899–923. [Google Scholar]
- Guo, J.; Pu, Y.; Zhong, L.; Wang, K.; Duan, X.; Chen, D. Lead impaired immune function and tissue integrity in yellow catfish (Peltobargus fulvidraco) by mediating oxidative stress, inflammatory response and apoptosis. Ecotoxicol. Environ. Saf. 2021, 226, 112857. [Google Scholar]
- Shahjahan, M.; Taslima, K.; Rahman, M.S.; Al-Emran, M.; Alam, S.I.; Faggio, C. Effects of heavy metals on fish physiology—A review. Chemosphere 2022, 300, 134519. [Google Scholar]
- Ackland, M.L.; Bornhorst, J.; Dedoussis, G.V.; Dietert, R.R.; Nriagu, J.O.; Pacyna, J.M.; Pettifor, J.M. Metals in the environment as risk factors for infectious diseases. In Trace Metals and Infectious Diseases; MIT Press: Cambridge, MA, USA, 2015. [Google Scholar]
- Macirella, R.; Curcio, V.; Ahmed, A.I.M.; Talarico, F.; Sesti, S.; Paravani, E.; Odetti, L.; Mezzasalma, M.; Brunelli, E. Morphological and Functional Alterations of Zebrafish (Danio rerio) Liver after Exposure to Two Ecologically Relevant Concentrations of Lead. Fishes 2023, 8, 342. [Google Scholar]
- Ebrahimi, M.; Taherianfard, M. The effects of heavy metals exposure on reproductive systems of cyprinid fish from Kor River. Iran. J. Fish. Sci. 2011, 10, 13–26. [Google Scholar]
- Bera, T.; Kumar, S.V.; Devi, M.S.; Kumar, V.; Behera, B.K.; Das, B.K. Effect of heavy metals in fish reproduction: A review. J. Environ. Biol. 2022, 43, 631–642. [Google Scholar]
- Taslima, K.; Al-Emran, M.; Rahman, M.S.; Hasan, J.; Ferdous, Z.; Rohani, M.F.; Shahjahan, M. Impacts of heavy metals on early development, growth and reproduction of fish—A review. Toxicol. Rep. 2022, 9, 858–868. [Google Scholar]
- Munaretto, J.S.; Ferronato, G.; Ribeiro, L.C.; Martins, M.L.; Adaime, M.B.; Zanella, R. Development of a multi-residue method for the determination of endocrine disrupters in fish fillet using gas chromatography–triple quadrupole tandem mass spectrometry. Talanta 2013, 116, 827–834. [Google Scholar] [PubMed]
- Dang, V.D.; Kroll, K.J.; Supowit, S.D.; Halden, R.U.; Denslow, N.D. Tissue distribution of organochlorine pesticides in largemouth bass (Micropterus salmoides) from laboratory exposure and a contaminated lake. Environ. Pollut. 2016, 216, 877–883. [Google Scholar]
- Tsai, M.-T.; Huang, S.-Y.; Cheng, S.-Y. Lead poisoning can be easily misdiagnosed as acute porphyria and nonspecific abdominal pain case report in emergency medicine 2017. Case Rep. Emerg. Med. 2017, 2017, 9050713. [Google Scholar] [CrossRef]
- Abadin, H.; Ashizawa, A.; Stevens, Y.W.; Llados, F.; Diamond, G.; Sage, G.; Citra, M.; Quinones, A.; Bosch, S.J.; Swarts, S.G. Toxicological Profile for Lead; Atlanta (GA) Agency for Toxic Substances and Disease Registry (US): Atlanta, GA, USA, 2007. [PubMed]
- Fernandes Azevedo, B.; Barros Furieri, L.; Peçanha, F.M.; Wiggers, G.A.; Frizera Vassallo, P.; Ronacher Simões, M.; Fiorim, J.; de Batista, P.R.; Fioresi, M.; Rossoni, L.; et al. Toxic effects of mercury on the cardiovascular and central nervous systems. J. Biomed. Biotechnol. 2012, 2012, 949048. [Google Scholar]
- World Health Organization. Elemental Speciation in Human Health Risk Assessment; World Health Organization: Geneva, Switzerland, 2006. [Google Scholar]
- Sanders, T.; Liu, Y.; Buchner, V.; Tchounwou, P.B. Neurotoxic effects and biomarkers of lead exposure: A review. Rev. Environ. Health 2009, 24, 15–46. [Google Scholar]
- Bondar, C. Hydromorphological Balance of the Danube River Channel on the Sector between Bazias (km 1072.2) and Danube Delta Inlet (km 80.5); National Institute of Marine Geology and Geo-Ecology: Bucharest, Romania, 2008; Available online: https://www.osce.org/files/f/documents/0/8/32944.pdf (accessed on 1 March 2023).
- Shabani, M.; Hadeiy, S.K.; Parhizgar, P.; Zamani, N.; Mehrad, H.; Hassanian-Moghaddam, H.; Phillips, S. Lead poisoning; a neglected potential diagnosis in abdominal pain. BMC Gastroenterol. 2020, 20, 134. [Google Scholar]
- Jaishankar, M.; Tseten, T.; Anbalagan, N.; Mathew, B.B.; Beeregowda, K.N. Toxicity, mechanism and health effects of some heavy metals. Interdiscip. Toxicol. 2014, 7, 60. [Google Scholar]
- Mitra, S.; Chakraborty, A.J.; Tareq, A.M.; Emran, T.B.; Nainu, F.; Khusro, A.; Idris, A.M.; Khandaker, M.U.; Osman, H.; Alhumaydhi, F.A.; et al. Impact of heavy metals on the environment and human health: Novel therapeutic insights to counter the toxicity. J. King Saud. Univ. Sci. 2022, 34, 101865. [Google Scholar]
- Goyer, R.A.; Clarkson, T.M. Chapter 23: Toxic effects of metals. In Casarett & Doull’s Toxicology; Klaassen, C.D., Ed.; McGraw-Hill: New York, NY, USA, 2001; pp. 811–868. [Google Scholar]
- Davison, A.G.; Taylor, A.; Darbyshire, J. Cadmium fume inhalation and emphysema. Lancet 1988, 26, 663–667. [Google Scholar]
- Järup, L.; Berglund, M.; Elinder, C.G.; Nordberg, G.; Vahter, M. Health effects of cadmium exposure—A review of the literature and a risk estimate. Scand. J. Work Environ. Health 1998, 24 (Suppl. 1), 1–52. [Google Scholar]
- IPCS (World Health Organization, International Programme on Chemical Safety). Inorganic Lead. Environmental Health Criteria Document No. 165; WHO: Geneva, Switzerland, 1995; pp. 152–192.
- ATSDR (Agency for Toxic Substances and Disease Registry). Toxicological Profile for Mercury; ATSDR: Atlanta, GA, USA, 1999.
- NAS/NRC (National Academy of Sciences/National Research Council). Arsenic in Drinking Water 2001 Update; National Academy of Science, National Academy Press: Washington, DC, USA, 2001. [Google Scholar]
- De Vleeschouwer, F.; Gérard, L.; Goormaghtigh, C.; Mattielli, N.; Le Roux, G.; Fagel, N. Atmospheric lead and heavy metal pollution records from a Belgian peat bog spanning the last two millennia: Human impact on a regional to global scale. Sci. Total Environ. 2007, 377, 282–295. [Google Scholar] [CrossRef] [PubMed]
- Fu, Z.; Wu, F.; Chen, L.; Xu, B.; Feng, C.; Bai, Y.; Liao, H.; Sun, S.; Giesy, J.P.; Guo, W. Copper and zinc, but not other priority toxic metals, pose risks to native aquatic species in a large urban lake in Eastern China. Environ. Pollut. 2016, 219, 1069–1076. [Google Scholar] [CrossRef]
- Golovanova, I.L. Effects of heavy metals on the physiological and biochemical status of fishes and aquatic invertebrates. Inc. Water Biol. 2008, 1, 93–101. [Google Scholar] [CrossRef]
- Meena, R.A.A.; Sathishkumar, P.; Ameen, F.; Yusoff, A.R.M.; Gu, F.L. Heavymetal pollution in immobile and mobile components of lentic ecosystems—A review. Environ. Sci. Pollut. Res. 2018, 25, 4134–4148. [Google Scholar] [CrossRef]
- ICPDR/International Commission for the Protection of the Danube River. Water Quality in the Danube River Basin—2019—TNMN—Yearbook; ICPDR: Vienna, Austria, 2019; Available online: www.icpdr.org (accessed on 12 March 2023).
- Subotić, S.; Jeftić, V.; Spasić, S.; Hegediš, A.; Krpo-Ćetković, J.; Lenhardt, M. Distribution and accumulation of elements (As, Cu, Fe, Hg, Mn, and Zn) in tissues of fish species from different trophic levels in the Danube River at the confluence with the Sava River (Serbia). Environ. Sci. Pollut. Res. 2013, 20, 5309–5317. [Google Scholar] [CrossRef]
- Teodorović, I.; Đukić, N.; Maletin, S.; Miljanović, B.; Jugovac, N. Metal pollution index: Proposal for freshwater monitoring based on trace metal accumulation in fish. Tiscia 2000, 32, 55–60. [Google Scholar]
- ORDER, no. 161 for the Approval of the Norm Regarding the Classification of Surface Water Quality in Order to Establish the Ecological Status of Water Bodies. Available online: http://www.monitoruljuridic.ro/monitorul-oficial/161/2006-02-21 (accessed on 10 March 2022). (In Romanian).
- Horton, R.K. An index number system for rating water quality. J. Water Pollut. Cont. Fed. 1965, 37, 300–305. [Google Scholar]
- Official Journal of the European Communities. Commission Regulation (EC) No 466/2001, of 8 March 2001. Setting Maximum Levels for Certain Contaminants in Foodstuffs; EC: Brussels, Belgium, 2001. [Google Scholar]
- FAO (Food and Agriculture Organization). Compilation of Legal Limits for Hazardous Substances in Fish and Fishery Products; FAO Fishery Circular 1983 No. 464; FAO: Rome, Italy, 1983; pp. 5–100. [Google Scholar]
- Official Gazzette of FRY, No 28/2011. Regulation on Quantity of Pesticides, Metals, Metalloids, and Other Toxic Substances, Chemotherapeutics, Anabolics, and Other Substances Which Can Be Found in Food. Available online: https://legislatie.just.ro/Public/DetaliiDocument/129856 (accessed on 5 March 2023).
- Derakhshan, Z.; Mahvi, A.H.; Faramarzian, M.; Dehghani, M.; Salari, M.; Fakhri, Y.; Afsharnia, M.; Hosseini, M.S.; Marzban, A.; Taghavi, M. Data on heavy metal concentration in common carp fish consumed in Shiraz, Iran. Elsevier Inc. Data Brief. 2018, 21, 1890–1894. [Google Scholar] [CrossRef]
- Al-Hashemi, A.H.; Sekhavatjou, M.S.; Kiabi, B.H.; Karbassi, A.R. Bioaccumulation of trace elements in water, sediment, and ProcZool Soc 123 Six fish species from a freshwater wetland, Iran. Microchem. J. 2012, 104, 1–6. [Google Scholar]
- ATSDR. Toxicological Profile for Chromium; U.S. Department of Health and Human Services, Public Health Service: Atlanta, GA, USA, 2012.
- Buha, A.; Wallace, D.; Matovic, V.; Schweitzer, A.; Oluic, B.; Micic, D.; Djordjevic, V. Cadmium exposure as a putative risk factor for the development of pancreatic cancer: Three different lines of evidence. BioMed. Res. Int. 2017, 2017, 1981837. [Google Scholar]
- FAO/WHO. Compilation of Legal Limits for Hazardous Substances in Fish and Fishery Products. Fisheries Circular. No. 764. 1983. Available online: http://www.fao.org/inland-fisheries/topic/detail/fr/c/1150083/ (accessed on 2 April 2023).
- Boyden, C.R.; Phillips, D.J.H. Seasonal variation and inherent variability of trace elements in oysters and their implications for indicator studies. Mar. Ecol. Prog. 1981, 5, 29–40. [Google Scholar]
- Ural, M.; Yildirim, N.; Danabas, D.; Kaplan, O.; Cikcikoglu Yildirim, N.; Ozcelik, M.; Kurekci, E.F. Some heavy metals accumulation in tissues in Capoeta umbla (Heckel, 1843) from Uzuncayir Dam Lake (Tunceli, Turkey). Bull. Environ. Contam. Toxicol. 2012, 88, 172–176. [Google Scholar]
- Yilmaz, F.; Özdemir, N.; Demirak, A.; Levent Tuna, A. Heavy metal levels in two fish species, Leuciscus cephalus and Lepomis gibbosus. Food Chem. 2007, 100, 830–835. [Google Scholar]
- Jarić, I.; Višnjić-Jeftić, Ž.; Cvijanović, G.; Gačić, Z.; Jovanović, L.; Skorić, S.; Lenhardt, M. Determination of differential heavy metal and trace element accumulation in liver, gills, intestine and muscle of starlet (Acipenser ruthenus) from the Danube River in Serbia by ICP-OES. Microchem. J. 2011, 98, 77–81. [Google Scholar]
- Poleksić, V.; Lenhardt, M.; Jarić, I.; Đorđević, D.; Gačić, Z.; Cvijanović, G.; Rašković, B. Liver, gills, and skin histopathology and heavy metal content of the Danube starlet (Acipenser ruthenus Linnaeus, 1758). Environ. Toxicol. Chem. 2010, 29, 515–521. [Google Scholar]
- Višnjić-Jeftić, Ž.; Jarić, I.; Jovanović, L.; Skorić, S.; Smederevac-Lalić, M.; Nikčević, M.; Lenhardt, M. Heavy metal and trace element accumulation in muscle, liver and gills of the Pontic shad (Alosa immaculata Bennet 1835) from the Danube River(Serbia). Microchem. J. 2010, 95, 341–344. [Google Scholar]
- Milanov, R.; Krstić, M.; Marković, R.; Jovanović, D.; Baltić, B.; Ivanović, J.; Jovetić, M.; Baltić, Ž.M. Analysis of heavy metals concentration in tissues of three different fish species included in human diet from Danube River, in the Belgrade Region, Serbia. Acta Vet. 2016, 66, 89–102. [Google Scholar]
- Antonijević, M.D.; Arsović, M.; Čáslavský, J.; Cvetković, V.; Dabić, P.; Franko, M.; Ilić, G.; Ivanović, M.; Ivanović, N.; Kosovac, M.; et al. Actual contamination of the Danube and Sava rivers at Belgrade. J. Serb. Chem. Soc. 2013, 9, 1169–1184. [Google Scholar]
- Ivanović, J.; Janjić, J.; Baltić, M.; Milanov, R.; Bošković, M.; Marković, R.V.; Glamočlija, N. Metal concentrations in water, sediment and three fish species from the Danube River, Serbia: A cause for environmental concern. Environ. Sci. Pollut. Res. 2016, 23, 17105–17112. [Google Scholar] [CrossRef]
- Culicov, O.A.; Trtíc-Petrovíc, T.; Nekhoroshkov, P.S.; Zinicovscaia, I.; Duliu, O.G. On the Geochemistry of the Danube River Sediments (Serbian Sector). Int. J. Environ. Res. Public Health 2022, 19, 12879. [Google Scholar] [CrossRef] [PubMed]
- Sediment-Quality Information, Monitoring and Assessment System to Support Transnational Cooperation for Joint Danube Basin Water Management (Project SIMONA). 2021. Available online: https://www.icpdr.org/main/publications/danube-watch-3-2021-simona-sediment-quality-information-monitoring-and-assessment (accessed on 2 March 2023).
- Popescu, F.; Trumić, M.; Cioabla, A.E.; Vujić, B.; Stoica, V.; Trumić, M.; Opris, C.; Bogdanović, G.; Trif-Tordai, G. Analysis of Surface Water Quality and Sediments Content on Danube Basin in Djerdap-Iron Gate Protected Areas. Water 2022, 14, 2991. [Google Scholar] [CrossRef]
- Radu, V.; Ionescu, P.; Diacu, E.; Deak, G.; Ivanov, A.A. Assessing and Spatio-Temporal Variations of Potentially Toxic Elements in the Sediments from Lower Danube River in 2011–2017 Period. Rev. Chim. 2020, 71, 126–135. [Google Scholar]
- Anghel, A.M.; Diacu, E.; Ilie, M.; Petrescu, A.; Ghita, G.; Marinescu, F.; Deak, G. Statistical Analysis of Heavy Metals Concentration in Water and Sediments in the Lower Part of the Danube River—Romanian Section. Rev. Chim. 2016, 11, 2151–2155. [Google Scholar]
- Ilie, M.; Marinescu, F.; Ghita, G.; Deak, G.Y.; Tanase, G.S.; Raischi, M. Assessment of Heavy Metal in Water and Sediments of the Danube River. J. Environ. Prot. Ecol. 2014, 15, 825–833. [Google Scholar]
- Winkels, H.J.; Kroonenberg, S.B.; Lychagin, M.Y.; Marin, G.; Rusakov, G.V.; Kasimov, N.S. Geochronology of priority pollutants in sedimentation zones of the Volga and Danube delta in comparison with the Rhine delta. Appl. Geochem. 1998, 13, 581–591. [Google Scholar] [CrossRef]
- Vignati, D.A.; Secrieru, D.; Bogatova, Y.I.; Dominik, J.; Céréghino, R.; Berlinsky, N.A.; Oaie, G.; Szobotka, S.; Stanica, A. Trace element contamination in the arms of the Danube Delta (Romania/Ukraine): Current state of knowledge and future needs. J. Environ. Manag. 2013, 125, 169–178. [Google Scholar]
- Vosniakos, F.; Petre, J.; Pascu, L.; Vasile, G.; Iancu, V.; Staniloae, D.; Nicolau, M.; Cruceru, L.; Golumbeanu, M. Aquatic ecosystem quality assessment of the Danube Delta in the periods April-Oct. 2007 and 2008. Fresenius Environ. Bull. 2010, 19, 20–29. [Google Scholar]
- Burada, A.; Topa, C.M.; Georgescu, L.P.; Teodorof, L.; Nastase, C.; Seceleanu-Odor, D.; Iticescu, C. Heavy Metals Environment Accumulation in Somova—Parches Aquatic Complex from the Danube Delta Area. Rev. Chim. 2015, 66, 48–54. [Google Scholar]
- Burada, A.; Odor, D.S.; Teodorof, L.; Nastasea, C.; Nastase, A.; Navodaru, I.; Georgescu, L.P. Mercury levels in fish tissues with and without commercial value from Danube Delta biosphere reserve. J. Environ. Prot. Ecol. 2014, 15, 842–850. [Google Scholar]
- Milošković, A.; Dojčinović, B.; Kovačević, S.; Radojković, N.; Radenković, M.; Milošević, D.; Simić, V. Spatial monitoring of heavy metals in the inland waters of Serbia: A multispecies approach based on commercial fish. Environ. Sci. Pollut. Res. 2016, 23, 9918–9933. [Google Scholar] [CrossRef]
- Matache, M.L.; Marin, C.; Rozylowicz, L.; Tudorache, A. Plants accumulating heavy metals in the Danube River wetlands. J. Environ. Health Sci. Eng. 2013, 11, 39. [Google Scholar] [CrossRef]
- Ionita, C.; Mititelu, M.; Morosan, E. Analysis Of Heavy Metals And Organic Pollutants From Some Danube River Fishes. Farmacia 2014, 62, 299–305. [Google Scholar]
- Tiberiu, R.; Rusu, T.A.; Vida, C.; Pădurețu, S. Determining Heavy Metal Concentrations in the Waters of Babadag River. ProEnvironment 2014, 7, 80–84. [Google Scholar]
- Ira-Adeline, S.; Victor, C.; Stefan-Mihai, P.; Alina, M.; Aurelia, N.; Stefan-Adrian, S.; Antoaneta, E.; Ancuta, S.D. Heavy Metal Evaluation in the Lower Sector of Danube River. Available online: https://landreclamationjournal.usamv.ro/pdf/2020/Art1.pdf (accessed on 20 March 2023).
- Catianis, I.; Tiron, D.L.; Grosu, D. Heavy Metals Occurrence in Lakes of the Danube Delta, Romania. Geo-Eco-Marina 2022, 28, 49–63. Available online: https://geoecomar.ro/beta/wp-content/uploads/2023/01/04_CATIANIS_c4_2022.pdf (accessed on 5 April 2023).
- Zhang, J.L.; Fang, L.; Song, J.Y.; Luo, X.; Fu, K.D.; Chen, L.Q. Health Risk Assessment of Heavy Metals in Cyprinus carpio (Cyprinidae) from the Upper Mekong River; Environmental Science and Pollution Research; Springer: Berlin/Heidelberg, Germany, 2019. [Google Scholar] [CrossRef]
- Calmuc, V.A.; Calmuc, M.; Arseni, M.; Topa, C.M.; Timofti, M.; Burada, A.; Iticescu, C.; Georgescu, L.P. Assessment of Heavy Metal Pollution Levels in Sediments and of Ecological Risk by Quality Indices, Applying a Case Study: The Lower Danube River, Romania. Water 2021, 13, 1801. [Google Scholar] [CrossRef]
- Teien, H.-C.; Kroglund, F.; Salbu, B.; Rosseland, B.O. Gill reactivity of aluminum-species following liming. Sci. Total Environ. 2006, 358, 206–220. [Google Scholar] [CrossRef] [PubMed]
- Hansen, B.H.; Garmo, A.; Olsvik, P.A.; Andersen, R.A. Gill metal binding and stress gene transcription in brown trout (Salmo trutta) exposed to metal environments: The effect of preexposure in natural populations. Environ. Toxicol. Chem. 2007, 26, 944–953. [Google Scholar] [CrossRef]
- Terra, B.F.; Araújo, F.G.; Calza, C.F.; Lopes, R.T.; Teixeira, T.P. Heavy metal in tissues of three fish species from different trophic levels in a tropical Brazilian River. Water Air Soil Pollut. 2008, 187, 275–284. [Google Scholar] [CrossRef]
- Čelechovská, O.; Svobodová, Z.; Žlábek, V.; Macharáčková, B. Distribution of metals in tissues of the common carp (Cyprinus carpio L.). Acta Vet. Brno 2007, 76, 93–100. [Google Scholar] [CrossRef]
- Beltcheva, M.; Metcheva, R.; Peneva, V.; Marinova, M.; Yankov, Y.; Chikova, V. Heavy metals in Antarctic notothenioid fish from South Bay, Livingston Island, South Shetlands (Antarctica). Biol. Trace Elem. Res. 2011, 141, 150–158. [Google Scholar] [CrossRef] [PubMed]
- de Carvalho Costa, S.; Hartz, S.M. Evaluation of trace metals (Cadmium, chromium, Copper and Zinc) in tissues of commercially important fish (Leporinus outsiders) from Guaíba Lake, Southern Brazil. Braz. Arch. Biol. Technol. 2009, 52, 241–250. [Google Scholar] [CrossRef]
- Jovanović, D.A.; Marković, R.V.; Teodorović, V.B.; Šefer, D.S.; Krstić, M.P.; Radulović, S.B.; Ćirić, J.; Janjić, J.M.; Baltić, M. Determination of heavy metals in muscle tissue of six fish species with different feeding habits from the Danube River, Belgrade—Public health and environmental risk assessment. Environ. Sci. Pollut. Res. 2017, 24, 11383–11391. [Google Scholar] [CrossRef]
- Subotić, S.; Spasić, S.; Višnjić-Jeftić, Ž.; Hegediš, A.; Krpo-Ćetković, J.; Mićković, B.; Skorić, S.; Lenhardt, M. Heavy metal and trace element bioaccumulation in target tissues of four edible fish species from the Danube River (Serbia). Ecotoxicol. Environ. Saf. 2013, 98, 196–202. [Google Scholar] [CrossRef] [PubMed]
- Lenhardt, M.; Jarić, I.; Višnjić-Jeftić, Z.; Skorić, S.; Gačić, Z.; Pucar, M.; Hegediš, A. Concentrations of 17 elements in muscle, gills, liver and gonads of five economically important fish species from the Danube River. Knowl. Manag. Aquat. Ecosyst. 2012, 407, 2. [Google Scholar] [CrossRef]
- Zrnčić, S.; Oraić, D.; Ćaleta, M.; Mihaljević, Z.; Zanella, D.; Bilandžić, N. Biomonitoring of heavy metals in fish from the Danube River. Environ. Monit. Assess. 2013, 185, 1189–1198. [Google Scholar] [CrossRef]
- Mititelu, M.; Nicolescu, F.; Ionita, C.-A.; Nicolescu, T.-O. Study of Heavy Metals and organic pollutants in some fishes of the Danube River. J. Environ. Prot. Ecol. 2012, 13, 869–874. [Google Scholar]
- Burada, A.; Teodorof, L.; Despina, C.; Seceleanu-Odor, D.; Tudor, M.; Ibram, O.; Navodaru, I.; Murariu, G.; Topa, C.M.; Tudor, M. Trace elements in fish tissue with commercial value of the Danube Delta biosphere reserve. Environ. Eng. Manag. J. 2017, 16, 731–738. [Google Scholar] [CrossRef]
- Jovicic, K.; Jankovic, S.; Visnjic-Jeftic, Z.; Skoric, S.; Djikanovic, V.; Lenhardt, M.; Hegedis, A.; Krpo-Cetkovic, J.; Jaric, I. Mapping differential elemental accumulation in fish tissues: Importance of fish tissue sampling standardization. Biol. Sci. 2016, 68, 303–309. [Google Scholar] [CrossRef]
- Gheorghe, S.; Vasile, G.G.; Gligor, C.; Lucaciu, I.E.; Lazar, M.N. Metallic Elements (Cu, Zn, Ni and Mn) Toxicity effects determination on a freshwater fish Cyprinus carpio (Common Carp) laboratory acclimatized. Rev. Chim. 2017, 68, 8. [Google Scholar] [CrossRef]
- Diaconescu, C.; Urdes, L.; Marius, H.; Ianitchi, D.; Popa, D. The influence of heavy metal content on superoxide dismutase and glutathione peroxidase activity in the fish meat originated from different areas of Danube river. Roum. Biotechnol. Lett. 2008, 13, 3859–3862. [Google Scholar]
- Kostić-Vuković, J.; Kolarević, S.; Kračun-Kolarević, M.; Višnjić-Jeftić, Ž.; Rašković, B.; Poleksić, V.; Gačić, Z.; Lenhardt, M.; Vuković-Gačić, B. Temporal variation of biomarkers in common bream Abramis brama (L. 1758) exposed to untreated municipal wastewater in the Danube River in Belgrade, Serbia. Environ. Monit. Assess. 2021, 193, 465. [Google Scholar] [CrossRef]
- Kalyoncu, L.; Kalyoncu, H.; Arslan, G. Determination of heavy metals and metals levels in five fish species from I¸sıklı Dam Lake and Karacaören Dam Lake (Turkey). Environ. Monit. Assess 2021, 184, 2231–2235. [Google Scholar] [CrossRef]
- Pantelica, A.; Ene, A.; Georgescu, I.I. Instrumental neutron activation analysis of some fish species from Danube River in Romania. Microchem. J. 2012, 103, 142–147. [Google Scholar] [CrossRef]
- Nachev, M.; Rozdina, D.; Michler-Kozma, D.N.; Raikova, G.; Sures, B. Metal accumulation in ecto- and endoparasites from the anadromous fish, the Pontic shad (Alosa immaculata). Parasitology 2022, 149, 496–502. [Google Scholar] [CrossRef]
- Jovičić, K.; Nikolić, D.M.; Višnjić-Jeftić, Z.; Đikanović, V.; Skorić, S.; Stefanović, S.M.; Lenhardt, M.; Hegediš, A.; Krpo-Ćetković, J.; Jarić, I. Mapping differential elemental accumulation in fish tissues: Assessment of metal and trace element concentrations in wels catfish (Silurus glanis) from the Danube River by ICP-MS. Environ. Sci. Pollut. Res. 2014, 22, 3820–3827. [Google Scholar] [CrossRef]
- Rašković, B.; Poleksić, V.; Višnjić-Jeftić, Ž.; Skorić, S.; Gačić, Z.; Djikanović, V.; Jarić, I.; Lenhardt, M. Use of histopathology and elemental accumulation in different organs of two benthophagous fish species as indicators of river pollution. Environ. Toxicol. 2014, 30, 1153–1161. [Google Scholar] [CrossRef] [PubMed]
- Sunjog, K.; Gačić, Z.; Kolarević, S.; Višnjić-Jeftić, Ž.; Jarić, I.; Knežević-Vukčević, J.; Vuković-Gačić, B.; Lenhardt, M. Heavy Metal Accumulation and the Genotoxicity in Barbel (Barbus barbus) as Indicators of the Danube River Pollution. Sci. World J. 2012, 2012, 351074. [Google Scholar] [CrossRef]
- Morina, A.; Morina, F.; Djikanović, V.; Spasić, S.; Krpo-Ćetković, J.; Kostić, B.; Lenhardt, M. Common barbel (Barbus barbus) as a bioindicator of surface river sediment pollution with Cu and Zn in three rivers of the Danube River Basin in Serbia. Environ. Sci. Pollut. Res. 2016, 23, 6723–6734. [Google Scholar] [CrossRef]
- Subotić, S.; Višnjić-Jeftić, Ž.; Spasić, S.; Hegediš, A.; Krpo-Ćetković, J.; Lenhardt, M. Concentrations of 18 Elements in Muscle, Liver, Gills, and Gonads of Sichel (Pelecus cultratus), Ruffe (Gymnocephalus cernua), and European Perch (Perca fluviatilis) in the Danube River near Belgrade (Serbia). Water Air Soil Pollut. 2015, 226, 287. [Google Scholar] [CrossRef]
- Karadede, H.; Ünlü, E. Concentrations of some heavy metals in water, sediment and fish species from the Ataturk Dam Lake (Euphrates), Turkey. Chemosphere 2000, 41, 1371–1376. [Google Scholar] [CrossRef] [PubMed]
- Papagiannis, I.; Kagalou, I.; Leonardos, J.; Petridis, D.; Kalfakakou, V. Copper and Zinc in four freshwater fish species from Lake Pamvotis (Greece). Environ. Int. 2004, 30, 357–362. [Google Scholar] [CrossRef] [PubMed]
- Karadede-Akin, H.; Ünlü, E. Heavy metal concentration in water, sediment, fish and some benthic organisms from Tigris River, Turkey. Environ. Monit. Assess. 2007, 131, 323–337. [Google Scholar] [CrossRef]
- Tekin-Özan, S.; Kir, I. Seasonal variations of heavy metals in some organs of carp (Cyprinus carpio L., 1758) from Beyşehir Lake (Turkey). Environ. Monit. Assess 2008, 138, 201–206. [Google Scholar] [CrossRef]
- Mazej, Z.; Sayegh-Petkovšek, S.; Pokorny, B. Heavy metal concentrations in food chain of Lake Velenjsko jezero, Slovenia: An artificial lake from mining. Arch. Environ. Contam. Toxicol. 2010, 58, 998–1007. [Google Scholar] [CrossRef]
- Kenšová, R.; Čelechovská, O.; Doubravová, J.; Svobodová, Z. Concentrations of metals in tissues of fish from the Vĕstonice Reservoir. Acta Vet. Brno 2010, 79, 335–345. [Google Scholar] [CrossRef]
- Petkovšek, S.A.S.; Grudnik, Z.M.; Pokorny, B. Heavy metals and arsenic concentrations in ten fish species from the Šalek lakes (Slovenia): Assessment of potential human health risk due to fish consumption. Environ. Monit. Assess. 2012, 184, 2647–2662. [Google Scholar] [CrossRef]
- Carpene, E.; Vasak, M. Hepatic metallothionein from goldfish (Carassius auratus). Comp. Biochem. Physiol. 1989, 92B, 463–468. [Google Scholar] [CrossRef]
- Kargin, F.; Erdem, C. Accumulation of Copper in liver, spleen, stomach, intestine, gill and muscle of Cyprinus carpio, Doga. Turk. J. Zool. 1991, 15, 306–314. [Google Scholar]
- Yılmaz, A.B.; Sangün, M.K.; Yağlıoğlu, D.; Turan, C. Metals (major, essential to non essential) composition of the different tissues of three demersal fish species from İskenderun Bay, Turkey. Food Chem. 2010, 123, 410–415. [Google Scholar] [CrossRef]
- Coger, V.; Million, N.; Rehbock, C.; Sures, B.; Nachev, M.; Barcikowski, S.; Wistuba, S.; Strauß, S.; Vogt, P.M. Tissue concentrations of zinc, iron, copper, and magnesium during the phases of full thickness wound healing in a rodent model. Biol. Trace Elem. Res. 2019, 191, 167–176. [Google Scholar] [CrossRef] [PubMed]
- Paterson, S.A.; Ralston, N.V.C.; Peck, D.V.; VanSickle, J.; Robertson, J.D.; Spate, V.L.; Morris, J.S. How might selenium moderate the toxic effects of mercury in stream fish of the western U.S.? Environ. Sci. Technol. 2009, 43, 3919–3925. [Google Scholar] [CrossRef] [PubMed]
- Maktabi, P.; Javaheri Baboli, M.; Jafarnejadi, A.R.; Askary Sary, A. Mercury concentrations in common carp (Cyprinus carpio) tissues, sediment and water from fish farm along the Karoun River in Iran. Vet. Res. Forum. 2015, 6, 217–221. [Google Scholar]
- Culha, S.T.; Yabanli, M.; Baki, B.; Yozukmaz, A. Heavy metals in tissues of scorpionfish (Scorpaena porcus) caught from Black Sea (Turkey) and potential risks to human health. Environ. Sci. Pollut. Res. Int. 2016, 23, 20882–20892. [Google Scholar] [CrossRef]
- Mehanna, S.F.; Abd El-Azim, H.; Belal, A.A. Impact of metal pollution, food availability, and excessive fishing on Rhabdosargus haffara stock (family: Sparidae) in Timsah lake. Environ. Sci. Pollut. Res. Int. 2016, 23, 15888–15898. [Google Scholar] [CrossRef]
- UNEP/OCHA. Cyanide Spill at Baia Mare, Romania; UNEP/OCHA Assessment Mission Report; United Nations Environment Programme (UNEP)/Office for the Co-ordination of Humanitarian Affairs (OCHA): Geneva, Switzerland, 2000. [Google Scholar]
- Triebskorn, R.; Telcean, I.; Casper, H.; Farkas, A.; Sandu, C.; Stan, G.; Colărescu, O.; Dori, T.; Köhler, H.-R. Monitoring pollution in River Mureş, Romania, part II: Metal accumulation and histopathology in fish. Environ. Monit. Assess. 2008, 141, 177–188. [Google Scholar] [CrossRef]
- Barlas, N. A pilot study of heavy metal concentration in various environments and fishes in the Upper Sakarya River Basin, Turkey. Environ. Toxicol. 1999, 14, 367–373. [Google Scholar] [CrossRef]
- Alonso, M.L.; Montaña, F.P.; Miranda, M.; Castillo, C.; Hernández, J.; Benedito, J.L. Interactions between toxic (As, Cd, Hg and Pb) and nutritional essential (Ca, Co, Cr, Cu, Fe, Mn, Mo, Ni, Se, Zn) elements in the tissues of cattle from NW Spain. BioMetals 2004, 17, 389–397. [Google Scholar] [CrossRef]
- Belitz, H.-D.; Grosch, W.; Schieberle, P. Lehrbuch der Lebensmittelchemie; Springer: Berlin/Heidelberg, Germany, 2001; ISBN 3-540-41096-15. [Google Scholar]
- Çelik, U.; Oehlenschläger, J. Zinc and copper content in marine fish samples collected from the eastern Mediterranean sea. Eur. Food Res. Technol. 2005, 220, 37–41. [Google Scholar] [CrossRef]
- Özden, Ö.; Erkan, N.; Ulusoy, Ş. Determination of mineral composition in three commercial fish species (Solea solea, Mullus surmuletus, and Merlangius merlangus). Environ. Monit. Assess. 2010, 70, 353–363. [Google Scholar] [CrossRef] [PubMed]
- Sharma, B.; Singh, S.; Siddiqi, N.J. Biomedical implications of heavy metals induced imbalances in redox systems. Biomed. Res. Int. 2014, 2014, 640754. [Google Scholar] [CrossRef]
- Gupta, V.K.; Singh, S.; Agrawal, A.; Siddiqi, N.J.; Sharma, B. Phytochemicals mediated remediation of neurotoxicity induced by heavy metals. Biochem. Res. Int. 2015, 2015, 534769. [Google Scholar] [CrossRef]
- Arnot, J.A.; Gobas, F.A. A review of bioconcentration factor (BCF) and bioaccumulation factor (BAF) assessments for organic chemicals in aquatic organisms. Environ. Rev. 2006, 14, 257–297. [Google Scholar] [CrossRef]
- Uysal, K.; Emre, Y.; Köse, E. The determination of heavy metal accumulation ratios in muscle, skin and gills of some migratory fish species by inductively coupled plasma-optical emission spectrometry (ICP-OES) in Beymelek Lagoon (Antalya/Turkey). Microchem. J. 2008, 90, 67–70. [Google Scholar] [CrossRef]
- Saha, N.; Mollah, M.Z.I.; Alam, M.F.; Rahman, M.S. Seasonal investigation of heavy metals in marine fishes captured from the Bay of Bengal and the implications for human health risk assessment. Food Control 2016, 70, 110–118. [Google Scholar] [CrossRef]
- Tao, Y.; Yuan, Z.; Xiaona, H.; Wei, M. Distribution and bioaccumulation of heavy metals in aquatic organisms of different trophic levels and potential health risk assessment from Taihu Lake, China. Ecotoxicol. Environ. Saf. 2012, 81, 55–64. [Google Scholar] [CrossRef]
- Bosch, A.C.; O’Neill, B.; Sigge, G.O.; Kerwath, S.E.; Hoffman, L.C. Heavy metals in marine fish meat and consumer health: A review. J. Sci. Food Agric. 2016, 96, 32–48. [Google Scholar] [CrossRef] [PubMed]
- Durmaz, E.; Kocagöz, R.; Bilacan, E.; Orhan, H. Metal pollution in biotic and abiotic samples of the Büyük Menderes River, Turkey. Environ. Sci. Pollut. Res. 2017, 24, 4274–4283. [Google Scholar] [CrossRef] [PubMed]
- Türkmen, M.; Türkmen, A.; Tepe, Y. Metal contaminations in five fish species from Black, Marmara, Aegean and Mediterranean seas, Turkey. J. Chil. Chem. Soc. 2008, 53, 1424–1428. [Google Scholar] [CrossRef][Green Version]
- Türkmen, M.; Türkmen, A.; Tepe, Y.; Töre, Y.; Ateş, A. Determination of metals in fish species from Aegean and Mediterranean seas. Food Chem. 2009, 113, 233–237. [Google Scholar] [CrossRef]
- Türkmen, A.; Tepe, Y.; Türkmen, M. Determination of metals in tissues of fish species from Hurmabogazı Lagoon. Indian J. Mar. Sci. 2016, 45, 277–282. [Google Scholar]
- Griboff, J.; Wunderlin, D.A.; Monferran, M.V. Metals, As and Se determination by inductively coupled plasma-mass spectrometry (ICP-MS) in edible fish collected from three eutrophic reservoirs. Their consumption represents a risk for human health? Microchem. J. 2017, 130, 236–244. [Google Scholar] [CrossRef]
- Jarup, L. Hazards of heavy metal contamination. Br. Med. Bull. 2003, 68, 167–182. [Google Scholar] [CrossRef]
- Ko, L.Y.Y. A pilot study on the effect of heavy metals detoxification in children with chronic allergy. In Proceedings of the 6th Asia Pacific Congress of Allergology and Clinical Immunology, Tokyo, Japan, 4–7 October 2004. [Google Scholar]
- Alam, M.; Tanaka, A.; Allinson, G.; Laurenson, L.; Stagnitti, F.; Snow, E. A comparison of trace element concentrations in cultured and wild carp (Cyprinus carpio) of Lake Kasumigaura, Japan. Ecotoxicol. Environ. Saf. 2002, 53, 348–354. [Google Scholar] [CrossRef] [PubMed]


| Category | Class I | Class II | Class III | Class IV | Class V |
|---|---|---|---|---|---|
| Cd (µg/L) | 0.5 | 1 | 2 | 5 | >5 |
| Co (µg/L) | 10 | 20 | 50 | 100 | >100 |
| Cr total (µg/L) | 25 | 50 | 100 | 250 | >250 |
| Cu (µg/L) | 20 | 30 | 50 | 100 | >100 |
| Ni (µg/L) | 10 | 25 | 50 | 100 | >100 |
| Pb (µg/L) | 5 | 10 | 25 | 50 | >50 |
| Zn (µg/L) | 100 | 200 | 500 | 1000 | >1000 |
| WQI Values | Status |
|---|---|
| 0–25 | Excellent (I) |
| 26–50 | Good (II) |
| 51–75 | Poor (III) |
| 76–100 | Very poor (IV) |
| >100 | Unsuitable for drinking (V) |
| Standard Value (mg/kg) | |
|---|---|
| Cd | 0.8 |
| Cu | 40 |
| Pb | 85 |
| Zn | 150 |
| Ni | 35 |
| Organization | Metals (mg/kg) | ||||||||
|---|---|---|---|---|---|---|---|---|---|
| As | Cd | Cr | Cu | Fe | Hg | Ni | Pb | Zn | |
| FAO (1983) | 1.0 | 0.05 | 0.15–1.0 | 30 | 100 | 0.5 | 80 | 0.2 | 30 |
| FAO/WHO limit (1989) | 0.5 | - | - | 0.5 | |||||
| European Commission Regulation EC No. 1881/2006 | 0.05 | - | - | 0.5 | 0.3 | ||||
| Decree No. 365/2001 | 0.05 | - | - | 0.2 | |||||
| Heavy Metals Regulations Legal Notice No. 66/2003 | 0.05 | 0.5 | 0.2 | ||||||
| Tissues | As | Cd | Cr | Cu | Fe | Hg | Ni | Pb | Zn | Years | Ref. | Sect |
|---|---|---|---|---|---|---|---|---|---|---|---|---|
| Common carp (Cyprinus carpio) | ||||||||||||
| M | 0.01 | 0.01 | - | - | - | 0.24 | - | 0.048 | - | 2013 | [68] | I |
| 0.258 | 0.059 | - | 0.688 | 9.38 | 0.393 | - | 0.059 | 6.16 | 2013 | [94] | I | |
| 0.333 | 0.082 | - | 0.757 | 9.68 | 0.466 | - | 0.084 | 6.17 | 2013 | [94] | I | |
| 0.66 | 0.005 | 0.01 | 1.3 | 19.62 | 0.89 | - | - | 59.01 | 2010 | [95] | I | |
| 0.395 | - | - | - | 7.42 | - | - | - | 54.70 | 2010 | [96] | I | |
| 0.66 | - | - | - | - | 0.89 | - | - | 54.23 | 2010 | [48] | I | |
| 0.055 | 0.016 | - | - | - | 0.234 | - | 0.014 | - | 2010 | [97] | I | |
| 0.013 | 0.014 | - | - | - | 0.207 | - | 0.036 | - | 2012 | [66] | I | |
| - | 0.01 | - | - | - | 0.5 | - | 0.16 | - | 2018 | [96] | I | |
| - | 0.084 | - | 5.10 | - | - | - | 0.58 | 42.2 | 2008 | [98] | IV | |
| - | 0.010 | - | 3.22 | - | - | - | 0.38 | 39.20 | 2008 | [98] | V | |
| 0.412 | - | 1.1435 | 1.291 | - | 0.2315 | 1.6855 | 0.1445 | - | 2013–2014 | [99] | V | |
| - | - | - | - | - | 0.054 | - | - | - | 2014 | [85] | V | |
| Int | 0.02 | 0.10 | - | - | - | 0.22 | - | 0.21 | - | 2013 | [68] | I |
| 0.016 | 0.103 | - | - | - | 0.207 | - | 0.266 | - | 2012 | [66] | I | |
| - | - | - | 13.5 | - | - | 0.9 | - | 644 | 2003–2013 | [100] | V | |
| G | 0.29 | 0.03 | 0.01 | 1.90 | 139.26 | 0.89 | - | - | 1186.3 | 2010 | [97] | I |
| - | - | - | - | 261.97 | - | - | - | 1773.76 | 2010 | [96] | I | |
| - | - | - | 4.33 | - | - | <0.03 | - | 674 | 2003–2013 | [101] | V | |
| - | - | - | 6.13 | - | - | 9.5 | - | 872 | 2003–2013 | [101] | V | |
| Skin | - | - | - | 3.98 | - | - | <0.03 | - | 263 | 2003–2013 | [101] | V |
| - | - | - | 3.15 | - | - | 12.9 | - | 485 | 2003–2013 | [101] | V | |
| L | 0.49 | 0.28 | 0.01 | 33.49 | 141.44 | 1.63 | - | - | 325.377 | 2010 | [95] | I |
| - | - | - | 21.97 | 418.36 | - | - | - | 582.79 | 2010 | [96] | I | |
| 0.02 | 0.13 | - | - | - | 0.22 | - | 0.06 | - | 2013 | [68] | I | |
| 0.018 | 0.132 | - | - | - | 0.206 | - | 0.047 | - | 2012 | [66] | I | |
| 0.48 | - | - | - | - | 0.63 | - | - | 325.37 | 2010 | [48] | I | |
| - | - | - | 73.3 | - | - | 4.41 | - | 450 | 2003–2013 | [101] | V | |
| - | - | - | 110 | - | - | 8.17 | - | 243 | 2003–2013 | [101] | V | |
| - | - | - | 89.9 | - | - | 2.46 | - | 189 | 2003–2013 | [101] | V | |
| Gon | - | - | - | - | 6.28 | - | - | - | 74.53 | 2010 | [96] | I |
| Crucian carp (Carassius carassius, Carassius gibelio) | ||||||||||||
| M | 0.031 | 0.017 | - | - | - | 0.087 | - | 0.052 | - | 2010 | [97] | I |
| 0.139 | 0.057 | - | 0.809 | 8.05 | 0.094 | - | 0.030 | 11.16 | 2013 | [94] | I | |
| 0.172 | 0.051 | - | 0.824 | 7.25 | 0.139 | 0.040 | 10.26 | 2013 | [94] | I | ||
| 0.6045 | - | 1.345 | 1.4115 | - | 0.3 | 2.2465 | 0.1835 | - | 2013–2014 | [99] | V | |
| 0.5985 | - | 1.2085 | 1.5005 | - | 0.267 | 1.994 | 0.1675 | - | 2013–2014 | [99] | V | |
| - | - | - | - | - | 0.0255 | - | - | - | 2014 | [79] | V | |
| - | - | - | - | - | 0.073 | - | - | - | 2014 | [79] | V | |
| - | - | - | 0.715 | - | 0.15 | - | - | 11.72 | 2007 | [102] | V | |
| Freshwater bream (Abramis brama) | ||||||||||||
| M | 0.16 | 0.004 | 0.23 | 0.2 | 2.31 | 0.16 | 0.02 | 0.21 | 3.15 | 2011–2013 | [80] | I + II |
| 0.21 | 0.004 | 0.2 | 0.14 | 2.32 | 0.08 | 0.02 | 0.25 | 3.9 | 2011–2013 | [80] | I + II | |
| 0.15 | 0.004 | 0.26 | 0.17 | 1.66 | 0.15 | 0.05 | 0.23 | 4.64 | 2011–2013 | [80] | I + II | |
| 1.73 | - | 0.26 | 1.13 | 9.72 | - | - | 0.08 | - | 2014 | [103] | I | |
| 0.46 | - | 0.30 | 1.41 | 14.23 | - | - | ND | - | 2014 | [103] | I | |
| ND | - | 0.33 | 0.66 | 27.64 | - | - | ND | - | 2014 | [103] | I | |
| ND | - | 0.19 | 1.49 | 15.40 | - | - | ND | - | 2014 | [103] | I | |
| ND | - | - | - | 1.31 | - | - | - | 23.84 | 2010 | [96] | I | |
| 0.035 | 0.018 | - | - | - | 0.237 | - | 0.030 | - | 2010 | [97] | I | |
| 0.109 | 0.021 | - | 0.707 | 13.6 | 0.110 | - | 0.019 | 9.06 | 2013 | [94] | I | |
| 0.154 | 0.027 | - | 0.717 | 13.54 | 0.161 | - | 0.028 | 9.02 | 2013 | [94] | I | |
| - | 0.01 | - | - | - | 0.17 | - | 0.08 | - | 2018 | [96] | I | |
| - | 0.053 | - | 2.77 | - | - | - | 0.27 | 33.27 | 2008 | [98] | IV | |
| - | - | - | 2.15 | - | - | - | 0.29 | 35.77 | 2008 | [98] | V | |
| 0.2375 | - | 0.962 | 1.889 | - | 0.2395 | 2.6735 | 0.1685 | - | 2013–2014 | [99] | V | |
| - | - | - | - | - | 0.02–0.035 | - | - | - | 2014 | [79] | V | |
| L | 0.22 | - | 0.25 | 44.25 | 177.56 | - | - | 0.20 | - | 2014 | [103] | I |
| 0.14 | - | 0.18 | 22.07 | 225.11 | - | - | 0.05 | - | 2014 | [103] | I | |
| ND | - | 0.20 | 44.06 | 190.35 | - | - | 0.47 | - | 2014 | [103] | I | |
| ND | - | 0.21 | 64.66 | 177.74 | - | - | 0.11 | - | 2014 | [103] | I | |
| ND | - | - | 14.14 | 213.53 | - | - | - | 66.77 | 2010 | [96] | I | |
| G | ND | - | 1.32 | 2.11 | 428.22 | - | - | 0.23 | - | 2014 | [103] | I |
| 3.2 | - | 0.91 | 0.85 | 158.45 | - | - | 0.12 | - | 2014 | [103] | I | |
| ND | - | 3.71 | 1.76 | 167.64 | - | - | ND | - | 2014 | [103] | I | |
| ND | - | 0.76 | 0.98 | 117 | - | - | ND | - | 2014 | [103] | I | |
| ND | - | - | ND | 369.21 | - | - | - | 59.85 | 2010 | [96] | I | |
| Gon | 1.75 | - | 0.08 | 1.16 | 20.67 | - | - | 0.08 | - | 2014 | [103] | I |
| 1.21 | - | 0.18 | 1.54 | 33.80 | - | - | 0.08 | - | 2014 | [103] | I | |
| 1.61 | - | 0.10 | 1.31 | 28.12 | - | - | 0.09 | - | 2014 | [103] | I | |
| 1.04 | - | 0.21 | 0.81 | 29.26 | - | - | ND | - | 2014 | [103] | I | |
| 0.15 | - | - | ND | 19.24 | - | - | - | 137.76 | 2010 | [1] | I | |
| Grass carp (Ctenopharyngodon idella) | ||||||||||||
| M | 0.039 | 0.018 | - | - | - | 0.367 | - | 0.034 | - | 2010 | [97] | I |
| W.B. | 48.5 | - | 0.03 | - | 11.6 | <7.3 | 109 | - | 15.4 | 2011 | [104] | I |
| Silver carp (Hypophthalmichthys molitrix) | ||||||||||||
| M | ND | - | - | ND | 12.53 | - | - | - | 31.90 | 2010 | [96] | I |
| 0.018 | 0.015 | - | - | - | 0.441 | - | 0.015 | - | 2010 | [97] | I | |
| 0.036 | 0.014 | - | - | - | 0.140 | - | 0.048 | - | 2012 | [66] | I | |
| 0.04 | 0.01 | - | - | - | 0.16 | - | 0.056 | - | 2013 | [68] | I | |
| L | 0.08 | 0.21 | - | - | - | 0.20 | - | 0.14 | - | 2013 | [68] | I |
| 0.21 | - | - | 188.78 | 511.72 | - | - | - | 222.40 | 2010 | [96] | I | |
| 0.073 | 0.191 | - | - | - | 0.185 | - | 0.125 | - | 2012 | [66] | I | |
| G | ND | - | - | ND | 211.88 | - | - | - | 73.72 | 2010 | [96] | I |
| Int | 0.065 | 0.062 | - | - | - | 0.253 | - | 1.518 | - | 2012 | [66] | I |
| 0.07 | 0.07 | - | - | - | 0.26 | - | 1.3 | - | 2013 | [68] | I | |
| W.B. | 58.7 | - | 0.24 | - | 51.4 | <13 | 284 | - | 82.5 | 2011 | [105] | I |
| Pontic shad (Alosa immaculata) | ||||||||||||
| M | 7.725 | 0.433 | - | 4.074 | 40.346 | - | - | - | 66.098 | 2007–2008 | [65] | III |
| 12.6 | 0.17 | - | 3.45 | 143.26 | - | - | 0.13 | 58.4 | 2010 | [106] | III | |
| 6.53 | 0.31 | - | 15.5 | 269 | - | - | 0.35 | 44.1 | 2010 | [106] | III | |
| - | 0.091 | - | 5.34 | - | - | - | 0.65 | 44.55 | 2008 | [98] | IV | |
| - | 0.012 | - | 3.3 | - | - | - | 0.45 | 41.45 | 2008 | [98] | V | |
| L | 9.4 | 20.8 | - | 34.2 | 1225 | - | - | 0.27 | 83.5 | 2010 | [106] | III |
| 6.389 | 0.714 | - | 20.003 | 751.814 | - | - | - | 99.759 | 2007–2008 | [65] | III | |
| G | 1.63 | 0.219 | - | 2.987 | 289.506 | - | - | - | 80.507 | 2007–2008 | [65] | III |
| Wels catfish (Silurus glanis) | ||||||||||||
| M | 0.1 | 0.09 | 0.145 | 0.07 | 0.95 | 0.33 | 0.074 | 0.17 | 7.62 | 2011–2013 | [80] | I + II |
| 0.09 | 0.001 | 0.13 | 0.07 | 1.33 | 0.2 | 0.016 | 0.18 | 2.97 | 2011–2013 | [80] | I + II | |
| 0.11 | 0.004 | 0.14 | 0.07 | 0.55 | 0.62 | 0.03 | 0.16 | 3 | 2011–2013 | [80] | I + II | |
| ND | ND | ND | ND | ND | ND | ND | ND | 7.91 | 2010 | [96] | I | |
| 0.034 | 0.02 | - | - | - | 0.235 | - | 0.032 | - | 2010 | [97] | I | |
| 0.22 | 0.01 | 0.08 | 1.42 | 27.06 | 1.63 | - | - | 20.81 | 2011 | [97] | I | |
| 0.003 | 0.008 | - | - | - | 0.327 | - | 0.014 | - | 2012 | [66] | I | |
| 0.131 | 0.004 | 0.138 | 0.949 | 19.46 | 1.598 | 0.120 | 0.006 | 19.62 | 2013 | [100] | I | |
| 0.003 | 0.01 | - | - | - | 0.53 | - | 0.06 | - | 2013 | [68] | I | |
| 0.160 | 0.068 | - | 1.55 | 8.32 | 0.208 | - | 0.058 | 7.06 | 2013 | [94] | I | |
| 0.211 | 0.069 | - | 1.62 | 8.17 | 0.260 | - | 0.069 | 6.68 | 2013 | [94] | I | |
| 0.7635 | - | 3.638 | 1.9455 | - | 0.235 | 1.823–4.089 | 0.145–0.382 | - | 2013–2014 | [99] | V | |
| - | - | - | - | - | 0.014–0.042 | - | - | - | 2014 | [79] | V | |
| G | ND | - | - | 160.11 | 54.93 | - | - | - | 53.77 | 2010 | [96] | I |
| 0.16 | 0.07 | 0.06 | 1.98 | 74.88 | 1.50 | - | - | 58.05 | 2010 | [97] | I | |
| 0.008 | - | 0.270 | 4.460 | 163.0 | 0.328 | 0.170 | 0.236 | 80.42 | 2013 | [107] | I | |
| 0.117 | 0.005 | 0.090 | 0.412 | 43.98 | 0.071 | 0.211 | 0.387 | 69.81 | 2013 | [100] | I | |
| L | ND | - | - | ND | 412.29 | - | - | - | 38.69 | 2010 | [96] | I |
| 0.24 | 0.02 | 0.04 | 8.37 | 396.16 | 1.90 | - | - | 41.52 | 2010 | [97] | I | |
| 0.004 | 0.064 | - | - | - | 0.143 | - | 0.034 | - | 2012 | [66] | I | |
| 0.096 | - | 0.010 | 17.77 | 745.7 | 0.639 | 0.060 | 0.067 | 93.14 | 2013 | [107] | I | |
| 0.005 | 0.12 | - | - | - | 0.23 | - | 0.10 | - | 2013 | [68] | I | |
| Int | 0.005 | 0.101 | - | - | - | 0.167 | - | 0.036 | - | 2012 | [66] | I |
| 0.006 | 0.14 | - | - | - | 0.30 | - | 0.10 | - | 2013 | [68] | I | |
| Skin | 0.360 | 0.005 | 0.154 | 1.902 | 25.86 | 0.657 | 0.244 | 0.009 | 58.95 | 2013 | [100] | I |
| W.B | < 29 | - | 0.062 | - | 13.7 | <3.1 | 84 | - | 12.4 | 2011 | [105] | I |
| Gon | 0.960 | - | 0.100 | 2.200 | 99.29 | 0.114 | 0.220 | 0.018 | 134.3 | 2013 | [107] | I |
| Pike-perch (Sander lucioperca) | ||||||||||||
| M | 0.11 | 0.003 | 0.18 | 0.09 | 0.81 | 0.15 | 0.01 | 0.25 | 2.74 | 2011–2013 | [80] | I + II |
| 0.13 | 0.04 | 0.18 | 0.11 | 2.35 | 0.3 | 0.016 | 0.23 | 3.76 | 2011–2013 | [80] | I + II | |
| 0.15 | 0.002 | 0.11 | 0.11 | 4.63 | 0.28 | 0.08 | 0.18 | 3.07 | 2011–2013 | [80] | I + II | |
| 0.032 | 0.018 | - | - | - | 0.173 | - | 0.043 | - | 2010 | [97] | I | |
| 0.17 | 0.005 | 0.043 | 0.75 | 17.97 | 1.32 | - | - | 15.14 | 2010 | [95] | I | |
| 0.199–0.219 | - | 0.708–1.587 | 0.979–1.244 | - | 0.205–0.223 | 2.084–3.543 | 0.091–0.143 | - | 2013–2014 | [99] | V | |
| - | - | - | - | - | 0.016–0.041 | - | - | - | 2014 | [79] | V | |
| L | 0.50 | 0.02 | 0.04 | 6.18 | 241.07 | 1.66 | - | - | 58.37 | 2010 | [95] | I |
| G | 0.25 | 0.01 | 0.02 | 1.01 | 73.01 | 1.52 | - | - | 40.11 | 2010 | [95] | I |
| Barbel (Barbus barbus) | ||||||||||||
| M | 0.84 | - | - | 4.8 | 11.12 | 2.15 | - | - | 10.06 | 2010 | [108] | I |
| 1.4 | - | - | ND | ND | - | - | - | 12.89 | 2010 | [109] | I | |
| 1.57 | - | 0.41 | 1.90 | - | 0.27 | 0.19 | 0.11 | 18.37 | 2012 | [110] | I | |
| 0.189 | 0.052 | - | 0.826 | 12.22 | 0.222 | - | 0.048 | 5.2 | 2013 | [94] | I | |
| 0.239 | 0.062 | - | 0.839 | 11.91 | 0.325 | - | 0.062 | 6.02 | 2013 | [94] | I | |
| L | 1.488 | 0.014 | - | 19.63 | 74.81 | - | 14.88 | - | 25.65 | 2010 | [108] | I |
| 0.54 | - | - | 27.49 | 78.82 | - | - | - | 47.08 | 2010 | [109] | I | |
| 1.74 | - | 0.37 | 25.85 | - | 0.09 | 0.16 | 0.12 | 59.50 | 2012 | [110] | I | |
| G | 0.001 | - | - | 12.15 | 106.22 | 1.187 | 0.96 | - | 40.59 | 2010 | [108] | I |
| 0.59 | - | - | ND | 120.91 | - | - | - | 47.85 | 2010 | [109] | I | |
| 0.85 | - | 0.64 | 2.68 | - | 0.02 | 0.22 | ND | 68.33 | 2012 | [110] | I | |
| Gon | 1.41 | - | - | ND | ND | - | - | - | 71.69 | 2010 | [109] | I |
| M | - | 0.01 | - | - | - | 0.09 | - | 0.15 | - | 2018 | [111] | I |
| Int | 1.80 | - | 0.57 | 5.81 | - | ND | 0.33 | 0.37 | 49.76 | 2012 | [110] | I |
| Northern pike (Esox lucius) | ||||||||||||
| M. | 0.030 | 0.015 | - | - | - | 0.236 | - | 0.036 | - | 2010 | [97] | I |
| 0.105 | 0.023 | - | 0.548 | 10.10 | 0.106 | - | 0.032 | 5.10 | 2013 | [94] | I | |
| 0.153 | 0.036 | - | 0.574 | 9.97 | 0.162 | - | 0.037 | 5.17 | 2013 | [94] | I | |
| - | 0.044 | - | 2.9 | - | - | - | 0.36 | 23.9 | 2008 | [98] | IV | |
| - | - | - | 1.5 | - | - | - | 0.26 | 21.92 | 2008 | [98] | V | |
| 0.173–1.199 | - | 0.781–2.071 | 0.901–2.696 | - | 0.182–0.428 | 1.892–3.601 | 0.060–0.270 | - | 2013–2014 | [99] | V | |
| - | - | - | - | - | 0.021–0.058 | - | - | - | 2014 | [79] | V | |
| European perch (Perca fluviatilis) | ||||||||||||
| M | 1.00 | ND | 0.09 | 0.45 | 11.85 | 2.72 | ND | - | 18.89 | 2011 | [111] | I |
| - | 0.034 | - | 3.85 | - | - | - | 0.19 | 32.33 | 2008 | [98] | IV | |
| - | - | - | 1.25 | - | - | - | 0.33 | 32.36 | 2008 | [98] | V | |
| 0.150–0.341 | - | 0.248–3.063 | 1.588–2.319 | - | 0.190–0.417 | 1.252–3.353 | 0.182–0.582 | - | 2013–2014 | [99] | V | |
| - | - | - | - | - | 0.012–0.038 | - | - | - | 2014 | [79] | V | |
| - | - | - | 0.26–0.37 | - | 0.29–0.35 | - | - | 6.13–6.36 | 2007 | [102] | V | |
| L | 3.03 | ND | 0.11 | 18.20 | 225 | 2.52 | ND | - | 77.66 | 2011 | [111] | I |
| G | 1.11 | ND | 0.25 | 0.66 | 189.39 | 1.84 | ND | - | 64.82 | 2011 | [111] | I |
| Gon | 1.43 | ND | 0.11 | 2.21 | 53.98 | 1.19 | ND | - | 68.06 | 2011 | [111] | I |
Disclaimer/Publisher’s Note: The statements, opinions and data contained in all publications are solely those of the individual author(s) and contributor(s) and not of MDPI and/or the editor(s). MDPI and/or the editor(s) disclaim responsibility for any injury to people or property resulting from any ideas, methods, instructions or products referred to in the content. |
© 2023 by the authors. Licensee MDPI, Basel, Switzerland. This article is an open access article distributed under the terms and conditions of the Creative Commons Attribution (CC BY) license (https://creativecommons.org/licenses/by/4.0/).
Share and Cite
Cordeli, A.N.; Oprea, L.; Crețu, M.; Dediu, L.; Coadă, M.T.; Mînzală, D.-N. Bioaccumulation of Metals in Some Fish Species from the Romanian Danube River: A Review. Fishes 2023, 8, 387. https://doi.org/10.3390/fishes8080387
Cordeli AN, Oprea L, Crețu M, Dediu L, Coadă MT, Mînzală D-N. Bioaccumulation of Metals in Some Fish Species from the Romanian Danube River: A Review. Fishes. 2023; 8(8):387. https://doi.org/10.3390/fishes8080387
Chicago/Turabian StyleCordeli (Săvescu), Anca Nicoleta, Lucian Oprea, Mirela Crețu, Lorena Dediu, Marian Tiberiu Coadă, and Diana-Nicoleta Mînzală. 2023. "Bioaccumulation of Metals in Some Fish Species from the Romanian Danube River: A Review" Fishes 8, no. 8: 387. https://doi.org/10.3390/fishes8080387
APA StyleCordeli, A. N., Oprea, L., Crețu, M., Dediu, L., Coadă, M. T., & Mînzală, D.-N. (2023). Bioaccumulation of Metals in Some Fish Species from the Romanian Danube River: A Review. Fishes, 8(8), 387. https://doi.org/10.3390/fishes8080387