
Lionfish Diet Composition at Three Study Sites in the Aegean Sea: An Invasive Generalist?


 , ,
, ,
Abstract
1. Introduction
2. Materials and Methods
2.1. Ethics Statement
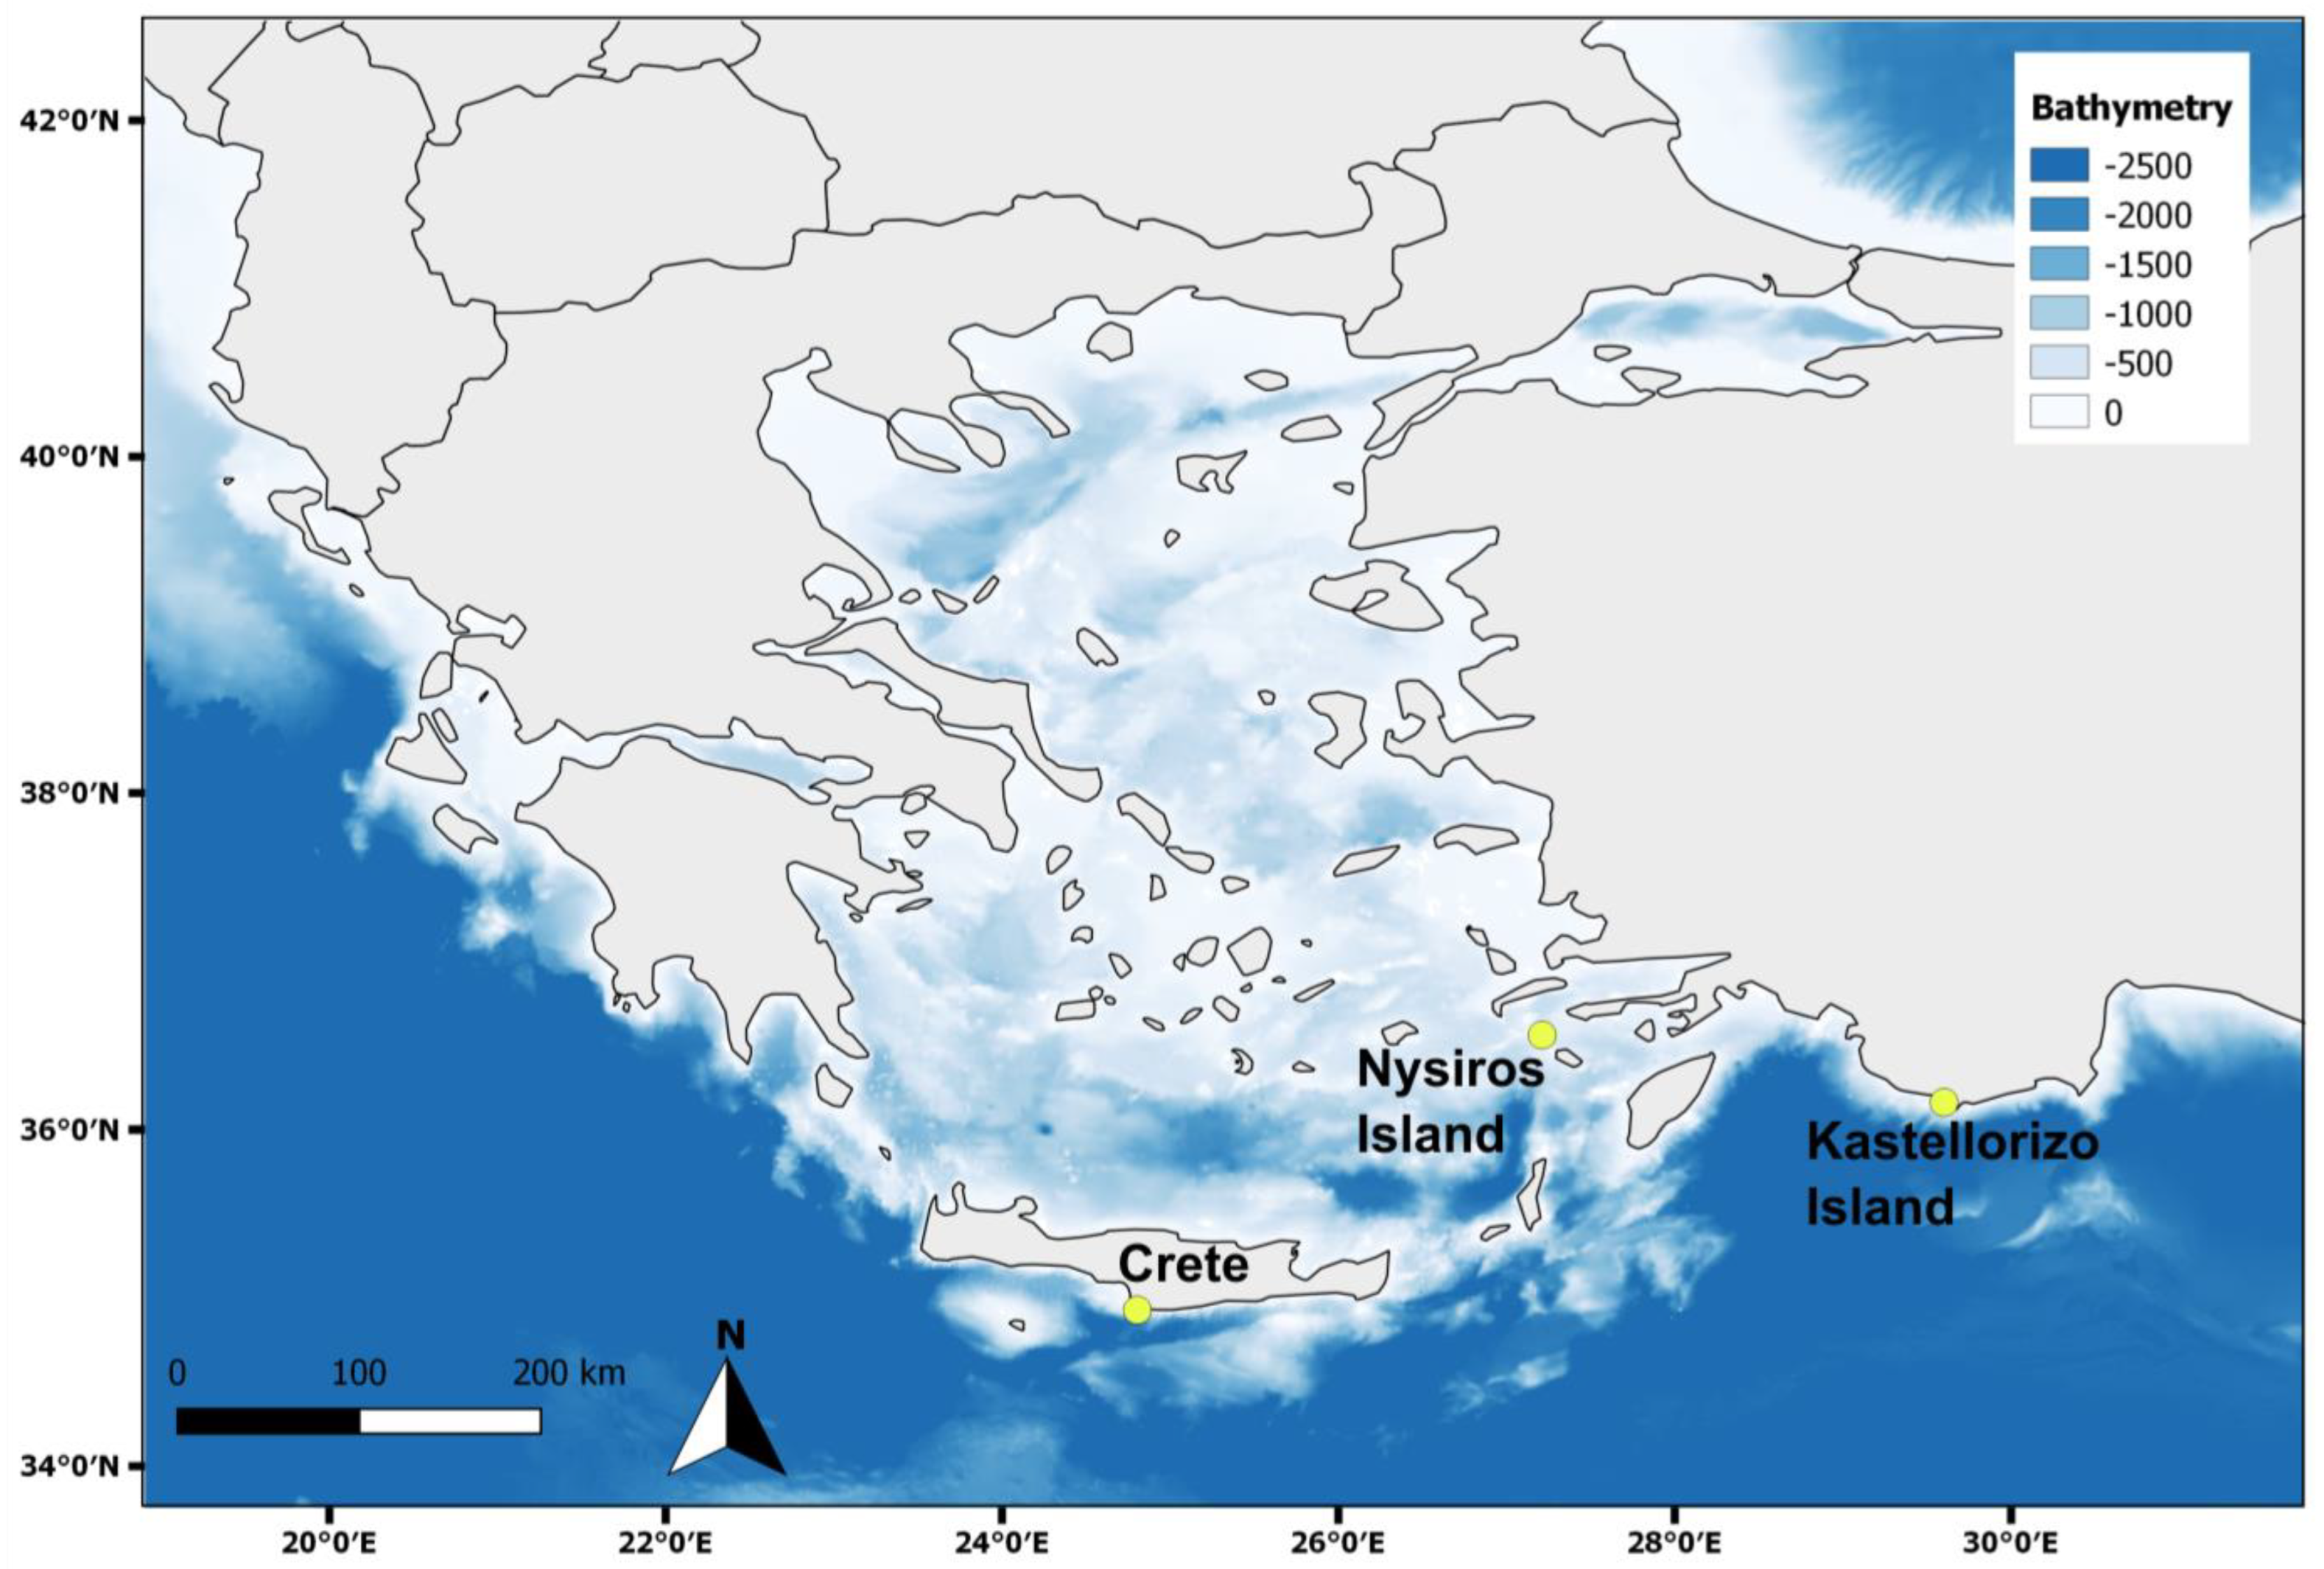
2.2. Sample Collection
2.3. Lab Work
2.4. Data Analysis
- (i)
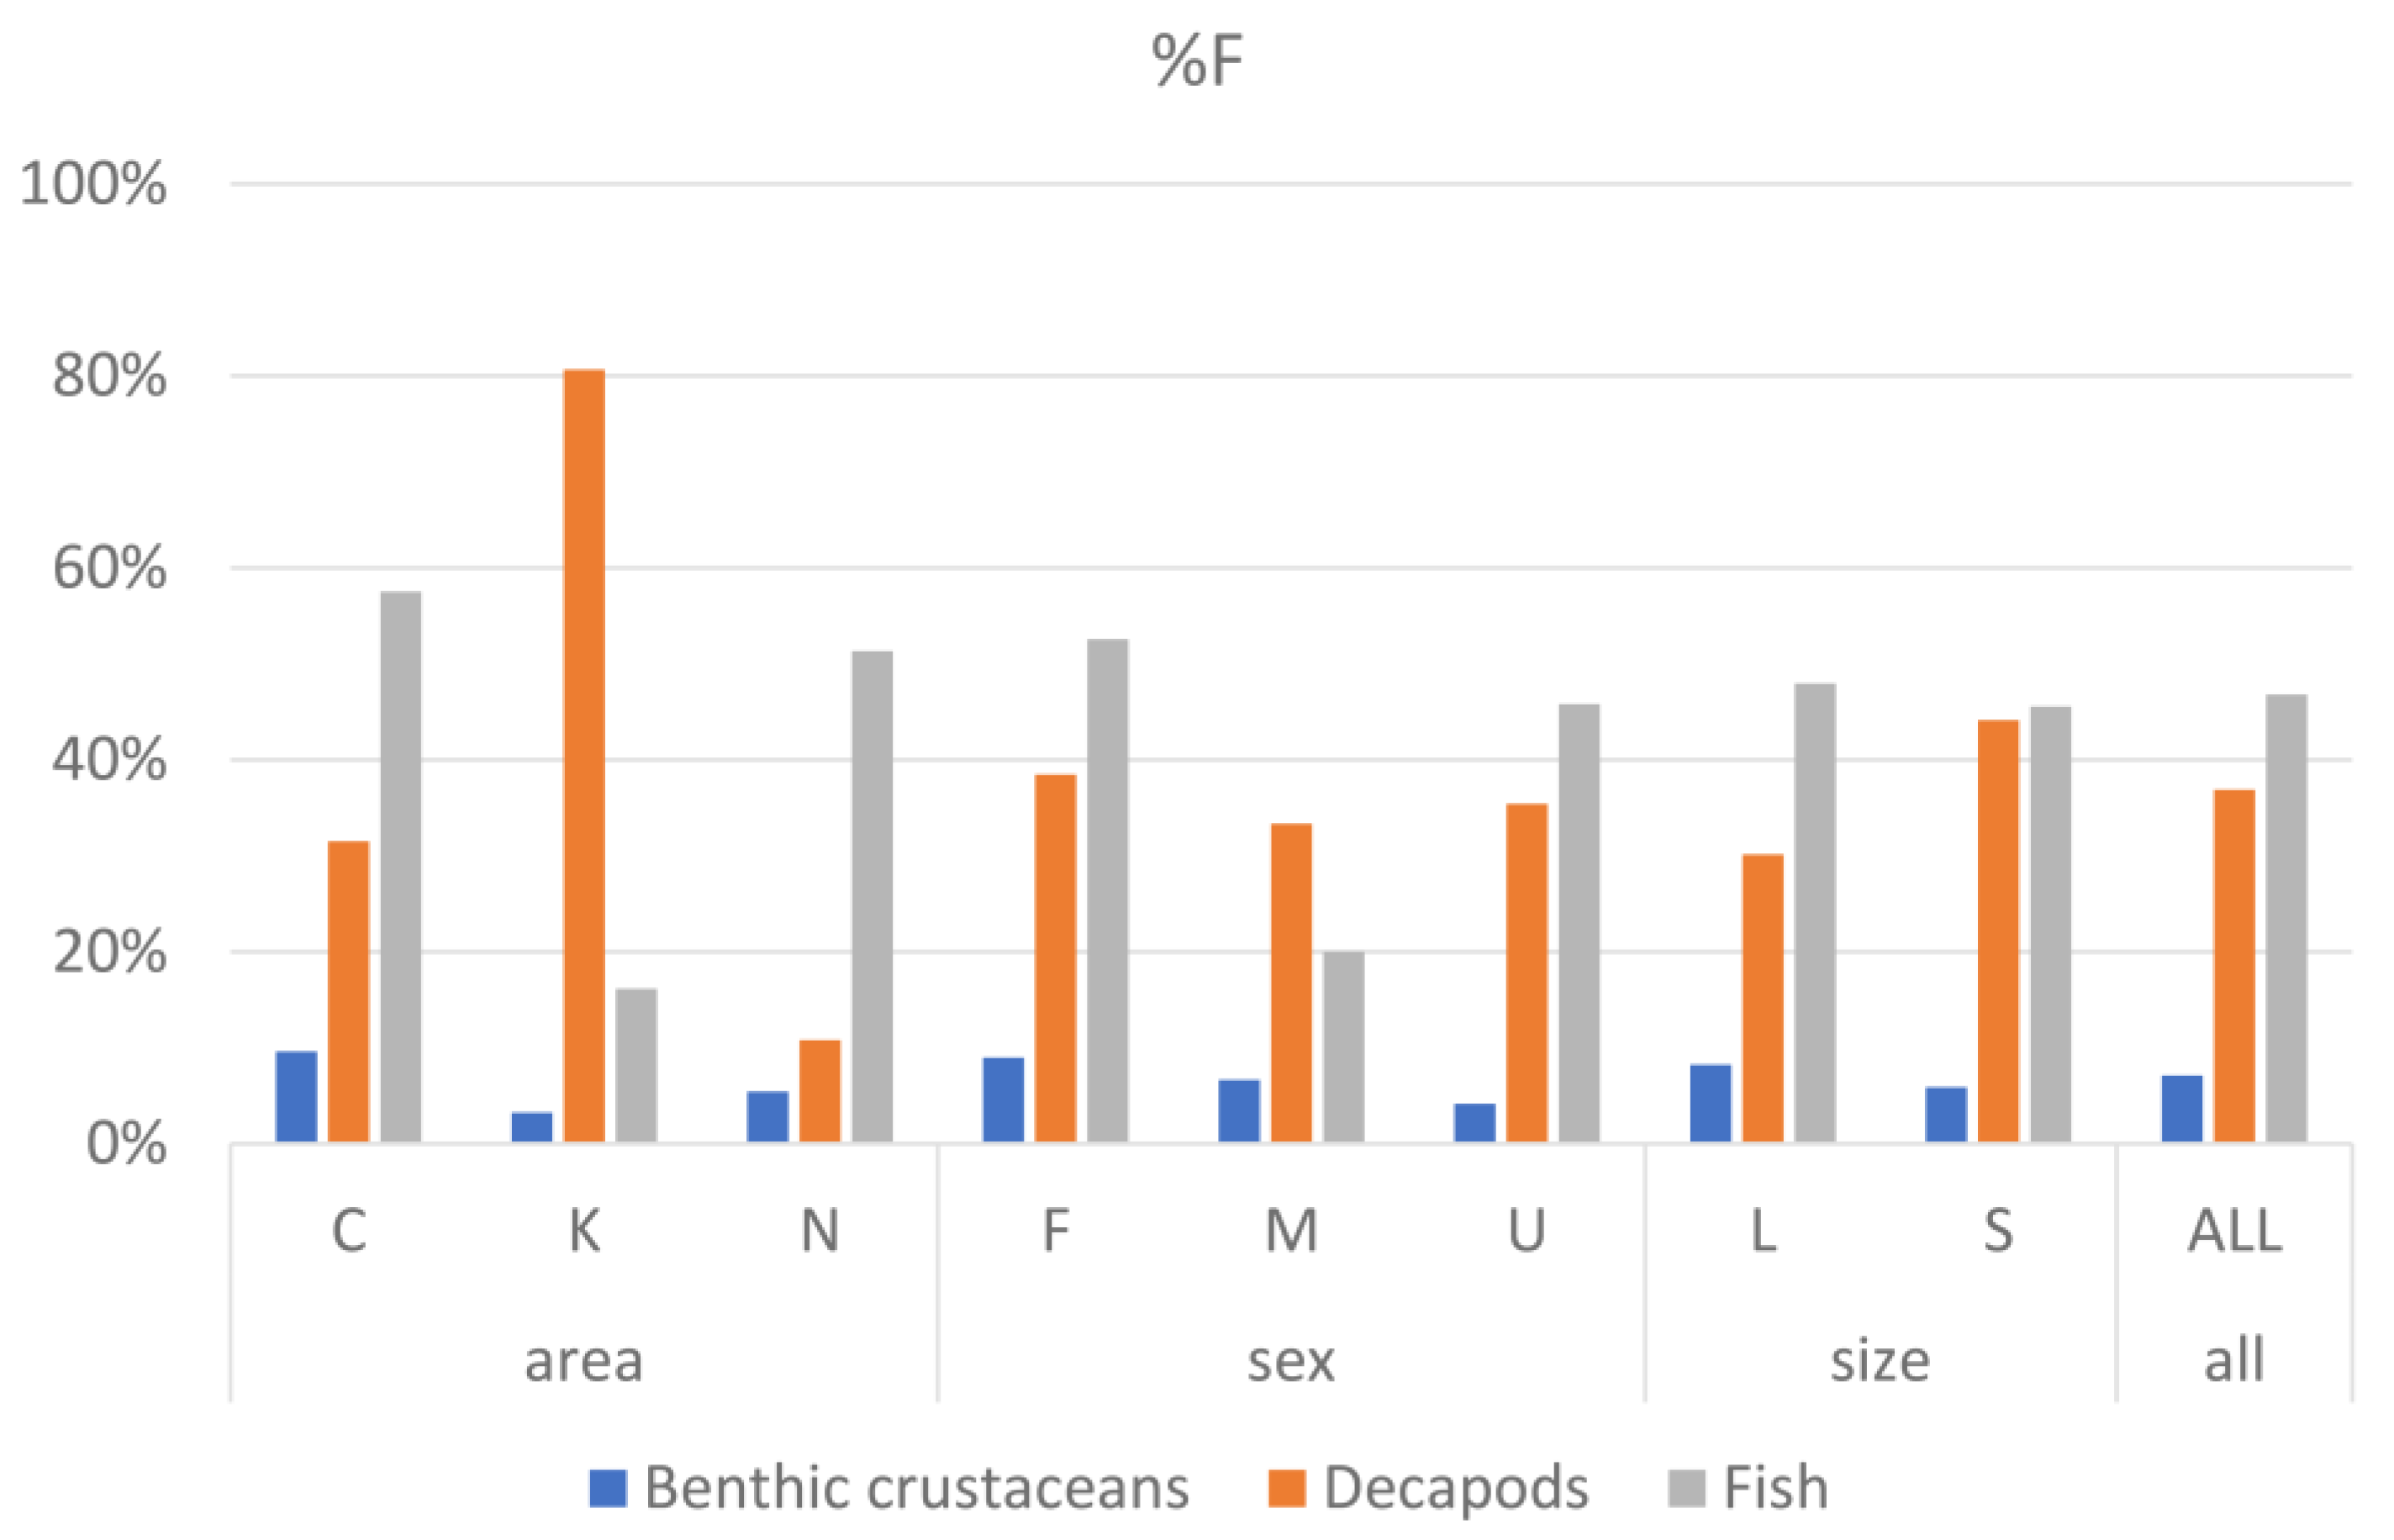
- Frequency of occurrence:where %F is the frequency of occurrence of prey taxon i in the analyzed stomachs, Si is the number of stomachs in the analysis containing items of prey taxon i, and Sf is the total number of stomachs in the analysis.%F = Si × 100/Sf
- (ii)
- Numerical:where %N is the relative numerical abundance of prey taxon i, ni is the total number of prey i items, and Σni the total number of all prey items in all stomachs in the analysis.%N = ni ×100/Σni
3. Results
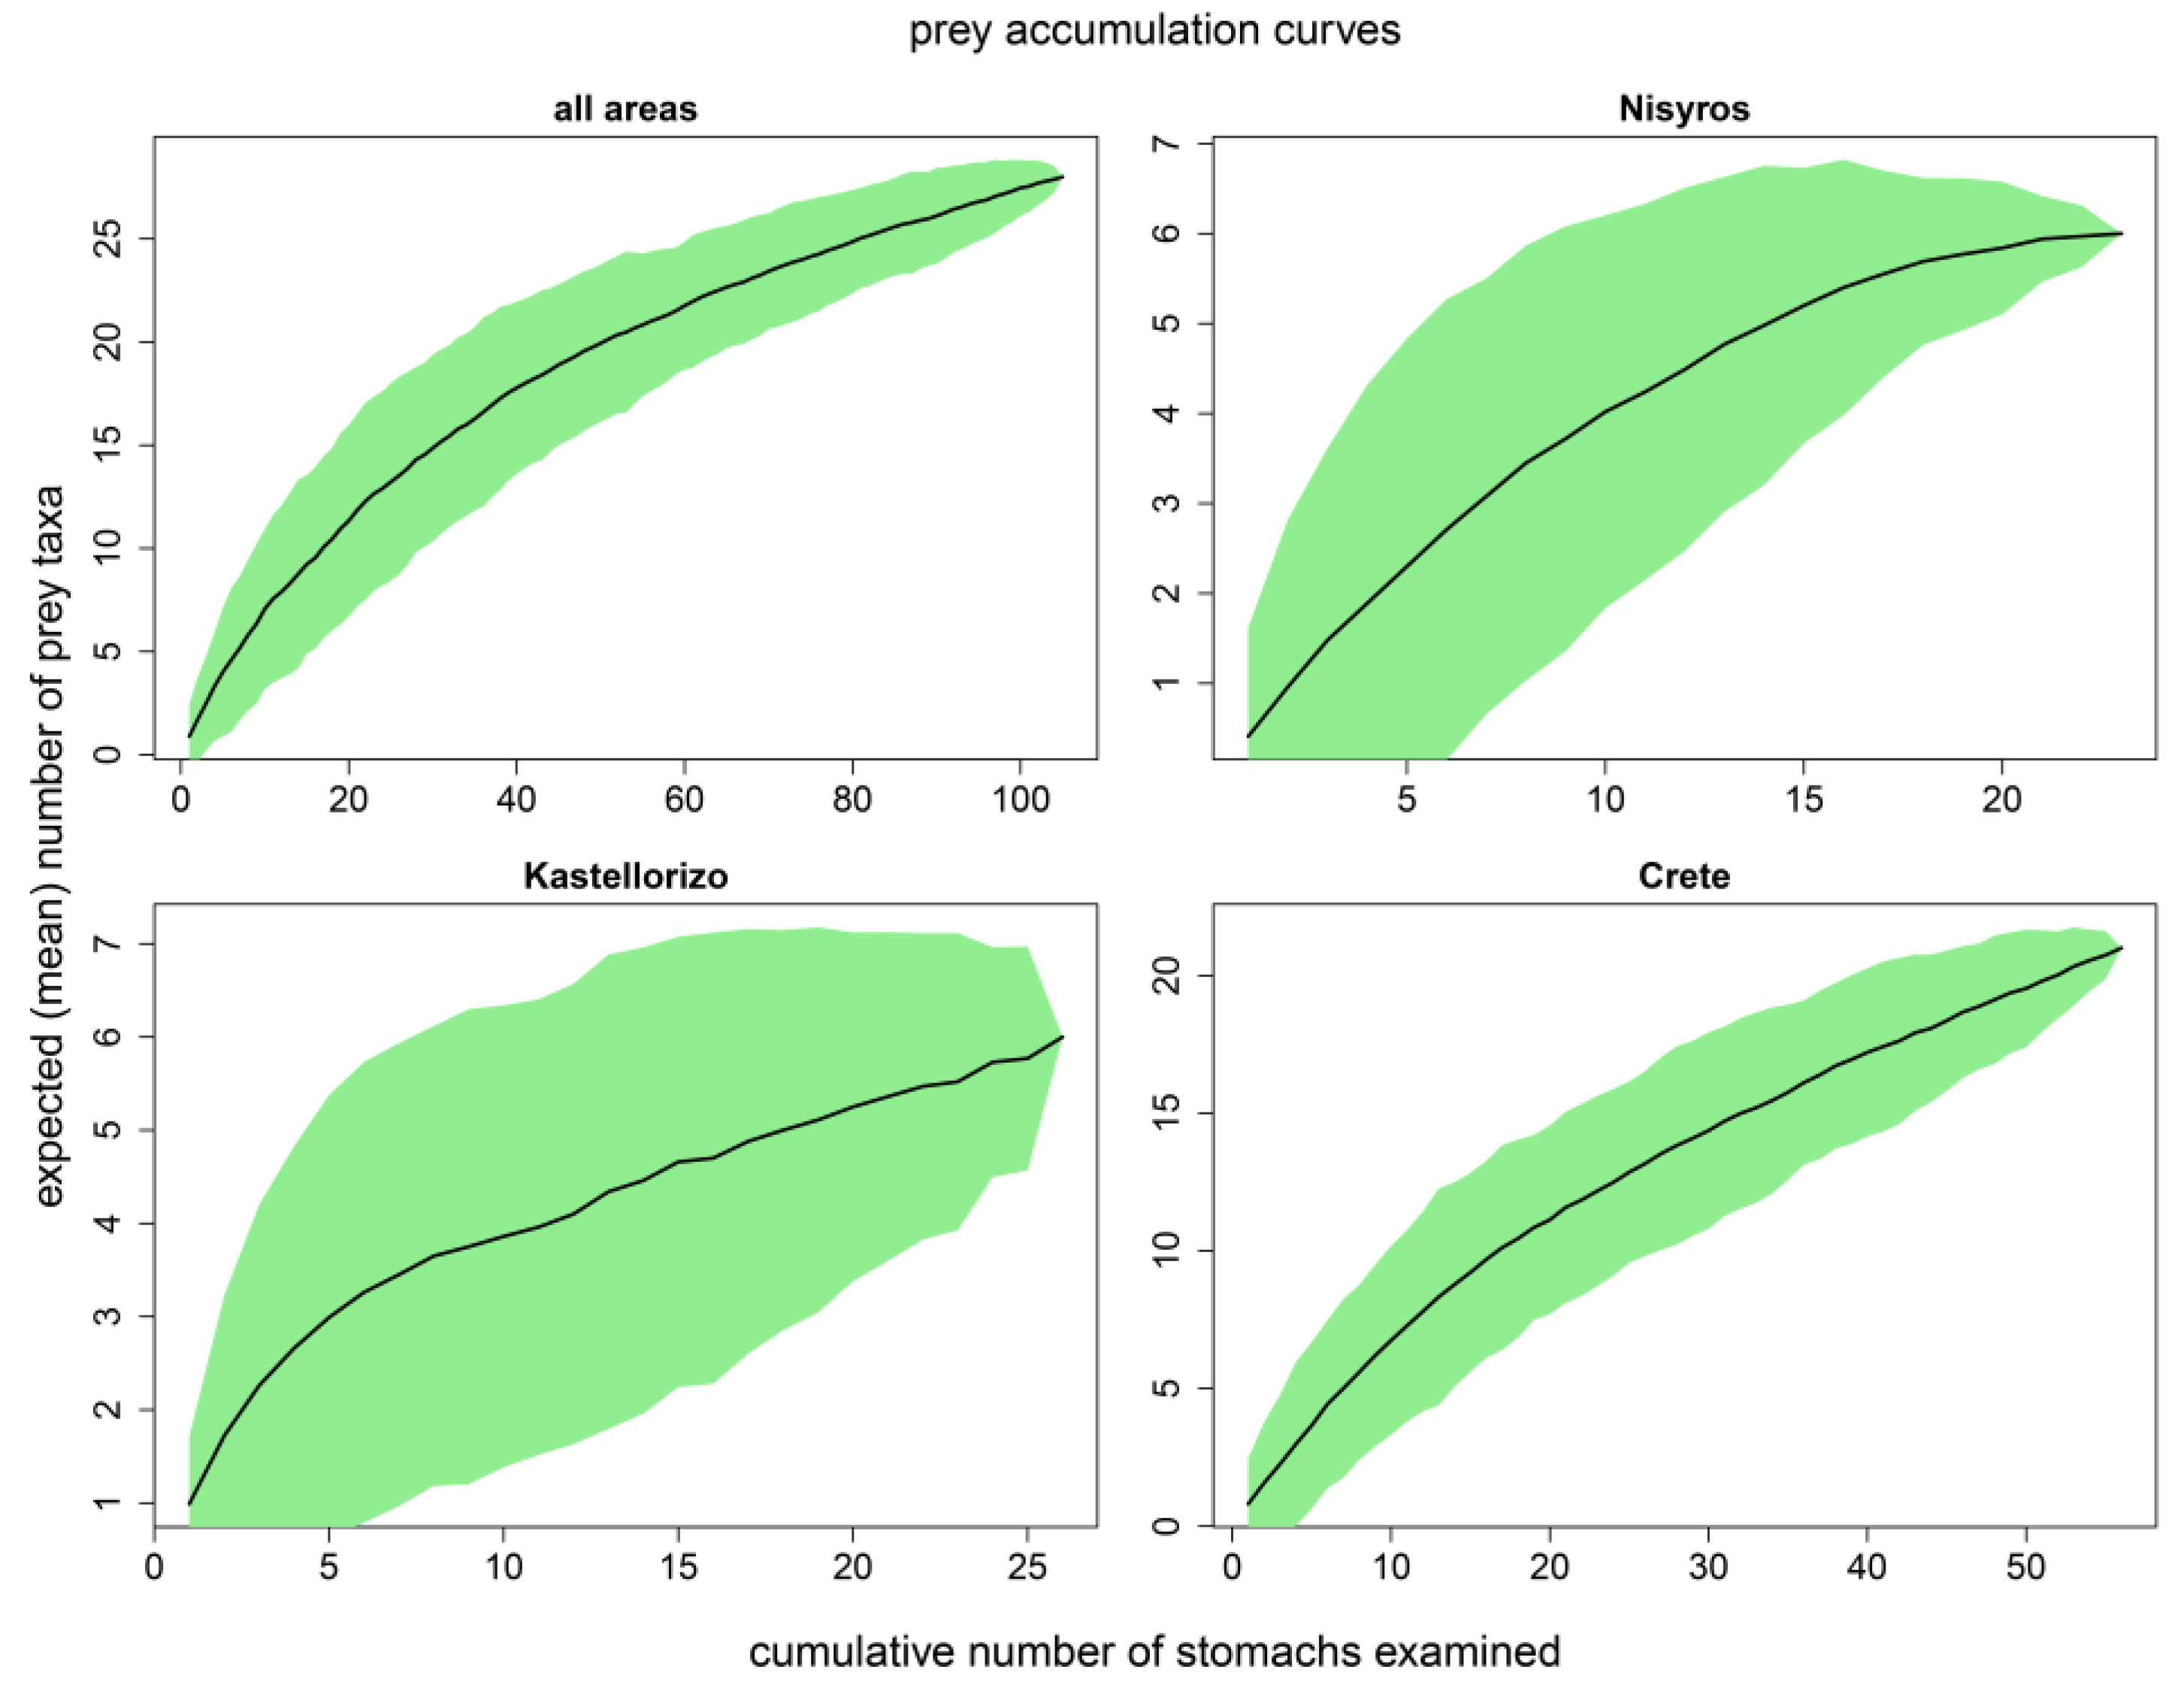
3.1. Sample Size Adequacy
3.2. Pterois miles Feeding Intensity
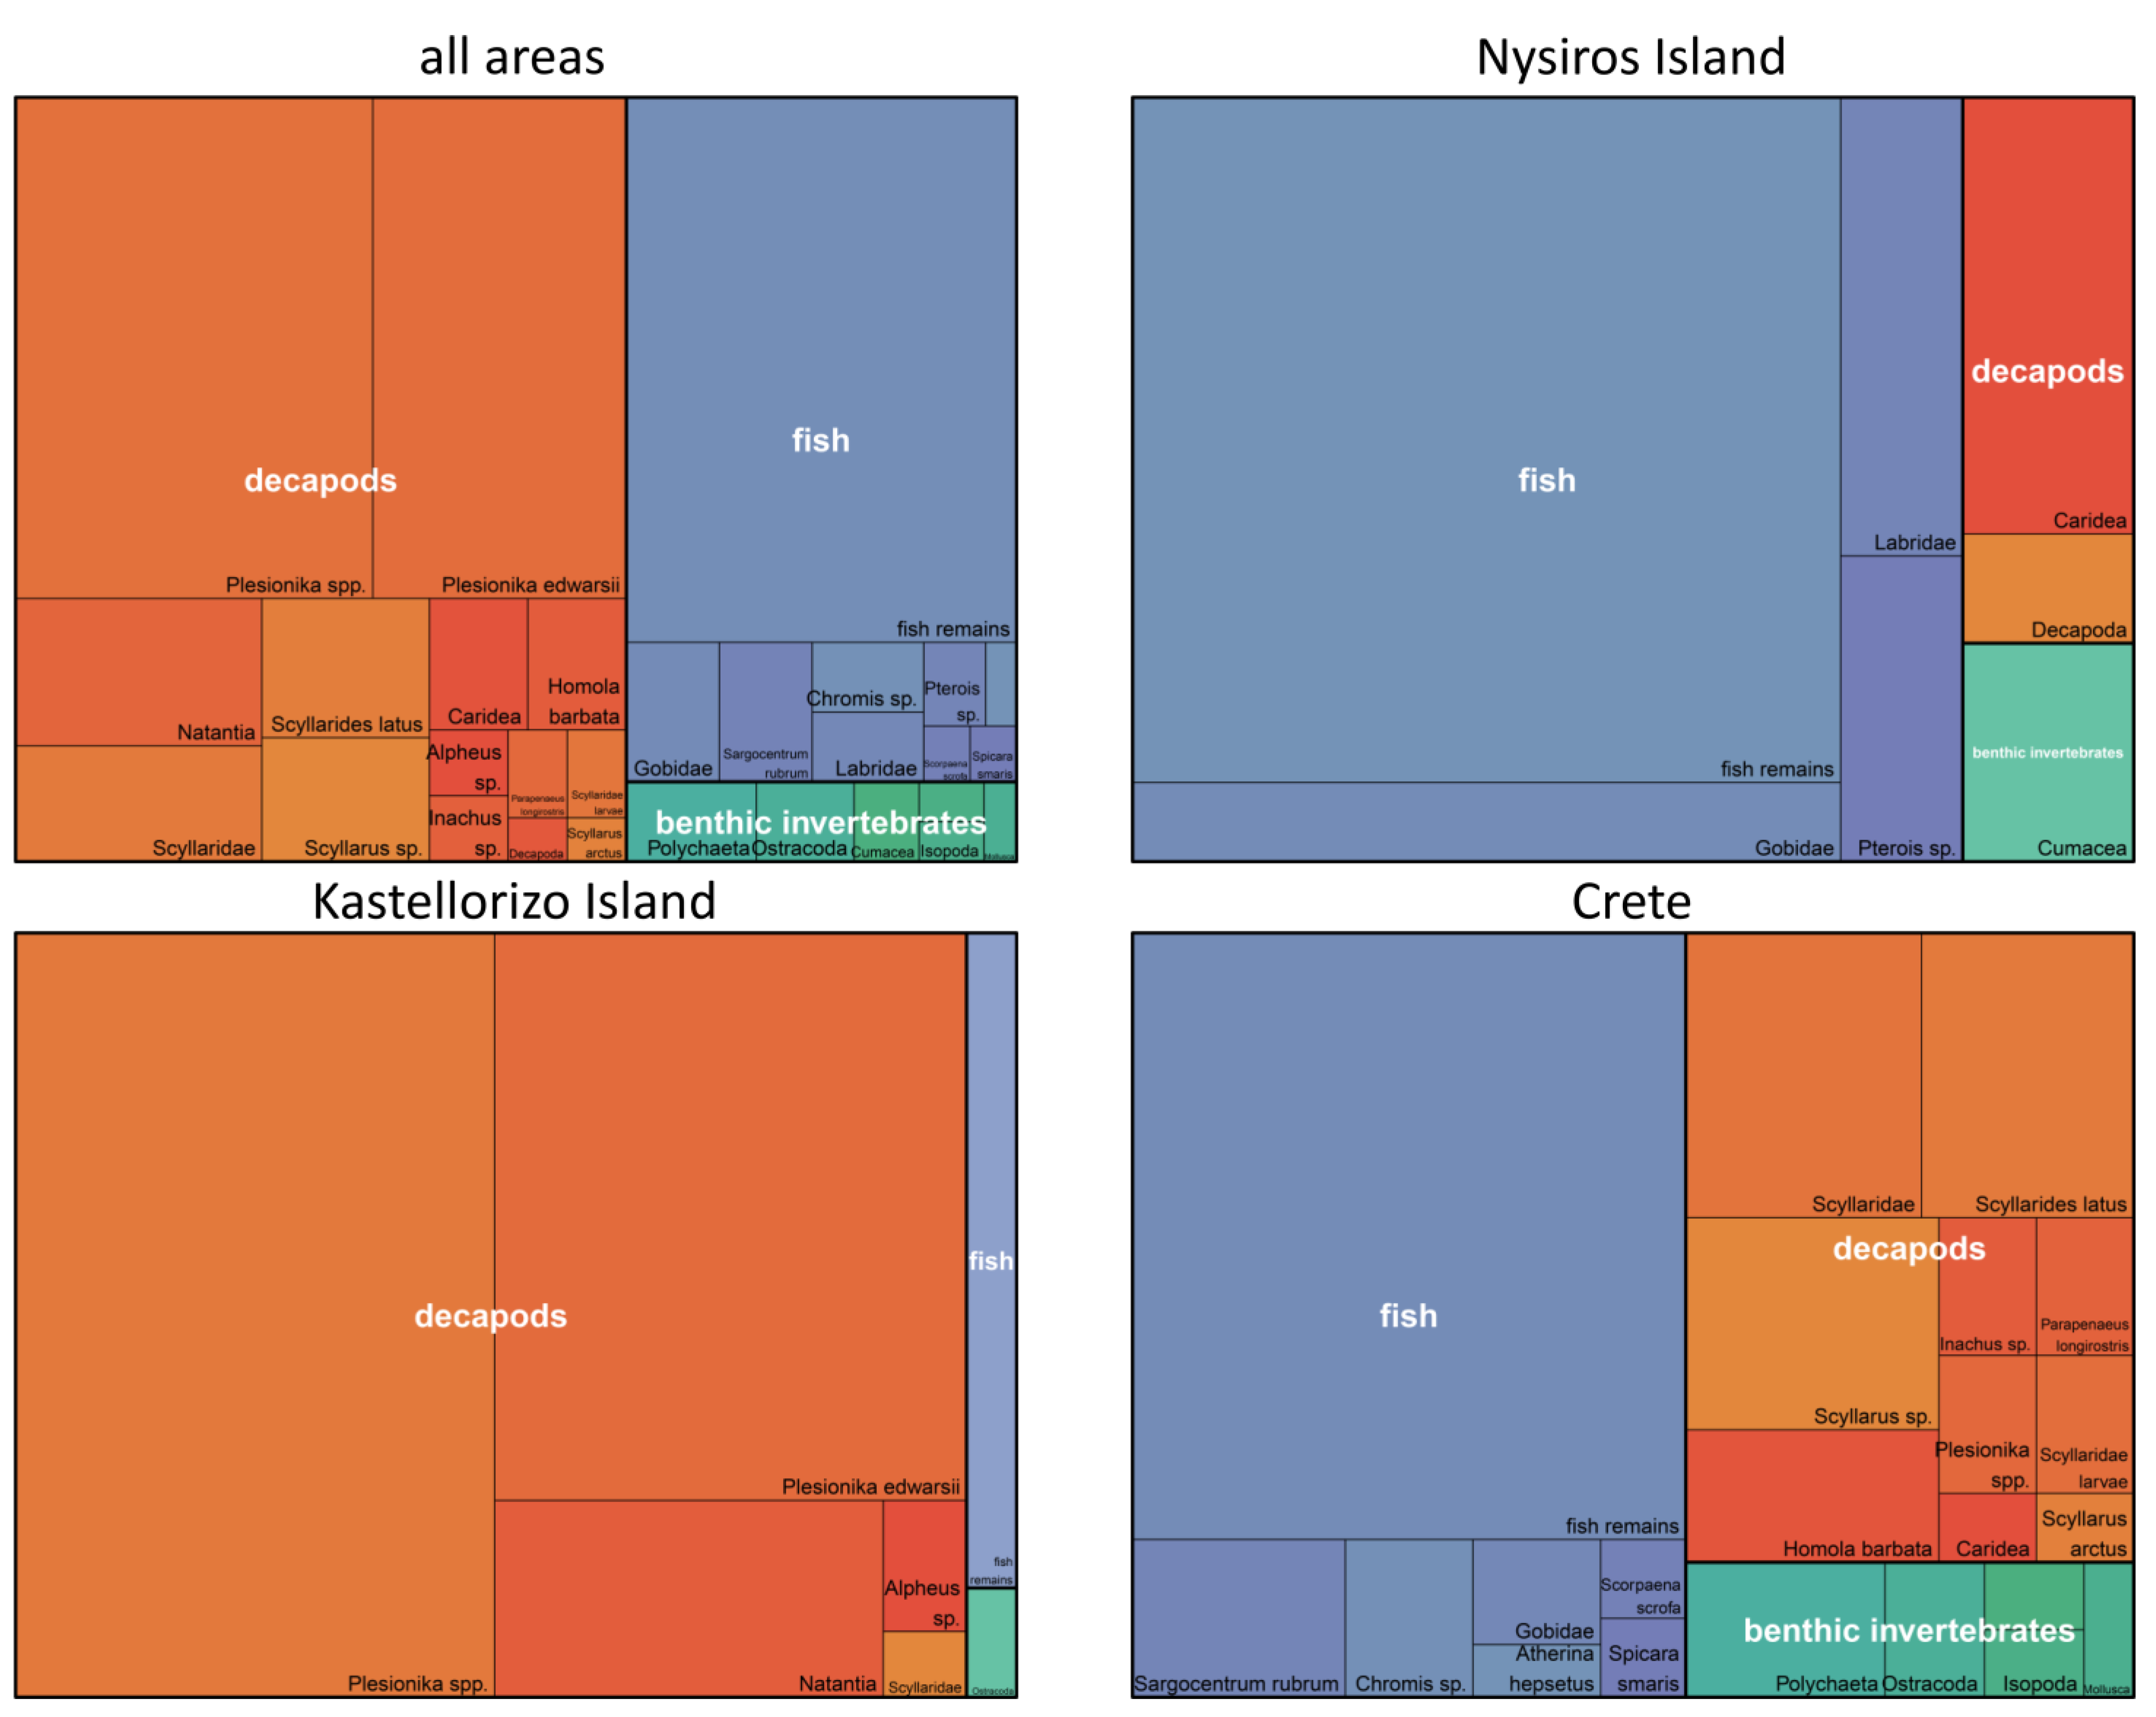
3.3. Contribution of Prey Taxa to P. miles Diet
3.4. Multivariate Analysis of P. miles Diet Composition
3.5. Pterois miles Diet Overlap between Areas, Sexes, and Size Classes
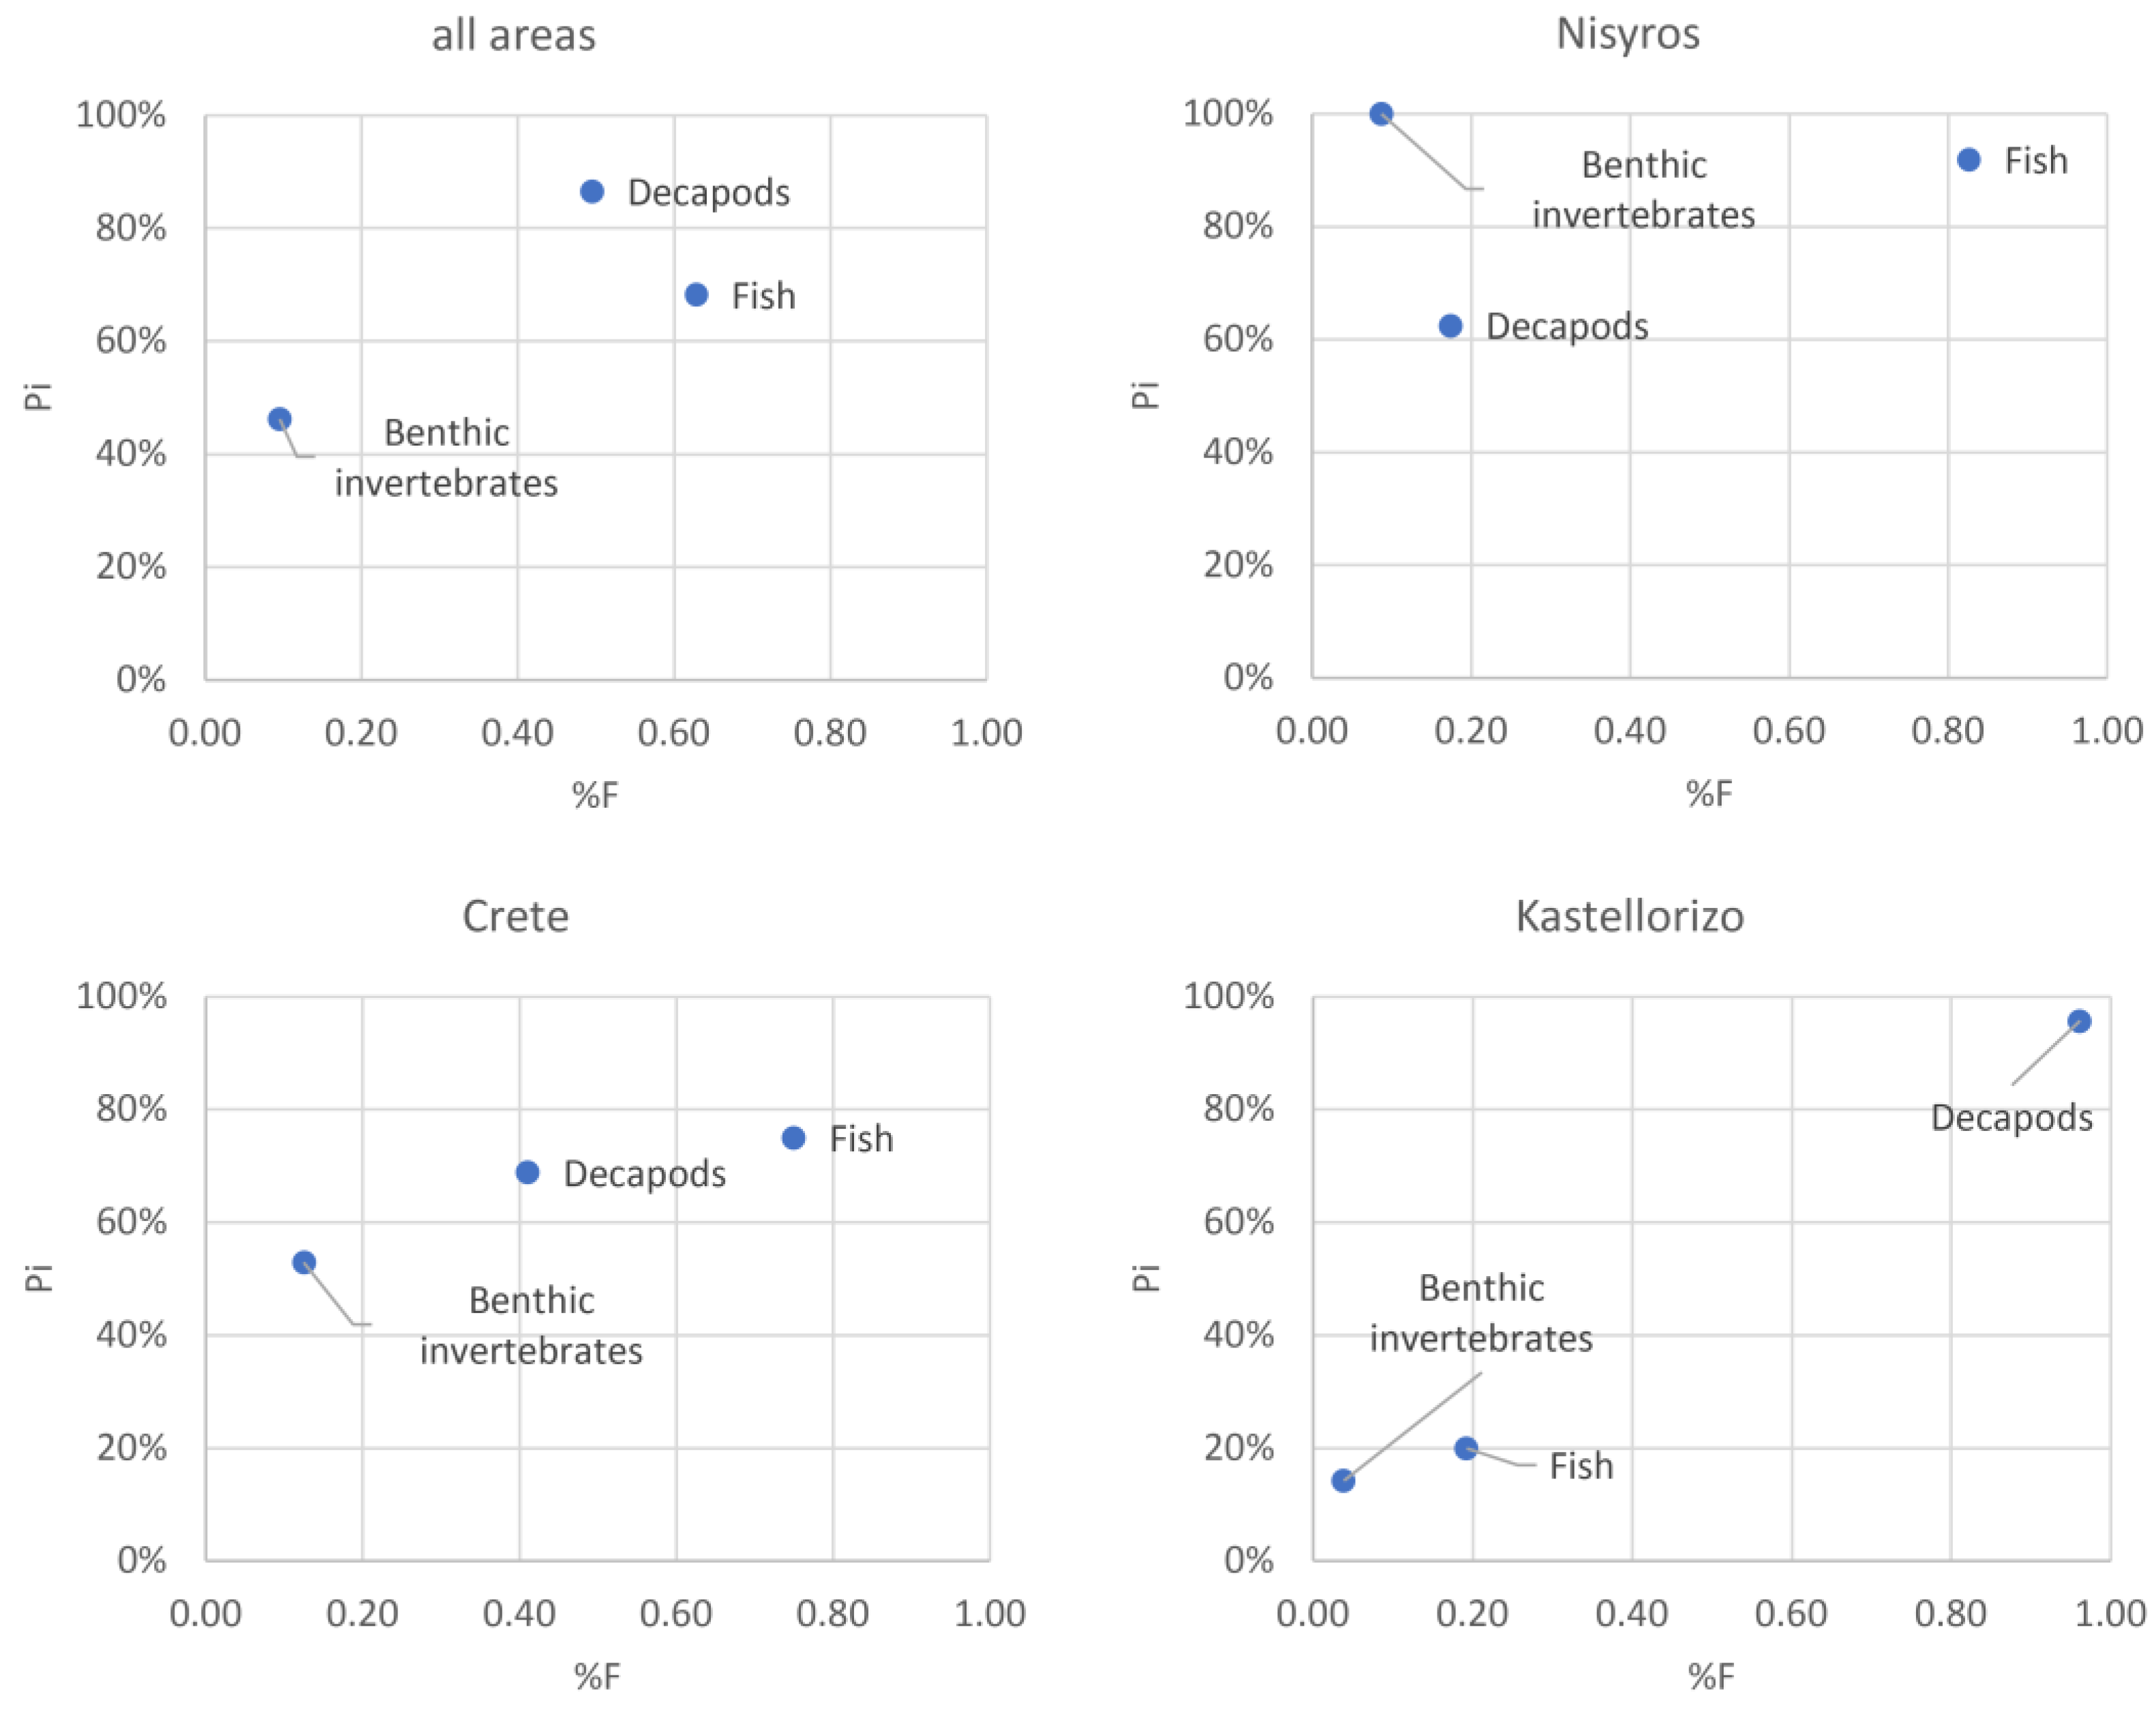
3.6. Pterois miles Feeding Strategy
3.7. Pterois miles Diet Breadth
4. Discussion
5. Conclusions
Author Contributions
Funding
Institutional Review Board Statement
Data Availability Statement
Acknowledgments
Conflicts of Interest
References
- Zenetos, A.; Albano, P.G.; Lopez Garcia, E.; Stern, N.; Tsiamis, K.; Galanidi, M. Established non-indigenous species increased by 40% in 11 years in the Mediterranean Sea. Mediterr. Mar. Sci. 2022, 23. [Google Scholar] [CrossRef]
- Katsanevakis, S.; Rilov, G.; Edelist, D. Impacts of marine invasive alien species on European fisheries and aquaculture–plague or boon? CIESM Monogr. 2018, 50, 125–132. [Google Scholar]
- Tsirintanis, K.; Azzurro, E.; Crocetta, F.; Dimiza, M.; Froglia, C.; Gerovasileiou, V.; Langeneck, J.; Mancinelli, G.; Rosso, A.; Stern, N.; et al. Bioinvasion impacts on biodiversity, ecosystem services, and human health in the Mediterranean Sea. Aquat. Invasions 2022, 17, 308–352. [Google Scholar] [CrossRef]
- Galil, B.S.; Zenetos, A. A sea change—Exotics in the Eastern Mediterranean Sea. In Invasive Aquatic Species in Europe. Distribution, Impacts and Management; Leppakoski, E., Gollasch, S., Olenin, S., Eds.; Kluwer Academic Publishers: Dordrecht, The Amsterdam; Boston, MA, USA; London, UK, 2002; pp. 325–336. [Google Scholar]
- Olden, J.; Poff, N.; Douglas, M.; Douglas, M.; Fausch, K. Ecological and evolutionary consequences of biotic homogenization. Trends Ecol. Evol. 2004, 19, 18–24. [Google Scholar] [CrossRef]
- South, J.; Dick, J.T.; McCard, M.; Barrios-O’Neill, D.; Anton, A. Predicting predatory impact of juvenile invasive lionfish (Pterois volitans) on a crustacean prey using functional response analysis: Effects of temperature, habitat complexity and light regimes. Environ. Biol. Fishes 2017, 100, 1155–1165. [Google Scholar] [CrossRef]
- Fanelli, E.; Azzurro, E.; Bariche, M.; Cartes, J.E.; Maynou, F. Depicting the novel Eastern Mediterranean food web: A stable isotopes study following Lessepsian fish invasion. Biol. Invasions 2015, 17, 2163–2178. [Google Scholar] [CrossRef]
- Bezerra, L.A.V.; Angelini, R.; Vitule, J.R.S.; Coll, M.; Sánchez-Botero, J.I. Food web changes associated with drought and invasive species in a tropical semiarid reservoir. Hydrobiologia 2018, 817, 475–489. [Google Scholar] [CrossRef]
- Côté, I.M.; Smith, N.S. The lionfish Pterois sp. invasion: Has the worst-case scenario come to pass? Fish Biol. 2018, 92, 660–689. [Google Scholar] [CrossRef] [PubMed]
- Lesser, M.P.; Slattery, M. Phase shift to algal dominated communities at mesophotic depths associated with lionfish (Pterois volitans) invasion on a Bahamian coral reef. Biol. Invasions 2011, 13, 1855–1868. [Google Scholar] [CrossRef]
- Green, S.J.; Akins, J.L.; Cote, I.M. Foraging behaviour and prey consumption in the Indo-Pacific lionfish on Bahamian coral reefs. Mar. Ecol. Prog. Ser. 2011, 433, 159–167. [Google Scholar] [CrossRef]
- Côté, I.M.; Green, S.J.; Hixon, M.A. Predatory fish invaders: Insights from Indo-Pacific lionfish in the western Atlantic and Caribbean. Biol. Conserv. 2013, 164, 50–61. [Google Scholar] [CrossRef]
- Dahl, K.A.; Patterson, W.F., III. Habitat-specific density and diet of rapidly expanding invasive red lionfish, Pterois volitans, populations in the Northern Gulf of Mexico. PLoS ONE 2014, 9, e105852. [Google Scholar] [CrossRef]
- Green, S.J.; Côté, I.M. Trait-based diet selection: Prey behaviour and morphology predict vulnerability to predation in reef fish communities. J. Anim. Ecol. 2014, 83, 1451–1460. [Google Scholar] [CrossRef]
- Harms-Tuohy, C.; Schizas, N.V.; Appeldoorn, R.S. Use of DNA metabarcoding for stomach content analysis in the invasive lionfish Pterois volitans in Puerto Rico. Mar. Ecol. Prog. Ser. 2016, 558, 181–191. [Google Scholar] [CrossRef]
- Dahl, K.A.; Patterson, W.F., III; Robertson, A.; Ortmann, A.C. DNA barcoding significantly improves resolution of invasive lionfish diet in the Northern Gulf of Mexico. Biol. Invasions 2017, 19, 1917–1933. [Google Scholar] [CrossRef]
- Green, S.J.; Akins, J.L.; Maljkovi, A.; Côte, I.M. Invasive lionfish drive Atlantic coral reef fish declines. PLoS ONE 2012, 7, e32596. [Google Scholar] [CrossRef]
- Layman, C.A.; Allgeier, J.E. Characterizing trophic ecology of generalist consumers: A case study of the invasive lionfish in The Bahamas. Mar. Ecol. Prog. Ser. 2012, 448, 131–141. [Google Scholar] [CrossRef]
- Golani, D.; Sonin, O. New records of the Red Sea fishes, Pterois miles (Scorpaenidae) and Pteragogus pelycus (Labridae) from the eastern Mediterranean Sea. Jpn. J. Ichthyol. 1992, 39, 167–169. [Google Scholar] [CrossRef]
- Albins, M.A.; Hixon, M.A. Invasive Indo-Pacific lionfish Pterois volitans reduce recruitment of Atlantic coral-reef fishes. Mar. Ecol. Prog. Ser. 2008, 367, 233–238. [Google Scholar] [CrossRef]
- Bariche, M.; Torres, M.; Azzurro, E. The Presence of the invasive Lionfish Pterois miles in the Mediterranean Sea. Mediterr. Mar. Sci. 2013, 14, 292–294. [Google Scholar] [CrossRef]
- Dimitriadis, C.; Galanidi, M.; Zenetos, M.; Corsini-Foka, M.; Giovos, I.; Karachle, P.K.; Fournari-Konstantinidou, I.; Kytinou, E.; Issaris, Y.; Azzurro, E.; et al. Updating the occurrences of Pterois miles in the Mediterranean Sea, with considerations on thermal boundaries and future range expansion. Mediterr. Mar. Sci. 2020, 21, 62–69. [Google Scholar] [CrossRef]
- Johnston, M.W.; Purkis, S.J. Spatial analysis of the invasion of lionfish in the western Atlantic and Caribbean. Mar. Pollut. Bull. 2011, 62, 1218–1226. [Google Scholar] [CrossRef] [PubMed]
- Peake, J.; Bogdanoff, A.K.; Layman, C.A.; Castillo, B.; Reale-Munroe, K.; Chapman, J.; Dahl, K.; Patterson, W.F., III; Eddy, C.; Ellis, R.D.; et al. Feeding ecology of invasive lionfish (Pterois volitans and Pterois miles) in the temperate and tropical western Atlantic. Biol. Invasions 2018, 20, 2567–2597. [Google Scholar] [CrossRef]
- Côté, I.M.; Maljković, A. Predation rates of IndoPacific lionfish on Bahamian coral reefs. Mar. Ecol. Prog. Ser. 2010, 404, 219–225. [Google Scholar] [CrossRef]
- Ritger, A.L.; Fountain, C.T.; Bourne, K.; Martín-Fernández, J.A.; Pierotti, M.E. Diet choice in a generalist predator, the invasive lionfish (Pterois volitans/miles). J. Exp. Mar. Biol. Ecol. 2020, 524, 151311. [Google Scholar] [CrossRef]
- Zannaki, K.; Corsini-Foka, M.; Kampouris, T.E.; Batjakas, I.E. First results on the diet of the invasive Pterois miles (Actinopterygii: Scorpaeniformes: Scorpaenidae) in the Hellenic waters. Acta Ichthyol. Piscat. 2019, 49, 311–317. [Google Scholar] [CrossRef]
- D’Agostino, D.; Jimenez, C.; Reader, T.; Hadjioannou, L.; Heyworth, S.; Aplikioti, M.; Argyrou, M.; Feary, D.A. Behavioural traits and feeding ecology of Mediterranean lionfish and naiveté of native species to lionfish predation. Mar. Ecol. Prog. Ser. 2020, 638, 123–135. [Google Scholar] [CrossRef]
- Savva, I.; Chartosia, N.; Antoniou, C.; Kleitou, P.; Georgiou, A.; Stern, N.; Hadjioannou, L.; Jimenez, C.; Andreou, V.; Hall-Spencer, J.M.; et al. They are here to stay: The biology and ecology of lionfish (Pterois miles) in the Mediterranean Sea. Fish Biol. 2020, 97, 148–162. [Google Scholar] [CrossRef]
- Morris, J.A., Jr. The Biology and Ecology of Invasive Indo–Pacific Lionfish. Ph.D. Thesis, North Carolina State University, Raleigh, NC, USA, 2009; 168p. [Google Scholar]
- Tuset, V.M.; Lombarte, A.; Assis, C.A. Otolith atlas for the western Mediterranean, north and central eastern Atlantic. Sci. Mar. 2008, 72, 7–198. [Google Scholar] [CrossRef]
- Ferry, L.A.; Cailliet, G.M. Sample size and data analysis: Are we characterizing and comparing diet properly? In Proceedings of the GUTSHOP ’96, Feeding Ecology and Nutrition in Fish, International Congress on the Biology of Fishes, San Francisco, CA, USA, 14–18 July 1996; American Fisheries Society: Washington, DC, USA, 1996; pp. 71–80. [Google Scholar]
- Tiralongo, F.; Messina, G.; Cazzolla Gatti, R.; Tibullo, D.; Lombardo, B.M. Some biological aspects of juveniles of the rough ray, Raja radula Delaroche, 1809 in Eastern Sicily (central Mediterranean Sea). J. Sea Res. 2018, 142, 174–179. [Google Scholar] [CrossRef]
- Oksanen, J.; Blanchet, F.G.; Friendly, M.; Kindt, R.; Legendre, P.; McGlinn, D.; Minchin, P.R.; O’Hara, R.B.; Simpson, G.L.; Solymos, P.; et al. Vegan: Community Ecology Package. R Package Version 2.6-4. 2019. Available online: https://CRAN.R-project.org/package=vegan (accessed on 4 December 2022).
- Hyslop, E.J. Stomach contents analysis—A review of methods and their application. J. Fish. Biol. 1980, 17, 411–429. [Google Scholar] [CrossRef]
- Tennekes, M. Treemap: Treemap Visualization. R Package Version 2.4-3. 2021. Available online: https://CRAN.R-project.org/package=treemap (accessed on 4 December 2022).
- Kruskal, J.B. Nonmetric multidimensional scaling: A numerical method. Psychometrika 1964, 29, 115–129. [Google Scholar] [CrossRef]
- Anderson, M. A new method for non-parametric multivariate analysis of variance. Austral. Ecol. 2001, 26, 32–46. [Google Scholar]
- Clarke, K.R. Non-parametric multivariate analyses of changes in community structure. Austral. Ecol. 1993, 18, 117–143. [Google Scholar] [CrossRef]
- Schoener, T.W. Nonsynchronous spatial overlap of lizards in patchy habitats. Ecology 1970, 51, 408–418. [Google Scholar] [CrossRef]
- Amundsen, P.-A.; Gabler, H.-M.; Staldvik, F.J. A new method for graphical analysis of feeding strategy from stomach contents data. J. Fish Biol. 1996, 48, 607–614. [Google Scholar]
- Levins, R. Evolution in Changing Environments; Princeton University Press: Princeton, NJ, USA, 1968; 120p. [Google Scholar]
- Krebs, C.J. Ecological Methodology, 3rd ed.; Addison-Wesley Educational Publishers, Inc.: Boston, MA, USA, 2014. [Google Scholar]
- R Core Team. R: A Language and Environment for Statistical Computing; R Foundation for Statistical Computing: Vienna, Austria, 2022; Available online: https://www.R-project.org/ (accessed on 1 December 2022).
- Clarke, K.R.; Warwick, R.M. Change in Marine Communities: An Approach to Statistical Analysis and Interpretation, 2nd ed.; PRIMER-E: Plymouth, UK, 2001. [Google Scholar]
- Clarke, Κ.Ρ.; Gorley, R.N. PRIMER v6: User Manual/Tutorial; PRIMER-E: Plymouth, UK, 2006. [Google Scholar]
- Anderson, M.J.; Gorley, R.N.; Clarke, K.R. PERMANOVA+ for PRIMER: Guide to Software and Statistical Methods; PRIMER-E: Plymouth, UK, 2008. [Google Scholar]
- Fishelson, L. Ethology and reproduction of pteroid fishes found in the Gulf of Aqaba (Red Sea), especially Dendrochirus brachypterus (Cuvier), (Pteroidae, Teleostei). Pubblicazioni della Stazione Zoologica di Napoli 1975, 39, 635–656. [Google Scholar]
- Khalaf, M.A.; Disi, A.M. Fishes of the Gulf of Aqaba; Marine Science Station: Aqaba, Jordan, 1997. [Google Scholar]
- Morris, J.A.; Akins, J.L. Feeding ecology of invasive lionfish (Pterois volitans) in the Bahamian archipelago. Environ. Biol. Fishes 2009, 86, 389–398. [Google Scholar] [CrossRef]
- Arredondo-Chávez, A.F.; Sánchez-Jimenez, J.A.; Ávila-Morales, O.G.; TorresChávez, P.; Herrerias-Diego, Y.; Medina-Nava, M.; Madrigal-Guridi, X.; Campos-Mendoza, A.; Domínguez- Domínguez, O.; Caballero-Vázquez, J.A. Spatio-temporal variation in the diet composition of red lionfish, Pterois volitans, (Actinopterygii: Scorpaeniformes: Scorpaenidae), in the Mexican Caribbean: Insights into the ecological effect of the alien invasion. Acta Ichthyol. Piscat. 2016, 46, 185–200. [Google Scholar] [CrossRef]
- Valdez-Moreno, M.; Quintal-Lizama, C.; Gómez-Lozano, R.; del Carmen García-Rivas, M. Monitoring an Alien Invasion: DNA Barcoding and the Identification of Lionfish and Their Prey on Coral Reefs of the Mexican Caribbean. PLoS ONE 2012, 7, e36636. [Google Scholar] [CrossRef]
- Sandel, V.; Martinez-Fernandez, D.; Wangpraseurt, D.; Sierra, L. Ecology and management of the invasive lionfish Pterois volitans/miles complex (Perciformes: Scorpaenidae) in Southern Costa Rica. Rev. Biol. Trop. 2015, 63, 213–221. [Google Scholar] [CrossRef] [PubMed]
- Munõz, R.C.; Currin, C.A.; Whitfield, P.E. Diet of invasive lionfish on hard bottom reefs of the Southeast USA: Insights from stomach contents and stable isotopes. Mar. Ecol. Prog. Ser. 2011, 432, 181–193. [Google Scholar] [CrossRef]
- Šantić, M.; Pallaoro, A.; Stagličić, N.; Markov-Podvinski, M. Feeding Habits of the red scorpionfish, Scorpaena scrofa (Osteichthyes: Scorpaenidae) from the eastern central Adriatic Sea. Cah. Biol. Mar. 2011, 52, 217–226. [Google Scholar] [CrossRef]
- Kampouris, T.E.; Koutsoubas, D.; Milenkova, D.; Economidis, G.; Tamvakidis, S.; Batjakas, I.E. New Data on the Biology and Fisheries of the Threatened Palinurus elephas (Fabricius, 1787) (Decapoda, Achelata, Palinuridae) from the North-West Aegean Sea, Greece. Water 2020, 12, 2390. [Google Scholar] [CrossRef]
- Kleiven, A.R.; Olsen, E.M.; Vølstad, J.H. Total catch of a red-listed marine species is an order of magnitude higher than official data. PLoS ONE 2012, 7, e31216. [Google Scholar] [CrossRef]
- La Mesa, G.; La Mesa, M.; Tomassetti, P. Feeding habits of the Madeira rockfish Scorpaena maderensis from central Mediterranean Sea. Mar. Biol. 2007, 150, 1313–1320. [Google Scholar] [CrossRef]
- Ordines, F.; Valls, M.; Gouraguine, A. Biology, feeding and habitat preferences of Cadenat’s rockfish, Scorpaena loppei (Actinopterygii: Scorpaniformes: Scorpanidae), in the Balearic Islands (western Mediterranean). Acta Ichthyol. Piscat. 2012, 42, 21–30. [Google Scholar] [CrossRef]
- Demirhan, S.A.; Can, M.F. Age growth food composition of Scorpaena porcus (Linnaeus 1758) in the southeastern Black Sea. J. Appl. Ichthyol. 2009, 25, 215–218. [Google Scholar] [CrossRef]
- Compaire, J.C.; Casademont, P.; Cabrera, R.; Gómez-Cama, C.; Soriguer, M.C. Feeding of Scorpaena porcus (Scorpaenidae) in intertidal rock pools in the Gulf of Cadiz (NE Atlantic). J. Mar. Biolog. Assoc. UK 2018, 98, 845–853. [Google Scholar] [CrossRef]
- Omri, N.; Derbal, F.; Kara, M.H. Diet of the black scorpionfish Scorpaena porcus (Scorpaenidae) of the gulf of Annaba, Algeria. Cybium 2019, 43, 179–186. [Google Scholar] [CrossRef]
- Aydin, M.; Mazlum, R.E. Feeding ecology of black scorpion fish (Scorpaena porcus Linnaeus, 1758) in SE Black Sea region, (Ordu) Turkey. J. Mar. Biol. Assoc. UK 2020, 100, 435–444. [Google Scholar] [CrossRef]
- Sahin, C.; Erbay, M.; Kalayci, F.; Ceylan, Y.; Yesilcicek, T. Life-History Traits of the Black Scorpionfish (Scorpaena porcus) in Southeastern Black Sea. Turk. J. Fish. Aquat. Sci. 2019, 19, 571–584. [Google Scholar] [CrossRef]
- Eddy, C.; Pitt, J.; Morris, J.A., Jr.; Smith, S.; Goodbody-Gringley, G.; Bernal, D. Diet of invasive lionfish (Pterois volitans and P. miles) in Bermuda. Mar. Ecol. Prog. Ser. 2016, 558, 193–206. [Google Scholar] [CrossRef]
- Galanidi, M.; Zenetos, A.; Bacher, S. Assessing the socio-economic impacts of priority marine invasive fishes in the Mediterranean with the newly proposed SEICAT methodology. Mediterr. Mar. Sci. 2018, 19, 107–123. [Google Scholar] [CrossRef]
- Albins, M.A.; Hixon, M.A. Worst case scenario: Potential long-term effects of invasive predatory lionfish (Pterois volitans) on Atlantic and Caribbean coral-reef communities. Environ. Biol. Fishes 2013, 96, 1151–1157. [Google Scholar] [CrossRef]
- Morris, J.A., Jr.; Akins, J.L.; Barse, A.; Cerino, D.; Freshwater, D.W.; Green, S.J.; Muñoz, R.C.; Paris, C.; Whitfield, P.E. Biology and ecology of the invasive lionfishes, Pterois miles and Pterois volitans. Proc. Gulf Caribb. Fish. Inst. 2009, 61, 409–414. [Google Scholar]
- Arias-González, J.E.; González-Gándara, C.; Cabrera, J.L.; Christensen, V. Predicted impact of the invasive lionfish Pterois volitans on the food web of a Caribbean coral reef. Environ. Res. 2011, 111, 917–925. [Google Scholar] [CrossRef]
- Rocha, L.A.; Rocha, C.R.; Baldwin, C.C.; Weigt, L.A.; McField, M. Invasive lionfish preying on critically endangered reef fish. Coral Reefs 2015, 34, 803–806. [Google Scholar] [CrossRef]
- Ballew, N.G.; Bacheler, N.M.; Kellison, G.T.; Schueller, A.M. Invasive lionfish reduce native fish abundance on a regional scale. Sci. Rep. 2016, 6, 32169. [Google Scholar] [CrossRef]


| Factor | Levels | Total | Full % | Empty % (=VI) |
|---|---|---|---|---|
| Area | Crete | 73 | 77% | 23% |
| Kastellorizo | 31 | 84% | 16% | |
| Nisyros | 37 | 62% | 38% | |
| Sex | F | 78 | 78% | 22% |
| M | 15 | 60% | 40% | |
| U | 48 | 73% | 27% | |
| Size | S | 68 | 76% | 24% |
| L | 73 | 73% | 27% | |
| Grand Total | 141 | 74% | 26% |
| Sex | Size | Nisyros | Kastellorizo | Crete |
|---|---|---|---|---|
| F | 31.83 | 315.07 | 171.12 | |
| S | 27.66 | 294.77 | 210.83 | |
| L | 32.66 | 330.3 | 103.39 | |
| M | 27.19 | 187.33 | ||
| S | 126.32 | |||
| L | 27.19 | 614.39 | ||
| U | 96.94 | 230.66 | 83.19 | |
| S | 23.5 | 166.26 | 100.78 | |
| L | 121.42 | 311.17 | 61.2 | |
| Area | 52.07 | 257.6 | 138.6 | |
| Taxon | N | C | K | F | M | U | S | L | ALL |
|---|---|---|---|---|---|---|---|---|---|
| BENTHIC INVERTEBRATES | 5.41 | 9.59 | 3.23 | 8.97 | 6.67 | 4.17 | 5.88 | 8.22 | 7.09 |
| Cumacea | 5.41 | 0.00 | 0.00 | 0.00 | 6.67 | 2.08 | 0.00 | 2.74 | 1.42 |
| Isopoda | 0.00 | 1.37 | 0.00 | 1.28 | 0.00 | 0.00 | 1.47 | 0.00 | 0.71 |
| Gastropoda | 0.00 | 1.37 | 0.00 | 1.28 | 0.00 | 0.00 | 0.00 | 1.37 | 0.71 |
| Mollusca | 0.00 | 1.37 | 0.00 | 1.28 | 0.00 | 0.00 | 0.00 | 1.37 | 0.71 |
| Polychaeta | 0.00 | 4.11 | 0.00 | 3.85 | 0.00 | 0.00 | 2.94 | 1.37 | 2.13 |
| Ostracoda | 0.00 | 1.37 | 3.23 | 1.28 | 0.00 | 2.08 | 1.47 | 1.37 | 1.42 |
| DECAPODS | 10.81 | 31.51 | 80.65 | 38.46 | 33.33 | 35.42 | 44.12 | 30.14 | 36.88 |
| Brachyura | |||||||||
| Homola barbata (Fabricius, 1793) | 0.00 | 5.48 | 0.00 | 2.56 | 0.00 | 4.17 | 4.41 | 1.37 | 2.84 |
| Inachus sp. | 0.00 | 2.74 | 0.00 | 1.28 | 0.00 | 2.08 | 2.94 | 0.00 | 1.42 |
| Natantia | |||||||||
| Alpheus sp. | 0.00 | 0.00 | 3.23 | 1.28 | 0.00 | 0.00 | 0.00 | 1.37 | 0.71 |
| Plesionika edwardsii (Brandt, 1851) | 0.00 | 0.00 | 41.94 | 8.97 | 20.00 | 6.25 | 10.29 | 8.22 | 9.22 |
| Plesionika spp. | 0.00 | 1.37 | 29.03 | 6.41 | 6.67 | 8.33 | 5.88 | 8.22 | 7.09 |
| Caridea | 8.11 | 1.37 | 0.00 | 3.85 | 0.00 | 2.08 | 5.88 | 0.00 | 2.84 |
| Parapenaeus longirostris (Lucas, 1846) | 0.00 | 2.74 | 0.00 | 0.00 | 0.00 | 4.17 | 2.94 | 0.00 | 1.42 |
| Natantia | 0.00 | 0.00 | 12.90 | 2.56 | 6.67 | 2.08 | 4.41 | 1.37 | 2.84 |
| Macrura | |||||||||
| Scyllarides latus (Latreille, 1803) | 0.00 | 6.85 | 0.00 | 3.85 | 0.00 | 4.17 | 2.94 | 4.11 | 3.55 |
| Scyllarus arctus (Linnaeus, 1758) | 0.00 | 1.37 | 0.00 | 1.28 | 0.00 | 0.00 | 1.47 | 0.00 | 0.71 |
| Scyllarus sp. | 0.00 | 9.59 | 0.00 | 6.41 | 0.00 | 4.17 | 5.88 | 4.11 | 4.96 |
| Scyllaridae larvae | 0.00 | 1.37 | 0.00 | 1.28 | 0.00 | 0.00 | 0.00 | 1.37 | 0.71 |
| Scyllaridae | 0.00 | 9.59 | 3.23 | 7.69 | 0.00 | 4.17 | 7.35 | 4.11 | 5.67 |
| Decapoda | 2.70 | 0.00 | 0.00 | 1.28 | 0.00 | 0.00 | 0.00 | 1.37 | 0.71 |
| FISH | 51.35 | 57.53 | 16.13 | 52.56 | 20.00 | 45.83 | 45.59 | 47.95 | 46.81 |
| Atherina hepsetus Linnaeus, 1758 | 0.00 | 1.37 | 0.00 | 1.28 | 0.00 | 0.00 | 1.47 | 0.00 | 0.71 |
| Chromis sp. | 0.00 | 2.74 | 0.00 | 1.28 | 0.00 | 2.08 | 1.47 | 1.37 | 1.42 |
| Gobidae | 5.41 | 2.74 | 0.00 | 5.13 | 0.00 | 0.00 | 2.94 | 2.74 | 2.84 |
| Labridae | 5.41 | 0.00 | 0.00 | 1.28 | 6.67 | 0.00 | 0.00 | 2.74 | 1.42 |
| Pterois sp. | 5.41 | 0.00 | 0.00 | 2.56 | 0.00 | 0.00 | 0.00 | 2.74 | 1.42 |
| Sargocentron rubrum (Forsskål, 1775) | 0.00 | 1.37 | 0.00 | 1.28 | 0.00 | 0.00 | 0.00 | 1.37 | 0.71 |
| Scorpaena scrofa (Linnaeus,1758) | 0.00 | 1.37 | 0.00 | 1.28 | 0.00 | 0.00 | 0.00 | 1.37 | 0.71 |
| Spicara smaris (Linnaeus, 1758) | 0.00 | 1.37 | 0.00 | 0.00 | 0.00 | 2.08 | 0.00 | 1.37 | 0.71 |
| fish remains | 40.54 | 47.95 | 16.13 | 42.31 | 13.33 | 41.67 | 39.71 | 38.36 | 39.01 |
| Taxon | N | C | K | F | M | U | S | L | ALL |
|---|---|---|---|---|---|---|---|---|---|
| BENTHIC INVERTEBRATES | 4.88 | 7.89 | 0.71 | 4.55 | 3.45 | 3.33 | 4.12 | 4.00 | 4.07 |
| Cumacea | 4.88 | 0.00 | 0.00 | 0.00 | 3.45 | 1.11 | 1.18 | 0.00 | 0.68 |
| Isopoda | 0.00 | 0.88 | 0.00 | 0.57 | 0.00 | 0.00 | 0.00 | 0.80 | 0.34 |
| Gastropoda | 0.00 | 0.88 | 0.00 | 0.57 | 0.00 | 0.00 | 0.59 | 0.00 | 0.34 |
| Mollusca | 0.00 | 0.88 | 0.00 | 0.57 | 0.00 | 0.00 | 0.59 | 0.00 | 0.34 |
| Polychaeta | 0.00 | 3.51 | 0.00 | 2.27 | 0.00 | 0.00 | 0.59 | 2.40 | 1.36 |
| Ostracoda | 0.00 | 1.75 | 0.71 | 0.57 | 0.00 | 2.22 | 1.18 | 0.80 | 1.02 |
| DECAPODS | 12.20 | 36.84 | 95.00 | 60.23 | 65.52 | 61.11 | 62.35 | 59.20 | 61.02 |
| Brachyura | |||||||||
| Homola barbata (Fabricius, 1793) | 0.00 | 4.39 | 0.00 | 1.14 | 0.00 | 3.33 | 0.59 | 3.20 | 1.69 |
| Inachus sp. | 0.00 | 1.75 | 0.00 | 0.57 | 0.00 | 1.11 | 0.00 | 1.60 | 0.68 |
| Natantia | |||||||||
| Alpheus sp. | 0.00 | 0.00 | 1.43 | 1.14 | 0.00 | 0.00 | 1.18 | 0.00 | 0.68 |
| Plesionika edwardsii (Brandt, 1851) | 0.00 | 0.00 | 35.00 | 14.77 | 31.03 | 15.56 | 18.82 | 13.60 | 16.61 |
| Plesionika spp. | 0.00 | 1.75 | 47.86 | 22.16 | 31.03 | 23.33 | 28.82 | 16.00 | 23.39 |
| Caridea | 9.76 | 0.88 | 0.00 | 2.27 | 0.00 | 1.11 | 0.00 | 4.00 | 1.69 |
| Parapenaeus longirostris (Lucas, 1846) | 0.00 | 1.75 | 0.00 | 0.00 | 0.00 | 2.22 | 0.00 | 1.60 | 0.68 |
| Natantia | 0.00 | 0.00 | 10.00 | 6.25 | 3.45 | 2.22 | 4.71 | 4.80 | 4.75 |
| Macrura | |||||||||
| Scyllarides latus (Latreille, 1803) | 0.00 | 7.89 | 0.00 | 2.84 | 0.00 | 4.44 | 2.94 | 3.20 | 3.05 |
| Scyllarus arctus (Linnaeus, 1758) | 0.00 | 0.88 | 0.00 | 0.57 | 0.00 | 0.00 | 0.00 | 0.80 | 0.34 |
| Scyllarus sp. | 0.00 | 7.02 | 0.00 | 3.41 | 0.00 | 2.22 | 1.76 | 4.00 | 2.71 |
| Scyllaridae larvae | 0.00 | 1.75 | 0.00 | 1.14 | 0.00 | 0.00 | 1.18 | 0.00 | 0.68 |
| Scyllaridae | 0.00 | 8.77 | 0.71 | 3.41 | 0.00 | 5.56 | 1.76 | 6.40 | 3.73 |
| Decapoda | 2.44 | 0.00 | 0.00 | 0.57 | 0.00 | 0.00 | 0.59 | 0.00 | 0.34 |
| FISH | 82.93 | 55.26 | 4.29 | 35.23 | 31.03 | 35.56 | 33.53 | 36.80 | 34.92 |
| Atherina hepsetus Linnaeus, 1758 | 0.00 | 0.88 | 0.00 | 0.57 | 0.00 | 0.00 | 0.00 | 0.80 | 0.34 |
| Chromis sp. | 0.00 | 2.63 | 0.00 | 1.14 | 0.00 | 1.11 | 0.59 | 1.60 | 1.02 |
| Gobidae | 7.32 | 1.75 | 0.00 | 2.84 | 0.00 | 0.00 | 1.18 | 2.40 | 1.69 |
| Labridae | 7.32 | 0.00 | 0.00 | 1.14 | 3.45 | 0.00 | 1.76 | 0.00 | 1.02 |
| Pterois sp. | 4.88 | 0.00 | 0.00 | 1.14 | 0.00 | 0.00 | 1.18 | 0.00 | 0.68 |
| Sargocentron rubrum (Forsskål, 1775) | 0.00 | 4.39 | 0.00 | 2.84 | 0.00 | 0.00 | 2.94 | 0.00 | 1.69 |
| Scorpaena scrofa Linnaeus, 1758 | 0.00 | 0.88 | 0.00 | 0.57 | 0.00 | 0.00 | 0.59 | 0.00 | 0.34 |
| Spicara smaris (Linnaeus, 1758) | 0.00 | 0.88 | 0.00 | 0.00 | 0.00 | 1.11 | 0.59 | 0.00 | 0.34 |
| fish remains | 63.41 | 43.86 | 4.29 | 25.00 | 27.59 | 33.33 | 24.71 | 32.00 | 27.80 |
| One-way SIMPER analysis | ||||||
|---|---|---|---|---|---|---|
| Within groups | ||||||
| Species | Av.Abund | Av.Sim | Sim/SD | Contrib% | Cum.% | |
| Group N (Average similarity = 34.59) | ||||||
| fish remains | 0.80 | 32.91 | 0.79 | 95.14 | 95.14 | |
| Group C (Average similarity = 29.05) | ||||||
| fish remains | 0.73 | 27.19 | 0.74 | 93.60 | 93.60 | |
| Group K (Average similarity = 26.60) | ||||||
| Plesionika edwarsii | 0.91 | 15.56 | 0.53 | 58.51 | 58.51 | |
| Plesionika spp. | 0.91 | 9.28 | 0.35 | 34.90 | 93.41 | |
| Between groups | ||||||
| Species | Av.Abund | Av.Abund | Av.Diss | Diss/SD | Contrib% | Cum.% |
| Groups N and C (Average dissimilarity = 69.17) | ||||||
| Group N | Group C | |||||
| fish remains | 0.80 | 0.73 | 23.30 | 1.09 | 33.69 | 33.69 |
| Caridea | 0.15 | 0.02 | 5.05 | 0.39 | 7.30 | 40.98 |
| Scyllarus sp. | 0.00 | 0.13 | 4.02 | 0.35 | 5.81 | 46.80 |
| Scyllaridae | 0.00 | 0.14 | 3.89 | 0.37 | 5.63 | 52.42 |
| Pterois sp. | 0.09 | 0.00 | 3.53 | 0.30 | 5.10 | 57.52 |
| Cumacea | 0.09 | 0.00 | 3.53 | 0.30 | 5.10 | 62.63 |
| Gobidae | 0.10 | 0.04 | 2.96 | 0.34 | 4.29 | 66.91 |
| Scyllarides latus | 0.00 | 0.12 | 2.89 | 0.29 | 4.18 | 71.09 |
| Labridae | 0.10 | 0.00 | 2.79 | 0.29 | 4.04 | 75.13 |
| Homola barbata | 0.00 | 0.08 | 2.11 | 0.26 | 3.04 | 78.18 |
| Decapoda | 0.04 | 0.00 | 1.76 | 0.21 | 2.55 | 80.73 |
| Polychaeta | 0.00 | 0.06 | 1.65 | 0.23 | 2.39 | 83.12 |
| Chromis sp. | 0.00 | 0.04 | 1.50 | 0.18 | 2.18 | 85.29 |
| Parapenaeus longirostris | 0.00 | 0.04 | 1.29 | 0.18 | 1.87 | 87.16 |
| Inachus sp. | 0.00 | 0.04 | 1.19 | 0.18 | 1.72 | 88.88 |
| Ostracoda | 0.00 | 0.03 | 0.95 | 0.13 | 1.38 | 90.26 |
| Groups N and K (Average dissimilarity = 93.62) | ||||||
| Group N | Group K | |||||
| Plesionika edwarsii | 0.00 | 0.91 | 26.14 | 0.91 | 27.92 | 27.92 |
| Plesionika spp. | 0.00 | 0.91 | 23.09 | 0.71 | 24.67 | 52.59 |
| fish remains | 0.80 | 0.21 | 21.39 | 1.12 | 22.84 | 75.43 |
| Natantia | 0.00 | 0.27 | 6.06 | 0.40 | 6.48 | 81.91 |
| Caridea | 0.15 | 0.00 | 3.72 | 0.37 | 3.97 | 85.88 |
| Pterois sp. | 0.09 | 0.00 | 2.86 | 0.29 | 3.06 | 88.94 |
| Cumacea | 0.09 | 0.00 | 2.86 | 0.29 | 3.06 | 92.00 |
| Groups C and K (Average dissimilarity = 93.68) | ||||||
| Group C | Group K | |||||
| Plesionika edwarsii | 0.00 | 0.91 | 24.18 | 0.90 | 25.81 | 25.81 |
| Plesionika spp. | 0.03 | 0.91 | 21.79 | 0.72 | 23.26 | 49.08 |
| fish remains | 0.73 | 0.21 | 19.08 | 1.07 | 20.37 | 69.44 |
| Natantia | 0.00 | 0.27 | 5.63 | 0.40 | 6.00 | 75.45 |
| Scyllaridae | 0.14 | 0.04 | 3.57 | 0.40 | 3.81 | 79.26 |
| Scyllarus sp. | 0.13 | 0.00 | 3.14 | 0.35 | 3.35 | 82.61 |
| Scyllarides latus | 0.12 | 0.00 | 2.35 | 0.29 | 2.51 | 85.12 |
| Homola barbata | 0.08 | 0.00 | 1.68 | 0.26 | 1.79 | 86.91 |
| Polychaeta | 0.06 | 0.00 | 1.33 | 0.23 | 1.42 | 88.33 |
| Ostracoda | 0.03 | 0.04 | 1.27 | 0.21 | 1.36 | 89.69 |
| Chromis sp. | 0.04 | 0.00 | 1.16 | 0.18 | 1.24 | 90.93 |
Disclaimer/Publisher’s Note: The statements, opinions and data contained in all publications are solely those of the individual author(s) and contributor(s) and not of MDPI and/or the editor(s). MDPI and/or the editor(s) disclaim responsibility for any injury to people or property resulting from any ideas, methods, instructions or products referred to in the content. |
© 2023 by the authors. Licensee MDPI, Basel, Switzerland. This article is an open access article distributed under the terms and conditions of the Creative Commons Attribution (CC BY) license (https://creativecommons.org/licenses/by/4.0/).
Share and Cite
Batjakas, I.E.; Evangelopoulos, A.; Giannou, M.; Pappou, S.; Papanikola, E.; Atsikvasi, M.; Poursanidis, D.; Gubili, C. Lionfish Diet Composition at Three Study Sites in the Aegean Sea: An Invasive Generalist? Fishes 2023, 8, 314. https://doi.org/10.3390/fishes8060314
Batjakas IE, Evangelopoulos A, Giannou M, Pappou S, Papanikola E, Atsikvasi M, Poursanidis D, Gubili C. Lionfish Diet Composition at Three Study Sites in the Aegean Sea: An Invasive Generalist? Fishes. 2023; 8(6):314. https://doi.org/10.3390/fishes8060314
Chicago/Turabian StyleBatjakas, Ioannis E., Athanasios Evangelopoulos, Maria Giannou, Sofia Pappou, Eleftheria Papanikola, Maria Atsikvasi, Dimitris Poursanidis, and Chrysoula Gubili. 2023. "Lionfish Diet Composition at Three Study Sites in the Aegean Sea: An Invasive Generalist?" Fishes 8, no. 6: 314. https://doi.org/10.3390/fishes8060314
APA StyleBatjakas, I. E., Evangelopoulos, A., Giannou, M., Pappou, S., Papanikola, E., Atsikvasi, M., Poursanidis, D., & Gubili, C. (2023). Lionfish Diet Composition at Three Study Sites in the Aegean Sea: An Invasive Generalist? Fishes, 8(6), 314. https://doi.org/10.3390/fishes8060314