
Transcriptome Analysis Reveals Differences in Gene Expression in the Muscle of the Brown-Marbled Grouper (Epinephelus fuscoguttatus) with Different Growth Rates

Abstract

1. Introduction
2. Methods
2.1. Ethics Statement
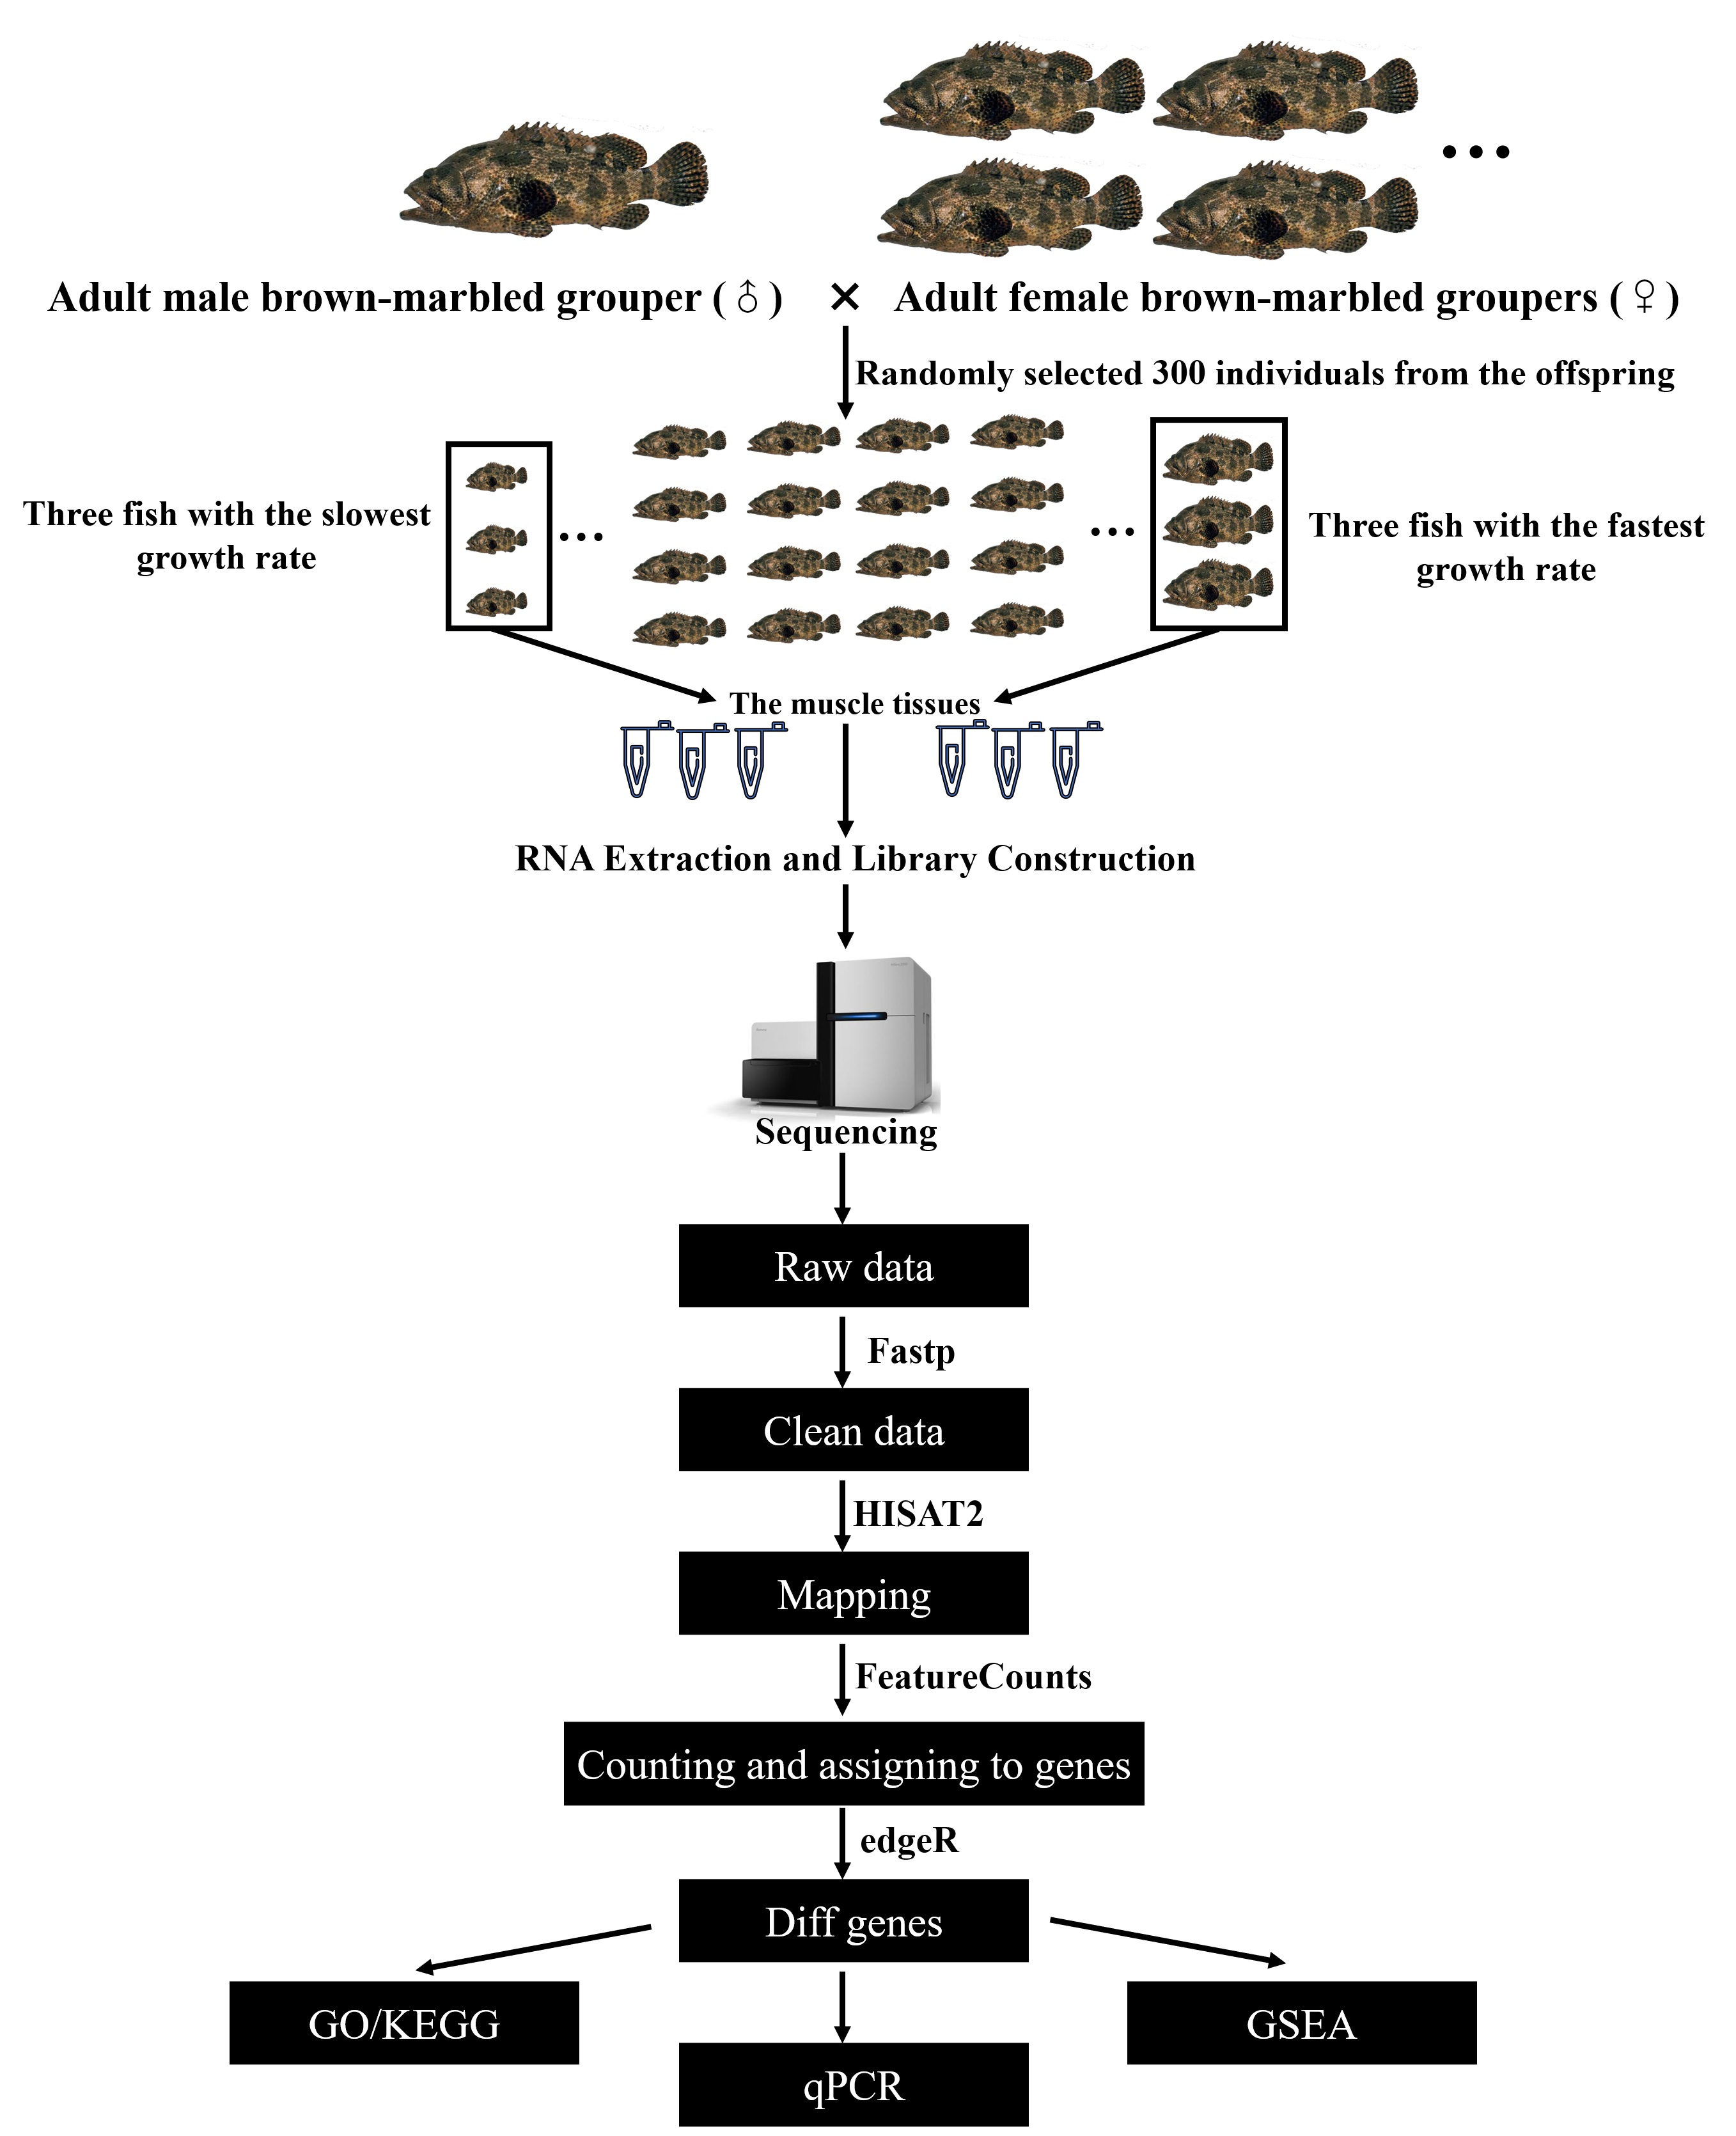
2.2. Experimental Fish and Sample Collection
2.3. RNA Extraction and Library Construction
2.4. DEG Analysis and GSEA Analysis
2.5. Real-Time PCR
2.6. Statistical Analyses
3. Result
3.1. Next-Generation Sequencing and Mapping to the Reference Genome
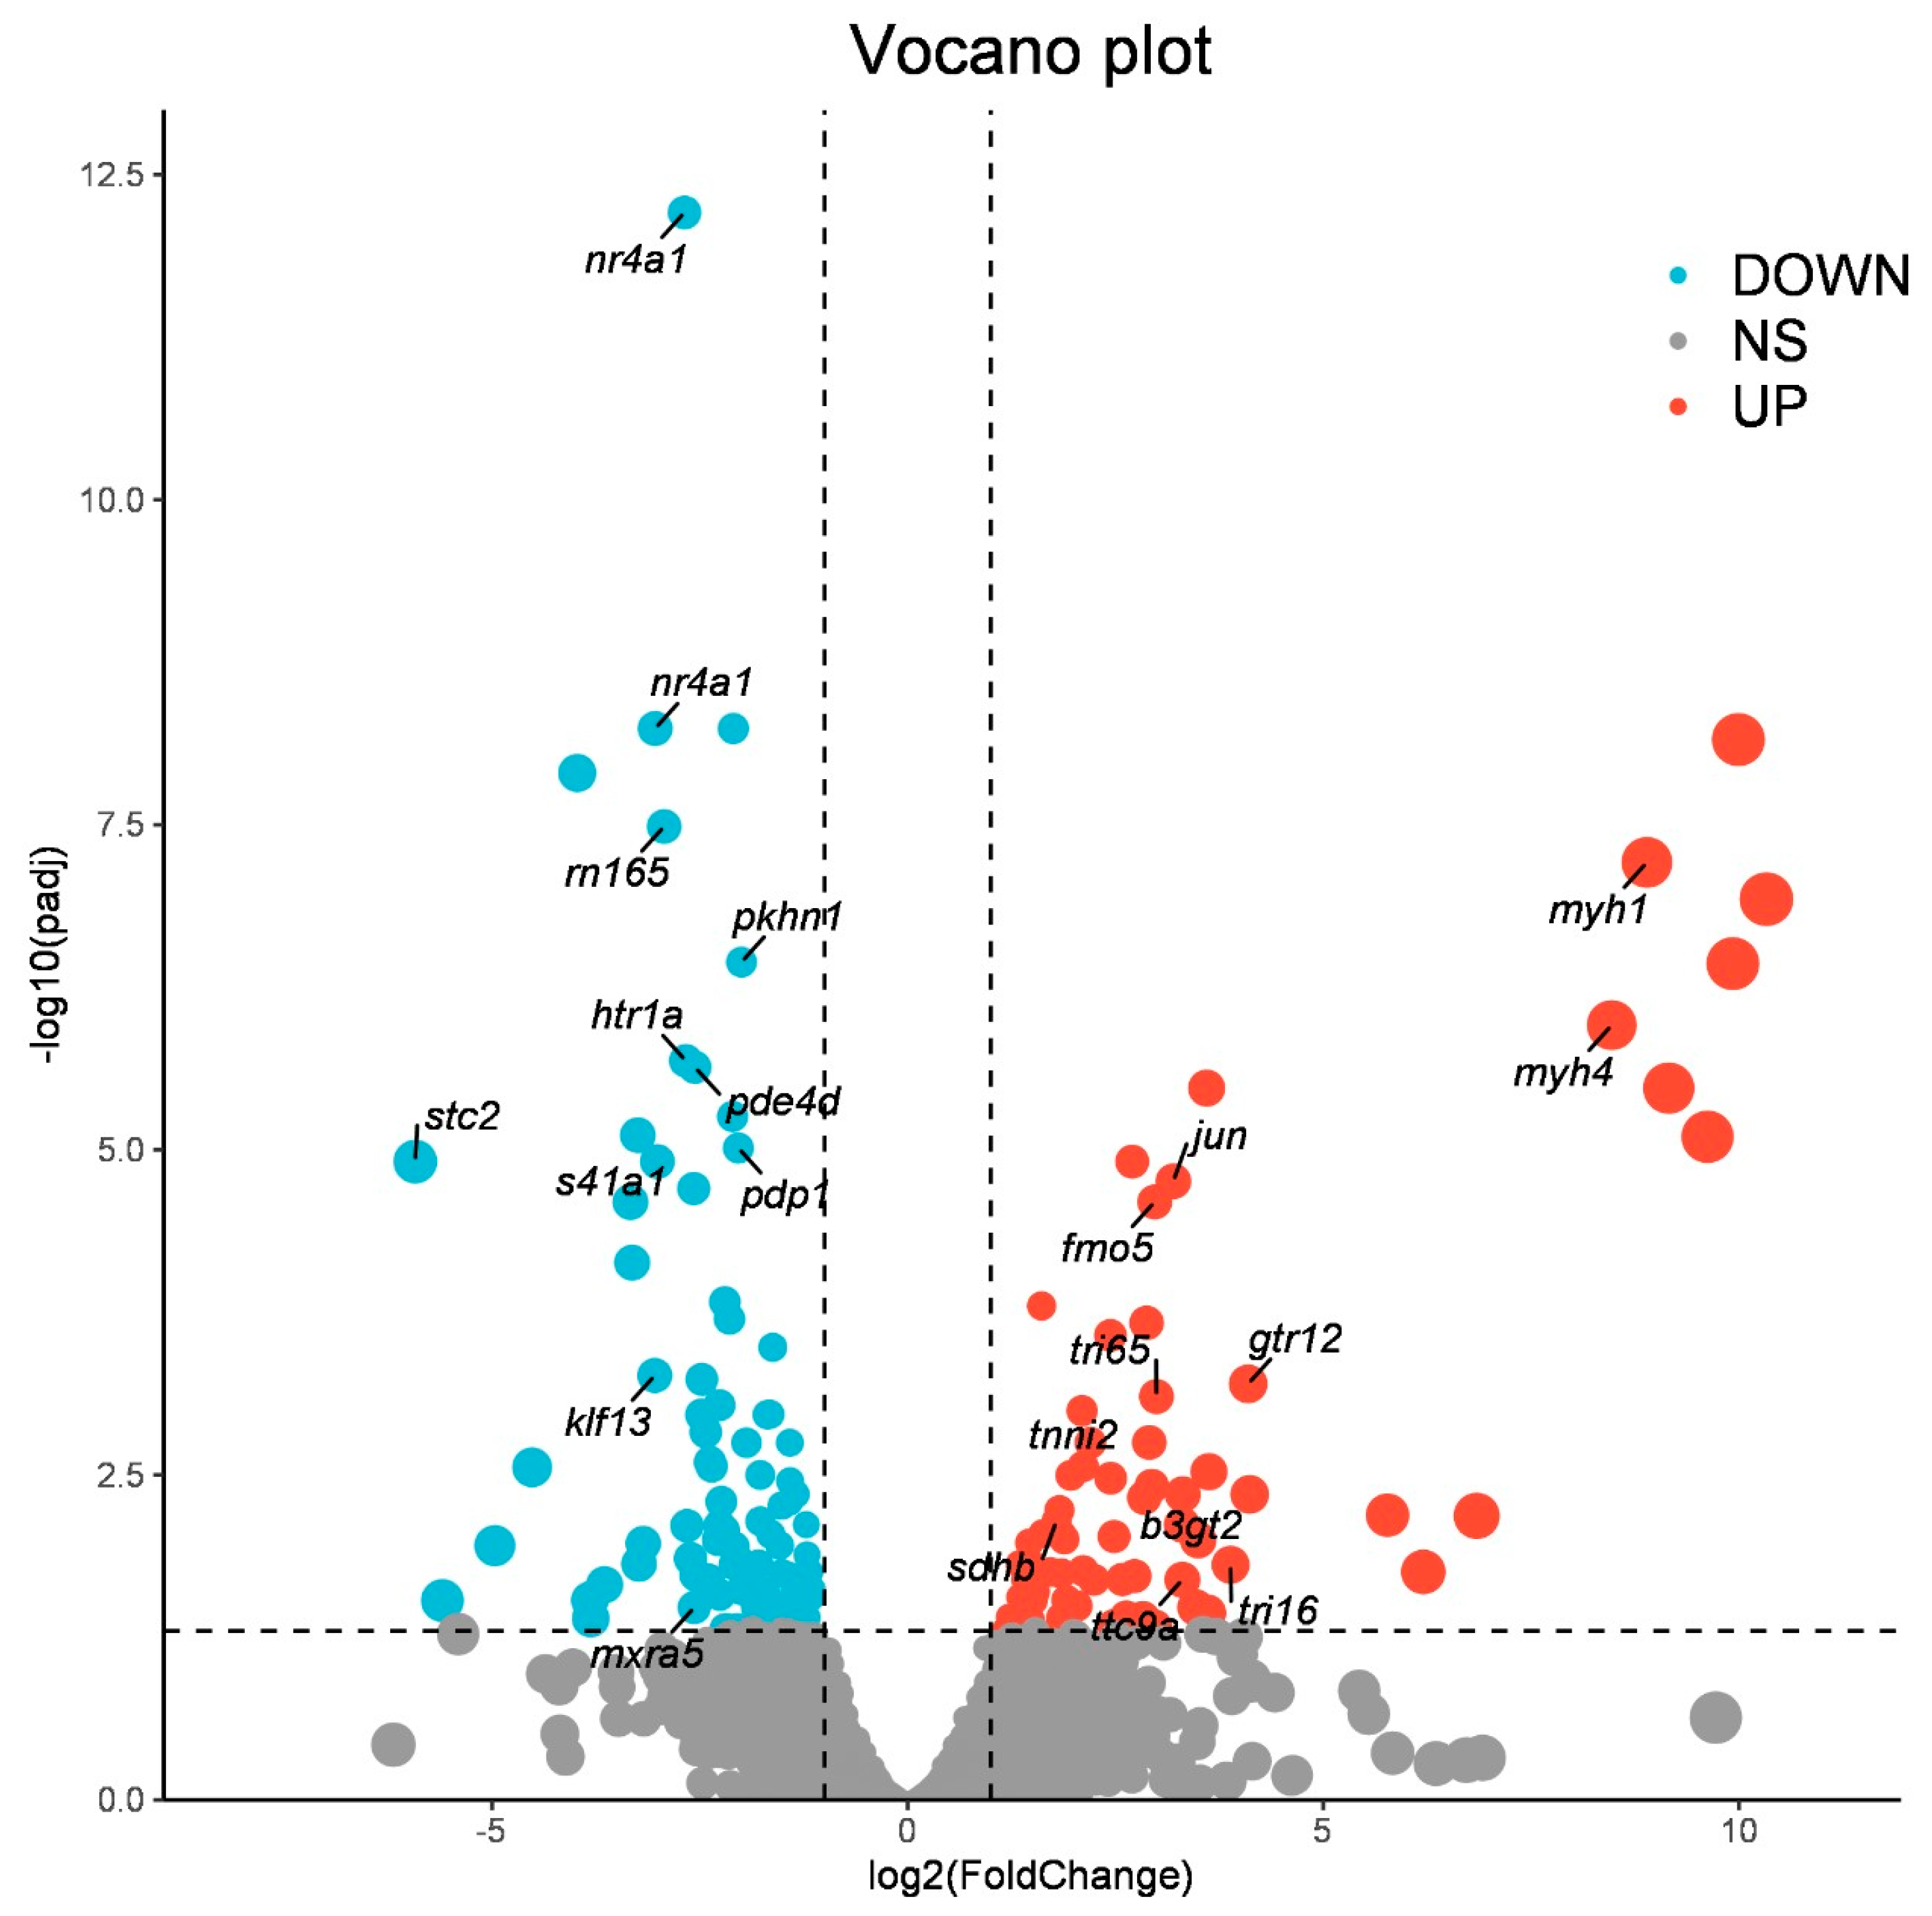
3.2. Identification of Differentially Expressed Genes
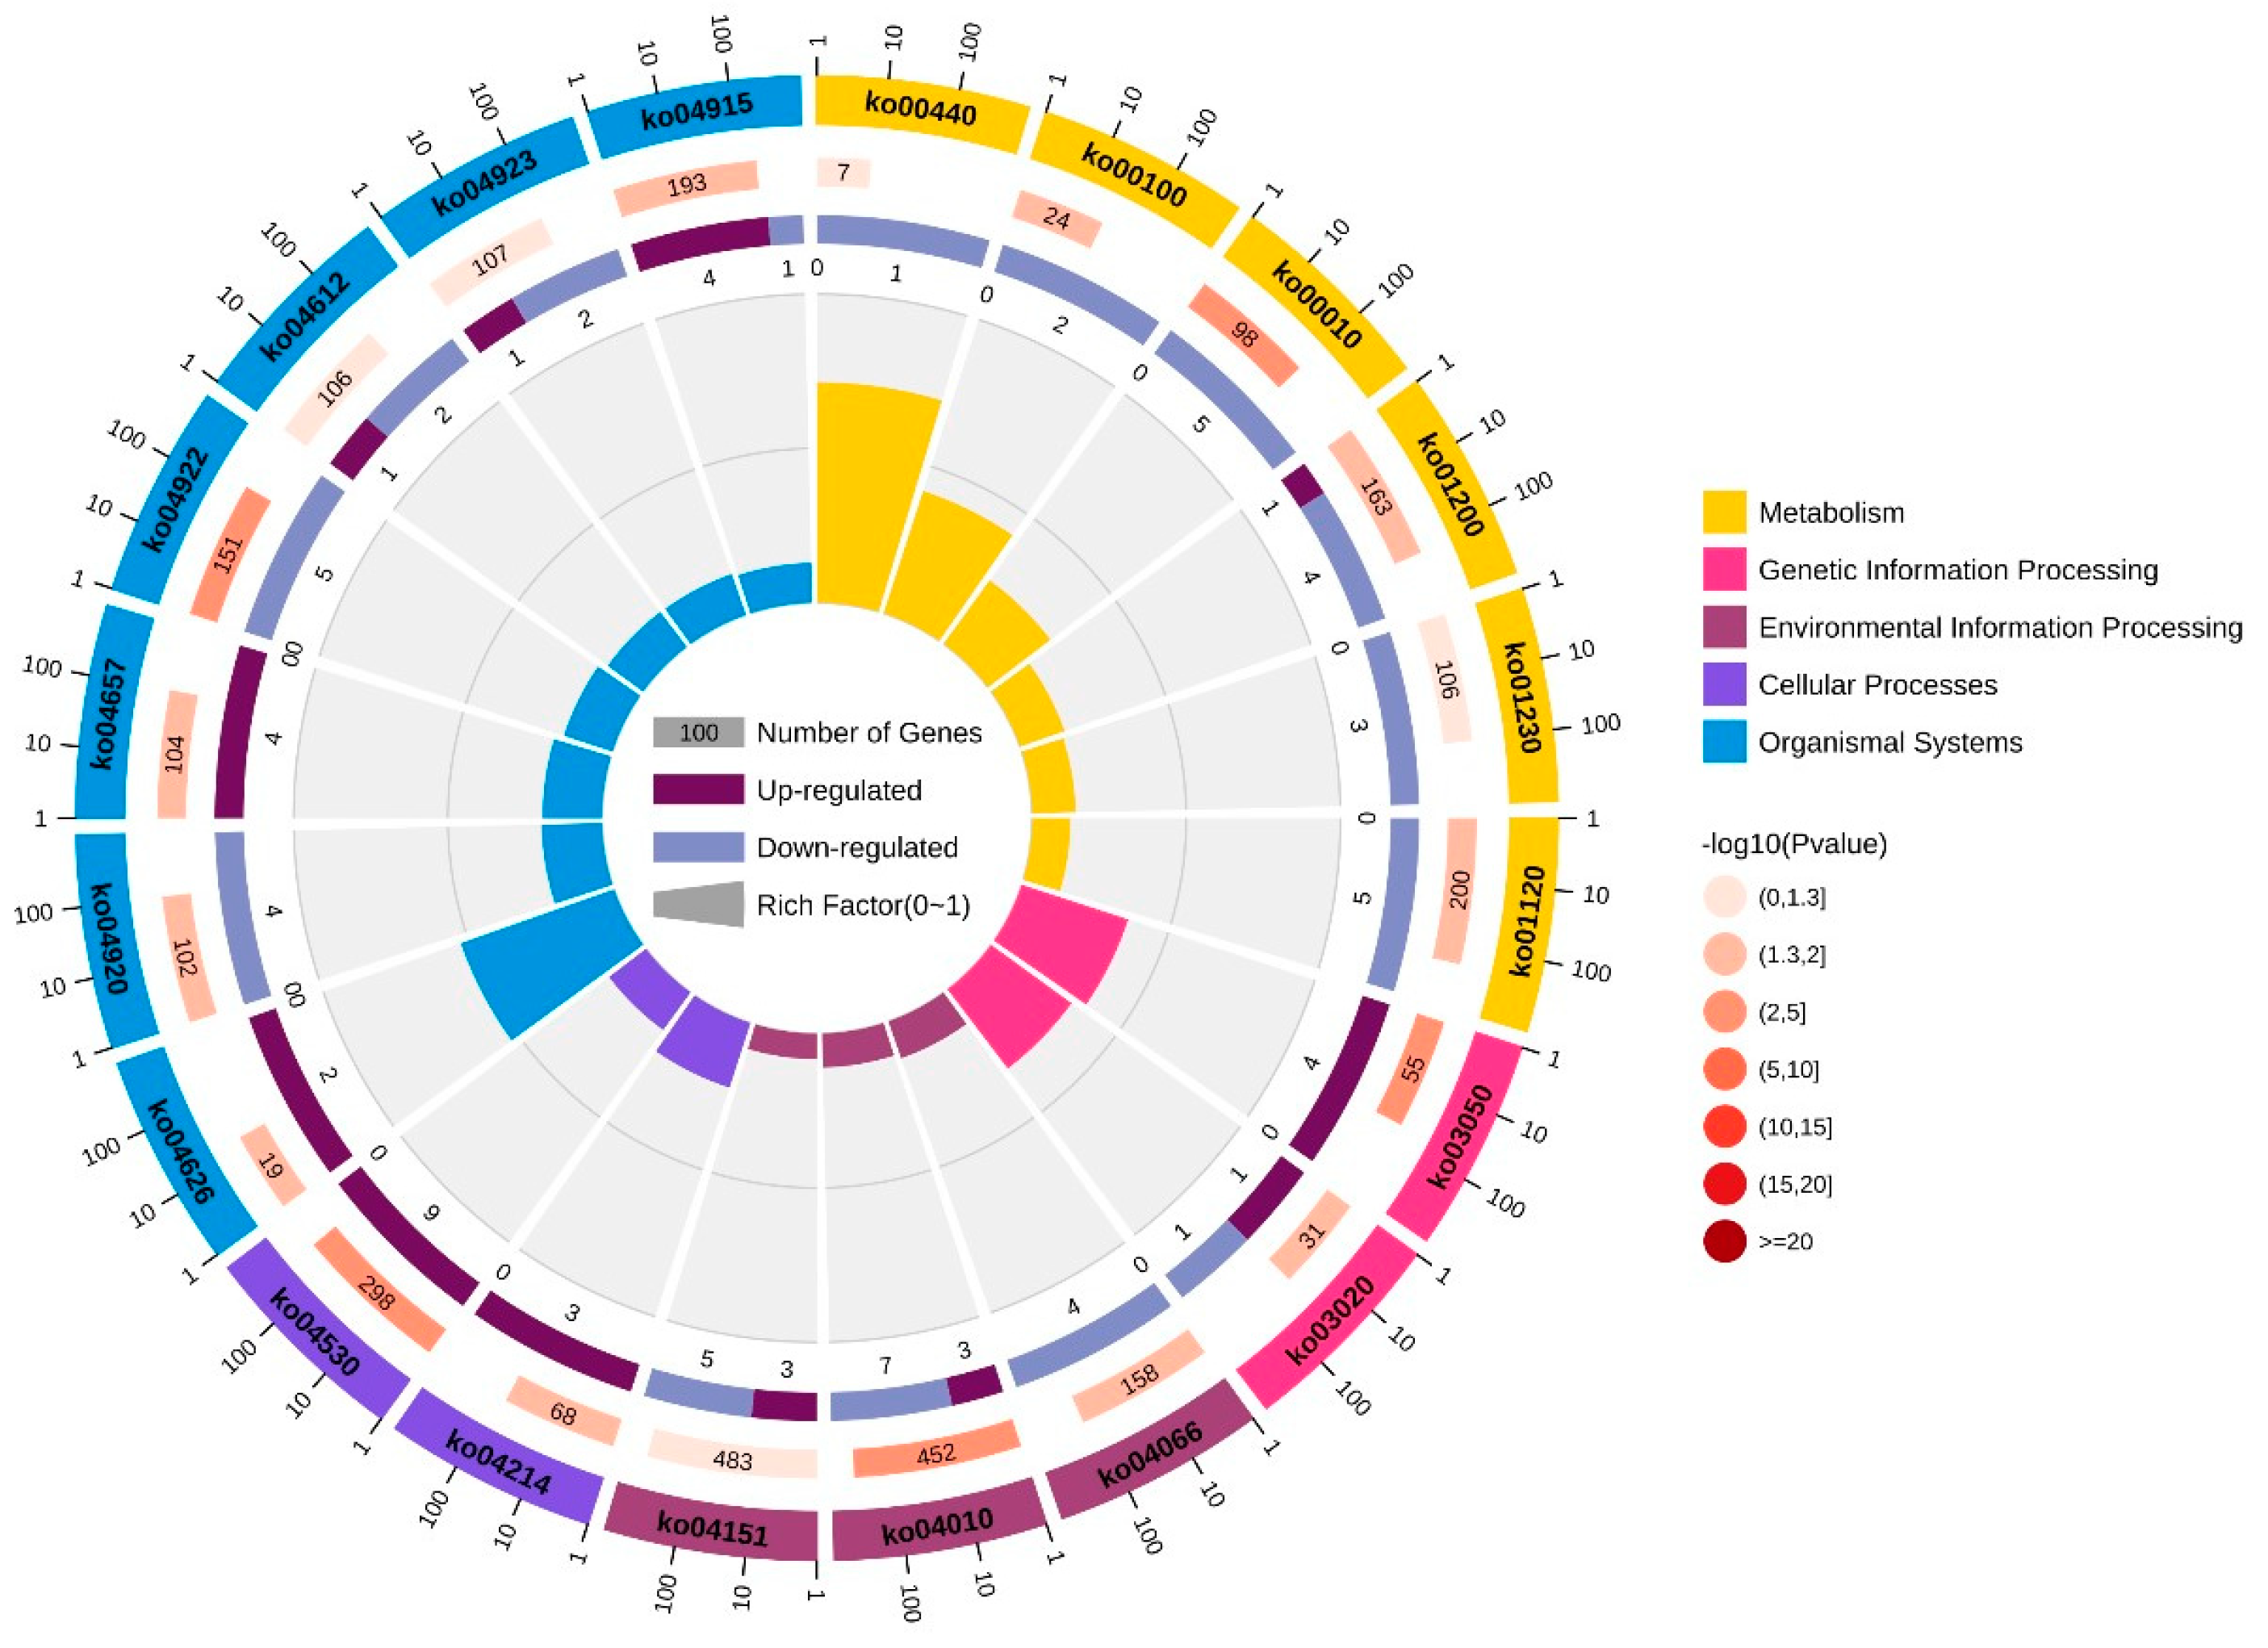
3.3. Enrichment Analysis of GO and KEGG Pathways on the Basis of DEGs
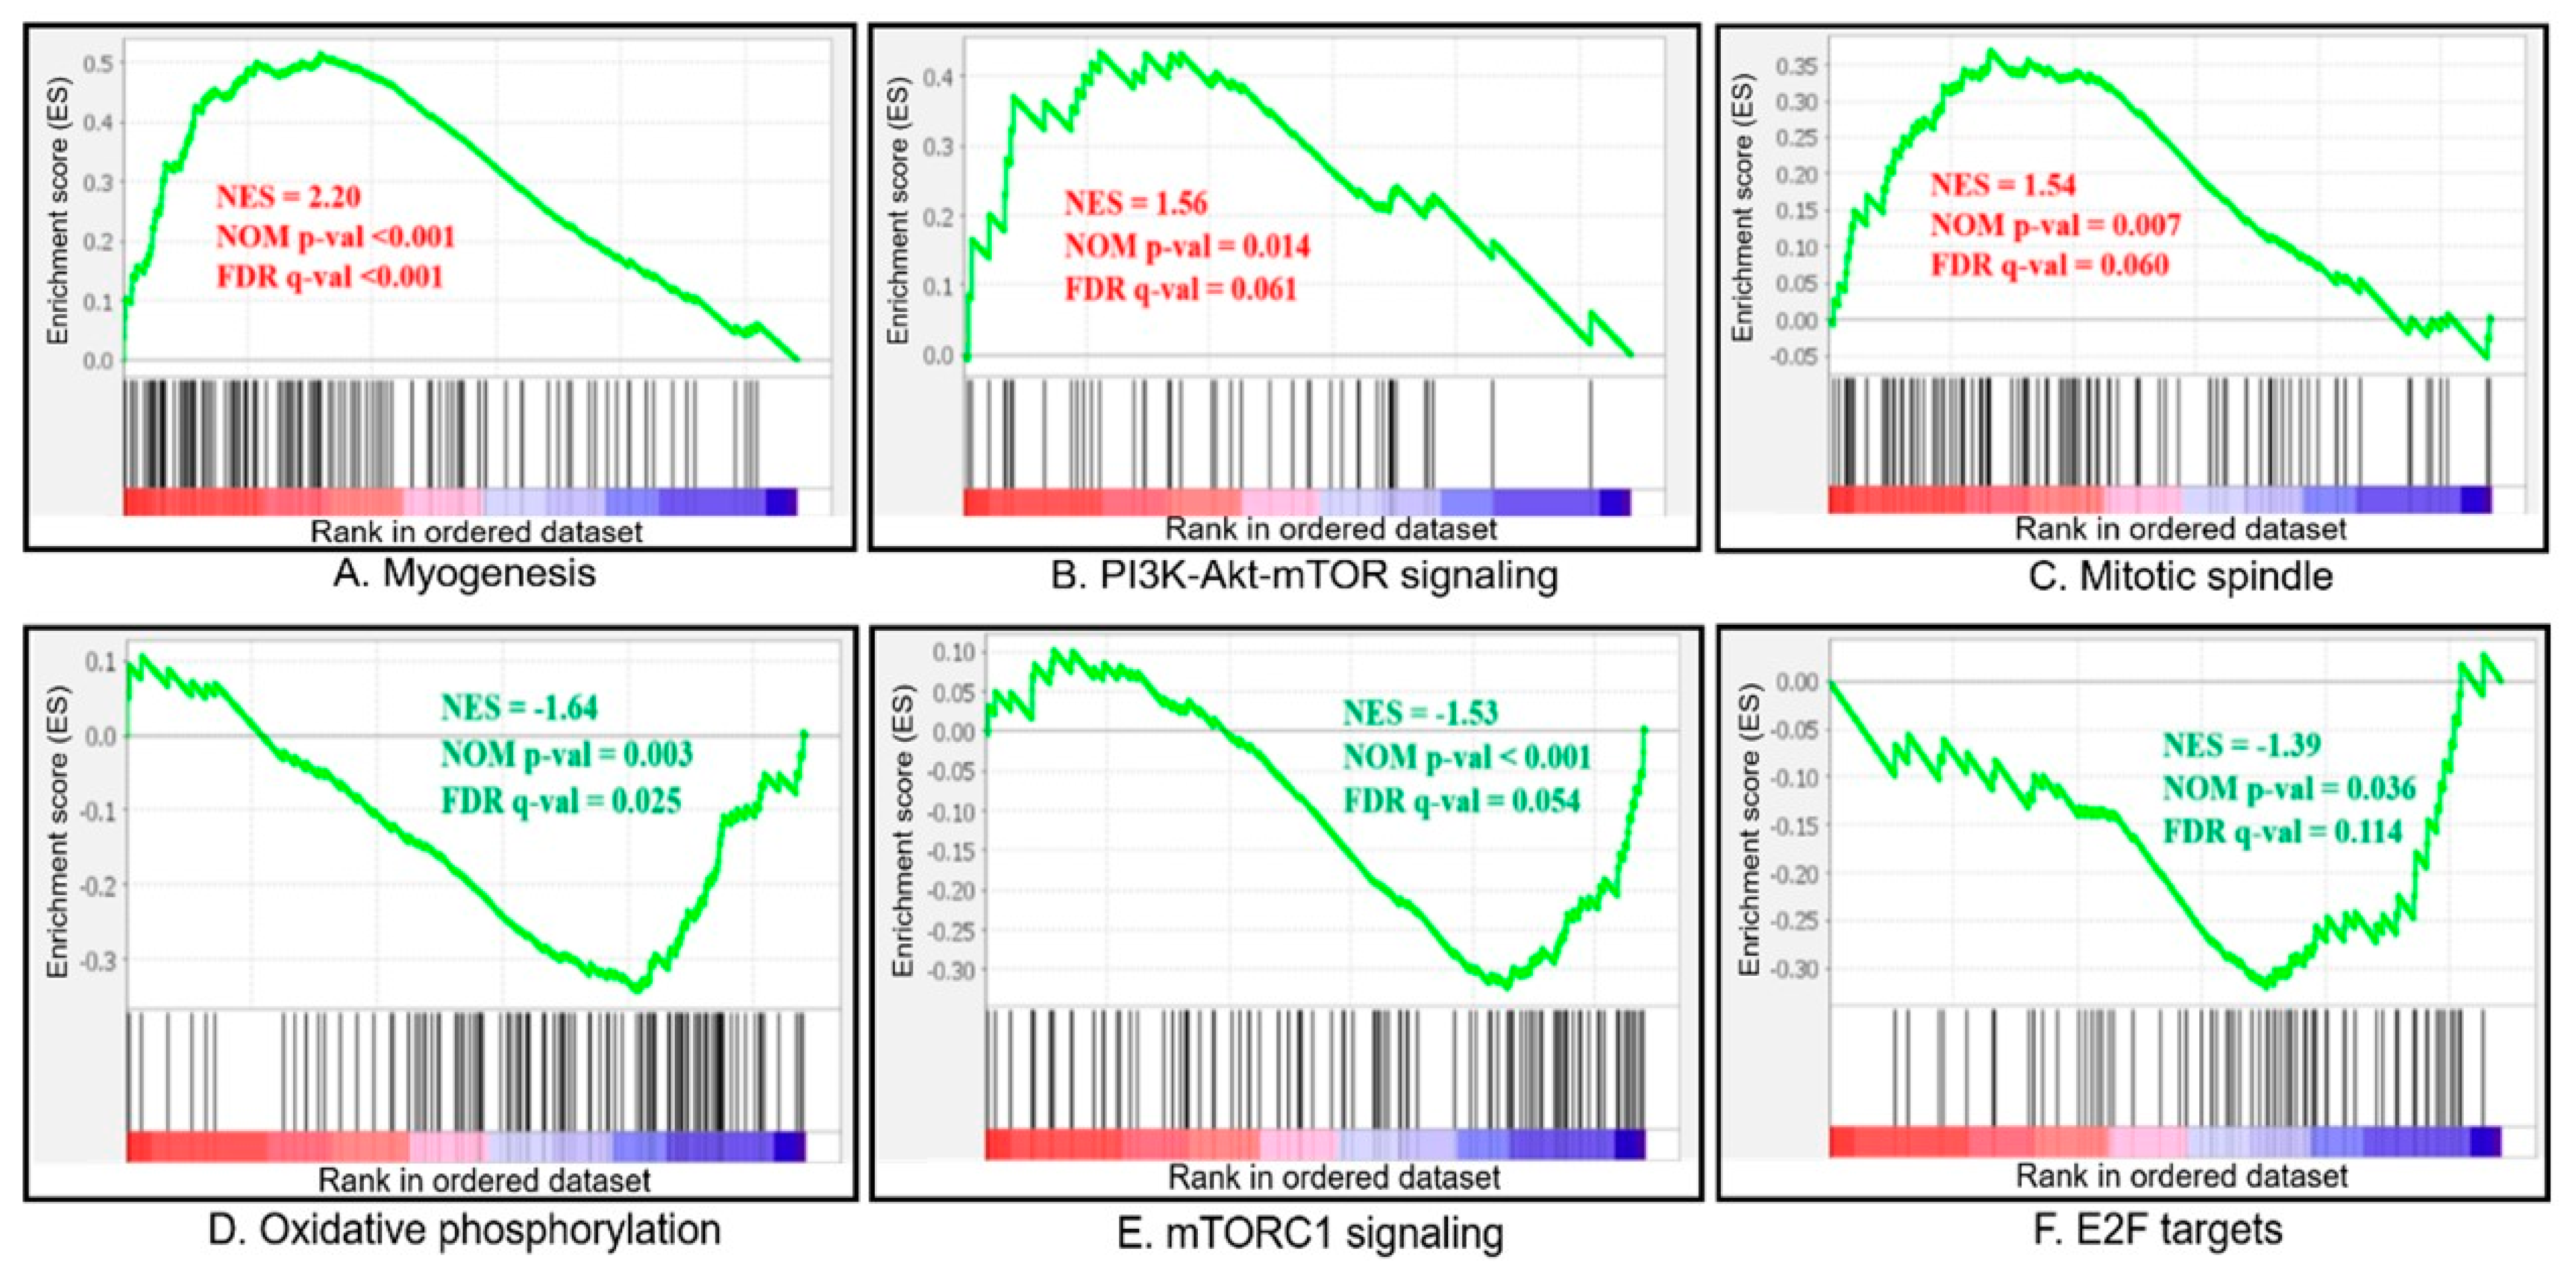
3.4. GSEA Analysis
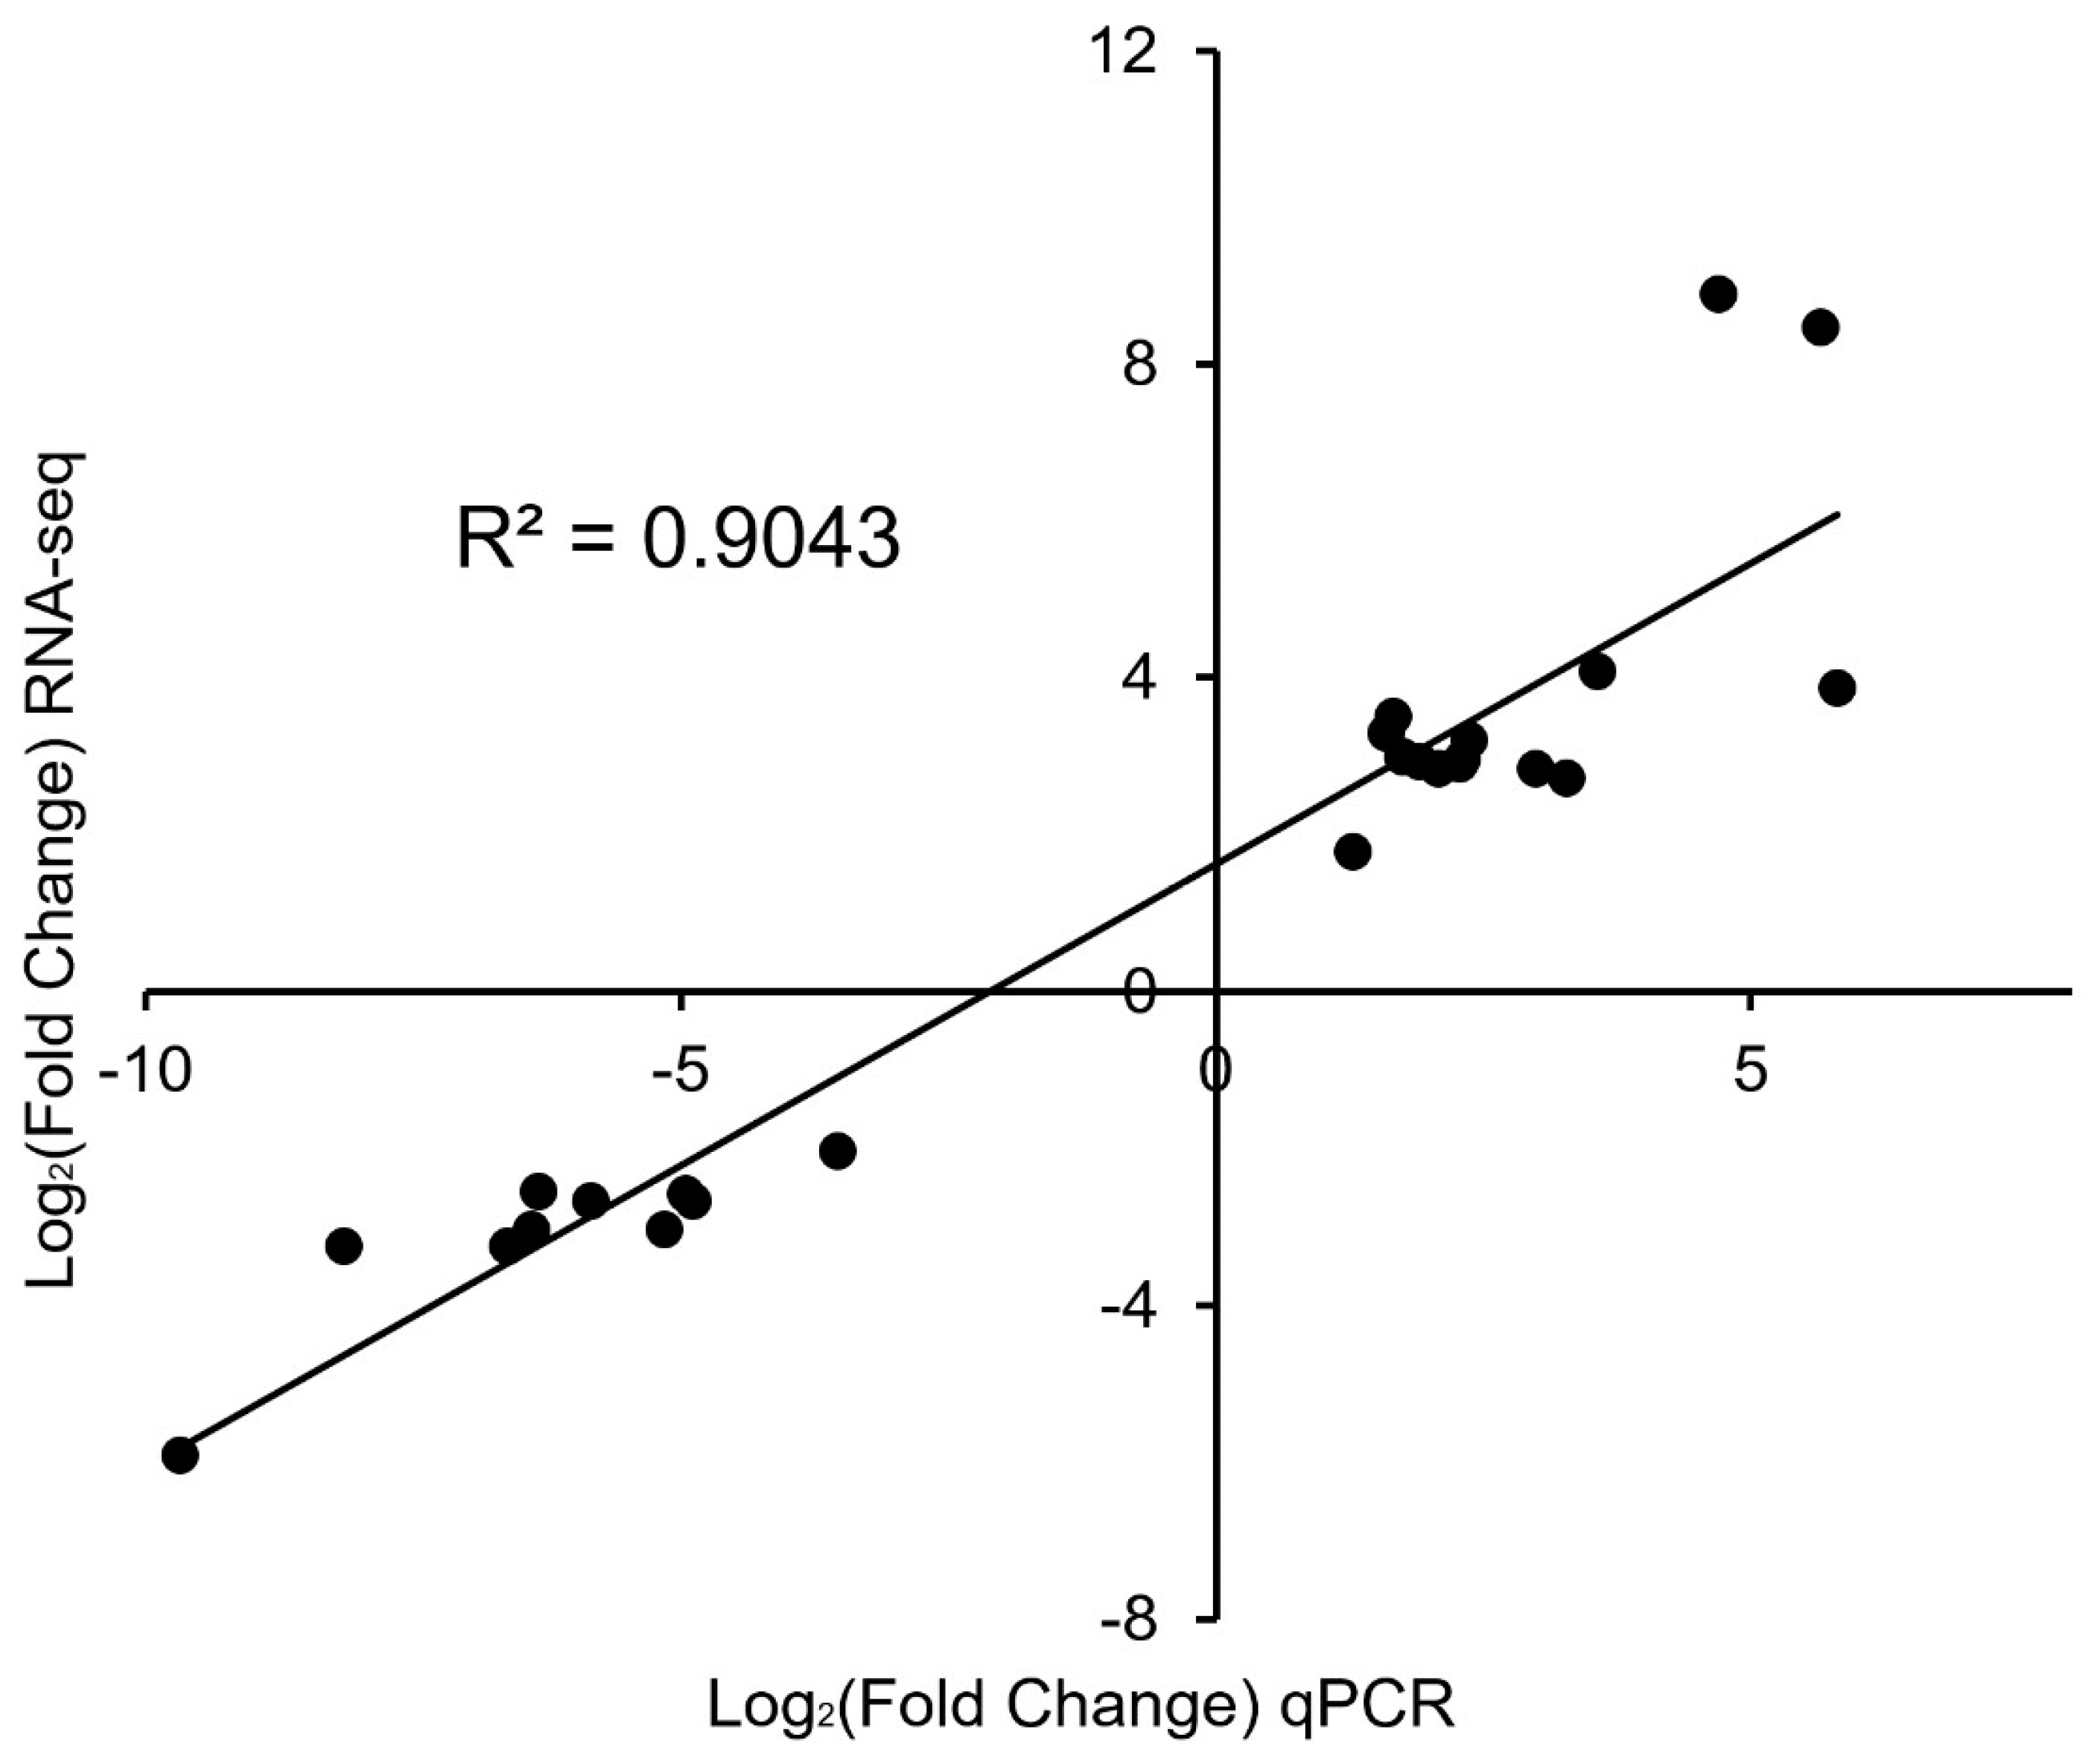
3.5. qPCR
4. Discussion
5. Conclusions
Supplementary Materials
Author Contributions
Funding
Institutional Review Board Statement
Data Availability Statement
Conflicts of Interest
References
- Mukai, Y.; Seng Lim, L. Morphogenesis of free neuromasts in the larvae of brown-marbled grouper Epinephelus fuscoguttatus. Mar. Freshw. Behav. Physiol. 2016, 49, 159–171. [Google Scholar] [CrossRef]
- Liu, G.; Gong, Z.; Li, Q. The complete mitochondrial genome of the breed Ningbo brown-marbled grouper (Epinephelus fuscoguttatus). Mitochondrial DNA B Resour. 2019, 4, 2109–2110. [Google Scholar] [CrossRef]
- Amenyogbe, E.; Chen, G.; Wang, Z. Identification, characterization, and expressions profile analysis of growth hormone receptors (GHR1 and GHR2) in Hybrid grouper (Epinephelus fuscoguttatus ♀ × Epinephelus polyphekadion ♂). Genomics 2020, 112, 1–9. [Google Scholar] [CrossRef]
- Sun, Y.; Guo, C.Y.; Wang, D.D.; Li, X.F.; Xiao, L.; Zhang, X.; You, X.; Shi, Q.; Hu, G.J.; Fang, C.; et al. Transcriptome analysis reveals the molecular mechanisms underlying growth superiority in a novel grouper hybrid (Epinephelus fuscogutatus ♀ × E. lanceolatus ♂). BMC Genet. 2016, 17, 24. [Google Scholar] [CrossRef] [PubMed]
- Zhu, K.; Zhang, D.; Wei, J.; Huang, G.; Guo, Y.; Jiang, S.; Yu, D. The complete mitochondrial genome of the hybrid grouper Epinephelus fuscoguttatus (♀) × Epinephelus lanceolatus (♂). Mitochondrial DNA A DNA Mapp. Seq. Anal. 2016, 27, 1968–1969. [Google Scholar] [CrossRef]
- Yang, Y.; Wu, L.; Wu, X.; Li, B.; Huang, W.; Weng, Z.; Lin, Z.; Song, L.; Guo, Y.; Meng, Z.; et al. Identification of Candidate Growth-Related SNPs and Genes Using GWAS in Brown-Marbled Grouper (Epinephelus fuscoguttatus). Mar. Biotechnol. 2020, 22, 153–166. [Google Scholar] [CrossRef]
- Liu, X.; Zeng, S.; Liu, S.; Wang, G.; Lai, H.; Zhao, X.; Bi, S.; Guo, D.; Chen, X.; Yi, H.; et al. Identifying the Related Genes of Muscle Growth and Exploring the Functions by Compensatory Growth in Mandarin Fish (Siniperca chuatsi). Front. Physiol. 2020, 11, 553563. [Google Scholar] [CrossRef] [PubMed]
- Fuentes, E.N.; Bjornsson, B.T.; Valdes, J.A.; Einarsdottir, I.E.; Lorca, B.; Alvarez, M.; Molina, A. IGF-I/PI3K/Akt and IGF-I/MAPK/ERK pathways in vivo in skeletal muscle are regulated by nutrition and contribute to somatic growth in the fine flounder. Am. J. Physiol. Regul. Integr. Comp. Physiol. 2011, 300, R1532–R1542. [Google Scholar] [CrossRef]
- Johnston, I.A.; Bower, N.I.; Macqueen, D.J. Growth and the regulation of myotomal muscle mass in teleost fish. J. Exp. Biol. 2011, 214, 1617–1628. [Google Scholar] [CrossRef]
- Johnston, I.A. Environment and plasticity of myogenesis in teleost fish. J. Exp. Biol. 2006, 209, 2249–2264. [Google Scholar] [CrossRef]
- Rehfeldt, C.; Te Pas, M.F.; Wimmers, K.; Brameld, J.M.; Nissen, P.M.; Berri, C.; Valente, L.M.; Power, D.M.; Picard, B.; Stickland, N.C.; et al. Advances in research on the prenatal development of skeletal muscle in animals in relation to the quality of muscle-based food. II--Genetic factors related to animal performance and advances in methodology. Animal 2011, 5, 718–730. [Google Scholar] [CrossRef]
- Weatherley, A.H.; Gill, H.S.; Lobo, A.F. Recruitment and maximal diameter of axial muscle fibres in teleosts and their relationship to somatic growth and ultimate size. J. Fish Biol. 1988, 33, 851–859. [Google Scholar] [CrossRef]
- Wood, A.W.; Duan, C.; Bern, H.A. Insulin-like growth factor signaling in fish. Int. Rev. Cytol. 2005, 243, 215–285. [Google Scholar] [CrossRef]
- Laviola, L.; Natalicchio, A.; Giorgino, F. The IGF-I signaling pathway. Curr. Pharm. Des. 2007, 13, 663–669. [Google Scholar] [CrossRef] [PubMed]
- Fuentes, E.N.; Valdes, J.A.; Molina, A.; Bjornsson, B.T. Regulation of skeletal muscle growth in fish by the growth hormone--insulin-like growth factor system. Gen. Comp. Endocrinol. 2013, 192, 136–148. [Google Scholar] [CrossRef] [PubMed]
- Wang, Z.; Gerstein, M.; Snyder, M. RNA-Seq: A revolutionary tool for transcriptomics. Nat Rev. Genet. 2009, 10, 57–63. [Google Scholar] [CrossRef]
- Liu, S.; Wang, X.; Sun, F.; Zhang, J.; Feng, J.; Liu, H.; Rajendran, K.V.; Sun, L.; Zhang, Y.; Jiang, Y.; et al. RNA-Seq reveals expression signatures of genes involved in oxygen transport, protein synthesis, folding, and degradation in response to heat stress in catfish. Physiol. Genom. 2013, 45, 462–476. [Google Scholar] [CrossRef]
- Sun, F.; Peatman, E.; Li, C.; Liu, S.; Jiang, Y.; Zhou, Z.; Liu, Z. Transcriptomic signatures of attachment, NF-kappaB suppression and IFN stimulation in the catfish gill following columnaris bacterial infection. Dev. Comp. Immunol. 2012, 38, 169–180. [Google Scholar] [CrossRef]
- Garcia de la Serrana, D.; Devlin, R.H.; Johnston, I.A. RNAseq analysis of fast skeletal muscle in restriction-fed transgenic coho salmon (Oncorhynchus kisutch): An experimental model uncoupling the growth hormone and nutritional signals regulating growth. BMC Genom. 2015, 16, 564. [Google Scholar] [CrossRef]
- Li, R.; Zhang, R.; Yi, J.; Guo, W.; Cheng, Q.; Zhi, L.; Lin, Y. Characterization and expression profiles of muscle transcriptome in Schizothoracine fish, Schizothorax prenanti. Gene 2019, 685, 156–163. [Google Scholar] [CrossRef]
- Li, S.; Liu, H.; Bai, J.; Zhu, X. Transcriptome assembly and identification of genes and SNPs associated with growth traits in largemouth bass (Micropterus salmoides). Genetica 2017, 145, 175–187. [Google Scholar] [CrossRef] [PubMed]
- Zhang, J.; Shen, Y.; Xu, X.; Dai, Y.; Li, J. Transcriptome Analysis of the Liver and Muscle Tissues of Black Carp (Mylopharyngodon piceus) of Different Growth Rates. Mar. Biotechnol. 2020, 22, 706–716. [Google Scholar] [CrossRef]
- Chen, S.; Zhou, Y.; Chen, Y.; Gu, J. fastp: An ultra-fast all-in-one FASTQ preprocessor. Bioinformatics 2018, 34, i884–i890. [Google Scholar] [CrossRef] [PubMed]
- Yang, Y.; Wang, T.; Chen, J.; Wu, L.; Wu, X.; Zhang, W.; Luo, J.; Xia, J.; Meng, Z.; Liu, X. Whole-genome sequencing of brown-marbled grouper (Epinephelus fuscoguttatus) provides insights into adaptive evolution and growth differences. Mol. Ecol. Resour. 2021, 22, 711–723. [Google Scholar] [CrossRef]
- Kim, D.; Paggi, J.M.; Park, C.; Bennett, C.; Salzberg, S.L. Graph-based genome alignment and genotyping with HISAT2 and HISAT-genotype. Nat. Biotechnol. 2019, 37, 907–915. [Google Scholar] [CrossRef]
- Liao, Y.; Smyth, G.K.; Shi, W. featureCounts: An efficient general purpose program for assigning sequence reads to genomic features. Bioinformatics 2014, 30, 923–930. [Google Scholar] [CrossRef]
- Robinson, M.D.; McCarthy, D.J.; Smyth, G.K. edgeR: A Bioconductor package for differential expression analysis of digital gene expression data. Bioinformatics 2010, 26, 139–140. [Google Scholar] [CrossRef] [PubMed]
- Kanehisa, M.; Araki, M.; Goto, S.; Hattori, M.; Hirakawa, M.; Itoh, M.; Katayama, T.; Kawashima, S.; Okuda, S.; Tokimatsu, T.; et al. KEGG for linking genomes to life and the environment. Nucleic Acids Res 2008, 36, D480–D484. [Google Scholar] [CrossRef]
- Subramanian, A.; Tamayo, P.; Mootha, V.K.; Mukherjee, S.; Ebert, B.L.; Gillette, M.A.; Paulovich, A.; Pomeroy, S.L.; Golub, T.R.; Lander, E.S.; et al. Gene set enrichment analysis: A knowledge-based approach for interpreting genome-wide expression profiles. Proc. Natl. Acad. Sci. USA 2005, 102, 15545–15550. [Google Scholar] [CrossRef]
- Ye, J.; Coulouris, G.; Zaretskaya, I.; Cutcutache, I.; Rozen, S.; Madden, T.L. Primer-BLAST: A tool to design target-specific primers for polymerase chain reaction. BMC Bioinform. 2012, 13, 134. [Google Scholar] [CrossRef]
- Saxton, R.A.; Sabatini, D.M. mTOR Signaling in Growth, Metabolism, and Disease. Cell 2017, 168, 960–976. [Google Scholar] [CrossRef] [PubMed]
- Dutta, H. Growth in fishes. Gerontology 1994, 40, 97–112. [Google Scholar] [CrossRef] [PubMed]
- Zhu, T.; Goh, E.L.K.; Graichen, R.; Ling, L.; Lobie, P.E. Signal transduction via the growth hormone receptor. Cell. Signal. 2001, 13, 599–616. [Google Scholar] [CrossRef] [PubMed]
- Behncken, S.N.; Waters, M.J. Molecular recognition events involved in the activation of the growth hormone receptor by growth hormone. J. Mol. Recognit. 1999, 12, 355–362. [Google Scholar] [CrossRef]
- Dhandare, B.C.; Rather, M.A.; Bhosale, B.P.; Pawar, R.; Guttula, P.K.; Pagarkar, A.U. Molecular modeling, docking and dynamic simulations of growth hormone receptor (GHR) of Labeo rohita. J. Biomol. Struct. Dyn. 2022, 40, 3024–3037. [Google Scholar] [CrossRef]
- Mullen, A.J.; Barton, P.J.R. Structural characterization of the human fast skeletal muscle troponin I gene (TNNI2). Gene 2000, 242, 313–320. [Google Scholar] [CrossRef]
- Zhu, X.; Wang, F.; Zhao, Y.; Yang, P.; Chen, J.; Sun, H.; Liu, L.; Li, W.; Pan, L.; Guo, Y.; et al. A gain-of-function mutation in Tnni2 impeded bone development through increasing Hif3a expression in DA2B mice. PLoS Genet. 2014, 10, e1004589. [Google Scholar] [CrossRef]
- Jepsen, M.R.; Kloverpris, S.; Mikkelsen, J.H.; Pedersen, J.H.; Fuchtbauer, E.M.; Laursen, L.S.; Oxvig, C. Stanniocalcin-2 inhibits mammalian growth by proteolytic inhibition of the insulin-like growth factor axis. J. Biol. Chem. 2015, 290, 3430–3439. [Google Scholar] [CrossRef]
- Lin, S.C.; Lin, M.H.; Horvath, P.; Reddy, K.L.; Storti, R.V. PDP1, a novel Drosophila PAR domain bZIP transcription factor expressed in developing mesoderm, endoderm and ectoderm, is a transcriptional regulator of somatic muscle genes. Development 1997, 124, 4685–4696. [Google Scholar] [CrossRef]
- Yang, W.J.; Wu, Y.B.; Chen, L.; Xu, K.K.; Xie, Y.F.; Wang, J.J. Two Chitin Biosynthesis Pathway Genes in Bactrocera dorsalis (Diptera: Tephritidae): Molecular Characteristics, Expression Patterns, and Roles in Larval-Pupal Transition. J. Econ. Entomol. 2015, 108, 2433–2442. [Google Scholar] [CrossRef]
- Ignatz, E.H.; Hori, T.S.; Kumar, S.; Benfey, T.J.; Braden, L.M.; Runighan, C.D.; Westcott, J.D.; Rise, M.L. RNA-Seq Analysis of the Growth Hormone Transgenic Female Triploid Atlantic Salmon (Salmo salar) Hepatic Transcriptome Reveals Broad Temperature-Mediated Effects on Metabolism and Other Biological Processes. Front. Genet. 2022, 13, 852165. [Google Scholar] [CrossRef] [PubMed]
- Valente, L.M.P.; Moutou, K.A.; Conceição, L.E.C.; Engrola, S.; Fernandes, J.M.O.; Johnston, I.A. What determines growth potential and juvenile quality of farmed fish species? Rev. Aquac. 2013, 5, S168–S193. [Google Scholar] [CrossRef]
- Laplante, M.; Sabatini, D.M. mTOR signaling in growth control and disease. Cell 2012, 149, 274–293. [Google Scholar] [CrossRef]
- Liu, G.Y.; Sabatini, D.M. mTOR at the nexus of nutrition, growth, ageing and disease. Nat. Rev. Mol. Cell. Biol. 2020, 21, 183–203. [Google Scholar] [CrossRef] [PubMed]
- Schiaffino, S.; Dyar, K.A.; Ciciliot, S.; Blaauw, B.; Sandri, M. Mechanisms regulating skeletal muscle growth and atrophy. FEBS J. 2013, 280, 4294–4314. [Google Scholar] [CrossRef]
- Ribback, S.; Cigliano, A.; Kroeger, N.; Pilo, M.G.; Terracciano, L.; Burchardt, M.; Bannasch, P.; Calvisi, D.F.; Dombrowski, F. PI3K/AKT/mTOR pathway plays a major pathogenetic role in glycogen accumulation and tumor development in renal distal tubules of rats and men. Oncotarget 2015, 6, 13036–13048. [Google Scholar] [CrossRef]
- Hietakangas, V.; Cohen, S.M. Regulation of tissue growth through nutrient sensing. Annu. Rev. Genet. 2009, 43, 389–410. [Google Scholar] [CrossRef]
- Menon, S.; Dibble, C.C.; Talbott, G.; Hoxhaj, G.; Valvezan, A.J.; Takahashi, H.; Cantley, L.C.; Manning, B.D. Spatial control of the TSC complex integrates insulin and nutrient regulation of mTORC1 at the lysosome. Cell 2014, 156, 771–785. [Google Scholar] [CrossRef] [PubMed]
- Huang, J.; Shi, C.; Gao, Y.; Su, J.; Shu, Y.; Zeng, N.; Zhai, G.; Jin, X.; Han, D.; He, J.; et al. Heterozygous depletion of pik3r1 improves growth and feed conversion efficiency in Gibel carp (Carassius gibelio). Aquaculture 2021, 545, 737207. [Google Scholar] [CrossRef]
- Rovira, M.; Arrey, G.; Planas, J.V. Exercise-Induced Hypertrophic and Oxidative Signaling Pathways and Myokine Expression in Fast Muscle of Adult Zebrafish. Front. Physiol. 2017, 8, 1063. [Google Scholar] [CrossRef]
- Norton, L.E.; Layman, D.K.; Bunpo, P.; Anthony, T.G.; Brana, D.V.; Garlick, P.J. The leucine content of a complete meal directs peak activation but not duration of skeletal muscle protein synthesis and mammalian target of rapamycin signaling in rats. J. Nutr. 2009, 139, 1103–1109. [Google Scholar] [CrossRef] [PubMed]
- Lansard, M.; Panserat, S.; Seiliez, I.; Polakof, S.; Plagnes-Juan, E.; Geurden, I.; Medale, F.; Kaushik, S.; Corraze, G.; Skiba-Cassy, S. Hepatic protein kinase B (Akt)-target of rapamycin (TOR)-signalling pathways and intermediary metabolism in rainbow trout (Oncorhynchus mykiss) are not significantly affected by feeding plant-based diets. Br. J. Nutr. 2009, 102, 1564–1573. [Google Scholar] [CrossRef] [PubMed]
- Seiliez, I.; Gabillard, J.C.; Skiba-Cassy, S.; Garcia-Serrana, D.; Gutierrez, J.; Kaushik, S.; Panserat, S.; Tesseraud, S. An in vivo and in vitro assessment of TOR signaling cascade in rainbow trout (Oncorhynchus mykiss). Am. J. Physiol. Regul. Integr. Comp. Physiol. 2008, 295, R329–R335. [Google Scholar] [CrossRef] [PubMed]


| Pathway ID | KEGG_B_Class | Pathway |
|---|---|---|
| ko00440 | Metabolism of other amino acids | Phosphonate and phosphinate metabolism |
| ko00100 | Lipid metabolism | Steroid biosynthesis |
| ko00010 | Carbohydrate metabolism | Glycolysis/gluconeogenesis |
| ko01200 | Global and overview maps | Carbon metabolism |
| ko01230 | Global and overview maps | Biosynthesis of amino acids |
| ko01120 | Global and overview maps | Microbial metabolism in diverse environments |
| ko03050 | Folding, sorting, and degradation | Proteasome |
| ko03020 | Transcription | RNA polymerase |
| ko04066 | Signal transduction | HIF-1 signaling pathway |
| ko04010 | Signal transduction | MAPK signaling pathway |
| ko04151 | Signal transduction | PI3K-Akt signaling pathway |
| ko04214 | Cell growth and death | Apoptosis—fly |
| ko04530 | Cellular community—eukaryotes | Tight junction |
| ko04626 | Environmental adaptation | Plant–pathogen interaction |
| ko04920 | Endocrine system | Adipocytokine signaling pathway |
| ko04657 | Immune system | IL-17 signaling pathway |
| ko04922 | Endocrine system | Glucagon signaling pathway |
| ko04612 | Immune system | Antigen processing and presentation |
| ko04923 | Endocrine system | Regulation of lipolysis in adipocyte |
| ko04915 | Endocrine system | Estrogen signaling pathway |
| GS | Biological Features | Number of Genes in Set | Size | ES (Fast vs. Slow) | NES (Fast vs. Slow) | Nominal p-Value | FDR q-Value |
|---|---|---|---|---|---|---|---|
| UPSET | |||||||
| MYOGENESIS | Genes involved in the development of skeletal muscle (myogenesis). | 200 | 114 | 0.514 | 2.189 | <0.001 | <0.001 |
| EPITHELIAL_MESENCHYMAL_TRANSITION | Genes defining epithelial–mesenchymal transition, as in wound healing, fibrosis, and metastasis. | 200 | 89 | 0.430 | 1.782 | <0.001 | 0.013 |
| ESTROGEN_RESPONSE_EARLY | Genes defining early response to estrogen. | 200 | 78 | 0.429 | 1.731 | 0.003 | 0.019 |
| APICAL_JUNCTION | Genes encoding components of the apical junction complex. | 200 | 91 | 0.418 | 1.707 | 0.001 | 0.021 |
| PI3K_AKT_MTOR_SIGNALING | Genes up-regulated by activation of the PI3K/AKT/mTOR pathway. | 105 | 43 | 0.435 | 1.558 | 0.018 | 0.068 |
| MITOTIC_SPINDLE | Genes important for mitotic spindle assembly. | 199 | 99 | 0.369 | 1.534 | 0.007 | 0.069 |
| HYPOXIA | Genes up-regulated in response to low oxygen levels (hypoxia). | 200 | 95 | 0.348 | 1.436 | 0.020 | 0.134 |
| DOWNSET | |||||||
| MYC_TARGETS_V1 | A subgroup of genes regulated by MYC-version 1 (v1). | 200 | 83 | −0.507 | −2.327 | 0.000 | 0.000 |
| MYC_TARGETS_V2 | A subgroup of genes regulated by MYC-version 2 (v2). | 58 | 28 | −0.627 | −2.210 | 0.000 | 0.000 |
| UNFOLDED_PROTEIN_RESPONSE | Genes up-regulated during unfolded protein response, a cellular stress response related to the endoplasmic reticulum. | 113 | 59 | −0.416 | −1.772 | 0.000 | 0.010 |
| OXIDATIVE_PHOSPHORYLATION | Genes encoding proteins involved in oxidative phosphorylation. | 200 | 109 | −0.343 | −1.634 | 0.004 | 0.027 |
| MTORC1_SIGNALING | Genes up-regulated through activation of the mTORC1 complex. | 200 | 98 | −0.323 | −1.504 | 0.004 | 0.066 |
| DNA_REPAIR | Genes involved in DNA repair. | 150 | 64 | −0.341 | −1.482 | 0.018 | 0.066 |
| E2F_TARGETS | Genes encoding cell-cycle-related targets of E2F transcription factors. | 200 | 69 | −0.320 | −1.414 | 0.026 | 0.095 |
Disclaimer/Publisher’s Note: The statements, opinions and data contained in all publications are solely those of the individual author(s) and contributor(s) and not of MDPI and/or the editor(s). MDPI and/or the editor(s) disclaim responsibility for any injury to people or property resulting from any ideas, methods, instructions or products referred to in the content. |
© 2023 by the authors. Licensee MDPI, Basel, Switzerland. This article is an open access article distributed under the terms and conditions of the Creative Commons Attribution (CC BY) license (https://creativecommons.org/licenses/by/4.0/).
Share and Cite
Wang, T.; Yang, Y.; Gong, S.; Wu, X.; Zeng, L.; Tao, Y.; Zhong, C.; Song, L.; Liu, X. Transcriptome Analysis Reveals Differences in Gene Expression in the Muscle of the Brown-Marbled Grouper (Epinephelus fuscoguttatus) with Different Growth Rates. Fishes 2023, 8, 309. https://doi.org/10.3390/fishes8060309
Wang T, Yang Y, Gong S, Wu X, Zeng L, Tao Y, Zhong C, Song L, Liu X. Transcriptome Analysis Reveals Differences in Gene Expression in the Muscle of the Brown-Marbled Grouper (Epinephelus fuscoguttatus) with Different Growth Rates. Fishes. 2023; 8(6):309. https://doi.org/10.3390/fishes8060309
Chicago/Turabian StyleWang, Tong, Yang Yang, Shirui Gong, Xi Wu, Leilei Zeng, Yuhao Tao, Chaoyue Zhong, Leling Song, and Xiaochun Liu. 2023. "Transcriptome Analysis Reveals Differences in Gene Expression in the Muscle of the Brown-Marbled Grouper (Epinephelus fuscoguttatus) with Different Growth Rates" Fishes 8, no. 6: 309. https://doi.org/10.3390/fishes8060309
APA StyleWang, T., Yang, Y., Gong, S., Wu, X., Zeng, L., Tao, Y., Zhong, C., Song, L., & Liu, X. (2023). Transcriptome Analysis Reveals Differences in Gene Expression in the Muscle of the Brown-Marbled Grouper (Epinephelus fuscoguttatus) with Different Growth Rates. Fishes, 8(6), 309. https://doi.org/10.3390/fishes8060309