Article

Human Chorionic Gonadotropin Enhancement of Early Maturation and Consequences for Reproductive Success of Feminized European Eel (Anguilla anguilla)

1
Animal Breeding and Genomics Department, Wageningen University & Research, 6708 PB Wageningen, The Netherlands
2
Experimental Zoology Group, Wageningen University and Research, 6700 AH Wageningen, The Netherlands
3
Palingkwekerij Koolen, 5571 XC Bergeijk, The Netherlands
4
Wageningen Eel Reproduction Experts B.V., 3708 AB Wageningen, The Netherlands
*
Author to whom correspondence should be addressed.
Fishes 2023, 8(6), 281; https://doi.org/10.3390/fishes8060281
Submission received: 14 April 2023 / Revised: 16 May 2023 / Accepted: 22 May 2023 / Published: 25 May 2023
(This article belongs to the Special Issue Biology and Ecology of Eels)

Abstract

:
To induce oocyte development, eels are weekly injected with salmon or carp pituitary extract (CPE). The weekly handling and hormone peaks result in inferior oocyte quality; therefore, alternative treatments that improve oocyte quality and reproductive success require investigation. The enhancement of early sexual maturation by a single injection with human chorionic gonadotropin (hCG), administered prior to CPE treatment, was investigated. Fifty feminized eels were subjected to simulated migration, after which eels received either a hCG or a sham injection. After two months, the hCG-treated eels showed an increase in eye size, gonadosomatic index (GSI), and plasma 11-ketotestosterone concentration, when compared with the sham-injected controls. The hCG-treated eels showed increases in oocyte diameter and lipid area, and in ovarian expression of aromatase (cyp19), follicle stimulating hormone receptor (fshr) and lipoprotein lipase (lpl). Yolk was present in the oocytes of the hCG-treated eels, not yet in the oocytes of the controls. The hCG-induced deposition of yolk may relate to early-life treatment with 17β-estradiol during feminization. hCG-treated eels required four CPE injections less to mature than the controls. hCG treatment may benefit reproductive success in feminized eels by initiating vitellogenesis and reducing the hypophysation period, although larvae were obtained from most females in both groups.
Key Contribution: This study quantified the many and diverse stimulatory effects of a single injection with human chorionic gonadotropin on the early sexual maturation of feminized European eels, which included the induced deposition of yolk in the oocytes. When administered prior to the regular protocol of induced maturation by weekly injections of pituitary extract, hCG injection shortened the hypophysation period significantly, which may benefit reproductive success.

1. Introduction

Chorionic gonadotropin is produced by the placenta of pregnant mammals and belongs, together with the gonadotropins follicle-stimulating hormone Fsh and luteinizing hormone Lh, to the family of glycoprotein hormones [1]. Fsh and Lh are essential in the regulation of sexual maturation in vertebrates [2], including the European eel. Fsh induces vitellogenesis in females and spermatogenesis in males; Lh plays a major role in oocyte maturation in females and spermiation in males (e.g., [3,4]). Human chorionic gonadotropin (hCG) is an Lh-analog and binds and activates the luteinizing hormone receptor (Lhr) [5,6,7].
11-Ketotestosterone (11KT) plays a major role during previtellogenesis in female eels [8]. This non-aromatizable androgen acts during the migratory silver stage of the eels and is referred to as the main puberty initiating androgen [9]. 11KT is responsible for ovarian lipid accumulation in eels, since elevated lipoprotein lipase (Lpl) levels were found after an increase in 11KT [10]. Lipid quantity and composition are key determinants of egg quality in marine fishes [11]. 11KT also induces the expression of the ovarian fshr [8] and stimulates the production of the phospholipoglycoprotein vitellogenin (Vtg; [12]).
Fsh controls the synthesis of 17β-estradiol (E2) by increasing ovarian aromatase (cyp19) activity during vitellogenesis [13]. Cyp19 is an enzyme that converts testosterone (T) into E2. When released into the blood circulation of the eel, E2 will bind to its hepatic nuclear estrogen receptor (Esr-1) and therewith induces the synthesis of Vtg by hepatocytes [14]. When released into the circulation, Vtg binds to its ovarian vitellogenin receptor (Vtgr) [15] and is cleaved into yolk protein in the vitellogenic oocytes [16]. Yolk is the main nutrient for developing embryos and is essential for early larval survival and development [17].
To induce the sexual maturation of eels in captivity, hypophysation is the most practiced way. Recently, also eel specific recombinant gonadotropins have successfully been applied to mature eels and produce larvae [18]. Hypophysation involves weekly injections with common carp (Cyprinus carpio) or Atlantic salmon (Salmo salar) pituitary extracts (CPE and SPE, respectively) leading to weekly handling of the eels and peaking hormone levels. Weekly handling causes stress in the animals and increases their susceptibility to diseases [19,20]. The weekly peaks in hormone levels are associated with oocyte developmental abnormalities [21]. Therefore, alternatives for hypophysation are under investigation, such as steroid implants [22] and human chorionic gonadotropin (hCG).
hCG is generally used to mature male eels. Fontaine [23] discovered that urine of pregnant women could be used to mature male eels, and later, it was shown that hCG was the active compound causing the effects. hCG has a longer half-life compared to other gonadotropins because it contains four glycosylated serine residues [24]. Therefore, hCG does not have to be injected weekly, in contrast to pituitary extract. In the study of Nguyen et al. [25], the effects of hCG were tested on ovarian morphology, sex steroid levels and messenger ribonucleic acid (mRNA) levels of genes expressed in the pituitary, in the short-finned eel A. australis. The study suggested the involvement of the Fsh receptor (Fshr) in the regulation of previtellogenic oocyte development. Eels that were treated with hCG (20, 100 or 500 IU kg−1 BW) showed significant increases in ovarian fshr mRNA and plasma levels of 11KT and E2. The study concluded that hCG stimulates oocyte growth and development during previtellogenesis; yolk deposition, however, was not observed [25].
In this study, we aimed to determine the effects of an hCG injection on the early maturation in feminized European eels and to assess the consequences for reproductive success. Effects of an hCG injection, administered before the regular protocol of CPE injections to mature European eels, and specifically feminized eels, have not been studied before. The controlled production of larvae enabled us to assess the potential consequences for reproductive success. Specifically, effects were investigated by analyses of the changes in external body appearance and biometry; of the gonadosomatic index (GSI) as determined by ultrasound; of the plasma 11 KT levels as determined by ELISA; of the expression patterns of key hepatic and ovarian genes in vitellogenesis; of oocyte histology, and of the relation with indicators of reproductive success.

2. Materials and Methods

2.1. Experimental Setup

Young elvers were transferred from eel farm Palingkwekerij Koolen (Bergeijk, The Netherlands) to the animal experimental facilities of Wageningen University & Research (CARUS, Wageningen, The Netherlands) and feminized by feeding them with E2-coated pellets over a 7 month period [26,27]. The feminizing treatment does not only realize female eels but also accelerates the oocyte development before the vitellogenic stage and shortens the generation time to 2 years from the glass-eel stage [28]. After an additional 6 months of feeding with a custom-made broodstock diet (protein 525 g kg−1, fat 98 g kg−1 and ash 76 g kg−1), 50 eels were transferred to seawater (Tropic Marine, 36 ppt) and fed no longer for a period of 7 weeks.
After this period, the 50 eels were anesthetized (phenoxy ethanol 0.2 mL L−1), portrait pictures were taken, and biometric data were collected. Eels were then subjected to a simulated migration (based on [29]) and swam for 83 days in a swim gutter against a flow of 0.5 m s−1 equaling a distance of 3514 km. Eels were swimming in the dark at daily alternating temperatures from 10 °C to 15 °C.
After this simulated migration, all 50 eels were anesthetized again, portrait pics were taken, and biometric data were collected. Eels were now also tagged with passive integrated transponders (PITs) and randomly divided into two groups (pre-treatment groups). One group of eels received an hCG injection (3000 IU kg−1; hCG-treated group; N = 25) and the other group received a physiological salt solution injection of the same volume (control or C group; N = 25). After 8 weeks, again all eels were anesthetized, portrait pics taken, biometric data were collected, and also blood samples were extracted (post-treatment groups). N = 10 eels from each group were dissected, and gonad weight (GW), liver weight (LW), gastrointestinal tract weight (GITW) and swim bladder weight (SBW) were determined. Tissue samples were taken from the liver and ovary and stored in RNAlater stabilization solution (Ambion) at −20 °C for RT-PCR. A second ovary sample was fixed in 4% Paraformaldehyde overnight at 4 °C and then stored in 70% ethanol before histological analysis. The remaining N = 15 eels from each group were used for hypophysation to sexually mature the eels and determine reproductive success (described in Section 2.7).

2.2. Biometrical Parameters

Portrait pics were taken of each eel three times (pre-migration; pre-treatment and post-treatment), and the images were scaled and aligned using ImageJ to visualize morphological changes. Eels were measured for biometrical parameters body length (BL), body weight (BW), body girth (BG), horizontal eye diameter (EDh) and vertical eye diameter (EDv). From these measurements, the Fulton’s condition factor (K; [30]), body girth index (BGI; [31]) and the eye index (EI; [32]) were calculated.

2.3. Blood Collection and 11KT Plasma Measurements

Blood samples (0.5 mL) were extracted post treatment from the caudal artery with a heparin-flushed syringe and then immediately put on ice. Plasma was separated by centrifugation (10,000 rpm, 5 min, 4 °C) and stored at −80 °C. Plasma 11KT concentrations in pg mL−1 were determined in N = 17 samples from the hCG-treated and control groups, as duplicates using the 11KT ELISA kit (Item No. 582751) from the Cayman Chemical Company (Ann Arbor, Michigan, Unites States) according to the manufacturer’s protocol. Three outliers (N = 1 of the control group, N = 2 of the hCG-treated group) with values > 2* SD were not considered in the analysis.

2.4. Tissue Indices and Ultrasound

Gonad weight, liver weight, gastrointestinal tract weight and swim bladder weight were used to calculate the GSI, the hepatosomatic Index (HSI), the gastrointestinal tract index (GITI) and the swim-bladder index (SBI), respectively, by dividing the tissue weights (g) by total body weight (g) and multiplying the outcome times 100.
GSI was also determined non-invasively by ultrasonography (MyLabFiveTMVet with a LA435 probe, Esaote, Genoa, Italy) for all eels at pre-migration, pre-treatment and post-treatment timepoints following the methodology developed by Bureau du Colombier et al. [33] and further validated by Palstra et al. [22]. The ultrasound videos were analyzed using ImageJ to determine the surface area of the gonads. The GSI was calculated according to the following formula [33]:
GSI = BW/(e^(3.02753 + 1.32056 × LN ((A1 + A2 + A3)/3))) × 100
BW: body weight (g); A1: area measurement 1 (cm2); A2: area measurement 2 (cm2); A3: area measurement 3 (cm2).
The GSI values as calculated on the basis of ultrasound videos of dissected eels were compared with their real GSI values. GSI values of two eels in the hCG-treated group were not considered as weights were wrongly determined, leaving N = 8 for the hCG group.

2.5. Histology

Gonadal samples were embedded in paraffin wax and cut into 5 μm sections using a motorized rotary microtome (HM350 Microm). Per sample, two slides containing 6 sections, each at least 30 μm apart, were stained for nuclei and cytoplasm using Mayer’s hematoxylin–eosin staining method. Sections were imaged using a Leica DM6b upright microscope. For each sample, the 10 largest oocytes with a visible central nucleus were selected. These oocytes were measured for their diameter using the image-processing software ImageJ [34]. The lipid area and the lipid area relative to the oocyte area were also determined using ImageJ.

2.6. RT-PCR

Total RNA of liver and ovary tissue was isolated and purified using an RNeasy Plus Universal Mini Kit (Qiagen) according to the manufacturer’s instructions. RNA quantity (>500 ng mL−1) and quality (>2.0 260/280 ratio) were determined by Nanodrop. Total RNA was reverse transcribed (Applied BiosystemsTM High-Capacity cDNA Reverse Transcription Kit) according to the manufacturer’s instructions, and the resulting cDNA was diluted to a concentration of 1/50 ng cDNA μL−1 in MilliQ (250 ng RNA μL−1 solution was used to transcribe into 4 μL cDNA, or RNA-equivalent, that was diluted in 196 μL MilliQ). mRNA levels were quantified using the Quantstudio 5 Real-Time RT-PCR system (ThermoFisher Scientific). RT-PCR was performed on a 20 µL mixture containing cDNA (5 µL, 1/50 ng µL−1), primers (1 µL, 5µM each), SensiFAST SYBR Lo-Rox Kit (10 μL; Bioline, Luckenwalde, Germany) and Milli-Q (4 µL). RT-PCR assays were run using a temperature profile starting at the hold stage (95 °C, 2 min), followed by 30 to 40 cycles of denaturation (95 °C, 15 s) and annealing/extension (°C depending on the selected target gene or housekeeping gene—HKG, 30 s and 72 °C, 5 s) and ending with the melt curve stage (95 °C, 1 s followed by 60 °C, 20 s) gradually heating (0.1 °C s−1) to 95 °C. The melting curves were analyzed for reaction specificity and the presence of primer cross-reaction. Primer efficiencies were determined using a series of dilutions to generate the standard curves. The choices for the selected target genes and HKGs were based on recent literature ([18,35,36,37,38]; Table 1).
Estrogen receptor-1 (esr-1) was selected as target gene in the liver. Ribosomal protein L36 (l36) was used as HKG to normalize esr-1 expression by calculating the relative fold change (fc) using the 2-ΔΔCt method.
For the ovary, six target genes were selected. These target genes were Aromatase (cyp19), Follicle-stimulating hormone receptor (fshr), Luteinizing hormone receptor-1 (lhr-1), Luteinizing hormone receptor-2 (lhr-2), Lipoprotein lipase (lpl) and Vitellogenin receptor (vtgr). The primers of Lpl and Lhr-2 were tested for their efficiencies, since the Lpl primer was newly designed, and Lhr-2 had an overall low expression. The efficiency of Lpl was tested to be 93%, and the efficiency of Lhr-2 was 106%; thus, both primers had efficiencies within the desired range (90–110%) and were used for further analysis. As HKGs, 18 s ribosomal RNA (18s), Elongation factor-1 (elf-1) and l36 were used to normalize the target genes by calculating the relative fc values using the 2-ΔΔCt method. The BestKeeper tool [39] was used to determine Ct values from 18S, elf-1 and l36 combined, so no significant differences were found between the Ct values of the hCG group and the C group.

2.7. Reproduction

The eels used for propagation (N = 15 for each of the groups) were fully matured by hypophysation. Eels received multiple weekly CPE injections until a BWI threshold value of 110 was crossed and eels received an extra booster CPE injection. Final ovulation was then induced by 17,20β-dihydroxy-4-pregnen-3-one (DHP) injection [40,41,42]. For each group, N = 3 eels died before egg release. From the remaining eels (N = 12 from each group), the days to reach a BWI of 110, the number of CPE injections to reach a BWI of 110, the hours after the final DHP injection until egg release, the percentage of floating eggs, the number of batches of eggs that were obtained and the number of batches that gave embryos and larvae, and the average survival days post-hatch (dph) and the maximal survival dph, were determined.

2.8. Data Analysis

Data analyses were performed using R-studio (version 4.1.1). To test for normal distribution of data, the Shapiro test was performed. If the data were normally distributed (p ≥ 0.05), Welch two sample t-tests were performed. If data were not normally distributed (p ≤ 0.05), Wilcoxon rank sum tests were performed. Data were compared using paired tests on the same eels between pre- and post-treatment values, and unpaired when comparing eels of the hCG-treated group with eels of the control group. GSI values as calculated on the basis of ultrasound data were compared with the GSI values as determined by dissection, on the same eels post-treatment, by paired two sample t-tests. Data were considered significantly different when p ≤ 0.05.

3. Results

3.1. Simulated Migration

All experimental eels managed to complete the simulated migration and were included for comparison of post-migration vs. pre-migration biometrical measurements. Significant decreases were apparent for BW, K and BGI (p < 0.001). BW decreased by 57 g, from 398 ± 48 g to 341 ± 42 g. K decreased from 0.204 ± 0.015 g to 0.175 ± 0.013, and BGI decreased from 0.200 ± 0.008 g to 0.179 ± 0.008. EI was 7.43 ± 0.17 after migration and not significantly higher than the average value of 7.32 ± 0.16 before migration.

3.2. Portrait Pictures and Biometry

The portrait images of the experimental eels indicated changes in head morphology that were associated with hCG treatment (Figure 1). In eels of the hCG-treated group, eye enlargement was observed that was not observed in the controls. Eels from the hCG-treated group also showed darkening of the pectoral fins and on the dorsal side of the body, in contrast to the controls. The head shape of the hCG-treated eels was less acute than the head shape of the controls. EI (p < 0.001; Table 2) was considerably higher in eels of the hCG-treated group as compared to the controls. Additionally, K (p < 0.01; Table 2) and BGI (p < 0.001; Table 2) values were higher in eels of the hCG-treated group.

3.3. Blood Plasma 11-Ketotestosterone

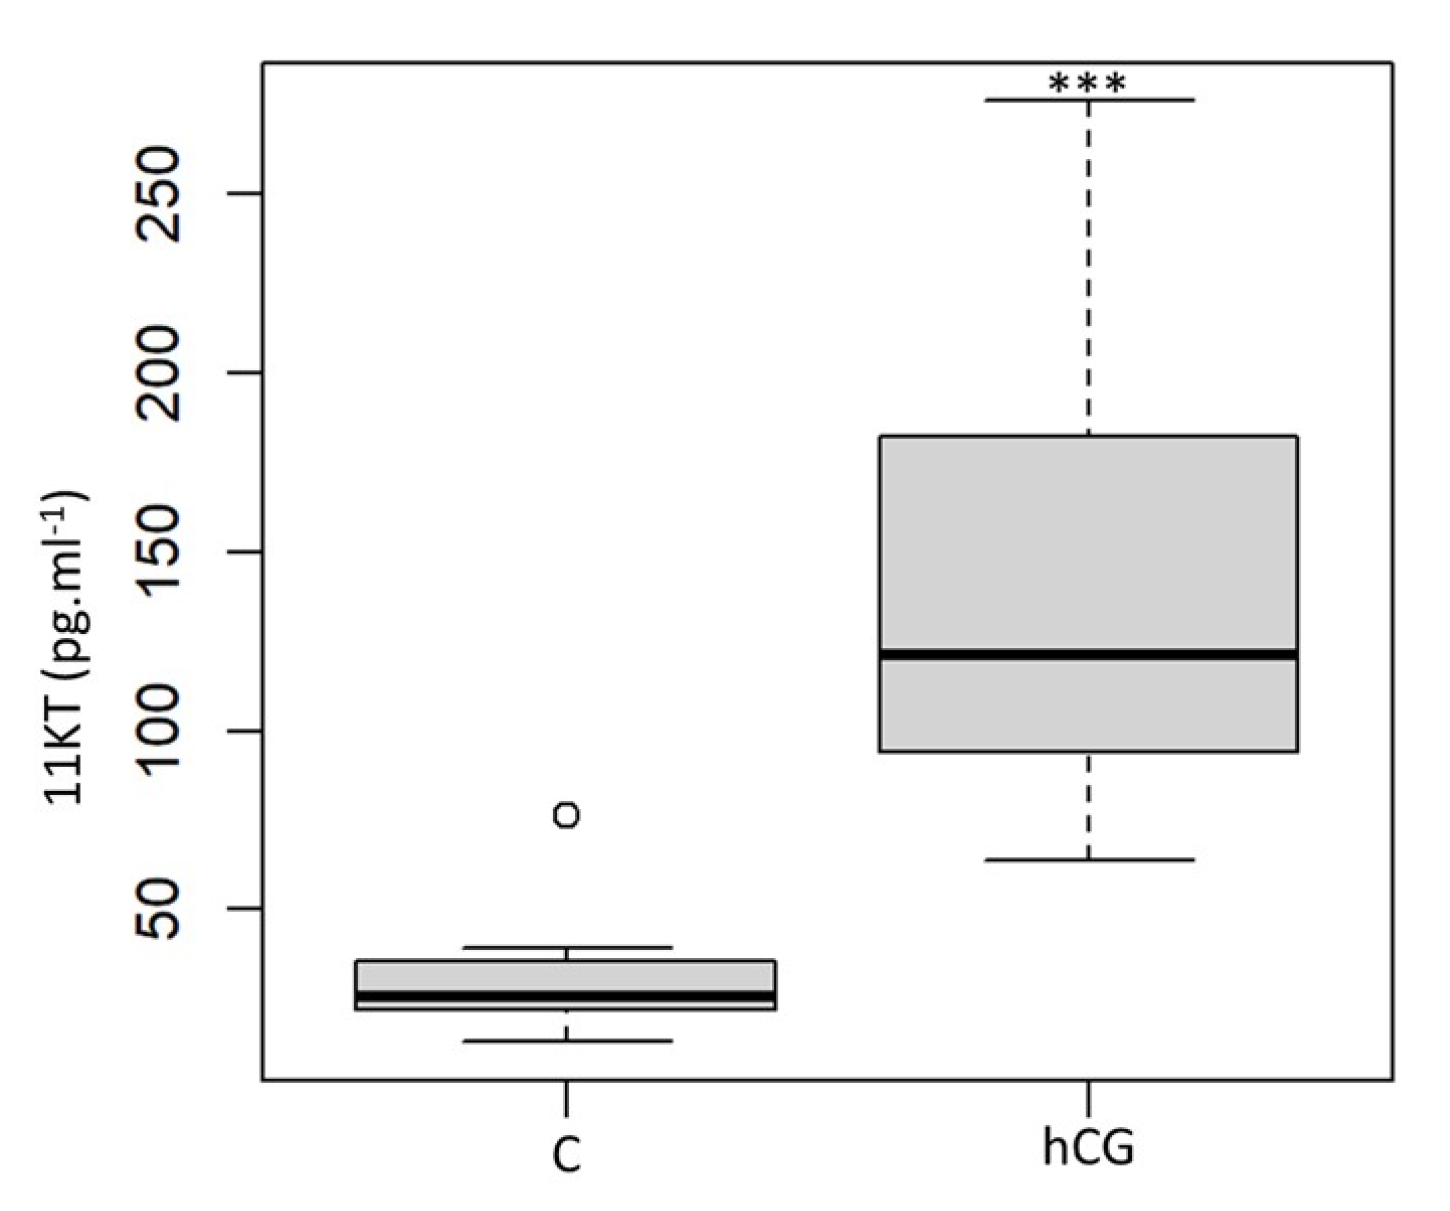
Significantly higher circulatory 11KT levels were found when comparing hCG-treated eels with the controls: 146 ± 64 vs. 46 ± 26 pg mL−1, respectively (p < 0.001; Figure 2).

3.4. Ultrasound and Dissection

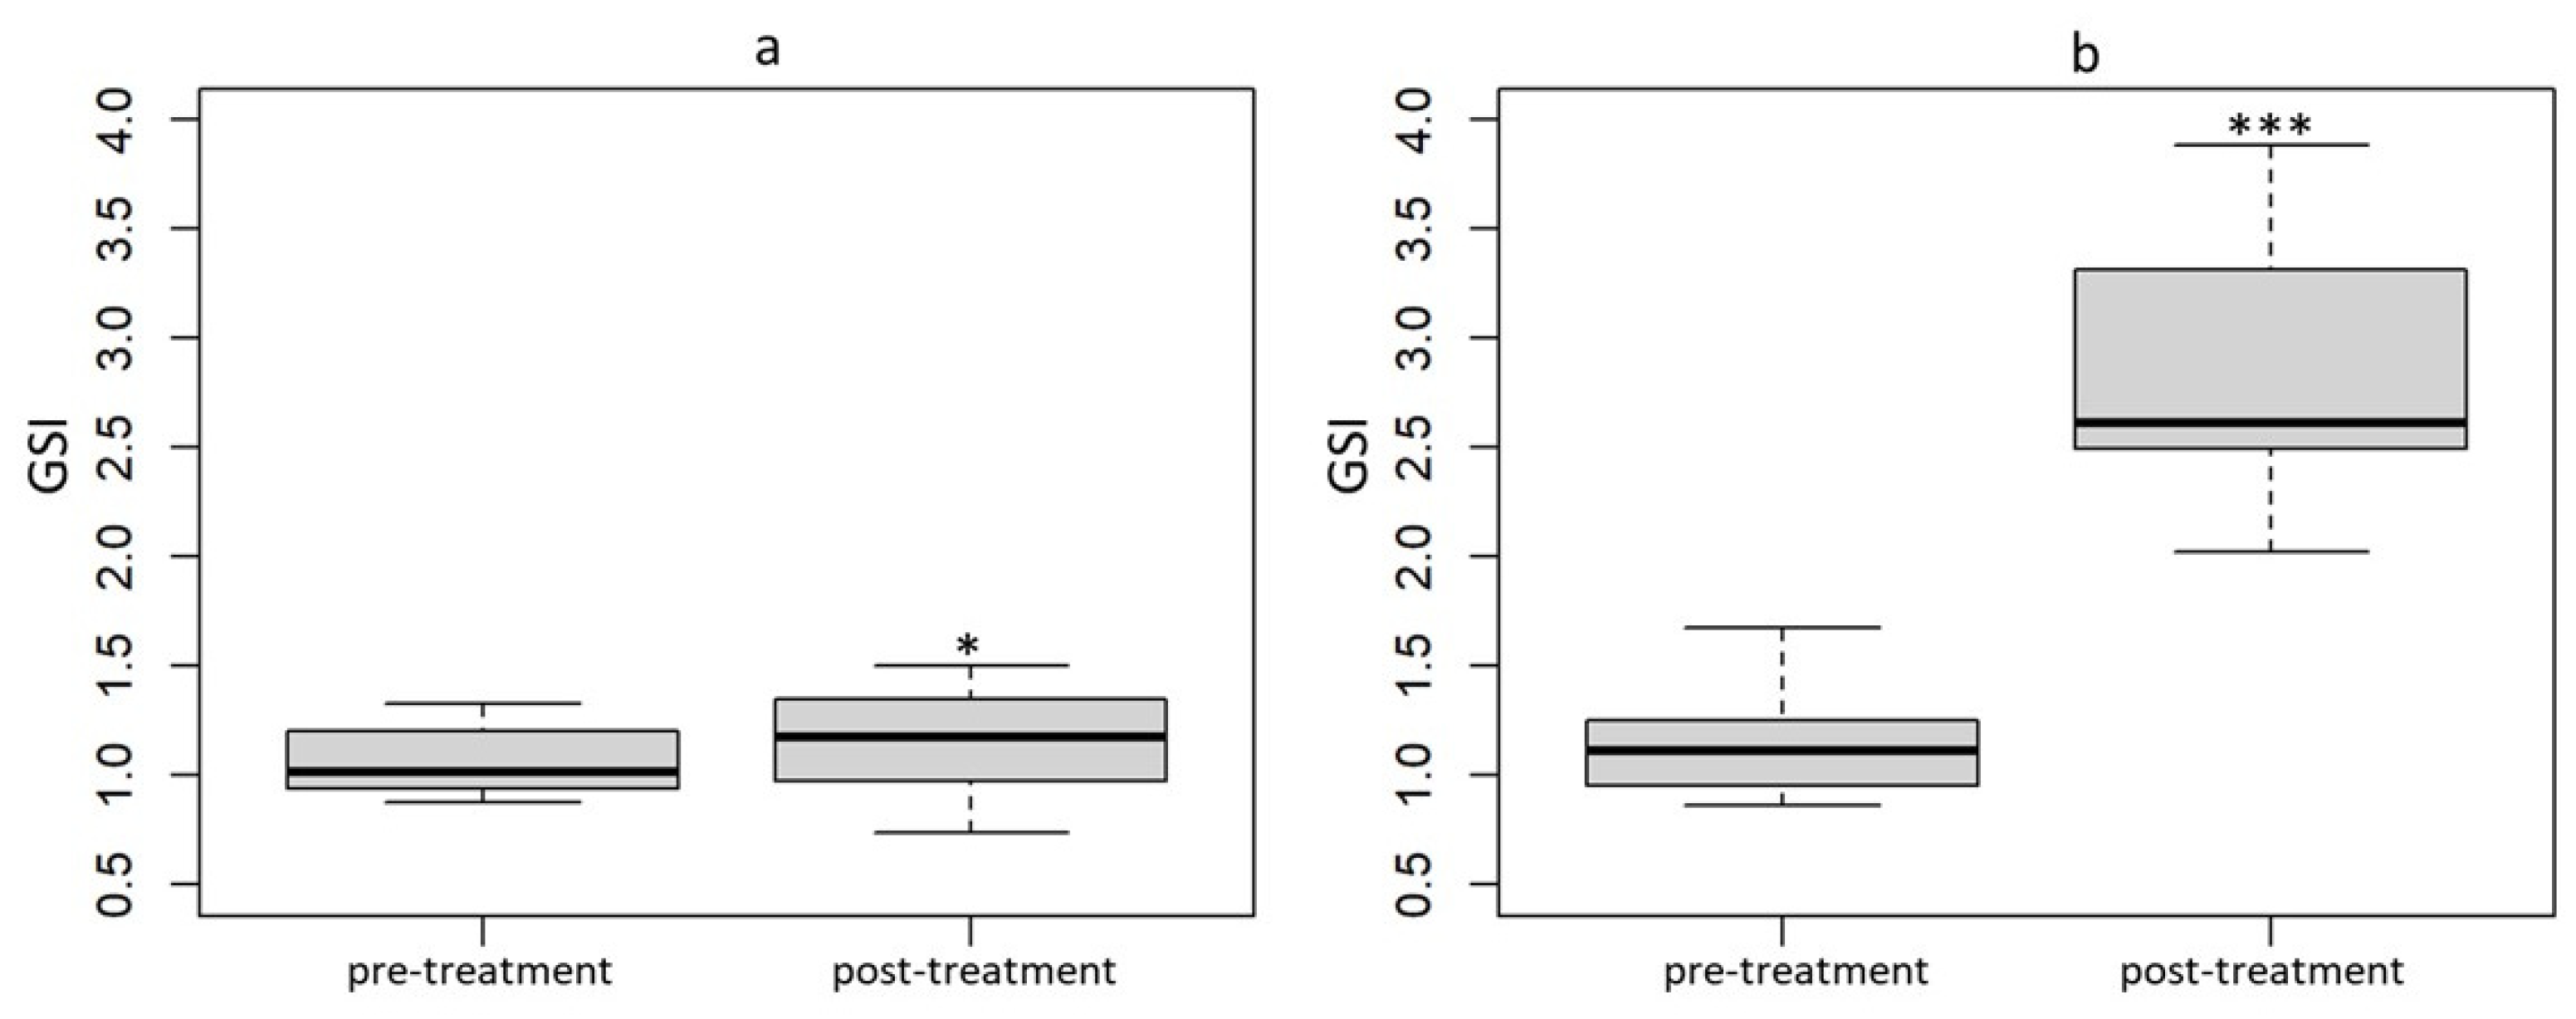
Ultrasound GSI calculations were validated by GSI determinations on the dissected eels of the hCG-treated and control groups. For eels of the control group (N = 10), GSI as calculated from ultrasound images was 1.34 ± 0.08 and very similar to the GSI of 1.38 ± 0.10 as determined on the dissected eels. For eels of the hCG-treated group (N = 8), GSI as calculated from ultrasound images was 2.82 ± 0.54 and also very similar to the GSI of 2.91 ± 0.55 as determined on the dissected eels. Ultrasound GSI data could, therefore, be used for further analyses. GSI values for hCG-treated eels (N = 25) were 2.88 ± 0.57 and significantly higher (p = 6.422 × 10⁻¹⁵) than before treatment (1.14 ± 0.204; Figure 3). Eels of the control group (N = 25) showed only slightly higher GSI values: 1.16 ± 0.22 vs. 1.06 ± 0.15 (p = 0.0159; Figure 3). hCG-treated eels had a significantly higher GSI value than the eels of the control group (p < 0.001).
Eels of the hCG-treated group showed significantly higher HSI values (1.04 ± 0.16 vs. 0.77 ± 0.14; p < 0.01), lower GITI values (0.53 ± 0.08 g vs. 1.18 ± 0.37 g; p < 0.001) and higher SBI values (0.29 ± 0.05 g vs. 0.20 ± 0.04 g; p = 0.015) as compared to eels of the control group.

3.5. Oocyte Histology

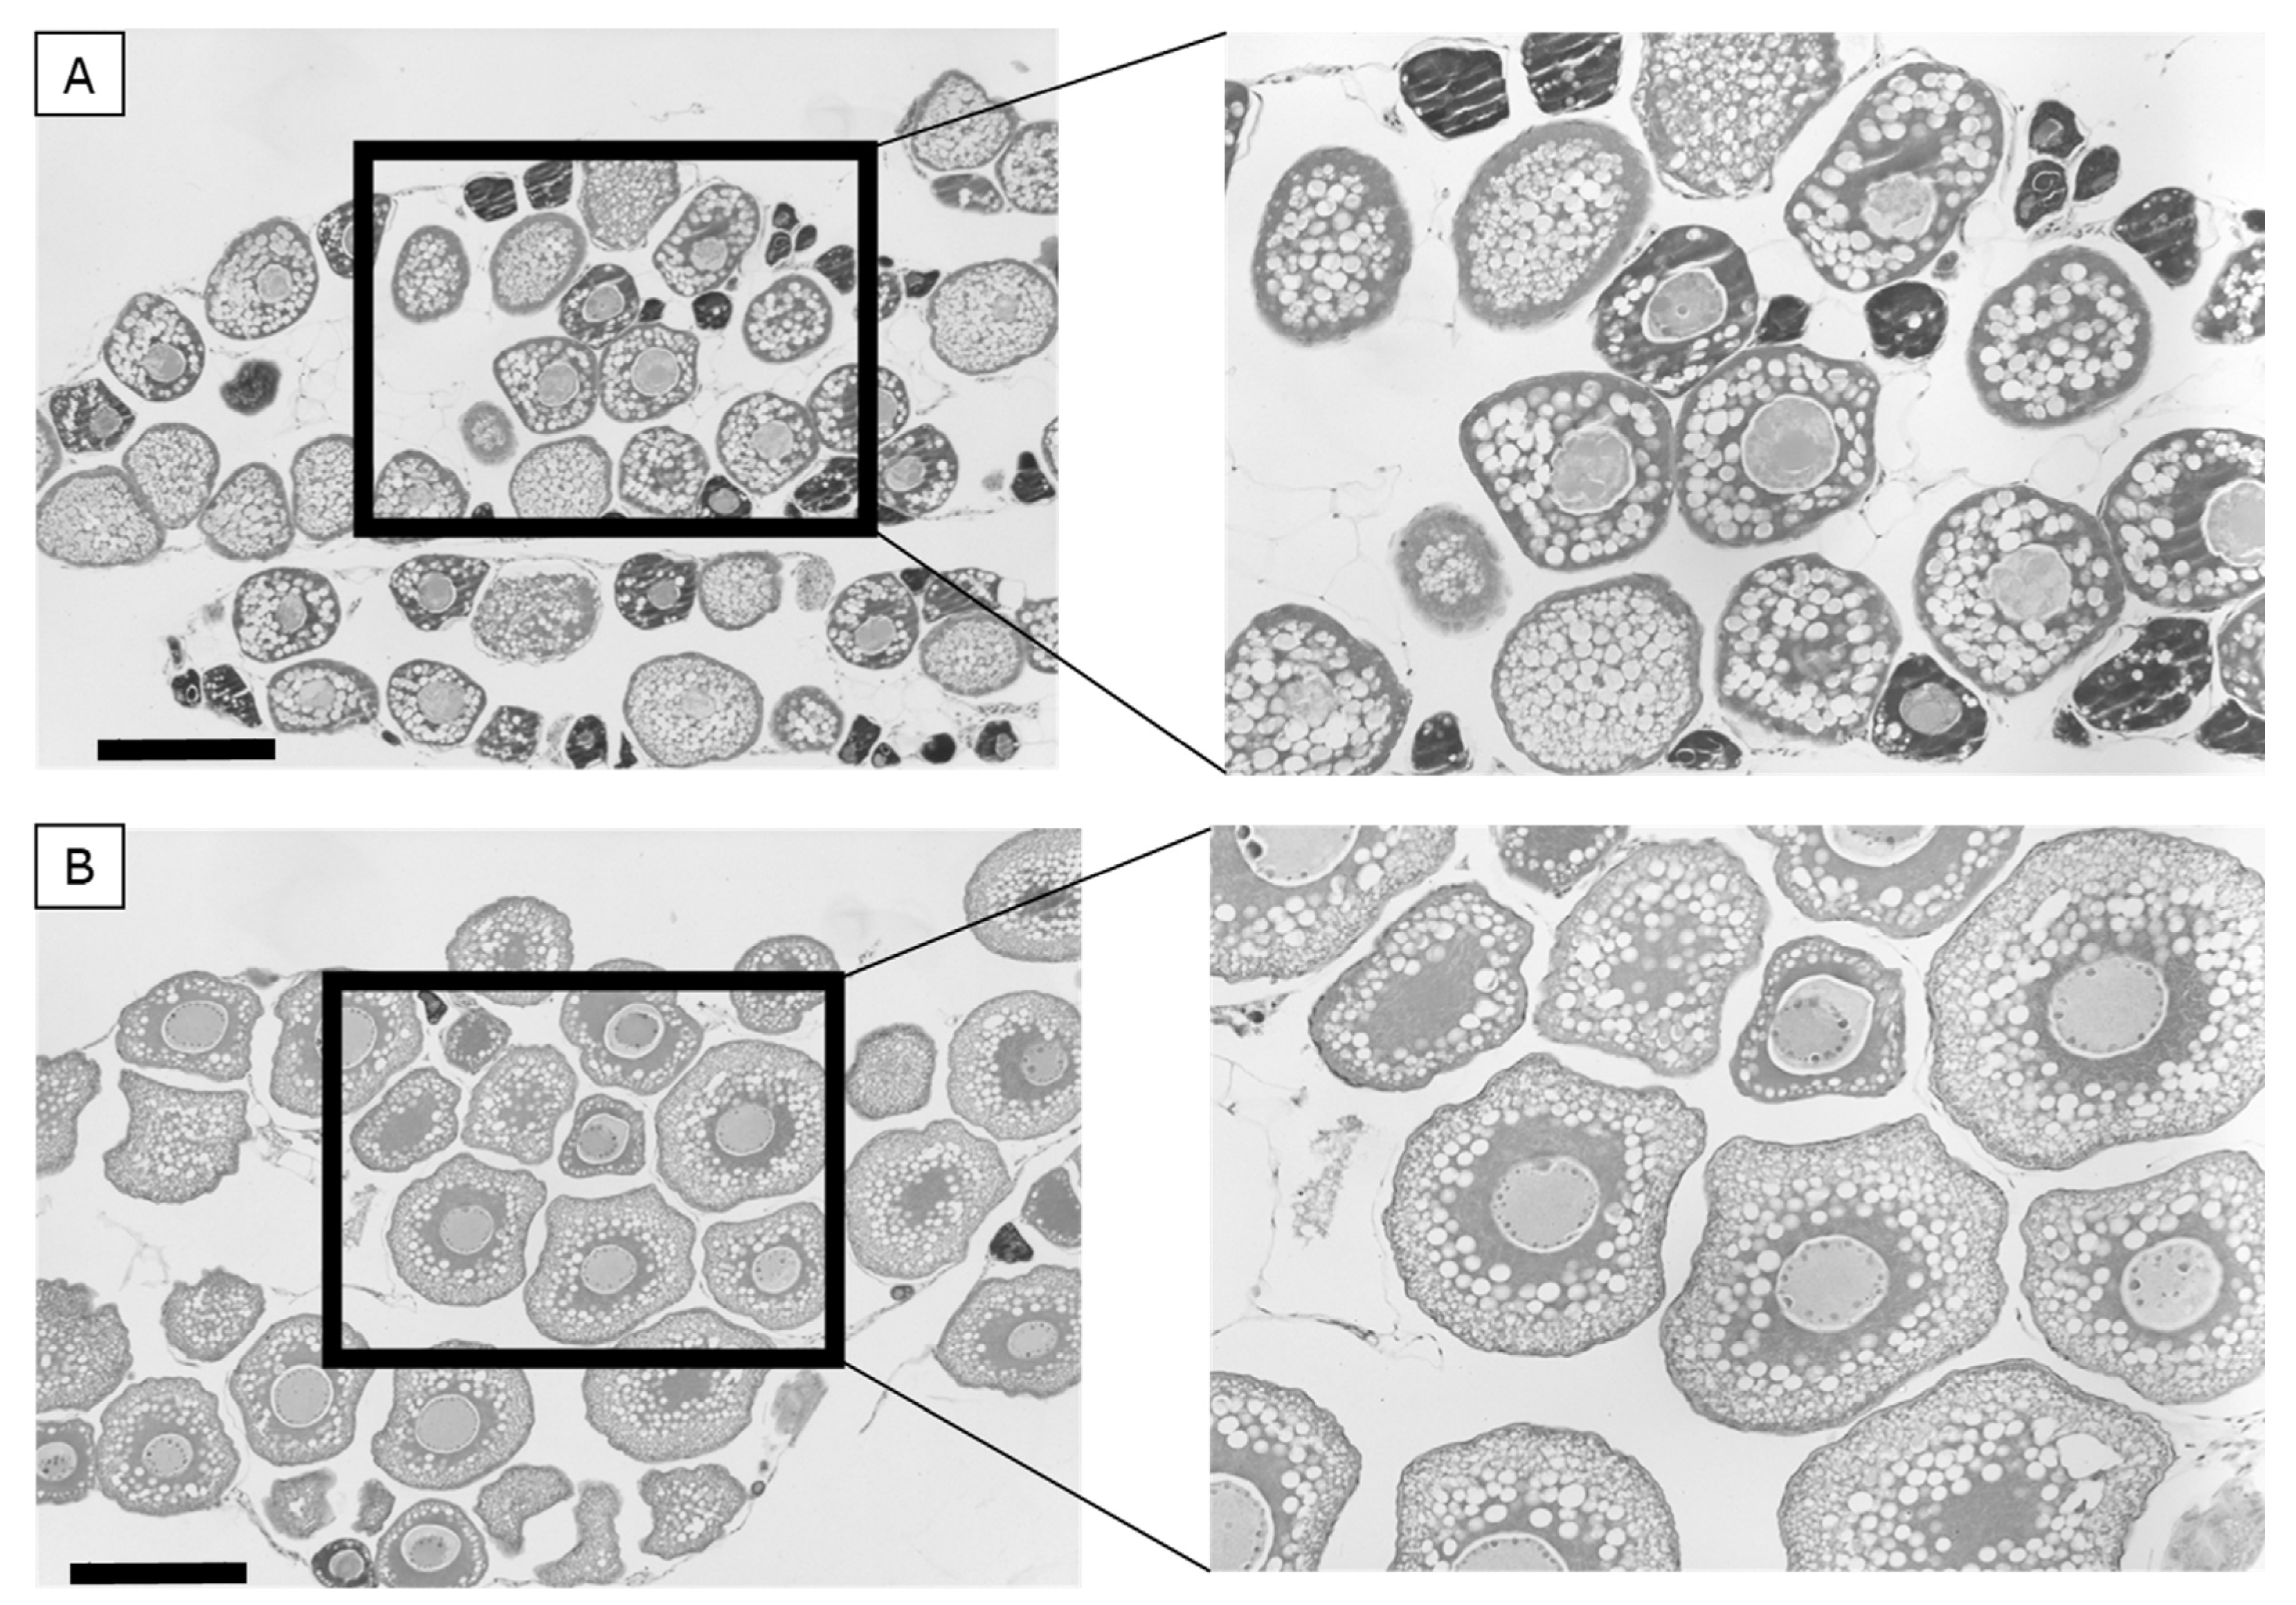
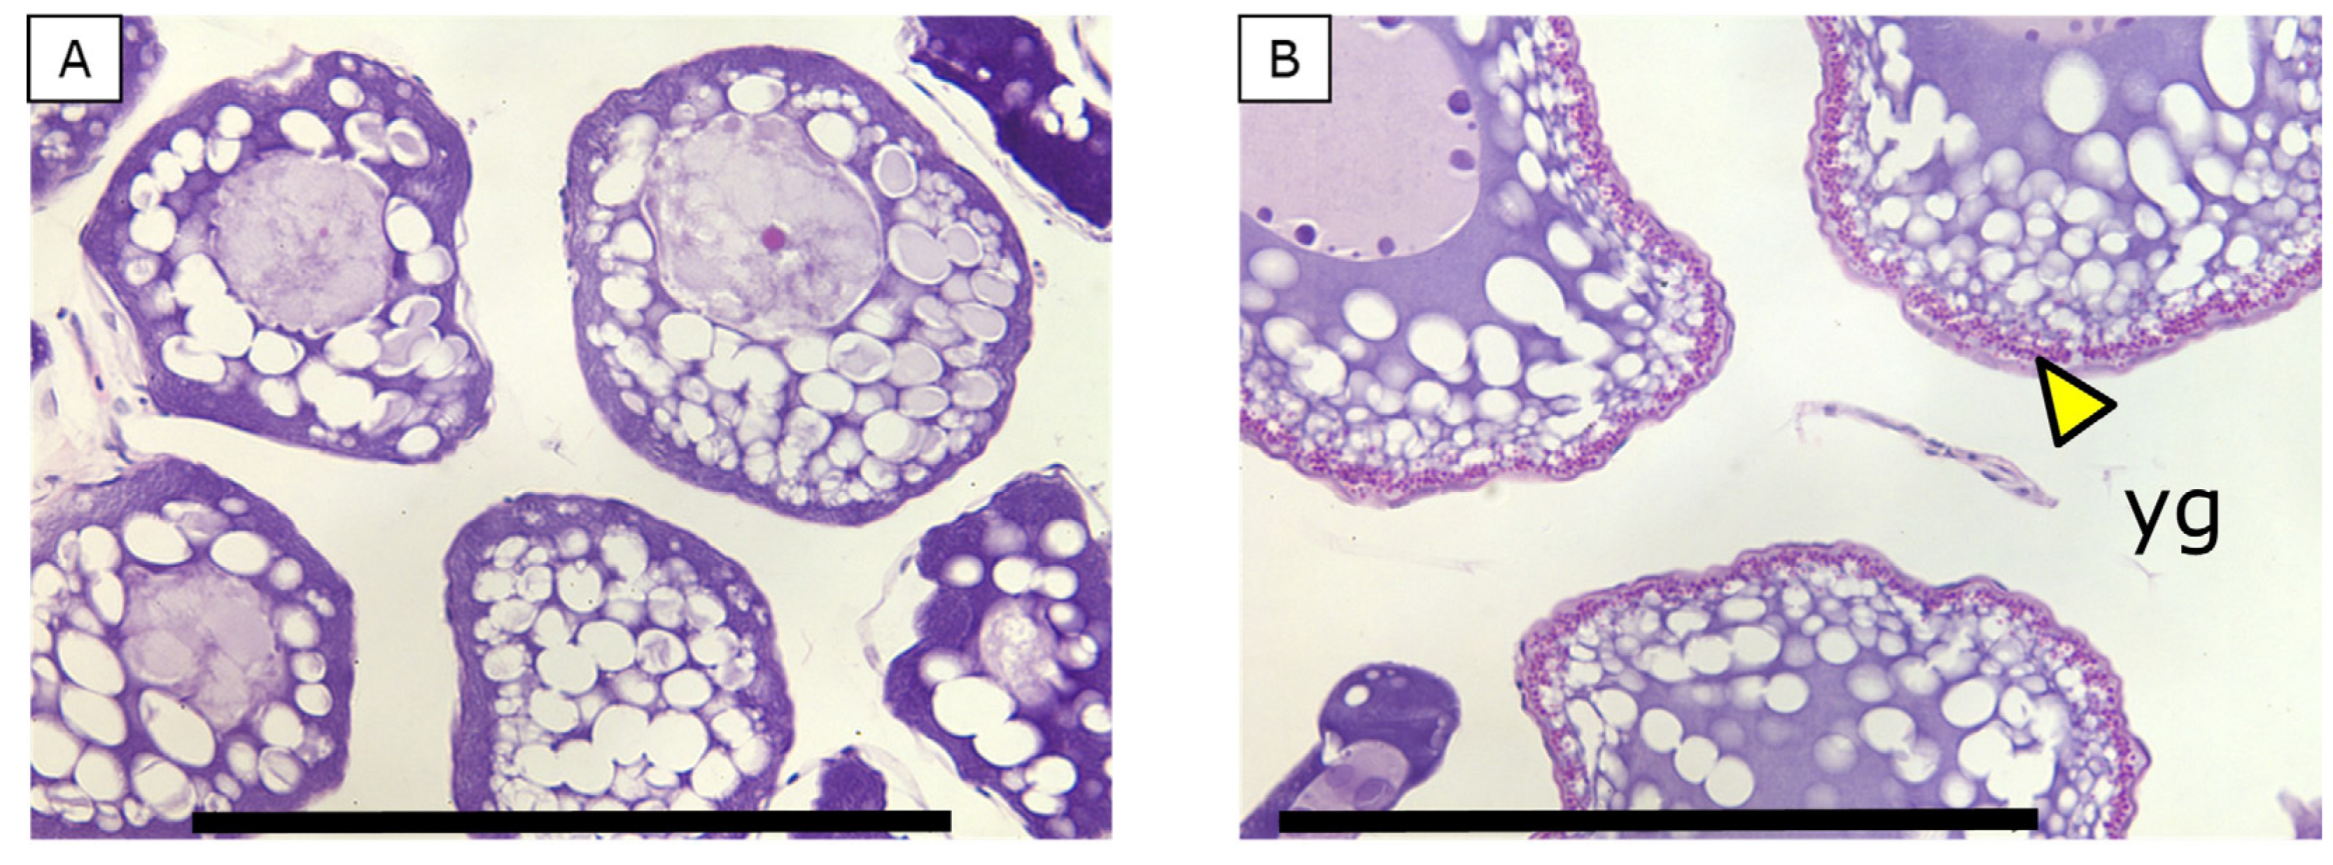
Oocytes from the hCG-treated eels were larger (196 ± 23 μm) than the oocytes from eels of the control group (117 ± 12 μm; p < 0.001; Figure 4). Yolk was present in the oocytes from the hCG-treated group but absent in the oocytes of the control eels (Figure 5).
The lipid area was much higher in the oocytes from the hCG-treated eels (9414 ± 2034 μm2) than in oocytes from eels of the control group (3978 ± 694 μm2; p < 0.001). The lipid area relative to the oocyte area was not different between eels from both groups (32 ± 2% vs. 31 ± 2%, hCG group vs. C group, respectively; p > 0.05).

3.6. RT-PCR

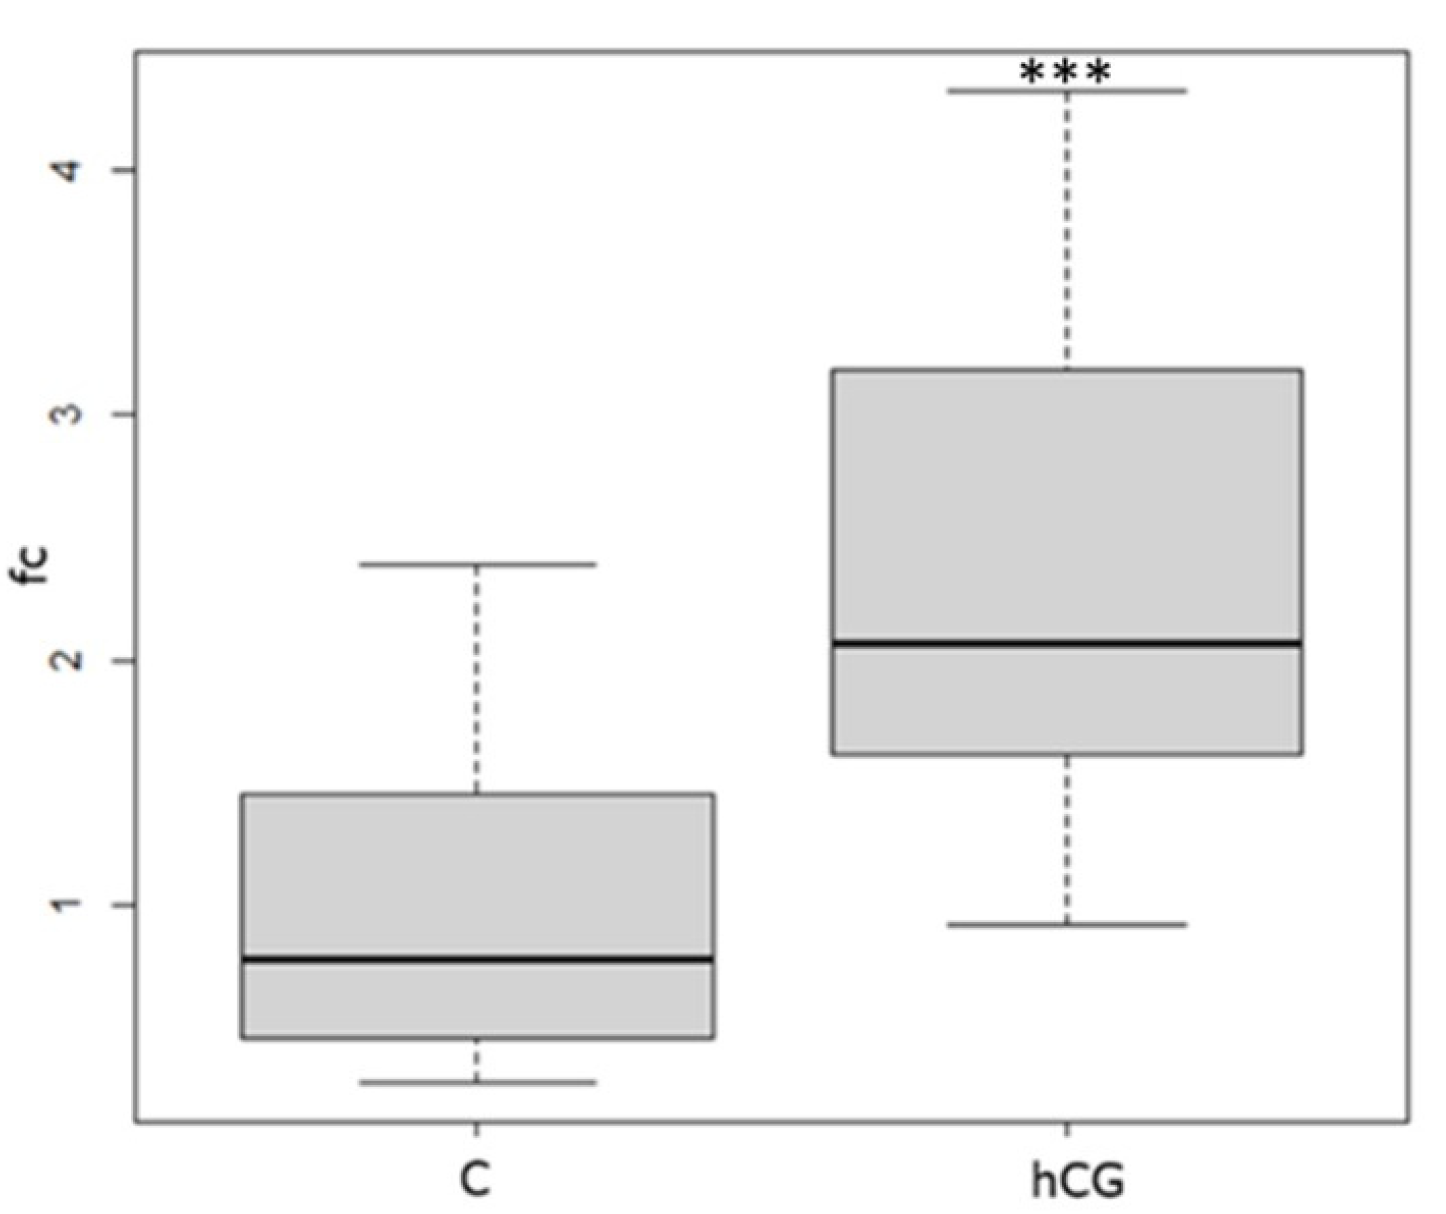
No significant differences were observed between Ct values of l36 expression in liver tissue from eels of the hCG-treated group and in liver tissue from the controls (p > 0.05). Using Ct values of housekeeping gene l36 for normalizing, esr-1 expression was higher in livers of eels of the hCG-treated group than in the controls (p ≤ 0.05). The relative fold change (fc) between esr-1 expression in hCG-treated eels and in controls was 2.33 ± 1.13 (Figure 6).
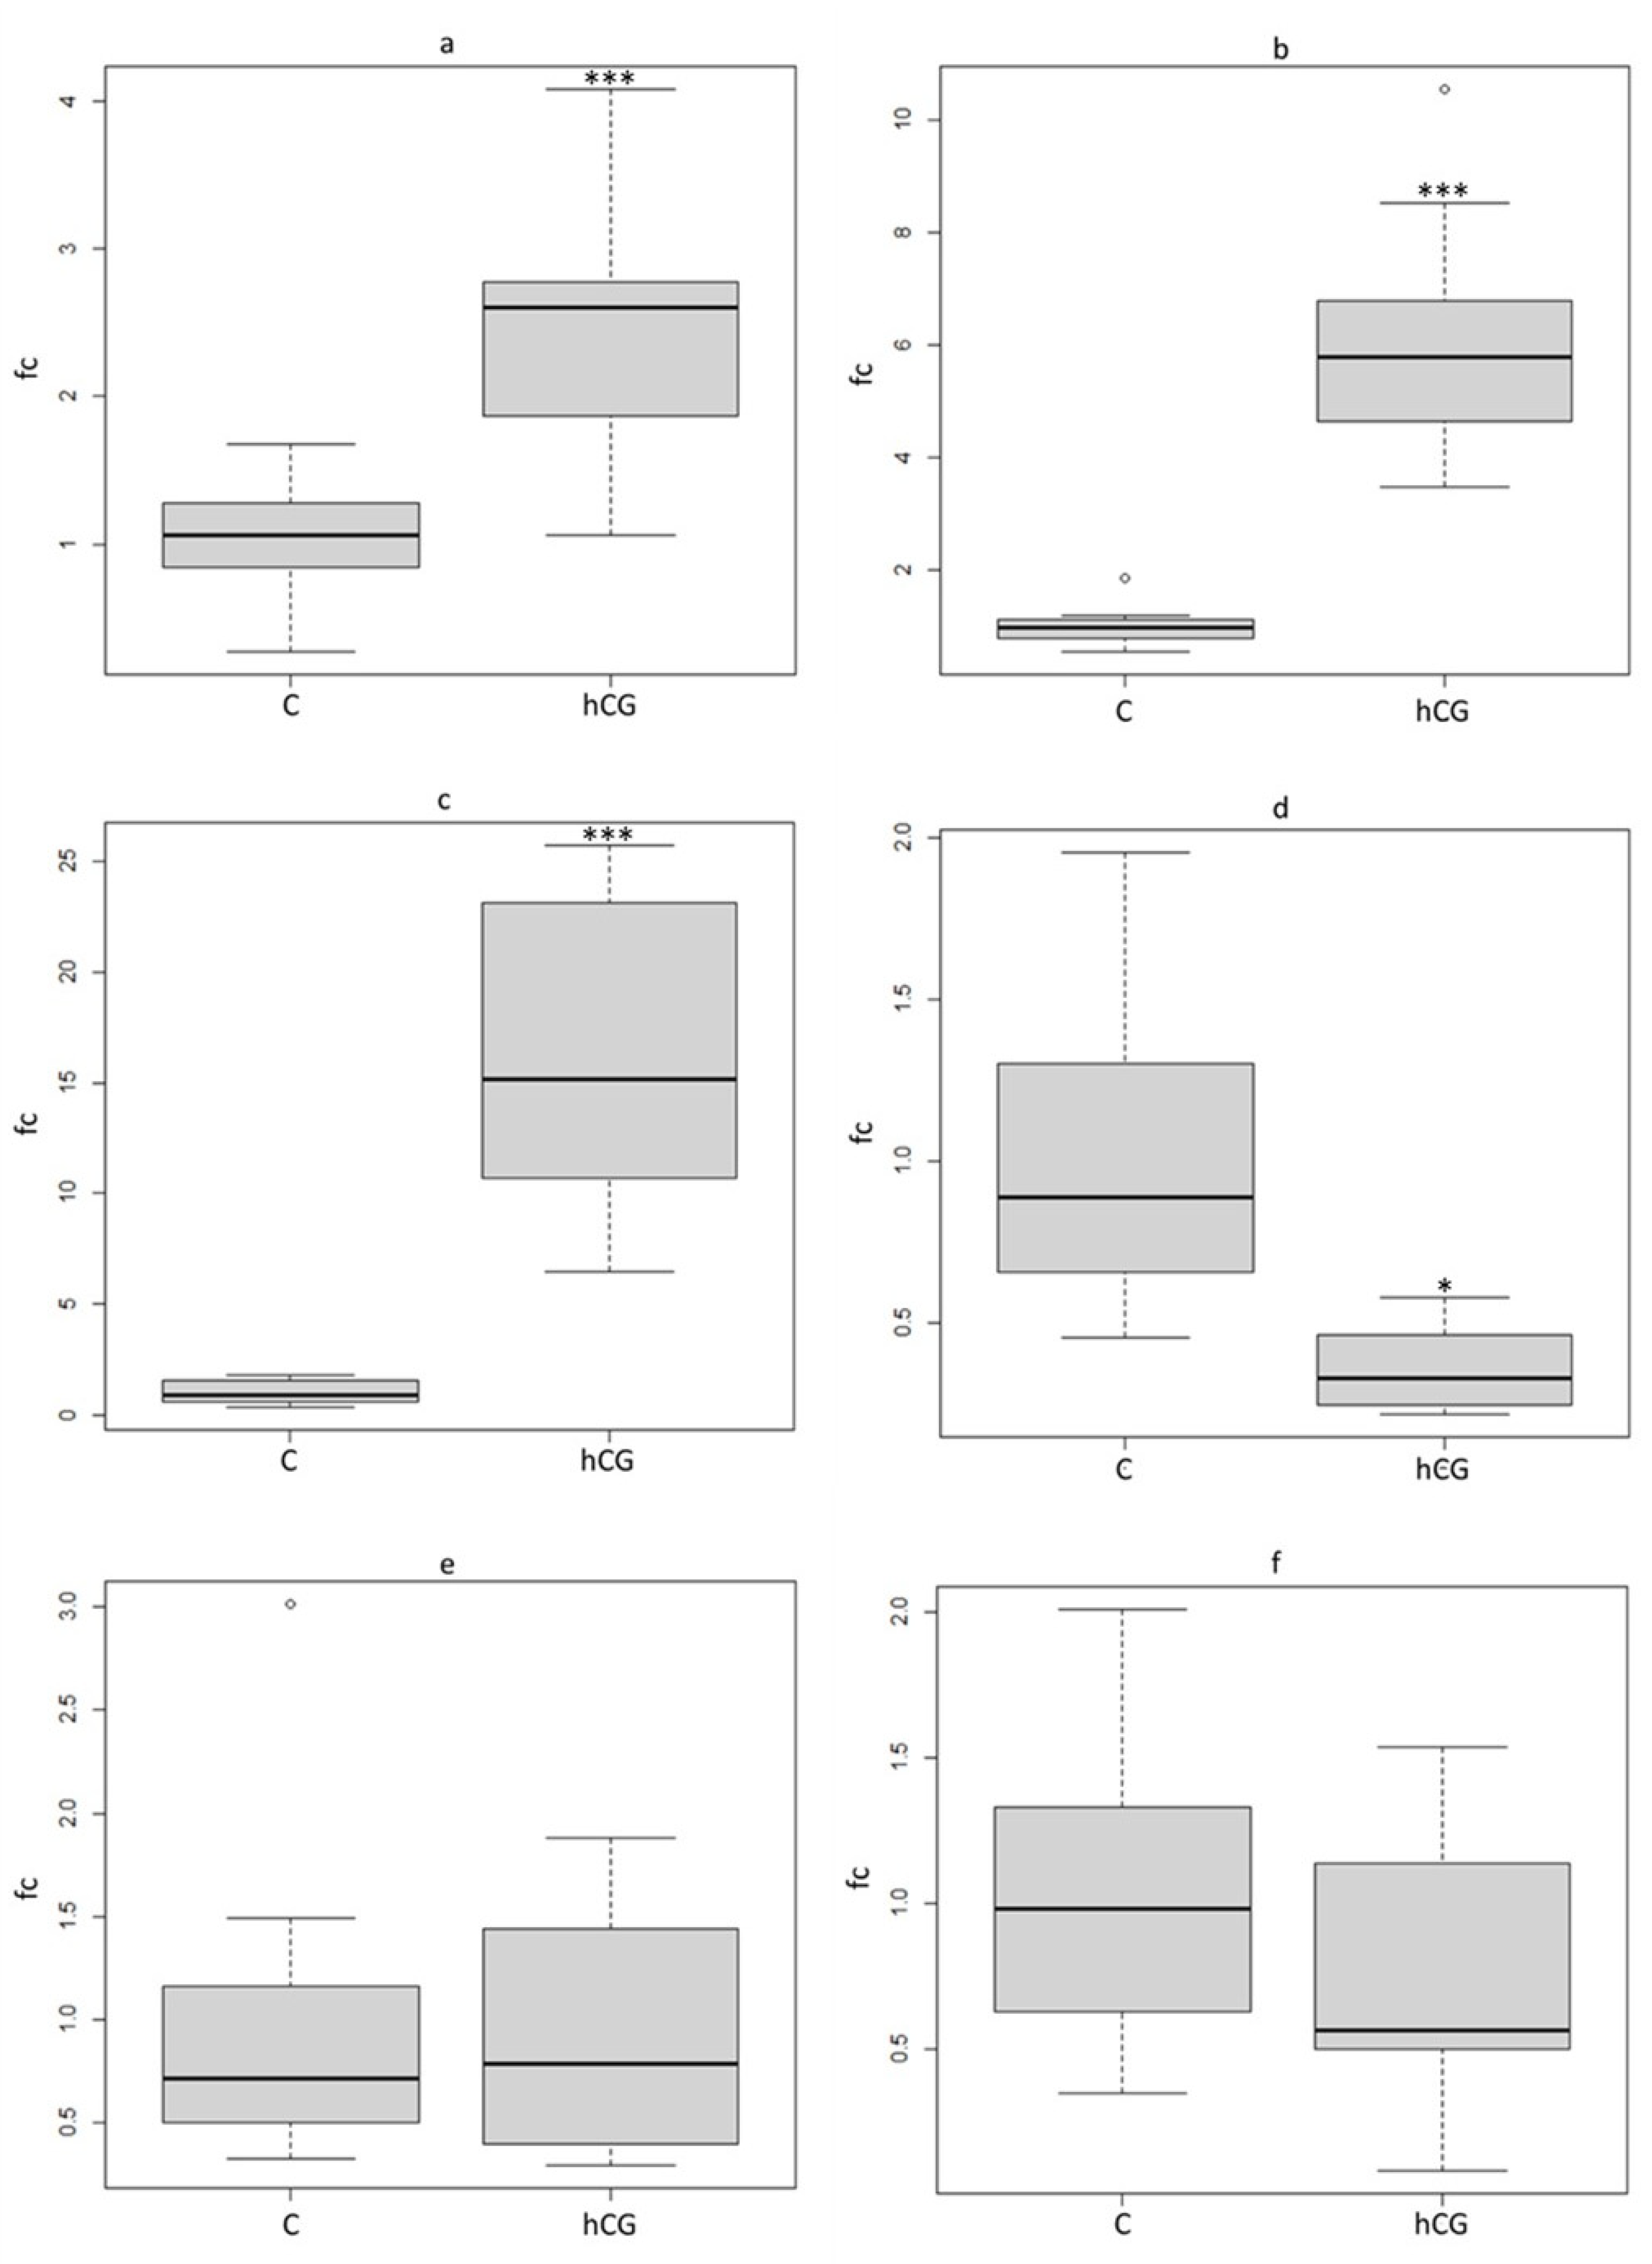
No significant differences were found between BestKeeper Ct values, of elf-1, l36 and 18s combined, in ovary tissue from eels of the hCG-treated group and in ovary tissue from the controls (p > 0.05). Significantly higher expression was found for cyp19, fshr and lpl with relative fold changes of 2.53 ± 0.93; 6.14 ± 2.13 and 15.75 ± 6.79, respectively, when comparing hCG-treated eels with the controls (p < 0.001; Figure 7a–c). Lower expression was found for vtgr with a relative fold change of 0.36 ± 0.13 (p ≤ 0.05; Figure 7d) when comparing hCG-treated eels with the controls. No significant differences were found in the expression of lhr-1 and lhr-2 with relative fold changes of 0.89 ± 0.55 and 0.73 ± 0.49, respectively (p > 0.05; Figure 7e,f) when comparing hCG-treated eels with the controls.

3.7. Reproduction Parameters

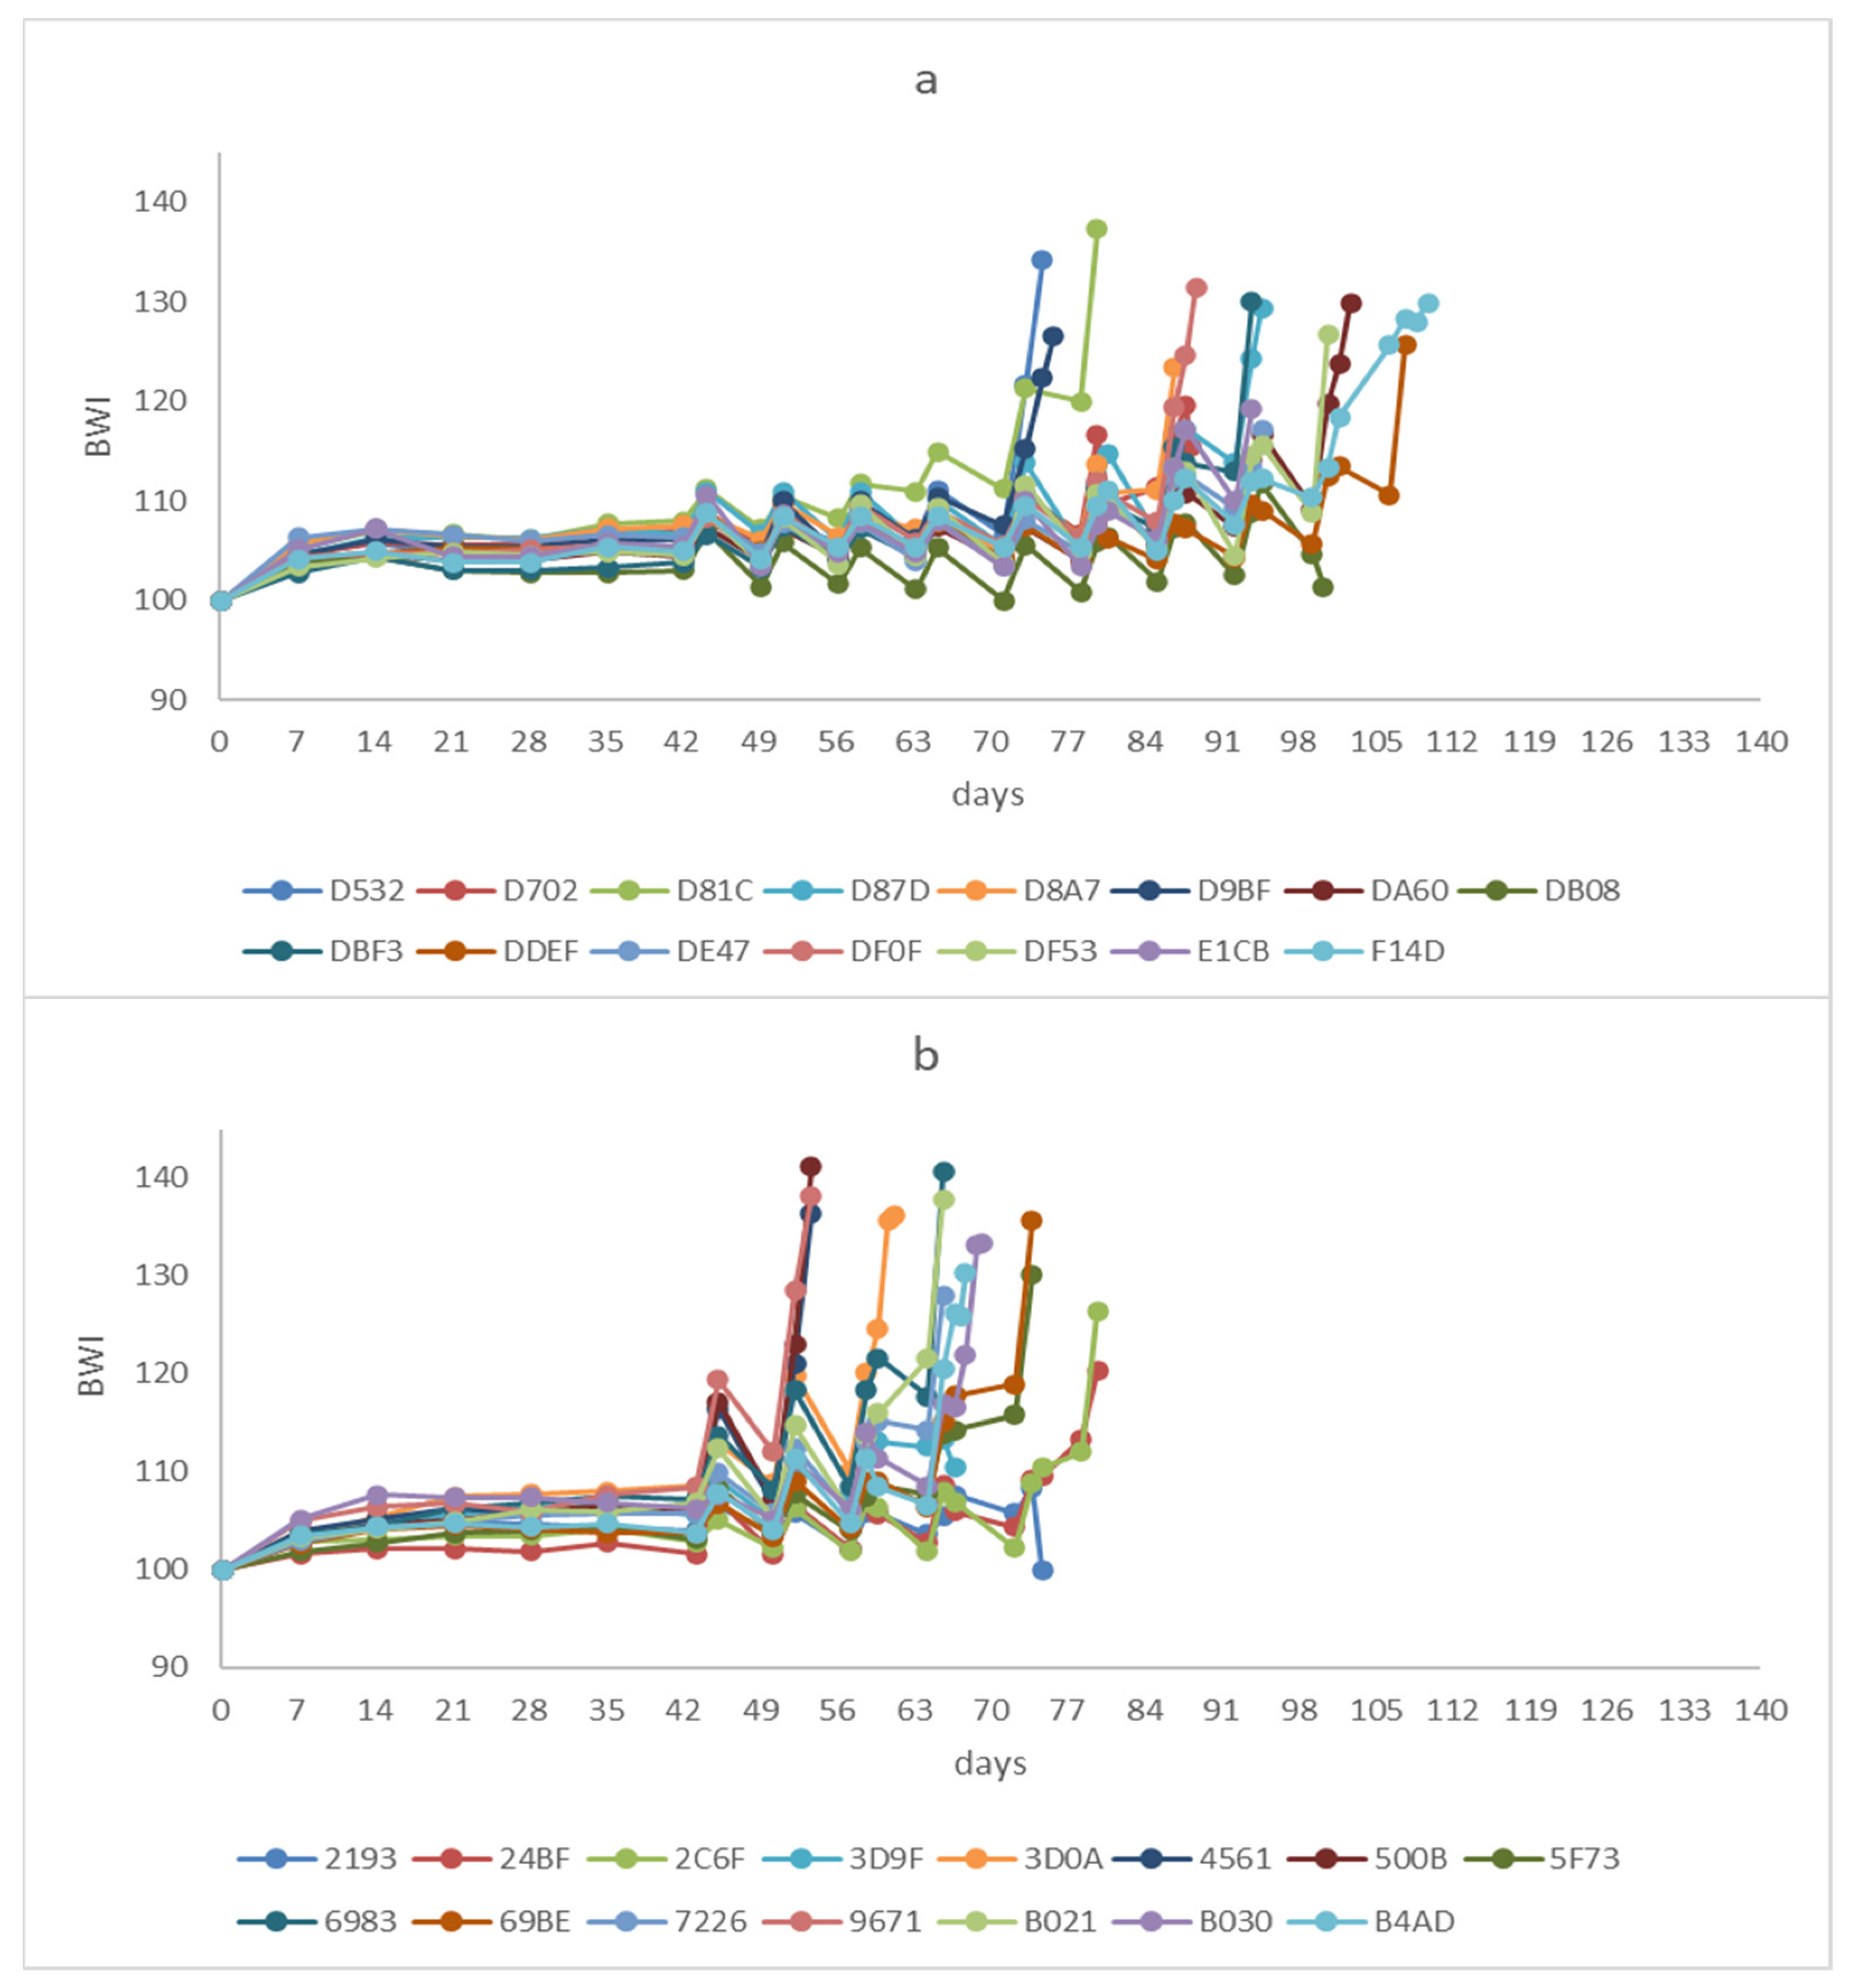
When BWI exceeded the threshold of 110, eels were given a booster CPE injection and then a DHP injection to induce ovulation. For eels of the control group, this was on average after 90 days and 14 CPE injections. Eels ovulated on average 12 h after DHP injection. The percentage of floating eggs was on average 33 ± 24%. For eels of the hCG group, the BWI of 110 was reached after just 64 days and only 10 CPE injections, on average 4 CPE injections less than eels of the control group (Figure 8). Eels of the hCG-treated group also ovulated on average 12 h after DHP injection. The percentage of floating eggs was on average 39 ± 26% (Table 3), slightly higher but not significantly different from eels of the control group.
Egg batches were obtained from N = 12 hCG-treated eels and from N = 12 eels of the control group. From nine eels of the control group, larvae batches were obtained. On average, larvae survived for 5 dph, with a maximum survival time of 9 dph. From 11 eels of the hCG-treated group, larvae batches were obtained that had an average survival time of 5 dph and a maximum survival time of 11 dph (Table 4).

4. Discussion

This study aimed to investigate the effects of a single human chorionic gonadotropin (hCG) injection on silvering, vitellogenesis and reproductive success of feminized European eels. Here, we will discuss these effects separately.

4.1. hCG Induction of Silvering

When eels become silver, multiple morphological changes occur, such as a significant eye enlargement [32] and darkening of the pectoral fin [43]. After the treatment period, significant eye enlargement was observed when comparing eels from the hCG-treated group with the control eels. Darkening of the pectoral fin was more advanced for the eels treated with hCG than for the controls. Silvering also includes thickening of the swim bladder wall [44], an organ that is of crucial importance for buoyancy control during the daily vertical migrations of the silver eels in the ocean [45]. We observed a higher swim bladder weight in the eels treated with hCG. During silvering, the gastrointestinal tract (GIT) regresses [46], which is in agreement with the lower GIT weight in hCG-treated eels in our study. In yellow eels or “pre-migrant” silver eels, 11KT concentrations are significantly lower than in migrant eels [47]. In the eels treated with hCG, plasma 11KT concentrations were significantly higher than in plasma from eels of the control group. Silvering is primarily under 11KT control [48], and the observed eye enlargement during silvering may be 11KT-mediated [49].

4.2. hCG Induction of Vitellogenesis

In the eels treated with hCG, several vitellogenic changes occurred as compared to the control eels. A significant increase was found in GSI and HSI of the eels treated with hCG. The oocytes in eels treated with hCG were significantly larger than the oocytes in the control eels. In the study of Adachi et al. [21] on A. japonica, it was shown that vitellogenesis commenced when the oocytes were about 250 µm in diameter, and Cottrill et al. [50] considered oocytes from A. rostrata vitellogenic at 200 µm. The average diameter of oocytes in the feminized eels treated with hCG in this study was 196 ± 23 µm. The higher lipid area and the much higher lpl expression in the oocytes of the hCG-treated eels suggests that hCG successfully induced lipid deposition in the oocytes. This is in line with the study of Nguyen et al. [25], where shortfin eels (A. australis) were treated with hCG and also showed lipid deposition and upregulated lpl expression, relative to the hCG dose. The most outstanding finding with the hCG treatment in our study was the yolk deposition that had occurred in the oocytes, as this has not yet been observed before in eels treated with hCG. The hCG-treated shortfin eels in the study of Nguyen et al. [25] had a significant up-regulation of ovarian fshr when increasing the dose of hCG. The eels that received the highest dose of hCG in their study showed advanced oocyte development in the ovaries. The authors concluded that Fsh signaling is essential for previtellogenic oocyte development in shortfin eels. This is in line with the findings of our study where an increase in ovarian fshr expression was observed in the eels that were treated with hCG. In the study of Nguyen et al. [25], the treatment with hCG did not affect cyp19 expression, while increases in plasma E2 and 11KT were observed. In our study, a significant increase in cyp19 expression was observed after hCG treatment. Cyp19 is a crucial enzyme for vitellogenesis and yolk deposition, since it converts T into E2 in the ovary [13].
Feminization may have had an epigenetic effect, explaining the observed differences in yolk deposition and cyp19 expression. To feminize eels, the eels were given pellets coated with E2 during a crucial early life period for sex determination. Besides feminization, this procedure may sensitize the eels in their response to hormonal stimulation later in life that may be directed by Cyp19. Additionally, Tzchori et al. [51] found higher cyp19 expression in the gonads of feminized European eels in comparison with non-feminized individuals.
In eels, hCG binds to the Lhr [5,6,7]. In our study, no significant differences were found in lhr-1 or lhr-2 expression after hCG treatment, similarly to findings in the study of Nguyen et al. [25]. As the Fshr may well be promiscuous and could bind Lh [52,53], also in Japanese eel [54], the question would be if hCG binds to the Fshr. Kazeto et al. [6] concluded that this is not the case for Japanese eel. The increases in fshr and cyp19 expressions mark the start of vitellogenesis. E2 synthesis is moderated by cyp19 activity, and E2 binds to the hepatic nuclear receptor Esr-1 and induces the synthesis of Vtg by the hepatocytes [14]. Vtgs are then released in the circulation of the eels. 11KT does not only induce Vtg and lipid synthesis; it has been suggested that it also plays an important role in Vtg and lipid transport and absorption [55]. The Vtgs are transported to the oocytes, bind to the Vtgrs and are absorbed and reconstructed into yolk protein [16]. In our study, we found a lower vtgr expression in hCG-treated eels. This supports the suggestion that the Vtgr is recycled to the oocyte surface during vitellogenic oocyte growth [56].

4.3. hCG Effects on Reproductive Success

The eels treated with hCG were in an advanced stage of maturation in comparison with the controls, which resulted in 4 CPE injections less to mature than the controls. They reached the BWI of 110 threshold 25 days faster than the controls. The presence of yolk and the higher lipid area in the oocytes of the eels treated with hCG may have had consequences for the egg quality. Still, in both groups, 12 out of 15 eels gave batches of larvae that survived on average 5 dph, so an apparent difference in reproductive success was absent.

5. Conclusions

In feminized European eels, pre-treatment with hCG induced silvering, vitellogenic hepatic and ovarian gene expression and lipid and yolk deposition in the oocytes. Yolk deposition and aromatase activation are specific for hCG induction in feminized eels, providing supporting evidence for the view that E2 treatment in early life may sensitize eels to hormonal stimulation later in life. Future research should aim to elucidate the epigenetic effects of early-life E2 treatment on the vitellogenic pathway. hCG also decreased the hypophysation period and could, therefore, be useful as pre-treatment in artificial reproduction protocols.

Author Contributions

Conceptualization, A.P.P. and L.T.N.H.; methodology, A.P.P., I.v.d.V., P.J., L.K., H.S. and L.T.N.H.; software, I.v.d.V.; validation, L.T.N.H.; formal analysis, I.v.d.V.; investigation, A.P.P., I.v.d.V., P.J. and L.T.N.H.; resources, L.K., H.S. and W.S.; data curation, A.P.P., I.v.d.V. and L.T.N.H.; writing—original draft preparation, A.P.P. and I.v.d.V.; writing—review and editing, A.P.P., I.v.d.V. and P.J.; visualization, I.v.d.V.; supervision, A.P.P.; project administration, A.P.P.; funding acquisition, A.P.P. and W.S. All authors have read and agreed to the published version of the manuscript.

Funding

This research was funded as the public–private partnership project “LARVitAAL” by the Dutch Ministry of Agriculture, Nature and Food Quality and the DUPAN foundation, grant number LWV21.061.

Institutional Review Board Statement

Experimental protocols complied with the current laws of The Netherlands and were approved by the CCD (Central Committee for Animal Experiments), project number AVD401002017817, 1 March 2017, and by the DEC (Animal Experiments Committee) and IvD (Authority for Animal Welfare), experiment number 2017.D-0007.005, 15 December 2020, of Wageningen University.

Informed Consent Statement

Not applicable.

Data Availability Statement

Raw data supporting the conclusions of this article will be made available by the authors, without undue reservation, to any qualified researcher.

Acknowledgments

The authors thank H. Komen for his constructive criticisms and zootechnicians of the CARUS facilities. Additionally, we thank our partners of the international EELRIC consortium (www.eelric.eu, accessed on 24 May 2023).

Conflicts of Interest

The authors declare no conflict of interest. The funders had no role in the design of the study; in the collection, analyses, or interpretation of data; in the writing of the manuscript; or in the decision to publish the results.

References

  1. Kazeto, Y.; Suzuki, H.; Ozaki, Y.; Gen, K. C-terminal peptide (hCTP) of human chorionic gonadotropin enhances in vivo biological activity of recombinant Japanese eel follicle-stimulating hormone and luteinizing hormone produced in FreeStyle 293-F cell lines. Gen. Comp. Endocrinol. 2021, 306, 113731. [Google Scholar] [CrossRef] [PubMed]
  2. Gharib, S.D.; Wierman, M.E.; Shupnik, M.A.; Chin, W.W. Molecular biology of the pituitary gonadotropins. Endocr. Rev. 1990, 11, 177–199. [Google Scholar] [CrossRef] [PubMed]
  3. Molés, G.; Hausken, K.; Carrillo, M.; Zanuy, S.; Levavi-Sivan, B.; Gómez, A. Generation and use of recombinant gonadotropins in fish. Gen. Comp. Endocrinol. 2020, 299, 113555. [Google Scholar] [CrossRef] [PubMed]
  4. Swanson, P.; Dickey, J.T.; Campbell, B. Biochemistry and physiology of fish gonadotropins. Fish. Physiol. Biochem. 2003, 28, 53–59. [Google Scholar] [CrossRef]
  5. Aizen, J.; Kowalsman, N.; Kobayashi, M.; Hollander, L.; Sohn, Y.C.; Yoshizaki, G.; Niv, M.Y.; Levavi-Sivan, B. Experimental and computational study of inter- and intra- species specificity of gonadotropins for various gonadotropin receptors. Mol. Cell. Endocrinol. 2012, 364, 89–100. [Google Scholar] [CrossRef]
  6. Kazeto, Y.; Kohara, M.; Tosaka, R.; Gen, K.; Yokoyama, M.; Miura, C.; Miura, T.; Adachi, S.; Yamauchi, K. Molecular characterization and gene expression of Japanese eel (Anguilla japonica) gonadotropin receptors. Zool. Sci. 2012, 29, 204–211. [Google Scholar] [CrossRef]
  7. Minegishi, Y.; Dirks, R.P.; de Wijze, D.L.; Brittijn, S.A.; Burgerhout, E.; Spaink, H.P.; van den Thillart, G.E.E.J.M. Quantitative bioassays for measuring biologically functional gonadotropins based on eel gonadotropic receptors. Gen. Comp. Endocrinol. 2012, 178, 145–152. [Google Scholar] [CrossRef]
  8. Lokman, P.M.; Wylie, M.J.; Downes, M.; Di Biase, A.; Damsteegt, E.L. Artificial induction of maturation in female silver eels, Anguilla australis: The benefits of androgen pre-treatment. Aquaculture 2015, 437, 111–119. [Google Scholar] [CrossRef]
  9. Aroua, S.; Schmitz, M.; Baloche, S.; Vidal, B.; Rousseau, K.; Dufour, S. Endocrine evidence that silvering, a secondary metamorphosis in the eel, is a pubertal rather than a metamorphic event. Neuroendocrinology 2005, 82, 221–232. [Google Scholar] [CrossRef]
  10. Divers, S.L.; McQuillan, H.J.; Matsubara, H.; Todo, T.; Lokman, P.M. Effects of reproductive stage and 11-ketotestosterone on LPL mRNA levels in the ovary of the shortfinned eel. J. Lipid Res. 2010, 51, 3250–3258. [Google Scholar] [CrossRef]
  11. Rainuzzo, J.R.; Reitan, K.I.; Olsen, Y. The significance of lipids at early stages of marine fish: A review. Aquaculture 1997, 155, 103–115. [Google Scholar] [CrossRef]
  12. Asanuma, H.; Ohashi, H.; Matsubara, H.; Ijiri, S.; Matsubara, T.; Todo, T.; Adachi, S.; Yamauchi, K. 11-ketotestosterone potentiates estrogen-induced vitellogenin production in liver of Japanese eel (Anguilla japonica). Fish. Physiol. Biochem. 2003, 28, 383–384. [Google Scholar] [CrossRef]
  13. Montserrat, N.; González, A.; Méndez, E.; Piferrer, F.; Planas, J.V. Effects of follicle stimulating hormone on estradiol-17β production and P-450 aromatase (CYP19) activity and mRNA expression in brown trout vitellogenic ovarian follicles in vitro. Gen. Comp. Endocrinol. 2004, 137, 123–131. [Google Scholar] [CrossRef]
  14. Lafont, A.-G.; Rousseau, K.; Tomkiewicz, J.; Dufour, S. Three nuclear and two membrane estrogen receptors in basal teleosts, Anguilla sp.: Identification, evolutionary history and differential expression regulation. Gen. Comp. Endocrinol. 2016, 235, 177–191. [Google Scholar] [CrossRef]
  15. Nagahama, Y.; Yoshikuni, M.; Yamashita, M.; Tokumoto, T.; Katsu, Y. 4 Regulation of oocyte growth and maturation in fish. Cur Top. Dev. Biol. 1995, 30, 103–145. [Google Scholar] [CrossRef]
  16. Wallace, R.A. Vitellogenesis and oocyte growth in nonmammalian vertebrates. In Oogenesis; Springer: Boston, MA, USA, 1985; pp. 127–177. [Google Scholar] [CrossRef]
  17. Sire, M.-F.; Babin, P.J.; Vernier, J.-M. Involvement of the lysosomal system in yolk protein deposit and degradation during vitellogenesis and embryonic development in trout. J. Exp. Zool. 1994, 269, 69–83. [Google Scholar] [CrossRef]
  18. Jéhannet, P.; Palstra, A.P.; Giménez Nebot, I.; Swinkels, W.; Heinsbroek, L.T.N.; Komen, H. Recombinant FSH and LH treatment to induce oocyte development in vitro and in vivo in the European eel Anguilla anguilla. Fishes 2023, 8, 123. [Google Scholar] [CrossRef]
  19. Brydges, N.M.; Boulcott, P.; Ellis, T.; Braithwaite, V.A. Quantifying stress responses induced by different handling methods in three species of fish. Appl. Anim. Behav. Sci. 2009, 116, 295–301. [Google Scholar] [CrossRef]
  20. Schreck, C.B.; Contreras-Sanchez, W.; Fitzpatrick, M.S. Effects of stress on fish reproduction, gamete quality, and progeny. In Reproductive Biotechnology in Finfish Aquaculture, 1st ed.; Lee, C.-S., Donaldson, E.M., Eds.; Elsevier: Amsterdam, The Netherlands, 2001; pp. 3–24. [Google Scholar] [CrossRef]
  21. Adachi, S.; Ijiri, S.; Kazeto, Y.; Yamauchi, K. Oogenesis in the Japanese eel Anguilla japonica. In Eel Biology, 1st ed.; Aida, K., Tsukamoto, K., Yamauchi, K., Eds.; Springer: Tokyo, Japan, 2003; pp. 502–518. [Google Scholar]
  22. Palstra, A.P.; Bouwman, L.J.; Jéhannet, P.; Kruijt, L.; Schipper, H.; Blokland, M.H.; Swinkels, W.; Heinsbroek, L.T.N.; Lokman, P.M. Steroid implants for the induction of vitellogenesis in feminized European silver eels (Anguilla anguilla L.). Front. Genet. 2022, 13, 969202. [Google Scholar] [CrossRef]
  23. Fontaine, M. Sur la maturation complète des organes génitaux de l’anguille mâle et l’émission spontanée de ses produits sexuels. CR Acad. Sci. Paris 1936, 202, 55. [Google Scholar]
  24. Furuhashi, M.; Shikone, T.; Fares, F.A.; Sugahara, T.; Hsueh, A.J.; Boime, I. Fusing the carboxy-terminal peptide of the chorionic gonadotropin (CG) beta-subunit to the common alpha-subunit: Retention of O-linked glycosylation and enhanced in vivo bioactivity of chimeric human CG. Mol. Endocrinol. 1995, 9, 54–63. [Google Scholar] [CrossRef] [PubMed]
  25. Nguyen, A.T.; Chia, J.H.Z.; Kazeto, Y.; Wylie, M.J.; Lokman, P.M. Induction of oocyte development in previtellogenic eel, Anguilla australis. Gen. Comp. Endocrinol. 2020, 291, 113404. [Google Scholar] [CrossRef] [PubMed]
  26. Chai, Y.; Tosaka, R.; Sago, K.; Hatanaka, R.; Ijiri, S.; Adachi, S. The relationship between the developmental stage of oocytes in various seasons and the quality of the egg obtained by artificial maturation in the feminized Japanese eel Anguilla japonica. Aquac. Sci. 2010, 58, 269–278. [Google Scholar] [CrossRef]
  27. Böhm, T.; Graziano, M.; Blom, E.; Brittijn, S.A.; Dirks, R.P.; Palstra, A.P. Simulated migration of feminized eels to stimulate and predict the sexual maturation response. In Proceedings of the ICBF2016, San Marcos, TX, USA, 12–18 June 2016. [Google Scholar]
  28. Ijiri, S.; Tsukamoto, K.; Chow, S.; Kurogi, H.; Adachi, S.; Tanaka, H. Controlled reproduction in the Japanese eel (Anguilla japonica), past and present. Aquac. Eur. 2011, 36, 13–17. [Google Scholar]
  29. Mes, D.; Dirks, R.P.; Palstra, A.P. Simulated migration under mimicked photothermal conditions enhances sexual maturation of farmed European eel (Anguilla anguilla). Aquaculture 2016, 452, 367–372. [Google Scholar] [CrossRef]
  30. Fulton, T.W. Rate of Growth of Sea Fishes; Neill & Company: Edinburg, UK, 1902. [Google Scholar]
  31. Palstra, A.; van den Thillart, G. Artificial maturation and reproduction of European eel. In Spawning Migration of European eel. Reproduction Index, a Useful Tool for Conservation Management, 1st ed.; van den Thillart, G., Dufour, S., Rankin, C., Eds.; Springer: Heidelberg, Germany, 2009; pp. 309–331. [Google Scholar]
  32. Pankhurst, N.W. Relation of visual changes to the onset of sexual maturation in the European eel Anguilla anguilla (L.). J. Fish. Biol. 1982, 21, 127–140. [Google Scholar] [CrossRef]
  33. Bureau du Colombier, S.; Jacobs, L.; Gesset, C.; Elie, P.; Lambert, P. Ultrasonography as a non-invasive tool for sex determination and maturation monitoring in silver eels. Fish. Res. 2015, 164, 50–58. [Google Scholar] [CrossRef]
  34. Schneider, C.; Rasband, W.; Eliceiri, K. NIH Image to ImageJ: 25 years of image analysis. Nat. Methods 2012, 9, 671–675. [Google Scholar] [CrossRef]
  35. Jéhannet, P.; Kruijt, L.; Damsteegt, E.L.; Swinkels, W.; Heinsbroek, L.T.N.; Lokman, P.M.; Palstra, A.P. A mechanistic model for studying the initiation of anguillid vitellogenesis by comparing the European eel (Anguilla anguilla) and the shortfinned eel (A. australis). Gen. Comp. Endocrinol. 2019, 279, 129–138. [Google Scholar] [CrossRef]
  36. Maugars, G.; Dufour, S. Demonstration of the coexistence of duplicated LH receptors in teleosts, and their origin in ancestral actinopterygians. PLoS ONE 2015, 10, e0135184. [Google Scholar] [CrossRef]
  37. Setiawan, A.N.; Lokman, P.M. The use of reference gene selection programs to study the silvering transformation in a freshwater eel Anguilla australis: A cautionary tale. BMC Mol. Biol. 2010, 11, 75. [Google Scholar] [CrossRef] [PubMed]
  38. Zadmajid, V.; Falahatimarvast, A.; Damsteegt, E.L.; Setiawan, A.N.; Ozaki, Y.; Shoae, A.; Lokman, P.M. Effects of 11-ketotestosterone and temperature on inhibin subunit mRNA levels in the ovary of the shortfinned eel, Anguilla australis. Comp. Bioch Phys. B 2015, 187, 14–21. [Google Scholar] [CrossRef] [PubMed]
  39. Pfaffl, M.W.; Tichopad, A.; Prgomet, C.; Neuvians, T.P. Determination of stable housekeeping genes, differentially regulated target genes and sample integrity: BestKeeper–Excel-based tool using pair-wise correlations. Biotechnol. Lett. 2004, 26, 509–515. [Google Scholar] [CrossRef] [PubMed]
  40. Kagawa, H.; Tanaka, H.; Ohta, H.; Okuzawa, K.; Hirose, K. In vitro effects of 17α-hydroxyprogesterone and 17α, 20β-dihydroxy-4-pregnen-3-one on final maturation of oocytes at various developmental stages in artificially matured Japanese eel Anguilla japonica. Fish. Sci. 1995, 61, 1012–1015. [Google Scholar] [CrossRef]
  41. Palstra, A.P.; Cohen, E.G.H.; Niemantsverdriet, P.R.W.; van Ginneken, V.J.T.; van den Thillart, G.E.E.J.M. Artificial maturation and reproduction of European silver eel: Development of oocytes during final maturation. Aquaculture 2005, 249, 533–547. [Google Scholar] [CrossRef]
  42. Tanaka, H. Progression in artificial seedling production of Japanese eel Anguilla japonica. Fish. Sci. 2015, 81, 11–19. [Google Scholar] [CrossRef]
  43. Han, Y.-S.; Liao, I.-C.; Huang, Y.-S.; He, J.-T.; Chang, C.-W.; Tzeng, W.-N. Synchronous changes of morphology and gonadal development of silvering Japanese eel Anguilla japonica. Aquaculture 2003, 219, 783–796. [Google Scholar] [CrossRef]
  44. Pelster, B. Swimbladder function and the spawning migration of the European eel Anguilla anguilla. Front. Physiol. 2015, 5, 486. [Google Scholar] [CrossRef]
  45. Yamada, Y.; Zhang, H.; Okamura, A.; Tanaka, S.; Horie, N.; Mikawa, N.; Utoh, T.; Oka, H.P. Morphological and histological changes in the swim bladder during maturation of the Japanese eel. J. Fish. Biol. 2001, 58, 804–814. [Google Scholar] [CrossRef]
  46. Balm, S.P.; Durif, C.; van Ginneken, V.; Antonissen, E.; Boot, R.; van Den Thillart, G.; Verstegen, M. Silvering of European eel (Anguilla anguilla L.): Seasonal changes of morphological and metabolic parameters. Anim. Biol. 2007, 57, 63–77. [Google Scholar] [CrossRef]
  47. Lokman, P.M.; Vermeulen, G.J.; Lambert, J.G.D.; Young, G. Gonad histology and plasma steroid profiles in wild New Zealand freshwater eels (Anguilla dieffenbachii and A. australis) before and at the onset of the natural spawning migration. I. Females. Fish. Physiol. Biochem. 1998, 19, 325–338. [Google Scholar] [CrossRef]
  48. Rohr, D.H.; Lokman, P.M.; Davie, P.S.; Young, G. 11-Ketotestosterone induces silvering-related changes in immature female short-finned eels, Anguilla australis. Comp. Biochem. Phys. A 2001, 130, 701–714. [Google Scholar] [CrossRef] [PubMed]
  49. Thomson-Laing, G.; Jasoni, C.L.; Lokman, P.M. The effects of migratory stage and 11-ketotestosterone on the expression of rod opsin genes in the shortfinned eel (Anguilla australis). Gen. Comp. Endocrinol. 2018, 257, 211–219. [Google Scholar] [CrossRef] [PubMed]
  50. Cottrill, R.A.; McKinley, R.S.; Kaak, G.; Dutil, J.-D.; Reid, K.B.; McGrath, K.J. Plasma non-esterified fatty acid profiles and 17beta-oestradiol levels of juvenile immature and maturing adult American eels in the St Lawrence River. J. Fish. Biol. 2001, 59, 364–379. [Google Scholar] [CrossRef]
  51. Tzchori, I.; Degani, G.; Hurvitz, A.; Moav, B. Cloning and developmental expression of the cytochrome P450 aromatase gene (CYP19) in the European eel (Anguilla anguilla). Gen. Comp. Endocrinol. 2004, 138, 271–280. [Google Scholar] [CrossRef]
  52. Yan, L.; Swanson, P.; Dickhoff, W.W. A two-receptor model for salmon gonadotropins (GTH I and GTH II). Biol. Reprod. 1992, 47, 418–427. [Google Scholar] [CrossRef]
  53. Miwa, S.; Yan, L.; Swanson, P. Localization of two gonadotropin receptors in the salmon gonad by in vitro ligand autoradiography. Biol. Reprod. 1994, 50, 629–642. [Google Scholar] [CrossRef]
  54. Kazeto, Y.; Kohara, M.; Miura, T.; Miura, C.; Yamaguchi, S.; Trant, J.M.; Adachi, S.; Yamauchi, K. Japanese eel follicle-stimulating hormone (Fsh) and luteinizing hormone (Lh): Production of biologically active recombinant Fsh and Lh by drosophila S2 cells and their differential actions on the reproductive biology. Biol. Reprod. 2008, 79, 938–946. [Google Scholar] [CrossRef]
  55. Wang, W.; Zhu, H.; Tian, Z.; Sun, A.; Dong, Y.; Dong, T.; Hu, H. Effects of 11-tetotestosterone on development of the previtellogenic ovary in the Sterlet, Acipenser ruthenus. Front. Endocrinol. 2020, 11, 115. [Google Scholar] [CrossRef]
  56. Perazzolo, L.M.; Coward, K.; Davail, B.; Normand, E.; Tyler, C.R.; Pakdel, F.; Schneider, W.J.; Le Menn, F. Expression and localization of messenger ribonucleic acid for the vitellogenin receptor in ovarian follicles throughout oogenesis in the Rainbow trout, Oncorhynchus mykiss. Biol. Reprod. 1999, 60, 1057–1068. [Google Scholar] [CrossRef]
Figure 1. Portrait pics of (a) a representative eel of the control group and (b) a representative eel of the human chorionic gonadotropin (hCG) treated group. Each eel is shown at three moments from left to right: before migration, pre-treatment and post-treatment. Morphological differences such as eye enlargement, darkening of the pectoral fin and a less acute head were observed in the eels after hCG treatment in comparison with the controls.
Fishes 08 00281 g001
Figure 2. Post-treatment 11-ketotestosterone concentrations (11KT in pg mL−1) as determined by enzyme-linked immunosorbent assay (ELISA) in the blood plasma of eels from the control group (C; N = 16) and from the human chorionic gonadotropin-treated group (hCG; N = 15). The asterisks indicate a significant difference between both groups (p < 0.001).
Fishes 08 00281 g002
Figure 3. Gonadosomatic index (GSI; AV ± SD) values, calculated from ultrasound images, for eels pre-treatment and post-treatment of (a) the control group (N = 25) and (b) the human chorionic gonadotropin (hCG) treated group (N = 25). The asterisks indicate significant differences of * p < 0.05 and *** p < 0.001.
Fishes 08 00281 g003
Figure 4. Mayer’s hematoxylin eosin (HE) stained oocytes from eels of (A) the control group and (B) the human chorionic gonadotropin (hCG) treated group. Scale bar = 200 µm.
Fishes 08 00281 g004
Figure 5. Yolk granules (yg, indicated by the yellow arrowhead), still absent in eels of (A) the control group, but present and visible as the peripherally located pink spots (indicated by the yellow arrow head) in eels of (B) the human chorionic gonadotropin (hCG) treated group. Scale bar = 200 µm.
Fishes 08 00281 g005
Figure 6. Relative fold change expression of estrogen-1 (esr-1) in the liver using Ribosomal Protein L36 (L36) as housekeeping gene for normalization. Abbreviations: fc = fold change; C = control group; hCG = human chorionic gonadotropin-treated group. The asterisks indicate a significant difference of *** p < 0.001.
Fishes 08 00281 g006
Figure 7. Relative fold change expression of (a) aromatase (cyp19), (b) follicle-stimulating hormone receptor (fshr), (c) lipoprotein lipase (lpl), (d) vitellogenin receptor (vtgr), (e) luteinizing hormone receptor-1 (lhr-1) and (f) luteinizing hormone receptor-2 (lhr-2) expression in the ovary using elongation factor-1 (elf-1), ribosomal protein l36 (l36) and 18S ribosomal RNAs (18S) as housekeeping genes for normalization. Abbreviations: fc = fold change; C = control group; hCG = human chorionic gonadotropin-treated group. The asterisks indicate significant differences of * p < 0.05 and *** p < 0.001.
Fishes 08 00281 g007
Figure 8. Body weight index evolution of the maturing feminized eels, that released eggs that could be fertilized, versus the number of weekly common carp pituitary extract (CPE) injections for eels from (a) the control group and (b) the human chorionic gonadotropin-treated group (N = 15 per group). Each experimental eel is represented by PITtag code and colored line connecting the weekly BWI values. Abbreviations: BWI = body weight index; CPE = common carp pituitary extract.
Fishes 08 00281 g008
Table 1. Primers for each of the target genes or housekeeping genes. Abv = gene abbreviation; Accession number: the Genbank accession number for A. anguilla; G: sequence obtained from the A. anguilla genome by Jéhannet et al. [35] or Setiawan and Lokman [37]; size: the Amplicon size, the PCR product size in base pairs (bp) of nucleotides; temp: annealing temperature in °C of target genes or housekeeping genes, and references. Abbreviations: FW = Forward primer; RV = Reverse primer.
Abv.GeneAccession NumberPrimer Sequence (5′-3′)Size (bp)Temp °CRef.
18S18 s ribosomal RNAFM946133FW: GTACACACGGCCGGTACAGT
RV: GGTAGGCGCAGAAAGTACCA
30260[37]
cyp19Aromatase cytochrome P450KF990052FW: CGCACCTACTTTGCTAAAGCTC
RV: AGGTTGAGGATGTCCACCTG
13762[35]
elf-1Elongation factor 1EU407825FW: CCCCTGCAGGATGTCTACAA
RV: AGGGACTCATGG TGCATTTC
15264[37]
esr-1Estrogen receptor 1LN879034FW: GGCATGGCCGAGATTTTC
RV: GCACCGGAGTTGAGCAGTAT
11662[35]
fshrFollicle-stimulating hormone receptorLN831181FW: CCTGGTCGAGATAACAATCACC
RV: CCTGAAGGTCAAACAGAAAGTCC
17363[38]
l3660 s ribosomal protein l36GFW: CCTGACCAAGCAGACCAAGT
RV: TCTCTTTGCACGGATGTGAG
16062[37]
lhr-1Luteinizing hormone 1LN831182FW: GCGGAAACACAGGGAGAAC
RV: GGTTGAGGTACTGGAAATCGAAG
15560[36]
lhr-2Luteinizing hormone 2LN831183FW: TCAACAACCTCACCAATCTCTCT
RV: GCAGTGAAGAAATAGCCGACA
16262[18]
lpllipoprotein lipaseXM035416270FW: TGATGCTGATTGCTACTTCTGG
RV: ATGCTCTCCTGCTGCTTCTT
11562This study
vtgrVitellogenin receptorGFW: TCTGAACGAACCCCAGGA
RV: TTTGGGGAGTGCTTGTTGA
14059[35]
Table 2. Paired biometric data (AV ± SD) for eels of the control (C) group and the human chorionic gonadotropin (hCG) treated group, pre- and post-treatment. Significant differences between either the C group post-treatment vs. pre-treatment, or for the hCG-treated group post-treatment vs. pre-treatment are indicated by (−) when post-treatment values were significantly smaller (p < 0.001) than pre-treatment values, or by (+) when post-treatment values were significantly larger (p < 0.001) than pre-treatment values. Abbreviations: BL = body length; BW = body weight; K = Fulton’s condition factor; BGI = body girth index; EI = eye index; C = control group; hCG = human chorionic gonadotropin-treated group.
BL
(cm)
BW
(g)
KBGIEI
C pre-treatment58 ± 3347 ± 470.17 ± 0.000.18 ± 0.007.26 ± 1.27
C post-treatment58 ± 3323 ± 45 (−)0.16 ± 0.00 (−)0.17 ± 0.00 (−)7.04 ± 1.26
hCG pre-treatment58 ± 3336 ± 370.18 ± 0.000.18 + 0.007.59 ± 1.10
hCG post-treatment58 ± 3329 ± 37 (−)0.17 ± 0.00 (−)0.18 ± 0.009.11 ± 0.92 (+)
Table 3. Reproduction parameters (AV ± SD) after hypophysation of hCG-treated eels (N = 15) and control eels (N = 15). “Days to reach BWI 110” is the number of days of weekly CPE injections to reach a BWI of 110; “CPE injections mature” is the number of CPE injections to reach final maturation, “Hours after final DHP injection” is the number of hours after DHP injection until egg release and “% Floating eggs” is the average percentage of floating eggs. Abbreviations: BWI = body weight index; CPE = common carp pituitary extract; DHP = 17,20β-dihydroxy-4-pregnen-3-one; C = control; hCG = human chorionic gonadotropin.
Days to Reach BWI 110CPE Injections MatureHours after Final DHP Injection% Floating Eggs
C group 90 ± 1114 ± 212 ± 133 ± 24
hCG group 65 ± 910 ± 112 ± 139 ± 26
Table 4. Reproduction results for hCG-treated and control eels (each group N = 15 eels). “Eggs” is the number of eels that released eggs, “Embryos” is the number of eels that had eggs with developing embryos, “Larvae” is the number of eels from which hatched larvae were produced, and under the header “larval longevity” are shown “average (dph)”, which is the average number of days post hatching that the larvae survived, and “max (dph)”, which is the maximal number of days post hatching that the larvae survived. Abbreviations: dph= days post hatching; C = control; hCG = human chorionic gonadotropin.
Larval Longevity
EggsEmbryosLarvaeAverage (dph)Max (dph)
C group 129959
hCG group 121111511
Disclaimer/Publisher’s Note: The statements, opinions and data contained in all publications are solely those of the individual author(s) and contributor(s) and not of MDPI and/or the editor(s). MDPI and/or the editor(s) disclaim responsibility for any injury to people or property resulting from any ideas, methods, instructions or products referred to in the content.