Article

Screening and Identification of Interacting Proteins of Mitfa in Red Tilapia

1
Wuxi Fisheries College, Nanjing Agricultural University, Wuxi 214128, China
2
Key Laboratory of Freshwater Fisheries and Germplasm Resources Utilization, Ministry of Agriculture and Rural Affairs, Freshwater Fisheries Research Center of Chinese Academy of Fishery Sciences, Wuxi 214081, China
*
Author to whom correspondence should be addressed.
Fishes 2023, 8(5), 241; https://doi.org/10.3390/fishes8050241
Submission received: 14 March 2023 / Revised: 12 April 2023 / Accepted: 13 April 2023 / Published: 5 May 2023
(This article belongs to the Special Issue Molecular Ecology and Genetic Diversity of Fish)

Abstract

:
Skin color variation and differentiation are bottlenecks in the aquaculture industry of red tilapia. The mitfa gene primarily regulates melanocyte survival and proliferation in fish skin pigmentation. In this study, a recombinant expression vector for Mitfa expression was successfully constructed. After induction and purification, nearly 600 μg of Mitfa protein was purified from the fermentation supernatant. His pull-down assay, followed by LC-MS/MS analysis, revealed 10 proteins that interact with the Mitfa protein. Five of these proteins were annotated in the melanogenesis and tyrosine metabolism pathways, including Krt, Tpm, Myh, Tyr and Dct. The purified Mitfa recombinant protein was injected into red tilapia, and its activity and function were examined. The expression levels of the mitfa, tyr, tyrp1, and dct genes increased greatly in the dorsal skin after injection (p < 0.05); meanwhile, the melanin content and tyrosinase activity increased significantly (p < 0.05). These findings provide a theoretical basis for comprehending the function and regulatory mechanism of the red tilapia mitfa gene.
Key Contribution: The prokaryotic recombinant expression vector pET 28a (+)-Mitfa was successfully constructed. The proteins interacting with the recombinant Mitfa protein were identified and the signaling pathways involved were predicted. The activity and function of the Mitfa protein in red tilapia were validated by an in vivo injection assay for the first time in this study. These results will contribute to a deeper understanding of the regulatory mechanism and pathways associated with mitfa genes contributing to variations in fish skin color.

Graphical Abstract

1. Introduction

The microphthalmia-associated transcription factor (mitf) gene is an essential regulator expressed in melanoblast precursors [1]. Mitf can specifically recognize the promoter region of the tyrosinase family genes and promotes the survival, migration, and development of melanocytes [2,3]. Mitf is mainly expressed in melanocytes, melanoma cells, neural crest progenitor cells, and retinal pigment epithelial (RPE) cells [4,5]. A mutation in mitf in mammals results in albinism, white patches, and non-pigment RPE [6,7,8]. In zebrafish, mitf has been extensively studied as a potential target gene for the treatment of melanoma [9]. In fighting fish, both the double-tailed and albino phenotypes are caused by mutations in regulatory elements near zic1/zic4 and in the mitfa coding region, respectively [10]. Mitfa is one of the duplicates of the mitf gene, which is strongly linked with the synthesis of melanin in the skin [11]. The zebrafish mutant for the mitfa exhibited the complete absence of melanocytes in the skin [12]. The expression patterns and function of the mitfa gene have been studied in other fish species [13,14,15]; however, its specific regulatory mechanism and interaction with other genes remain unknown.
Red tilapia (Oreochromis spp.) is one of the most valuable freshwater fish species because of its attractive color, lack of a dark peritoneum, and rapid growth rate [16]. Nevertheless, during the overwintering period, red tilapia undergoes skin color darkening, which can lead to a steep decline in its economic value [17,18]. Therefore, it is crucial to investigate the molecular functions and regulatory mechanisms underlying skin color changes in red tilapia. Currently, the molecular characteristics of melanin synthesis genes, including mitf gene duplicates [11], mc1r [19], and pmch1 [20] were studied in red tilapia. In our earlier transcriptome analysis, the expression of the red tilapia mitfa in dark skin was substantially higher than in red skin [17,18]. We obtained the full-length cDNA of mitfa from the red tilapia, analyzed its sequence and protein structure using bioinformatics tools, and investigated the tissue expression profile of mitfa [11]. However, information on the regulatory mechanism of skin pigmentation is insufficient.
This study aimed to further investigate the skin color regulatory mechanism of mitfa in red tilapia. The recombinant plasmid pET28a (+)-Mitfa was created, and the Mitfa recombinant protein was expressed in prokaryotic systems. Particularly, the proteins interacting with Mitfa were screened by the His pull-down technique and identified by mass spectrometry. Subsequently, the signaling pathways associated with the interaction proteins were further studied. Then, the Mitfa recombinant protein was injected into red tilapia, and the relative mitfa, tyr, tyrp1, and dct expression levels were analyzed at different time points. These results will enhance the understanding of the regulatory mechanism and regulatory pathways of the mitfa gene behind skin color variation in red tilapia.

2. Materials and Methods

2.1. Sample Collection

The red tilapia (average weight 100 ± 5 g) were obtained from the Qiting Pilot Research Station (Yixing, Jiangsu, China), affiliated with the Freshwater Fisheries Research Center. The red tilapia were adapted into tanks of 256 L capacity in the recirculation aquaculture system at 26 ± 2 °C under a 12 h light/dark photoperiod. The fish were fed with special aquatic compound feed in the morning (at 8:30) and evening (at 18:30) every day. The red tilapia were briefly sedated with MS-222 at 50 mg/L concentration (Yufubao Aquatic Technology Co., Ltd., Guangzhou, China), and the dorsal skin of the fish was collected. All fresh skin tissues were frozen in liquid nitrogen for RNA and protein extraction. The total protein was extracted from the dorsal skin according to the protein extraction kit (Sangon Biotech., Shanghai, China).

2.2. RNA Extraction and cDNA Synthesis

The RNA was extracted from the dorsal skin using RNA TRIzol reagent (Invitrogen, Carlsbad, CA, USA), following the precise instructions. The RNA integrity and abundance were evaluated by 1% agarose gel electrophoresis. The OD260/OD280 values were measured using a NanoDrop 100 ultra-micro spectrophotometer (Analytikjena, Jena, Germany) to estimate the purity of the RNA. The PrimeScript RT Master Mix Perfect Real Time Kit (Takara, Kyoto, Japan) was then used to reverse-transcribe the RNA into first-strand cDNA.

2.3. Expression and Purification of the Mitfa Recombinant Protein

The mitfa gene sequence (Accession No. XMJ015775442 in GenBank, NCBI) of the red tilapia was used to design the mitfa-his-F and mitfa-his-R constructs (Table 1), which include BamH I and Xho I restriction sites at both ends of the open reading frame. The polymerase chain reaction (PCR) consisted of 12.5 µL of 10 ×Taq Master Mix (Cwbiotech, Beijing, China), 2 µL of each primer (10 µmol/L), 2 µL of cDNA template, and 8.5 μL of ddH2O. The PCR products were separated on an agarose gel, and the DNA target band was extracted and purified by a FastPure Gel DNA Extraction Mini Kit (Vazyme, Nanjing, China). The amplified target fragment and the plasmid were ligated together for cloning the mitfa-encoding DNA into the pET28a (+) plasmid (Takara, Kyoto, Japan).
The pET28a (+)-Mitfa construct was introduced into Escherichia coli Rosetta (DE3) cells and cultured overnight on Luria–Bertani (LB) solid medium. A single colony of the recombinant plasmid was picked and cultured to identify positive clones. The transformants with the target gene were identified by double-enzyme digestion. Next, the cells were cultured in LB medium containing 50 μg/mL ampicillin and 30 μg/mL chloramphenicol and incubated overnight at 37 °C. Subsequently, 1 mmol/L isopropyl β-D-thiogalactoside was added, and the expression of the recombinant protein was induced at 20 °C for 8 h. After resuspension in 50 mL pre-cooled NTA-0 Buffer (20 mM Tris-HCl, 0.5 M NaCl, 10% Glycerol, pH 7.9), the Mitfa protein was diluted with guanidine hydrochloride (6 M) and dialyzed for 48 h at 4 °C. The supernatant was filtered and affinity purified by fast protein liquid chromatography. Finally, the purified protein was examined by 12% SDS-polyacrylamide gel electrophoresis (SDS-PAGE), and the result was observed by Coomassie brilliant blue staining.

2.4. His Pull-Down Assay

A 100 µL of a 50% slurry of Ni-NTA-agarose resin (Sangon Biotech, Shanghai, China) was mixed with 500 µg of pure His-tagged Mitfa protein. This mixture was then maintained at 4 °C for 180 min. To the control group, 900 μL of phosphate buffered saline (PBS) and 100 μL of Ni-NTA-agarose resin were added. The resins were rinsed 3 times with 1 mL PBST and centrifuged at 2500 rpm for 3 min. To both the control and experimental groups, 1 mg of total dorsal skin protein was added and incubated overnight with gentle shaking. The supernatant was obtained after washing 3 times and centrifuging at 12,000 rpm for 5 min. Anti-Mitfa was used as the primary antibody in the immunoblotting of the Mitfa protein.

2.5. Western Blotting

The Mitfa recombinant protein was used to vaccinate a female New Zealand rabbit. A total of 4 immunizations were performed at 7 d intervals. At the end of the 4 immunizations, antisera were collected, and immunization levels were determined by enzyme-linked immunosorbent assay (ELISA). The acquired polyclonal antiserum was evaluated for antibody titer and specificity. Then, the rabbit polyclonal antibody was purified by Protein G affinity chromatography.
The Mitfa recombinant protein or the total protein from the dorsal skin were separated by SDS-PAGE in 12.5% (w/v) acrylamide gel with a 4% (w/v) acrylamide stacking gel. After electrophoresis, the proteins were transferred to polyvinylidene fluoride membranes (Bio-Rad, Hercules, CA, USA) and immersed in a blocking solution (Roche, Shanghai, China) at room temperature for 1.5 h. Then, the membranes were incubated with a primary antibody (anti-Mitfa, 1:5000 dilution) and a secondary antibody (goat anti-rabbit alkaline phosphatase-conjugated antibody, 1:10,000 dilution) for 2 h at room temperature. After color development by enhanced chemiluminescence, the protein bands were exposed and photographed using a chemiluminescent gel imaging system.

2.6. Liquid Chromatography with Tandem Mass Spectrometry (LC-MS/MS) Analysis

The bands of interest in the previous section were removed from the gel using a clean blade and digested enzymatically. The original MS data were collected using the Triple TOF 5600 + LC/MS system (AB SCIEX, Boston, MA, USA) and immediately sent to the Proteinpilot software for retrieval. The protein was identified using the Uniprot database (http://www.Uniprot.org (accessed on 10 March 2023)) and the NCBI database (http://www.ncbi.nlm.nih.gov (accessed on 10 March 2023)). The experiment was set up with a confidence level of conf ≤ 95% and a unique peptide ≥1. The peptide sequences and molecular weight were obtained by filtering out common contaminating proteins.

2.7. Bioinformatics Analysis

Next, Gene Ontology (GO) functional annotation (http://www.geneontology.org/ (accessed on 10 March 2023)) and Kyoto Encyclopedia of Genes and Genomes (KEGG, http://www.kegg.jp/ (accessed on 10 March 2023)) enrichment analysis of the interacting proteins was performed by clusterProfiler package [21] and KOBAS v3.0 [22], respectively. The GO terms and KEGG pathways with p-value ≤ 0.05 were considered as significantly enriched.

2.8. Administration of the Mitfa Recombinant Protein for In Vivo Assays

From a preliminary experiment (Figure S1), we determined the dosage of the Mitfa recombinant protein administration to be 0.1 μg/g body weight for the subsequent experiments. The juvenile red tilapia (initial weight: 10 ± 2 g) were injected intraperitoneally with Mitfa recombinant protein and diethyl-pyrocarbonate-treated water (control group). Each group had 30 red tilapia, with three replicates per treatment. The red tilapia were sampled at 12 h, 24 h, 48 h, 72 h, and 96 h after injection. Total RNA and total protein were extracted from the dorsal skin. The mRNA for mitfa, tyr, tyrp1, and dct genes was evaluated by quantitative real-time PCR (qRT-PCR), and the Mitfa protein expression was analyzed by Western blotting. The activity of tyrosinase and the melanin content of the samples were tested using an ELISA kit (Enzyme-linked Biotechnology, Shanghai, China).

2.9. Quantitative Real-Time PCR Analysis

The first-strand cDNAs were used as the template for qRT-PCR. The specific primers for the genes are listed in Table 1. The qRT-PCR was conducted on a CFX96 Real-Time PCR Detection System (Bio-Rad, Hercules, CA, USA). A total of 20 microliters of the PCR reaction volume contained 2.0 µL of cDNA, 10 µL SYBR Premix ExTaq II (2×), 1.0 μL of each primer (10 µM), and 6 µL of ddH2O. The following cycling program was used for qRT-PCR: 95 °C for 35 s, followed by 38 cycles of 95 °C for 5 s, and 58 °C for 30 s. The experimental data were statistically analyzed according to the internal reference gene (β-actin gene) using the 2−ΔΔCt method [23]. All data analyses were carried out by SPSS 26 software (Chicago, IL, USA); p-values ≤ 0.05 were regarded as statistically significant.

3. Results

3.1. Construction of the pET28a (+)-Mitfa Prokaryotic Expression Vector

The pET28a (+) and mitfa DNA fragments were digested with the restriction enzymes of BamH I and Xho I, and two distinct fragments of length 5.5 kb and 1.5 kb were separated by agarose gel electrophoresis (Figure 1). The sizes of these two fragments were as expected, indicating that the target gene sequence was complete and accurate, and the orientation of expression was correct. Therefore, the recombinant expression vector was correctly constructed.

3.2. Expression and Purification of the Mitfa Fusion Protein

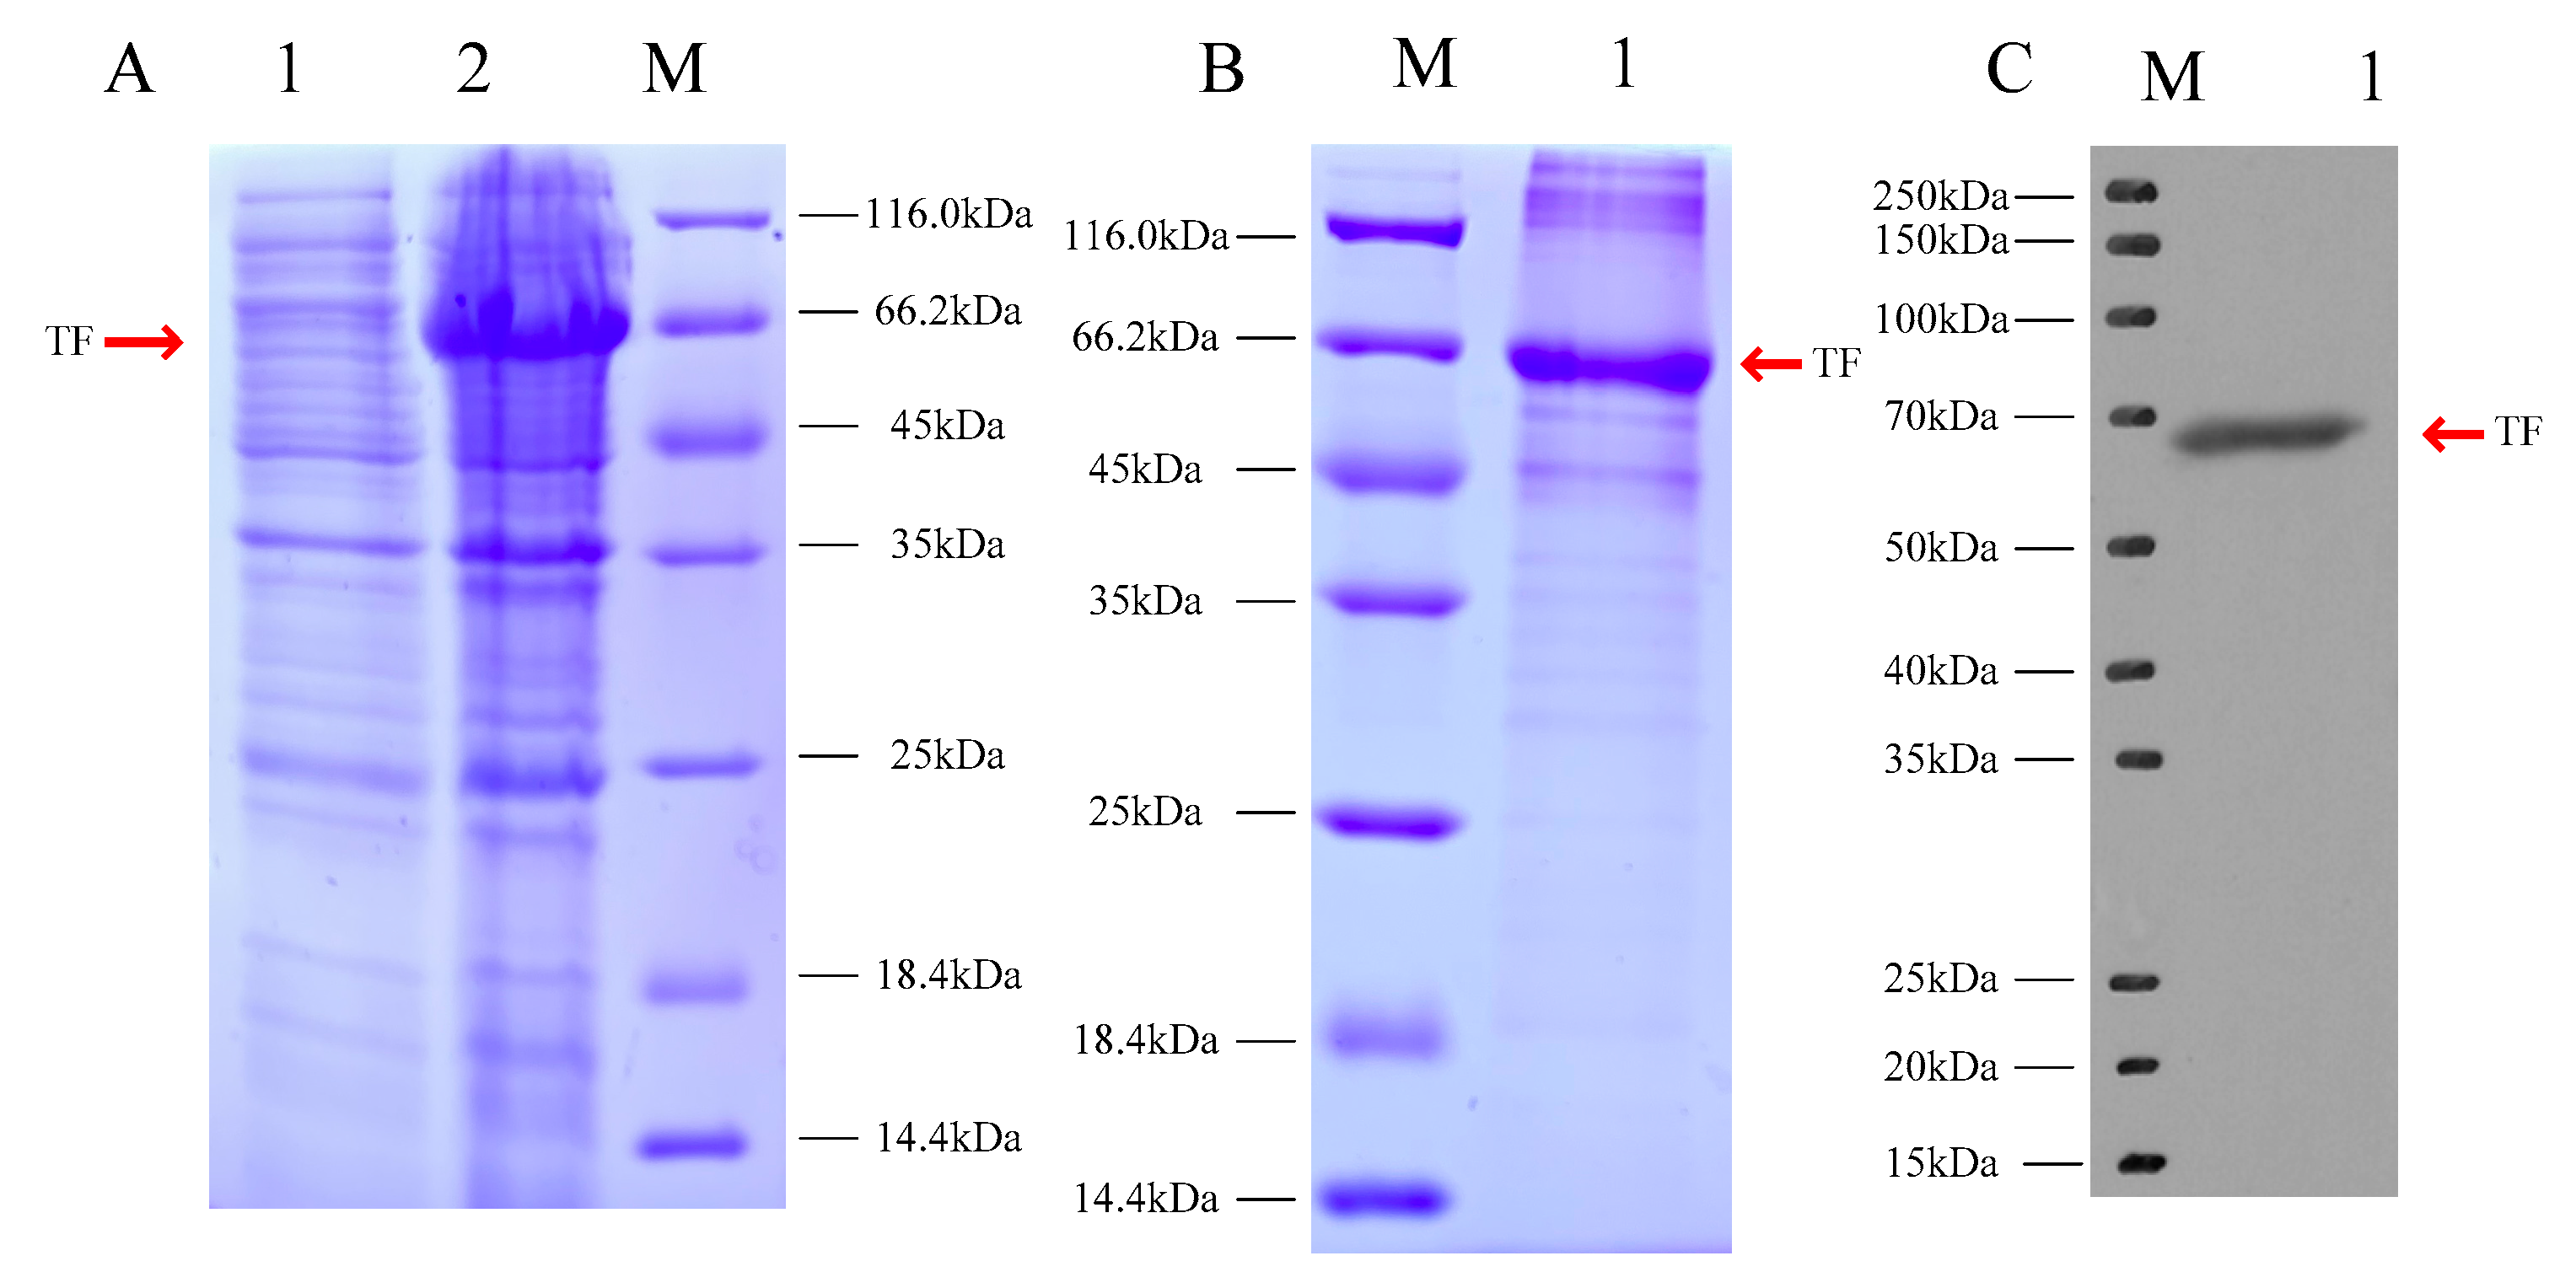
The SDS-PAGE analyses revealed that the expression product was primarily present in the precipitate, and a small amount was also present in the supernatant of the bacterial lysate (Figure 2A). The active recombinant Mitfa was obtained after purification and renaturation. In contrast to the control group, the His pull-down assay showed that there was a conspicuous protein band of approximately 61 kD in the experimental group (Figure 2B). The obtained Mitfa protein was more than 80% pure, as determined by affinity chromatography. The Western blotting result revealed that the target band was of the Mitfa protein (Figure 2C).

3.3. Screening and Identification of Proteins Interacting with Mitfa

The His pull-down assay showed that compared to the control group, a conspicuous protein band of approximately 61 kD was observed in the experimental group (Figure 3). These two groups have different protein bands, indicating that the His-Mitfa protein interacted with multiple proteins in the total protein extract. These differential protein bands were examined and identified by LC-MS/MS analysis (Table 2). The obtained spectrum for His control and His-Mitfa fusion proteins were 468 and 526, respectively, with the number of identification spectra being 1 and 59, respectively. Ten credible proteins interacting with Mitfa were screened based on the matching principle of a peptide number ≥ 1 (Table 3).

3.4. Enrichment Analysis of the Mitfa Interaction Proteins

GO annotation identified ten proteins interacting with Mitfa (Figure 4A). The most abundant components in the category of cellular components were the melanosome membrane, pigment granule membrane, melanosome, and pigment granule. In the biological process category, the majority of the interacting proteins were engaged in the melanin biosynthesis process, developmental pigmentation, the tyrosine metabolic process, and the secondary metabolite biosynthesis process. In the molecular function category, structural molecule activity, tyrosinase activity, and catechol oxidase activity were the most abundant terms.
KEGG enrichment analysis showed that the Mitfa-interacting proteins were considerably abundant in six pathways: melanogenesis, tyrosine metabolism, cardiac muscle contraction, glycolysis/gluconeogenesis, RNA degradation, and adrenergic signaling in cardiomyocytes (p < 0.05; Figure 4B). Among them, both melanogenesis and tyrosine metabolism pathways are involved in pigmentation-related pathways.

3.5. Administration of the Recombinant Mitfa Protein

Intraperitoneal injection of recombinant Mitfa protein into the red tilapia revealed that the relative mitfa expression of the red tilapia increased considerably at 12–96 h after injection (Figure 5, p < 0.05). After injection, the relative mitfa mRNA expression in the dorsal skin was considerably higher at 12 h–48 h than that at 96 h (p < 0.05). After injection of recombinant Mitfa, the level of Mitfa protein detected using the polyclonal anti-Mitfa antibody revealed clearly enhanced expression compared with the control groups, which was consistent with its mRNA expression levels in the respective groups (Figure 6). Moreover, the expression of the Mitfa protein was significantly higher at 12 h and 24 h after intraperitoneal injection than it was at 72 h and 96 h (p < 0.05).
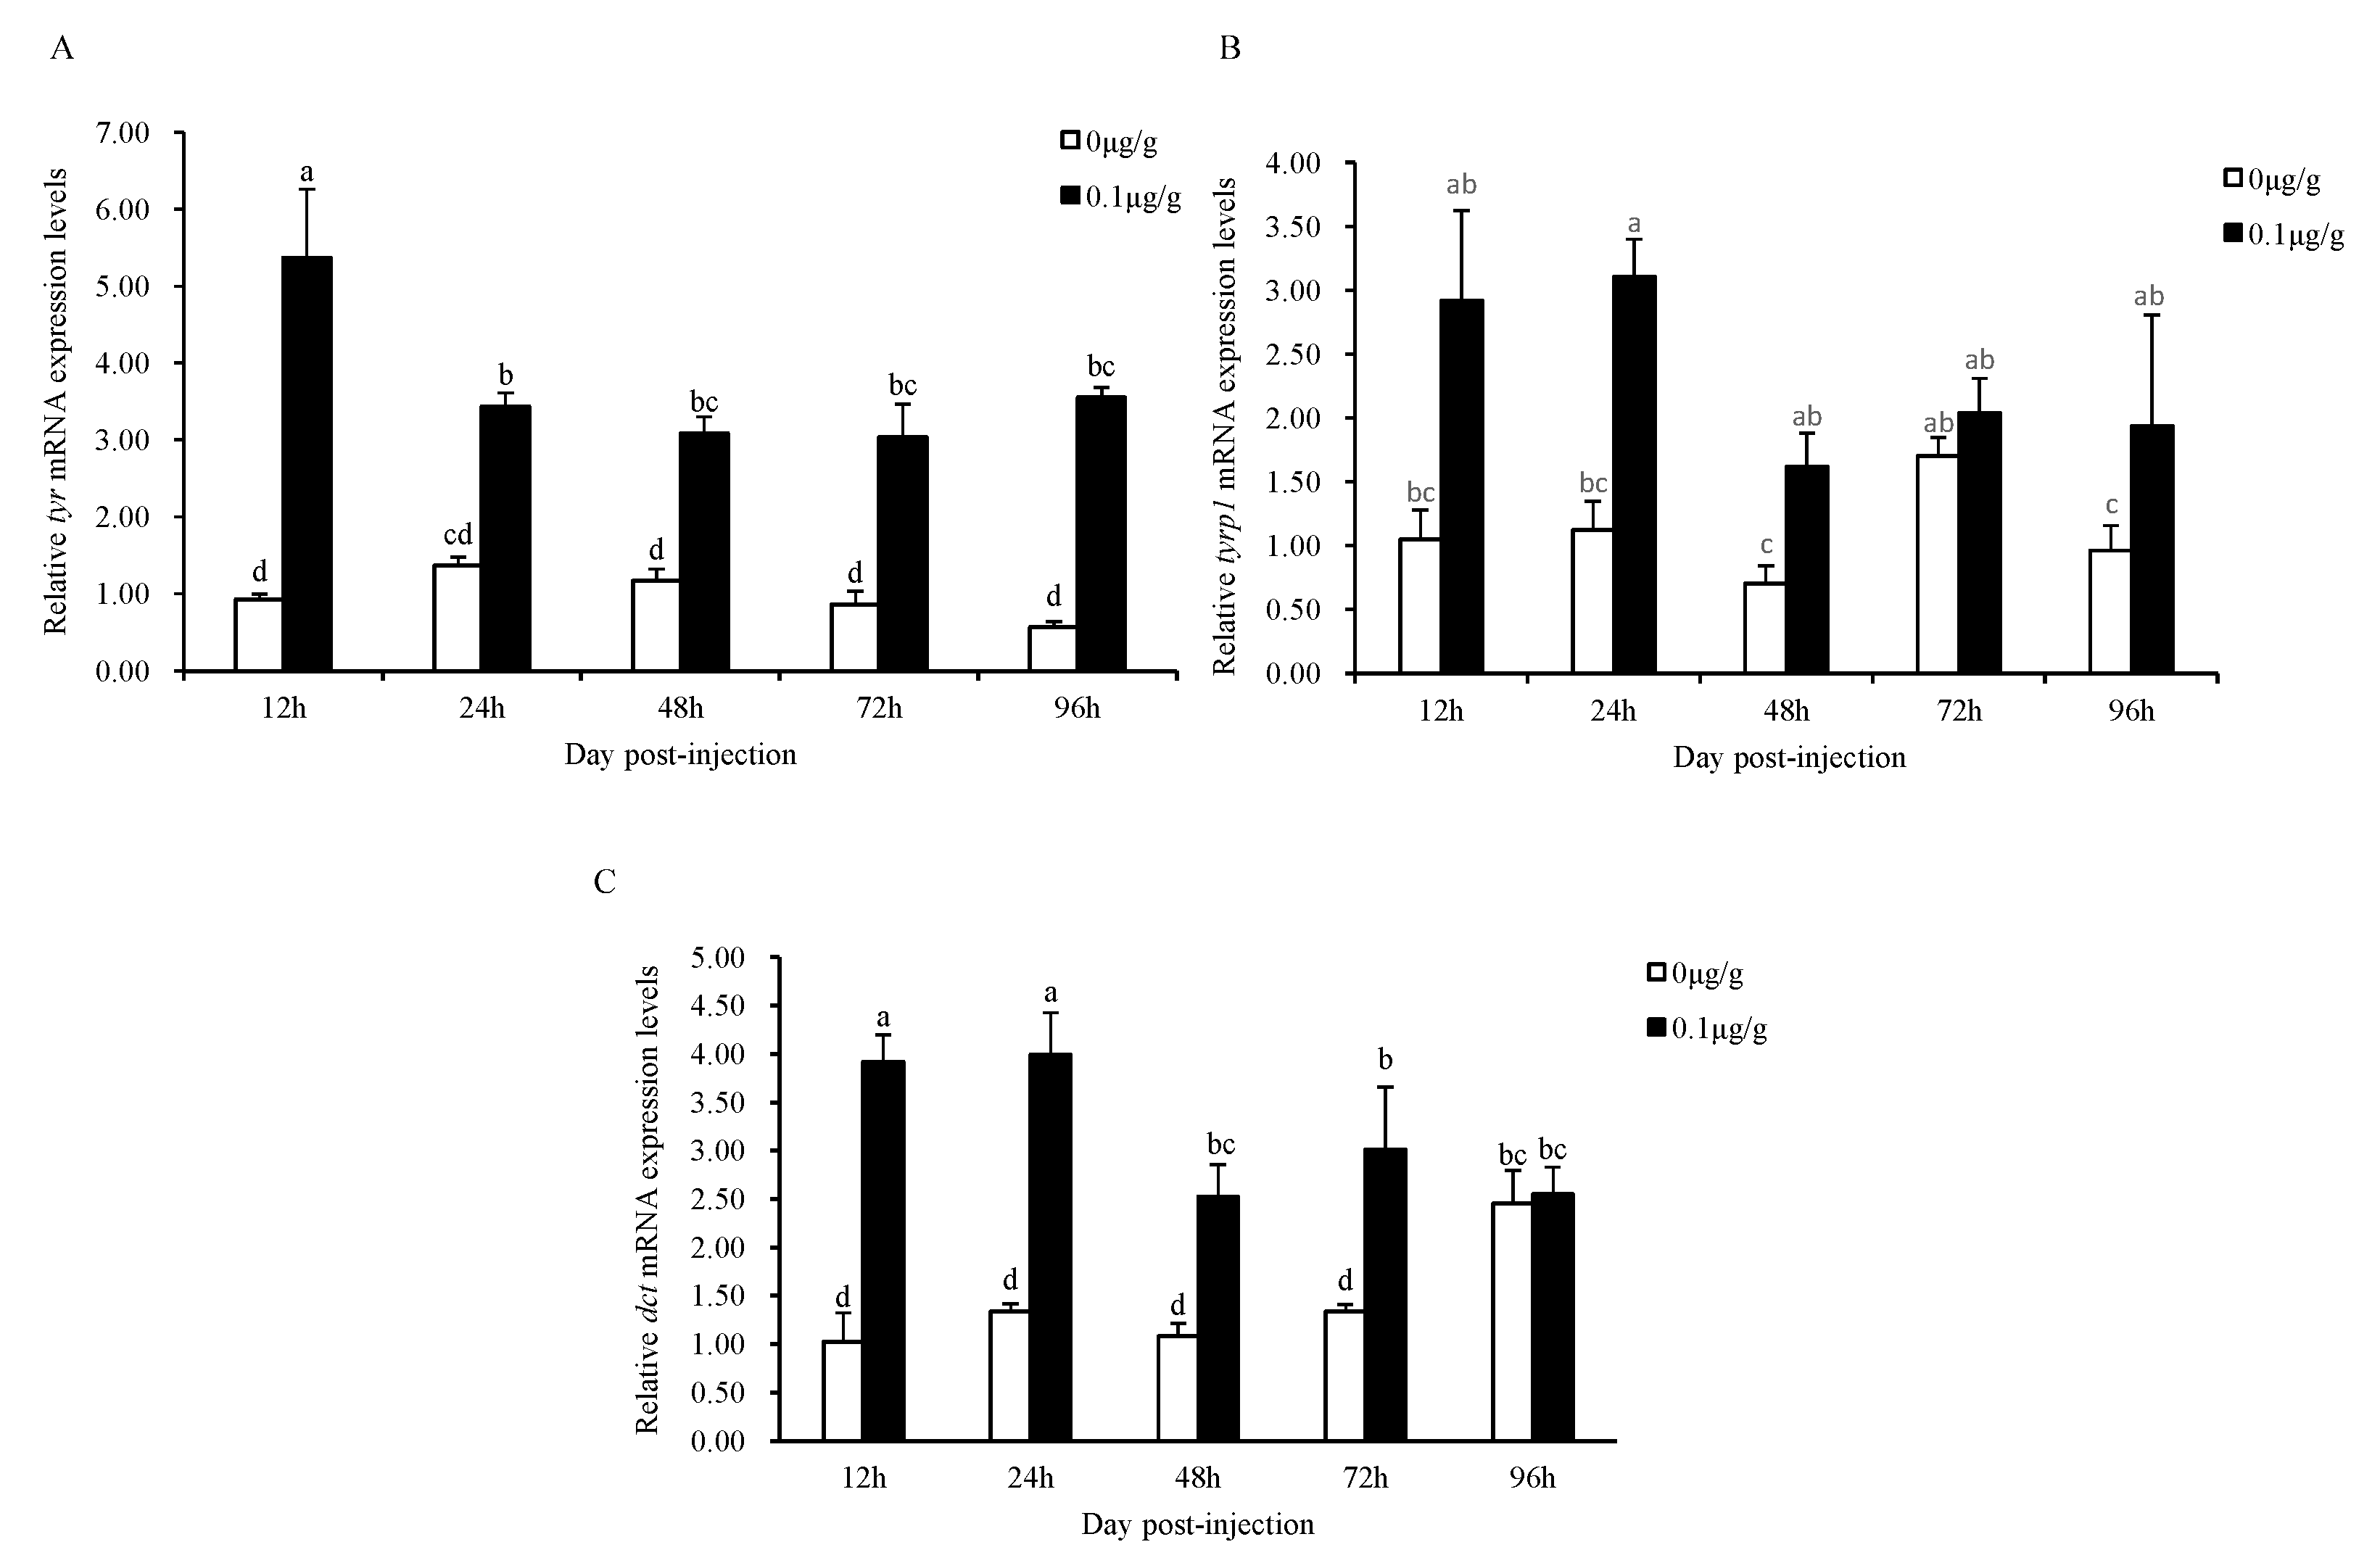
Relative expressions of the tyr, tyrp1, and dct mRNA were analyzed by qRT-PCR after intraperitoneal injection of the Mitfa recombinant protein (Figure 7). The expression of tyr was significantly up-regulated in the dorsal skin after injection of the Mitfa recombinant protein (p < 0.05; Figure 7A). At 12 h after injection, the relative tyrp1 mRNA expression in the dorsal skin was substantially enhanced relative to the control group, although the statistical difference was not significant compared to the other four time points post injection (p > 0.05; Figure 7B). Thus, the administration of the Mitfa recombinant protein could significantly increase the expression of the dct gene except at 96 h (p < 0.05; Figure 7C).
The tyrosinase activity and the melanin level were also measured after the Mitfa recombinant protein intraperitoneal injection (Figure 8). At five time points, the recombinant protein injection group had considerably higher tyrosinase activity in the dorsal skin compared to that of the control group (p < 0.05; Figure 8A). Moreover, except for 12 h, a significant increase in melanin content was observed in the recombinant protein injection group compared to the control group (p < 0.05; Figure 8B).

4. Discussion

In this study, a pET 28a (+)-Mitfa recombinant protein was constructed and expressed in E. coli Rosetta (DE3). However, the intensity of the target band of the Mitfa recombinant protein in the electrophoresis detection was larger than the theoretically evaluated value. Similar results were reported in the other fish [24,25]. Proteins with large molecular weight and/or basic amino acids in the His-tag might have slowed their mobility down in SDS-PAGE [24,26]. In our study, the mass spectrometry and Western blot results confirmed the correct expression of the Mitfa fusion protein.
His pull-down combined with LC-MS is an effective method for screening in vitro protein interactions. A total of ten proteins interacting with Mitfa were identified in this study, of which the krt, tpm, dct, tyr, and myh genes are associated with pigment synthesis. Overexpression of the krt gene induced skin melanocyte proliferation and promoted the expression of the melanin synthesis gene, thus increasing the melanin content [27,28]. The krt gene is expressed in higher levels in darker skin than in white skin [29]. The myh and the tpm genes are probably associated with the kinesin and melanin movement and may influence the change in skin color by affecting melanin synthesis and movement [30]. The dct and tyr genes regulate the type and amount of melanin and promote the development and maturation of melanocytes [31]. In some other vertebrates, the mutation in both dct and tyr genes caused a reduction in the size of the black spot and the degeneration of melanocyte dendritic structure, leading to a white or gray color [32,33,34,35,36]. In this study, these proteins revealed that the proteins interacting with Mitfa play an essential role in melanocytes’ proliferation and migration.
The GO function of the proteins interacting with Mitfa suggested that these interacting proteins are involved in melanin synthesis and melanocyte proliferation and differentiation. KEGG pathways analysis revealed that many interacting proteins were significantly enriched in six pathways. Among them, three interacting proteins are engaged in melanogenesis, and two participate in tyrosine metabolism. Several studies report that the melanogenesis and tyrosine metabolism signaling pathways participate in the pigmentation mechanism in teleost fishes and mammals [18,37]. Meanwhile, we found that some interacting proteins are enriched abundantly in the cardiac muscle contraction and adrenergic signaling in cardiomyocyte pathways. Both cardiac muscle contraction and adrenergic signaling in cardiomyocyte pathways are involved in melanophore development, which consequently influences color pigmentation [30,38]. Thus, Mitfa and its interacting proteins might regulate melanogenesis.
In vivo administration of recombinant protein resulted in a transient decrease in the mRNA level of growth-related genes or an increase in the standard length of the fish [39,40]. In our study, Mitfa recombinant protein injection increased the expression of both mitfa mRNA and protein until 12 h and it gradually decreased after 12 h, probably due to the degradation of recombinant protein by intracellular lysosomes. Numerous melanophore-specific genes in fish, including tyr, tyrp1, and dct, participate directly in melanin biosynthesis and have been discovered to be mediated by the mitf gene [41]. Furthermore, based on the results of our study, Dct and Tyr proteins interacted with Mitfa proteins. In our previous study, the relative expressions of mitfa, tyr, tyrp1, and dct mRNA were reduced after mitfa gene interference [14]. In the dorsal skin of the red tilapia, the relative expressions of the tyr, tyrp1, and dct genes were enhanced after receiving the Mitfa recombinant protein. Hence, the Mitfa recombinant protein obtained through the prokaryotic expression system had significant biological activity and could induce the expression of melanin-related genes in red tilapia. Therefore, it is reasonable to think that Mitfa regulates melanin synthesis in red tilapia through direct or indirect interactions with other proteins.

5. Conclusions

A vector pET 28a (+)-Mitfa for prokaryotic expression was effectively constructed and successfully expressed in E. coli Rosetta (DE3). The Mitfa recombinant protein was majorly present in the precipitate, with only a small portion in the supernatant. LC-MS revealed that ten proteins interacted with the Mitfa protein, and GO annotation revealed that these interacting proteins mainly function at the melanosome membrane, pigment granule membrane, and other sites. KEGG enrichment analysis indicated that these interaction proteins are mainly involved in the melanogenesis signaling pathway and the tyrosine metabolism signaling pathway. The tyrosinase activity and melanin concentration increased in the red tilapia after the Mitfa recombinant protein was injected, which also enhanced the expression of the mitfa, tyr, tyrp1, and dct genes. This finding will contribute to the study of the regulatory mechanism of the mitfa gene on the body color of fish.

Supplementary Materials

The following supporting information can be downloaded at: https://www.mdpi.com/article/10.3390/fishes8050241/s1, Figure S1: Relative expression of mitfa genes in the dorsal skin of the red tilapia after different doses of the Mitfa recombinant protein injection.

Author Contributions

Conceptualization, Z.D. and B.J.; methodology, B.J.; software, B.J.; validation, B.J., Z.D. and L.W.; formal analysis, B.J. and M.L.; investigation, B.J. and W.Z.; resources, L.W.; data curation, L.W. and Z.D.; writing—original draft preparation, B.J.; writing—review and editing, L.W. and J.F.; visualization, B.J.; supervision, Z.D.; project administration, Z.D. and L.W. All authors have read and agreed to the published version of the manuscript.

Funding

This research was funded by Jiangsu Natural Science Foundation, grant number BK20221208, and the National Natural Science Foundation-Youth Fund Project, grant number 31802290.

Institutional Review Board Statement

The sampling scheme and experimental protocols were subject to the approval of the Bioethical Committee of Freshwater Fisheries Research Center (FFRC) of the Chinese Academy of Fishery Sciences (CAFS) (2013863 BCE, 9/2013). The methods of samples handling and the experimental procedures were carried out in accordance with the guidelines for the care and use of animals for scientific purposes issued by the Ministry of Science and Technology, Beijing China (No. 398, 2006).

Informed Consent Statement

Not applicable.

Data Availability Statement

The datasets generated and/or analyzed during the current study are available from the corresponding author upon request.

Acknowledgments

Thanks are given to Nanjing Agricultural University for the scholarship awarded to Bingjie Jiang and the Freshwater Fisheries Research Center of the Chinese Academy of Fishery Sciences for providing materials and facilities for the experiment. We also thank all of the teachers from the Key Laboratory of Freshwater Fisheries and Germplasm Resources Utilization, Ministry of Agriculture and Rural Affairs, for aiding in the data curation.

Conflicts of Interest

The authors declare no conflict of interest. The funders had no role in the design of the study; in the collection, analysis, or interpretation of the data; in the writing of the manuscript; or in the decision to publish the results.

References

  1. Bauer, G.L.; Praetorius, C.; Bergsteinsdottir, K.; Hallsson, J.H.; Gisladottir, B.K.; Schepsky, A.; Steingrimsson, E. The role of mitf phosphorylation sites during coat color and eye development in mice analyzed by bacterial artificial chromosome transgene rescue. Genetics 2009, 183, 581–594. [Google Scholar] [CrossRef] [PubMed]
  2. Abrahamian, C.; Grimm, C. Endolysosomal cation channels and mitf in melanocytes and melanoma. Biomolecules 2021, 11, 1021. [Google Scholar] [CrossRef] [PubMed]
  3. Levy, C.; Khaled, M.; Fisher, D.E. Mitf master regulator of melanocyte development and melanoma oncogene. Trends. Mol. Med. 2006, 12, 406–414. [Google Scholar] [CrossRef] [PubMed]
  4. Liu, D.; Zhu, W.Y. Mitf and melanocyte development, differentiation and functional regulation. J. Cell. Biol. 2002, 24, 346–351. [Google Scholar]
  5. Ma, X.Y.; Li, H.R.; Chen, Y.; Yang, J.; Chen, H.C.; Arnheiter, H.; Hou, L. The transcription factor mitf in RPE function and dysfunction. Prog. Retin. Eye Res. 2019, 73, 100766. [Google Scholar] [CrossRef]
  6. Minvielle, F.; Bed’hom, B.; Coville, J.L.; Ito, S.; Inoue-Murayama, M.; Gourichon, D. The “silver” Japanese quail and the mitf gene: Causal mutation, associated traits and homology with the “blue” chicken plumage. BMC Genet. 2010, 11, 15. [Google Scholar] [CrossRef]
  7. Wang, Y.; Li, S.M.; Jing, H.; Chen, S.Y.; Liu, P.Y. Mutations of tyr and mitf genes are associated with plumage colour phenotypes in geese. Asian Austral. J. Anim. 2014, 27, 778–783. [Google Scholar] [CrossRef]
  8. Goding, C.R.; Arnheiter, H. Mitf-the first 25 years. Gene Dev. 2019, 33, 983–1007. [Google Scholar] [CrossRef]
  9. Lister, J.A.; Robertson, C.P.; Lepage, T.; Johnson, S.L.; Raible, D.W. Nacre encodes a zebrafish microphthalmia-related protein that regulates neural-crest-derived pigment cell fate. Development 1999, 126, 3757–3767. [Google Scholar] [CrossRef]
  10. Wang, L.; Sun, F.; Wan, Z.Y.; Ye, B.Q.; Wen, Y.F.; Liu, H.M.; Yang, Z.T.; Pang, H.Y.; Meng, Z.N.; Fan, B.; et al. Genomic basis of striking fin shapes and colors in the fighting fish. Mol. Biol. Evol. 2021, 38, 3383–3396. [Google Scholar] [CrossRef]
  11. Jiang, B.J.; Wang, L.M.; Luo, M.K.; Fu, J.J.; Dong, Z.J. Molecular and functional analysis of the microphthalmia-associated transcription factor (mitf) gene duplicates in red tilapia. Comp. Biochem. Phys. A 2022, 271, 111257. [Google Scholar] [CrossRef] [PubMed]
  12. Lister, J.A.; Close, J.; Raible, D.W. Duplicate mitf genes in zebrafish: Complementary expression and conservation of melanogenic potential. Dev. Biol. 2001, 237, 333–344. [Google Scholar] [CrossRef] [PubMed]
  13. Liu, J.H.; Wen, S.; Luo, C.; Zhang, Y.Q.; Tao, M.; Wang, D.W.; Deng, S.M.; Xiao, Y.M. Involvement of the mitfa gene in the development of pigment cell in Japanese ornamental koi carp (Cyprinus carpio L.). Genet. Mol. Res. 2015, 14, 2775–2784. [Google Scholar] [CrossRef] [PubMed]
  14. Zhang, Y.Q.; Liu, J.H.; Peng, L.Y.; Ren, L.; Zhang, H.Q.; Zou, L.J.; Liu, W.B.; Xiao, Y.M. Comparative transcriptome analysis of molecular mechanism underlying gray-to-red body color formation in red crucian carp (Carassius auratus, red var.). Fish Physiol. Biochem. 2017, 43, 1387–1398. [Google Scholar] [CrossRef]
  15. Chen, X.D.; WU, G.D.; Song, H.M.; Wang, X.J.; Mou, X.D.; Liu, Y.; Liu, C.; Hu, Y.C. Structure and expression analysis of body color-related mitf gene in Amphilophus citrinellus. Prog. Fish. Sci. 2022, 43, 107–118. [Google Scholar]
  16. Jiang, B.J.; Fu, J.J.; Dong, Z.J.; Fang, M.; Zhu, W.B.; Wang, L.M. Maternal ancestry analyses of red tilapia strains based on D-loop sequences of seven tilapia populations. PeerJ 2019, 7, e7007. [Google Scholar] [CrossRef]
  17. Zhu, W.B.; Wang, L.M.; Dong, Z.J.; Chen, X.T.; Song, F.B.; Liu, N.; Yang, H.; Fu, J.J. Comparative transcriptome analysis identifies candidate genes related to skin color differentiation in red tilapia. Sci. Rep. 2016, 6, 31347. [Google Scholar] [CrossRef]
  18. Jiang, B.J.; Wang, L.M.; Luo, M.K.; Fu, J.J.; Dong, Z.J. Transcriptome analysis of skin color variation during and after overwintering of Malaysian red tilapia. Fish Physiol. Biochem. 2022, 48, 669–682. [Google Scholar] [CrossRef]
  19. Wang, L.M.; Jiang, B.J.; Zhu, W.B.; Fu, J.J.; Luo, M.K.; Liu, W.; Dong, Z.J. The role of melanocortin 1 receptor on melanogenesis pathway in skin color differentiation of red tilapia. Aquacult. Rep. 2022, 22, 100946. [Google Scholar] [CrossRef]
  20. Chen, Z.; Xue, H.F.; Zhao, H.Y.; Liu, K.; Li, H.; He, J.Z.; Wei, L.J. Cloning and expression of melanin-concentrating hormone 1 gene in Florida red tilapia (Oreochromis sp.). Nanfang Shuichan Kexue 2018, 14, 73–82. [Google Scholar]
  21. Yu, G.C.; Wang, L.G.; Han, Y.Y.; He, Q.Y. Clusterprofler: An R package for comparing biological themes among gene clusters. Omics 2012, 16, 284–287. [Google Scholar] [CrossRef]
  22. Xie, C.; Mao, X.Z.; Huang, J.J.; Ding, Y.; Wu, J.M.; Dong, S.; Kong, L.; Gao, G.; Li, C.Y.; Wei, L.P. KOBAS 2.0: A web server for annotation and identification of enriched pathways and diseases. Nucleic Acids Res. 2011, 39 (Suppl. S2), 316–322. [Google Scholar] [CrossRef] [PubMed]
  23. Livak, K.J.; Schmittgen, T.D. Analysis of relative gene expression data using real-time quantitative PCR and the 2−ΔΔCT method. Methods 2001, 25, 402–408. [Google Scholar] [CrossRef] [PubMed]
  24. Chen, J.; Zhang, Y.H.; Tang, Z.G.; Mao, J.W.; Kuang, Z.L.; Qin, C.B.; Li, W.S. Production of recombinant orange-spotted grouper (Epinephelus coioides) follicle-stimulating hormone (FSH) in single-chain form and dimer form by Pichia pastoris and their biological activities. Gen. Comp. Endocr. 2012, 178, 237–249. [Google Scholar] [CrossRef] [PubMed]
  25. Zhang, Y.X.; Wang, B.; Liu, X.Z.; Xu, Y.J.; Shi, B.; Jiang, Y. Recombinant expression and bioactivity analysis of two leptin genes of Cynoglossus semilaevis. Shui Chan Xue Bao 2019, 43, 2279–2289. [Google Scholar]
  26. Tang, W.H.; Zhang, J.L.; Wang, Z.Y.; Hong, M.M. The cause of deviation made in determining the molecular weight of His-tag fusion proteins by SDS-PAGE. Sheng Li Xue Bao 2000, 26, 64–68. [Google Scholar]
  27. Cui, Y.C.; Song, Y.J.; Geng, Q.L.; Ding, Z.F.; Qin, Y.L.; Fan, R.W.; Dong, C.S.; Geng, J.J. The expression of krt2 and its effect on melanogenesis in alpaca skins. Acta Histochem. 2016, 118, 505–512. [Google Scholar] [CrossRef] [PubMed]
  28. Cui, Y.C.; Geng, J.J.; Geng, Q.L.; Ding, Z.F.; Dong, C.S. Human krt2 promotes melanogenesis in alpaca skin melanocytes in culture. Zhongguo Shengwu Huaxue Yu Fenzi Shengwu Xuebao 2017, 33, 303–310. [Google Scholar]
  29. Fan, R.; Xie, J.S.; Bai, J.M.; Wang, H.D.; Tian, X.; Bai, R.; Jia, X.Y.; Yang, L.; Song, Y.F.; Herrid, M.; et al. Skin transcriptome profiles associated with coat color in sheep. BMC Genet. 2013, 14, 389. [Google Scholar] [CrossRef]
  30. Wei, L.J.; Lv, Y.J.; Zou, H.; Wen, Y.H.; Gan, B.J.; Zhang, G.J.; Zhang, S.; Yan, X.Y.; Ye, X.C. Skin melanin synthesis of Jinbian carp and expression analysis of transport related genes. Nanfang Nongye Xuebao 2020, 51, 453–460. [Google Scholar]
  31. Chao, M.; Xu, H.; Huang, C.; Li, M.M.; Gong, X.T.; Tian, G.H.; Su, Y.; Li, Y.F.; Li, H.; Su, Y.Y. Research progress on color-related genes of fish. Hunan Wenli Xueyuan Xuebao Ziran Kexueban 2020, 32, 30–35. [Google Scholar]
  32. Si, Z.X.; Chen, H.L.; Xu, X.L.; Wang, J.; Wang, C.H. Effect of dct on pigmentation patterns in Oujiang color common carp. Zhongguo Shuichan Kexue 2020, 27, 605–612. [Google Scholar]
  33. Imes, D.L.; Geary, L.A.; Grahn, R.A.; Lyons, L.A. Albinism in the domestic cat (Felis catus) is associated with a tyrosinase (tyr) mutation. Anim. Genet. 2006, 37, 175–178. [Google Scholar] [CrossRef] [PubMed]
  34. Yokoyama, T.; Silversides, D.W.; Waymire, K.G.; Kwon, B.S.; Takeuchi, T.; Overbeek, P.A. Conserved cysteine to serine mutation in tyrosinase is responsible for the classical albino mutation in laboratory mice. Nucleic Acids Res. 1990, 18, 7293–7298. [Google Scholar] [CrossRef] [PubMed]
  35. Aigner, B.; Besenfelder, U.; Muller, M.; Brem, G. Tyrosinase gene variants in different rabbit strains. Mamm. Genome 2000, 11, 700–702. [Google Scholar] [CrossRef]
  36. Tobita-Teramoto, T.; Jang, G.Y.; Kino, K.; Salter, D.W.; Brumbaugh, J.; Akiyama, T. Autosomal albino chicken mutation (ca/ca) deletes hexanucleotide (-Δ GACTGG817) at a copper-binding site of the tyrosinase gene. Poultry Sci. 2000, 79, 46–50. [Google Scholar] [CrossRef]
  37. Bian, F.F.; Yang, X.F.; Ou, Z.J.; Luo, J.Z.; Tan, B.Z.; Yuan, M.R.; Chen, T.S.; Yang, R.B. Morphological characteristics and comparative transcriptome analysis of three different phenotypes of Pristella maxillaris. Front. Genet. 2013, 10, 698. [Google Scholar] [CrossRef]
  38. Chen, S.Y.; Chen, K.C.; Xu, J.M.; Li, F.W.; Ding, J.L.; Ma, Z.; Li, G.; Li, H. Insights into mRNA and long non-coding RNA profiling RNA sequencing in uterus of chickens with pink and blue eggshell colors. Front. Vet. Sci. 2021, 8, 736387. [Google Scholar] [CrossRef]
  39. Murashita, K.; Uji, S.; Yamamoto, T.; RøNnestad, I.; Kurokawa, T. Production of recombinant leptin and its effects on food intake in rainbow trout (Oncorhynchus mykiss). Comp. Biochem. Phys. B 2008, 150, 377–384. [Google Scholar] [CrossRef]
  40. Leedom, T.A.; Uchida, K.; Yada, T.; Iii, N.; Byatt, J.C.; Collier, R.J.; Tetsuya, H.; Gordon, G.E. Recombinant bovine growth hormone treatment of tilapia: Growth response, metabolic clearance, receptor binding and immunoglobulin production. Aquaculture 2002, 207, 359–380. [Google Scholar] [CrossRef]
  41. Wang, C.X.; Lu, B.Y.; Li, T.; Liang, G.Y.; Xu, M.M.; Liu, X.Y.; Tao, W.J.; Zhou, L.Y.; Kocher, T.D.; Wang, D.S. Nile tilapia: A model for studying teleost color patterns. J. Hered. 2021, 112, 469–484. [Google Scholar] [CrossRef] [PubMed]
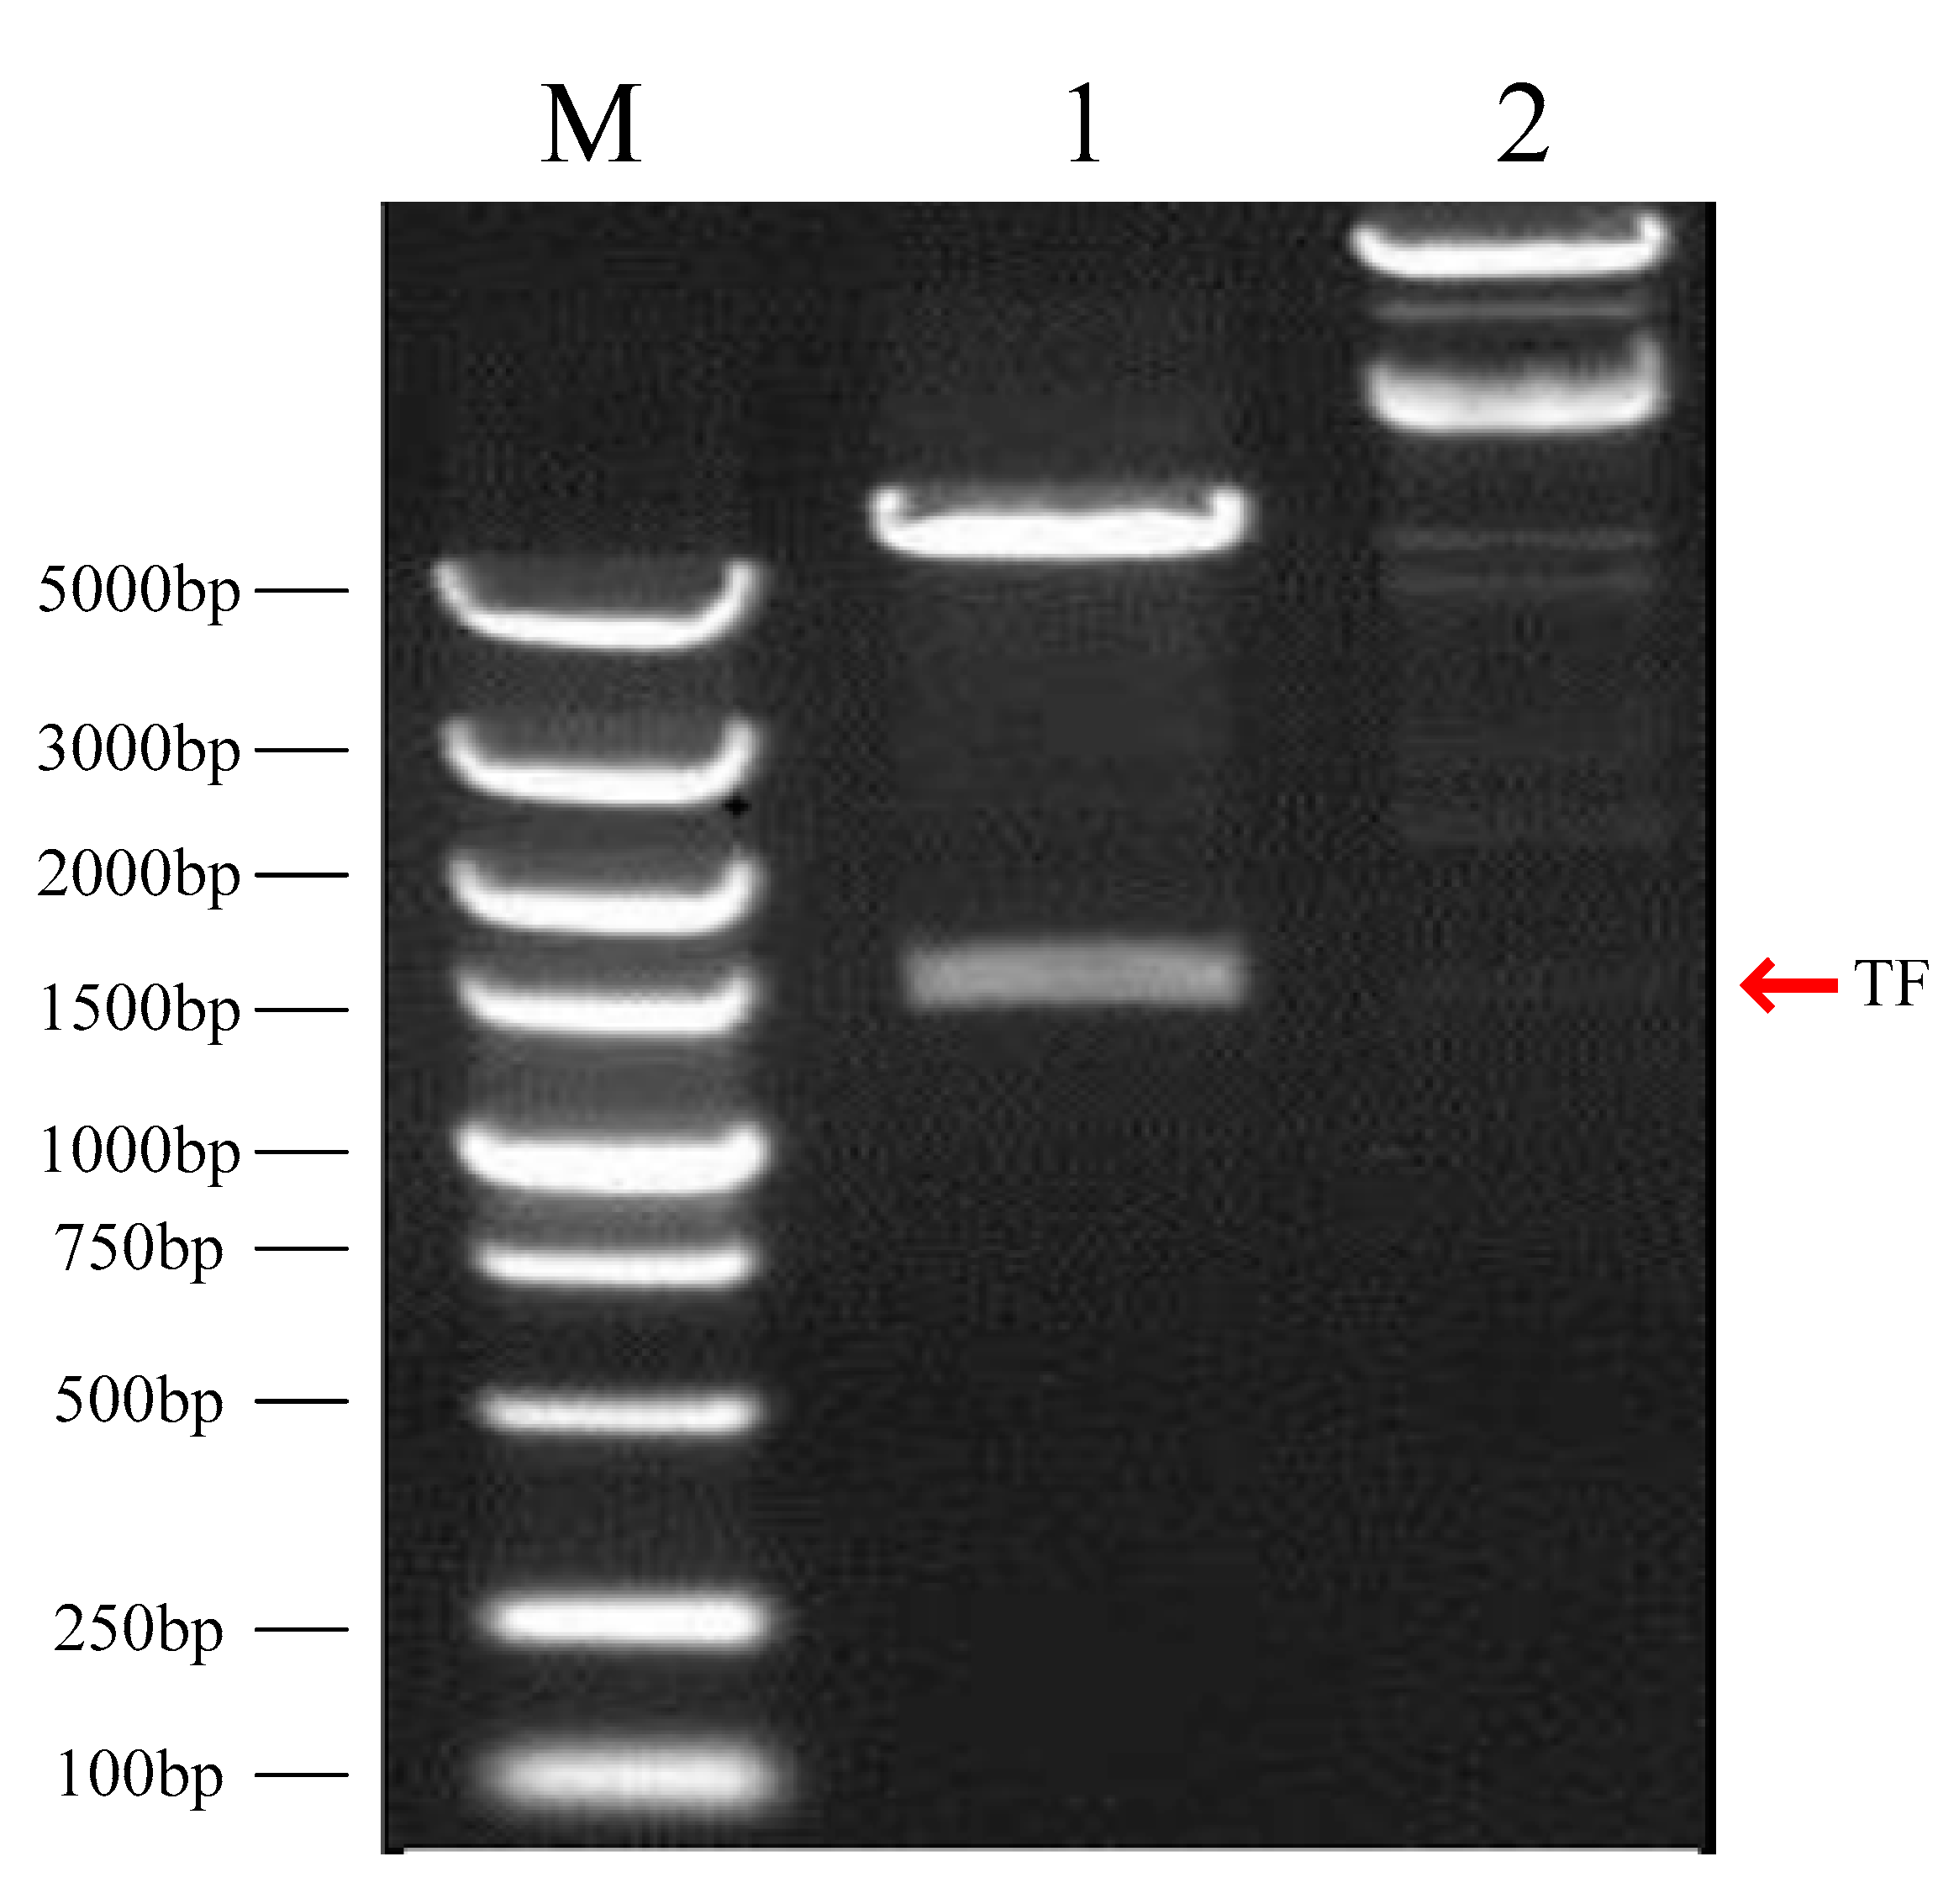
Figure 1. Construction of Mitfa fusion expression vector. M: molecular marker; lane 1: digested pET28a (+)-Mitfa; lane 2: closed circular plasmid DNA; TF: target fragment.
Fishes 08 00241 g001
Figure 2. Expression and purification of the Mitfa fusion protein. (A) SDS-PAGE electrophoresis of the supernatant and precipitate. Lane 1: the supernatant protein; lane 2: the protein in the precipitate. (B) SDS-PAGE electrophoresis of the Mitfa fusion protein. Lane 1: target fragment. (C) Identification of the Mitfa fusion protein by Western blotting. Lane 1: target fragment. M: protein molecular weight marker; TF: target fragment.
Fishes 08 00241 g002
Figure 3. His pull-down results. (A) Silver staining of the His-Mitfa fusion protein; (B) Western blotting to detect the His-Mitfa fusion protein. M: protein molecular weight marker; CG: control group (His control protein); EG: experimental group (His-Mitfa fusion protein); TP: red tilapia total protein; TF: target fragment.
Fishes 08 00241 g003
Figure 4. GO (A) and KEGG (B) analysis of the Mitfa interacting proteins.
Fishes 08 00241 g004
Figure 5. Relative expression of mitfa mRNA in the dorsal skin of red tilapia after the intraperitoneal injection of the Mitfa recombinant protein. Values with different letters mean significant differences (p < 0.05).
Fishes 08 00241 g005
Figure 6. The expression of the Mitfa protein in the dorsal skin of the red tilapia after the intraperitoneal injection of the Mitfa recombinant protein. β-actin is the reference protein. Values with different letters mean significant differences (p < 0.05).
Fishes 08 00241 g006
Figure 7. Relative expression of the tyr (A), tyrp1 (B), and dct (C) mRNA in the dorsal skin after the intraperitoneal injection of the Mitfa recombinant protein into the red tilapia. Values with different letters mean significant differences (p < 0.05).
Fishes 08 00241 g007
Figure 8. The tyrosinase activity (A) and melanin content (B) in the dorsal skin of the red tilapia after the intraperitoneal injection of the Mitfa recombinant protein. Values with different letters mean significant differences (p < 0.05).
Fishes 08 00241 g008
Table 1. Primer sequences.
PrimerSequences (5′-3′)
mitfa-his-FACCAAGTTTCTAACACATGA
mitfa-his -RGTGGCATTATAAAGAGAGAC
mitfa FAGGAAGCTGGAGCACGCA
mitfa RGGGCAGTCACCAAGGACG
tyr FTGTAATGCCACAGGGGAGGG
tyr RTCCTGTCTCGTACTCGGGGA
tyrp1 FTGCTCCACACCTTTACCGAC
tyrp1 RTAACCGAGGTTTTCAGGGGC
dct FTTCGAGTCGACACCAAACCC
dct RTCAGGGGTCAAGGAGTGGAT
β-actin FGTACCACCATGTACCCTGGC
β-actin RTGAAGTTGTTGGGCGTTTGG
Table 2. Statistical table of protein identification information.
Sample IDSpectrumNumber of Identification SpectraSpectrum Resolution RateNumber of PeptidesNumber of ProteinsUnique-2 **
His control protein46810.21110
His-Mitfa fusion protein5265911.2244108
**: the number of identified proteins containing at least 2 unique peptides.
Table 3. Information table on the interaction proteins with Mitfa.
Uniprot IDDescriptionGene NameCoverage (%)Unique PeptideScore
I3JXH8_ORENITroponin T type 3atnnt33.2911.46
I3JKR2_ORENI2-phospho-D-glycerate hydro-lyaseeno32.3912.00
A0A669E6N4_ORENIDecorindcn7.5237.31
XP_003447332.1Dopachrome tautomerasedct13.78713.93
I3KRD3_ORENIKeratin 15krt123.5924.00
A0A669B2B8_ORENIUncharacterized proteintpm45.9224.06
A0A669BWG1_ORENIIF rod domain-containing proteinkrt44.2624.34
tr|I3JC76|I3JC76_ORENITyrosinasetyr11.4512.00
A0A669BU68_ORENIUncharacterized proteinmyh13.58714.45
I3KFU7_ORENIIF rod domain-containing proteinina1.4924.00
Disclaimer/Publisher’s Note: The statements, opinions and data contained in all publications are solely those of the individual author(s) and contributor(s) and not of MDPI and/or the editor(s). MDPI and/or the editor(s) disclaim responsibility for any injury to people or property resulting from any ideas, methods, instructions or products referred to in the content.