Abstract
Examining temporal changes in the growth and generation time of fish species can be valuable for understanding population responses to different management measures and environmental conditions. Atlantic herring (Clupea harengus-Linnaeus, 1758) is an ecologically and commercially important pelagic forage fish species that occupies the southern Gulf of St. Lawrence. Here, we developed von Bertalanffy growth curves and estimated yearly values of generation time for NAFO Division 4TVn Atlantic herring for the years from 1988 to 2021. The results indicate a temporal reduction in the growth and generation time of both spring and fall spawning herring. Over the time series, the generation time of spring and fall spawners reduced by approximately 1 and 2 years, respectively. Furthermore, the average generation time of spring spawners across the time series (6.23 years (95% CI: 5.78–6.85 years)) was approximately 1 year lower than that of fall spawners (7.52 years (6.82–8.34 years)). Overall, the findings of this study can be used to better inform stock assessments and rebuilding plans for 4TVn spring and fall spawning Atlantic herring and highlight the importance of examining temporal trends in growth and generation time for more effective management of fish stocks.
Key Contribution:
The growth and generation time of Atlantic herring from the southern Gulf of St. Lawrence has been estimated to decline over time. Over 34 years, the generation time of spring and fall spawners has been reduced by approximately 1 and 2 years, respectively, while the average generation time of spring spawner (6.23 years) has been found to be approximately 1 year lower than that of fall spawners (7.52 years).
1. Introduction
Atlantic herring (Clupea harengus-Linnaeus, 1758) is an ecologically and commercially important pelagic forage fish species that occupies the southern Gulf of St. Lawrence from the north shore of the Gaspe Peninsula down to the northern tip of Cape Breton Island, Nova Scotia, Canada (Northwest Atlantic Fisheries Organization (NAFO) Division 4T; see Figure 1) [1,2]. Within the southern Gulf of St. Lawrence, Atlantic herring consist of two genetically distinct stocks, a spring spawning and fall spawning stock [3], which generally spawn from April to May and mid-August to mid-October, respectively [4]. Individuals are known to overwinter along the north and east coasts of Cape Breton Island in NAFO Division 4T and 4Vn [5]; therefore, the stocks are referred to and assessed as 4TVn spring and fall spawning Atlantic herring [1,6].
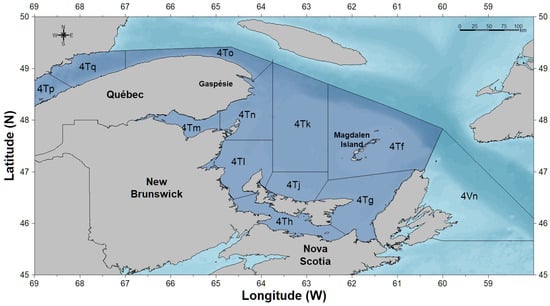
Figure 1.
Map of the southern Gulf of St. Lawrence showing NAFO Divisions 4T and 4Vn.
The population dynamics and life history of exploited stocks are important to evaluate to better understand how stocks respond to variations in abiotic and biotic factors (e.g., environmental conditions, fishing pressure) and to conceptualize the current state of a stock with respect to previous states [7]. One key aspect of population dynamics is growth, as it has implications for survival, length-at-age, reproduction, generation time, and various other population processes [8]. The von Bertalanffy growth curve [9] is commonly used to describe the growth of fish and is a staple in fisheries science. Examining changes in growth through time can be valuable for identifying responses to different management measures and environmental conditions. Furthermore, parameters from growth curves can be used to compute other ecologically important population parameters such as generation time.
Generation time is the average age of parents when their offspring are born, and is a valuable measure to estimate when examining the life history and population dynamics of a species [10]. For iteroparous fish species, generation time is typically greater than the age-at-maturity, but smaller than a species maximum observed age. Generation time allows researchers and managers to understand the turnover of individuals in a population and can help identify reproductive changes in response to various stressors. Recent evidence suggests the length- and age-at-maturity of Atlantic herring in the Gulf of St. Lawrence has undergone combined environmental- and fishing-induced changes through time [11]. Therefore, it is expected that generation time has also been impacted. Generation time is a valuable measure for the development of rebuilding plans and can be incorporated in stock assessments; yet, to the best of our knowledge, no generation time estimates exist for 4TVn Atlantic herring.
Accordingly, we aim to generate annual and overall von Bertalanffy growth curves and derive associated annual and overall estimates of generation time for both spring and fall spawning 4TVn Atlantic herring stocks to help better inform stock assessments and rebuilding plans for the stocks.
2. Materials and Methods
Atlantic herring length, age (derived from otolith reading), and spawning component assignment (i.e., spring or fall spawner) were obtained from the commercial fishery and scientific sampling activities routinely performed for the stock assessments for 4TVn spring and fall spawning Atlantic herring [1]. All details relating to sample collection, ageing, and spawning component assignment are outlined in the most recent 4TVn spring and fall spawning Atlantic herring stock assessment [1]. Length-at-age von Bertalanffy growth curves [9] were fitted to spring and fall spawning herring length and age data for Atlantic herring captured between 1988 and 2021 in the southern Gulf of St. Lawrence. Von Bertalanffy growth curves were fitted using non-linear regression [9] as follows:
where La is the length-at-age a, L∞ is the asymptotic length in mm, K is the growth coefficient, which describes the rate at which growth slows as the asymptotic length is approached, and t0 is the theoretical age that fish length would be zero. Starting values were selected and model fitting was conducted following Ogle et al. [12] using the FSA package [13] in R version 4.2.2 [14].
Von Bertalanffy growth curves were also fitted to spring and fall spawning herring length and age data in each year to allow the examinations of changes in growth and generation time across the time series. Year-specific growth curves were developed using non-linear regression with the equation:
where La,y is the length at age a for year y, L∞,y is the asymptotic length (mm) in year y, Ky is the growth coefficient in year y, and t0,y is the theoretical time that fish length would be zero for year y. The asymptotic length was plotted through time for spring and fall spawning herring to examine temporal changes in asymptotic length and determine if herring are getting larger or smaller through time.
In order to generate estimates of generation time, we first derived estimates of the length class that would theoretically have the highest biomass in an unfished population (Lopt) for each year following Beverton [15] and Froese et al. [16] using the equation:
where L∞,y is the asymptotic length in mm from the von Bertalanffy growth curve in year y, Ky is the growth coefficient from the von Bertalanffy growth curve in year y, and My is the natural mortality of the population in year y. Estimates of natural mortality for spring and fall spawning herring were extracted from the most recent stock assessment for 4TVn Atlantic herring [1]. Within the stock assessment, estimates of natural mortality are presented for young (ages 2–6) and older (ages 7–11+) herring; therefore, here we utilize biomass-weighted average natural mortality estimates of young and older herring to provide an estimate of natural mortality across age classes.
Generation time of spring and fall spawning herring was then estimated following Froese et al. [16] using the equation:
Typically, t0 obtained directly from the fitted von Bertalanffy growth curve that is estimated from length and age data is unrealistic as growth in early life history stages (i.e., larval stages) differs from growth after metamorphosis. Therefore, in order to provide more realistic estimates of generation time, we used a previously developed empirical equation 9to compute t0e,y from L∞,y and Ky, for use in the generation time estimate following Froese et al. [16]. The empirical equation for t0e,y was computed as follows:
where L∞,y is the asymptotic length in mm from the von Bertalanffy growth curve in year y, Ky is the growth coefficient from the von Bertalanffy growth curve in year y. Generation time estimates were plotted across the time series for spring and fall spawning herring to evaluate how generation time has varied temporally. Average generation time was also computed to provide a general estimate of generation time across the time series. All analysis was conducted in R version 4.2.2 [14].
3. Results
3.1. Von Bertalanffy Growth Curves
For spring spawning herring, a von Bertalanffy curve fitted across all years of data was described by the equation:
(Non-linear regression, df = 66047, RSE = 19.1, p < 0.0001.)
The growth of spring spawning herring shifted through time as indicated by the yearly von Bertalanffy growth curves (Table 1; Figure 2 and Figure 3, all p < 0.0001). The asymptotic length of spring spawning herring von Bertalanffy models (L∞) generally decreased across the time series (Figure 4) and showed substantial inter-annual variation with a maximum value of 363.22 mm (95 % CI: 360.81–365.58 mm) in 1992 and a minimum of 291.87 mm (288.47–295.81 mm) in 2015.

Table 1.
The von Bertalanffy parameter estimates of asymptotic length (L∞; mm), the growth coefficient (K), and the theoretical time fish length would be zero (t0; years) for spring spawning herring. Parameter estimates are shown for the von Bertalanffy growth curve fitted for each year and for all data combined. The lower (LCI) and upper (UCI) 95% CI for each parameter estimate are also reported.
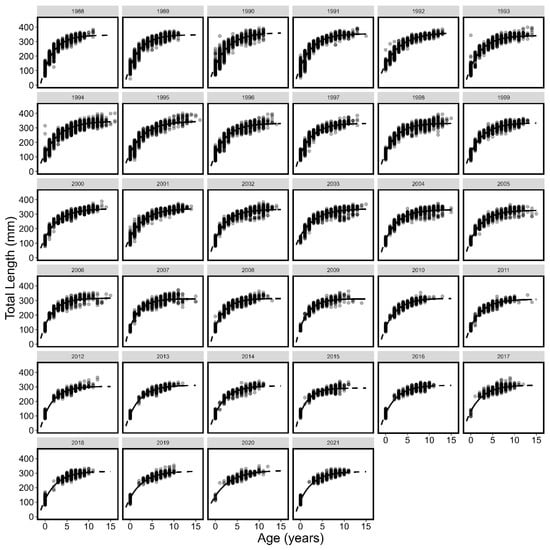
Figure 2.
Von Bertalanffy growth curves (line) and individual length (mm) and age (points) by year for spring spawning Atlantic herring. The solid portion of the lines show observed age ranges and the dotted portion of lines are extrapolated to ages not observed.
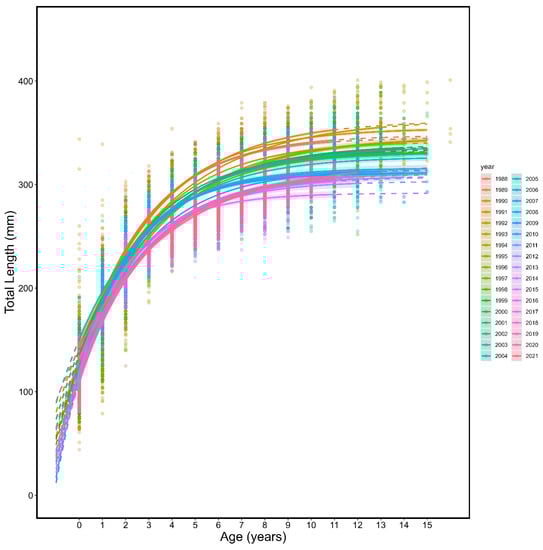
Figure 3.
Annual von Bertalanffy growth curves (line) and individual length (mm) and age (points), colour coded by year for spring spawning Atlantic herring. The solid portion of the lines show observed age ranges and the dotted portion of lines are extrapolated to ages not observed.
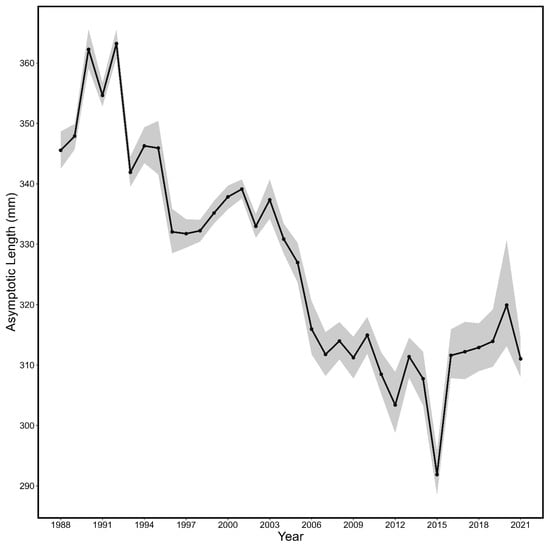
Figure 4.
The asymptotic length (L∞; line) and associated 95% CI (shaded area) by year estimated from the yearly von Bertalanffy growth curves for spring spawning Atlantic herring.
For fall spawning herring, a von Bertalanffy growth curve fitted across all years of data was described by the equation:
(Non-linear regression, df = 123894, RSE = 19.3, p < 0.0001.)
The growth of fall spawning herring shifted through time as indicated by the yearly von Bertalanffy growth curves (Table 2; Figure 5 and Figure 6, all p < 0.0001). The asymptotic length in the von Bertalanffy models (L∞) generally decreased across the time series (Figure 7) and showed considerable interannual variations with a maximum of 380.62 mm (378.57–382.57 mm) in 1994 and a minimum of 310.30 mm (307.805–313.46 mm) in 2014.
Table 2.
The von Bertalanffy parameter estimates of asymptotic length (L∞; mm), the growth coefficient (K), and the theoretical time fish length would be zero (t0; years) for fall spawning herring. Parameter estimates are shown for the von Bertalanffy growth curve fitted for each year and for all data combined. The lower (LCI) and upper (UCI) 95% CI for each parameter estimate are also reported.
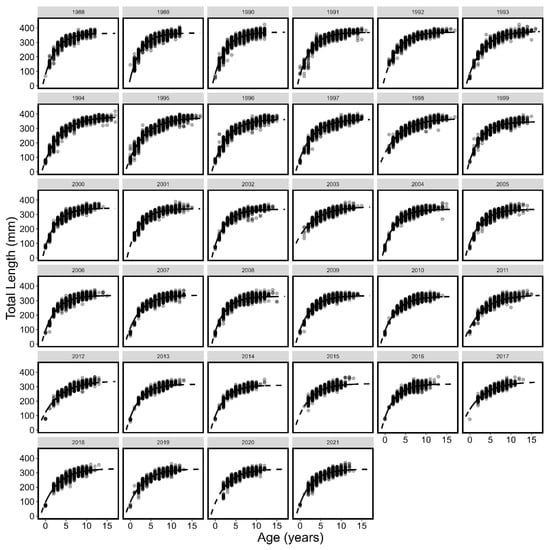
Figure 5.
Von Bertalanffy growth curves (line) and individual length and age (points) by year for fall spawning Atlantic herring. The solid portion of the lines show observed age ranges and the dotted portion of lines are extrapolated to ages not observed.
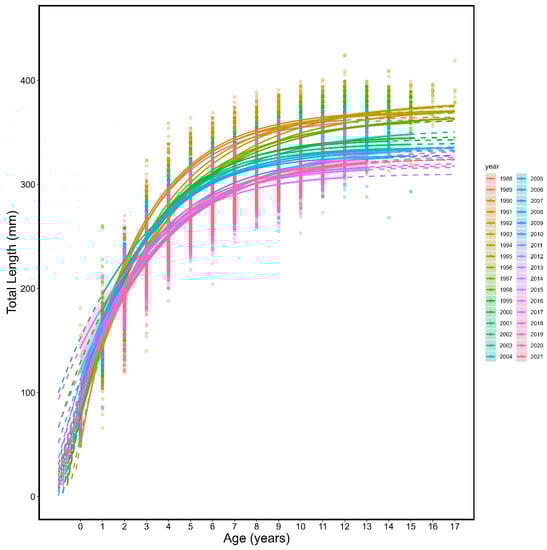
Figure 6.
Annual von Bertalanffy growth curves (line) and individual length (mm) and age (points) colour coded by year for fall spawning Atlantic herring. The solid portion of the lines show observed age ranges and the dotted portion of lines are extrapolated to ages not observed.
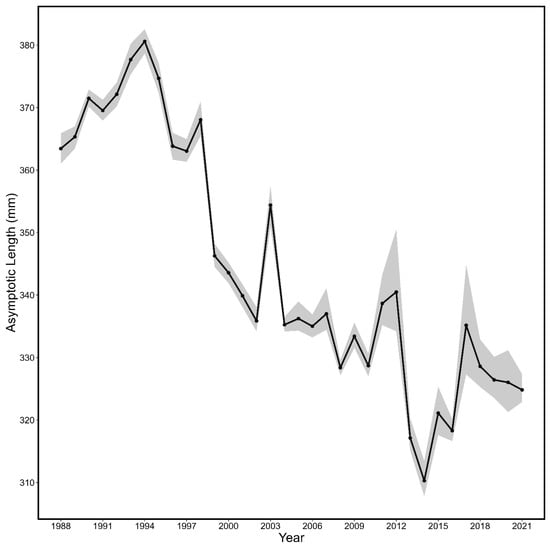
Figure 7.
The asymptotic length (L∞; line) and associated 95% CI (shaded area) by year estimated from the yearly von Bertalanffy growth curves for fall spawning Atlantic herring.
3.2. Generation Time
Overall, the average generation time for spring spawning herring from 1988 to 2021 was 6.23 years (95% CI: 5.78–6.85 years). Generation time estimates for spring spawning herring (Figure 8) reached a maximum of 6.99 years (6.31–8.01 years) in 1990 and then consistently declined to a minimum of 5.66 years (5.18–6.34 years) in 2003. Following 2003, the generation time estimates for spring spawning herring fluctuated around 6 years.
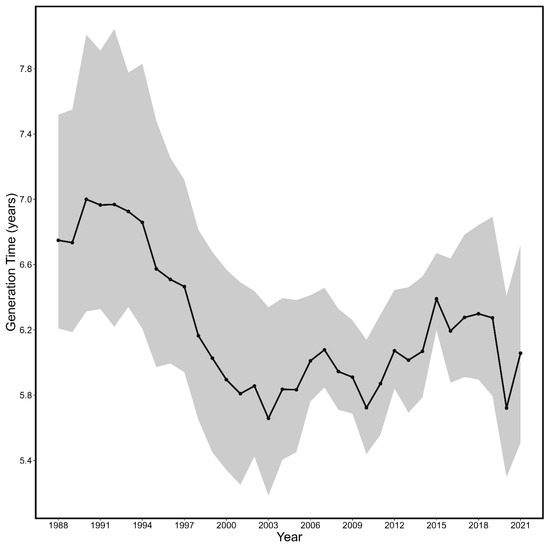
Figure 8.
The estimated generation time and associated 95% CI (shaded area) from 1988 to 2021 for spring spawning Atlantic herring.
Overall, the average generation time for fall spawning herring from 1988–2021 was 7.52 years (6.82–8.34 years). Generation time estimates for fall spawning herring (Figure 9) gradually rose from 1988 to 2003 and reached a maximum of 9.28 years (7.89–10.97 years) in 2003. Following 2003, generation time estimates of fall spawning herring experienced declines, with a major decline around 2011 (~24.5 % decline), and reached a minimum of 6.09 years (5.71–6.76 years) in 2020.
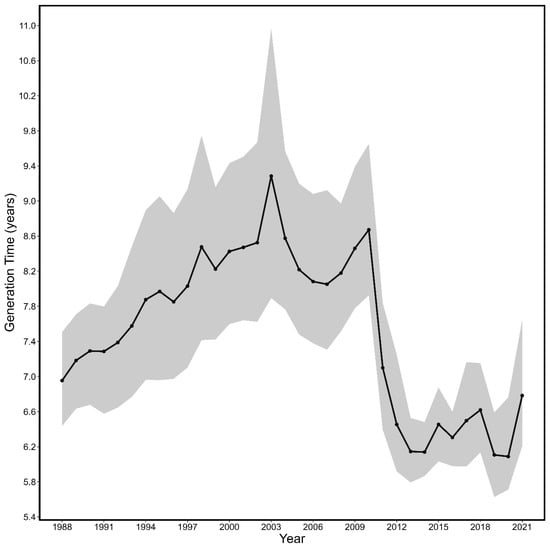
Figure 9.
The estimated generation time associated 95% CI (shaded area) from 1988 to 2021 for fall spawning Atlantic herring.
4. Discussion
We determined that both the asymptotic length and generation time of spring and fall spawning herring have generally decreased through time when examining length and age data from 1988 to 2021. Therefore, the use of growth and generation time estimates averaged across the time series would be inappropriate and misleading when conducting stock assessments and developing rebuilding plans for 4TVn Atlantic herring. Rather, incorporating temporally variable estimates of growth and generation time are essential to provide a more robust understanding of the population dynamics of the species, and to effectively evaluate changes in population dynamics in response to various stressors.
Based on our results, it appears that across the years, fall spawning herring exhibit a longer asymptotic length than spring spawning herring, implying fall spawners have the capacity to grow to a greater length than their spring spawning counterparts. Spring spawning 4TVn herring have been in the critical zone of the Fisheries and Oceans Precautionary Approach [17] since approximately 2002 [1], which coincides with the reduction in the asymptotic length of spring spawners (Figure 6). Alternatively, for fall spawners, spawning stock biomass (SSB) increased in the early 2000s despite a relatively consistent asymptotic length that was lower compared to the 1990s. However, around 2011, SSB declined rapidly [1] and coincided with drops in asymptotic length. Interestingly, the asymptotic length of Atlantic herring has undergone substantial shifts across the time series, with general reductions, suggesting both spring and fall spawning herring are not growing to as large a size as they have historically. This corroborates observations that size-at-age has generally been decreasing over the last decades across eastern Canada Atlantic herring spring and fall stocks (4VWX [18], 4R [19], 4S [20]; Newfoundland East and South coast [21,22]).
A decrease in the sizes of fishes can have wide-ranging negative implications, including reduced fecundity and reduced lifetime reproductive output [23,24], which in turn can negatively impact population productivity and population abundance. Therefore, it is important to evaluate and account for temporal changes in growth when developing management and rebuilding strategies for fishes. Furthermore, incorporating temporal changes in size can facilitate a deeper understanding of the population level implications of reduced growth [22].
Similar to the observed trends of asymptotic length, the generation times of both spring and fall spawning 4TVn herring have undergone overall declines across the time series. Furthermore, results suggest the generation time of spring spawners is on average approximately 1 year younger than fall spawners. Spring and fall spawners have experienced a reduction in generation time of greater than 1 and 2 years, respectively. Specifically, the reduction in the generation of spring spawners in the mid-1990s to early 2000s corresponded with declines in SSB, and a reduction in fall spawning generation time of approximately 25% occurred around 2010–2012, which coincided with a large reduction in SSB observed for the stock [1]. A shorter generation time has implications for population dynamics. A reduced generation time indicates that the age class contributing most to reproduction is lower; thus, smaller fish are contributing more to reproduction. As size is exponentially related to reproduction [23,25,26], a reduction in generation time in conjunction with a reduction in length-at-age would lead to lower fecundity and lower overall reproductive output, which would negatively impact recruitment and population abundance. Additionally, recently, Barret et al. [23] found fecundity-at-age and fecundity-at-size of Atlantic herring has also decreased through time, which would further exacerbate reductions in overall reproductive output. Egg size is also related to the size of parents, with smaller females typically producing smaller eggs [27]. Smaller eggs correlate with a smaller length at hatch, shorter yolk sac duration, and reduced growth rate of early-stage larvae, all of which could negatively impact larval survival and recruitment [28,29,30]. Such a finding further highlights the importance of examining temporal changes in generation time for effectively understanding past and future population trajectories.
As growth declined while the natural mortality of older herring increased over time, a decline in generation time was expected. The factors affecting fish somatic growth can arise from both environmental factors [31] and population dynamics through density dependence [32]. In Norwegian spring spawning herring, Stenevik et al. [33] found a significant negative correlation between estimated asymptotic length and fish density. Investigating 70 fish populations from the northeast Atlantic, Zimmerman et al. [34] found evidence for density dependence in both recruitment and growth. As seen in the sGSL for spring spawning herring, food availability affects recruitment [35] and could also explain some of the variation in the observed growth. The increased natural mortality in older sGSL herring is assumed to be driven by increased predation [36]. The result is a truncated age composition, where the populations are now composed of younger fish as adults were removed by natural mortality. Hence, the length classes that contribute most to population biomass are from younger fish. When combined with reduced growth, the yearly generation time estimates can only decline.
Three main uncertainties are associated with the analysis. First, it is assumed that age classes and length ranges in each age class are representative of the true population. In reality, certain age classes have a low sample size in some years (especially ages zero to 2), and consequently, the range of lengths sampled in each age class may not be inclusive of the full range. However, the estimation of Linf and K parameters of the von Bertalanffy growth curves is well informed by the high sample size of ages 3+. Furthermore, the use of t0e,y in the calculation of generation time likely reduces a potential effect of the low sample size of ages 0 to 2. A second uncertainty resides in the use of natural mortality estimates for the calculation, which are derived from a statistical catch-at-age population model that incorporates time-varying natural mortality [36]. The natural mortality estimates are model dependent, and thus, values change with each assessment cycle when the population model is run using more years of data. Therefore, similar analyses conducted in the future will need to incorporate contemporary estimates of natural mortality. Lastly, von Bertalanffy growth curves only describe the average growth trajectory, not growth trajectories of each individual fish; thus, conclusions regarding growth and generation time are averaged across the stock and are subject to uncertainty, which we have attempted to incorporate through the propagation of uncertainty and presentation of associated confidence intervals at each stage of the analysis.
5. Conclusions
Here, we identified temporal trends in the growth and generation time of Atlantic herring from the southern Gulf of St. Lawrence. Over the time series, the generation time of spring and fall spawners reduced by approximately 1 and 2 years, respectively. The average generation time of spring spawner across the time series (6.23 years) was approximately 1 year lower than that of fall spawners (7.52 years). The mechanisms by which reductions in growth and generation time occur must be investigated in future studies. Overall, the current study provides valuable temporal estimates of growth and generation time that can be incorporated into stock assessments and rebuilding plans for 4TVn Atlantic herring. Furthermore, this analysis provides a useful framework that can be applied to evaluate changes in growth and generation time of other ecologically or commercially important fish species.
Author Contributions
Conceptualization, J.B., J.L.M., F.T. and N.R.; methodology, J.B.; formal analysis, J.B. and F.T.; writing—original draft preparation, J.B.; writing—review and editing, J.B., J.L.M., F.T. and N.R.; visualization, J.B.; supervision, J.L.M. and N.R.; funding acquisition, J.B., J.L.M., F.T. and N.R. All authors have read and agreed to the published version of the manuscript.
Funding
This research was funded by Fisheries and Oceans Canada.
Institutional Review Board Statement
The data on fish used in this study were not directly collected for this study. The fish data are collected yearly for the stock assessment of the species and stored in our institutional oracle database. I am using data that exist in this oracle database that is a collection of samples collected in fishery-dependent and fishery-independent surveys from 1988 to 2021. As this was not an experimental study, and the fish data were collected for other purposes over several decades, we do not believe the ethics committee information is relevant for this paper.
Informed Consent Statement
Not applicable.
Data Availability Statement
All data are available from the corresponding author upon reasonable request.
Acknowledgments
We thank Daniel Ricard for useful conversations regarding von Bertalanffy growth curves. We also thank all the dedicated fishers and DFO employees involved in collecting herring samples across the years.
Conflicts of Interest
The authors declare no conflict of interest.
References
- Rolland, N.; Turcotte, F.; Mcdermid, J.L.; Dejong, R.A.; Landry, L. Assessment of the NAFO Division 4TVn Southern Gulf of St. Lawrence Atlantic Herring (Clupea Harengus) in 2020-2021. DFO Can. Sci. Advis. Sec. Res. Doc. 2022, 2022/068, xii + 142 p. [Google Scholar]
- Claytor, R.R. Fishery Acoustic Indices for Assessing Atlantic Herring Populations. Can. Tech. Rep. Fish. Aquat. Sci. 2001, 2359, 213 p. [Google Scholar]
- Lamichhaney, S.; Fuentes-Pardo, A.P.; Rafati, N.; Ryman, N.; McCracken, G.R.; Bourne, C.; Singh, R.; Ruzzante, D.E.; Andersson, L. Parallel Adaptive Evolution of Geographically Distant Herring Populations on Both Sides of the North Atlantic Ocean. Proc. Natl. Acad. Sci. USA 2017, 114, E3452–E3461. [Google Scholar] [CrossRef] [PubMed]
- Messieh, S.N. Some Characteristics of Atlantic Herring (Clupea harengus) Spawning in the Southern Gulf of St. Lawrence. NAFO Sci. Counc. Stud. 1987, 11, 53–61. [Google Scholar]
- Simon, J.; Stobo, W.T. The 1982-1983 4Vn Herring Biological Update. DFO CAFSAC Res. Doc. 1983, 83/49, 28 p. [Google Scholar]
- Turcotte, F.; Swain, D.P.; McDermid, J.L.; Dejong, R.A. Assessment of the NAFO Division 4TVn Southern Gulf of St. Lawrence Atlantic Herring (Clupea Harengus) in 2018-2019. DFO Can. Sci. Advis. Sec. Res. Doc. 2021, 2021/030, xiv + 158 p. [Google Scholar]
- Jennings, S.; Reynolds, J.D.; Mills, S.C. Life History Correlates of Responses to Fisheries Exploitation. Proc. R. Soc. B Biol. Sci. 1998, 265, 333–339. [Google Scholar] [CrossRef]
- Winemiller, K.O. Life History Strategies, Population Regulation, and Implications for Fisheries Management. Can. J. Fish. Aquat. Sci. 2005, 62, 872–885. [Google Scholar] [CrossRef]
- Beverton, R.J.H.; Holt, S.J. On the Dynamics of Exploited Fish Populations; Chapman and Hall: London, UK, 1957. [Google Scholar]
- Froese, R.; Palomares, M.L.; Pauly, D. Estimation of Life-History Key Facts. Available online: https://www.fishbase.se/manual/key%20facts.htm (accessed on 3 January 2023).
- Beaudry-Sylvestre, M.; Benoit, H.P.; Hutchings, J.A. Combined Effects of Exploitation and Environmental Change on Life History: A Comparative Analysis on Atlantic Herring. ICES J. Mar. Sci. 2022, 79, 2728–2740. [Google Scholar] [CrossRef]
- Ogle, D.H.; Brenden, T.O.; McCormick, J.L. Growth Estimation: Growth Models and Statistical Inference. In Age and Growth of Fishes: Principles and Techniques; Quist, M.C., Isermann, D.A., Eds.; American Fisheries Society: Bathesda, MD, USA, 2017; pp. 265–359. [Google Scholar]
- Ogle, D.H. Introductory Fisheries Analyses with R; CRC Press: Boca Raton, FL, USA, 2016. [Google Scholar]
- R Development Core Team R: A Language and Environment for Statistical Computing. R Foundation for Statistical Computing, Vienna, Austria. Available online: https://www.R-Project.Org/ (accessed on 3 January 2023).
- Beverton, R.J.H. Patterns of Reproductive Strategy Parameters in Some Marine Teleost Fishes. J. Fish Biol. 1992, 41, 137–160. [Google Scholar] [CrossRef]
- Pauly, D. Gill Size and Temperature as Governing Factors in Fish Growth: A Generalization of von Bertalanffy’s Growth Formula. Ber. Inst. f. Meereskd. Univ. Kiel 1979, 63, xv + 156 p. [Google Scholar]
- DFO A Harvest Strategy Compliant With the Precautionary Approach. Can. Sci. Advis. Secr. Sci. Advis. Rep. 2006, 2006/023.
- DFO 2018 Assessment of 4VWX Herring. DFO Can. Sci. Advis. Sec. Sci. Advis. Rep. 2018, 2018/052, 1–26.
- DFO Assessment of the West Coast of Newfoundland (NAFO Division 4R) Herring ( Clupea Harengus) Stocks in 2021. DFO Can. Sci. Advis. Sec. Sci. Advis. Rep. 2022, 2022/020, 1–18.
- DFO Assessment of the Quebec North Shore (Division 4S) Herring Stocks in 2020. DFO Can. Sci. Advis. Sec. Sci. Advis. Rep. 2021, 2021/037, 1–15.
- Bourne, C.; Squires, B.; O’Keefe, B.; Schofield, M. Assessment of Newfoundland East and South Coast Atlantic Herring (Clupea Harengus) Stock Complexes to 2018. DFO Can. Sci. Advis. Sec. Res. Doc. 2023, 2023/013, iv + 41 p. [Google Scholar]
- Wheeler, J.P.; Purchase, C.F.; Macdonald, P.D.M.; Fill, R.; Jacks, L.; Wang, H.; Ye, C. Temporal Changes in Maturation, Mean Length-at-Age, and Condition of Spring-Spawning Atlantic Herring (Clupea harengus) in Newfoundland Waters. ICES J. Mar. Sci. 2009, 66, 1800–1807. [Google Scholar] [CrossRef]
- Barrett, T.J.; Hordyk, A.R.; Barrett, M.A.; van den Heuvel, M.R. Spatial and Temporal Differences in Fecundity of Atlantic Herring (Clupea harengus) off Nova Scotia and Consequences for Biological Reference Points. Can. J. Fish. Aquat. Sci. 2022, 79, 1086–1096. [Google Scholar] [CrossRef]
- Burbank, J.; Drake, D.A.R.; Power, M. Silver Shiner, Notropis Photogenis Fecundity and Parasite Infections during the Reproductive Period. Can. J. Zool. 2022, 100, 826–833. [Google Scholar] [CrossRef]
- Messieh, S.N. Fecundity Studies on Atlantic Herring from the Southern Gulf of St. Lawrence and along the Nova Scotia Coast. Trans. Am. Fish. Soc. 1976, 105, 384–394. [Google Scholar] [CrossRef]
- Marshall, D.J.; Bode, M.; Mangel, M.; Arlinghaus, R.; Dick, E.J. Reproductive Hyperallometry and Managing the World’s Fisheries. Proc. Natl. Acad. Sci. USA 2021, 118, e2100695118. [Google Scholar] [CrossRef] [PubMed]
- Óskarsson, G.J. Pre-Spawning Factors and Recruitment Variation in Atlantic Herring (Clupeidae; Clupea harengus, L.): A Comparative Approach. Ph.D. thesis, Dalhousie University, Halifax, NS, Canada, 2005. [Google Scholar]
- Dickey-Collas, M.; Nash, R.D.M.; Brunel, T.; Van Damme, C.J.G.; Marshall, C.T.; Payne, M.R.; Corten, A.; Geffen, A.J.; Peck, M.A.; Hatfield, E.M.C.; et al. Lessons Learned from Stock Collapse and Recovery of North Sea Herring: A Review. ICES J. Mar. Sci. 2010, 67, 1875–1886. [Google Scholar] [CrossRef]
- Burbank, J.; Dejong, R.A.; Turcotte, F.; Rolland, N. Understanding Factors Influencing Atlantic Herring (Clupea harengus) Recruitment: From Egg Deposition to Juveniles. Fish. Oceanogr. 2022, 32, 147–159. [Google Scholar] [CrossRef]
- Óskarsson, G.J.; Taggart, C.T. Variation in Reproductive Potential and Influence on Icelandic Herring Recruitment. Fish. Oceanogr. 2010, 19, 412–426. [Google Scholar] [CrossRef]
- Ottersen, G.; Loeng, H. Covariability in early growth and year-class strength of Barents Sea cod, haddock, and herring: The environmental link. ICES J. Mar. Sci. 2000, 57, 339–348. [Google Scholar] [CrossRef]
- Lorenzen, K.; Enberg, K. Density-dependent growth as a key mechanism in the regulation of fish populations: Evidence from among-population comparisons. Proc. R. Soc. Lond. B 2002, 269, 49–54. [Google Scholar] [CrossRef]
- Stenevik, E.K.; Hølleland, S.; Enberg, K.; Høines, Å.; Salthaug, A.; Slotte, A.; Vatnehol, S.; Aanes, S. Predicting density-dependent somatic growth in Norwegian spring-spawning herring. ICES J. Mar. Sci. 2022, 79, 1340–1352. [Google Scholar] [CrossRef]
- Zimmermann, F.; Ricard, D.; Heino, M. Density regulation in Northeast Atlantic fish populations: Density dependence is stronger in recruitment than in somatic growth. J. Anim. Ecol. 2018, 87, 672–681. [Google Scholar] [CrossRef] [PubMed]
- Turcotte, F. Environmental effects on recruitment dynamics and population projections of NAFO Division 4TVn Spring Spawning Atlantic Herring. DFO Can. Sci. Advis. Sec. Res. Doc. 2022, 2022/047, iv + 25 p. [Google Scholar]
- Turcotte, F.; Swain, D.P.; McDermid, J.L. NAFO 4TVn Atlantic Herring Population Models: From Virtual Population Analysis to Statistical Catch-at-Age Estimating Time-Varying Natural Mortality. DFO Can. Sci. Advis. Sec. Res. Doc. 2021, 2021/029, vi + 52 p. [Google Scholar]
Disclaimer/Publisher’s Note: The statements, opinions and data contained in all publications are solely those of the individual author(s) and contributor(s) and not of MDPI and/or the editor(s). MDPI and/or the editor(s) disclaim responsibility for any injury to people or property resulting from any ideas, methods, instructions or products referred to in the content. |
© 2023 by the authors. Licensee MDPI, Basel, Switzerland. This article is an open access article distributed under the terms and conditions of the Creative Commons Attribution (CC BY) license (https://creativecommons.org/licenses/by/4.0/).