Article

Experimental Investigation of the Hydrodynamic Characteristics of Longline Aquaculture Facilities under Current and Wave Conditions

College of Fisheries, Ocean University of China, Qingdao 266003, China
*
Author to whom correspondence should be addressed.
These authors contributed equally to this work.
Fishes 2023, 8(4), 204; https://doi.org/10.3390/fishes8040204
Submission received: 11 March 2023 / Revised: 11 April 2023 / Accepted: 13 April 2023 / Published: 15 April 2023
(This article belongs to the Special Issue Fisheries and Aquaculture Engineering)

Abstract

:
In this study, a longline aquaculture facility with lantern nets off the coast of northern China was modelled to conduct hydrodynamic tests starting from the culture unit to the entire facility under various current and wave conditions. The experimental results indicated that the drag coefficients of the lantern net model with weights of 0.5, 0.75, and 1.0 kg were 0.75, 0.83, and 0.91, respectively, in the Reynolds number range of 1 × 10⁴–1 × 10⁶. The current-driven upstream mooring line was more dominant than the wave-driven tension, and a simplified model of the longline facility accurately predicted the mooring line tension under the current conditions. The scope of the mooring line (defined as the length of the mooring line related to the water depth) played an important role in eliminating an order of magnitude difference in mooring tension under the wave conditions. The amplitudes of the vertical movement of the longline facility were smaller than the wave height when L/Lm was less than 1.5. Therefore, detailed information is needed to better understand the hydrodynamic characteristics and motion response of longline aquaculture facilities for the safe operation of longline structures in offshore environments, in order to process high-quality oyster products.
Key Contribution: In this paper, a simplified model of a longline facility with two major components of the lantern net and buoy accurately predicted the mooring line tension in currents based on the measurement of the drag coefficients of the lantern net model. The mooring line played an important role in eliminating the order-of-magnitude difference in mooring tension related to waves.

1. Introduction

Aquatic products play an important role in improving the human dietary structure and ensuring food security [1,2]. The culture of marine bivalve shellfish (e.g., oysters, mussels, and scallops) farmed at an economically viable scale has been proposed to provide high-quality protein for a growing population [3,4]. Aquaculture areas for farming shellfish in the sea cover 60.4% of the total national aquaculture areas, in which oysters account for ~40% of the annual shellfish production in China [5]. In the coastal areas of northern China, the main species for seawater shellfish farming is the Pacific oyster (Crassotrea gigas), and the development of farming facilities from the initial coastal raft aquaculture to the current off-the-coast longline aquaculture is conducive to an increase in oyster production. Moreover, longline aquaculture is superior in terms of expansion to open ocean environments [3,6,7]. However, the mechanics of submerged aquaculture facilities in relation to the marine environment have not been fully investigated and understood, and the design of longline facilities (e.g., configurations) depends on the experience of the operators with years of farming work [8]. Consequently, longline culture facilities are vulnerable to storms, which may cause anchor failure, rope breakage, line entanglement, drift-ice entrainment, buoy implosion, culture unit fall-off, and benthic predation [9,10,11,12,13].
A typical longline aquaculture facility (also known as a longline culture system) of an oyster farm comprises multiple rows or columns of lantern nets [14] hanging from a main horizontal line; buoys connected to the main line provide buoyancy; the facility is secured to a location by anchors embedded in the seabed; and station keeping is ensured via mooring lines [14,15]. With regard to structural survival, the hydrodynamics of longline aquaculture facilities are considered to be important. Two hydrodynamic drivers, currents and waves, effectively transfer energy from the flow to the farm structure. In reality, the submerged facility is flexible and moves rapidly in response to currents and waves, as determined based on the relative velocity between the longline structure and fluid [9].
Techniques for measuring the local oceanography and structural response longline facilities have been adopted with new approaches over the past two decades. Plew et al. [16] and Stevens et al. [17] reported that the tidally driven current affected the pretension of the mooring lines and dominated the hydrodynamic load; the wave energy attenuation across the farm was frequency dependent; and the maximum load of the mooring line potentially increased by 100% in waves and currents. Meanwhile, the floats at each end of the main line more closely followed the wave orbital motion than the floats in the middle. The mussel-laden loops of rope droppers differently responded to floats, implying flexibility along the vertical dimension. Gagnon and Bergeron [11] stated that the mooring tension of a mussel longline by currents and waves is limited based on the combined effects of pretension, current shielding between mussel droppers, flow blockage owing to surrounding longlines, and dropper resistance. Significant longline displacement occurred during short periods when the predicted drag force transmitted to the legs exceeded the predicted holding capacity. Nguyen et al. [8] showed that the measured mooring tension of an oyster longline was strongly correlated with tide-induced water under severe environmental conditions, i.e., high tides, storm surges, and 100-year extreme wave heights. However, these are general conclusions on the aforementioned facilities because it is impossible to sufficiently sample at the predetermined farming site to determine the aspects of the specific longline facility [9,18]. Despite numerous efforts, a guidebook for designing a longline aquaculture facility can seldom be provided without hydrodynamic testing, which is beneficial for generalizing the loading and motion of various longline facilities [19,20].
It is much easier to control these parameters in laboratory experiments and numerical simulations. In previous simulations of longline aquaculture facilities, the kinematic and dynamic responses of longline facilities are often predicted using the hydrodynamic models of culture units coupled with the Morison equation [3,9,18,21,22]. The drag and inertia coefficients of the culture unit should be investigated through physical testing to establish a hydrodynamic model, eventually guaranteeing the good precision of the longline facility. However, a few experimental studies on the hydrodynamic performance of longline culture units and facilities exist. The drag coefficient of live blue mussels was determined to be 1.6 for Reynolds numbers between 2.3 × 10⁴ and 1.4 × 10⁵ [4]; however, the hydrodynamics of the lantern net have not yet been investigated. Zhao et al. [15] altered the incident wave angles, lantern net layout depth, and lantern net layout forms to measure the hydrodynamic responses of a longline culture with lantern nets, illustrating that the tension of the upstream mooring line was greater than that of the downstream line, and the vertical motion of the structure was greater than that of the horizontal motion in the wave case. Feng et al. [23] conducted a model experiment of a scaled longline aquaculture facility with different dropper weights, upper buoy patterns, and incident wave angles. The results indicated that the dropper weight and incident wave angle significantly influenced the motion and loading of the raft-like system. The maximum displacement of the main line was negatively correlated with the dropper weight. Cheng et al. [24] conducted a study on the effect of relative structural length on the maximum mooring line tension under the action of regular and irregular waves. The result showed that the maximum mooring line tension appeared when the ratio of structure length to wavelength was 1.15 ∼ 1.35. Compared with the aforementioned study that focused on part of the longline facility, hydrodynamic tests from the culture unit to the whole facility in various types of currents and waves are required and can be more conducive to understanding the hydrodynamic mechanism of longline aquaculture facilities.
Thus, this paper conducted experimental tests to study the hydrodynamic characteristics and motion response of a single-row longline aquaculture facility with lantern nets. The drag measurements were conducted to investigate the drag coefficient of the lantern net under different weights and Reynolds numbers. The wave tank tests of the longline aquaculture system under different wave conditions present the maximum mooring line tension and motion responses of the lantern nets and buoys in the different positions of the facility. The objectives of this study were to determine the drag coefficient of the lantern net and the impacts of the wave steepness (H/L, H: wave height, L: wavelength), L / L m (the ratio of the wavelength L to the main line length L m ), and h / g T 2 (h: water depth, g: acceleration of gravity, T: wave period) on the mooring line tension and motion amplitude of the lantern nets and buoys.

2. Materials and Methods

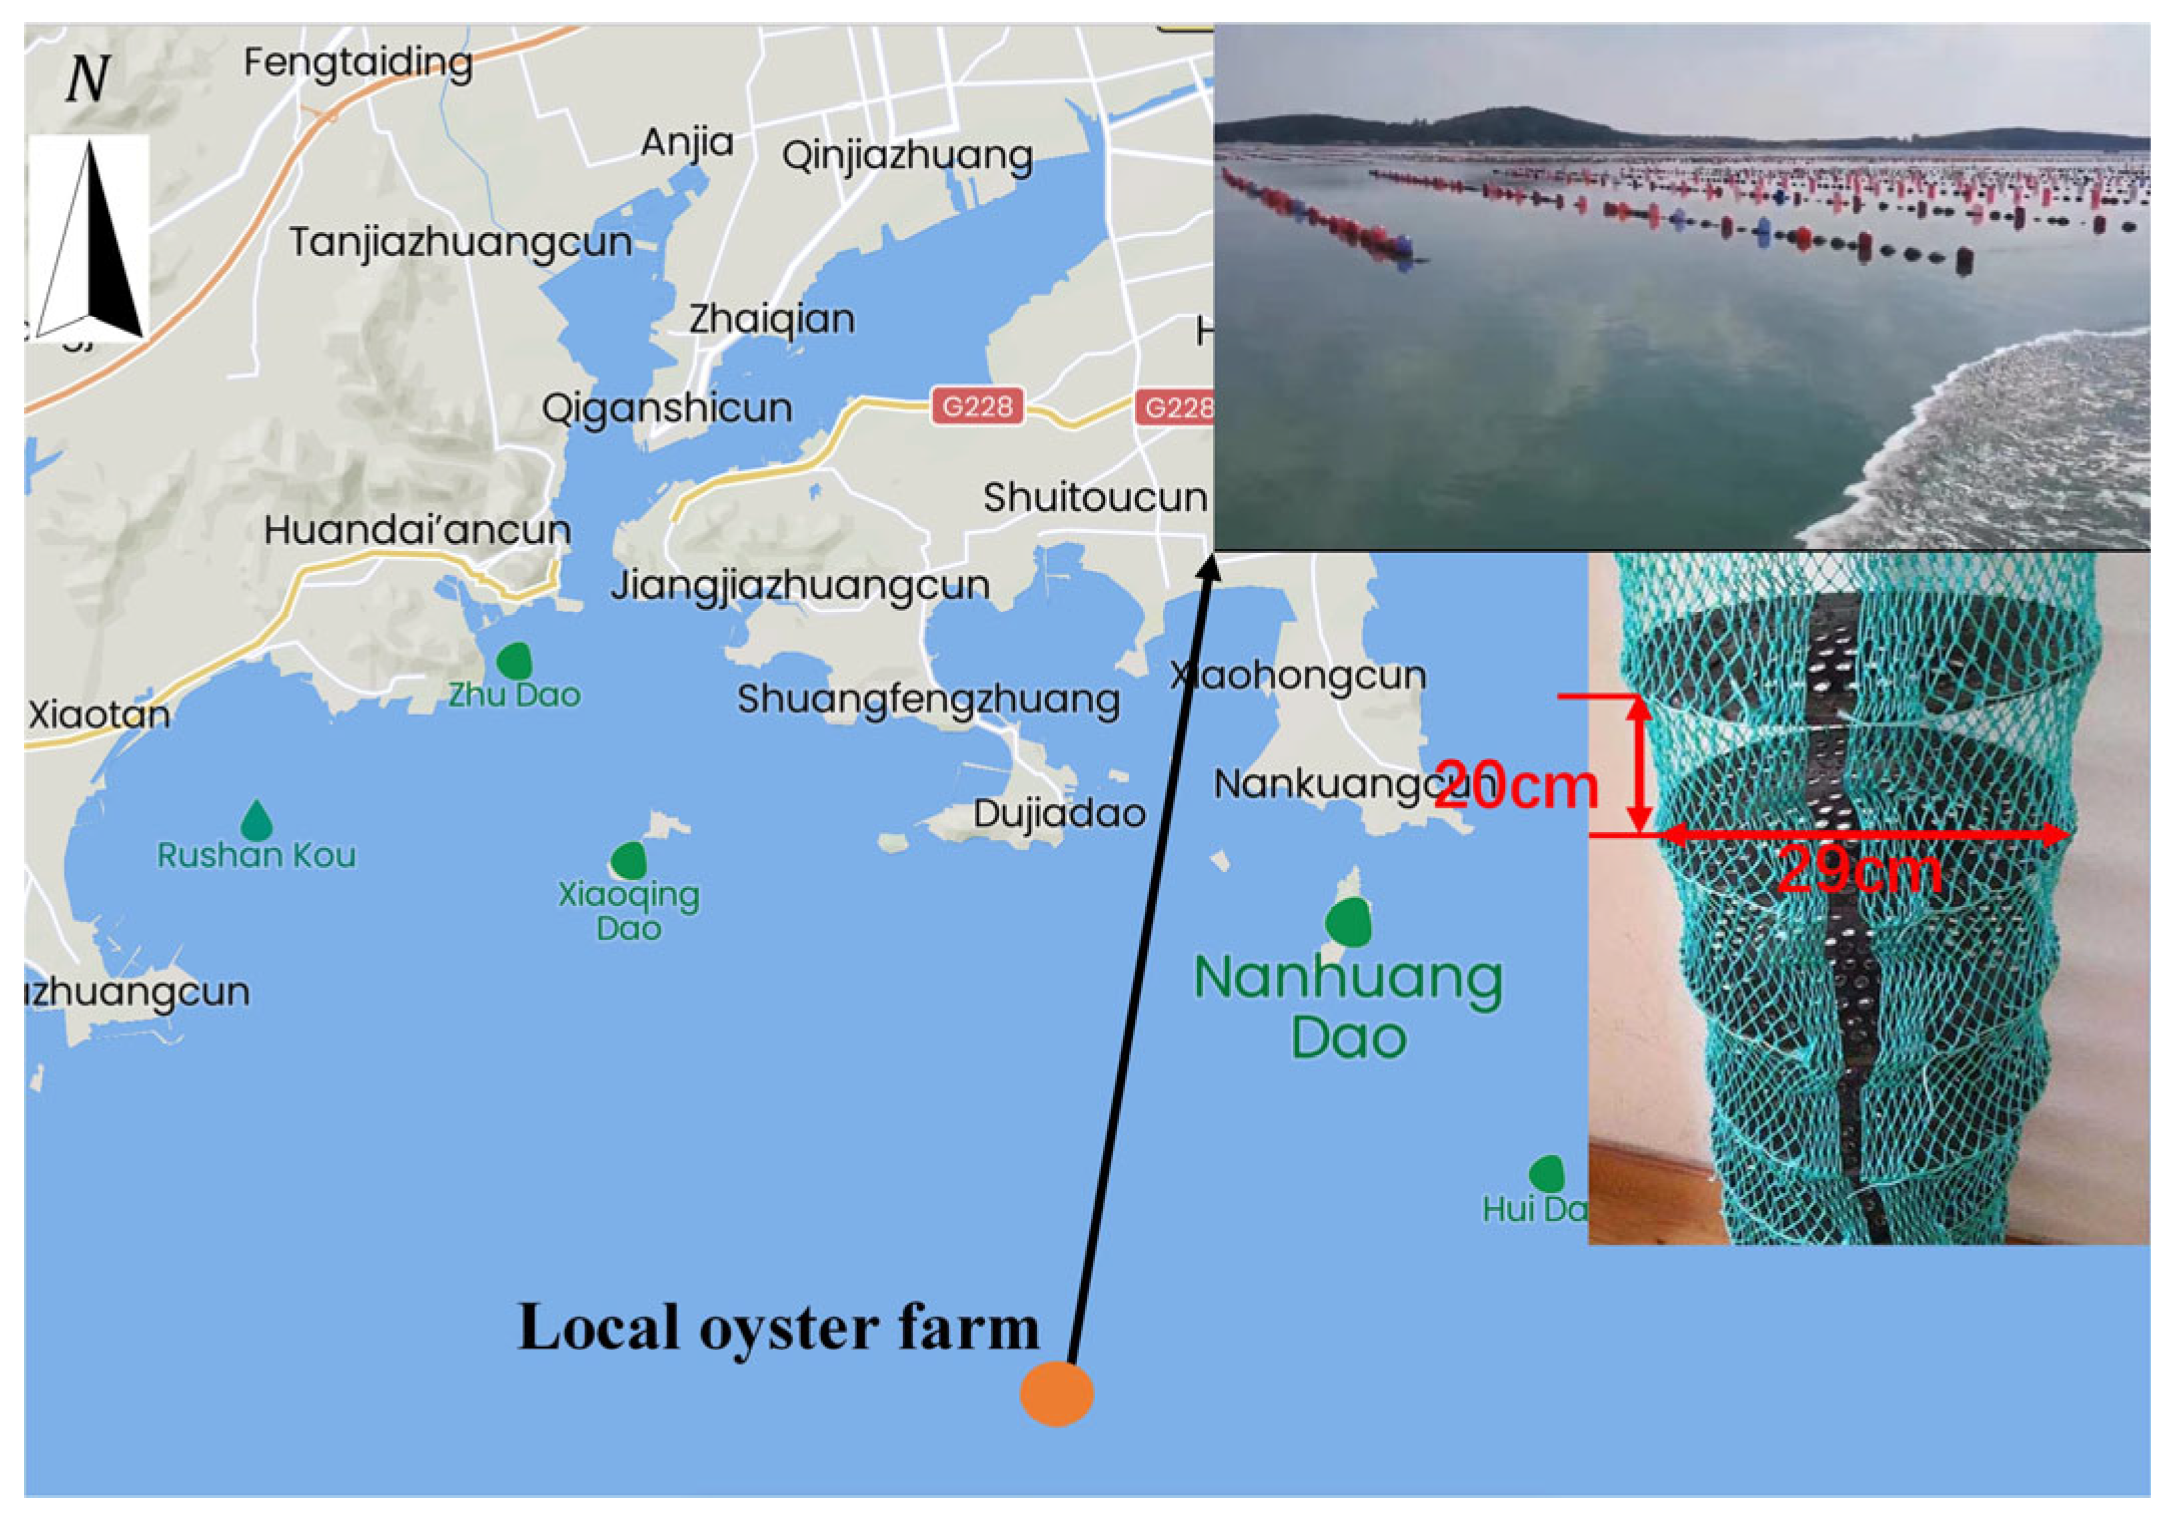
2.1. Prototype Configurations of a Longline Aquaculture Facility with Lantern Nets

A longline aquaculture facility with lantern nets, located on a commercial farm off Nanhuang Island, Rushan City, Shandong Province, China, was selected as the prototype in the present study (Figure 1). The oyster farm is at a distance of 6.4 km from the nearest coast on a 12–15 m deep sandy bottom. It is exposed to waves with a significant height of 0.5–1.5 m for an average period of 2.0–5.5 s, and even to storm surges with a wave height of 6–7 m and a current of ca. 3 knots. Tidal currents in the absence of the farm are in the range of 1.5–2 knots during spring/autumn tides and are multidirectional with their main axis directed toward SW-NE [25,26,27].
The single-row longline aquaculture facility in the first column from the southwestern corner of the farm was selected; it was fully experienced in environmental currents and waves without the flow blockage between the longlines [9,11,16]. The longline facility was anchored at both ends by embedded anchors, which were 168 m apart. The lengths of the main line and each mooring line were 100 and 36 m (polyethylene ropes with a diameter of 26 mm), respectively. The main line supports 80 vertically hanging lantern nets with an average length of 1.6 m and eight porous disks (material: rubber) with a diameter of 29 cm. The lantern net is covered with polyethylene nettings with a mesh size of 4 cm attached to the main line at an interval of 2.1 m with a tether line (also known as a whip line) of 1.2 m. Prior to scaling, the air weight of the oysters in each lantern net reached 30–35 kg for sale. There were 120 buoys (total buoyancy of 1908 kgf) with a floating line of 1.8 m tied to the main line at equal spacings, and one compensating buoy (15.9 kgf buoyancy) was attached to both ends of the main line (Table 1). The weight of biofouling on ropes, floats, and lantern nets was not considered.

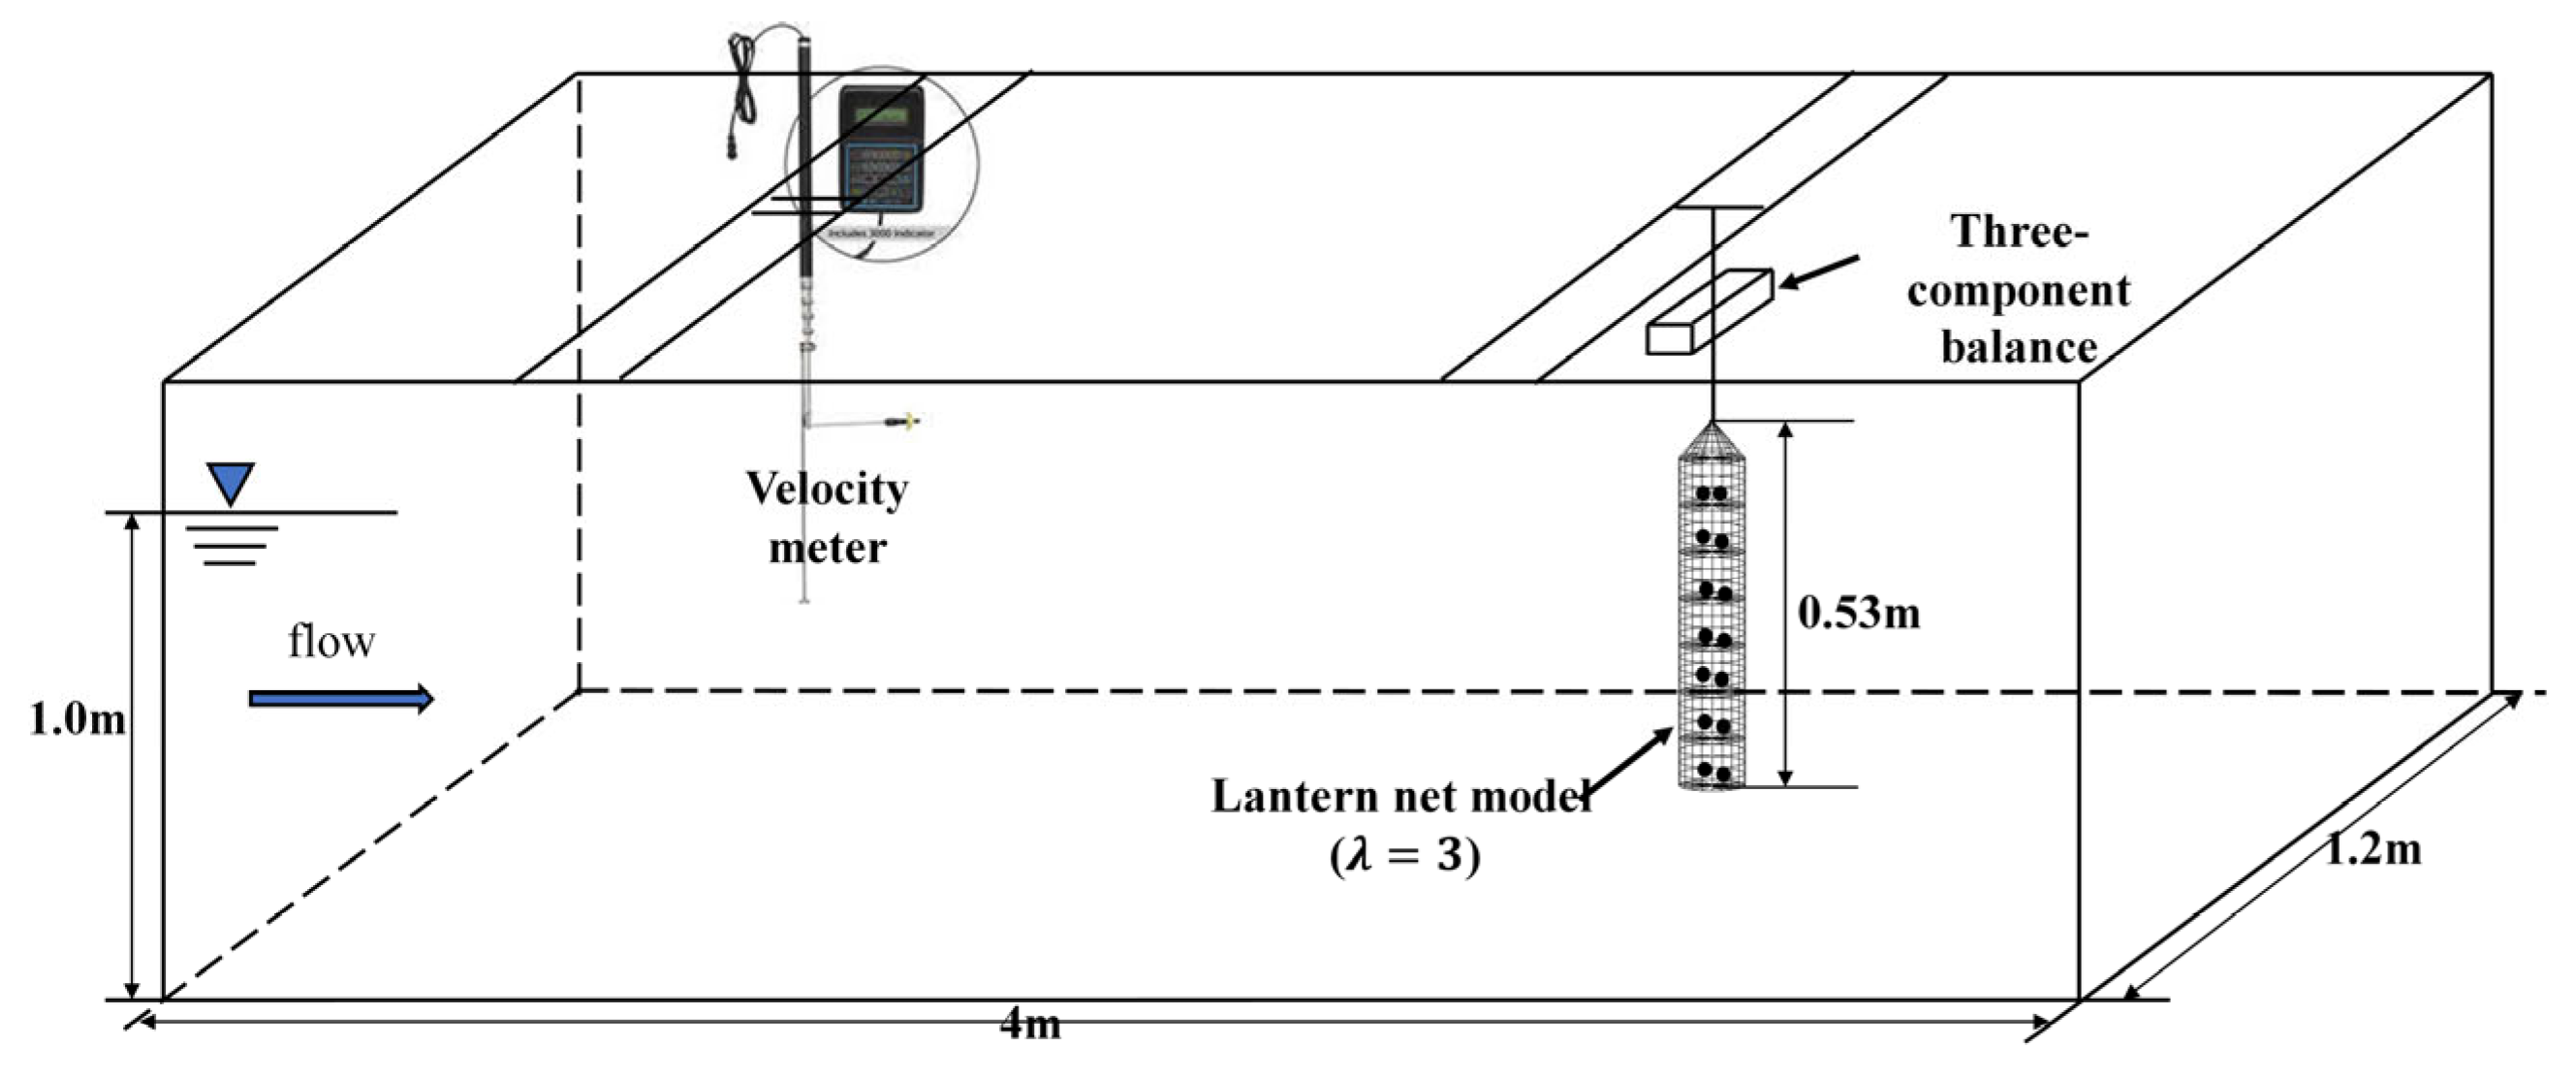
2.2. Flume Tank Experiment to Investigate the Drag Characteristics of the Lantern Net

The hydrodynamic characteristics of the lantern net model were measured in a circulating flume tank at the Ocean University of China (observation section: length 4.0 m, width 1.2 m, and water depth 1.0 m). Figure 2 shows the measurement system. The model of the prototype lantern net was fabricated based on the Froude similarity law with a 1/3 length scale and 1/27 force scale. Three lantern net models with a height of 53 cm and a diameter of 9.7 cm were altered for the weights in the water of 0.5, 0.75, and 1.0 kg based on fine adjustments of gravel.
A tether line (10 cm length) was fixed to the top center section of the lantern net model to enable a connection to a three-component balance (maximum load of 49 N), which measured the lift force L and drag force D. The flow velocity was measured using a Doppler current meter (Nortek China Ltd., Vectrino, Qingdao, China, measurement range: 0.1–2.0 m/s) installed 100 cm upstream of the model. The inclination angle θ of the lantern net relative to the oncoming current was recorded using a camera. Thus, the normal drag coefficient CDn [=2D/(ρSV2)] and Reynolds number Re (=Vd/ν) can be calculated, where ρ denotes the water density, ν denotes the kinematic viscosity, V denotes the current velocity, and S denotes the envelope projected area (or outline area) multiplied by the inclination angle. Hydrodynamic experiments on the lantern net model were carried out at current velocities of 15–60 cm/s, considering increments of 15 cm/s. The hydrodynamic force was obtained at a sampling frequency of 50 Hz within a measurement period of 20 s. The hydrodynamic force and flow velocity values were passed through a digital voltmeter, and the measured data were sent to a personal computer. The data were analyzed using the average values. The water temperature was maintained at 17 °C during the experiments.

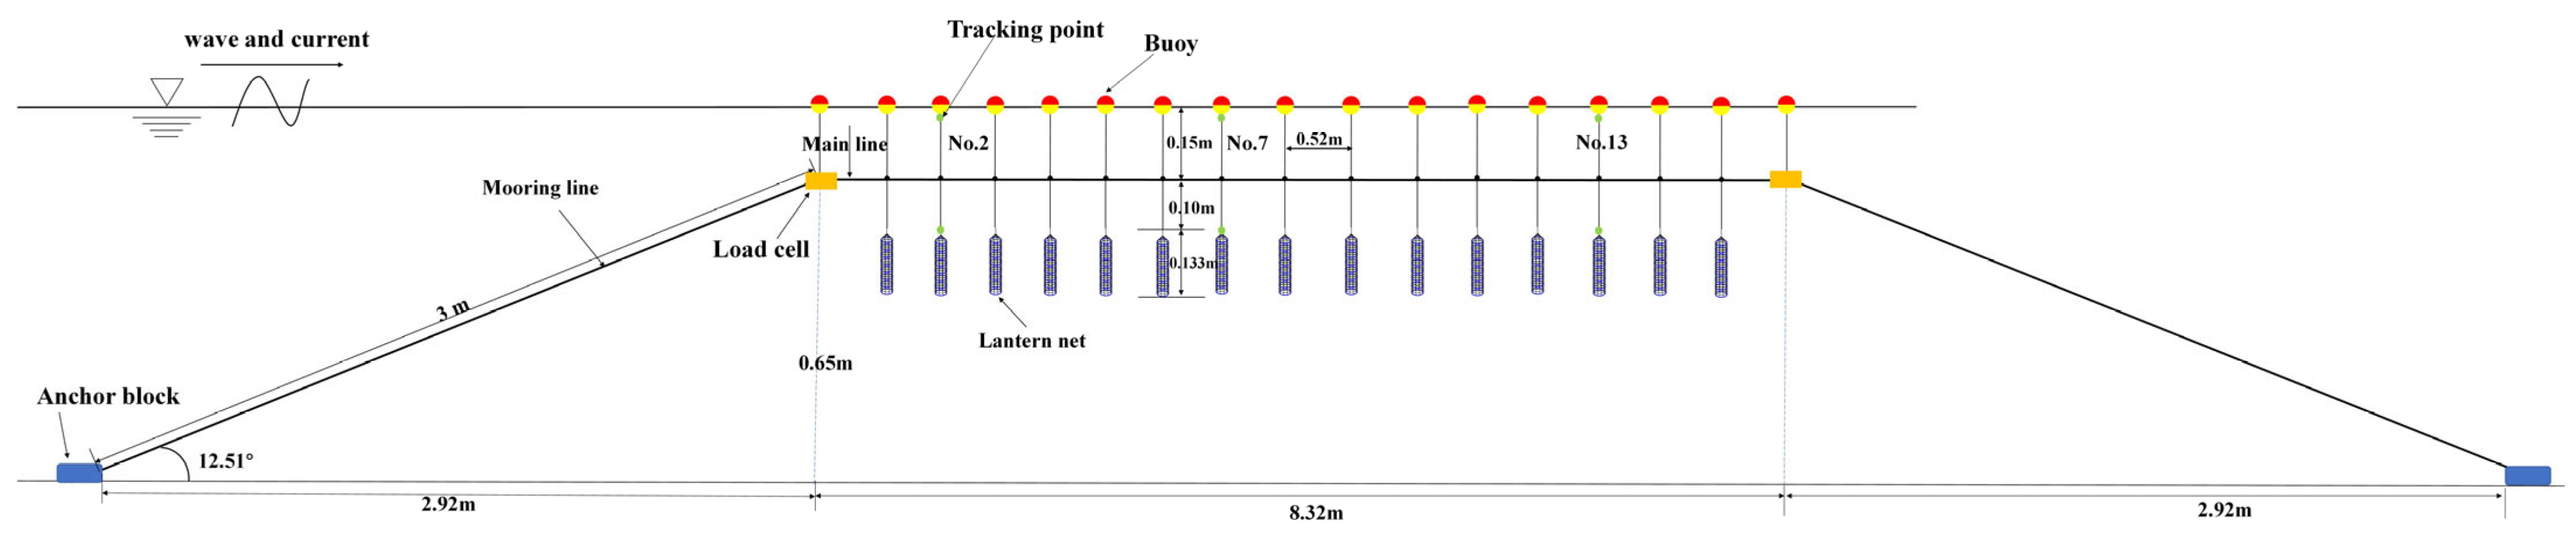
2.3. Wave/current-Tank Experiment to Investigate the Hydrodynamics of the Longline Aquaculture Facility with Lantern Nets

As mentioned above, a single-row prototype oyster longline aquaculture facility with lantern nets was selected as the physical model to facilitate testing under current and wave conditions (Figure 3). The longline facility model was fabricated based on the Froude similarity law with a 1/12 length scale, 1/3.46 velocity scale, and 1/1728 force scale. The major components of the longline facility model were two mooring lines with a length of 3 m, one main line with a length (Lm) of 8.33 m, 15 lantern nets with a height of 13.3 cm and a weight in water of 27.8 g, and 17 floats with a buoyancy of 65 gf (Table 1). In particular, it was a compromising approach that the number of lantern nets (buoys) tied to the main line decreased from 80 (122) in the prototype to 15 (19) in the model, owing to difficulties occurred during the model development (e.g., a lantern net model with a weight in water of 5.3 g and a buoy with a buoyancy of 9.2 gf). The total weight and buoyancy of the lantern nets and buoys were evenly distributed in the models.
The longline facility model was positioned in the middle section of the two-dimensional wave/current tank at the Ningbo Institute of Dalian University of Technology (observation section: length 30 m, width 2 m, and water depth 0.8 m) (Figure 3). The facility model was directed toward the incident wave, starting 2.5 m away from the wave-making system. Both ends of the model were rigidly anchored on the flume floor using cement blocks (a weight in water of 3.4 kg). A load cell (maximum load 49 N) mounted near the first buoy along the upstream direction was used to measure mooring tension under the current and wave conditions at a ratio of mooring line length to water depth of 3.75, which is considered to be slack mooring. The buoy was attached above the load cell to compensate for buoyancy. The dynamic motion tracking of the buoys above the water surface and lantern nets in mid-water under wave actions was implemented using light-emitting diodes (LEDs; 650 nm) and charge-coupled device high-speed camera acquisition systems positioned outside the tank. The LEDs were installed at the bottom section of the buoy and the top center section of the lantern net. Moreover, a Doppler current meter (Nortek China Ltd., Vectrino, measurement range: 0.1–2.0 m/s) under the current condition and wave gauge (measurement range of 60 cm) under the wave condition were installed upstream to monitor the generated flow velocity and wave height, respectively.
The following two experiments in the current/wave tank were carried out: (1) Under the current condition, the mooring tension was measured in the range of 15–45 cm/s at increments of 7.5 cm/s and a sampling frequency of 25 Hz within a measuring period of 60 s. The inclination angle of the lantern net and immersion depth of the buoy while varying the current settings were obtained when the longline facility was in a steady state. (2) Under the wave condition, second-order Stokes waves were generated, which are typical shallow water waves in the commercial oyster farm of Nanhuang Island. The details of the wave parameters are listed in Table 2. Waves with periods of T = 1.15–2.02 s were tested at heights of H = 0.083 and 0.125 m. The mooring tension of the main line was measured at a sampling frequency of 25 Hz within a measurement period of 60 s. The peak value (maximum tension, Fmax) of the mooring line was considered to reflect the potential risk of rope breakage in the longline facility. As shown in Figure 3, the one-frame movement of the tracking points of three pairs of buoys and lantern nets (Nos. 2, 7, and 13) were captured at intervals of 1/250 s using a camera, which was connected to a personal computer. The size of each image is 1024 × 768 pixels. For this analysis, 400 pairs of pictures were used to calculate the horizontal and vertical movement amplitudes of the buoy and lantern nets.

3. Results

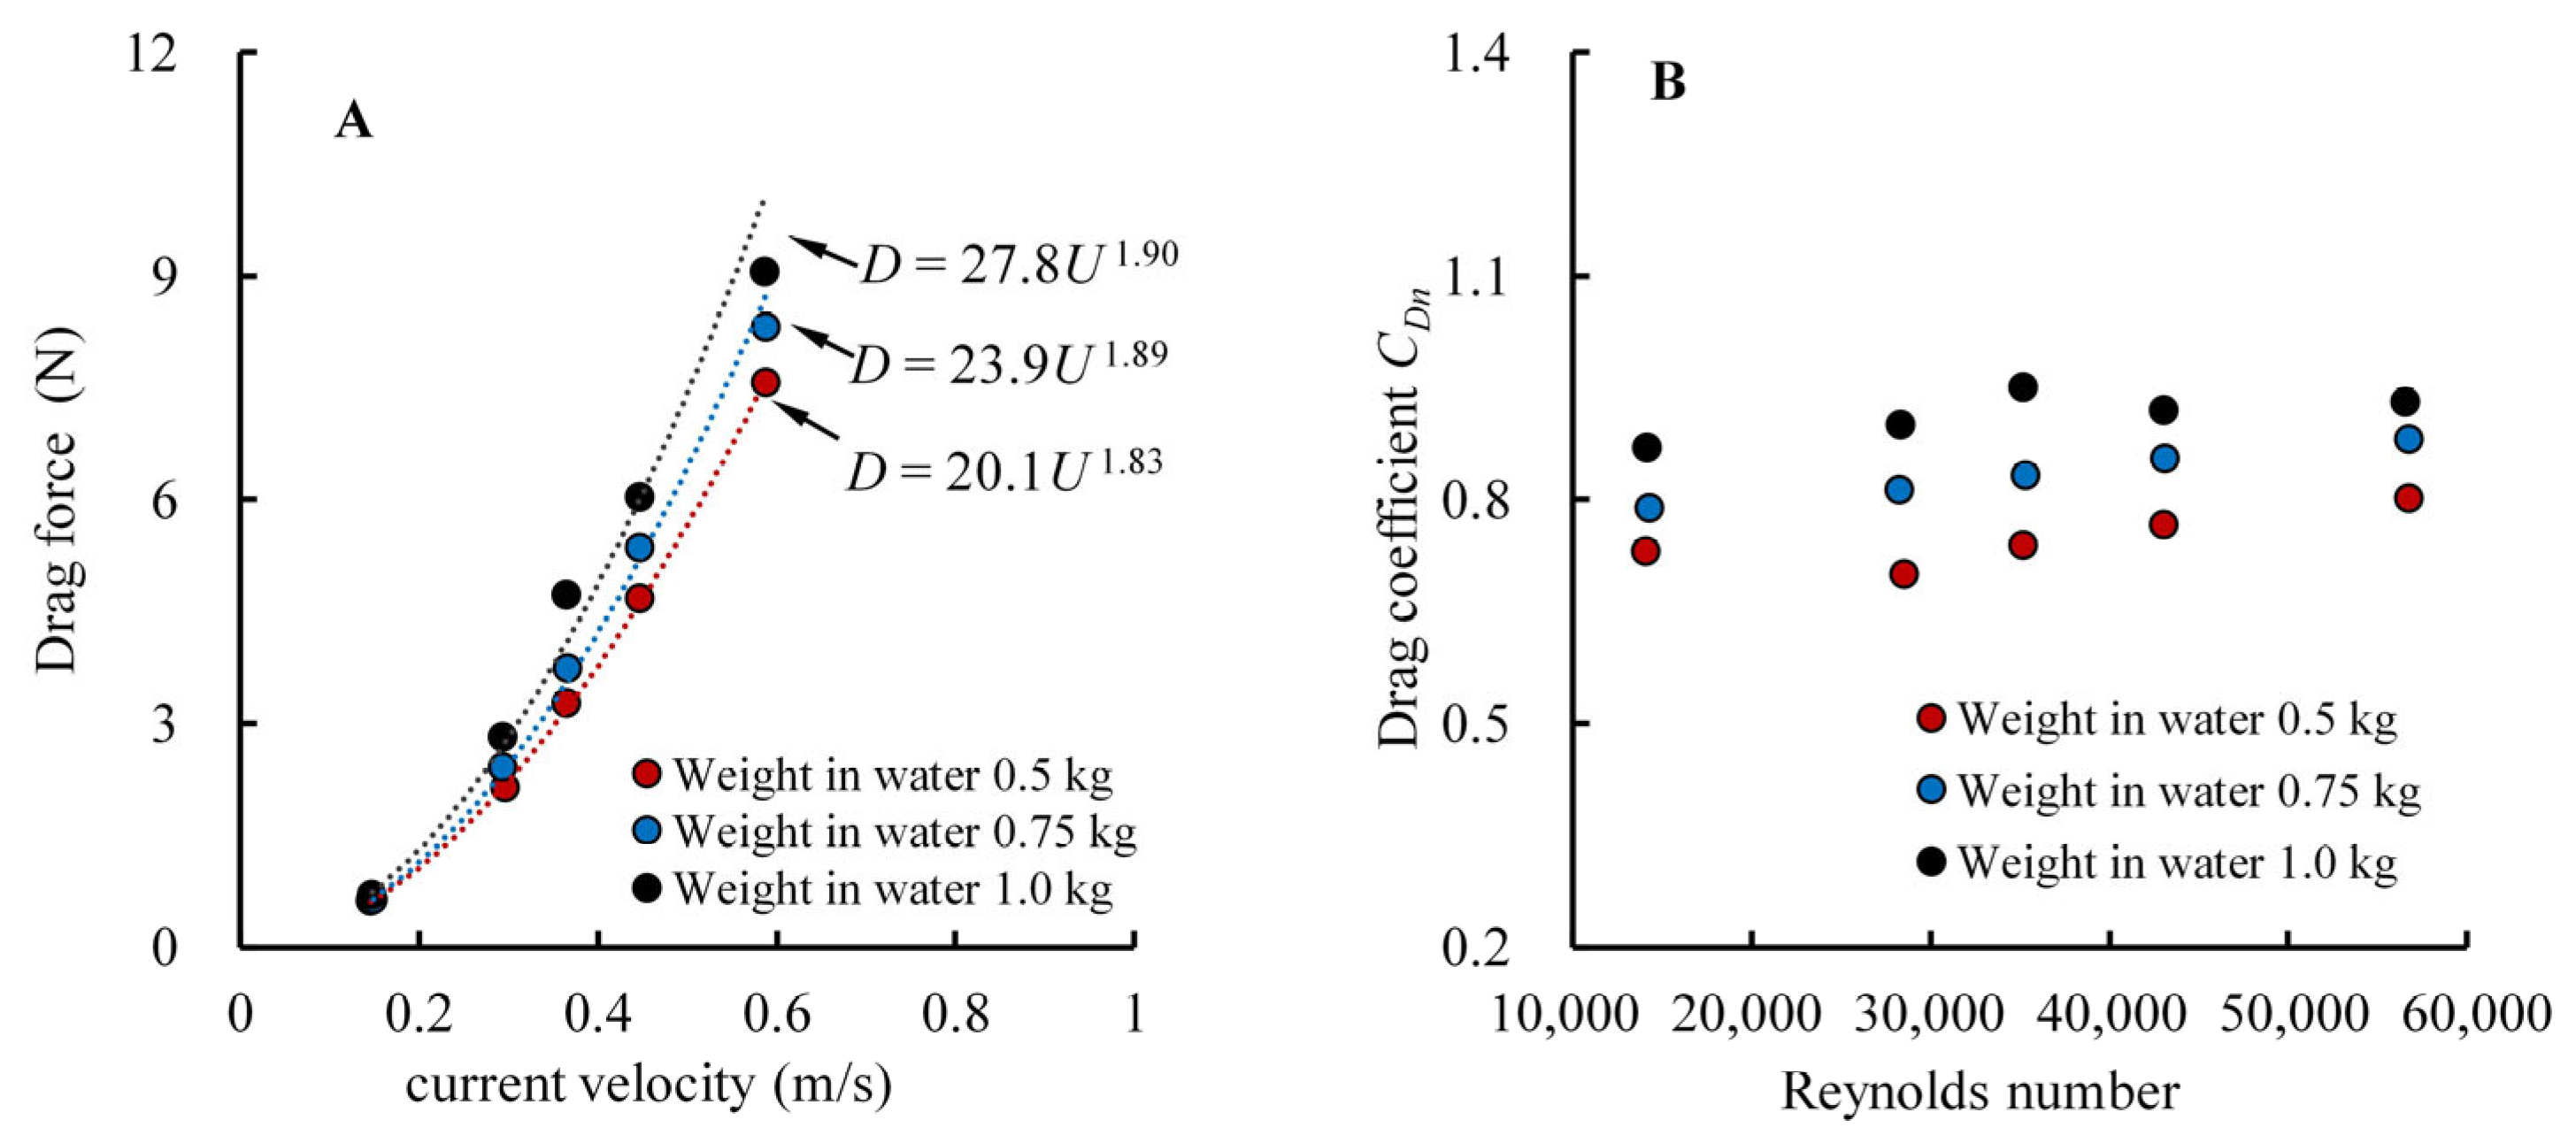
3.1. Drag force of the Lantern Net in Currents

The single lantern net model with different weights (e.g., 0.5, 0.75, and 1.0 kg in water), assumed to be the weights of a single lantern net at different culture stages, was tested in currents. The relationship between the drag force and flow velocity of the lantern net model is shown in Figure 4A. This indicates that the drag force of the lantern net under the same weight exponentially increased with an increase in the flow velocity, and the power exponent of the estimated formulas in terms of the drag force and current increased from 1.83 to 1.90. Meanwhile, for the same current, the greater the weight of the lantern net, the greater its drag force was.
The drag coefficients of the lantern net model were calculated from the measured drag forces and projected areas of the model, and the diameter of the lantern net model was used to calculate the Reynolds number. The drag coefficient was plotted against the Reynolds number (Figure 4B). There were only slight variations in the drag coefficient of the tested model in the Reynolds number range of 1 × 10⁴–6 × 10⁴. The averaged drag coefficients of the lantern net model with the adopted weights of 0.5, 0.75, and 1.0 kg were determined to be 0.75, 0.83, and 0.91, respectively.

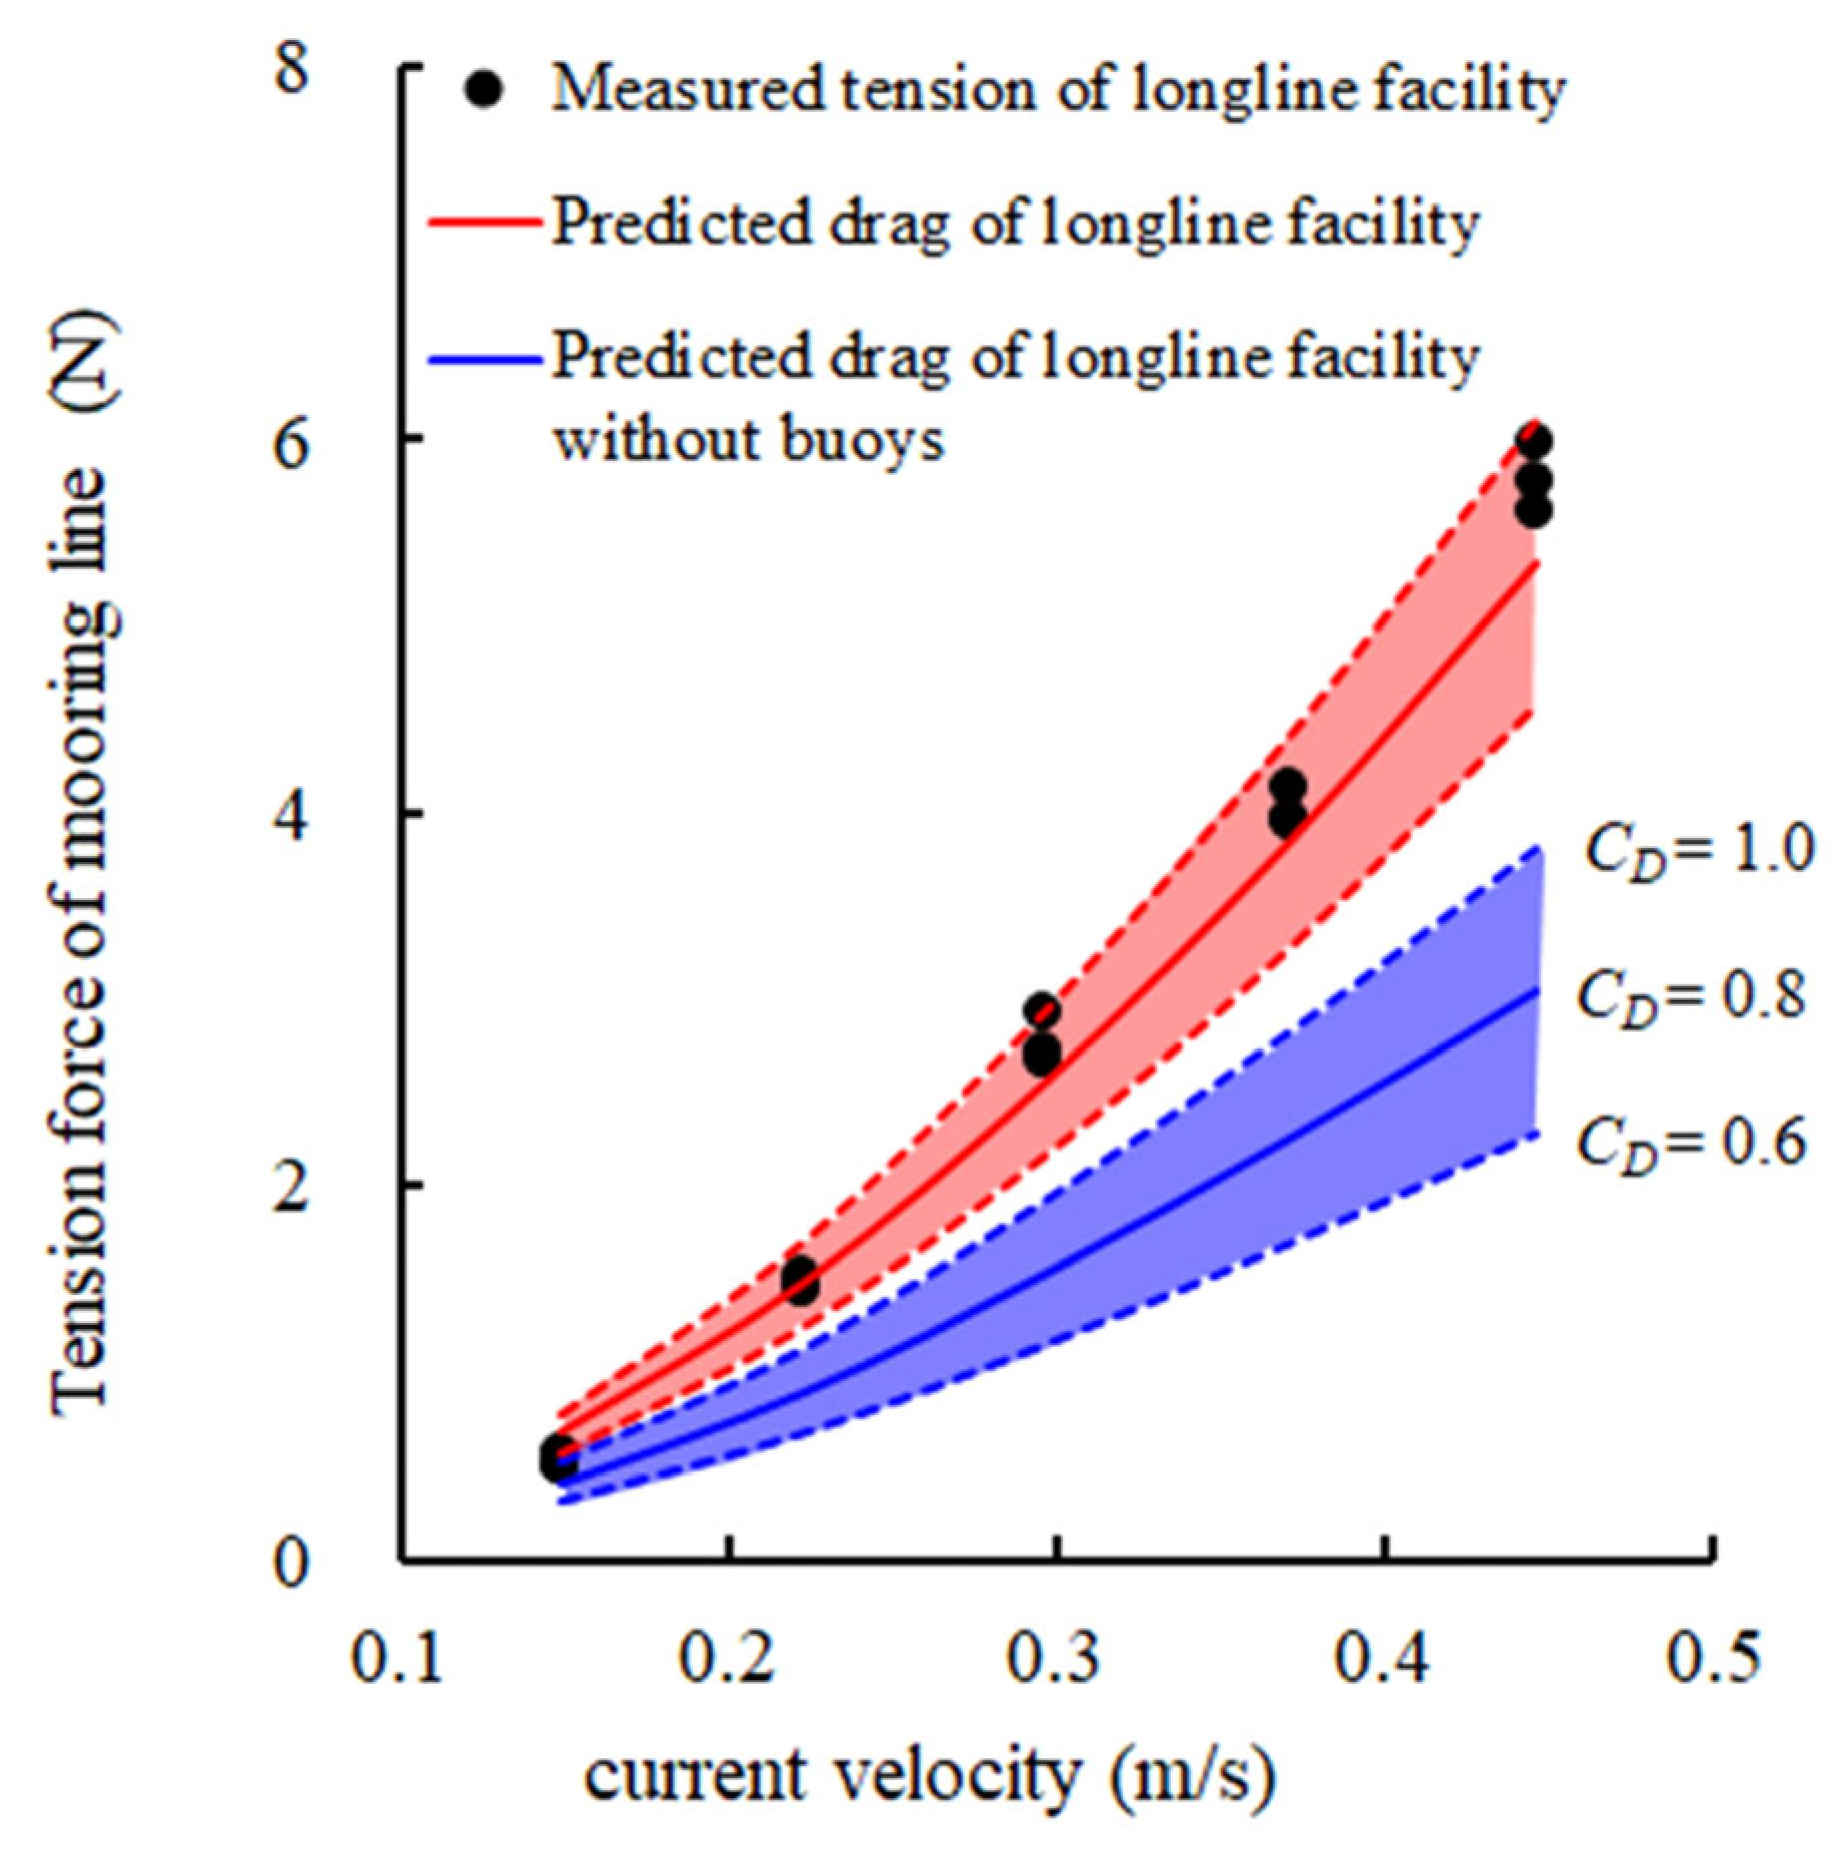
3.2. Mooring Line Tension of the Longline Aquaculture Facility in Currents

The upstream mooring line experienced the total resistance of the single-row longline aquaculture facility when the longline model was set parallel to the current direction. Figure 5 shows the tension of the upstream mooring line of the longline facility model in the current range of 15–45 cm/s. There was no significant change in the time-series data of the measured tension in every current setting. The black dots represent the average values of the mooring line tension. Referring to the experimental results, the mooring line tension sharply increased with the increment of the current; concurrently, the inclined angle between the current and the lantern net models (Figure S1), and the immersion volume of the buoys above the surface increased as the current increased (Table 3).
The insights into the drag distributions of lantern nets and buoys relative to the whole longline facility were considered with regard to structural design. The upstream mooring line tension of the longline facility under the current condition was estimated based on the drag forces of the lantern nets and buoys and the angle was converted using the length of the mooring line and water depth. Thus, the drag coefficients of the lantern net, i.e., 0.6 to 1.0, were considered (Figure 4B), and the drag coefficient with a value of 0.5 of the buoy as a sphere was considered. As shown in Figure 5, the purple and red areas represent the predicted mooring line tension of the longline model without and with buoys, respectively. The measured upstream mooring tensions with varying currents were consistent with those of the estimated values, with a drag coefficient of 0.8 for the lantern net. This implies that the drag coefficients of the lantern nets obtained from the flume tank experiment were reasonable. The proportions of the drag distribution of the lantern nets (drag coefficient:0.8) and buoys at 15–45 cm/s were 61.9%–56.9% and 38.1%–43.1%, respectively.

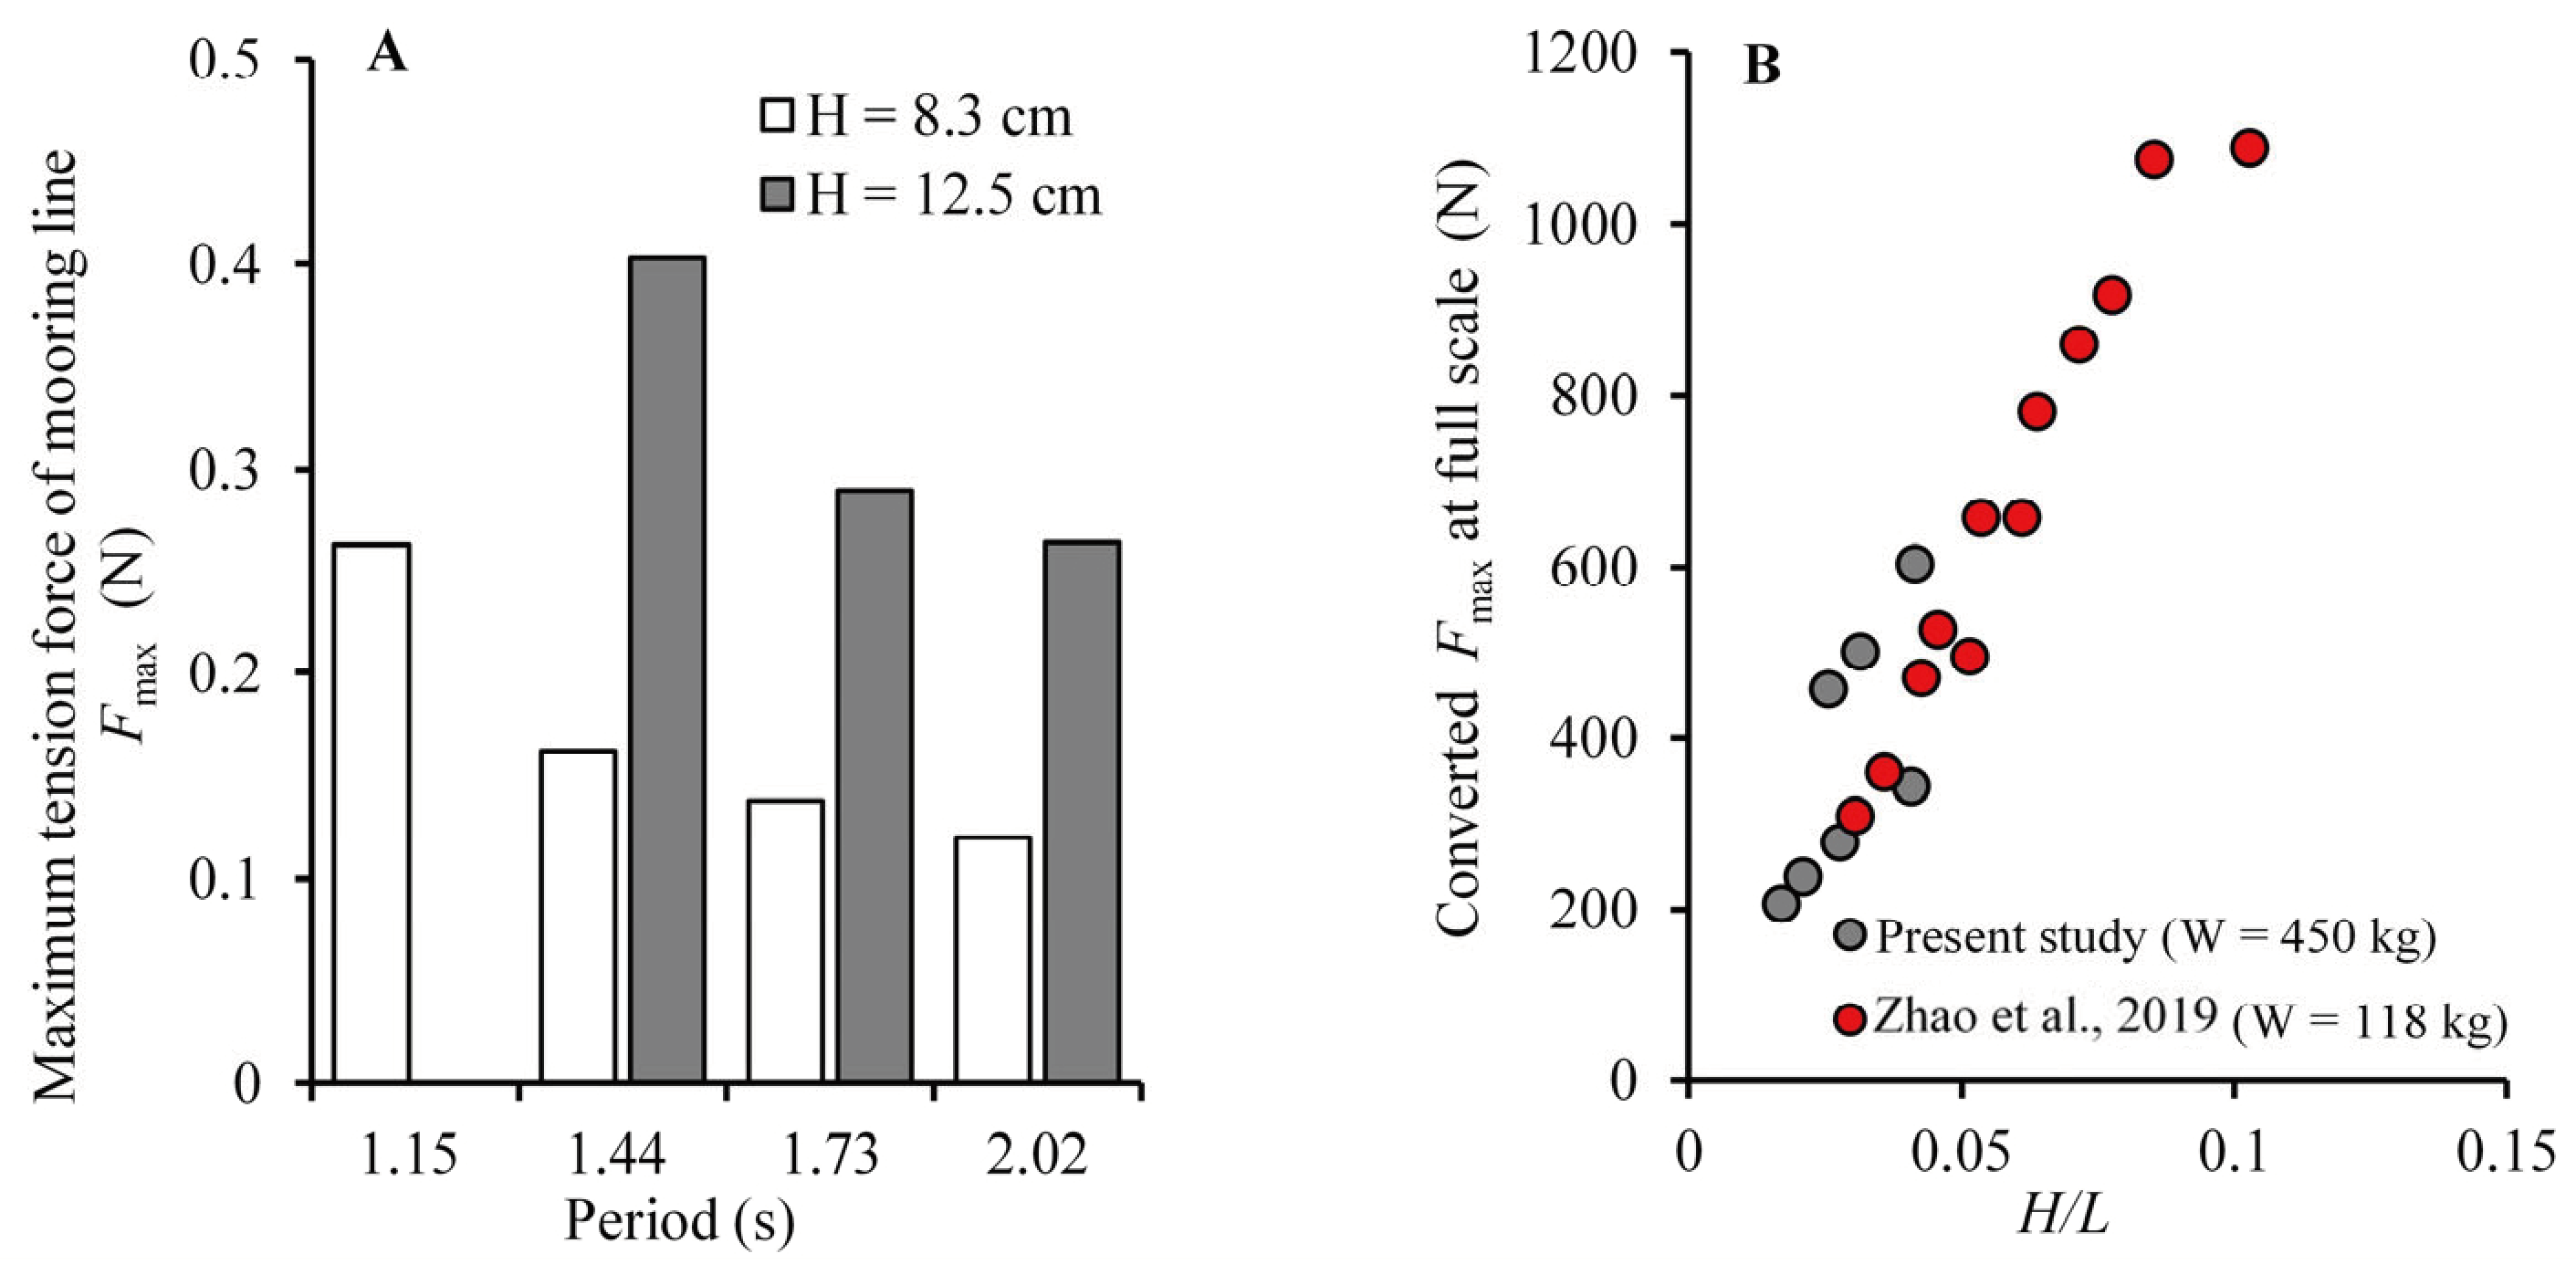
3.3. Maximum Tension of the Mooring Line of the Longline Aquaculture Facility under the Wave Conditions

Figure 6A shows the maximum tension (Fmax) of the upstream mooring line of the longline aquaculture facility at different wave heights and periods. The maximum tension of the mooring line increased with an increase in the wave height at the same wave periods of 1.44, 1.73, and 2.02 s. Meanwhile, Fmax decreased with an increase in the wave period at the same wave heights of 8.3 and 12.5 cm. The maximum tension of the prototype longline facility with lantern nets was converted considering the measured tension of the facility model and a force scale of 1/1728 of the Froude similarity law. The maximum mooring line tension increased from 200 to 600 N as the wave steepness (H/L, H: wave height, L: wavelength) increased from 0.017 to 0.041 (Figure 6B). The increasing tendency of the maximum mooring line tension from 300 to 1100 N with wave steepness was similar to that of a simplified longline facility with lantern nets in the wave steepness range of 0.03–0.1 [14].

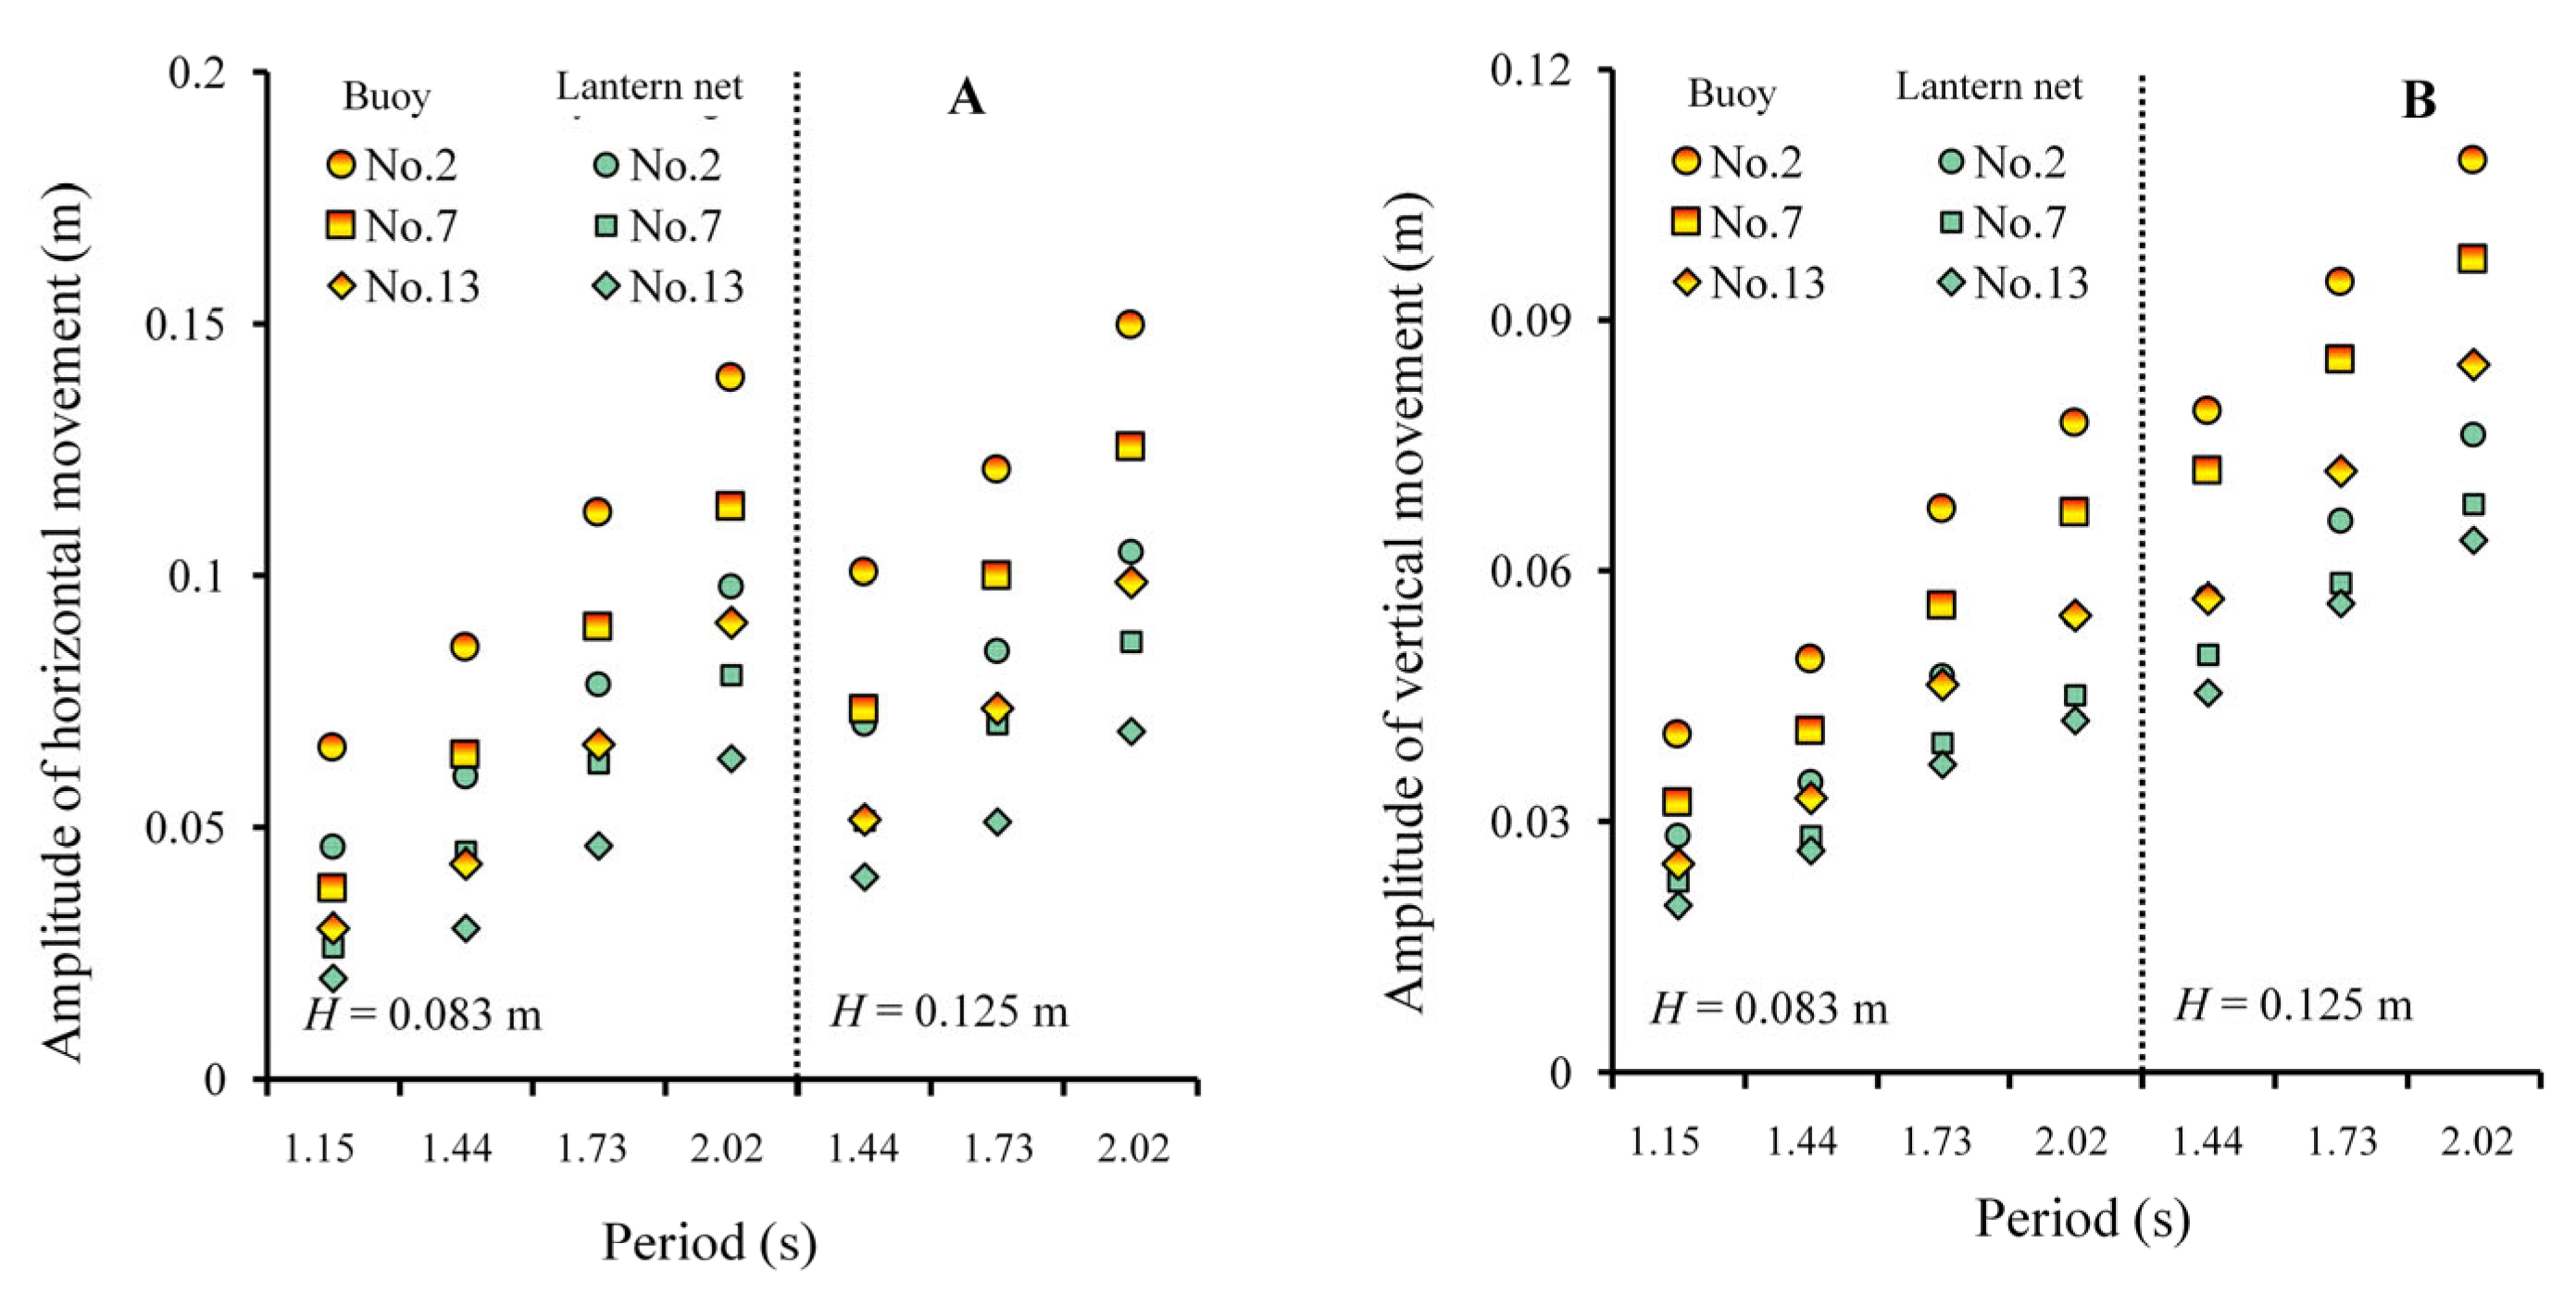
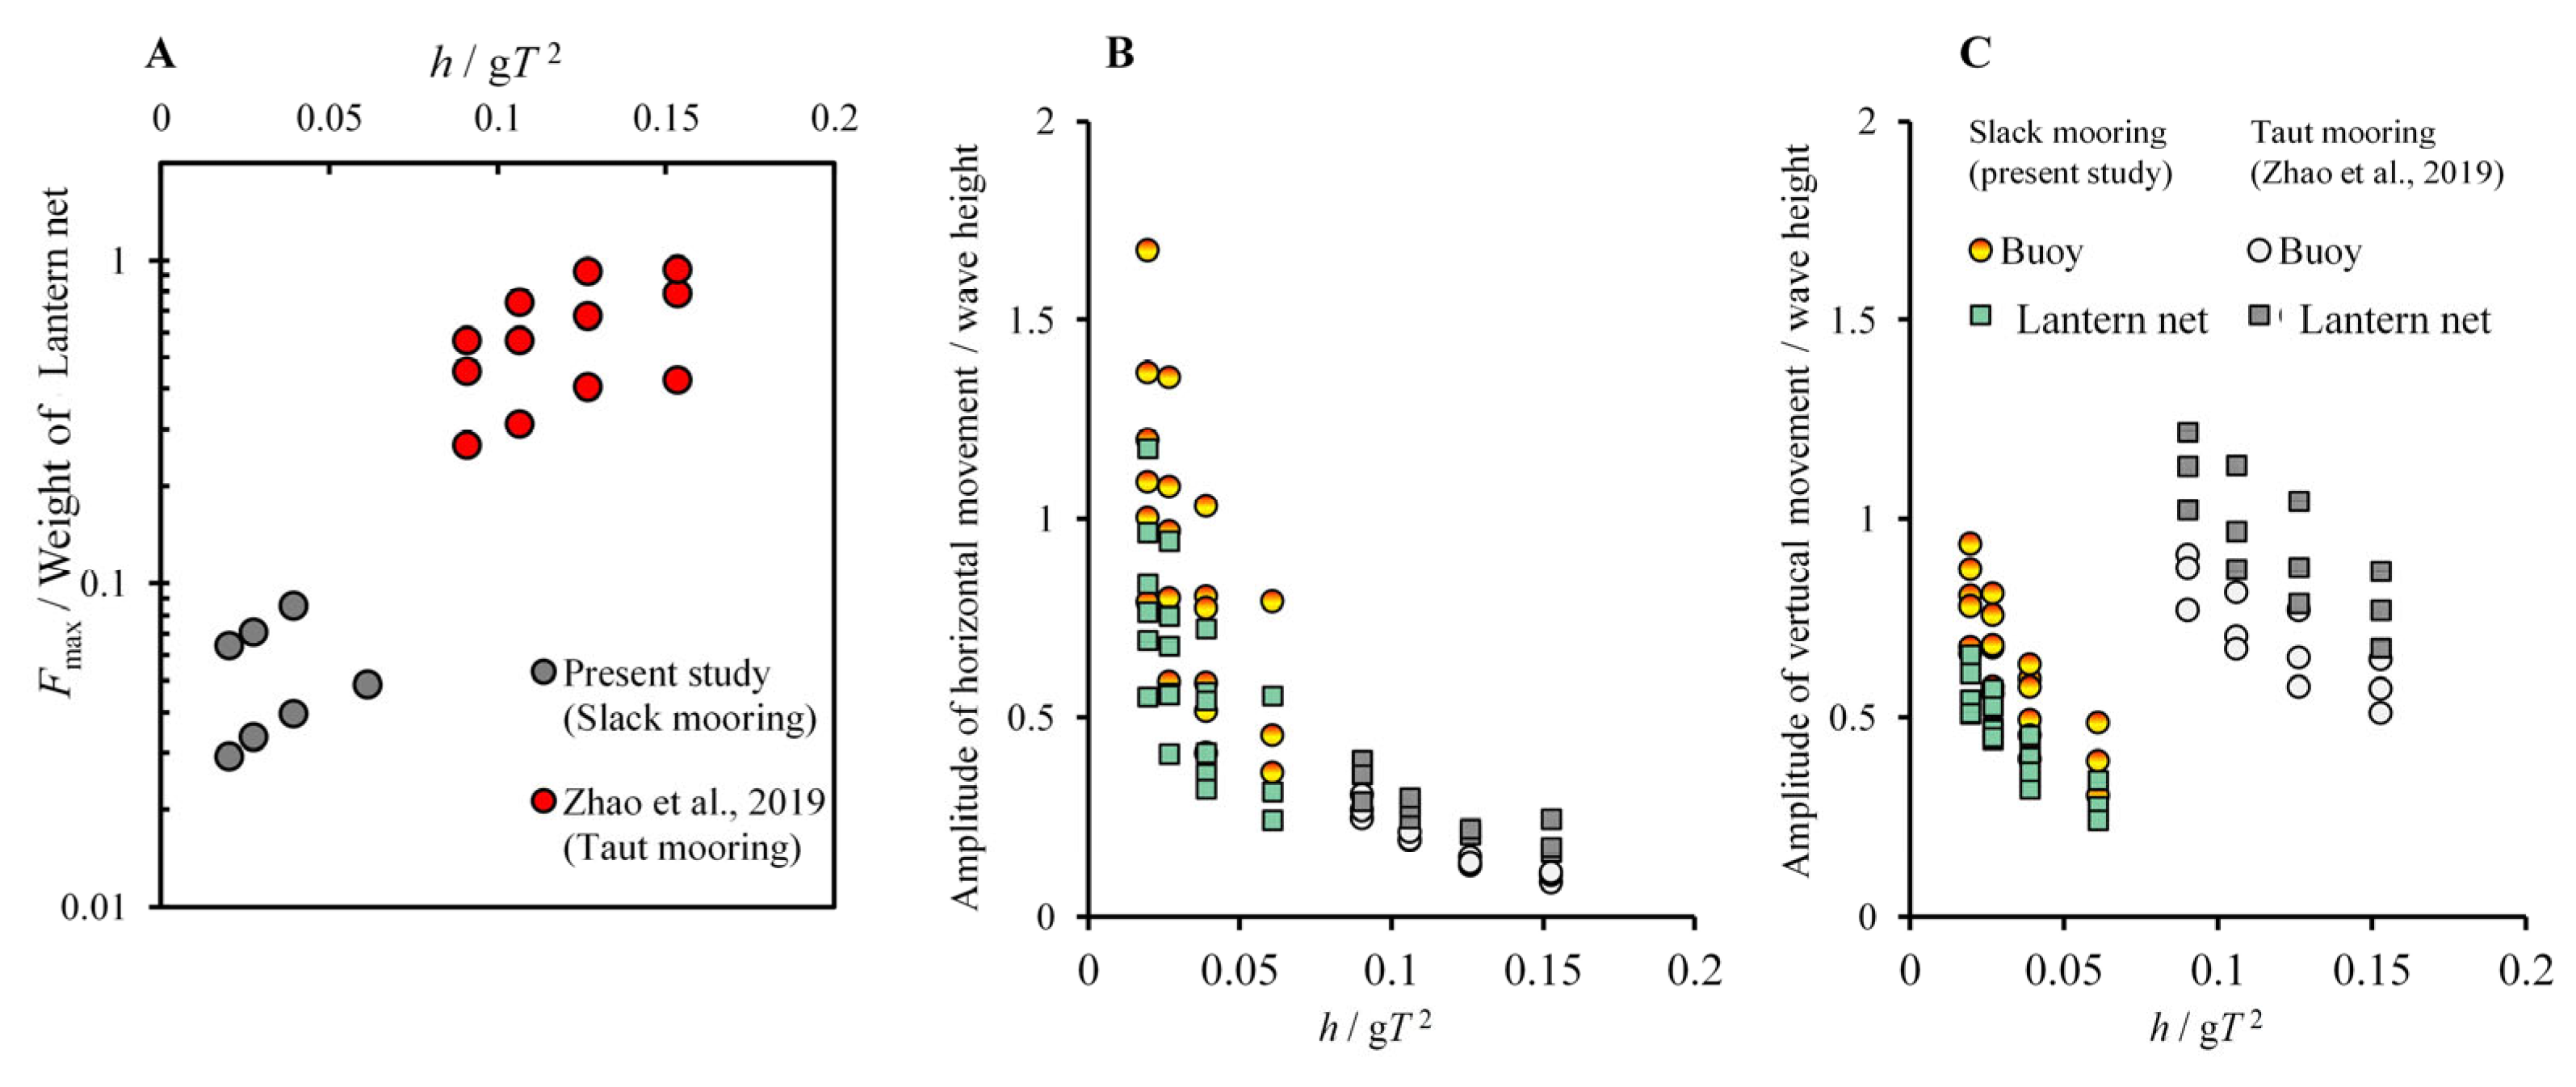
3.4. Dynamic Motion of the Longline Aquaculture Facility in Waves

The movements of three pairs of the buoy and the lantern net of Nos. 2 (upstream), 7 (middle), and 13 (downstream) considering the wave heights of 0.083 and 0.125 m and wave periods of 1.44 and 1.73 s were monitored. The horizontal and vertical amplitudes of the buoys and lantern nets along the upstream, middle, and downstream sections of the longline aquaculture facility were measured (Figure 7). The experimental results indicated that the amplitudes in the horizontal and vertical dimensions of the buoys were greater than those of the lantern net in the wave tests. The movement of the buoy and lantern net pairs was attenuated in the order of Nos. 2, 7, and 13 along the wave direction. Moreover, there was no significant difference in the horizontal movements of buoys or lantern nets between the wave heights of 0.083 and 0.125 m, when varying the wave periods between 1.44 and 2.02 s. However, the vertical movement of buoys or lantern nets at a wave height of 0.125 m was larger than that at a wave height of 0.083 m.

4. Discussion

Marine aquaculture may be defined as a phenomenon occurring in the sea with significant exposure to wind and waves categorized as inshore (i.e., coastal or off-coast) and offshore aquaculture, which is adopted by the FAO [28]. A classification system based on the significant wave height, corresponding to medium (1–2 m), high (2–3 m), and extreme (>3 m) was proposed by Ryan [29]. In our study, the prototype of the chosen longline aquaculture facility with lantern nets that was distant from the nearest Nanhuang Island belongs to the inshore off-coast aquaculture category. Experiments on the reduced-scale models of the lantern net to the whole facility were conducted to understand the hydrodynamic performance of the longline facility exposed to currents and waves. Solutions for expanding offshore longline facilities could be provided to modifying the configurations of the available off-the-coast longline facility [8,9,10].
Using the mooring line to highlight the issues of anchor failure and rope breakage has been considered as a key component of longline facilities. The main specifications of the mooring line are the diameter and length, of which the former is associated with the breaking strength of the rope [15] and the latter is often generalized as the ratio of line length to water depth (or the scope refers in particular to the mooring of marine structures) to build a relationship with the hydrodynamic loads of the floating structure and towing system [30].
The hydrodynamic force loading on the mooring line determines its diameter, for which all the mooring lines used in the farm should be the same to cope with currents and waves generated from diverse directions. Based on the present results (Figure 5 and Figure 6A), we found that instead of the wave-driven tension, the current-driven tension of the upstream mooring line was dominant for the off-the-coast longline facility. Thus, the approach of estimating the mooring line tension of a longline facility under current conditions (e.g., static simulation) is important for the design of a mooring line [9,18,21,22]. In this study, a simplified model of the longline facility with two major components, i.e., the lantern net and buoy, predicted the mooring line tension well (Figure 5). The bias of the simplified model with the drag coefficients of the lantern net with different weights from 0.5 to 1.0 increased with the current. The precision of the estimation method can be improved using an improved accurate hydrodynamic model of the lantern net, considering confounding effects on the hydrodynamic characteristics of the lantern net, e.g., inclination angle, porosity, and roughness. Furthermore, the weight of the lantern net was adjusted to simulate different culture stages of the culture unit, which implies that the risk of mooring line breakage should be evaluated in advance, as the lantern net is harvested.
The scope of a mooring line is described as a slack and taut configuration for a floating structure. The longline facility with five lantern nets weighing 118 kg was moored at a scope value of 2 [14], and a value of 3.75 to investigate a longline facility weighing 450 kg in our experiments. The converted Fmax at full scale of the aforementioned mooring lines in waves was in the range of 200–1200 N, although the weight of the lantern net in this study was approximately four times larger (Figure 6B). This agrees with the seaward mooring tension of two kinds of single-row longline aquaculture facilities under the wave conditions (rectangular cage and mussel dropper) tested in sea trials [8,11]. The ratio of Fmax divided by the weights of the cage nets was herein calculated to characterize the dimensionless load on the mooring line. Typical wave conditions from shallow water to deep water were defined as h/gT2, and the corresponding dynamic motions of the buoy and lantern net under the wave conditions were defined as the amplitudes of horizontal and vertical movements relative to the wave height (Figure 8). The trends indicated that the dimensionless load on the mooring line increased as h/gT2 increased, whereas the movement amplitude of the longline facility decreased. This implies that the movement of the longline facility is conversely subjected to the high tension of the mooring line, which often suffers from worse waves in deep water. Furthermore, the dimensionless load of the mooring line with a scope of 2 was on the order of 1, i.e., ten times that of the upstream line moored at 3.75 (Figure 8A). This indicates that the scope of the mooring line plays a key role in eliminating an order of magnitude difference in mooring tension under the wave conditions, specifically in reducing the anchor failure of the longline facility.
Relationships between L/Lm (ratio of the wavelength L to the main line length Lm) and the hydrodynamic load of the mooring line and the movement amplitudes of the longline facility were derived, in order to select an appropriate length for the main line (Figure 9). The dimensionless load on the mooring line decreased with an increase in L/Lm; however, the buoy and lantern net moved more as L/Lm increased. The amplitudes of the vertical movement of the longline facility were mostly less than the wave height, as L/Lm was less than 1.5. Multi-row longline aquaculture facilities can be sequentially arranged as the distance of the sum of the channels of servicing vessels and twice the wave height at the site. A longer main line hanging additional cultural units is acceptable for the farmers; however, this implies that the collision of adjacent longline facilities would occur, and correspondingly, the hanging cultural units would get easily twisted and lost. Moreover, the trajectories of the lantern net and buoys are staggered; therefore, we may have to consider that the whip line is wound on the main line at a high frequency based on field observations. The selection criterion of the main line length should be assessed more carefully since a shorter length of the main line than that of the farm may lead to a reduction in production [9,12,13]. A compromising approach to compensate for the potential loss of oyster production is to increase the number of lantern nets in single-row longline aquaculture facilities. However, an increase in the number of lantern nets may enable the diminution of the water-column exchange, which is unfavorable for oyster growth [31].
Accordingly, the multiscale interrelation between a shellfish farm and the surrounding flow has drawn constant attention [9]. A longline aquaculture facility is a highly interdisciplinary topic, and engineering cannot be entirely separated from biology. Numerous efforts in terms of the shielding effect at the cm scale and blockage effect at the m scale indicate that the hydrodynamics of the area cause water flow distortions, current attenuation, wake formation, and distorted water column stratification. It affects the supply of nutrients and seston and alters material dispersal, biodeposition, and resuspension, thus diminishing the carrying capacity of the system and affecting the surrounding ecology and ecosystem services [9,12,13,31]. In the future, the fluid structure issue of the longline aquaculture facility with lantern nets under current/wave conditions will be investigated with the surrounding biology. Understanding the mechanics of such structures is vital for the correct prediction of response under extreme conditions and for avoiding over-engineering in design.

5. Conclusions

In this paper, an experimental study was conducted to investigate the hydrodynamics of a longline facility with lantern nets through experiments in currents and waves. Drag measurements were conducted to investigate the relationship between the drag coefficient and the Reynolds number for a single lantern net in a steady flow. In the wave tank, the mooring line tension and motion response of the longline structure model were studied under different wave conditions.
The experimental data showed that the drag force of the lantern net increased with the increase in flow velocity. This is consistent with the results of the drag force of columnar structures, such as circular cylinders, net cages [32,33,34], and mussel ropes [16], which is proportional to the square of velocity. However, due to the large deformation and permeability of the fish cage in a current, the drag coefficient of the net mesh was used to calculate the drag on the fish cage in the numerical simulations of the fish cage model. The net solidity and height of the fish cage are the main factors that have a significant influence on the drag force of the fish cage [35,36]. In this study, we did not consider the shielding effect of the biofouling on the lantern net on the drag force of the lantern net. The weights (i.e., 0.5 kg, 0.75 kg, 1.0 kg in water) mimic the weight of oysters at different stages. The drag coefficients of the lantern net model with different weights were in the range of 0.6 to 1.0, and there was no significant variation in the drag coefficient at the tested Reynolds numbers of 1 × 10⁴–6 × 10⁴. We suggest that the drag coefficient of C D = 0.8 ± 0.1 is a reasonably accurate value for a lantern net with a weight of 15–30 kg in water. In the future, we will consider the influence of the biofouling on the shielding effect of the net mesh on the drag force of the lantern nets.
The wave tank tests were conducted to investigate the mooring line tension and motion response of the lantern nets and buoys under different wave conditions. Compared the mooring line tension in the currents and W&C (wave and current), the current-driven tension of the upstream mooring line was more dominant than the wave-driven tension for the tested off-the-coast longline facility. Moreover, a simplified model of the longline facility with two major components, i.e., the lantern net and buoy, predicts the mooring line tension in currents well. Meanwhile, the comparison of our study results and the results in Zhao [14] showed that the dimensionless load on the mooring line increased as h / g T 2 increased, and the scope of the mooring line plays a key role in eliminating an order of magnitude difference in mooring tension under wave conditions, specifically in reducing the anchor failure of the longline facility. The dimensionless load ( F m a x /Weight) of the mooring line with a scope of 2 was on the order of 1, which is ten times that of the upstream line moored at 3.75. It appears that the scope was the key factor in reducing the mooring tension in waves. As the two major components of the longline aquaculture facility, the motion responses of the lantern nets and buoys were also investigated. We recorded the trajectories of lantern nets and buoys marked No. 2, 7, 13 by CCD during the wave tank tests. The results showed that the amplitudes of the horizontal and vertical movements of the longline facility increased with L / L m , which implies that the collision of adjacent facilities and the loss of cultured oysters occurred for the facility with a longer wavelength.
In light of these experiments, the results aim to better understand the hydrodynamic characteristics and motion response of the longline aquaculture facility for the safety and stability of the longline structure in open sea environments.

Supplementary Materials

The following supporting information can be downloaded at: https://www.mdpi.com/article/10.3390/fishes8040204/s1, Figure S1: Inclined angle between the oyster cage and the flow direction in the currents from 0.15 to 0.45 m/s.

Author Contributions

Formal analysis, J.X., Y.L., X.W. (Xiao Wang), and G.G.; Funding acquisition, X.W. (Xinxin Wang) and X.Y.; Investigation, J.X., Y.L., X.W. (Xiao Wang), and G.G.; Methodology, J.X., Y.L., X.W. (Xiao Wang), and G.G; Project administration, X.W. (Xinxin Wang) and X.Y.; Supervision, X.W. (Xinxin Wang) and X.Y.; Visualization, J.X., Y.L., X.W. (Xiao Wang), and G.G.; Writing—original draft, J.X.; Writing—review and editing, X.W. (Xinxin Wang) and X.Y. All authors have read and agreed to the published version of the manuscript.

Funding

This study was financially supported by the National Natural Science Foundation of China under Grant Nos. 31802349 to X. Wang and 32202997 to X. You. The project ZR2022QD010 was supported by Shandong Provincial Natural Science Foundation to X. You.

Institutional Review Board Statement

No applicable.

Informed Consent Statement

No applicable.

Data Availability Statement

The data presented in this study are available on request from the corresponding author.

Conflicts of Interest

The authors declare no conflict of interest.

References

  1. Hosomi, R.; Yoshida, M.; Fukunaga, K. Seafood consumption and components for health. Glob. J. Health Sci. 2012, 4, 72–86. [Google Scholar] [CrossRef] [Green Version]
  2. Golden, C.D.; Koehn, J.Z.; Shepon, A.; Passarelli, S.; Free, C.M.; Viana, D.F.; Matthey, H.; Eurich, J.G.; Gephart, J.A.; Fluet-Chouinard, E.; et al. Aquatic foods to nourish nations. Nature 2021, 598, 315–320. [Google Scholar] [CrossRef]
  3. Knysh, A.; Tsukrov, I.; Chambers, M.; Swift, M.R.; Sullivan, C.; Drach, A. Numerical modeling of submerged mussel longlines with protective sleeves. Aquac. Eng. 2020, 88, 102027. [Google Scholar] [CrossRef]
  4. Landmann, J.; Fröhling, L.; Gieschen, R.; Buck, B.H.; Heasman, K.; Scott, N.; Smeaton, M.; Goseberg, N.; Hildebrandt, A. Drag and inertia coefficients of live and surrogate shellfish dropper lines under steady and oscillatory flow. Ocean Eng. 2021, 235, 109377. [Google Scholar] [CrossRef]
  5. China Agriculture Press. Bureau of Fisheries of the Ministry of Agriculture: China Fishery Statistical Yearbook 2020; China Agriculture Press: Beijing, China, 2020. [Google Scholar]
  6. Buck, B.H. Experimental trials on the feasibility of offshore seed production of the mussel Mytilus edulis in the German Bight: Installation, technical requirements and environmental conditions. Helgol. Mar. Res. 2007, 61, 87–101. [Google Scholar] [CrossRef] [Green Version]
  7. Cheney, D.; Langan, R.; Heasman, K.; Friedman, B.; Davis, J. Shellfish Culture in the Open Ocean: Lessons Learned for Offshore Expansion. Mar. Technol. Soc. J. 2010, 44, 55–67. [Google Scholar] [CrossRef]
  8. Nguyen, N.Q.; Thiagarajan, K.; Auger, J. Integrity assessment of an oyster farm mooring system through in-situ measurements and extreme environment modeling. Ocean Eng. 2019, 172, 641–659. [Google Scholar] [CrossRef]
  9. Stevens, C.; Plew, D.; Hartstein, N.; Fredriksson, D. The physics of open-water shellfish aquaculture. Aquac. Eng. 2008, 38, 145–160. [Google Scholar] [CrossRef]
  10. Ferreira, J.G.; Saurel, C.; Lencart e Silva, J.D.; Nunes, J.P.; Vazquez, F. Modelling of interactions between inshore and offshore aquaculture. Aquaculture 2014, 426–427, 154–164. [Google Scholar] [CrossRef]
  11. Gagnon, M.; Bergeron, P. Observations of the loading and motion of a submerged mussel longline at an open ocean site. Aquac. Eng. 2017, 78, 114–129. [Google Scholar] [CrossRef]
  12. South, P.M.; Delorme, N.J.; Skelton, B.M.; Floerl, O.; Jeffs, A.G. The loss of seed mussels in longline aquaculture. Rev. Aquac. 2021, 14, 440–455. [Google Scholar] [CrossRef]
  13. Mascorda Cabre, L.; Hosegood, P.; Attrill, M.J.; Bridger, D.; Sheehan, E.V. Offshore longline mussel farms: A review of oceanographic and ecological interactions to inform future research needs, policy and management. Rev. Aquac. 2021, 13, 1864–1887. [Google Scholar] [CrossRef]
  14. Zhao, Y.-P.; Yang, H.; Bi, C.-W.; Chen, Q.-P.; Dong, G.-H.; Cui, Y. Hydrodynamic responses of longline aquaculture facility with lantern nets in waves. Aquac. Eng. 2019, 86, 101996. [Google Scholar] [CrossRef]
  15. López, J.; Hurtado, C.F.; Gomez, A.; Zamora, V.; Queirolo, D.; Gutierrez, A. Stress analysis of a submersible longline culture system through dynamic simulation. Lat. Am. J. Aquat. 2017, 45, 25–32. [Google Scholar] [CrossRef]
  16. Plew, D.R.; Stevens, C.L.; Spigel, R.H.; Hartstein, N.D. Hydrodynamic Implications of Large Offshore Mussel Farms. IEEE J. Ocean. Eng. 2005, 30, 95–108. [Google Scholar] [CrossRef]
  17. Stevens, C.L.; Plew, D.R.; Smith, M.J.; Fredriksson, D.W. Hydrodynamic Forcing of Long-Line Mussel Farms: Observations. J. Waterw. Port Coast. Ocean. Eng. 2007, 133, 192–199. [Google Scholar] [CrossRef]
  18. Raman-Nair, W.; Colbourne, B. Dynamics of a mussel longline system. Aquac. Eng. 2003, 27, 191–212. [Google Scholar] [CrossRef]
  19. Magoon, C.; Vining, R. Introduction to Shellfish Aquaculture in the Puget Sound Region; Washington Department of Natural Resources Handbook: Olympia, WA, USA, 1980. [Google Scholar]
  20. Homziak, J.; Veal, C.D.; Hayes, D. Design and Construction of Aquaculture of Facilities in Dredged Material Containment Area; Technical Report EL-93-11; U.S. Army Engineer Waterways Experiment Station: Vicksburg, MS, USA, 1993. [Google Scholar]
  21. Matsubara, Y.; Noda, H.; Hirao, A. Dynamic Behaviour of the Submerged Buoy-Cable System by Ocean Waves. Coast. Eng. Jpn. 1985, 28, 235–241. [Google Scholar] [CrossRef]
  22. Cheng, W.; Sun, Z.; Liang, S.; Liu, B. Numerical model of an aquaculture structure under oscillatory flow. Aquac. Eng. 2020, 89, 102054. [Google Scholar] [CrossRef]
  23. Feng, D.; Meng, A.; Wang, P.; Yao, Y.; Gui, F. Effect of design configuration on structural response of longline aquaculture in waves. Appl. Ocean Res. 2021, 107, 102489. [Google Scholar] [CrossRef]
  24. Cheng, W.-W.; Xu, Y.-Y.; Mu, P. Experimental and numerical investigation of the dynamic responses of longline aquacultural structures under waves. Ocean Eng. 2023, 276, 114234. [Google Scholar] [CrossRef]
  25. Yao, G.-Q.; Ma, Z.-X.; Ding, B.-C.; Wang, J.-Y. Statistical analysis of annual ultimate values of waves in the Yellow Sea and the Bohai Sea. China Harb. Eng. 1992, 4, 31–37. [Google Scholar]
  26. Zhang, X.-Z.; Kong, Y.-W. Research on offshore significant wave height based on satellite observation data. Technol. Ind. Across Straits 2017, 1, 80–81. [Google Scholar] [CrossRef]
  27. Qiu, W.-B.; Li, G.-Y.; Xu, J.-C.; Hu, Y.-Q.; Wang, Y.-D.; Shi, H.-Y. Spatial and temporal variation characteristics of the waves in the Yellow Sea and Bohai Sea. Mar. Sci. 2021, 45, 1–8. [Google Scholar] [CrossRef]
  28. Kapetsky, J.; Aguilar-Manjarrez, J.; Jenness, J. A Global Assessment of Offshore Mariculture Potential from a Spatial Perspective; FAO Fisheries and Aquaculture Technical Paper NO. 549; Fisheries and Aquaculture Management Division: Rome, Italy, 2013. [Google Scholar]
  29. Ryan, J. Farming the deep blue. In Bord Iascaigh Mhara Technical Report; BIM: Dublin, Ireland, 2004; Available online: http://www.bim.ie/media/bim/content/downloads/Farming,the,Deep,Blue.pdf (accessed on 2 February 2023).
  30. You, X.; Kumazawa, T.; Ito, S.; Hattori, R.; Yu, H.; Shiode, D.; Hu, F. Sediment recognition by warp tension monitoring of bottom otter trawling and applying the self-organizing map algorithm. Ocean Eng. 2021, 236, 109455. [Google Scholar] [CrossRef]
  31. Lin, J.; Li, C.; Zhang, S. Hydrodynamic effect of a large offshore mussel suspended aquaculture farm. Aquaculture 2016, 451, 147–155. [Google Scholar] [CrossRef]
  32. Zhan, J.M.; Jia, X.P.; Li, Y.S.; Sun, M.G.; Guo, G.X.; Hu, Y.Z. Analystical and experimental investigation of drag on nets of fish cages. Aquac. Eng. 2006, 1, 91–101. [Google Scholar] [CrossRef]
  33. Zhao, Y.P.; Bi, C.W.; Dong, G.H.; Gui, F.K.; Cui, Y.; Xu, T.J. Numerical simulation of the flow field inside and around gravity cages. Aquac. Eng. 2013, 52, 1–13. [Google Scholar] [CrossRef]
  34. Bi, C.W.; Zhao, Y.P.; Dong, G.H.; Zheng, Y.X.; Gui, F.K. A numerical analysis on the hydrodynamic characteristics of net cages using coupled fluid–structure interaction model. Aquac. Eng. 2014, 59, 1–12. [Google Scholar] [CrossRef]
  35. Mjåtveit, M.A.; Cheng, H.; Ong, M.C.; Lee, J. Comparative study of circular and square gravity-based fish cages with different dimensions under pure current conditions. Aquac. Eng. 2022, 96, 102223. [Google Scholar] [CrossRef]
  36. Cheng, H.; Li, L.; Ong, M.C. Comparative study of five commonly used gravity type fish cages under pure current conditions. Ocean Eng. 2022, 250, 110977. [Google Scholar] [CrossRef]
Figure 1. Location and image of the investigated longline aquaculture farm with lantern nets at a distance of 6.4 km from Nanhuang Island, Shandong Province, China, and the prototype of the lantern net with eight porous disks (material: rubber) with a diameter of 29 cm.
Fishes 08 00204 g001
Figure 2. Hydrodynamic experiment setup of the lantern net model in the flume tank.
Fishes 08 00204 g002
Figure 3. Schematic of single-row longline aquaculture facility with lantern nets in the current/wave tank.
Fishes 08 00204 g003
Figure 4. (A) Relationship between the drag force and flow velocity of the lantern net model and (B) drag coefficient of the lantern net in the Reynolds number range of 1 × 10⁴–1 × 10⁶.
Fishes 08 00204 g004
Figure 5. Relationship between tension force of mooring line of the longline aquaculture facility model with lantern nets and current velocity.
Fishes 08 00204 g005
Figure 6. (A) Maximum tension of mooring line Fmax of the longline aquaculture facility model with lantern nets in the wave conditions at wave periods of 1.15–2.02 s and wavelengths L of 8.3 and 12.5 cm. (B) Relationship between converted Fmax at full scale of the longline aquaculture facility with lantern nets and the values of H/L from 0.01 to 0.1 (H: wave height) [14].
Fishes 08 00204 g006
Figure 7. Amplitudes of (A) horizontal movement and (B) vertical movement of the Nos. 2, 7, and 13 pairs of buoy and lantern nets in the wave conditions at wave periods of 1.15–2.02 s and wavelengths of 8.3 and 12.5 cm.
Fishes 08 00204 g007
Figure 8. Relationships between (A) Fmax/weight of lantern nets, (B) amplitude of horizontal movement/wave height, (C) amplitude of vertical movement/wave height and h/gT2 (h: water depth, g: acceleration of gravity, T: wave period) [14].
Fishes 08 00204 g008
Figure 9. Relationships between (A) Fmax/weight of lantern nets, (B) amplitude of horizontal movement/wave height, (C) amplitude of vertical movement/wave height and L/Lm (L: wavelength, Lm: length of the main line) [14].
Fishes 08 00204 g009
Table 1. Configurations of prototype and model of longline aquaculture facility with lantern nets.
ComponentsParametersPrototypeModel of 1/12
Lantern netMaterialPolyethylenePolyethylene
Diameter0.29 m2.42 cm
Height1.6 m13.3 cm
Length for each layer0.2 m1.67 cm
Mass of lantern net (weight in water)9 kg27.8 g
Net meshMaterialPolyethylenePolyethylene
Diameter0.002 m0.1 cm
Length0.02 m0.3 cm
Main lineMaterialPolyethylenePolyethylene
Diameter0.026 m0.22 cm
Length100 m833 cm
Mooring lineMaterialPolyethylenePolyethylene
Diameter0.026 m0.22 cm
Length36 m300 cm
BuoyMaterialpolyethylenepolyethylene
Diameter0.2 m5.1 cm
Buoyancy16.5 kgf *9.2 gf *
Tether line 1MaterialPolyethylenePolyethylene
Diameter0.009 m0.05 cm
Length1.8 m15 cm
Tether line 2MaterialPolyethylenePolyethylene
Diameter0.006 m0.08 cm
Length1.2 m10 cm
* kgf: the force for each 1 kg, 1 kgf = 9.806 N; gf: the force for each 1 g, 1 gf = 9.806 × 10⁻³ N.
Table 2. Wave parameters used in the wave experiment.
Wave Height H (m)Periods T (s)Wavelength L (m)
10.0831.152.07
21.443.05
31.733.98
42.024.91
50.1251.443.05
61.733.98
72.024.91
Table 3. Information of the lantern net and buoy of the longline aquaculture facility with lantern nets in the calculation of tension mooring in the current conditions.
ComponentLantern NetBuoy
Projected area3.19 × 10−3 m22.04 × 10−3 m2
Number1517
Drag coefficient0.8 ± 0.10.5
Current velocity (m/s)Inclined angle (deg.)Ratio of submerged volume
0.149100.26
0.223180.29
0.29723.70.32
0.37130.70.35
0.44636.70.38
Disclaimer/Publisher’s Note: The statements, opinions and data contained in all publications are solely those of the individual author(s) and contributor(s) and not of MDPI and/or the editor(s). MDPI and/or the editor(s) disclaim responsibility for any injury to people or property resulting from any ideas, methods, instructions or products referred to in the content.

