Article

Stress Response to Entrainment Flow Speed near Pump Inlet Fish Screens in Two Model Teleost Species, Anguilla anguilla and Oncorhynchus mykiss

1
Department for Innovation in Biological, Agro-Food and Forest Systems, University of Tuscia, Largo dell’Università, 01100 Viterbo, Italy
2
Department of Hydraulic Engineering, Faculty of Civil Engineering and Geosciences, Delft University of Technology, 2628 CN Delft, The Netherlands
3
Department of Civil and Environmental Engineering, University of Michigan, Ann Arbor, MI 48109, USA
4
ATKB, 4181 CD Waardenburg, The Netherlands
*
Author to whom correspondence should be addressed.
Fishes 2023, 8(3), 139; https://doi.org/10.3390/fishes8030139
Submission received: 29 January 2023 / Revised: 24 February 2023 / Accepted: 26 February 2023 / Published: 28 February 2023
(This article belongs to the Special Issue Impacts of Anthropogenic Stressors on Fish Physiology)

Abstract

:
Fish screens are structures associated with pump stations and power plants, that prevent entrainment of fish, but may also be a source of physiological stress, if placed in locations of strong flow speeds that fish are unable to sustain swimming against over time. Herein, the acute response of Anguilla anguilla and Oncorhynchus mykiss to a 30-minute exposure to two water flow regimes was evaluated at the lowest level of the hypothalamus–pituitary–interrenal axis, from blood serum and skin mucus, in a controlled setup presenting a 45° vertically-angled fish screen. Cortisol response was species specific, regardless of the matrix employed. While the flow velocity factor did not describe any variance of eel data, and no statistically significant differences in cortisol concentrations were observed among eel groups, cortisol release in response to flume hydraulics followed a dose-dependent pattern in trout, with a large proportion of the variance described by the model. Mucus cortisol was highly and strongly correlated to serum levels of trout specimens subjected to the strongest flow. Given the established neuromodulatory and molecular roles of cortisol on major fitness-relevant processes, animal welfare implications may be severe, especially considering ever increasing exposure to chronic anthropogenic stressors, resulting in repeated and/or prolonged elevation of circulating glucocorticoids.

1. Introduction

Evidence of global warming is clear across the globe, and far more complex than a mere rise in temperatures, consisting, for instance, in water shortages, increased fire threats, and droughts. The development and establishment of renewables seem to be essential for achieving decarbonization goals in the energy sector: indeed, the EU has plans for a 55% greenhouse gas emissions reduction by 2030, and aspirations of climate neutrality by 2050 [1,2].
Multiple descriptors of the EU Marine Framework Directive survey fish populations, with the aim of achieving a Good Ecological Status (GES) [3]. On the other hand, hydropower infrastructures are known sources of damage to fish: impacts have so far been assessed in terms of severity of injuries (e.g., scale loss, hemorrhages, skin wounds) or mortality, particularly in relation to migration routes and spawning grounds, following turbine entrainment or downstream passage solutions [4,5,6,7]; mathematical modeling has been employed to predict turbine encounter and fish injury/mortality rates caused by hydropower mechanisms, i.e., water pressure change (also known as rapid decompression), cavitation, fluid shear stress (also known as velocity change rate), turbulence, and collision (also referred to as strike or crush) [8,9,10,11,12]; underwater cameras and telemetry have elucidated fish behavior, migration routes, and habitat use in the vicinity of operating hydropower plants, providing science-informed input for the most efficient design of fish-crossing facilities [13,14,15]. Of equal importance, but having received far less attention, the study of animal hormonal status has been almost entirely overlooked. Yet, it is known that fish do respond to stressful stimuli such as confinement, handling, or physical disturbance, and stress levels are paramount for determining animal welfare [16].
Trash racks and fish screens are associated with a variety of structures, such as pump stations, power plants, irrigation systems, and cooling water intakes. They can prevent entrainment of fish, but when placed in locations of strong flow speeds, it is hypothesized that they induce severe physiological stress in fish that attempt to swim away from the screens. Therefore, placement of fish screens or trash racks sufficiently far from pump or turbine intakes is necessary, in order to prevent stress-induced physiological damage to fish, and therefore to help maintain fisheries.
The present study evaluated the physiological acute response of Anguilla anguilla and Oncorhynchus mykiss to a 30-minute exposure to entrainment flow speeds near pump inlet fish screens, at the lowest level of the hypothalamus–pituitary–interrenal axis, from traditional and unconventional biological matrices. The experimental setup included a 45° vertically-angled fish screen, to investigate its influence on fish physiology. Both teleost species are relevant from a biological and an economical perspective. In addition, the catadromous European eel also undergoes a spawning migration from inland European water habitats to the Sargasso Sea, in the mid-north Atlantic Ocean, and is therefore subjected to several threats represented by water management infrastructures; the 90% decrease in abundance of adult specimens at the silver stage in the 1975–2010 timeframe [17], was partly attributed to anthropogenic activities [18].
In light of the increasing efforts to establish hydropower technologies, even from low heads, as well as of importance to diverse research fields related to water management, the main overall objectives of the field tests were: (i) to investigate whether flow speeds, if sustained by fish for a period of time compatible to pump or turbine intake downstream passage, impact the physiology of fish, (ii) to generate knowledge on how far fish screens or trash racks should be installed from intakes in order to prevent physical and physiological consequences, and (iii) to explore the use of an alternative and more convenient biological matrix, sampling-wise, for the quantification of cortisol. To date, only one study has attempted the evaluation of stress levels in fish following simulation of hydropower design and operation [19] and, historically, blood-derived matrices were preferred for cortisol quantification because they reflect actual and prompt cortisol changes.
The relevance of the results presented is two-fold: first, a broadly-applicable approach is described, that considers not only physical damage or mortality experienced by fish, as investigated so far, but also their physiological condition, advancing the knowledge about non-lethal effects of anthropic infrastructures on animal fitness; second, given the established neuromodulatory and molecular impacts of cortisol on major fitness-relevant biological processes, the results provide information about the possible impairment of animal welfare and fisheries, especially on account of ever-increasing exposure to chronic anthropic stressors, resulting in repeated and/or prolonged elevation of circulating glucocorticoids.

2. Materials and Methods

2.1. Desktop Analysis of Fish Swimming Fatigue Curves

The selection of the two flow velocities to be tested per species within the experimental setup was based on fish swimming performance and fatigue curves available on SPOT—Swim Performance Online Tools [20,21]. This tool comprises fish swimming performance fatigue (fixed velocity or swim speed vs. endurance time) and distance (swim distance vs. water velocity) curves, produced by regression analysis of data collected from the literature, ranging in time from 3 seconds to 30 minutes. The two species of interest, i.e., Anguilla anguilla and Oncorhynchus mykiss, were included, for statistical and computational reasons, by the tool authors within the “Eel” and the “Salmon & Walleye” groups, respectively. These groups benefit from the most robust experimental datasets and regressions.
Flow velocities were selected with the aim of testing the physical and physiological impacts of fish screen exposure and water flow. On these grounds, test group 1 (tg1) and tg2 flow velocities were chosen to that they would be be sustained throughout the 30-minute test duration by 50% and 97.5% of 495 mm A. anguilla, or 180 mm O. mykiss populations, respectively, putatively causing the impingement on the fish screen of the remaining 50%, or 2.5% of specimens.

2.2. Experimental Setup

The experiments took place in the open flume of the Civil Engineering and Geoscience Faculty (51°59′49.7″ N–4°22′37.4″ E), Delft University of Technology (The Netherlands), on 17–21 October 2022. The location was scouted considering costs associated with use, license requirement, ethics concerns, and impacts of the trials to natural populations. Figure 1 depicts top and lateral views of the experimental chambers, specifically built for the trials.
The experimental chambers were fabricated from HDPE, embedded in a wooden casing. The internal dimensions of the chambers were 300 cm (length) × 70 cm (height) × 50 cm (width). The front end of the chambers (in flowing water) were closed by wire screens (wire = 0.65 mm; mesh size = 6 × 6 mm) to prevent fish from escaping. At the rear of the chamber, a 45° vertically-angled fish screen (vertical bars = 6 mm; bar spacing = 6 mm) (water flowing out) was installed.
Fish were purchased from the Trout hatchery “De Tipbosch” (O. mykiss), Hellendoorn, and “Koman fish traders” (A. anguilla), Moerdijk, both in the Netherlands, and transported to the test location under controlled conditions. Immediately after delivery, 50 specimens were randomly allocated to each of the test groups (i.e., tg1, tg2, and ctrl) into flow-through aerated dedicated chambers, for recovery and acclimatization purposes. The experiments began after a 24-h acclimatization period and lasted for 30 minutes, during which all specimens of a given group were tested at a single time. The 30-min duration was selected based on the availability of fish swimming fatigue curves (see section above), and knowledge on the downstream passage time of several fish species, including A. anguilla [22,23,24,25]. Details of the test schedules, environmental parameters, and hydraulics conditions are included in Table 1.

2.3. Sample Collection

Following the 30-minute trials, fish specimens were progressively transferred to dedicated anesthetic tanks, containing 120 (A. anguilla) or 50 (O. mykiss) mg L−1 of clove oil (CAS 8000-34-8; Santa Cruz Biotechnology, catalog # sc-214750A), to prevent a cortisol stress response to handling [26]. Importantly, the potentially stressful consequence of the anesthetic bath was controlled for by handling control fish in the same way. In general, control fish were treated (i.e., netting, relocation, handling) exactly as test fish, but were exposed to a 0 m s−1 flow regime. Literature searches [27,28] and preliminary tests were conducted prior to trials, to determine the anesthetic dosage that would induce stage A5 anesthesia (i.e., no movement, loss of responsiveness to tactile stimuli, slow and irregular opercular ventilation) and R5 recovery [29] within 3 minutes of immersion in the anesthetic bath, and 10 minutes of the end of sampling operations. Sampling operations were concluded within 1 minute of reaching stage A5 anesthesia. Clove oil was selected as the anesthetic because: (i) it is a natural product derived from the leaves, buds, and stem of the clove tree Eugenia aromatica; (ii) immersion in a clove oil bath was reported to cause a minimum of pain and distress, and was hence recommended by the European Food Safety Authority for ensuring animal welfare in experimental operations [30]; (iii) it, or its active ingredient, were shown to be as effective as MS-222 in inducing anesthesia in O. mykiss but less persistent in fish tissues [31]; and (iv) cortisol in the two fish species herein employed was not secreted in response to an exposure to clove oil or its active ingredients [32,33,34].
Monitoring of delayed mortality, up to 48 h post-trial, and externally-visible physical injuries caused by the experimental setup, was conducted according to a field-based assessment protocol developed by Mueller et al. [6].
Blood was collected via caudal venipuncture into 2 mL tubes, using 25G and 21G needles on eel (n = 50 per test group) and trout (n = 50 per test group), respectively, paying extreme attention to avoiding hemolysis. Blood was left undisturbed at room temperature (14 °C) for 4 hours. Clots were removed by centrifugation at 2000× g for 10 minutes, and the supernatant was stored at −20 °C until cortisol quantification.
Mucus was collected from the dorso-lateral surface of specimens (n = 25 per test group per species) using disposable cell scrapers (Jetbiofil, catalog # CSC011025), ensuring the lack of contamination with blood, uro/genital, or intestinal excretions. Mucus was diluted 1:5 w:v with sterile PBS, pH 7.2 (Thermo Fisher Scientific, Waltham, MA, USA, catalog # 20012019), vigorously vortexed for 15 seconds, and centrifuged at 2000× g for 10 minutes. The supernatant was stored at −20 °C until cortisol quantification.

2.4. Cortisol Quantification

Endogenic cortisol was quantified from two biological matrices, i.e., serum and mucus, using a commercial competitive enzyme-linked immunosorbent assay kit, specifically validated on teleosts (Fish Cortisol ELISA Kit, detection range 0.0023–10 ng mL−1, catalog # CSB-E08487f, lot # W22064818, CUSABIO TECHNOLOGY LLC), following the manufacturer’s instructions. Briefly, all reagents were brought to 25°C 30 minutes before use. Test samples were diluted, 1:50 v:v (serum) or 1:10 v:v (mucus), with the sample diluent reagent. The cortisol standard was reconstituted with 1 mL of sample diluent, yielding a stock solution of 10 ng mL−1, and six 4-fold dilutions were obtained by mixing 50 μL of serially diluted standards with 150 μL of sample diluent. The sample diluent served as the 0 ng mL−1 standard for curve generation. Reactions were initiated by mixing 50 μL of test samples or standards into individual wells with 50 μL of 1× antibody. Following a gentle linear shake (493 cpm, 60 s), the plate was covered and incubated at 37 °C for 40 minutes, then washed three times with 200 μL of wash buffer. Horseradish peroxidase-conjugate (100 μL) was immediately pipetted into the wells, and the plate was incubated at 37 °C for 30 minutes in the dark. The wash process was replicated five times. Color development was initiated by adding 90 μL of TMB (3,3’,5,5’-Tetramethylbenzidine) substrate to each well, and incubating the plate at 37 °C for exactly 10 minutes. This step was stopped by adding 50 μL of 0.16 M H2SO4 (sulfuric acid); 90 s later, absorbance was measured at 450 nm with a BioTek Epoch 2 microplate spectrophotometer (Agilent Technologies, Inc., Santa Clara, CA, USA), in endpoint mode, with 570 nm wavelength correction. All pipetting steps were performed using a freshly calibrated multichannel pipette (MyPIPETMAN Select Multichannel P8×300, Gilson, catalog # FP10015S). Standards, test samples, and blanks were assayed in duplicate. According to the manufacturer, cross-reactivity of the antibody with analogue steroids was negligible, and accounted for 0% for 17-hydroxyprogesterone and 1% for corticosterone (personal communication by CUSABIO technical support). To this end, absorbance data was modeled as
y = a + b x + c x 2
where y is cortisol concentration in ng mL−1, x is optical density, and a, b, and c are regression coefficients of −0.4039057925, 0.08594757513, and 1.085069259, respectively. Intra-assay precision, calculated on three samples of known concentration, replicated 20 times within a single assay, had a coefficient of variation (CV%) of less than 8%; inter-assay precision, calculated on three samples of known concentration tested in 20 assays, had a CV% of less than 10%. Preliminary validation of test samples was conducted on samples representative of each group and species by serial dilution with the kit buffer, evaluating parallelism and optimal dilution factor, and also considering sample volume availability.

2.5. Data Analyses

Wavelength correction was performed on and background noise was subtracted from 450 nm absorbance data in Microsoft Excel. Cortisol standard curves for each assay were modeled on CurveExpert Basic, v. 2.2.3, using the CurveFinder feature for unconstrained data fitting with linear, nonlinear, and polynomial (degrees 2 to 4) regressions. Models were ranked according to AICC (Akaike information criterion, corrected for low sample sizes) and correlation coefficient, r.
Statistical analyses were conducted in the RStudio environment, R version 4.1.0, using the readxl package for raw data input [35], the tidyverse and broom packages for data manipulation and transformation [36,37], the rstatix package for statistical testing [38], and the ggpubr and ggtext packages for annotated data visualization [39,40].
Normality and homoscedasticity assumptions for conducting parametric tests were verified by means of the Shapiro and Levene tests, and through the inspection of model residuals in normal quantile (QQ) plots. Nonparametric tests were conducted, in cases where the raw or natural log-transformed data did not satisfy the assumptions mentioned above. Fish morphometric data were compared among test groups within species with a one-way ANOVA, either Welch-corrected or traditional. Cortisol concentrations from both matrices were compared among test groups within species, via one-way ANOVA or Kruskal–Wallis H test. Post hoc testing was performed using the Tukey honest significant difference test or the Dunn test, respectively, only in case the main effect was statistically significant (p < 0.05). Cortisol concentrations per test group per species were analyzed as a function of sampling time (i.e., predictor variable), by linear modeling. Serum cortisol concentrations were compared between “early” and “late” samples (see Section 3.4), by means of an unpaired t-test (A. anguilla) or Wilcoxon rank sum test (O. mykiss). The correlation between blood serum and skin mucus cortisol concentrations were analyzed per test group per species using the Spearman’s rank correlation test.

3. Results

3.1. Fish Morphometry

A. anguilla specimens in the tg1, tg2, and ctrl groups had total lengths of 49.48 ± 3.97 (mean ± standard deviation), 49.88 ± 2.67, and 49.54 ± 2.82 cm, and body weights of 266.73 ± 39.81, 271.22 ± 35.14, and 268.59 ± 36.96 gr, respectively.
O. mykiss specimens in the tg1, tg2, and ctrl groups had total lengths of 17.98 ± 0.59, 18.10 ± 0.74, and 18.27 ± 0.60 cm, and body weights of 55.08 ± 5.99, 55.36 ± 6.57, and 55.38 ± 5.18 gr, respectively.
Fish total length (Welch-corrected ANOVA; A. anguilla: F(2, 95.8) = 0.26, p = 0.773; O. mykiss: F(2, 97.1) = 3.13, p = 0.096) and weight (ANOVA; A. anguilla: F(2, 147) = 0.219, p = 1; O. mykiss: F(2, 147) = 0.053, p = 1) per species did not differ significantly among experimental groups.

3.2. Physical Damage

None of the fish employed in the trial showed evident signs of suffering. A 100% survival rate, following the exposure to the different flow regimes, was recorded for both species.
All specimens successfully recovered from stage A5 anesthesia within 10 minutes of the end of sampling operations, showing no signs of long-term effects up to 48 h after the end of experiments.
Negligible physical impacts from the experimental setup were reported. A 0.33% rate of pigment anomaly and fin hemorrhage was recorded in A. anguilla exposed to the strongest flow velocity; no physical damage whatsoever were identified on O. mykiss specimens.

3.3. Cortisol Quantification

Cortisol was quantified in A. anguilla and O. mykiss from traditional (i.e., blood serum) and unconventional (i.e., skin mucus) matrices, using a final sample dilution of 1:50 v:v for both.
Details on the EIA assays are included in Table 2. The relation between cortisol concentration (outcome) and wavelength-corrected absorbance (independent variable) was best modeled by the dose–response Hill equation in all assays conducted, independently of species, test group, or matrix tested. The general form of the Hill equation is:
y = α + θ + x η κ η + x η

3.4. Blood Serum Cortisol Levels

The physiological response to entrainment flow speeds measured in blood serum was species specific.
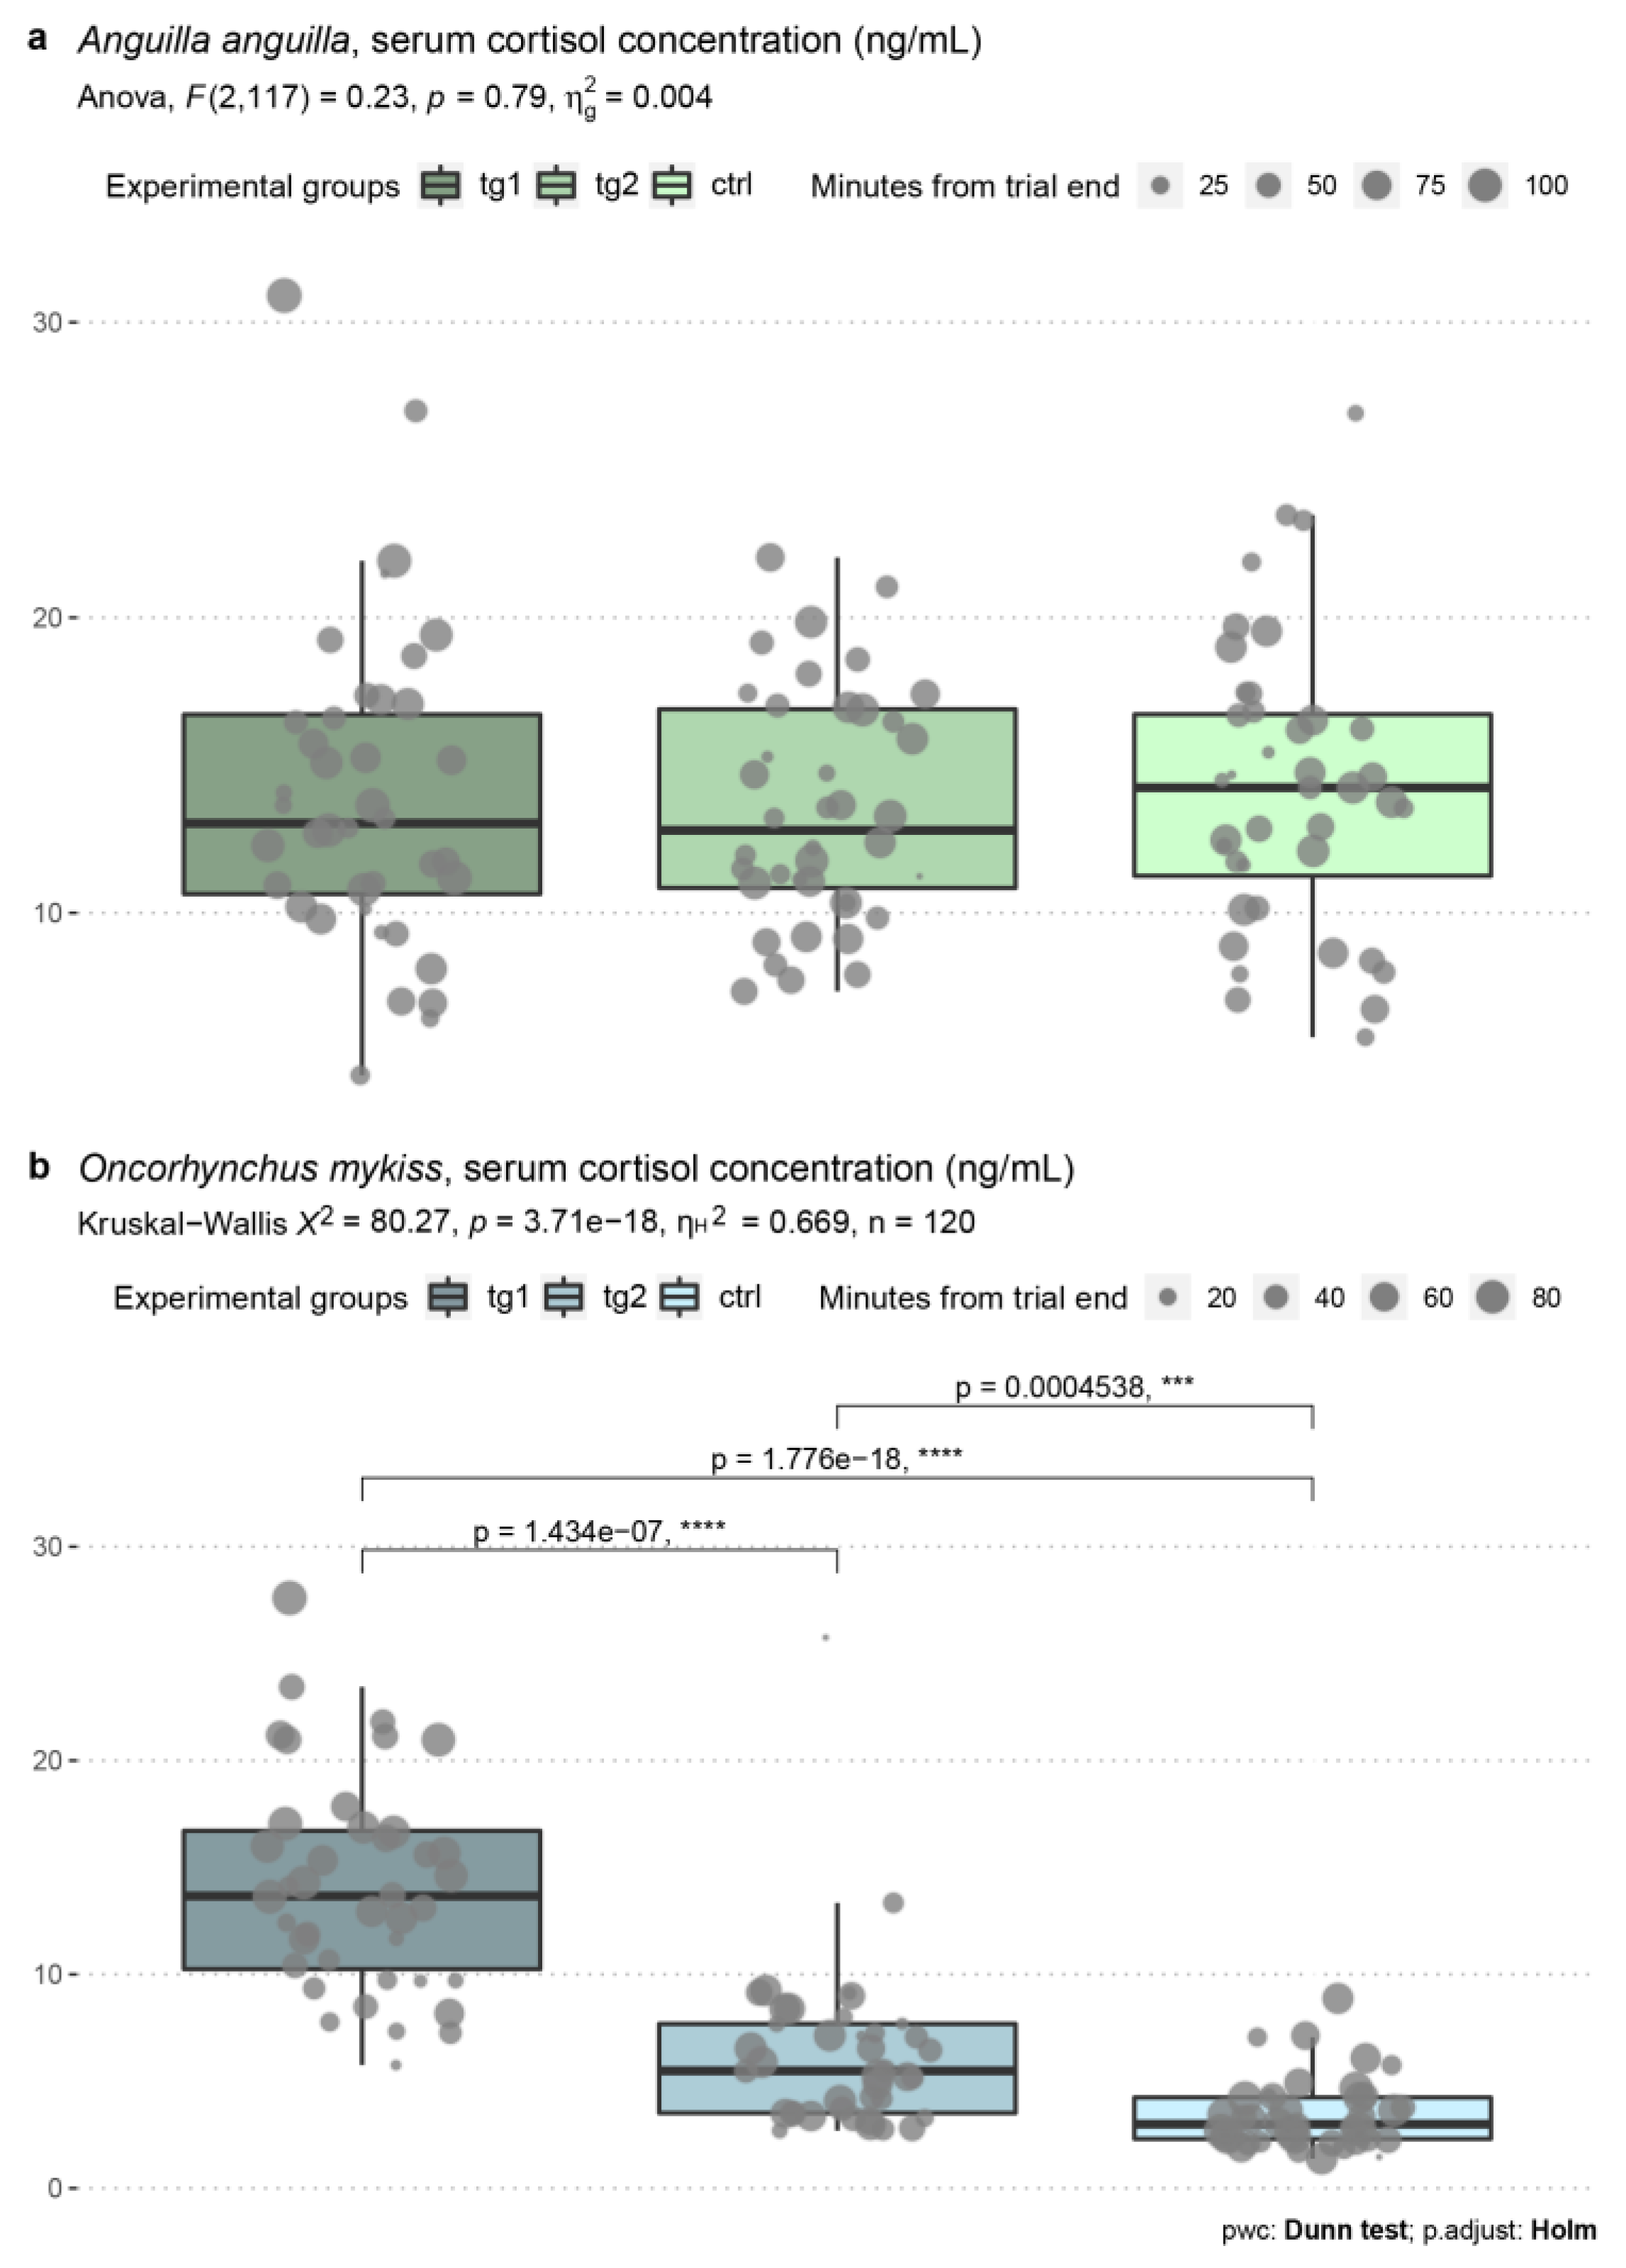
The mean (median; 95% CI) ± standard deviation of cortisol concentration in A. anguilla was 14.0 (13.0; 1.72) ± 5.38 ng mL−1 in tg1, 13.5 (12.8; 1.25) ± 3.92 ng mL−1 in tg2, and 14.2 (14.2; 1.56) ± 4.88 ng mL−1 in the control group (Figure 2a). A one-way ANOVA, conducted to identify the effect of test regimes on serum cortisol levels, returned a nonsignificant main effect of flow velocity on cortisol concentration (F(2,117) = 0.234, p = 0.792), and the predictor variable described 0.4% of the model variance.
The mean (median; 95% CI) ± standard deviation of cortisol concentration in O. mykiss was 14.1 (13.7; 1.60) ± 5.0 ng mL−1 in tg1, 6.31 (5.49; 1.27) ± 3.97 ng mL−1 in tg2, and 3.46 (3.0; 0.53) ± 1.66 ng mL−1 in the control group (Figure 2b). The Kruskal–Wallis H test determined a statistically significant main effect of flow velocity on cortisol concentration (χ2(2) = 80.27, p = 3.71 × 10⁻¹⁸), with the predictor variable describing 66.9% of the model variance. Pairwise comparisons identified strong statistically significant differences among the three experimental groups, and serum cortisol concentration reflected the flume hydraulics proportionally.
All the above-mentioned results refer to the analysis of the first 40 samples, taken within 90 minutes of the end of the trials, and for this reason regarded as “early”.
The entire sample size of n = 50 per experimental group was then considered (i.e., samples were not excluded based on sampling time elapsed from trial end), with the aim of verifying whether sampling time (i.e., minutes elapsed from trial end) influenced serum cortisol concentration. Time, as the predictor variable in linear modeling, was significant for both species (A. anguilla tg1: slope = 0.0649, R2 = 0.142, p = 7 × 10⁻³; tg2: slope = 0.136, R2 = 0.206, p = 9 × 10⁻⁴; O. mykiss ctrl: slope = 0.0646, R2 = 0.298, p = 0), and the relation with cortisol concentration was positive. Serum cortisol concentrations differed significantly between early and late samples for both A. anguilla (unpaired t-test; tg1: t(13.52) = −3.12, p = 1.24 × 10⁻²; tg2: t(9.34) = −3.51, p = 1.24 × 10⁻²; t(13.08) = −3.49, p = 1.18 × 10⁻²) and O. mykiss (Wilcoxon rank sum test; tg1: W = 328, p = 1.98 × 10⁻³; tg2: W = 37, p = 1.62 × 10⁻⁴; ctrl: W = 8, p = 1.02 × 10⁻⁵).

3.5. Skin Mucus Cortisol Levels

The physiological response to entrainment flow speeds measured in skin mucus samples collected within 100 (A. anguilla) and 75 (O. mykiss) minutes of the end of the trials, was also species specific.
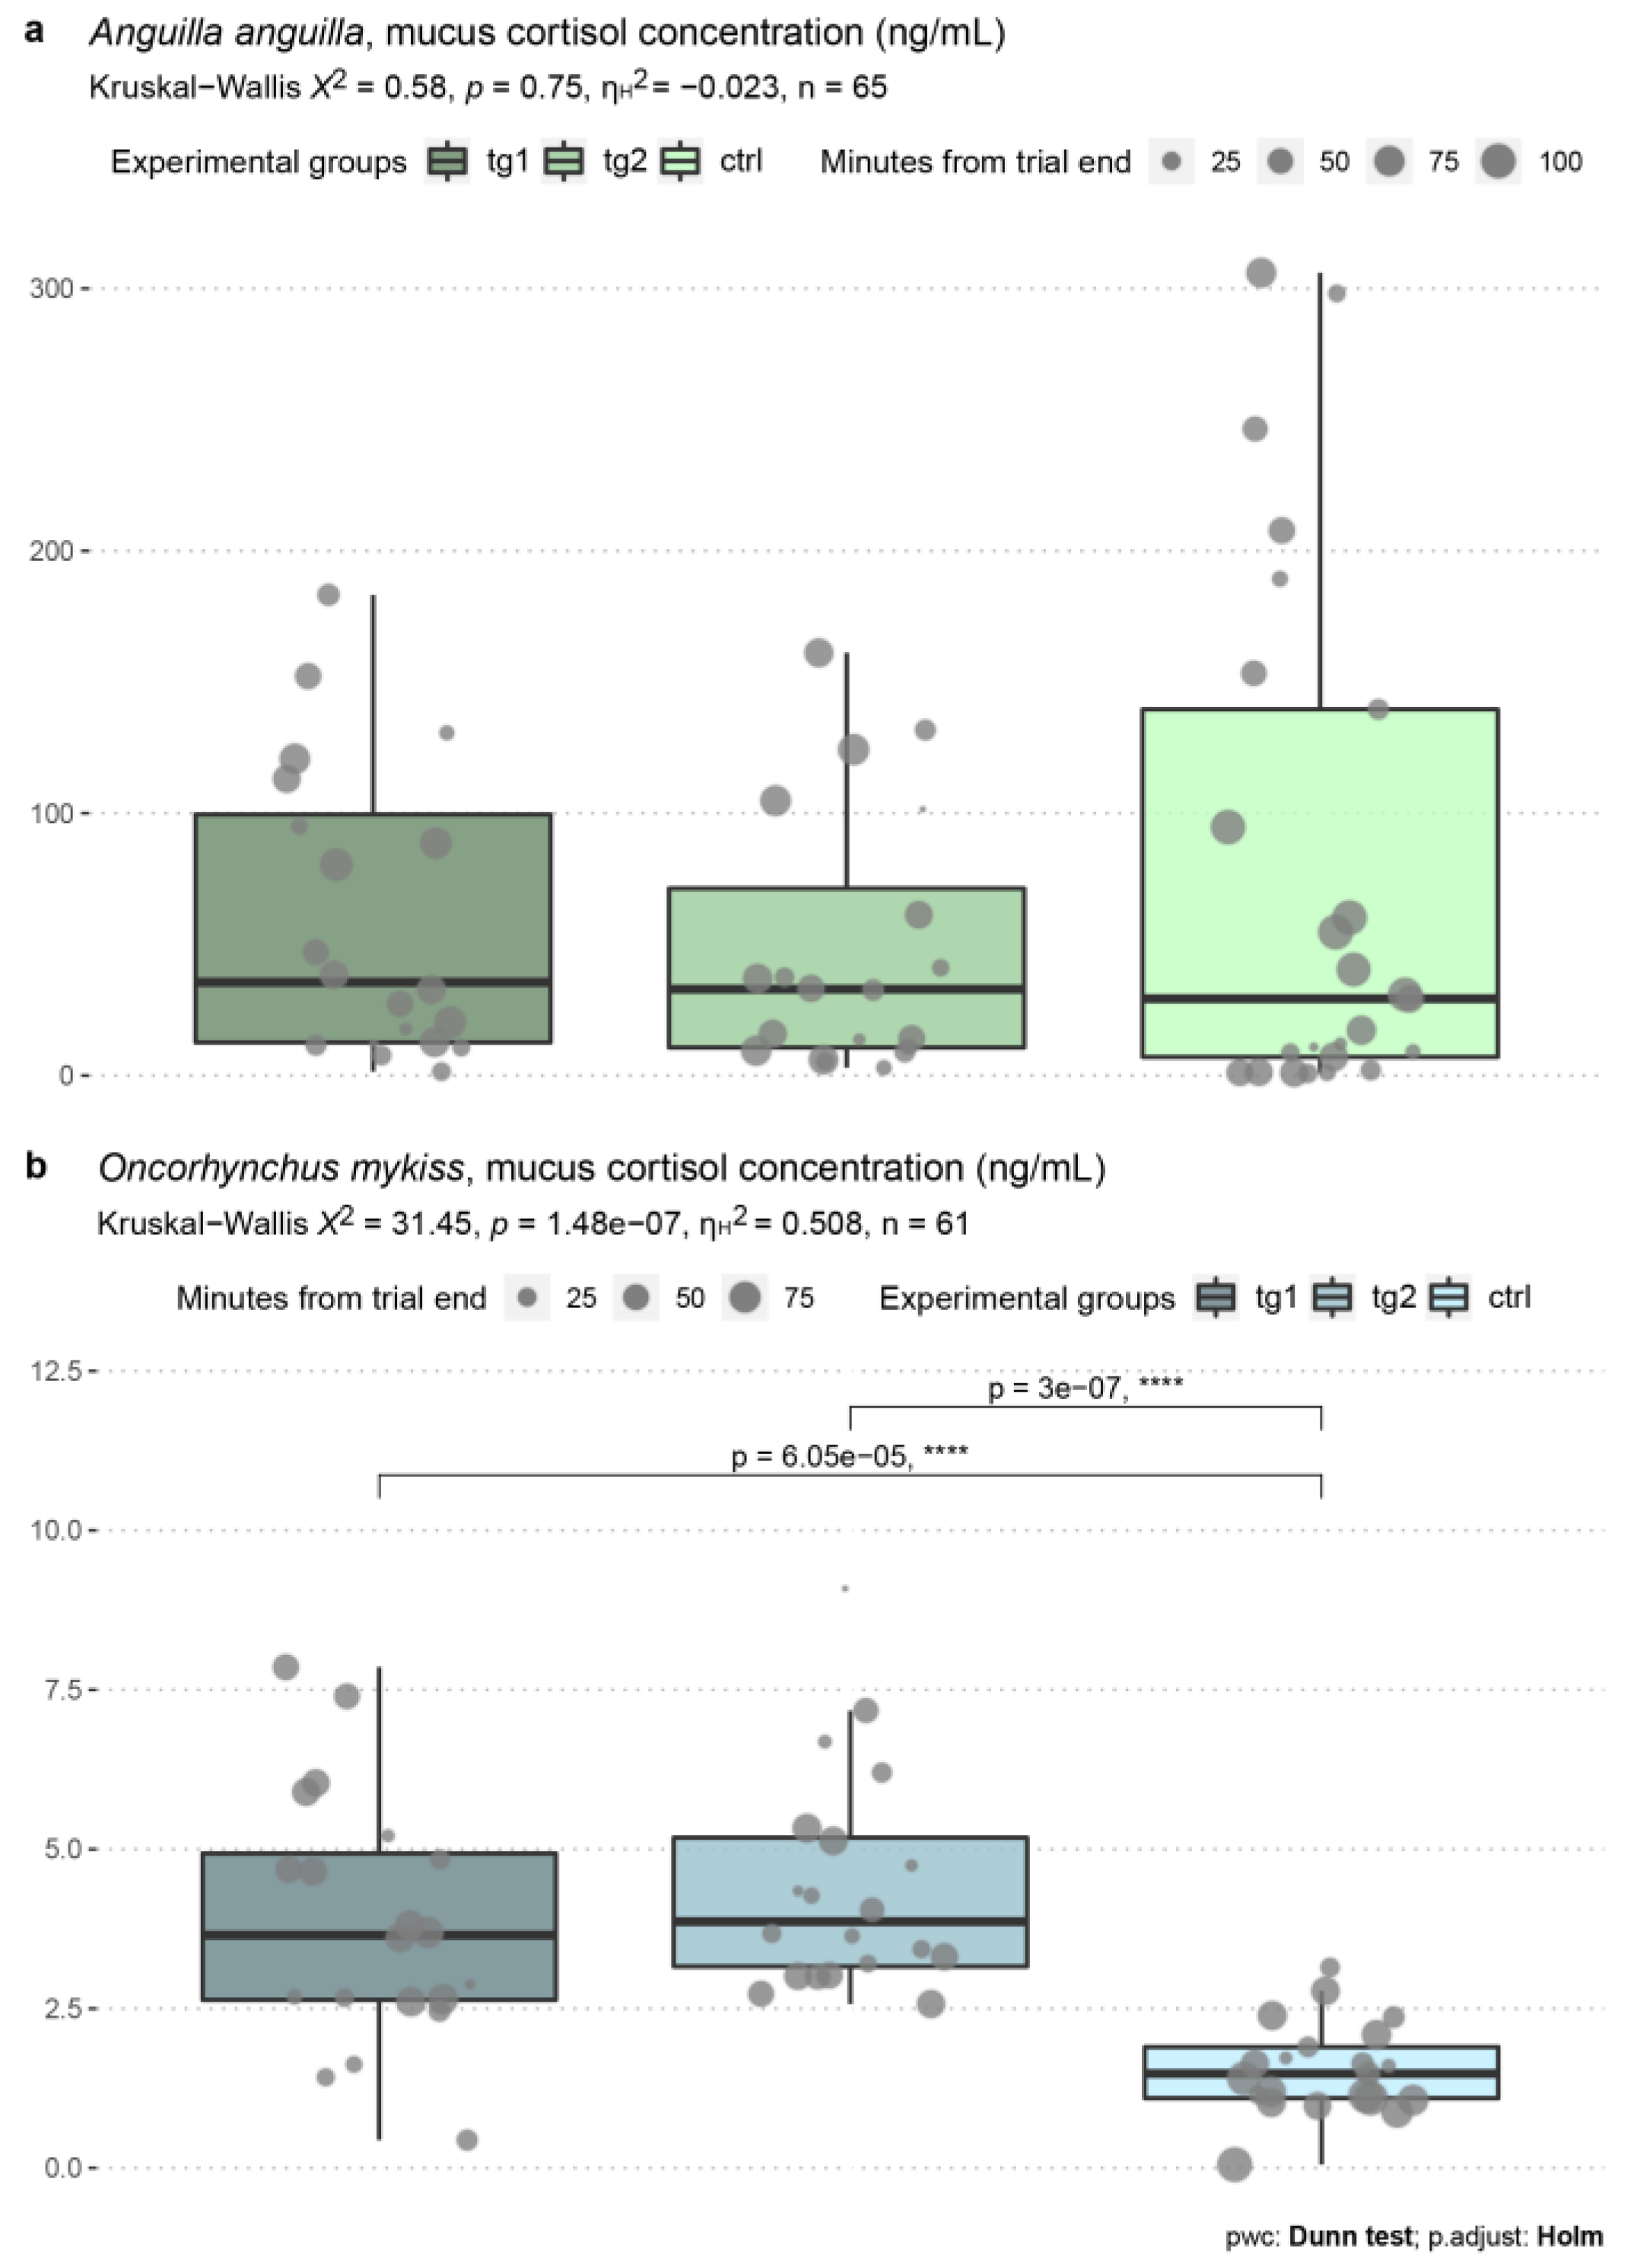
The mean (median; 95% CI) ± standard deviation of cortisol concentration in A. anguilla was 60.2 (35.57; 26.06) ± 55.68 ng mL−1 in tg1, 47.69 (32.93; 23.02) ± 49.18 ng mL−1 in tg2, and 76.95 (29.29; 41.03) ± 99.4 ng mL−1 in the control group (Figure 3a). The main effect of flow velocity was nonsignificant according to a Kruskal–Wallis H test (χ2(2) = 0.57, p = 0.75). The effect size magnitude, calculated as eta squared based on the H-statistic, was small (n = 65).
The mean (median; 95% CI) ± standard deviation of cortisol concentration in O. mykiss was 3.86 (3.65; 0.92) ± 1.96 ng mL−1 in tg1, 4.43 (3.86; 0.81) ± 1.72 ng mL−1 in tg2, and 1.56 (1.48; 0.32) ± 0.71 ng mL−1 in the control group (Figure 3b). The Kruskal–Wallis H test determined a highly significant main effect of flow velocity on cortisol concentration (χ2(2) = 31.45, p = 1.48 × 10⁻⁷), with an effect size of 0.51 (n = 61). Pairwise comparisons using Dunn’s test indicated that skin mucus cortisol concentrations were higher in tg1 (p = 6.05 × 10⁻⁵) and tg2 (p = 3 × 10⁻⁷) than in the control group.

3.6. Blood Serum–Skin Mucus Cortisol Correlation

To validate skin mucus as an alternative biological matrix, i.e., a proxy of blood serum for cortisol quantification, a correlation analysis between the two was conducted.
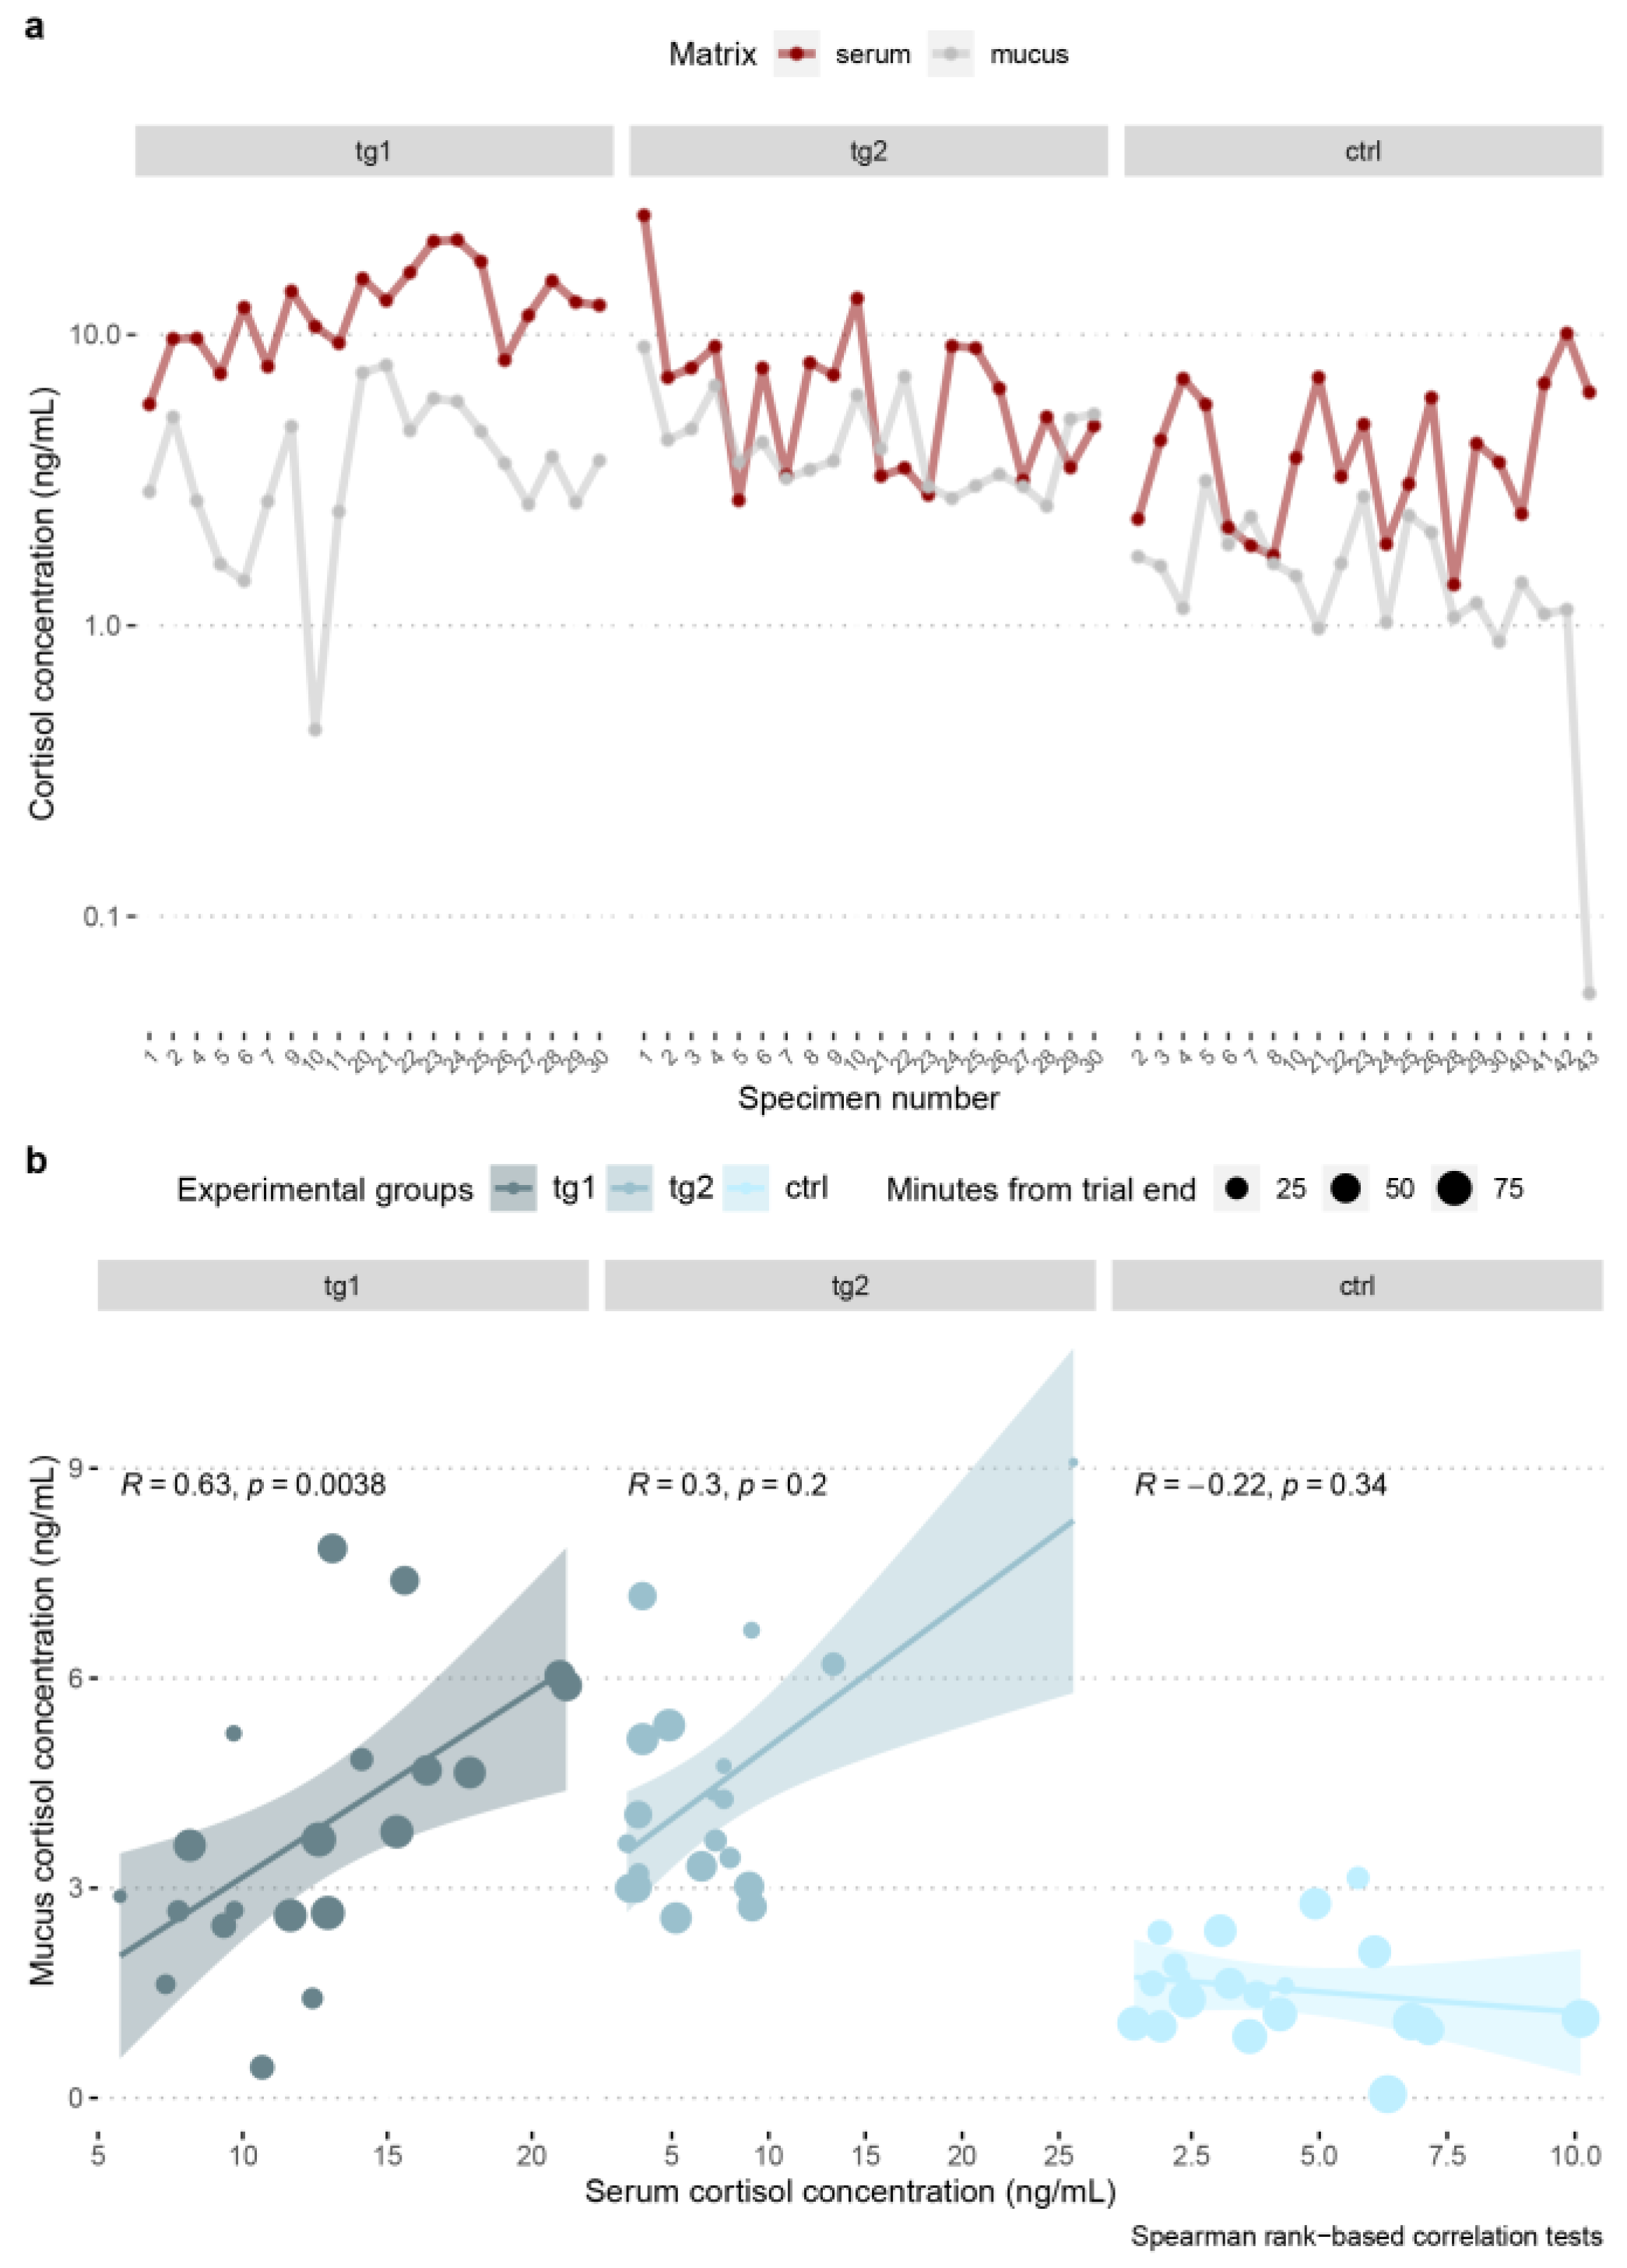
Low coefficients of determination and statistically nonsignificant correlations in cortisol concentrations between A. anguilla matrices were found in all experimental groups, according to the Spearman’s rank-based method (Figure 4a,b, Table 3).
Cortisol quantification in trout skin mucus in test groups 1 and 2, was positively correlated to circulating cortisol concentrations in O. mykiss. Cortisol fluctuations in skin mucus were highly and strongly significantly correlated to those in serum in tg1 (R = 0.63, p = 3.8 × 10⁻³). A negative and nonsignificant correlation between matrices was found in the control condition (Figure 5a,b, Table 3).

4. Discussion

The present study evaluated the physiological response of two teleost species, A. anguilla and O. mykiss, representative of the Anguillidae and Salmonidae families, as a function of the acute exposure to stressors consisting of water flow regimes and fish screens. The nature of this research is clearly an applied one: in addition to hydropower facilities, pumped hydro storage facilities, and cooling water intakes, fish screens are also commonly used in irrigation systems, to divert fish away from pump station diversions. For instance, California’s State Water Project and Central Valley Project supply water for irrigation and drinking, from the freshwater portion of the San Francisco Delta to Southern California, via some of the largest water diverting pump stations in the world, and struggle to manage fish mortality via fish screens and system hydrodynamic manipulations [41]; fish mortality is excessive at irrigation diversions throughout Australia, and requires adoption of practices to reduce entrainment and stress [42]; New Zealand also has the potential to reduce fish mortality by adopting screens, situated so as to minimize stress to fishes [43]. Our results may therefore be highly relevant to screen design and operation, not only from a hydropower perspective.
External impacts caused by the experimental setup were negligible: they accounted for a 0% mortality rate, examined up to 48 (A. anguilla) and 24 h (O. mykiss) post-trial, and extremely low non-lethal injury rates were recorded, in just one of the two species, possibly explainable as pre-existing damage of the two A. anguilla specimens. In addition to immediate mortality, fish were monitored after the end of trials for delayed mortality because, as per preliminary fatigue curves analysis and Black [44], a severe muscular activity was expected for fishes belonging to test group 1. Unsurprisingly, these observations differ from Ben Ammar et al. [45]: in that case, the experimental setup evaluated physical damage in A. anguilla following downstream passage through a bulb turbine, equipped with four adjustable blades rotating at 176.5 rpm. Numerous studies have reported the severe physical injuries caused to Anguilla spp. or salmonid species by well-characterized hydropower mechanisms, especially blade strike: collisions with physical structures of the hydropower plant, either fixed (e.g., stay or guide vanes) or moveable (e.g., turbine blades), are the predominant source of injury and death in fish [46], and result in abrasion, contusions, grinding, striking, fractures, fin amputation, decapitation, eye damage, and scale loss, among other things [9,11,47].
A physiological response was instead enacted. Our data have established baseline cortisol concentrations for two species, relevant to hydropower settings. The basal levels of serum cortisol measured in the two control experimental groups were in line with previous research [48,49,50], confirming that handling and sampling operations did not interfere with fish physiology, and that the analytical methods employed were reliable.
The mounting of a physiological response was demonstrated to be species specific and, only in rainbow trout, resulted in an approximately 4- and 2-fold elevation of circulating cortisol, compared to undisturbed specimens. Neuroendocrinological stress responses are known to differ in magnitude, timing, and severity, both within (e.g., [51]) and across fish species (e.g., [16]). This was suggested to depend on several factors such as genetic differences across taxa determining diverse susceptibility and homeostatic resilience, the life history and life stage of fish, environmental parameters, and the overall physiological condition at the time of testing [52]. A response may be commonly mounted against a given stressor in some species but not in others: for instance, cortisol increased in rainbow trout but not in the European sea bass Dicentrarchus labrax following transport [53]; altered cortisol responses, compared to a reference site, were observed in largemouth bass (Micropterus salmoides), brown bullhead (Ameiurus nebulosus) and logperch (Percina caprodes), but not in white sucker (Catostomus commersonii) and pumpkinseed (Lepomis gibbosus) inhabiting the same stream [54].
It may be argued that the lack of cortisol elevation in the European eel depended on the short duration of the trial. However, cortisol secretion was demonstrated to be induced as early as 30 minutes post-ACTH injection in Anguilla japonica [55], suggesting the prompt responsiveness of the HPI axis in the Anguilla genus. The flow regimes tested herein, which corresponded to 0.5 and 0.3 body length (BL) s−1, were definitely not physically exhaustive, and were likely not stressful to eel. This possibility contradicts the swimming fatigue curves analysis that preceded the field experiments and which flow speeds were based upon, but is supported by findings of Van Ginneken et al. [48]: the authors measured a vast array of physiological data, including cortisol concentration, from 40 cm BL European eels, following 6-hour sustained swimming experiments, in water flows ranging from 0.25 to 3 BL s−1 (i.e., 10–120 cm s−1), and observed no significant differences in any of the parameters up to a swimming speed of 2 BL s−1 (i.e., 80 cm s−1). These results seem to suggest a good tolerance capacity and homeostatic competence in the European eel, both from an energetic and metabolic perspective, against acute (up to 6 hours) stressors, and suggest a revision of the fatigue equations developed by Katopodis and Gervais [21]. It must be remembered, though, that numerous factors affect the swimming capacity of fish, such as water temperature, the fish’s energy stores related to food supply, and the general health status of the fish, in addition to flow velocity.
In light of the absolute lack of physical injuries or mortality, the moderate elevation of serum cortisol concentration, and the dispersion of the data measured in test group 2 of trout, and applying a precautionary principle approach, the maximum flow speed to adopt in the proximity of fish screens for maximizing energy generation by hydropower, while reducing physiological hazard to Anguillidae and Salmonidae populations, should be lower than 0.2 m s−1. Testing additional flow velocities in the 0–0.2 m s−1 range would help in identifying the actual critical limit.
Cortisol is produced by interrenal cells of the head kidney, following the activation of the hypothalamus–pituitary–interrenal neuroendocrine axis. It is the predominant corticosteroid in teleosts [56], and exerts its functions through receptors that are ubiquitously expressed in fish organs/tissues, such as in the liver, gills, intestine, kidney, spleen, heart, skeletal muscles, gonads, leukocytes, and erythrocytes [57]. Cortisol mediates/controls essential biological processes under homeostatic conditions such as aerobic/anaerobic metabolism [58], lipolysis, amino acid metabolism and protein turnover (all reviewed in [59]), osmoregulation [60], food intake [61], growth [62], innate immunity [63,64], and reproduction [65]. However, cortisol is promptly released into the bloodstream within minutes of the perception of a threat and, for this reason, it is classified as the primary neuroendocrine stress response, on which downstream events depend [59]. In view of the contemporary general adaptation syndrome [52], stress-associated physiological changes, also known as secondary responses, are vital as they allow the animal to resist and recover from a stressor; however, should the stressor increase in severity and/or frequency, prolonged cortisol elevation in blood results in tertiary responses that negatively impact processes such as growth, behavior and reproduction, ultimately possibly affecting the health and fitness of a population (e.g., [66,67]).
The measurement of circulating cortisol levels was established as a biomarker of acute stress [68], due to its biological significance: several experimental designs, such as in in vivo/in vitro tests (e.g., [69,70]) or in laboratory/field conditions (e.g., [71]), quantified it, to assess the impacts of a wide variety of environmental (e.g., temperature, pH, O2, and CO2 concentrations) and anthropic stressors (e.g., capture, handling, alternative feeding regimes), within minutes of exposure. Glucocorticoid quantification is also preferred to the investigation of ACTH or catecholamine release because of methodological advantages [72]: measuring cortisol is convenient because teleost-validated commercial assays exist that offer high sensitivity and excellent specificity, without significant cross-reactivity with cortisol analogues.
A huge knowledge gap on the physiological implications of design and operation of hydropower, potentially linkable to additional water management activities, exists in the literature as, to date, patterns of cortisol and glucose response have been evaluated only by Flodmark and co-workers [19], who exposed rainbow trout to 30 min up- and down-ramping protocols both for short- (i.e., 4 and 12 h) and long-terms (i.e., 1 week). Plasma cortisol increased to 60 ng mL−1 two hours after the flow reduction from 190 to 40 L s−1, and stabilized around 15 ng mL−1 after an initial peak of 60 ng mL−1, when the above fluctuation was experienced daily. The authors concluded that the “reduced water level and flow do not pose more than slight discomfort to the fish”. In our opinion, it is possible that the 1–3 year age range of specimens contributed to the large individual variation in cortisol concentration, hampering the possibility of isolating the actual physiological consequences of flow fluctuation alone, and that habituation or exhaustion of the HPI axis cannot be ruled out a priori, since several stress sources, such as electrofishing and fin-clipping, were actually applied within the experimental design. It is also known that chronically-administered stressors disrupt the relationship between cortisol levels and the actual physiological condition of fishes [73,74].
Further knowledge must be generated as to the actual consequences of severe, repeated and/or sustained elevation of circulating glucocorticoids caused by chronic exposure to natural and anthropic stressors. The most recent data, obtained through a combination of in vivo and in vitro methods, demonstrated that chronically elevated levels of cortisol exert metabolism-impairing and growth-suppressing effects on O. mykiss physiology, contributing to decreased condition factor, liposomatic index, food intake, mass gain, liver glycogen, and red blood cell counts; elevated basal oxygen requirement; altered expression of genes involved in food intake regulation; as well as innate and adaptive immunity [75,76,77]. Such consequences are likely to reflect on higher levels of biological organization [78]. As for A. anguilla, taking into account (i) the drastic decrease in branchial aquaporin expression during freshwater-to-saltwater acclimation [79], (ii) the established role of cortisol as a saltwater-adapting hormone for maintaining water and electrolyte balance in marine environments [80], and (iii) the similar aquaporin mRNA downregulation exerted by elevated plasma cortisol [81], an unregulated timing-wise elevation of circulating cortisol concentrations may compromise the successfulness of the species’ reproductive migration. Gathering solid data on the effects of chronic cortisol elevation on the migratory behavior of the species should, then, be prioritized for the definition of solid conservation measures. In general, future perspectives may focus on better understanding the possible relation between prolonged cortisol elevation and additional metabolic or immune consequences in fish.
Despite blood-derived matrices are preferred as they precisely inform on concentration and kinetics of cortisol release, the difficulty and invasiveness associated with blood sampling, as well as the sampling procedure being a source of stress itself, have encouraged the development of quantification methods on alternative matrices, whose collection cause minimum disruption to the animal [53,82]. In this view, in addition to blood serum, skin mucus was collected to assay cortisol and correlate its concentrations between the two matrices, with the underlying hypothesis that lipophilic glucocorticoids diffuse from the blood to the skin mucus in the case of the triggering of the HPI axis. A very low matrix correlation was detected in A. anguilla, while mucus cortisol could be measured and statistically correlated with serum levels in O. mykiss. Cortisol was detected in skin mucus in response to several stressors [53,83,84], but never with regards to screens, and matrix intercorrelation was explored in rainbow trout by Carbajal et al. [82] who, similarly to our results, found a correlation coefficient of 0.7 between plasma and mucus only at the early phase of the response. The lack of correlation between eel matrices was likely due to the fact that cortisol in skin mucus faithfully reflects acute stress responses in fish serum only if a neuroendocrine response is actually enacted [82], which did not appear to be the case in this study. Based on these data, we propose mucus as a validated matrix for investigating recently experienced threats in a non-invasive and easier manner, sampling-wise, for non-experienced hydropower operators.

5. Conclusions

In conclusion, the hormonal responses enacted by eel and trout reflected the distinct susceptibility of the two species to human-imposed stressors. Our work highlights the importance of broadening the spectrum of analyses, from purely external or internal assessment of physical injuries, to the monitoring of hormonal changes, also using non-conventional matrices. Encompassing animal physiology would allow the truthful assessment of non-lethal effects of water management infrastructures on the fitness of natural populations.
For the specific fish species studied, we also found that sustained swimming against flow speeds as low as 20 cm s−1 does result in an elevation of hormonal stress levels, and this should be accounted for in the design and placement of fish screens that prevent entrainment into pumps and turbines. According to the experimental design employed in the present study, we are unable to make recommendations as to the maximum exposure time to screens that would not impact the physiology of fish. It would be broadly beneficial for efficient screen or bypass fishways design if future efforts were made to relate the extent of stress response to time of exposure to a given flow velocity.

Author Contributions

Conceptualization, A.M., F.T.V., G.S. and J.B.; methodology, A.M. and F.T.V.; formal analysis, A.M.; investigation, A.M. and A.D.L.; data curation, A.M. and A.D.L.; writing—original draft preparation, A.M. and G.S.; writing—review and editing, A.D.L., F.T.V., R.M. and J.B.; visualization, A.M.; supervision, F.T.V., R.M. and G.S.; project administration, A.M., R.M. and G.S.; funding acquisition, J.B. All authors have read and agreed to the published version of the manuscript.

Funding

This study was funded by the European Union Horizon 2020 project ALPHEUS (Augmenting grid stability through Low-head Pumped Hydro Energy Utilization and Storage) (http://alpheus-h2020.eu/ (accessed on 24 February 2023), project ID 883553).

Institutional Review Board Statement

Fish manipulation and sampling was performed in strict accordance with Directive 2010/63/EU, by qualified university personnel and ATKB staff. ATKB is licensed to perform animal experiments by the Dutch Ministry of Economic Affairs and Climate policy (license # NVWA/2012/1982). ATKB is holder of project license # AVD2120020209250, issued by the Dutch Central Committee for Animal Experiments, allowing live fish experimentation at pumps and turbines. Both licenses were evaluated as relevant and ethical by the Dutch Animal Experiments Committee with document # “AVD2120020209250 DEC-advies”.

Data Availability Statement

The data presented in this study are available on request from the corresponding author. The data are not publicly available because the ALPHEUS project is ongoing until 31/03/2024.

Acknowledgments

This study was conducted within the framework of the Horizon 2020 “ALPHEUS: Augmenting Grid Stability Through Low Head Pumped Hydro Energy Utilization and Storage” project (www.alpheus-h2020.eu (accessed on 24 February 2023)), whose overall scope is to explore the feasibility of the low head pumped hydro storage (PHS) technology in the North Sea region. This study was supported by the “Departments of Excellence 2018” Program (Dipartimenti di Eccellenza) of the Italian Ministry of Education, University and Research awarded to the DIBAF Department of University of Tuscia.

Conflicts of Interest

The authors declare no conflict of interest.

References

  1. Ruiz, R.A.; De Vilder, L.H.; Prasasti, E.B.; Aouad, M.; De Luca, A.; Geisseler, B.; Terheiden, K.; Scanu, S.; Miccoli, A.; Roeber, V.; et al. Low-Head Pumped Hydro Storage: A Review on Civil Structure Designs, Legal and Environmental Aspects to Make Its Realization Feasible in Seawater. Renew. Sustain. Energy Rev. 2022, 160, 112281. [Google Scholar] [CrossRef]
  2. European Union Commission Delivering the European Green Deal. Available online: https://commission.europa.eu/strategy-and-policy/priorities-2019-2024/european-green-deal/delivering-european-green-deal_en (accessed on 28 January 2023).
  3. European Union Commission. Directive 2008/56/EC of the European Parliament and of the Council of 17 June 2008 Establishing a Framework for Community Action in the Field of Marine Environmental Policy (Marine Strategy Framework Directive. Available online: https://eur-lex.europa.eu/legal-content/EN/TXT/?uri=celex%3A32008L0056 (accessed on 28 January 2023).
  4. Knott, J.; Mueller, M.; Pander, J.; Geist, J. Fish Passage and Injury Risk at a Surface Bypass of a Small-Scale Hydropower Plant. Sustainability 2019, 11, 6037. [Google Scholar] [CrossRef] [Green Version]
  5. Mueller, M.; Sternecker, K.; Milz, S.; Geist, J. Assessing Turbine Passage Effects on Internal Fish Injury and Delayed Mortality Using X-ray Imaging. PeerJ 2020, 8, ee9977. [Google Scholar] [CrossRef] [PubMed]
  6. Mueller, M.; Pander, J.; Geist, J. Evaluation of External Fish Injury Caused by Hydropower Plants Based on a Novel Field-Based Protocol. Fish. Manag. Ecol. 2017, 24, 240–255. [Google Scholar] [CrossRef] [Green Version]
  7. Piper, A.T.; Rosewarne, P.J.; Wright, R.M.; Kemp, P.S. The Impact of an Archimedes Screw Hydropower Turbine on Fish Migration in a Lowland River. Ecol. Eng. 2018, 118, 31–42. [Google Scholar] [CrossRef]
  8. Richmond, M.C.; Serkowski, J.A.; Ebner, L.L.; Sick, M.; Brown, R.S.; Carlson, T.J. Quantifying Barotrauma Risk to Juvenile Fish during Hydro-Turbine Passage. Fish. Res. 2014, 154, 152–164. [Google Scholar] [CrossRef] [Green Version]
  9. Saylor, R.; Sterling, D.; Bevelhimer, M.; Pracheil, B. Within and Among Fish Species Differences in Simulated Turbine Blade Strike Mortality: Limits on the Use of Surrogacy for Untested Species. Water 2020, 12, 701. [Google Scholar] [CrossRef] [Green Version]
  10. Pflugrath, B.D.; Mueller, R.P.; Engbrecht, K.; Colotelo, A.H. American Eel Resilience to Simulated Fluid Shear Associated with Passage through Hydroelectric Turbines. Knowl. Manag. Aquat. Ecosyst. 2021, 422, 20. [Google Scholar] [CrossRef]
  11. Saylor, R.; Fortner, A.; Bevelhimer, M. Quantifying Mortality and Injury Susceptibility for Two Morphologically Disparate Fishes Exposed to Simulated Turbine Blade Strike. Hydrobiologia 2019, 842, 55–75. [Google Scholar] [CrossRef]
  12. Romero-Gomez, P.; Richmond, M.C. Simulating Blade-Strike on Fish Passing through Marine Hydrokinetic Turbines. Renew. Energy 2014, 71, 401–413. [Google Scholar] [CrossRef]
  13. Calles, O.; Olsson, I.C.; Comoglio, C.; Kemp, P.S.; Blunden, L.; Schmitz, M.; Greenberg, L.A. Size-Dependent Mortality of Migratory Silver Eels at a Hydropower Plant, and Implications for Escapement to the Sea. Freshw. Biol. 2010, 55, 2167–2180. [Google Scholar] [CrossRef]
  14. Li, X.; Deng, Z.D.; Brown, R.S.; Fu, T.; Martinez, J.J.; McMichael, G.A.; Skalski, J.R.; Townsend, R.L.; Trumbo, B.A.; Ahmann, M.L.; et al. Migration Depth and Residence Time of Juvenile Salmonids in the Forebays of Hydropower Dams Prior to Passage through Turbines or Juvenile Bypass Systems: Implications for Turbine-Passage Survival. Conserv. Physiol. 2015, 3, cou064. [Google Scholar] [CrossRef] [PubMed]
  15. Jansen, H.M.; Winter, H.V.; Bruijs, M.C.M.; Polman, H.J.G. Just Go with the Flow? Route Selection and Mortality during Downstream Migration of Silver Eels in Relation to River Discharge. ICES J. Mar. Sci. 2007, 64, 1437–1443. [Google Scholar] [CrossRef]
  16. Barton, B.A. Stress in Fishes: A Diversity of Responses with Particular Reference to Changes in Circulating Corticosteroids. Integr. Comp. Biol. 2002, 42, 517–525. [Google Scholar] [CrossRef]
  17. Bevacqua, D.; Melià, P.; Gatto, M.; De Leo, G.A. A Global Viability Assessment of the European Eel. Glob. Chang. Biol. 2015, 21, 3323–3335. [Google Scholar] [CrossRef]
  18. Piper, A.T.; Wright, R.M.; Walker, A.M.; Kemp, P.S. Escapement, Route Choice, Barrier Passage and Entrainment of Seaward Migrating European Eel, Anguilla anguilla, within a Highly Regulated Lowland River. Ecol. Eng. 2013, 57, 88–96. [Google Scholar] [CrossRef] [Green Version]
  19. Flodmark, L.E.W.; Urke, H.A.; Halleraker, J.H.; Arnekleiv, J.V.; Vøllestad, L.A.; Poléo, A.B.S. Cortisol and Glucose Responses in Juvenile Brown Trout Subjected to a Fluctuating Flow Regime in an Artificial Stream. J. Fish Biol. 2002, 60, 238–248. [Google Scholar] [CrossRef]
  20. Di Rocco, R.; Gervais, R. SPOT: Swim Performance Online Tools. Available online: http://www.fishprotectiontools.ca/ (accessed on 28 January 2023).
  21. Katopodis, C.; Gervais, R. Fish Swimming Performance Database and Analyses; DFO Can. Sci. Advis. Sec. Res. Doc. 2016/002., 550. Available online: http://www.dfo-mpo.gc.ca/csas-sccs/Publications/ResDocs-DocRech/2016/2016_002-eng.html (accessed on 28 January 2023).
  22. Scruton, D.A.; Pennell, C.J.; Robertson, M.J.; Clarke, K.D.; Eddy, W.; McKinley, R.S. Telemetry Studies of the Passage Route and Entrainment of Downstream Migrating Wild Atlantic Salmon (Salmo salar) Smolts at Two Hydroelectric Installations on the Exploits River, Newfoundland, Canada. Aquat. Telem. Adv. Appl. Proc. Fifth Conf. Fish Telem. 2005, 91–101. [Google Scholar]
  23. Calles, O.; Elghagen, J.; Nyqvist, D.; Harbicht, A.; Nilsson, P.A. Efficient and Timely Downstream Passage Solutions for European Silver Eels at Hydropower Dams. Ecol. Eng. 2021, 170, 106350. [Google Scholar] [CrossRef]
  24. Sanz-Ronda, F.J.; Fuentes-Pérez, J.F.; García-Vega, A.; Bravo-Córdoba, F.J. Fishways as Downstream Routes in Small Hydropower Plants: Experiences with a Potamodromous Cyprinid. Water 2021, 13, 1041. [Google Scholar] [CrossRef]
  25. Peter, A.; Schoelzel, N.; Wilmsmeier, L.; Albayrak, I.; Bravo-Córdoba, F.J.; García-Vega, A.; Fuentes-Pérez, J.F.; Valbuena-Castro, J.; Carazo-Cea, O.; Escudero-Ortega, C.; et al. The Attractiveness of Fishways and Bypass Facilities. In Novel Developments for Sustainable Hydropower; Springer: Cham, Switzerland, 2022. [Google Scholar]
  26. Olsen, Y.A.; Einarsdottir, I.E.; Nilssen, K.J. Metomidate Anaesthesia in Atlantic Salmon, Salmo salar, Prevents Plasma Cortisol Increase during Stress. Aquaculture 1995, 134, 155–168. [Google Scholar] [CrossRef]
  27. Priborsky, J.; Velisek, J. A Review of Three Commonly Used Fish Anesthetics. Rev. Fish. Sci. Aquac. 2018, 26, 417–442. [Google Scholar] [CrossRef]
  28. Javahery, S.; Nekoubin, H.; Moradlu, A.H. Effect of Anaesthesia with Clove Oil in Fish (Review). Fish Physiol. Biochem. 2012, 38, 1545–1552. [Google Scholar] [CrossRef] [PubMed]
  29. Mylonas, C.C.; Cardinaletti, G.; Sigelaki, I.; Polzonetti-Magni, A. Comparative Efficacy of Clove Oil and 2-Phenoxyethanol as Anesthetics in the Aquaculture of European Sea Bass (Dicentrarchus labrax) and Gilthead Sea Bream (Sparus aurata) at Different Temperatures. Aquaculture 2005, 246, 467–481. [Google Scholar] [CrossRef]
  30. Panel, A. Opinion of the Scientific Panel on Animal Health and Welfare (AHAW) on a Request from the Commission Related to the Aspects of the Biology and Welfare of Animals Used for Experimental and Other Scientific Purposes. EFSA J. 2005, 3, 292. [Google Scholar] [CrossRef]
  31. Anderson, W.G.; McKinley, R.S.; Colavecchia, M. The Use of Clove Oil as an Anesthetic for Rainbow Trout and Its Effects on Swimming Performance. North Am. J. Fish. Manag. 1997, 17, 301–307. [Google Scholar] [CrossRef]
  32. King, V.W.; Hooper, B.; Hillsgrove, S.; Benton, C.; Berlinsky, D.L. The Use of Clove Oil, Metomidate, Tricaine Methanesulphonate and 2-Phenoxyethanol for Inducing Anaesthesia and Their Effect on the Cortisol Stress Response in Black Sea Bass (Centropristis striata L.). Aquac. Res. 2005, 36, 1442–1449. [Google Scholar] [CrossRef]
  33. Iversen, M.H.; Økland, F.; Thorstad, E.B.; Finstad, B. The Efficacy of Aqui-S Vet. (Iso-Eugenol) and Metomidate as Anaesthetics in European Eel (Anguilla anguilla L.), and Their Effects on Animal Welfare and Primary and Secondary Stress Responses. Aquac. Res. 2013, 44, 1307–1316. [Google Scholar] [CrossRef]
  34. Renault, S.; Daverat, F.; Pierron, F.; Gonzalez, P.; Dufour, S.; Lanceleur, L.; Schäfer, J.; Baudrimont, M. The Use of Eugenol and Electro-Narcosis as Anaesthetics: Transcriptional Impacts on the European Eel (Anguilla anguilla L.). Ecotoxicol. Environ. Saf. 2011, 74, 1573–1577. [Google Scholar] [CrossRef]
  35. Wickham, H.; Bryan, J. Readxl: Read Excel Files, R Package Version 1.3.1. 2019. Available online: https://readxl.tidyverse.org/ (accessed on 28 January 2023).
  36. Wickham, H.; Averick, M.; Bryan, J.; Chang, W.; McGowan, L.; François, R.; Grolemund, G.; Hayes, A.; Henry, L.; Hester, J.; et al. Welcome to the Tidyverse. J. Open Source Softw. 2019, 4, 1686. [Google Scholar] [CrossRef] [Green Version]
  37. Robinson, D.; Hayes, A.; Couch, S. Broom: Convert Statistical Objects into Tidy Tibbles, R Package Version 0.7.11. 2022. Available online: https://broom.tidymodels.org/ (accessed on 28 January 2023).
  38. Kassambara, A. Rstatix: Pipe-Friendly Framework for Basic Statistical Tests, R Package Version 0.7.0. 2021. Available online: https://cran.r-project.org/web/packages/rstatix/index.html (accessed on 28 January 2023).
  39. Kassambara, A. Ggpubr: “ggplot2” Based Publication Ready Plots, R Package Version 0.4.0. 2022. Available online: https://cran.r-project.org/web/packages/ggpubr/index.html (accessed on 28 January 2023).
  40. Wilke, C.O.; Wiernik, B.M. Ggtext: Improved Text Rendering Support for “Ggplot2”, R Package Version 0.1.2. 2022. Available online: https://cran.r-project.org/web/packages/ggtext/index.html (accessed on 28 January 2023).
  41. Grimaldo, L.F.; Sommer, T.; Van Ark, N.; Jones, G.; Holland, E.; Moyle, P.B.; Herbold, B.; Smith, P. Factors Affecting Fish Entrainment into Massive Water Diversions in a Tidal Freshwater Estuary: Can Fish Losses Be Managed? N. Am. J. Fish. Manag. 2009, 29, 1253–1270. [Google Scholar] [CrossRef] [Green Version]
  42. Boys, C.A.; Rayner, T.S.; Baumgartner, L.J.; Doyle, K.E. Native Fish Losses Due to Water Extraction in Australian Rivers: Evidence, Impacts and a Solution in Modern Fish- and Farm-friendly Screens. Ecol. Manag. Restor. 2021, 22, 134–144. [Google Scholar] [CrossRef]
  43. Unwin, M.J.; Webb, M.; Barker, R.J.; Link, W.A. Quantifying Production of Salmon Fry in an Unscreened Irrigation System: A Case Study on the Rangitata River, New Zealand. North Am. J. Fish. Manag. 2005, 25, 619–634. [Google Scholar] [CrossRef]
  44. Black, E.C. Hyperactivity as a Lethal Factor in Fish. J. Fish. Res. Board Can. 1958, 15, 573–586. [Google Scholar] [CrossRef]
  45. Ben Ammar, I.; Cornet, V.; Houndji, A.; Baekelandt, S.; Antipine, S.; Sonny, D.; Mandiki, S.N.M.; Kestemont, P. Impact of Downstream Passage through Hydropower Plants on the Physiological and Health Status of a Critically Endangered Species: The European Eel Anguilla anguilla. Comp. Biochem. Physiol. Part A Mol. Integr. Physiol. 2021, 254, 110876. [Google Scholar] [CrossRef]
  46. Pracheil, B.M.; DeRolph, C.R.; Schramm, M.P.; Bevelhimer, M.S. A Fish-Eye View of Riverine Hydropower Systems: The Current Understanding of the Biological Response to Turbine Passage. Rev. Fish Biol. Fish. 2016, 26, 153–167. [Google Scholar] [CrossRef]
  47. Bevelhimer, M.S.; Pracheil, B.M.; Fortner, A.M.; Saylor, R.; Deck, K.L. Mortality and Injury Assessment for Three Species of Fish Exposed to Simulated Turbine Blade Strike. Can. J. Fish. Aquat. Sci. 2019, 76, 2350–2363. [Google Scholar] [CrossRef]
  48. Van Ginneken, V.J.T.; Balm, P.; Sommandas, V.; Onderwater, M.; Van Den Thillart, G. Acute Stress Syndrome of the Yellow European Eel (Anguilla anguilla Linnaeus) When Exposed to a Graded Swimming-Load. Neth. J. Zool. 2002, 52, 29–42. [Google Scholar] [CrossRef] [Green Version]
  49. Pickering, A.D.; Pottinger, T.G. Stress Responses and Disease Resistance in Salmonid Fish: Effects of Chronic Elevation of Plasma Cortisol. Fish Physiol. Biochem. 1989, 7, 253–258. [Google Scholar] [CrossRef]
  50. Barton, B.A. Salmonid Fishes Differ in Their Cortisol and Glucose Responses to Handling and Transport Stress. N. Am. J. Aquac. 2000, 62, 12–18. [Google Scholar] [CrossRef]
  51. Samaras, A.; Dimitroglou, A.; Sarropoulou, E.; Papaharisis, L.; Kottaras, L.; Pavlidis, M. Repeatability of Cortisol Stress Response in the European Sea Bass (Dicentrarchus labrax) and Transcription Differences between Individuals with Divergent Responses. Sci. Rep. 2016, 6, 34858. [Google Scholar] [CrossRef] [PubMed] [Green Version]
  52. Schreck, C.B.; Tort, L. The Concept of Stress in Fish; Elsevier Inc.: Amsterdam, The Netherlands, 2016; Volume 35, ISBN 9780128027288. [Google Scholar]
  53. Bertotto, D.; Poltronieri, C.; Negrato, E.; Majolini, D.; Radaelli, G.; Simontacchi, C. Alternative Matrices for Cortisol Measurement in Fish. Aquac. Res. 2010, 41, 1261–1267. [Google Scholar] [CrossRef]
  54. King, G.D.; Chapman, J.M.; Cooke, S.J.; Suski, C.D. Stress in the Neighborhood: Tissue Glucocorticoids Relative to Stream Quality for Five Species of Fish. Sci. Total Environ. 2016, 547, 87–94. [Google Scholar] [CrossRef] [PubMed] [Green Version]
  55. Li, Y.Y.; Inoue, K.; Takei, Y. Steroidogenic Acute Regulatory Protein in Eels: CDNA Cloning and Effects of ACTH and Seawater Transfer on Its mRNA Expression. Zool. Sci. 2003, 20, 211–219. [Google Scholar] [CrossRef] [Green Version]
  56. Donaldson, E.M. The Pituitary-Interrenal Axis as an Indicator of Stress in Fish. In Stress and Fish; Pickering, A.D., Ed.; Academic Press: London, UK, 1981; pp. 11–47. [Google Scholar]
  57. Bernier, N.J.; Flik, G.; Klaren, P.H.M. Regulation and Contribution of Corticotropic, Melanotropic and Thyrotropic Axes to The Stress Response in Fishes. In Fish Physiology; Bernier, N.J., Van Der Kraak, G., Farrell, A., Brauner, C.J., Eds.; Elsevier B.V.: Amsterdam, The Netherlands, 2009; ISBN 978-0-12-374631-3. [Google Scholar]
  58. Wendelaar Bonga, S.E. The Stress Response in Fish. Physiol. Rev. 1997, 77, 591–625. [Google Scholar] [CrossRef]
  59. Mommsen, T.P.; Vijayan, M.M.; Moon, T.W. Cortisol in Teleosts: Dynamics, Mechanisms of Action, and Metabolic Regulation. Rev. Fish Biol. Fish. 1999, 9, 211–268. [Google Scholar] [CrossRef]
  60. McCormick, S.D. Endocrine Control of Osmoregulation in Teleost Fish. Am. Zool. 2001, 41, 781–794. [Google Scholar] [CrossRef] [Green Version]
  61. Bernier, N.J. The Corticotropin-Releasing Factor System as a Mediator of the Appetite-Suppressing Effects of Stress in Fish. Gen. Comp. Endocrinol. 2006, 146, 45–55. [Google Scholar] [CrossRef]
  62. Chang, J.P.; Wong, A.O.L. Growth Hormone Regulation in Fish. In Fish Physiology; Bernier, N.J., Van Der Kraak, G., Farrell, A., Brauner, C.J., Eds.; Elsevier B.V.: Amsterdam, The Netherlands, 2009. [Google Scholar]
  63. Harris, J.; Bird, D.J. Modulation of the Fish Immune System by Hormones. Vet. Immunol. Immunopathol. 2000, 77, 163–176. [Google Scholar] [CrossRef]
  64. Vizzini, A.; Vazzana, M.; Cammarata, M.; Parrinello, N. Peritoneal Cavity Phagocytes from the Teleost Sea Bass Express a Glucocorticoid Receptor (Cloned and Sequenced) Involved in Genomic Modulation of the in vitro Chemiluminescence Response to Zymosan. Gen. Comp. Endocrinol. 2007, 150, 114–123. [Google Scholar] [CrossRef]
  65. Sen Huang, Y.; Rousseau, K.; Sbaihi, M.; Le Belle, N.; Schmitz, M.; Dufour, S. Cortisol Selectively Stimulates Pituitary Gonadotropin β-Subunit in a Primitive Teleost, Anguilla Anguilla. Endocrinology 1999, 140, 1228–1235. [Google Scholar] [CrossRef] [PubMed]
  66. Uren Webster, T.M.; Rodriguez-Barreto, D.; Martin, S.A.M.; Van Oosterhout, C.; Orozco-terWengel, P.; Cable, J.; Hamilton, A.; Garcia De Leaniz, C.; Consuegra, S. Contrasting Effects of Acute and Chronic Stress on the Transcriptome, Epigenome, and Immune Response of Atlantic Salmon. Epigenetics 2018, 13, 1191–1207. [Google Scholar] [CrossRef] [PubMed] [Green Version]
  67. Uren Webster, T.M.; Rodriguez-Barreto, D.; Consuegra, S.; Garcia de Leaniz, C. Cortisol-Related Signatures of Stress in the Fish Microbiome. Front. Microbiol. 2020, 11, 1621. [Google Scholar] [CrossRef] [PubMed]
  68. Sadoul, B.; Geffroy, B. Measuring Cortisol, the Major Stress Hormone in Fishes. J. Fish Biol. 2019, 94, 540–555. [Google Scholar] [CrossRef] [PubMed] [Green Version]
  69. Madaro, A.; Nilsson, J.; Whatmore, P.; Roh, H.J.; Grove, S.; Stien, L.H.; Olsen, R.E. Acute Stress Response on Atlantic Salmon: A Time-Course Study of the Effects on Plasma Metabolites, Mucus Cortisol Levels, and Head Kidney Transcriptome Profile. Fish Physiol. Biochem. 2022, 49, 97–116. [Google Scholar] [CrossRef]
  70. Samaras, A.; Pavlidis, M. Fish Scales Produce Cortisol upon Stimulation with ACTH. Animals 2022, 12, 3510. [Google Scholar] [CrossRef] [PubMed]
  71. Vercauteren, M.; Ampe, B.; Devriese, L.; Moons, C.P.H.; Decostere, A.; Aerts, J.; Chiers, K. Explorative Study on Scale Cortisol Accumulation in Wild Caught Common Dab (Limanda limanda). BMC Vet. Res. 2022, 18, 324. [Google Scholar] [CrossRef]
  72. Ellis, T.; Yildiz, H.Y.; López-Olmeda, J.; Spedicato, M.T.; Tort, L.; Øverli, Ø.; Martins, C.I.M. Cortisol and Finfish Welfare. Fish Physiol. Biochem. 2012, 38, 163–188. [Google Scholar] [CrossRef]
  73. Madaro, A.; Olsen, R.E.; Kristiansen, T.S.; Ebbesson, L.O.E.; Nilsen, T.O.; Flik, G.; Gorissen, M. Stress in Atlantic Salmon: Response to Unpredictable Chronic Stress. J. Exp. Biol. 2015, 218, 2538–2550. [Google Scholar] [CrossRef] [Green Version]
  74. Laberge, F.; Yin-Liao, I.; Bernier, N.J. Temporal Profiles of Cortisol Accumulation and Clearance Support Scale Cortisol Content as an Indicator of Chronic Stress in Fish. Conserv. Physiol. 2019, 7, coz052. [Google Scholar] [CrossRef] [Green Version]
  75. Pfalzgraff, T.; Lund, I.; Skov, P.V. Prolonged Cortisol Elevation Alters Whole Body and Tissue Metabolism in Rainbow Trout (Oncorhynchus mykiss). Comp. Biochem. Physiol.-Part A Mol. Integr. Physiol. 2022, 263, 111098. [Google Scholar] [CrossRef] [PubMed]
  76. Madison, B.N.; Tavakoli, S.; Kramer, S.; Bernier, N.J. Chronic Cortisol and the Regulation of Food Intake and the Endocrine Growth Axis in Rainbow Trout. J. Endocrinol. 2015, 226, 103–119. [Google Scholar] [CrossRef] [PubMed] [Green Version]
  77. Shepherd, B.S.; Spear, A.R.; Philip, A.M.; Leaman, D.W.; Stepien, C.A.; Sepulveda-Villet, O.J.; Palmquist, D.E.; Vijayan, M.M. Effects of Cortisol and Lipopolysaccharide on Expression of Select Growth-, Stress- and Immune-Related Genes in Rainbow Trout Liver. Fish Shellfish Immunol. 2018, 74, 410–418. [Google Scholar] [CrossRef] [PubMed]
  78. Pankhurst, N.W. The Endocrinology of Stress in Fish: An Environmental Perspective. Gen. Comp. Endocrinol. 2011, 170, 265–275. [Google Scholar] [CrossRef] [Green Version]
  79. Cutler, C.P.; Cramb, G. Branchial Expression of an Aquaporin 3 (AQP-3) Homologue Is Downregulated in the European Eel Anguilla anguilla Following Seawater Acclimation. J. Exp. Biol. 2002, 205, 2643–2651. [Google Scholar] [CrossRef]
  80. Cao, Q.; Gu, J.; Wang, D.; Liang, F.; Zhang, H.; Li, X.; Yin, S. Physiological Mechanism of Osmoregulatory Adaptation in Anguillid Eels. Fish Physiol. Biochem. 2018, 44, 423–433. [Google Scholar] [CrossRef] [Green Version]
  81. Cutler, C.P.; Phillips, C.; Hazon, N.; Cramb, G. Cortisol Regulates Eel (Anguilla anguilla) Aquaporin 3 (AQP3) mRNA Expression Levels in Gill. Gen. Comp. Endocrinol. 2007, 152, 310–313. [Google Scholar] [CrossRef]
  82. Carbajal, A.; Reyes-López, F.E.; Tallo-Parra, O.; Lopez-Bejar, M.; Tort, L. Comparative Assessment of Cortisol in Plasma, Skin Mucus and Scales as a Measure of the Hypothalamic-Pituitary-Interrenal Axis Activity in Fish. Aquaculture 2019, 506, 410–416. [Google Scholar] [CrossRef]
  83. Guardiola, F.A.; Cuesta, A.; Esteban, M.Á. Using Skin Mucus to Evaluate Stress in Gilthead Seabream (Sparus aurata L.). Fish Shellfish Immunol. 2016, 59, 323–330. [Google Scholar] [CrossRef]
  84. De Mercado, E.; Larrán, A.M.; Pinedo, J.; Tomás-Almenar, C. Skin Mucous: A New Approach to Assess Stress in Rainbow Trout. Aquaculture 2018, 484, 90–97. [Google Scholar] [CrossRef]
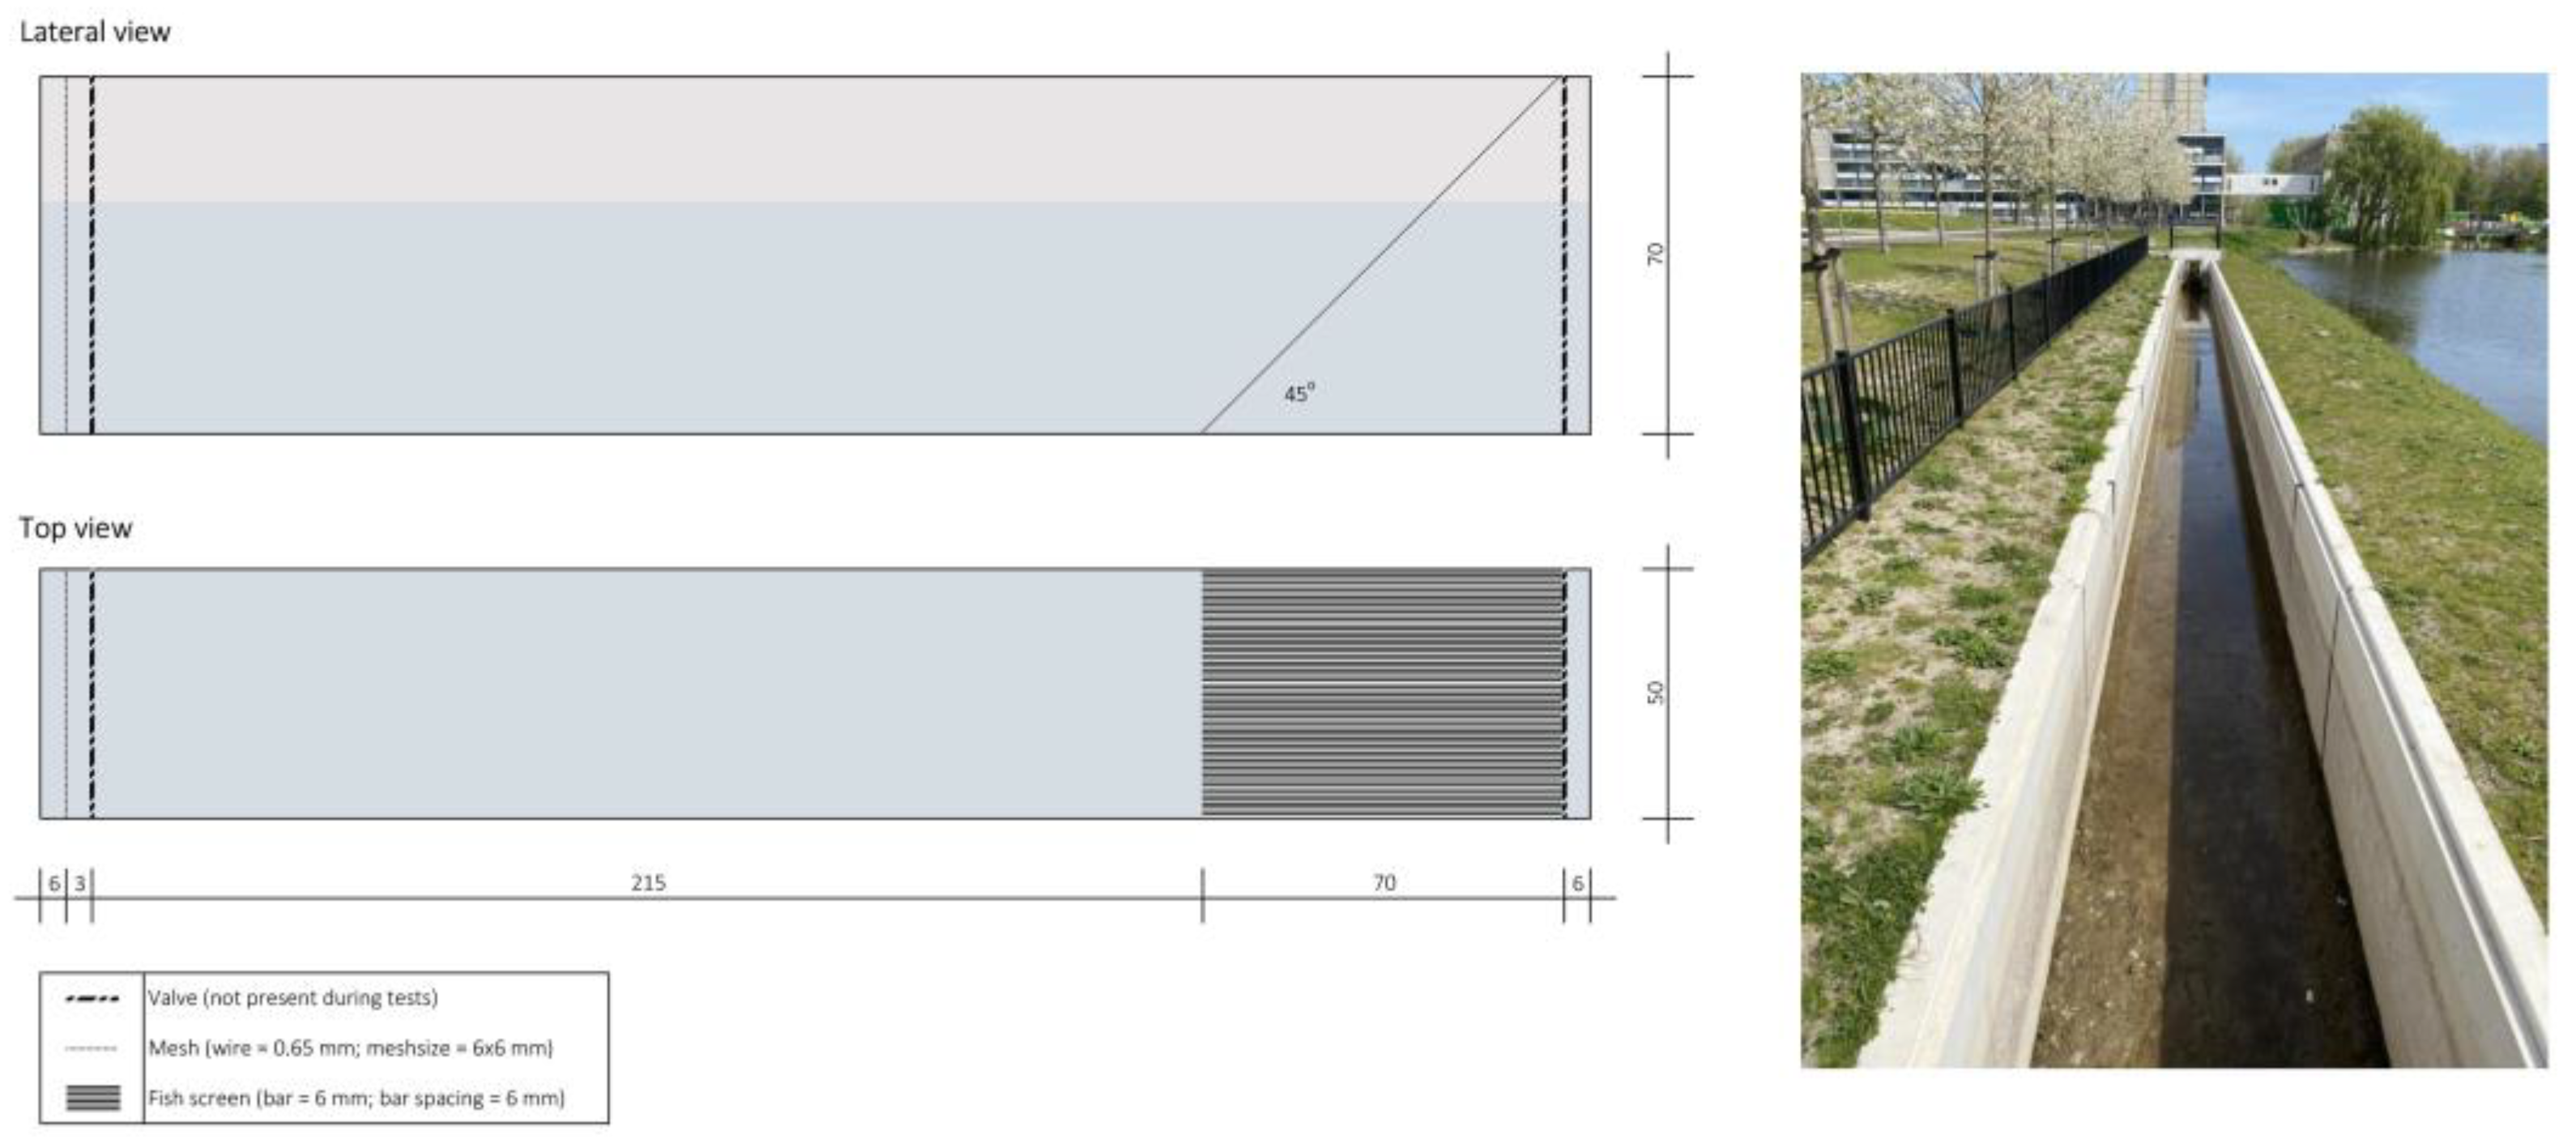
Figure 1. Diagram of an experimental chamber (left) and view of the TU Delft flume, where experiments took place (right). Dimensions of the chamber, unless otherwise stated, are expressed in cm.
Fishes 08 00139 g001
Figure 2. Concentrations of serum cortisol (ng mL−1) quantified in A. anguilla (a) and O. mykiss (b), with details of statistical analyses. Experimental groups are color coded, and points overlaid on box-plots reflect time in minutes elapsed from the end of trial to sampling operations. Post hoc testing was performed only in case the main effect was statistically significant (p < 0.05). ηg2: generalized eta squared; ηH2: eta squared based on the H-statistic; pwc: pairwise comparison; asterisks denote degree of statistical significance.
Fishes 08 00139 g002
Figure 3. Concentrations of skin mucus cortisol (ng mL−1) quantified in A. anguilla (a) and O. mykiss (b), with details of the statistical analyses. Experimental groups are color coded, and points overlaid on box-plots reflect time in minutes elapsed from the end of trial to sampling operations. Post hoc testing was performed only in case the main effect was statistically significant (p < 0.05). ηH2: eta squared based on the H-statistic; pwc: pairwise comparison; asterisks denote degree of statistical significance.
Fishes 08 00139 g003
Figure 4. Comparison of A. anguilla blood serum–skin mucus cortisol concentrations (a), and correlation tests between matrices (b) per experimental group, with indication of the time, in minutes, elapsed from the end of trial to sampling operations, and details of the statistical tests. Colors indicate experimental groups.
Fishes 08 00139 g004
Figure 5. Comparison of O. mykiss blood serum–skin mucus cortisol concentrations (a), and correlation tests between matrices (b) per experimental group, with indication of the time, in minutes, elapsed from the end of trial to sampling operations, and details of the statistical tests. Colors indicate experimental groups.
Fishes 08 00139 g005
Table 1. Schedule, regime, and environmental conditions of experimental trials.
Test n.DateSpeciesTest GroupTest Regime (m s−1)Average Test Regime (m s−1)Start TimeEnd TimeWater Temp. (°C)Dissolved O2 (mg mL−1)
119/10/2022A. anguilla10.250.2709:0009:3013.510.7
219/10/2022A. anguilla20.150.1611:4512:1513.810.6
319/10/2022A. anguillactrl0014:3015:0014.110.8
420/10/2022O. mykiss10.40.4009:0309:3312.710.4
520/10/2022O. mykiss20.20.1911:4012:1013.110.4
620/10/2022O. mykissctrl0014:0214:3213.310.2
Table 2. Results of statistical models ranking, standard error of regressions, and coefficient parameters of EIA assay cortisol standard datasets per species and test group. AICC: Akaike information corrected criterion; r: correlation coefficient; SE: standard error.
DateSpeciesAssayMatrixModelAICCrSEαθηκ
05/11/2022O. mykisstg1serumDR-Hill−49.9993270.999979595213940.029352300693504−4.73 × 10−21.25 × 101−3.10 × 1002.21 × 10−1
07/11/2022O. mykisstg2serumDR-Hill−52.9193060.9999714751358350.031040737370267301.02 × 101−4.55 × 1002.66 × 10−1
08/11/2022O. mykissctrlserumDR-Hill−48.6495500.9999513571040340.040534774744687501.16 × 101−4.68 × 1002.36 × 10−1
14/11/2022A. anguillatg1serumDR-Hill−67.5011160.9999977111790280.00983069005901328−8.19 × 10−21.84 × 101−2.58 × 1001.29 × 10−1
15/11/2022A. anguillatg2serumDR-Hill−40.2256370.999930765094650.0540671371859781−4.87 × 10−21.91 × 102−2.26 × 1004.82 × 10−2
21/11/2022A. anguillactrlserumDR-Hill−56.5749980.9999910307247680.0194605917542529−1.11 × 10−11.83 × 101−2.38 × 1001.29 × 10−1
22/11/2022A. anguillatg1–tg2–ctrl (10 samples each)serumDR-Hill−57.4221410.999991931952160.0184570248435207−6.65 × 10−21.61 × 101−2.96 × 1002.24 × 10−1
24/11/2022O. mykisstg1–tg2–ctrl (10 samples each)serumDR-Hill−43.4650330.9999070006468470.056047106992414602.24 × 101−2.73 × 1001.02 × 10−1
05/12/2022A. anguillatg1–tg2–ctrlmucusDR-Hill−59.6401030.9999938854857620.016067882856762−3.07 × 10−21.21 × 101−3.73 × 1001.79 × 10−1
12/12/2022O. mykisstg1–tg2–ctrlmucusDR-Hill−60.4781060.9999944935799050.0152479834979885−1.05 × 10−11.60 × 101−2.86 × 1001.66 × 10−1
Table 3. Statistical details of the correlation tests between cortisol concentrations measured in blood serum and skin mucus. r: correlation coefficient.
SpeciesGrouprStatisticp
A. anguillatg10.1611160.496
A. anguillatg2−0.1415220.542
A. anguillactrl−0.1329340.539
O. mykisstg10.634963.79 × 10−3
O. mykisstg20.39280.195
O. mykissctrl−0.2218790.337
Disclaimer/Publisher’s Note: The statements, opinions and data contained in all publications are solely those of the individual author(s) and contributor(s) and not of MDPI and/or the editor(s). MDPI and/or the editor(s) disclaim responsibility for any injury to people or property resulting from any ideas, methods, instructions or products referred to in the content.