Abstract
The Antarctic continent is one of the most pristine environments on planet Earth, yet one of the most fragile and susceptible to the effects of the ongoing climate change. The overwhelming majority of the components of Antarctic marine trophic chain are stenotherm organisms, highly adapted to the extreme, but extremely stable, freezing temperatures of the Antarctic ocean, which have not changed significantly during the past fifteen million years. Notothenioid fishes are the most abundant representatives of ichthyofauna at these latitudes, being ubiquitously found in coastal areas across the entire continent. While different Antarctic fish species have been previously subjected to studies aimed at defining their range of thermal tolerance, or at studying the response to acute thermal stress, just a handful of authors have investigated the effects of the exposure to a moderate increase of temperature, falling within the expected forecasts for the next few decades in some areas of the Antarctica. Here, the emerald rockcod Trematomus bernacchii was used as a model species to investigate the effects of a 20-day long exposure to a +1.5 C increase in the brain, gills and skeletal muscle, using a RNA-sequencing approach. In parallel, the experimental design also allowed for assessing the impact of stabling (including acclimation, the handling of fishes and their confinement in tanks during the experimental phase) on gene expression profiling. The results of this study clearly identified the brain as the most susceptible tissue to heat stress, with evidence of a time-dependent response dominated by an alteration of immune response, protein synthesis and folding, and energy metabolism-related genes. While the gills displayed smaller but still significant alterations, the skeletal muscle was completely unaffected by the experimental conditions. The stabling conditions also had an important impact on gene expression profiles in the brain, suggesting the presence of significant alterations of the fish nervous system, possibly due to the confinement to tanks with limited water volume and of the restricted possibility of movement. Besides providing novel insights in the molecular mechanisms underlying thermal stress in notothenioids, these findings suggest that more attention should be dedicated to an improved design of the experiments carried out on Antarctic organism, due to their extreme susceptibility to the slightest environmental alterations.
1. Introduction
The consensus of the scientific community identifies global warming as one of the primary causes of concern associated with climate change, with global average temperatures expected to rise by +1.5 C above pre-industrial levels by the end of this decade [1]. However, surface temperature has not been rising uniformly across the globe, with some areas being more affected than others. Among these, the polar and sub-polar regions of the north hemisphere are experiencing the most dramatic changes. Nevertheless, warming is occurring also in Antarctica, where it is mostly affecting surface temperatures and, as a result, sea ice coverage [2]. This ice retreat represents an unprecedented event in the past ten millennia [3], as supported by data from marine sediment cores [4,5]. Although the general conditions of the Antarctic Ocean are believed to have been stable for more than 15 million years [6,7], they have been significantly altered in the past 50 years, with the average annual sea surface temperatures increasing by nearly 3 C in some regions of Antarctica [4,8].
The uncompensated melting of sea ice reduces surface albedo during the summer, making the ocean more likely to receive direct solar radiation, increasing its temperature over longer timeframes, and further impacting marine communities and habitats. Moreover, the melting of sea ice, which reduces water salinity, especially in the upper layers [9,10], can seriously impact marine communities by affecting the stratification of the water columns and the depth of the mixed layer.
The combined effects of all the physical and chemical changes to the Antarctic habitats due to climate change are unpredictable, but the greatest concern is undoubtedly the loss of balance in the polar trophic chain, where fish play a key role, which has been almost completely isolated and stable for millions of years. Within the 320 species that make up the Antarctic ichthyofauna, the suborder Notothenioidei is the most represented taxonomic group, both in terms of number of species and biomass [11,12].
Antarctic notothenioid fishes are physiologically adapted to life in subzero water temperatures thanks to the acquisition of several striking unique morphological and physiological traits compared to their closest extant relatives living in temperate waters. Such adaptations include the ability to produce antifreeze glycoproteins that prevent the growth of ice crystals in body fluids (hypotonic compared with seawater) [13,14], the loss of an inducible Heat Shock response [15,16,17], the partial or complete loss of expression of adult hemoglobin [18,19] and modifications in gas exchange functionality in gills [20,21].
The most iconic genus within Notothenioidei, which currently counts 11 recognized species [22], is Trematomus bernacchii (Boulenger, 1902). This species, commonly named emerald rockcod, is widely distributed around the coast of Antarctica, living from the sea level to depths up to more than 200 m [23,24].
Due to its local abundance and ease of capture, T. bernacchii has been one of the first subjects of study for defining the upper boundary of thermal tolerance in Antarctic fishes, which in this species is markedly low (i.e., 6 C) compared with other eurythermal fishes [25,26]), even though thermal acclimation increases its heat tolerance to some extent [27]. These pioneering studies helped to define the conditions that have been later used in a number of studies to experimentally evaluate the effects of lethal and sub-lethal temperature increases. While certainly useful for investigating thermal tolerance, such extreme temperature conditions, often reached through short-term exposures, are often inconsistent with the current trends of temperature increase observed in Antarctica and are therefore poorly informative of the alterations that may be observed in T. bernacchii in the upcoming years. Nevertheless, these studies have described significant alterations at different levels, which involved growth and feeding behavior [28], cardiorespiratory performance [29], enzyme metabolic capacity [30], cell proliferation [31], tissue morphology [32] and lipid composition [33], with the central nervous system most certainly being a primary site of thermal injury [26].
To obtain a reliable overview of the changes induced by a moderate increase in seawater temperature, in this work, we used an RNA-seq approach to investigate the transcriptomic response in three tissues (skeletal muscle, gills, and brain) of T. bernacchii in response to a moderate heat stress (i.e., +1.5 C) over a period of up to 20 days, which would be consistent with the expected increase in water temperature due a prolonged absence of an ice layer. The collection of naïve individuals (sampled in the wild), of animals exposed to heat stress after an acclimation period and of paired controls (maintained at environmental seawater temperatures) allowed us to disentangle the transcriptomic alterations due to heat stress and stabling, gathering important information that could help to improve the experimental design of future studies in Antarctic notothenioids.
2. Materials and Methods
2.1. Sampling and Housing of Specimens
Forty-five adult individuals of T. bernacchii (average length of 255 ± 28 mm) were caught with fish traps baited with Argentine lobsters placed under the pack near the Mario Zucchelli Station (MZS) at Terra Nova Bay, in the Ross Sea (Ross Sea 744142 S, 1640723 E) at 25 m depth. Five individuals were then sacrificed immediately after the catch, defining the hereafter-named “naïve” group. The remaining fish were transferred to MZS and acclimated for up to 11 days in a 1500 L tank characterized by an open system, with running seawater at −0.9 C, directly fed from the sea, under controlled physical and chemical conditions. After acclimation, ten specimens were sampled (T0 group) and 30 specimens were randomly split in two experimental 180 L tanks with running water at two different temperatures: −0.9 C for the control group and +0.6 C for the stress group. The specimens were fed with the bivalve mollusk Adamussium colbecki once a week for the entire duration of the experiment; the water temperature of each tank was logged every 15 min with a submerged Tinytag Aquatic 2 data logger. Five specimens from each tank were sampled after 6 h (T1), 7 days (T2) and 20 days (T3). All the animals were euthanized with 1 mg × mL−1 tricaine, and gill, skeletal muscle and brain tissues were dissected as described in [34], placed in RNAlater (Thermo Fisher Scientific, Waltham, MA, USA) and stored at −20 C. In total, 45 individual samples were collected for each tissue (3 biological replicates for the naïve, T0, T1—control, T1—stress, T2—control, T2—stress, T3—control and T3—stress samples). The samples were then shipped to Italy in refrigerated tanks at −20 C. Upon arrival, all samples were kept at −80 C until extraction.
2.2. RNA Extraction, Library Preparation and Sequencing
Total RNA was isolated from each sample using the DirectZol™ RNA MiniPrep kit (Cat R2052, Zymo Research Corporation, Irvine, CA, USA) and was quantified with a NanoDrop™ 2000 Spectrophotometer (Thermo Fisher Scientific, Wilmington, DE, USA). The total RNA concentration (ng/mL) was accurately estimated according to the RNA: High Sensitivity assay on a Qubit™ 2.0 Fluorometer (Life Technologies, Foster City, CA, USA).
Following an assessment of RNA Integrity Number (RIN) on an Agilent 2100 Bioanalyzer instrument (Agilent Technologies, Palo Alto, CA, USA), barcoded libraries compatible with Illumina single-end sequencing were prepared for the overall best three samples of each group according to the QuantSeq™ 3’ mRNA-Seq Kit (Lexogen GmbH, Vienna, Austria) forward (FWD) protocol. The qualitative and quantitative analyses of the libraries were also performed with the Agilent 2100 Bioanalyzer. All libraries were pooled according to the Illumina Pooling Calculator [35] and sequenced on a NovaSeq 6000 platform (Illumina, San Diego, CA, USA) with a 100 bp single end sequencing strategy at Area Science Park (Trieste, Italy).
2.3. Data Preparation
Raw sequencing reads (deposited in the NCBI database under the Bioproject ID PRJNA600926) were quality checked with fastqc v0.11.9 plus MultiQC [36] and trimmed with fastp [37], by removing the first 15nt, subjected to compositional bias (in line with the information provided by the library preparation kit manufacturer), undetermined nucleotides (N), heading and trailing homopolymers. Following this process, resulting trimmed reads shorter than 35nt were also removed. All other settings were left as default.
The annotated reference genome of T. bernacchii (v.fTreBer1.1) was downloaded from NCBI [38], imported in the CLC Genomics Workbench v20 (Qiagen, Hilden, Germany) environment and used as a reference for read mapping, which was carried out using the following parameters: length fraction = 0.95, similarity fraction = 0.95. A mapping report was generated and used for identification of potential outlier samples. These were identified as those displaying a fraction of “reads mapped to gene regions” lower than the average of all samples by at least one standard deviation unit.
2.4. Gene Expression Analysis
Trimmed reads were mapped on the transcripts extracted from the annotated reference genome using salmon v1.2.1 [39,40] with default parameters and by setting the –validateMappings flag. The expression data in the form of counts were imported in an R v4.0.2 [41] environment with the tximport [42] package.
Expression data were normalized and processed with the Multi Dimensional Scaling (MDS) method provided by the edgeR [43] v3.32 package. This dimensionality reduction approach allowed for verifying the coherence of the expression profiles among all samples, with particular reference to the outliers previously identified by read mapping, thanks to a visual assessment of the emerging clusters. Therefore, two samples from skeletal muscle (belonging to the T1 control and T1 stressed groups, respectively) and two samples from gills (belonging to the T0 and one T1 stressed groups, respectively) were excluded from further analyses, leaving the respective samples with just two biological replicates.
Expression data obtained from each tissue were filtered with the filterByExpr function in order to remove poorly-expressed genes, unlikely to carry out a biological relevant role and possible source of unwanted background noise. Differential Gene Expression (DGE) analyses were carried out with the edgeR package [44]. All the differential expression tests were performed with the GLM functionality by the glmQLfit and glmQLFTest functions. Genes with FDR-corrected p-value < 0.05 and absolute value of log fold change >1 were deemed as Differentially Expressed Genes (DEGs) and were retrieved by calling the topTags function.
The alterations of gene expression determined by thermal stress in T. bernacchii gills, skeletal muscle and brain over 20 days were identified as follows. To minimize the influence of the effect of stabling, each time point of the stress group was compared with the control samples from all the four experimental time points, grouped together. The effect of stabling on the transcriptional profiles of the three tissues was evaluated by performing pairwise comparisons between the four time points of the control group and the naive (i.e., pre-acclimation) group.
Expression profile clustering analysis was performed for the DEGs obtained in response to stabling effect as follows: per gene CPM expression values were standardized and clustered with K-means clustering with the scikit-learn [45] Python package. The optimal number of clusters was estimated with a combination of the elbow and silhouette methods.
All protein-coding genes were functionally annotated by querying the encoded protein sequences against UniProt-SwissProt [46] with diamond [47] and the interPro database with InterProScan [48,49], which allowed for linking Gene Ontology (GO) [50,51] terms to each gene.
The DEGs resulting from all the comparisons were used for a Gene Set Enrichment Analysis (GSEA) [52], by performing a hypergeometric test on Gene Ontology (GO) terms, which were considered as significantly over-represented when the FDR-corrected p-value was lower than 0.05 and the observed-expected value was higher than 3.
For each tissue, only the genes identified as expressed by the filterByExpr function were used as “universe” for the hypergeometric test in order to minimize false positives [53]. The test was separately carried out on up and downregulated DEGs, as well as on the clusters of co-regulated genes identified by scikit-learn. For visualization purposes, the results of the GSEAs were plotted in dendrograms with a method similar to that of GO_MWU [54], clustering them by complete linkage of the overlap of the underlying DEG sets (top 30 by significance if more than 30 GO were significantly enriched). In these visualizations, the size of the GO descriptions indicates the observed/expected ratio, while the color codes for enrichment significance(). All the figures were generated with ggplot2 [55], seaborn [56] and matplotlib [57].
2.5. Limitations of the Experimental Design
The experimental phases of this study were conducted at the Mario Zucchelli Station at Terranova Bay, Antarctica and were therefore limited by the available hardware at the facilities and by the access time granted to each research team. All the available time and instrumentation (including tanks and related hardware) were used for this experiment, which could only rely on the use of a single tank for each of the two experimental conditions, without the possibility of including technical replicates. Nevertheless, as previously reported in other studies carried out on the same species [58], this factor is unlikely to have significantly impacted the outcome of the study. We also recognize that, in light of the results of our study, the selected acclimation time (i.e., 11 days) might have had a significant impact on the response of T. bernacchii to stabling. Nevertheless, this experimental design was planned based on the consensus of the scientific literature available on the subject at the time, which indicated an acclimation time between 7 and 10 days as appropriate for the target species and other notothenioid fishes [30,59,60,61].
3. Results
Sequencing provided a total of 407.1 million reads, averaging 5.7 million reads per sample, with a median length of 96 nt and 40.2% GC content (which was consistent with the genomic GC content of this species, i.e., 40.9% [38]).
Read quality was generally high, with all but a single sample having a mean PHRED quality score >30 in all positions. The trimming process removed, on average, about 6% reads from each sample (ranging from 1.7 to 30.1%; see Table S1), leaving (upon the removal of the four outlier samples detailed in the Section 2) a total of about 370 million reads available for gene expression analysis.
The mean mapping rate of trimmed reads was 60.9%, widely ranging from 21.77% to 82.0%, with a median of 63.4%. On average, 86% of reads mapped on regions annotated as genes. The Multi Dimensional Scaling (MDS) plot, constructed based on gene expression profiles of all the biological samples included in the experiment (Figure 1), evidenced a marked clustering of samples based on the tissue of origin, even though the gill samples displayed a higher degree of variability compared with brain and skeletal muscle samples. The MDS plots built by separately considering the brain (Figure S1a), gill (Figure S1b) and skeletal muscle (Figure S1c) samples did not evidence a strong clustering based on the timing of exposure to heat stress, suggesting on the other hand a significant contribution of stabling stress in explaining the diversity among gene expression profiles, in particular in gills and brain.
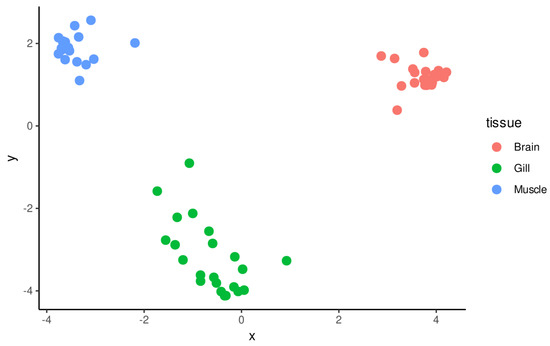
Figure 1.
MDS plot obtained from expression data of all samples, excluding four outliers identified during the preliminary phases of analysis. Markers are colored by tissue of origin. Separate MDS plots are available for each of the three tissues in Figure S1.
3.1. Differential Gene Expression in Response to +1.5 C Warming
Under a quantitative point of view, none of the three tissues analyzed in this study displayed significant alterations of gene expression profiles at the earliest time point, i.e., T1, in the comparison between fishes kept at −0.9 C and +0.6 C, indicating that this short-term (6 h) exposure to increased temperature had a negligible impact on transcription (Table 1).

Table 1.
Number of DEGs observed across all comparisons in the heat stress experiment.
The brain, the most responsive tissue out of the three tested in this study, displayed a significant time-dependent response, highlighted by the marked increase of the number of DEGs observed from T2 to T3, both in terms of up and downregulation (Table 1). In detail, 117 DEGs were identified in this tissue at T2 (Table S1a), the vast majority of which (i.e., 114) were upregulated. Such DEGs were mostly associated with terms related to complement activation, with some overlap with coagulation and acute phase response (Table S1f, Figure 2).
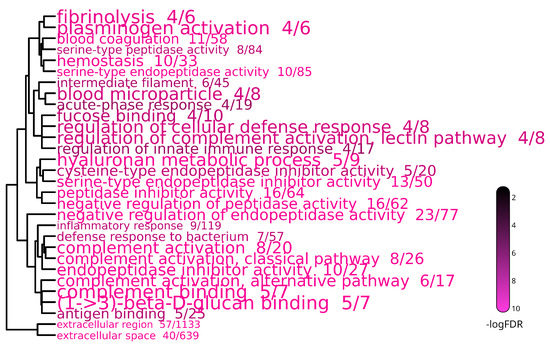
Figure 2.
Dendrogram representation of complete linkage of overlapping DEGs associated with the top 30 most significantly enriched GO terms in the Stressed vs. Control comparison of the Brain sample at T2. The size of the GO terms codes for the observed/expected value, the color scale for statistical significance.
Among the 1009 DEGs identified at T3, 519 were upregulated and 490 were downregulated (Table S1b). The GSEA, performed separately for up- and downregulated DEGs (Table S1g), identified 30 enriched GO terms associated with downregulation, mostly related to ribosomal structure and activity, mitochondrial respiration, cytoskeleton organization, protein turnover and folding (Figure 3A).
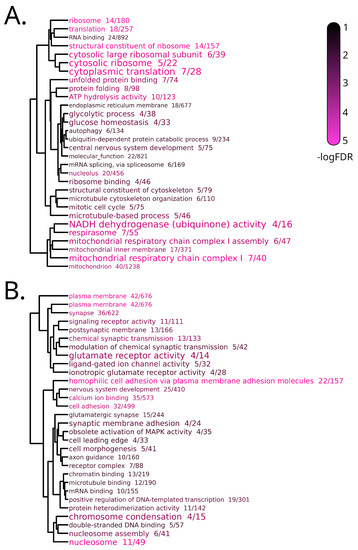
Figure 3.
Dendrogram representation of complete linkage of overlapping downregulated (A) and upregulated (B) DEGs associated with the top 30 most significantly enriched GO terms in the Stressed vs. Control comparison of the Brain sample at T3. The size of the GO terms codes for the observed/expected value, the color scale for statistical significance.
The latter feature was of particular interest, as it included five genes encoding for heat shock proteins that were consistently downregulated only in brain after 20 days of exposure to the warmer condition. In detail, these genes were hspa9, hsp90aa1.2, hsp90ab1, hspa14 and hspa8b (Figure 4); the gene showing the greatest reduction in expression was hspa9, with a logFC of −1.65.
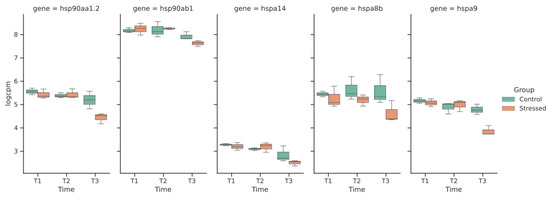
Figure 4.
Expression levels in log(CPM) of the five HSPs differentially expressed across the entire experiment.
On the other hand, the 44 enriched GO terms associated with upregulated DEGs included terms specifically linked with neuronal structure and activity, involving in particular glutamatergic synapses, and nucleosome organization (Figure 3B).
A perturbation of gene expression profiles was also observed in gills, even though this was only detectable at T3 and involved a much lower number of genes compared with the brain, i.e., 17 upregulated and 7 downregulated DEGs (Table 1, Table S1c). While the GSEA carried out on downregulated genes was not informative due to the low number of DEGs, the same analysis involving upregulated genes revealed an association with seven GO terms, with “DNA replication” and “negative regulation of apoptotic process” being the most significantly enriched processes (Table 2).
Table 2.
Enriched GO terms of upregulated genes at the 20 Days time point in the gill tissue (in response to heat stress).
Strikingly, the skeletal muscle appeared to be nearly unaffected by heat exposure throughout the entire experimental period of 20 days, and the only two upregulated genes detected, one at T1 and one T2 may simply denote background noise, as they code for proteins annotated as “complement C1q and tumor necrosis factor-related protein 9-like” and “Histone H1.0”, respectively, and just barely passed the fold change and significance thresholds.
3.2. Differential Gene Expression in Response to Stabling
The confinement of T. bernacchi individuals in tanks, with a limited water volume and a greatly reduced possibility of movement compared with the external environment, produced a significant alteration of gene expression profiles, regardless of the exposure to heat stress. Such changes were clearly revealed in two out of the three tissues analyzed by the comparison between the individuals kept in tanks at different time points and the naïve individuals sampled from the wild. Similar to the results reported in the previous section in response to heat stress, the brain was by far the most responsive tissue, with a total of 1840 DEGs identified (Table S1d), followed by gills, with 84 DEGs (Table S1e), and by the skeletal muscle, which was apparently unaffected, as suggested by the detection of a single DEG (Table 3). Nevertheless, stabling stress did not result in a time-dependent increase of DEGs as in the case of heat stress, but rather allowed the identification of several clusters of co-regulated DEGs displaying peculiar expression trends, which were analyzed in detail in the brain and gills.
Table 3.
Number of DEGs and relative co-expression clusters observed due to stabling in each tissue.
Four different clusters, describing four distinct temporal expression patterns, were identified in the brain (Figure 5). Cluster 0 included 195 “late response” DEGs, which were upregulated at T3 and were significantly enriched in 14 GO terms. These (Figure 6A, reported in detail in Table S1h) included, among the others, several terms connected with the organization muscle fibers, the regulation of apoptosis and glycolytic process. The largest cluster, i.e., cluster 1, comprised 968 genes that displayed a significant downregulation starting from T1, which might reflect the effect of the movement of T. bernacchii individuals from a large acclimation tank to the smaller experimental tanks. The DEGs of this cluster were enriched in terms related with neuron organization and function, such as glutamatergic and GABA-ergic synapses, ion channel activity and dendrite morphogenesis (Figure 6B, Table S1i).

Figure 5.
Spaghetti plots of gene expression patterns identified by K-means clustering of DEGs from the stabling stress test in brain. The x-axis reports the experimental time point and the y-axis reports expression levels as scaled log (CPM). The thick black line represents average, and the gray area represents the bootstrap confidence interval.
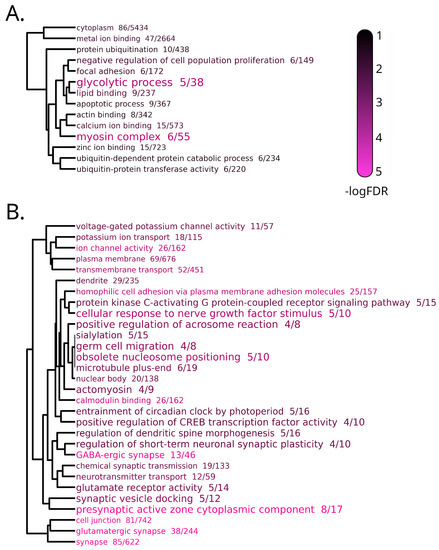
Figure 6.
Dendrogram representation of complete linkage of overlapping DEGs associated with the top 30 most significantly enriched GO terms in clusters 0 (A) and 1 (B) of the transcriptomic response to stabling stress in brain. The size of the GO terms codes for the observed/expected value and the color scale for statistical significance.
The 324 DEGs included in cluster 2 displayed a peak of expression at T1, followed by a return of the levels of expression close to T0, pointing out a possible acute response to the transfer from the acclimation tanks to the experimental tanks, of opposite direction compared to cluster 1. The DEGs included in this cluster were enriched in terms linked with mitochondrial activity, mRNA splicing and protein synthesis, together with four terms specifically associated with four DEGs encoding zona pellucida sperm-binding proteins (Figure 7A, Table S1j). Cluster 3 included 353 DEGs, which displayed an increased expression, compared with the baseline, from T1 to T3, with a peak of expression at T2. The majority of enriched terms associated with cluster 3 were linked with mitochondrial respiration and ribosomal structure and function, suggesting a delayed activation of cellular energetic metabolism in response to the transfer to the experimental tanks (Figure 7B, Table S1k).
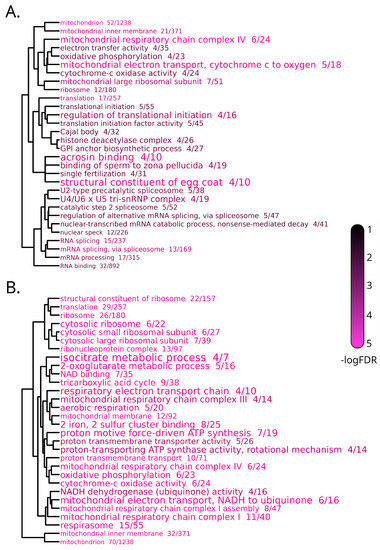
Figure 7.
Dendrogram representation of complete linkage of overlapping DEGs associated with the top 30 most significantly enriched GO terms in clusters 2 (A) and 3 (B) of the transcriptomic response to stabling stress in brain. The size of the GO terms codes for the observed/expected value, the color scale for statistical significance.
The same clustering approach, applied to the gills, identified five clusters of co-regulated genes, depicted in Figure 8. The vast majority of DEGs (i.e., 66.89% of the total) were placed into cluster 0, which likely represents an acute response to the transfer of fish from a large acclimation tank to smaller experimental tanks, analogous to the previously described brain cluster 2. The functional enrichment analysis performed on this cluster identified 16 significantly enriched terms, which were mainly linked with muscle function and cytoskeleton, along with others related with catalytic and phosphorylation processes (Table S1l). The four remaining clusters only included a very small number of DEGs and therefore could not be subjected to GSEA. In detail, cluster 1 included four DEGs which were slightly downregulated at T0 (following acclimation) and whose expression then continuously raised, recovering normal levels at T1 and even showing a slight upregulation at T3. Cluster 2 consisted of six “late response” DEGs, upregulated at T3, showing a similar trend to gill cluster 0. Cluster 3 included four DEGs, which were upregulated throughout the experimental phase (T1, T2 and T3). Cluster 4 was comprised of four genes, which were upregulated only at T0, at the end of the acclimation phase.
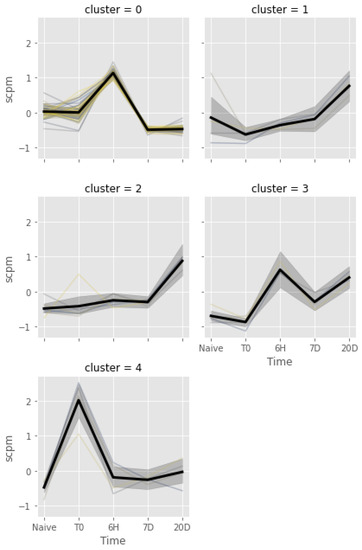
Figure 8.
Spaghetti plots of gene expression patterns identified by K-means clustering of DEGs from the stabling stress test in gills. The x-axis reports the experimental time point and the y-axis reports expression levels as scaled log(CPM). The thick black line represents average, and the gray area represents the bootstrap confidence interval.
4. Discussion
This experiment was designed to evaluate the transcriptomic effects of the exposure to a moderate temperature increase in different tissues of T. bernacchii. The inclusion of both naïve (i.e., sampled in the wild) and control (i.e., kept at environmental seawater temperature) fish groups in this study allowed us to also evaluate the effect of stabling, which was found to be quite significant and might have, to some extent, also masked the specific transcriptomic response to heat exposure. This finding highlights the difficulties in planning reliable experimental setups on wild organisms adapted to an extremely stable environment, such as Antarctica. We will separately discuss here the main implications of our findings, in light of these limitations, for the three tissues analyzed in this study.
4.1. Transcriptional Response of Brain to Heat and Stabling Stress
The response of the brain to heat stress began at T2 and primarily consisted of gene upregulation. According to GSEA, this response involved an increased expression of endopeptidases and most likely triggered innate immune response via complement activation (Table S1f). One of the few downregulated genes was textitfkbp5, a co-chaperone that interacts specifically with the heat shock protein HSP90 [62]. In mammals, fkbp5 inhibits the Glucocorticoid Receptor (GR) complex [63]. This process may counterbalance the inflammatory response identified by GSEA, which would be compatible with a stress condition [64] in the brain of T. bernacchii, likely induced by heat stress [65,66].
The transcriptional profile of the brain was severely affected at T3 (Table 1), as evidenced by the strong downregulation of genes involved in the structure and function of ribosomes and mitochondria (Table S1g). This alteration, not detectable at the earlier time points, could be interpreted as a response aimed at balancing the metabolic changes induced by chronic heat stress, with a repression of protein synthesis and energy metabolism. This hypothesis is also supported by the downregulation of multiple autophagy-related genes.
The significant downregulation of five heat shock proteins in Brain at T3 is of particular interest, as Antarctic notothenioids have been previously shown to have lost inducibility of HSP genes that are constitutively expressed in these organisms [15,17]. However, the downregulation of HSPs had already been occasionally described in response to a more drastic heat shock in the gills of T. bernacchii, [32], as well as in other notothenioids, such as Pagothenia borchgrevinki [67] and Harpagifer antarcticus [68]. Based on the results of this experiment, we propose that the downregulation of these chaperonins may be associated with a decrease in metabolic rates and in the consequent decrease of protein synthesis, as suggested by the GSEA analysis (Table S1g).
Several other enriched terms associated with genes downregulated at T3 were linked with structural constituents of the cytoskeleton, suggesting that structural re-organization of brain cells was ongoing. The enriched terms associated with the upregulated genes further support alterations in synapse formation and functionality (Table S1g). Moreover, the enrichment of terms related to glutamatergic synapses is suggestive of stress derived from the inability to move to areas with lower water temperature, an avoidance behavior expected in animals lacking efficient thermal regulation mechanisms [69]; heat and confinement stress may therefore act synergistically. The significant response of the brain to prolonged thermal stress is most likely due to its high physiological sensitivity, as previously observed in early thermal lethality experiments [26]. Indeed, the combination of the innate immune response activation observed at T2, followed by a decreased protein folding activity and, possibly, also by oxidative damage caused by altered mitochondrial activity, could result in cellular damage, or even in cell death.
The brain was also extremely sensitive to stabling stress, which determined the differential expression of 1840 genes. The spaghetti plots of the four clusters of co-regulated DEGs (Figure 5) appear to display a time-dependent progression of response. This starts with the downregulation of the genes included in cluster 1, concurrent with the activation of genes belonging to cluster 2 (T1), followed by the activation the genes included in cluster 3 (T2) and cluster 0 (T3).
The genes belonging to cluster 1 were strongly downregulated shortly after the transfer of the fish from the large acclimation tank to the smaller experimental tanks (i.e., 6 h). The most significantly enriched GO terms in this cluster included glutamatergic/GABA-ergic synapse-related processes and functions, and many terms related with ion channel function (Table S1i). Although this observation is apparently in contrast with the previously reported upregulation of similar terms in response to heat stress at T3 (Table S1g), only a fraction of DEGs were shared between the two stressors. This kind of response may be originating from a broad set of factors linked with stabling, including a sudden variation in population density, human handling and territorial attitudes.
The GO enrichment of cluster 2 also denoted an acute response to the transfer to experimental tanks, with an opposite direction compared with cluster 1, indicating an activation of metabolism and protein synthesis (Table S1j). Such alterations were partially recovered at T2 and T3, and may represent the short-term consequences of human manipulation and confinement in smaller tanks. The genes included in Cluster 3 were enriched in GO terms related to ribosomes and mitochondria, with a great prevalence of mitochondrial respiration processes and functions (Table S1k), likely indicative of oxidative stress. The peak of expression observed at T2 for this cluster may be a functional extension of the observations reported above for cluster 2.
The two most enriched terms in cluster 0 were the cytoplasm cellular localization and metal ion binding (Table S1h), with the latter being linked with the many differentially expressed zinc- and calcium-binding proteins. The dis-regulation of metal homeostasis in the brain is associated with many neuro-degenerative conditions in model organisms [70]. Zinc ions are crucial for synapse function, as they are found in high concentrations in the vesicles produced by many types of neurons [71]. Calcium, on the other hand, is a key regulator of mitochondrial activity [72], with a role in the reduction of oxidative stress in neurons. Altogether, these observations are consistent with a strong effect of stabling on the brain, which might have impaired the function of many specialized cell types, such as glial cells and neurons. The alteration of their metabolism could result in oxidative damage, with significant impact on specific functions related to synapse activity.
Since the RNA in this experiment was extracted from the entire brain, the transcriptomic profiles described above provide a comprehensive picture of the changes observed across a broad range of cell types with highly specialized functions. Given the importance of the brain in stress response in T. bernacchii, future research would greatly benefit from separate sampling of selected brain areas to further identify the physiological implications of our observations.
4.2. Transcriptional Response of Gills to Heat and Stabling Stress
Fish gills are the largest contact area with the external environment and are therefore expected to be particularly sensitive to environmental changes. However, we only observed a relatively weak transcriptional response to heat stress in this tissue.
Only one DEG was identified at T2, (urgcp), and its differential expression did not persist at T3. Its human ortholog is known to be upregulated in several cancers and is thought to be involved in cell cycle progression [73,74]. However, the GSEA performed for the 17 DEGs that were upregulated at T3 showed some delayed consequences of this early upregulation by revealing an enrichment of terms related to the cell cycle and DNA replication. It is plausible that at least some of these DEGs are placed downstream of urgcp and play a role in the heat stress response pathway in T. bernacchii gills. Consistent with our results, experiments in this species have shown that short-term sublethal heat exposure leads to a transient increase in cell proliferation within 72 h, while it induces hepatocyte apoptosis through the over-expression of the pcna gene [31]. Although pcna was not found among the DEGs at T3, one of its interactors, i.e., pclaf (PCNA-associated factor), was significantly upregulated; its expression and interaction with pcna are fundamental for DNA damage repair [75]. At T3, other upregulated DEGs involved in activation of DNA replication and damage repair mechanisms were detected: banf1 [76], mcm4 [77], LOC117480017 (ortholog to emp2, which also regulates angiogenesis) [78,79] and ranbp1. In addition, the known promoter of DNA damage repair neil1 [80] is significantly downregulated at T3.
The genes caspa and LOC117500516 (ortholog to pycard), which activate the inflammatory response in zebrafish and mediate apoptosis through activation of IL1B [81,82], were both upregulated. The establishment of an inflammatory state is also supported by upregulation of LOC117472831, the ortholog of human ccl21. Similar to the HSP genes previously discussed, the expression of cct3, a member of the TCP1 complex [83] and LOC117491065 (sgta), an interactor of HSP70 and HSC70 [84,85], was strongly repressed at T3.
The activation of genes involved in cell replication and DNA repair pathways, as well as the downregulation of some key molecular chaperones, support the known role of gills in response and acclimation to increased temperature, although only a small number of DEGs were detected after 20 days of exposure at +1.5 C. In addition, a previous study examining the effects of acute temperature stress (4 C for four hours) in T. bernacchii described a larger transcriptomic response that partially overlaps with the results of this work [86]. Further research is undoubtedly needed to better understand the signaling pathways involved in the response to heat stress in the gills of the emerald rockcod, possibly with longer heat exposures and more experimental time points. The confinement in tanks also altered the expression profile of the gill tissue, albeit to a lesser magnitude than in the brain, as evidenced by the detection of only 94 DEGs. The vast majority of these were assigned to cluster 0 (Figure 8), which represents a response to the transfer to smaller experimental tanks. The GSEA unexpectedly detected several enriched GO terms associated with muscle function (Table S1l). This observation could be explained by an increased contractile activity of the gills and their associated blood vessels. In addition, the presence of some enriched structural terms such as “actin cytoskeleton organization” could be related to the morphological changes observed in the erythrocytes of T. bernacchii collected from the same individuals analyzed in this study [34]. Since the gills are a highly vascularized tissue, circulating blood cells are expected to account for a significant proportion of the total RNA extracted from this tissue.
Each of the other four DEG clusters contained only a few genes (Figure 8). Clusters 1 and 2 included genes that were upregulated at T3 and associated with vesicular transport (e.g., myo1e [87,88] and snx21 [89,90]), immune response, and antiviral activity, which could be explained by the mobilization of transposable elements that may occur under stress conditions [91]. The most significant immunity-related DEGs from gill clusters 1 and 2 were (i) ifi44, whose activation promotes viral activity [92]; (ii) trim69, an E3 ubiquitin ligase with antiviral activity, regulated by ifn [93,94]; (iii) gimap8, a small GTPase that increases the lifespan of T lymphocytes [95]. Genes from cluster 3 had different functions and were consistently upregulated from T1 onwards. Among these, ap5z1 might be involved in the selection of cargo molecules of vesicles to and from lysosomes [96], and gspt1 is a cell growth regulator [97] that may also be involved in antiviral response [98,99]. Cluster 4 was particularly interesting because it contained genes that were upregulated only after capture and at the end of the acclimation period. The most important DEG in this cluster was LOC117488042, which encodes for an integumentary mucin C.1-like protein that could serve as a physical barrier to pathogens in the mucus covering the gills of fish. An increase in thickness of the mucus could be a rapid response to spatial and environmental changes experienced by the fish during transfer from its natural habitat to laboratory facilities.
4.3. Transcriptional Response of Skeletal Muscle to Heat and Stabling Stress
As reported in the Section 3, the skeletal muscle was by far the most transcriptionally stable out of the three T. bernacchii tissues analyzed in this study. Just a handful of DEGs were identified, both in response to heat stress and in response to stabling. In most cases, these were likely false positives linked with inter-individual differences that could not be appropriately addressed due to the low number of biological replicates available. Note that some sequencing libraries obtained from this tissue had to be discarded due to the low quality of the output, as reported in the Section 2, leaving only two available biological replicates for a few experimental time points. For example, the only gene responsive to heat stress, i.e., the complement-related gene ctrp9, was only upregulated at T1, as a result of the exceptionally high expression level observed in just one of the two available biological replicates. The lack of significant transcriptomic response to thermal stress in the skeletal muscle does not preclude the possibility of other kinds of alterations being present in this tissue. For example, the fatty acid composition of the muscle cells of T. bernacchii changes during acclimation to warmer temperatures [59] through a process that may be either post-transcriptionally regulated (and thereby not detectable by RNA-seq), or not triggered at all by the small temperature increase applied in this experimental setting. The skeletal muscle was also not transcriptionally affected in response to stabling, as only one gene coding for an elongation factor 2-like protein was upregulated at T2. In summary, the very low number of DEGs identified in response to both types of stress in the skeletal muscle, together with the transient nature of such alterations, are consistent with a complete lack of response by this tissue. Due to the important role in metabolic cold adaptation of this tissue [100], our results do not preclude the possibility that its transcriptomic profile may be significantly altered by greater temperature increases or by longer exposure times.
5. Conclusions
Our results highlight a remarkable difference in the sensitivity of three tissues of T. bernacchii to heat and stabling stress, with the brain being the most strongly influenced one, followed by the gills. The skeletal muscle was not affected at all at a transcriptional level. Thermal stress had a very clear time-dependent effect on the gene expression profiles of both brain and gills; in particular, the signatures of differential gene expression appeared earlier in the brain (i.e., after 7 days of exposure) and later in gills (after 20 days of exposure). In gills, chronic heat stress triggered a gene expression alteration consistent with the activation of immune response and ongoing DNA damage. In brain, the transcriptomic alterations involved the activation of innate immune response at T2 and a significant alteration of several processes linked with neuronal and synaptic structure and function, with a consequent impact on metabolism and a surprising downregulation of protein folding activity. We hypothesize that, in its natural environment, T. bernacchii might be able to adopt a behavioral avoidance response to thermal stress, which was impaired by the spatial constraints of this experimental settings. Therefore, the combination of unfavorable water temperature and spatial confinement synergistically induced a significant stress in the brain of the fish, possibly simulating the reduction of its favorable temperature zones that may occur in a warming sea scenario. Altogether, these results emphasize the importance of always taking into account the confinement in experimental tanks as a fundamental confounding factor when studying the effect of stressors on notothenioid fish.
Supplementary Materials
The following supporting information can be downloaded at: https://www.mdpi.com/article/10.3390/fishes7060387/s1, Figure S1: MDS plots of samples. The shape of markers codes for experimental group, the color codes for experimental time. Tissues: (a) brain; (b) gills; (c) muscle; Table S1: master table containing the results of: (1.1) data preparation and mapping, (a–e) differential expression analyses, (f–l) GO enrichment analyses.
Author Contributions
Original draft compilation: S.G., A.S.G. and M.G.; proofreading: S.G., A.S.G., C.M., G.F., F.C., G.S., P.E., A.P., P.G.G. and M.G.; experimental design: C.M., G.S., P.G.G. and M.G.; sampling: P.G.G.; wet lab methods: A.S.G., C.M., G.F., F.C. and P.E.; bioinformatic analysis: S.G., A.S.G. and M.G.; interpretation of results: S.G., A.S.G., A.P., P.G.G. and M.G. All authors have read and agreed to the published version of the manuscript.
Funding
This work was funded by the Italian Program of Antarctic Research (Grant Nos. PNRA16_00099 and PNRA16_00234).
Institutional Review Board Statement
The sample collection and animal research conducted in this study comply with Italy’s Ministry of Education, University and Research regulations concerning activities and environmental protection in Antarctica and with the Protocol on Environmental Protection to the 137 Antarctic Treaty, Annex II, Art. 3. All the activities on animals performed during the Italian Antarctic Expedition were under the control of a PNRA Ethics Referent, which acts on behalf of the Italian Ministry of Foreign Affairs. In particular, the required data for the project identification code PNRA16_00099 are as follows: Name of the ethics committee or institutional review board: Italian Ministry of Foreign Affairs. Name of PNRA Ethics Referent: Carla Ubaldi, ENEA Antarctica, Technical Unit (UTA).
Informed Consent Statement
Not applicable.
Data Availability Statement
The raw reads generated by RNA-seq have been deposited at the NCBI SRA database under the BioProject ID PRJNA600926.
Acknowledgments
The authors would like to thank Fiorella Florian and Fabrizia Gionechetti for their precious assistance in the wet-lab phase of the experiment.
Conflicts of Interest
The authors declare no conflict of interest. The funders had no role in the design of the study; in the collection, analyses, or interpretation of data; in the writing of the manuscript, or in the decision to publish the results.
References
- Masson-Delmotte, V.; Zhai, P.; Pörtner, H.; Roberts, D.; Skea, J.; Shukla, P.; Pirani, A.; Moufouma-Okia, W.; Péan, C.; Pidcock, R.; et al. IPCC, 2018: Summary for Policymakers. In Global Warming of 1.5 C. An IPCC Special Report on the Impacts of Global Warming of 1.5 C above Pre-Industrial Levels and Related Global Greenhouse Gas Emission Pathways, in the Context of Strengthening the Global; Technical Report; World Meteorological Organization: Geneva, Switzerland, 2018. [Google Scholar]
- Marshall, G.J.; Orr, A.; van Lipzig, N.P.M.; King, J.C. The Impact of a Changing Southern Hemisphere Annular Mode on Antarctic Peninsula Summer Temperatures. J. Clim. 2006, 19, 5388–5404. [Google Scholar] [CrossRef]
- Turner, J.; Overland, J.E.; Walsh, J.E. An Arctic and Antarctic Perspective on Recent Climate Change. Int. J. Climatol. 2007, 27, 277–293. [Google Scholar] [CrossRef]
- Domack, E.; Levente, A.; Burnet, A.; Bindschadler, R.; Convey, P.; Kirby, M. Antarctic Peninsula Climate Variability: Historical and Paleoenvironmental Perspectives: Domack/Antarctic Peninsula Climate Variability: Historical and Paleoenvironmental Perspectives; Antarctic Research Series; American Geophysical Union: Washington, DC, USA, 2003. [Google Scholar] [CrossRef]
- Pudsey, C.J.; Evans, J. First Survey of Antarctic Sub–Ice Shelf Sediments Reveals Mid-Holocene Ice Shelf Retreat. Geology 2001, 29, 787. [Google Scholar] [CrossRef]
- Dayton, P.K. Polar Benthos. In Polar Oceanography; Elsevier: Amsterdam, The Netherlands, 1990; pp. 631–685. [Google Scholar] [CrossRef]
- Dayton, P.K.; Mordida, B.J.; Bacon, F. Polar Marine Communities. Am. Zool. 1994, 34, 90–99. [Google Scholar] [CrossRef]
- Turner, J.; Colwell, S.R.; Marshall, G.J.; Lachlan-Cope, T.A.; Carleton, A.M.; Jones, P.D.; Lagun, V.; Reid, P.A.; Iagovkina, S. Antarctic Climate Change during the Last 50 Years. Int. J. Climatol. 2005, 25, 279–294. [Google Scholar] [CrossRef]
- Jacobs, S.S.; Giulivi, C.F.; Mele, P.A. Freshening of the Ross Sea During the Late 20th Century. Science 2002, 297, 386–389. [Google Scholar] [CrossRef]
- Moline, M.A.; Claustre, H.; Frazer, T.K.; Schofield, O.; Vernet, M. Alteration of the Food Web along the Antarctic Peninsula in Response to a Regional Warming Trend: Alteration of the Antarctic Food Web. Glob. Chang. Biol. 2004, 10, 1973–1980. [Google Scholar] [CrossRef]
- Eastman, J.T. The Nature of the Diversity of Antarctic Fishes. Polar Biol. 2005, 28, 93–107. [Google Scholar] [CrossRef]
- Eastman, J.T.; McCune, A.R. Fishes on the Antarctic Continental Shelf: Evolution of Amarine Species Flock? J. Fish Biol. 2000, 57, 84–102. [Google Scholar] [CrossRef]
- Harding, M.M.; Anderberg, P.I.; Haymet, A.D.J. ‘Antifreeze’ Glycoproteins from Polar Fish. Eur. J. Biochem. 2003, 270, 1381–1392. [Google Scholar] [CrossRef] [PubMed]
- Matschiner, M.; Hanel, R.; Salzburger, W. On the Origin and Trigger of the Notothenioid Adaptive Radiation. PLoS ONE 2011, 6, e18911. [Google Scholar] [CrossRef]
- Hofmann, G.E.; Buckley, B.A.; Airaksinen, S.; Airaksinen, S.; Keen, J.E.; Keen, J.E.; Somero, G.N. Heat-Shock Protein Expression is Absent in the Antarctic Fish Trematomus Bernacchii (Family Nototheniidae). J. Exp. Biol. 2000, 15, 2331–2339. [Google Scholar] [CrossRef] [PubMed]
- Buckley, A.B.; Place, S.P.; Hofmann, G.E. Regulation of Heat Shock Genes in Isolated Hepatocytes from an Antarctic Fish, Trematomus Bernacchii. J. Exp. Biol. 2004, 21, 3649–3656. [Google Scholar] [CrossRef] [PubMed]
- Hofmann, G.E.; Lund, S.G.; Place, S.P.; Whitmer, A.C. Some like It Hot, Some like It Cold: The Heat Shock Response Is Found in New Zealand but Not Antarctic Notothenioid Fishes. J. Exp. Mar. Biol. Ecol. 2005, 316, 79–89. [Google Scholar] [CrossRef]
- Tetens, V.; Wells, R.M.G.; Devries, A.L. Antarctic Fish Blood: Respiratory Properties and the Effects of Thermal Acclimation. J. Exp. Biol. 1984, 109, 265–279. [Google Scholar] [CrossRef]
- Sidell, B.D.; O’Brien, K.M. When Bad Things Happen to Good Fish: The Loss of Hemoglobin and Myoglobin Expression in Antarctic Icefishes. J. Exp. Biol. 2006, 209, 1791–1802. [Google Scholar] [CrossRef]
- Maffia, M.; Rizzello, A.; Rizzello, A.; Acierno, R.; Rollo, M.; Chiloiro, R.; Storelli, C. Carbonic Anhydrase Activity in Tissues of the Icefish Chionodraco Hamatus and of the Red-Blooded Teleosts Trematomus Bernacchii and Anguilla Anguilla. J. Exp. Biol. 2001, 204, 3983–3992. [Google Scholar] [CrossRef]
- Ansaloni, F.; Gerdol, M.; Torboli, V.; Fornaini, N.R.; Greco, S.; Giulianini, P.G.; Coscia, M.R.; Miccoli, A.; Santovito, G.; Buonocore, F.; et al. Cold Adaptation in Antarctic Notothenioids: Comparative Transcriptomics Reveals Novel Insights in the Peculiar Role of Gills and Highlights Signatures of Cobalamin Deficiency. Int. J. Mol. Sci. 2021, 22, 1812. [Google Scholar] [CrossRef]
- Sanchez, S.; Dettai, A.; Bonillo, C.; Ozouf-Costaz, C.; Ozouf-Costaz, C.; Detrich, H.W.; Lecointre, G. Molecular and Morphological Phylogenies of the Antarctic Teleostean Family Nototheniidae, with Emphasis on the Trematominae. Polar Biol. 2007, 30, 155–166. [Google Scholar] [CrossRef]
- Brueggeman, P. Underwater Field Guide to Ross Island & McMurdo Sound, Antarctica; The National Science Foundation’s Office of Polar Progams, University of California: San Diego, CA, USA, 1998. [Google Scholar]
- Miller, R.G. History and Atlas of the Fishes of the Antarctic Ocean; Foresta Institute: Carson City, NV, USA, 1993. [Google Scholar]
- Bilyk, K.T.; DeVries, A.L. Heat Tolerance and Its Plasticity in Antarctic Fishes. Comp. Biochem. Physiol. A Mol. Integr. Physiol. 2011, 158, 382–390. [Google Scholar] [CrossRef]
- Somero, G.N.; DeVries, A.L. Temperature Tolerance of Some Antarctic Fishes. Science 1967, 156, 257–258. [Google Scholar] [CrossRef] [PubMed]
- Podrabsky, J.E.; Somero, N. Inducible Heat Tolerance in Antarctic Notothenioid Fishes. Polar Biol. 2006, 30, 39–43. [Google Scholar] [CrossRef]
- Sandersfeld, T.; Davison, W.; Lamare, M.; Knust, R.; Richter, C. Elevated Temperature Causes Metabolic Trade-Offs at the Whole Organism Level in the Antarctic Fish Trematomusbernacchii. J. Exp. Biol. 2015, 15, 2373–2381. [Google Scholar] [CrossRef]
- Jayasundara, N.; Healy, T.M.; Somero, G.N. Effects of Temperature Acclimation on Cardiorespiratory Performance of the Antarctic Notothenioid Trematomus Bernacchii. Polar Biol. 2013, 36, 1047–1057. [Google Scholar] [CrossRef]
- Enzor, L.A.; Hunter, E.M.; Place, S.P. The Effects of Elevated Temperature and Ocean Acidification on the Metabolic Pathways of Notothenioid Fish. Conserv. Physiol. 2017, 5, 19. [Google Scholar] [CrossRef] [PubMed]
- Sleadd, I.M.; Lee, M.; Hassumani, D.O.; Stecyk, T.M.; Zeitz, O.K.; Buckley, B.A. Sub-Lethal Heat Stress Causes Apoptosis in an Antarctic Fish That Lacks an Inducible Heat Shock Response. J. Therm. Biol. 2014, 44, 119–125. [Google Scholar] [CrossRef] [PubMed]
- Garofalo, F.; Santovito, G.; Amelio, D. Morpho-Functional Effects of Heat Stress on the Gills of Antarctic T. Bernacchii and C. Hamatus. Mar. Pollut. Bull. 2019, 141, 194–204. [Google Scholar] [CrossRef]
- Truzzi, C.; Annibaldi, A.; Antonucci, M.; Scarponi, G.; Illuminati, S. Gas Chromatography–Mass Spectrometry Analysis on Effects of Thermal Shock on the Fatty Acid Composition of the Gills of the Antarctic Teleost, Trematomus Bernacchii. Environ. Chem. 2018, 15, 424–435. [Google Scholar] [CrossRef]
- Rizzotti, D.; Manfrin, C.; Gerdol, M.; Greco, S.; Santovito, G.; Giulianini, P. Morphological Analysis of Erythrocytes of an Antarctic Teleost under Heat Stress: Bias of the Stabling Effect. J. Therm. Biol. 2021, 103, 103139. [Google Scholar] [CrossRef]
- Illumina Pooling Calculator. Available online: https://support.illumina.com/help/pooling-calculator/pooling-calculator.htm (accessed on 13 July 2019).
- Ewels, P.; Magnusson, M.; Lundin, S.; Käller, M. MultiQC: Summarize Analysis Results for Multiple Tools and Samples in a Single Report. Bioinformatics 2016, 32, 3047–3048. [Google Scholar] [CrossRef]
- Chen, S.; Zhou, Y.; Chen, Y.; Gu, J. Fastp: An Ultra-Fast All-in-One FASTQ Preprocessor. bioRxiv 2018. [Google Scholar] [CrossRef] [PubMed]
- Bista, I.; Wood, J.M.D.; Desvignes, T.; McCarthy, S.A.; Matschiner, M.; Ning, Z.; Tracey, A.; Torrance, J.; Sims, Y.; Chow, W.; et al. Genomics of Cold Adaptations in the Antarctic Notothenioid Fish Radiation. bioRxiv 2022, 494096v1. [Google Scholar] [CrossRef]
- Patro, R.; Duggal, G.; Love, M.I.; Irizarry, R.A.; Kingsford, C. Salmon Provides Fast and Bias-Aware Quantification of Transcript Expression. Nat. Methods 2017, 14, 417–419. [Google Scholar] [CrossRef] [PubMed]
- Corley, S.M.; Troy, N.M.; Bosco, A.; Wilkins, M.R. QuantSeq. 3’ Sequencing Combined with Salmon Provides a Fast, Reliable Approach for High Throughput RNA Expression Analysis. Sci. Rep. 2019, 9, 18895. [Google Scholar] [CrossRef] [PubMed]
- R Core Team. R: A Language and Environment for Statistical Computing; R Foundation for Statistical Computing: Vienna, Austria, 2020. [Google Scholar]
- Soneson, C.; Love, M.I.; Robinson, M.D. Differential Analyses for RNA-seq: Transcript-Level Estimates Improve Gene-Level Inferences. F1000Research 2015, 4, 1521. [Google Scholar] [CrossRef] [PubMed]
- Robinson, M.D.; McCarthy, D.J.; Smyth, G.K. edgeR: A Bioconductor Package for Differential Expression Analysis of Digital Gene Expression Data. Bioinformatics 2010, 26, 139–140. [Google Scholar] [CrossRef] [PubMed]
- McCarthy, D.J.; Chen, Y.; Smyth, G.K. Differential Expression Analysis of Multifactor RNA-Seq Experiments with Respect to Biological Variation. Nucleic Acids Res. 2012, 40, 4288–4297. [Google Scholar] [CrossRef]
- Pedregosa, F.; Varoquaux, G.; Gramfort, A.; Michel, V.; Thirion, B.; Grisel, O.; Blondel, M.; Prettenhofer, P.; Weiss, R.; Dubourg, V.; et al. Scikit-Learn: Machine Learning in Python. J. Mach. Learn. Res. 2011, 12, 2825–2830. [Google Scholar]
- The UniProt Consortium. UniProt: The Universal Protein Knowledgebase in 2021. Nucleic Acids Res. 2021, 49, D480–D489. [Google Scholar] [CrossRef]
- Buchfink, B.; Xie, C.; Huson, D.H. Fast and Sensitive Protein Alignment Using DIAMOND. Nat. Methods 2015, 12, 59–60. [Google Scholar] [CrossRef]
- Jones, P.; Binns, D.; Chang, H.Y.; Fraser, M.; Li, W.; McAnulla, C.; McWilliam, H.; Maslen, J.; Mitchell, A.; Nuka, G.; et al. InterProScan 5: Genome-scale Protein Function Classification. Bioinformatics 2014, 30, 1236–1240. [Google Scholar] [CrossRef] [PubMed]
- Blum, M.; Chang, H.Y.; Chuguransky, S.; Grego, T.; Kandasaamy, S.; Mitchell, A.; Nuka, G.; Paysan-Lafosse, T.; Qureshi, M.; Raj, S.; et al. The InterPro Protein Families and Domains Database: 20 Years On. Nucleic Acids Res. 2021, 49, D344–D354. [Google Scholar] [CrossRef] [PubMed]
- Consortium, G.O. The Gene Ontology (GO) Database and Informatics Resource. Nucleic Acids Res. 2004, 32, D258–D261. [Google Scholar] [CrossRef] [PubMed]
- The Gene Ontology Consortium; Carbon, S.; Douglass, E.; Good, B.M.; Unni, D.R.; Harris, N.L.; Mungall, C.J.; Basu, S.; Chisholm, R.L.; Dodson, R.J.; et al. The Gene Ontology Resource: Enriching a GOld Mine. Nucleic Acids Res. 2021, 49, D325–D334. [Google Scholar] [CrossRef]
- Subramanian, A.; Tamayo, P.; Mootha, V.K.; Mukherjee, S.; Ebert, B.L.; Gillette, M.A.; Paulovich, A.G.; Pomeroy, S.L.; Golub, T.R.; Lander, E.S.; et al. Gene Set Enrichment Analysis: A Knowledge-Based Approach for Interpreting Genome-Wide Expression Profiles. Proc. Natl. Acad. Sci. USA 2005, 102, 15545–15550. [Google Scholar] [CrossRef]
- Timmons, J.A.; Szkop, K.J.; Gallagher, I.J. Multiple Sources of Bias Confound Functional Enrichment Analysis of Global-Omics Data. Genome Biol. 2015, 16, 186. [Google Scholar] [CrossRef]
- Wright, R.M.; Aglyamova, G.V.; Meyer, E.; Matz, M.V. Gene expression associated with white syndromes in a reef building coral, Acropora hyacinthus. BMC Genom. 2015, 16, 371. [Google Scholar] [CrossRef]
- Wickham, H. Ggplot2: Elegant Graphics for Data Analysis; Springer: New York, NY, USA, 2016. [Google Scholar]
- Waskom, M.L. Seaborn: Statistical Data Visualization. J. Open Source Softw. 2021, 6, 3021. [Google Scholar] [CrossRef]
- Hunter, J.D. Matplotlib: A 2D graphics environment. Comput. Sci. Eng. 2007, 9, 90–95. [Google Scholar] [CrossRef]
- Huth, T.J.; Place, S.P. Transcriptome wide analyses reveal a sustained cellular stress response in the gill tissue of Trematomus bernacchii after acclimation to multiple stressors. BMC Genom. 2016, 17, 127. [Google Scholar] [CrossRef]
- Truzzi, C.; Illuminati, S.; Antonucci, M.; Scarponi, G.; Annibaldi, A. Heat Shock Influences the Fatty Acid Composition of the Muscle of the Antarctic Fish Trematomus Bernacchii. Mar. Environ. Res. 2018, 139, 122–128. [Google Scholar] [CrossRef] [PubMed]
- Vasadia, D.J.; Zippay, M.L.; Place, S.P. Characterization of thermally sensitive miRNAs reveals a central role of the FoxO signaling pathway in regulating the cellular stress response of an extreme stenotherm, Trematomus bernacchii. Mar. Genom. 2019, 48, 100698. [Google Scholar] [CrossRef] [PubMed]
- Giuliani, M.E.; Nardi, A.; Carlo, M.D.; Benedetti, M.; Regoli, F. Transcriptional and Catalytic Responsiveness of the Antarctic Fish Trematomus bernacchii Antioxidant System toward Multiple Stressors. Antioxidants 2021, 10, 410. [Google Scholar] [CrossRef] [PubMed]
- Zgajnar, N.; De Leo, S.; Lotufo, C.; Erlejman, A.; Piwien-Pilipuk, G.; Galigniana, M. Biological Actions of the Hsp90-binding Immunophilins FKBP51 and FKBP52. Biomolecules 2019, 9, 52. [Google Scholar] [CrossRef]
- Wochnik, G.M.; Rüegg, J.; Abel, G.A.; Schmidt, U.; Holsboer, F.; Rein, T. FK506-binding Proteins 51 and 52 Differentially Regulate Dynein Interaction and Nuclear Translocation of the Glucocorticoid Receptor in Mammalian Cells. J. Biol. Chem. 2005, 280, 4609–4616. [Google Scholar] [CrossRef] [PubMed]
- Caratti, G.; Matthews, L.; Poolman, T.; Kershaw, S.; Baxter, M.; Ray, D. Glucocorticoid Receptor Function in Health and Disease. Clin. Endocrinol. 2015, 83, 441–448. [Google Scholar] [CrossRef]
- Medzhitov, R. Origin and Physiological Roles of Inflammation. Nature 2008, 454, 428–435. [Google Scholar] [CrossRef]
- Martin, L.B. Stress and Immunity in Wild Vertebrates: Timing is Everything. Gen. Comp. Endocrinol. 2009, 163, 70–76. [Google Scholar] [CrossRef]
- Bilyk, K.T.; Cheng, C.H.C. RNA-seq Analyses of Cellular Responses to Elevated Body Temperature in the High Antarctic Cryopelagic Nototheniid Fish Pagothenia Borchgrevinki. Mar. Genom. 2014, 18, 163–171. [Google Scholar] [CrossRef]
- Clark, M.S.; Fraser, K.P.P.; Burns, G.; Peck, L.S. The HSP70 Heat Shock Response in the Antarctic Fish Harpagifer Antarcticus. Polar Biol. 2007, 31, 171–180. [Google Scholar] [CrossRef]
- Ismailov, I.I.; Scharping, J.B.; Andreeva, I.E.; Friedlander, M.J. Antarctic Teleosts with and without Hemoglobin Behaviorally Mitigate Deleterious Effects of Acute Environmental Warming. PLoS ONE 2021, 16, e0252359. [Google Scholar] [CrossRef] [PubMed]
- Bolognin, S.; Messori, L.; Zatta, P. Metal Ion Physiopathology in Neurodegenerative Disorders. Neuromolecular Med. 2009, 11, 223–238. [Google Scholar] [CrossRef] [PubMed]
- Nakashima, A.S.; Dyck, R.H. Zinc and Cortical Plasticity. Brain Res. Rev. 2009, 59, 347–373. [Google Scholar] [CrossRef] [PubMed]
- Drago, D.; Cavaliere, A.; Mascetra, N.; Ciavardelli, D.; Di Ilio, C.; Zatta, P.; Sensi, S.L. Aluminum Modulates Effects of β Amyloid 1–42 on Neuronal Calcium Homeostasis and Mitochondria Functioning and Is Altered in a Triple Transgenic Mouse Model of Alzheimer’s Disease. Rejuvenation Res. 2008, 11, 861–871. [Google Scholar] [CrossRef]
- Song, J.; Xie, H.; Lian, Z.; Zhaorui, L.; Yang, G.T.; Yang, G.; Du, R.; Du, Y.; Zou, X.; Jin, H.; et al. Enhanced Cell Survival of Gastric Cancer Cells by a Novel Gene URG4. Neoplasia 2006, 8, 995–1002. [Google Scholar] [CrossRef]
- Tufan, N.L.S.; Lian, Z.; Zhaorui, L.; Liu, J.; Pan, J.; Arbuthnot, P.; Kew, M.C.; Clayton, M.; Zhu, M.H.; Feitelson, M.A. Hepatitis Bx Antigen Stimulates Expression of a Novel Cellular Gene, URG4, That Promotes Hepatocellular Growth and Survival. Neoplasia 2002, 4, 355–368. [Google Scholar] [CrossRef]
- Turchi, L.; Fareh, M.; Aberdam, E.; Kitajima, S.; Simpson, F.; Wicking, C.; Aberdam, D.; Virolle, T. ATF3 and p15PAF Are Novel Gatekeepers of Genomic Integrity upon UV Stress. Cell Death Differ. 2009, 16, 728–737. [Google Scholar] [CrossRef]
- Segura-Totten, M.; Kowalski, A.K.; Craigie, R.; Wilson, K.L. Barrier-to-Autointegration Factor: Major Roles in Chromatin Decondensation and Nuclear Assembly. J. Cell Biol. 2002, 158, 475–485. [Google Scholar] [CrossRef]
- Ishimi, Y. A DNA Helicase Activity Is Associated with an MCM4, -6, and -7 Protein Complex. J. Biol. Chem. 1997, 272, 24508–24513. [Google Scholar] [CrossRef]
- Gee, H.Y.; Ashraf, S.; Wan, X.; Vega-Warner, V.; Esteve-Rudd, J.; Lovric, S.; Fang, H.; Hurd, T.W.; Sadowski, C.E.; Allen, S.J.; et al. Mutations in EMP2 Cause Childhood-Onset Nephrotic Syndrome. Am. J. Hum. Genet. 2014, 94, 884–890. [Google Scholar] [CrossRef]
- Morales, S.A.; Telander, D.G.; Leon, D.; Forward, K.; Braun, J.; Wadehra, M.; Gordon, L.K. Epithelial Membrane Protein 2 Controls VEGF Expression in ARPE-19 Cells. Investig. Ophthalmol. Vis. Sci. 2013, 54, 2367–2372. [Google Scholar] [CrossRef] [PubMed]
- Takao, M.; Kanno, S.i.; Kobayashi, K.; Zhang, Q.M.; Yonei, S.; van der Horst, G.T.; Yasui, A. A Back-up Glycosylase in Nth1 Knock-out Mice Is a Functional Nei (Endonuclease VIII) Homologue. J. Biol. Chem. 2002, 277, 42205–42213. [Google Scholar] [CrossRef] [PubMed]
- Masumoto, J.; Zhou, W.; Chen, F.F.; Su, F.; Kuwada, J.Y.; Hidaka, E.; Katsuyama, T.; Sagara, J.; Taniguchi, S.; Ngo-Hazelett, P.; et al. Caspy, a Zebrafish Caspase, Activated by ASC Oligomerization is Required for Pharyngeal Arch Development. J. Biol. Chem. 2003, 278, 4268–4276. [Google Scholar] [CrossRef] [PubMed]
- Li, J.Y.; Gao, K.; Shao, T.; Fan, D.D.; Hu, C.B.; Sun, C.C.; Dong, W.R.; Lin, A.F.; Xiang, L.X.; Shao, J.Z. Characterization of an NLRP1 Inflammasome from Zebrafish Reveals a Unique Sequential Activation Mechanism Underlying Inflammatory Caspases in Ancient Vertebrates. J. Immunol. 2018, 201, 1946–1966. [Google Scholar] [CrossRef] [PubMed]
- Freund, A.; Zhong, F.L.; Venteicher, A.S.; Meng, Z.; Veenstra, T.D.; Frydman, J.; Artandi, S.E. Proteostatic Control of Telomerase Function through TRiC-mediated Folding of TCAB1. Cell 2014, 159, 1389–1403. [Google Scholar] [CrossRef]
- Dutta, S.; Tan, Y.J. Structural and Functional Characterization of Human SGT and Its Interaction with Vpu of the Human Immunodeficiency Virus Type 1. Biochemistry 2008, 47, 10123–10131. [Google Scholar] [CrossRef]
- Liu, F.H.; Wu, S.J.; Hu, S.M.; Hsiao, C.D.; Wang, C. Specific Interaction of the 70-kDa Heat Shock Cognate Protein with the Tetratricopeptide Repeats. J. Biol. Chem. 1999, 274, 34425–34432. [Google Scholar] [CrossRef]
- Buckley, B.A.; Somero, G.N. cDNA Microarray Analysis Reveals the Capacity of the Cold-Adapted Antarctic Fish Trematomus Bernacchii to Alter Gene Expression in Response to Heat Stress. Polar Biol. 2009, 32, 403–415. [Google Scholar] [CrossRef]
- Feeser, E.A.; Ignacio, C.M.G.; Krendel, M.; Ostap, E.M. Myo1e Binds Anionic Phospholipids with High Affinity. Biochemistry 2010, 49, 9353–9360. [Google Scholar] [CrossRef]
- Krendel, M.; Osterweil, E.K.; Mooseker, M.S. Myosin 1E Interacts with Synaptojanin-1 and Dynamin and is Involved in Endocytosis. FEBS Lett. 2007, 581, 644–650. [Google Scholar] [CrossRef]
- Kim, H.; Tao, S.; Song, S.; Cho, W. Sorting Nexin 21 is a Novel Membrane-binding Endonuclease. FASEB J. 2015, 29, LB175. [Google Scholar] [CrossRef]
- Mostowy, S.; Cossart, P. Septins: The Fourth Component of the Cytoskeleton. Nat. Rev. Mol. Cell Biol. 2012, 13, 183–194. [Google Scholar] [CrossRef]
- Pappalardo, A.M.; Ferrito, V.; Biscotti, M.A.; Canapa, A.; Capriglione, T. Transposable Elements and Stress in Vertebrates: An Overview. Int. J. Mol. Sci. 2021, 22, 1970. [Google Scholar] [CrossRef]
- DeDiego, M.L.; Nogales, A.; Martinez-Sobrido, L.; Topham, D.J. Interferon-Induced Protein 44 Interacts with Cellular FK506-Binding Protein 5, Negatively Regulates Host Antiviral Responses, and Supports Virus Replication. mBio 2019, 10, e01839-19. [Google Scholar] [CrossRef]
- Kueck, T.; Bloyet, L.M.; Cassella, E.; Zang, T.; Schmidt, F.; Brusic, V.; Tekes, G.; Pornillos, O.; Whelan, S.P.J.; Bieniasz, P.D. Vesicular Stomatitis Virus Transcription is Inhibited by TRIM69 in the Interferon-Induced Antiviral State. J. Virol. 2019, 93, e01372-19. [Google Scholar] [CrossRef]
- Rihn, S.J.; Aziz, M.A.; Stewart, D.G.; Hughes, J.; Turnbull, M.L.; Varela, M.; Sugrue, E.; Herd, C.S.; Stanifer, M.; Sinkins, S.P.; et al. TRIM69 Inhibits Vesicular Stomatitis Indiana Virus. J. Virol. 2019, 93, e00951-19. [Google Scholar] [CrossRef]
- Webb, L.M.C.; Pascall, J.C.; Hepburn, L.; Carter, C.; Turner, M.; Butcher, G.W. Generation and Characterisation of Mice Deficient in the Multi-GTPase Domain Containing Protein, GIMAP8. PLoS ONE 2014, 9, e110294. [Google Scholar] [CrossRef]
- Hirst, J.; Edgar, J.R.; Esteves, T.; Darios, F.; Madeo, M.; Chang, J.; Roda, R.H.; Dürr, A.; Anheim, M.; Gellera, C.; et al. Loss of AP-5 Results in Accumulation of Aberrant Endolysosomes: Defining a New Type of Lysosomal Storage Disease. Hum. Mol. Genet. 2015, 24, 4984–4996. [Google Scholar] [CrossRef]
- Hoshino, S.; Miyazawa, H.; Enomoto, T.; Hanaoka, F.; Kikuchi, Y.; Kikuchi, A.; Ui, M. A Human Homologue of the Yeast GST1 Gene Codes for a GTP-binding Protein and Is Expressed in a Proliferation-Dependent Manner in Mammalian Cells. EMBO J. 1989, 8, 3807–3814. [Google Scholar] [CrossRef] [PubMed]
- Wang, X.; Xuan, Y.; Han, Y.; Ding, X.; Ye, K.; Yang, F.; Gao, P.; Goff, S.P.; Gao, G. Regulation of HIV-1 Gag-Pol Expression by Shiftless, an Inhibitor of Programmed-1 Ribosomal Frameshifting. Cell 2019, 176, 625–635.e14. [Google Scholar] [CrossRef] [PubMed]
- Liu, W.; Ma, N.; Gao, X.; Liu, W.; Jia, J.; Tang, L.; Li, M.; Yang, L.; Li, T.; Yan, L.; et al. Role of GSPT1 and GSPT2 Polymorphisms in Different Outcomes upon Hepatitis B Virus Infection and Prognosis to Lamivudine Therapy. Biosci. Rep. 2019, 39, BSR20181668. [Google Scholar] [CrossRef] [PubMed]
- Johnston, I.A. Muscle Metabolism and Growth in Antarctic Fishes (Suborder Notothenioidei): Evolution in a Cold Environment. Comp. Biochem. Physiol. Part B Biochem. Mol. Biol. 2003, 136, 701–713. [Google Scholar] [CrossRef] [PubMed]
Publisher’s Note: MDPI stays neutral with regard to jurisdictional claims in published maps and institutional affiliations. |
© 2022 by the authors. Licensee MDPI, Basel, Switzerland. This article is an open access article distributed under the terms and conditions of the Creative Commons Attribution (CC BY) license (https://creativecommons.org/licenses/by/4.0/).