
The Pathology and Splenic Transcriptome Profiling of Trionyx sinensis Challenged with Bacillus cereus

 ,
,
Abstract
1. Introduction
2. Materials and Methods
2.1. Animal Infection and Sample Collection
2.2. Histopathologic Observation
2.3. Detection of Virulence Factor Genes
2.4. RNA Extraction, cDNA Library Construction, and Sequencing
2.5. Raw Data Assembly and Annotation
2.6. Identification and Patterns of DEGs
2.7. GO Term and KEGG Pathway Enrichment Analysis of DEGs
2.8. Analysis of Gene Expression by qPCR
2.9. Statistical Analysis
3. Results
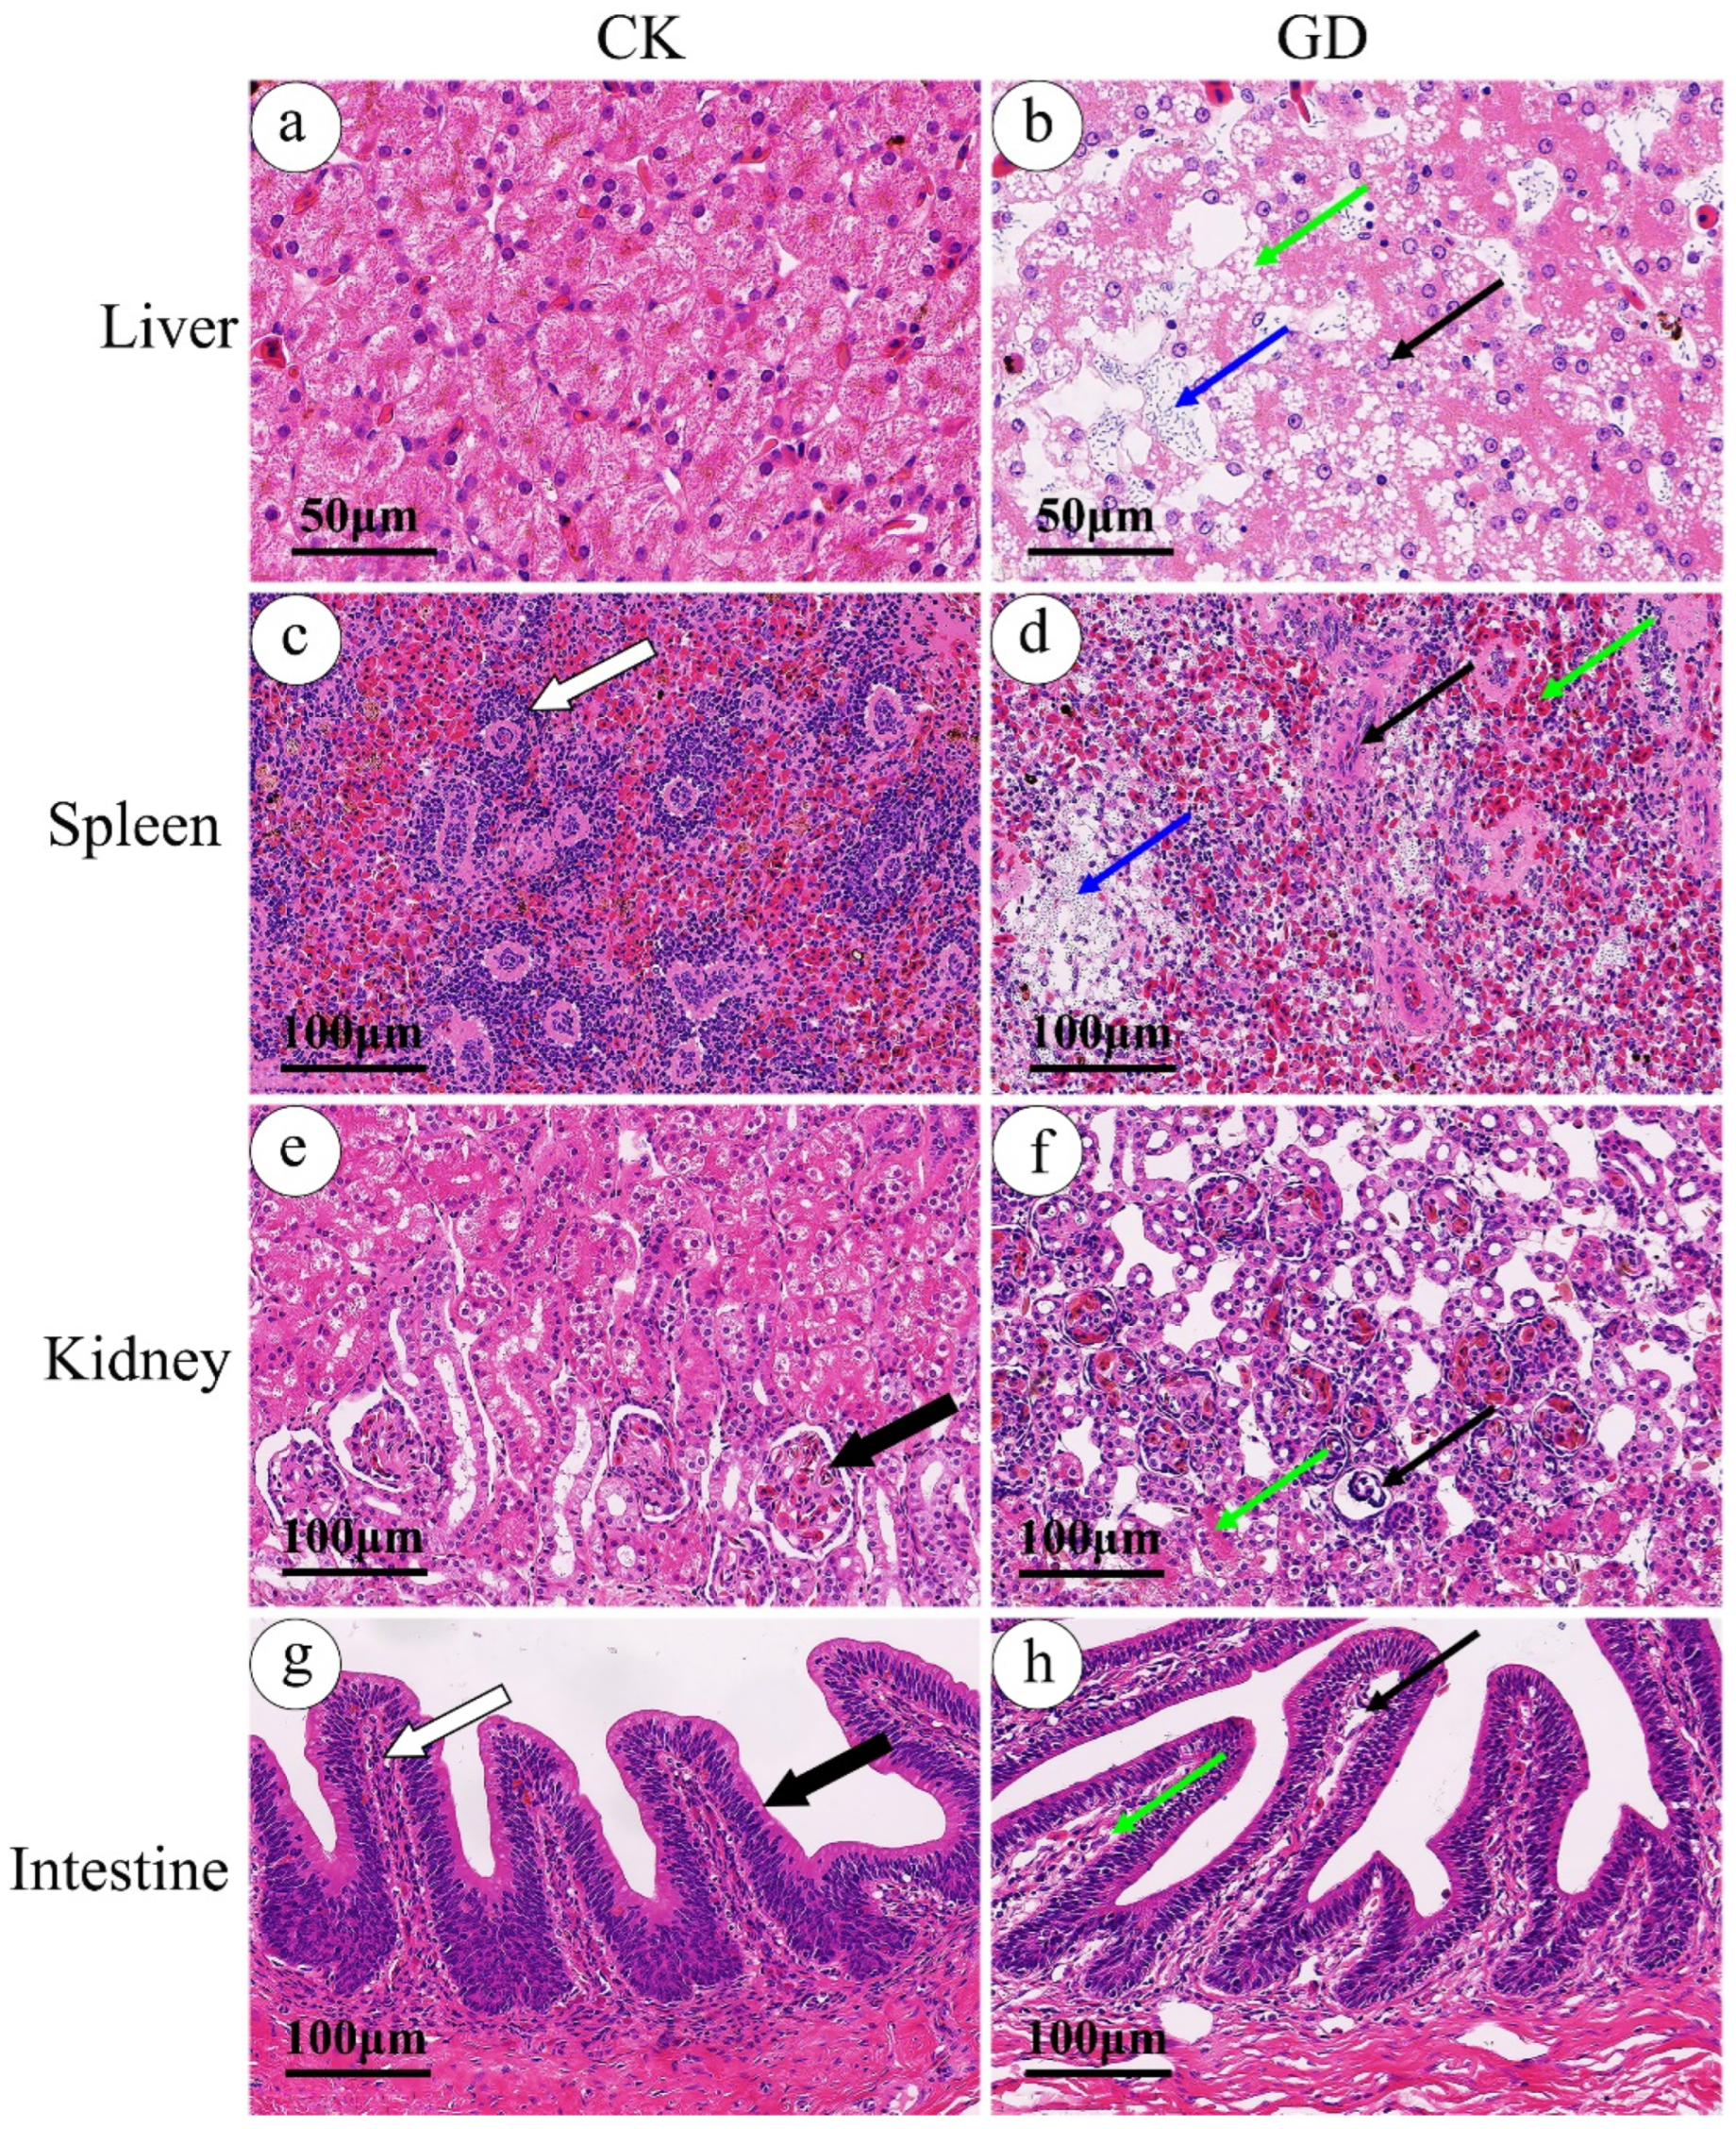
3.1. Histopathology
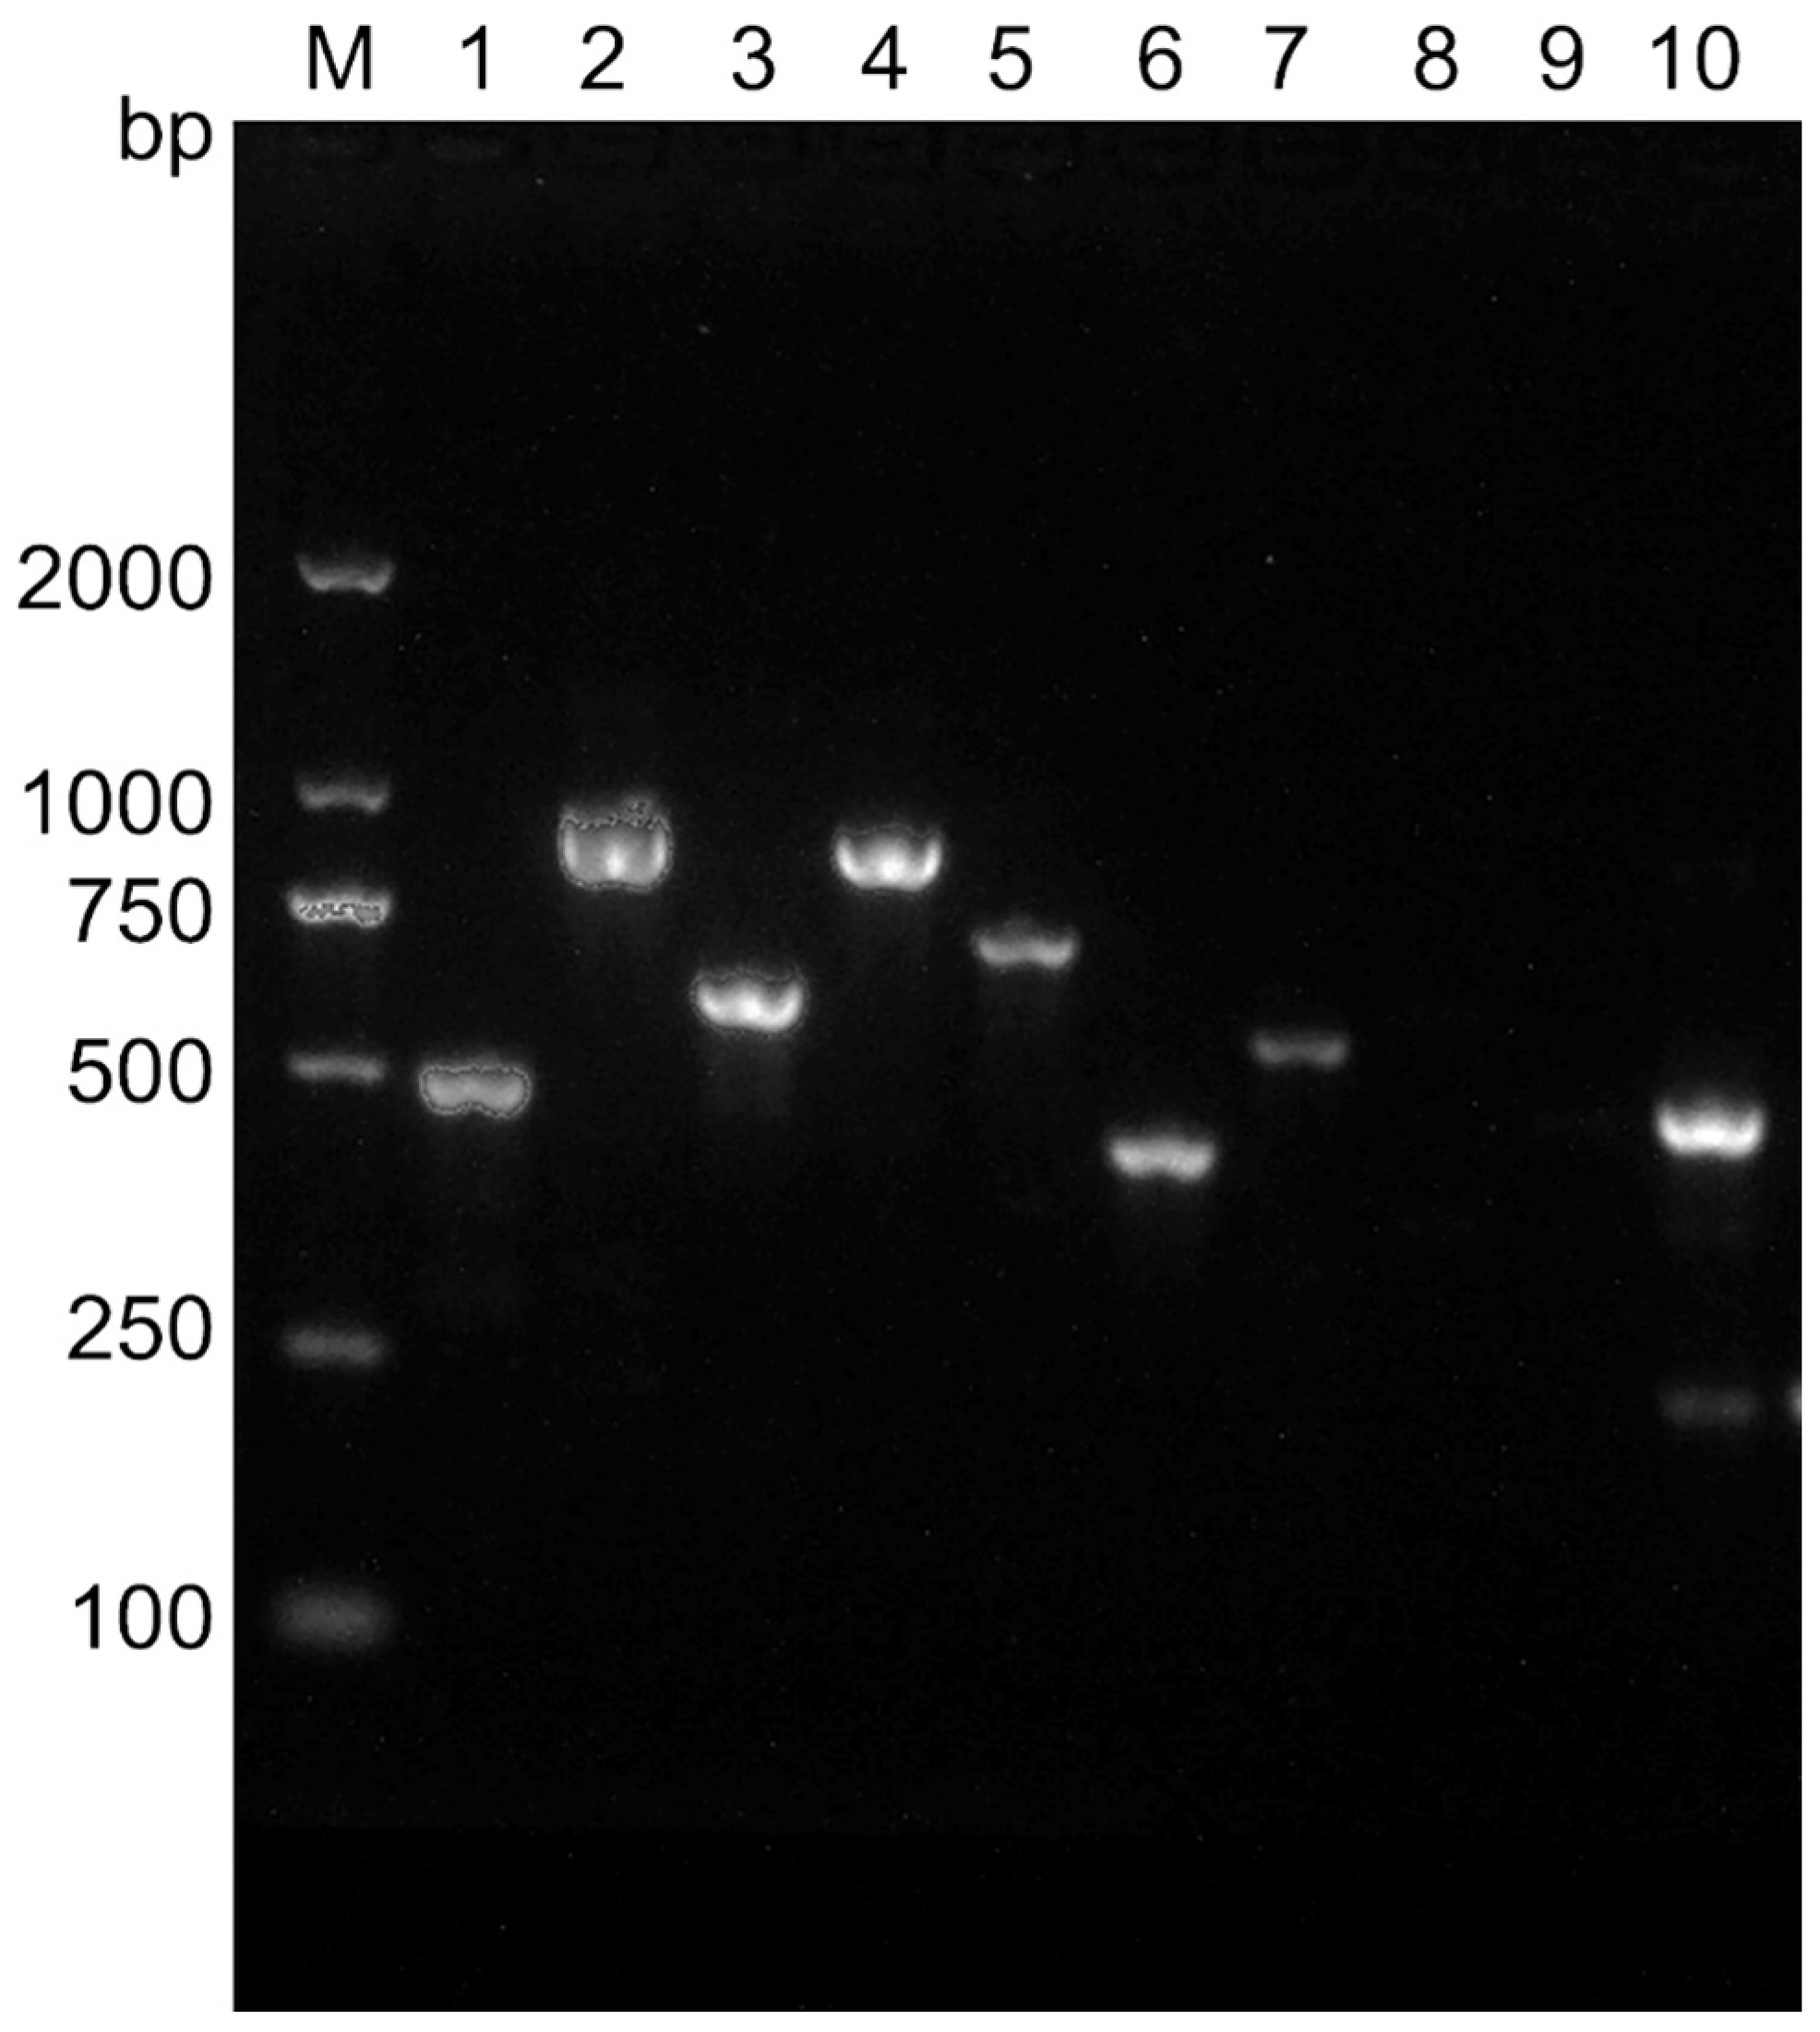
3.2. Toxigenic Profiles of B. cereus
3.3. Illumina Sequencing and de Novo Transcriptome Assembly
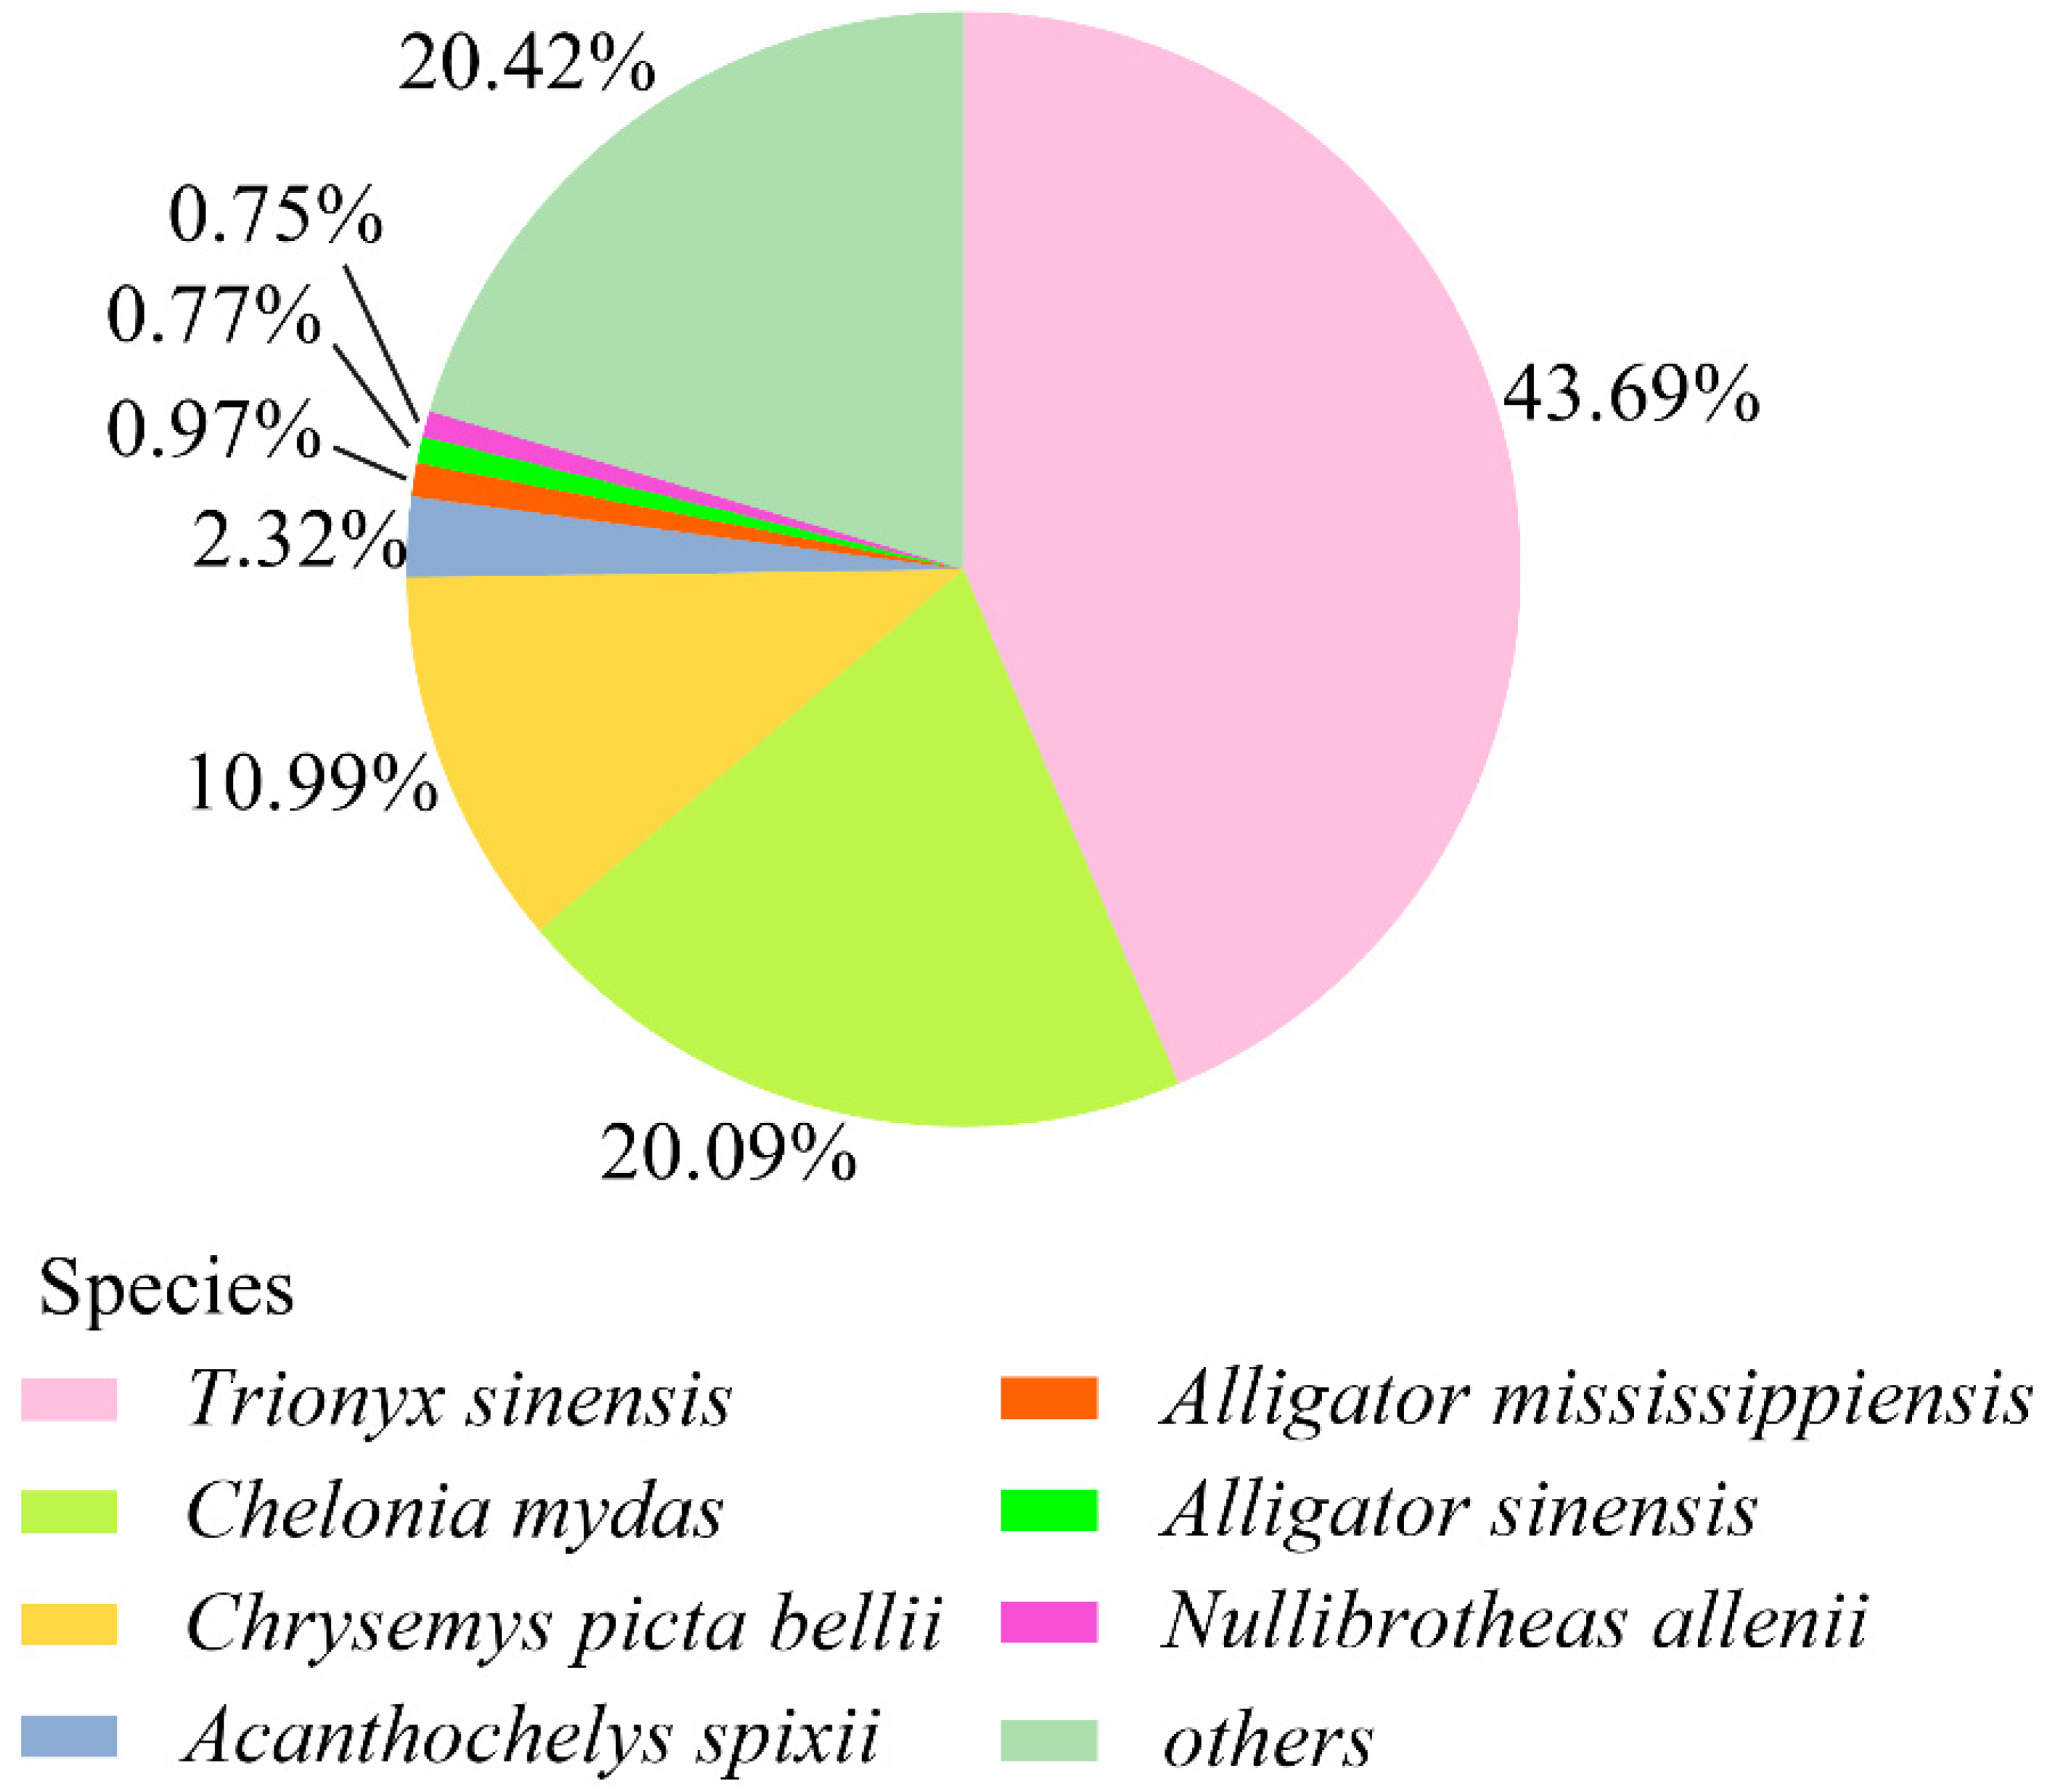
3.4. Unigene Annotation
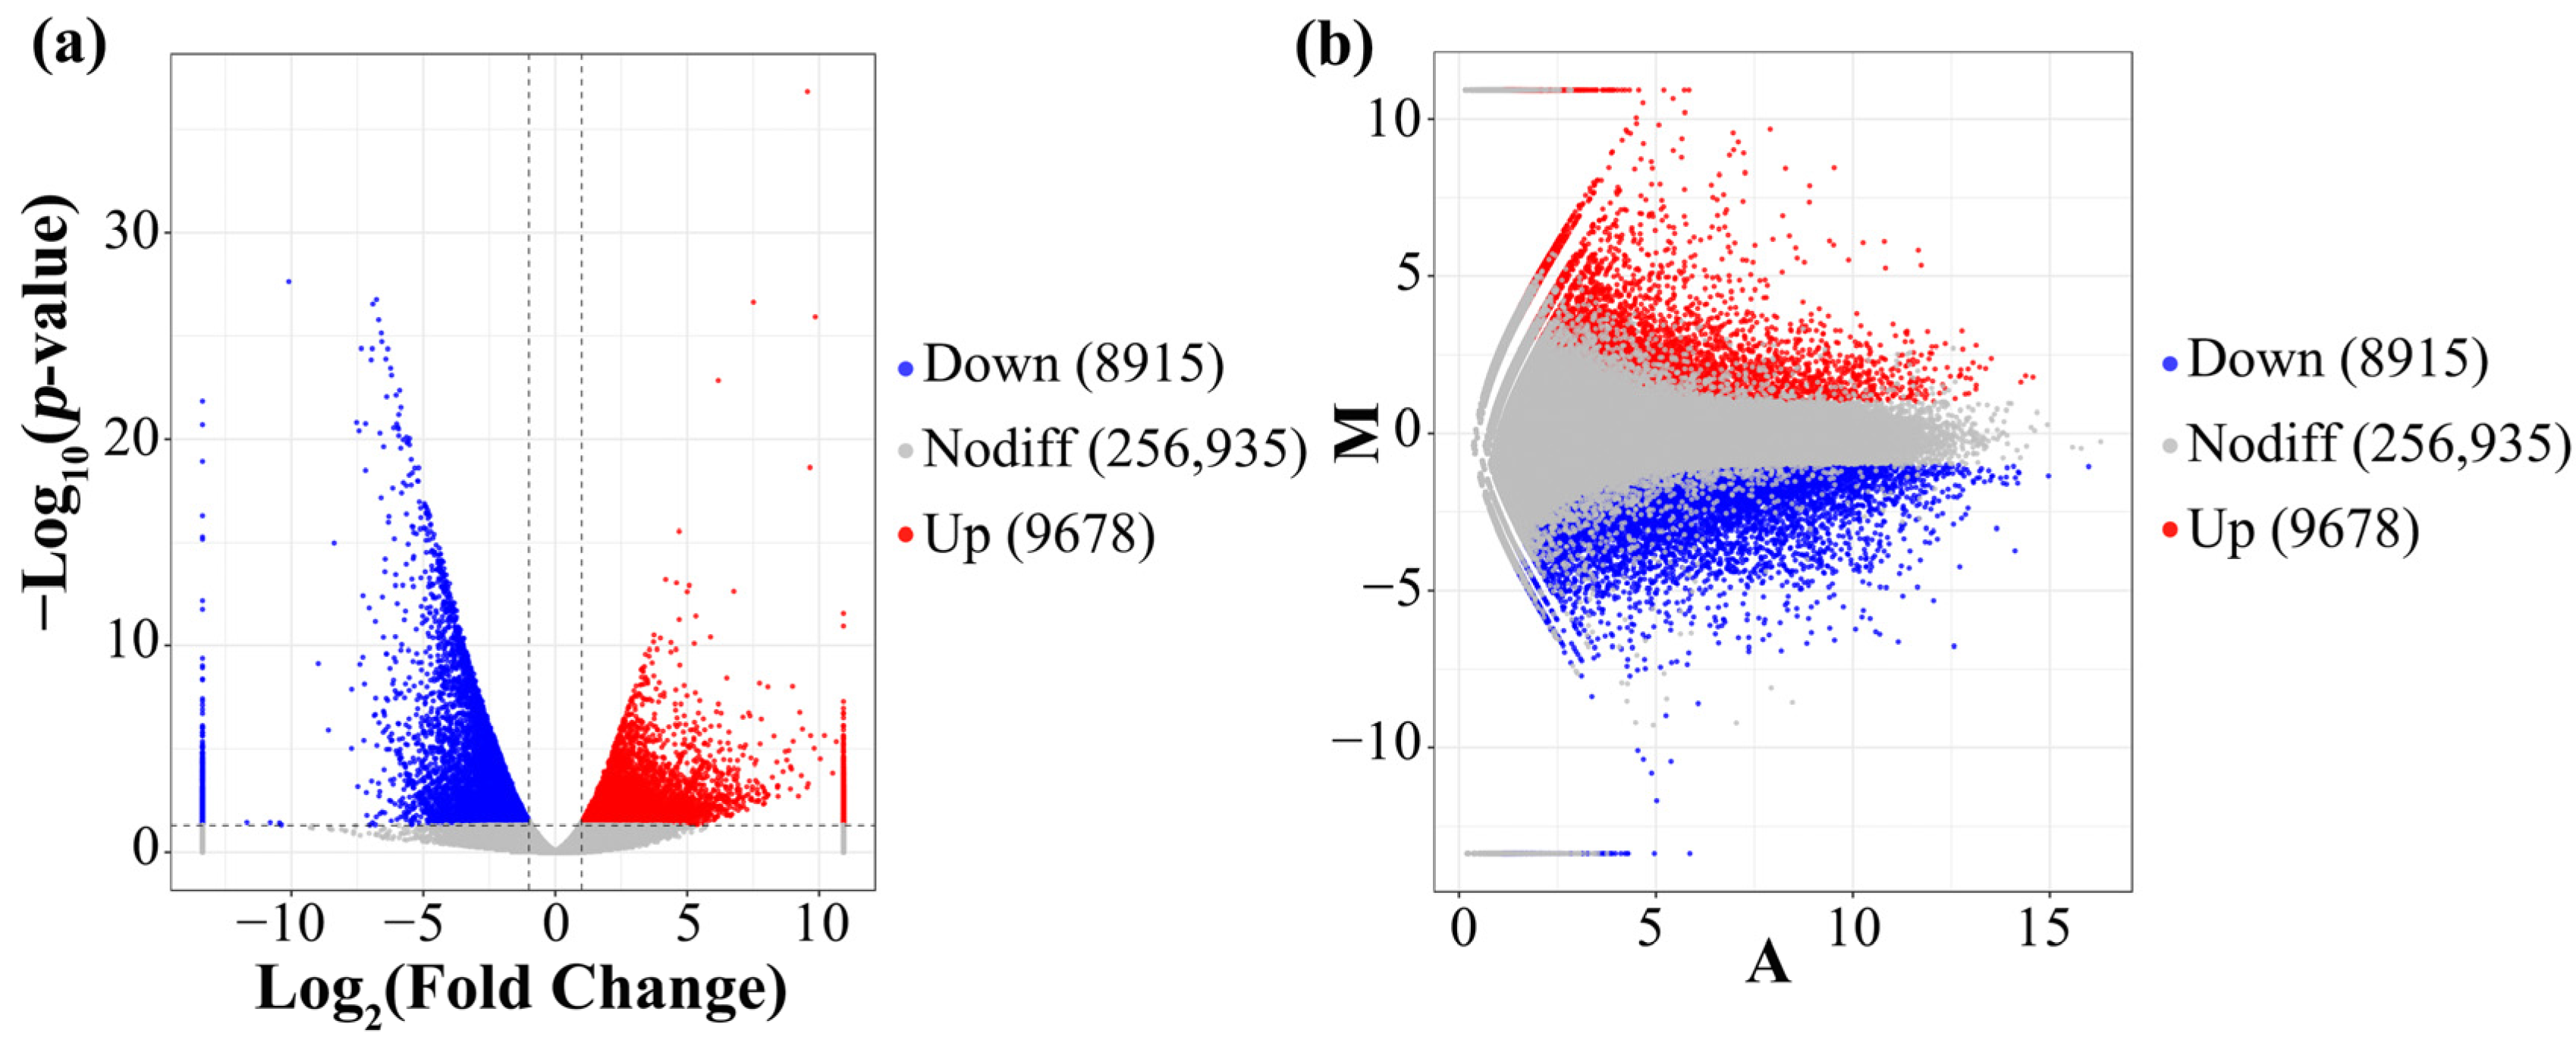
3.5. Analysis of the DEGs
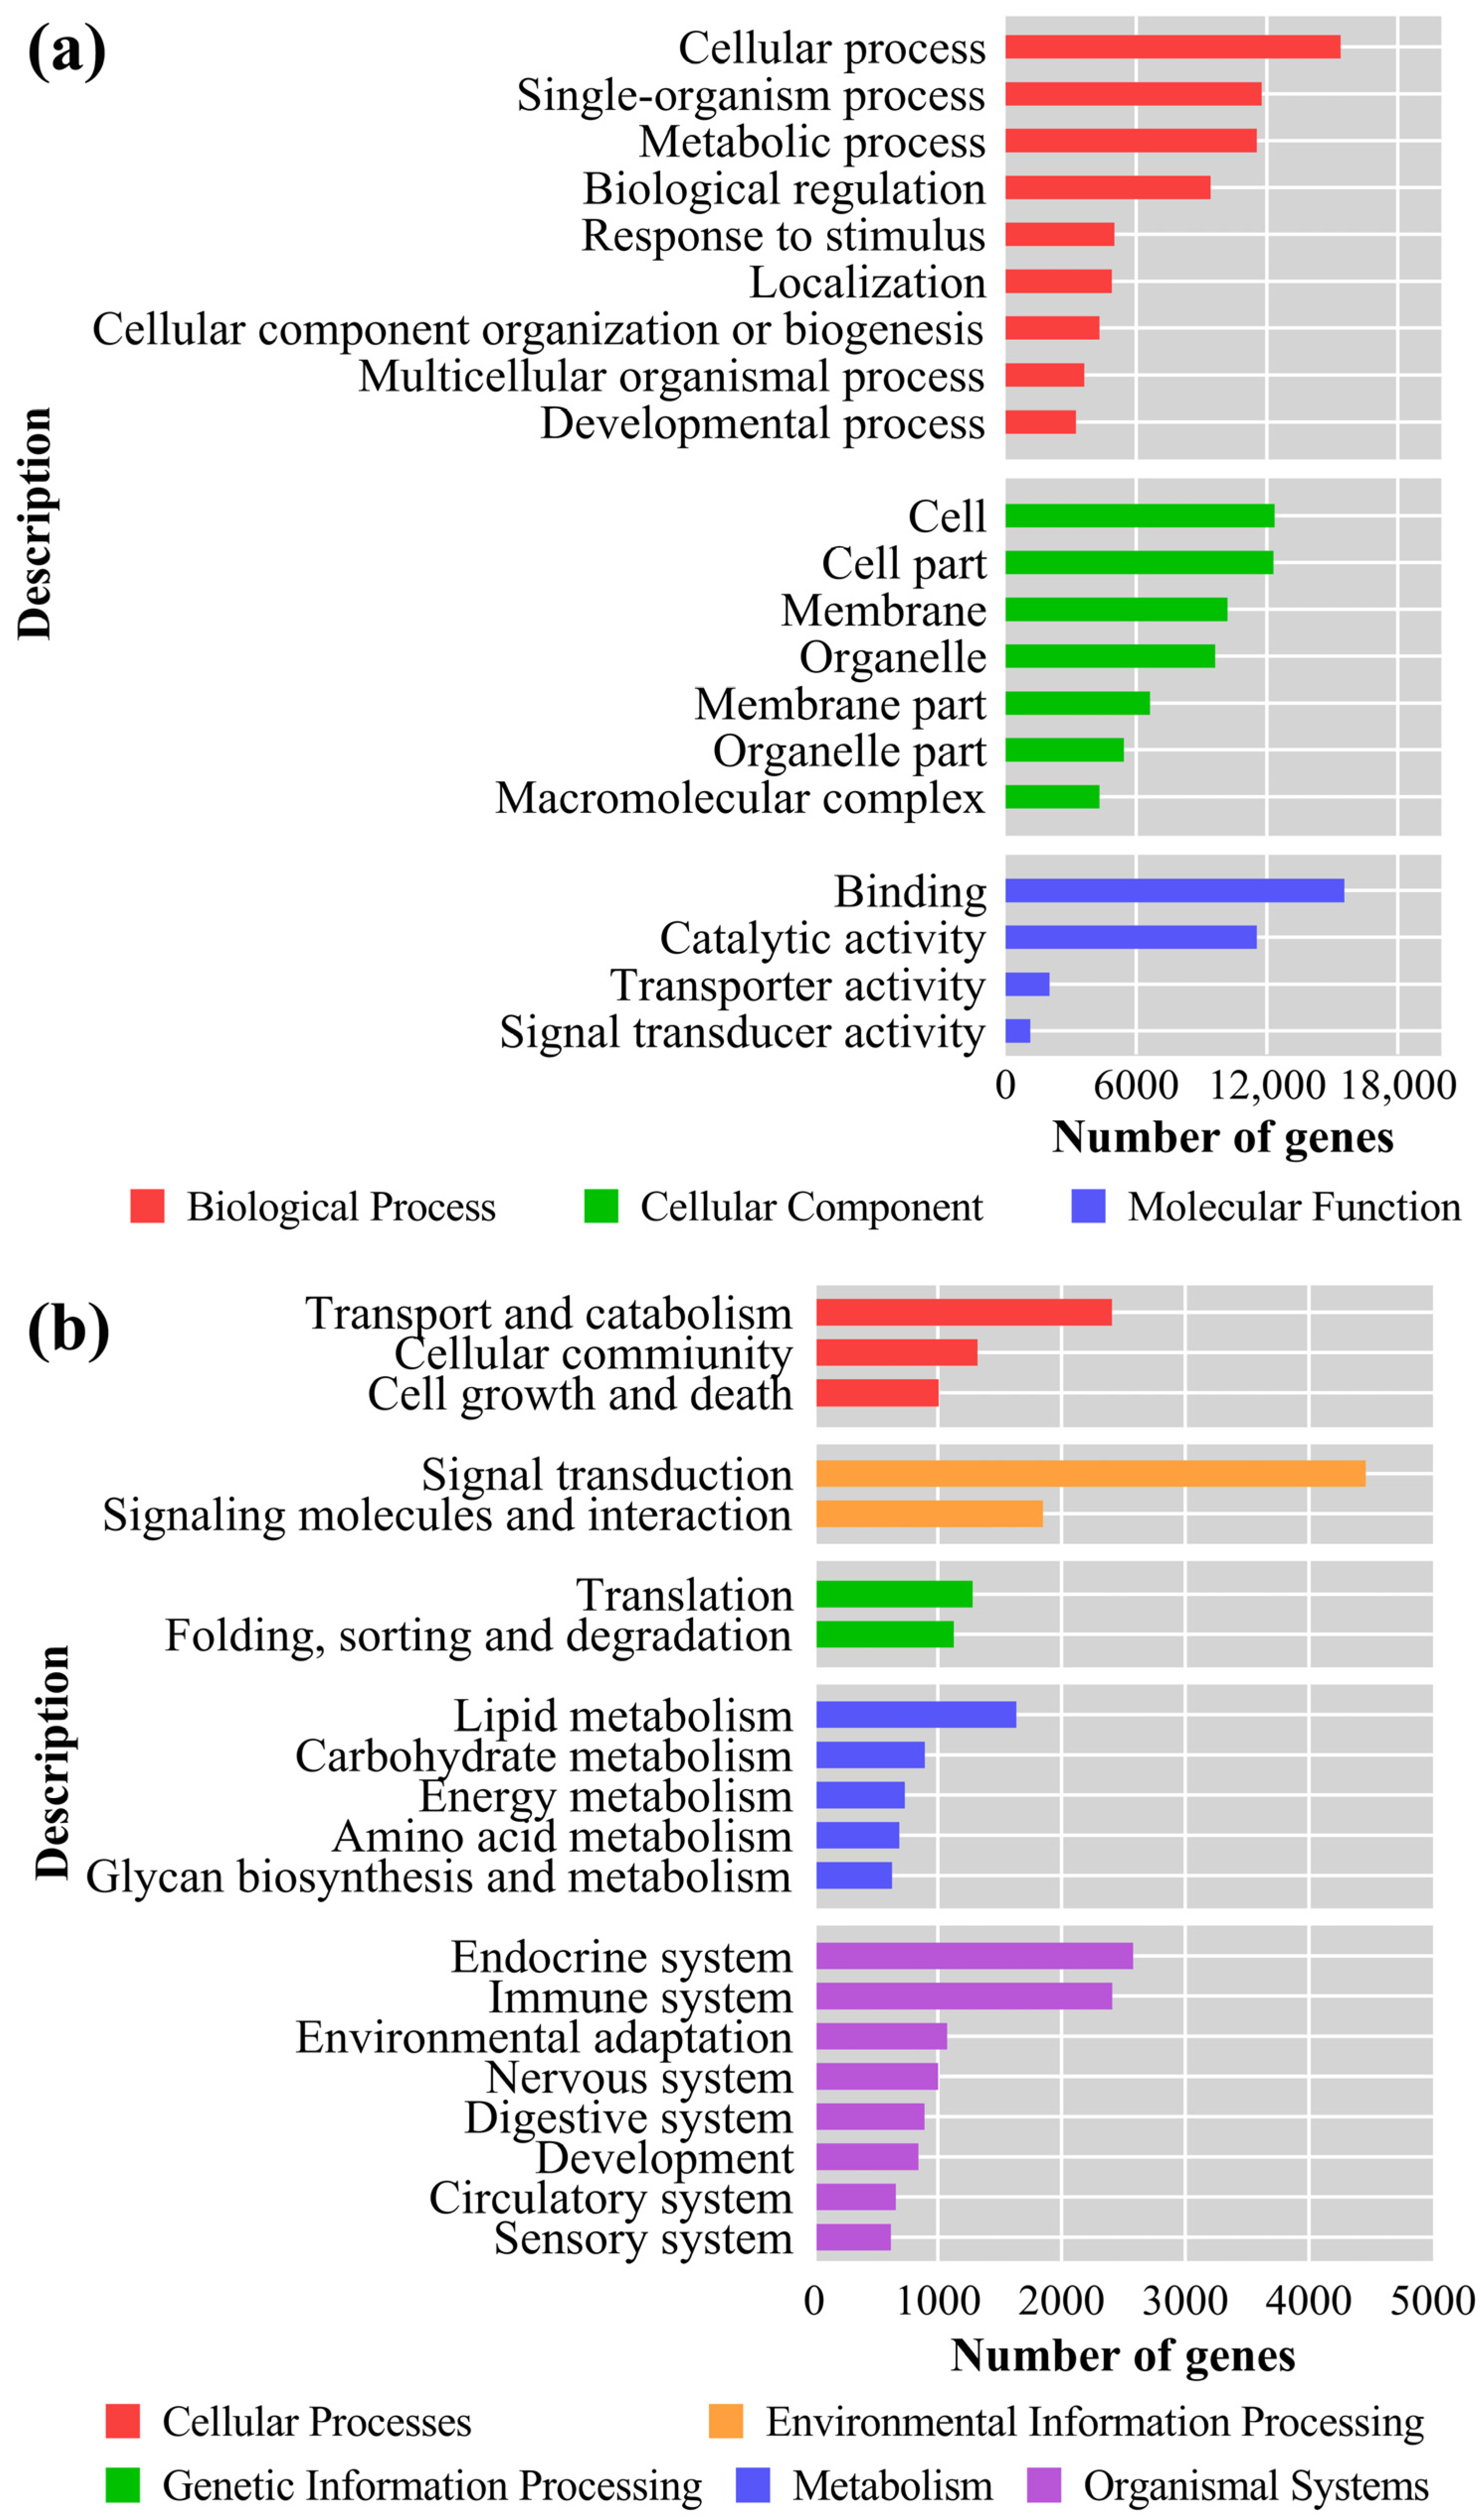
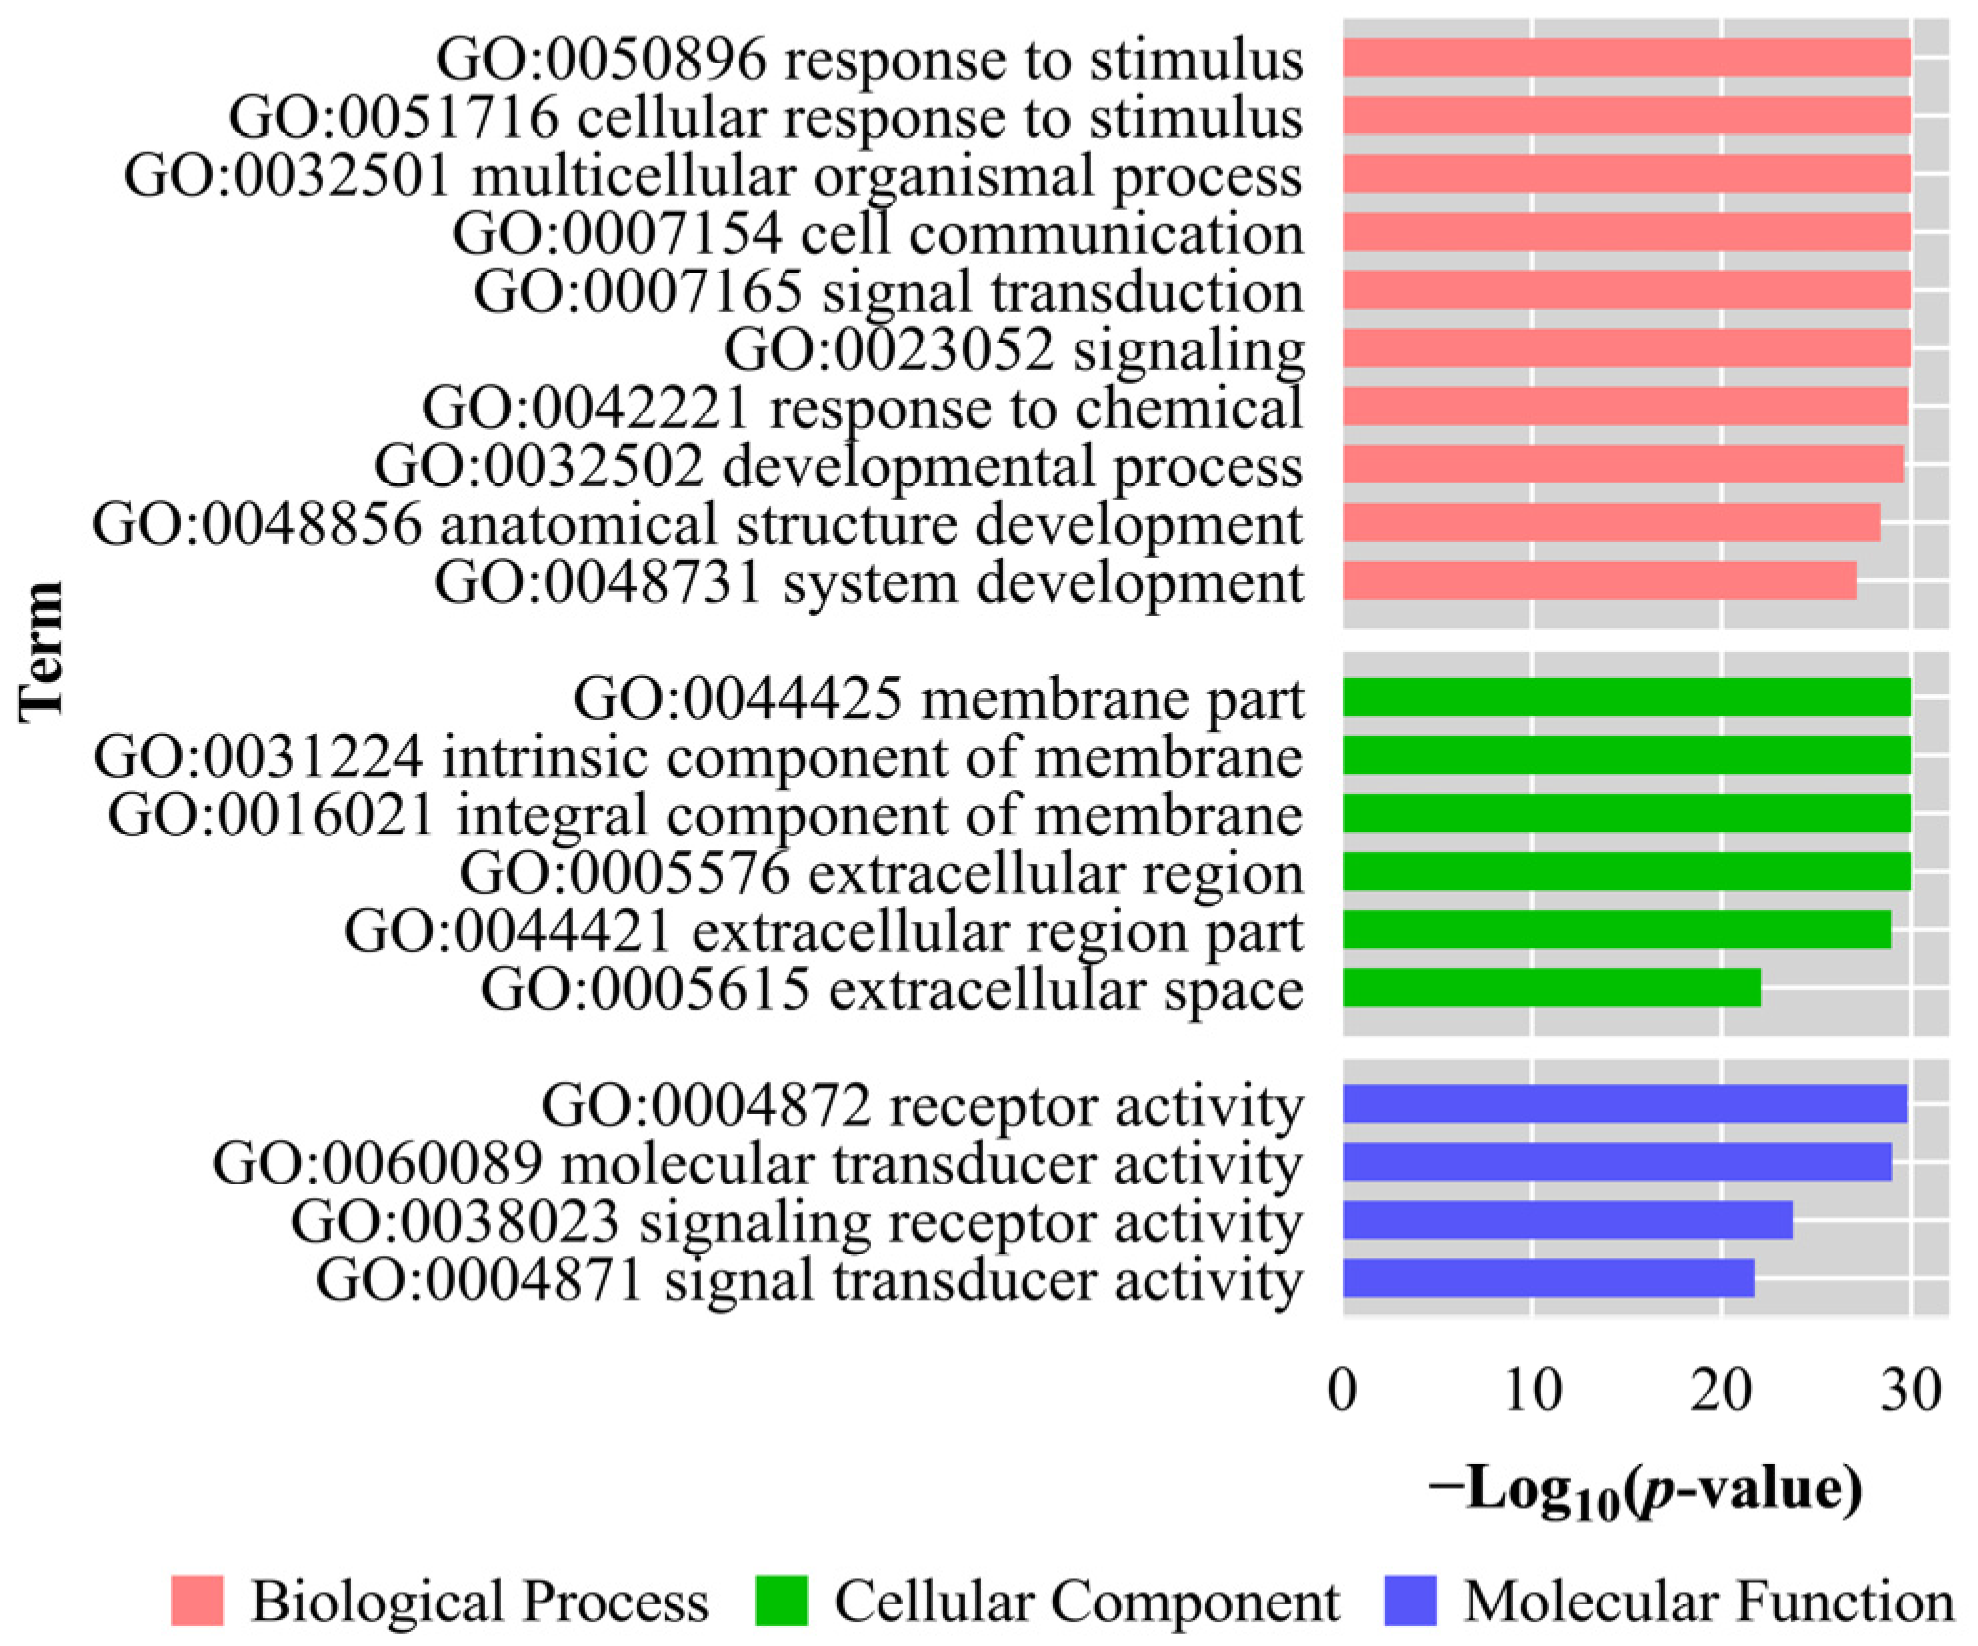
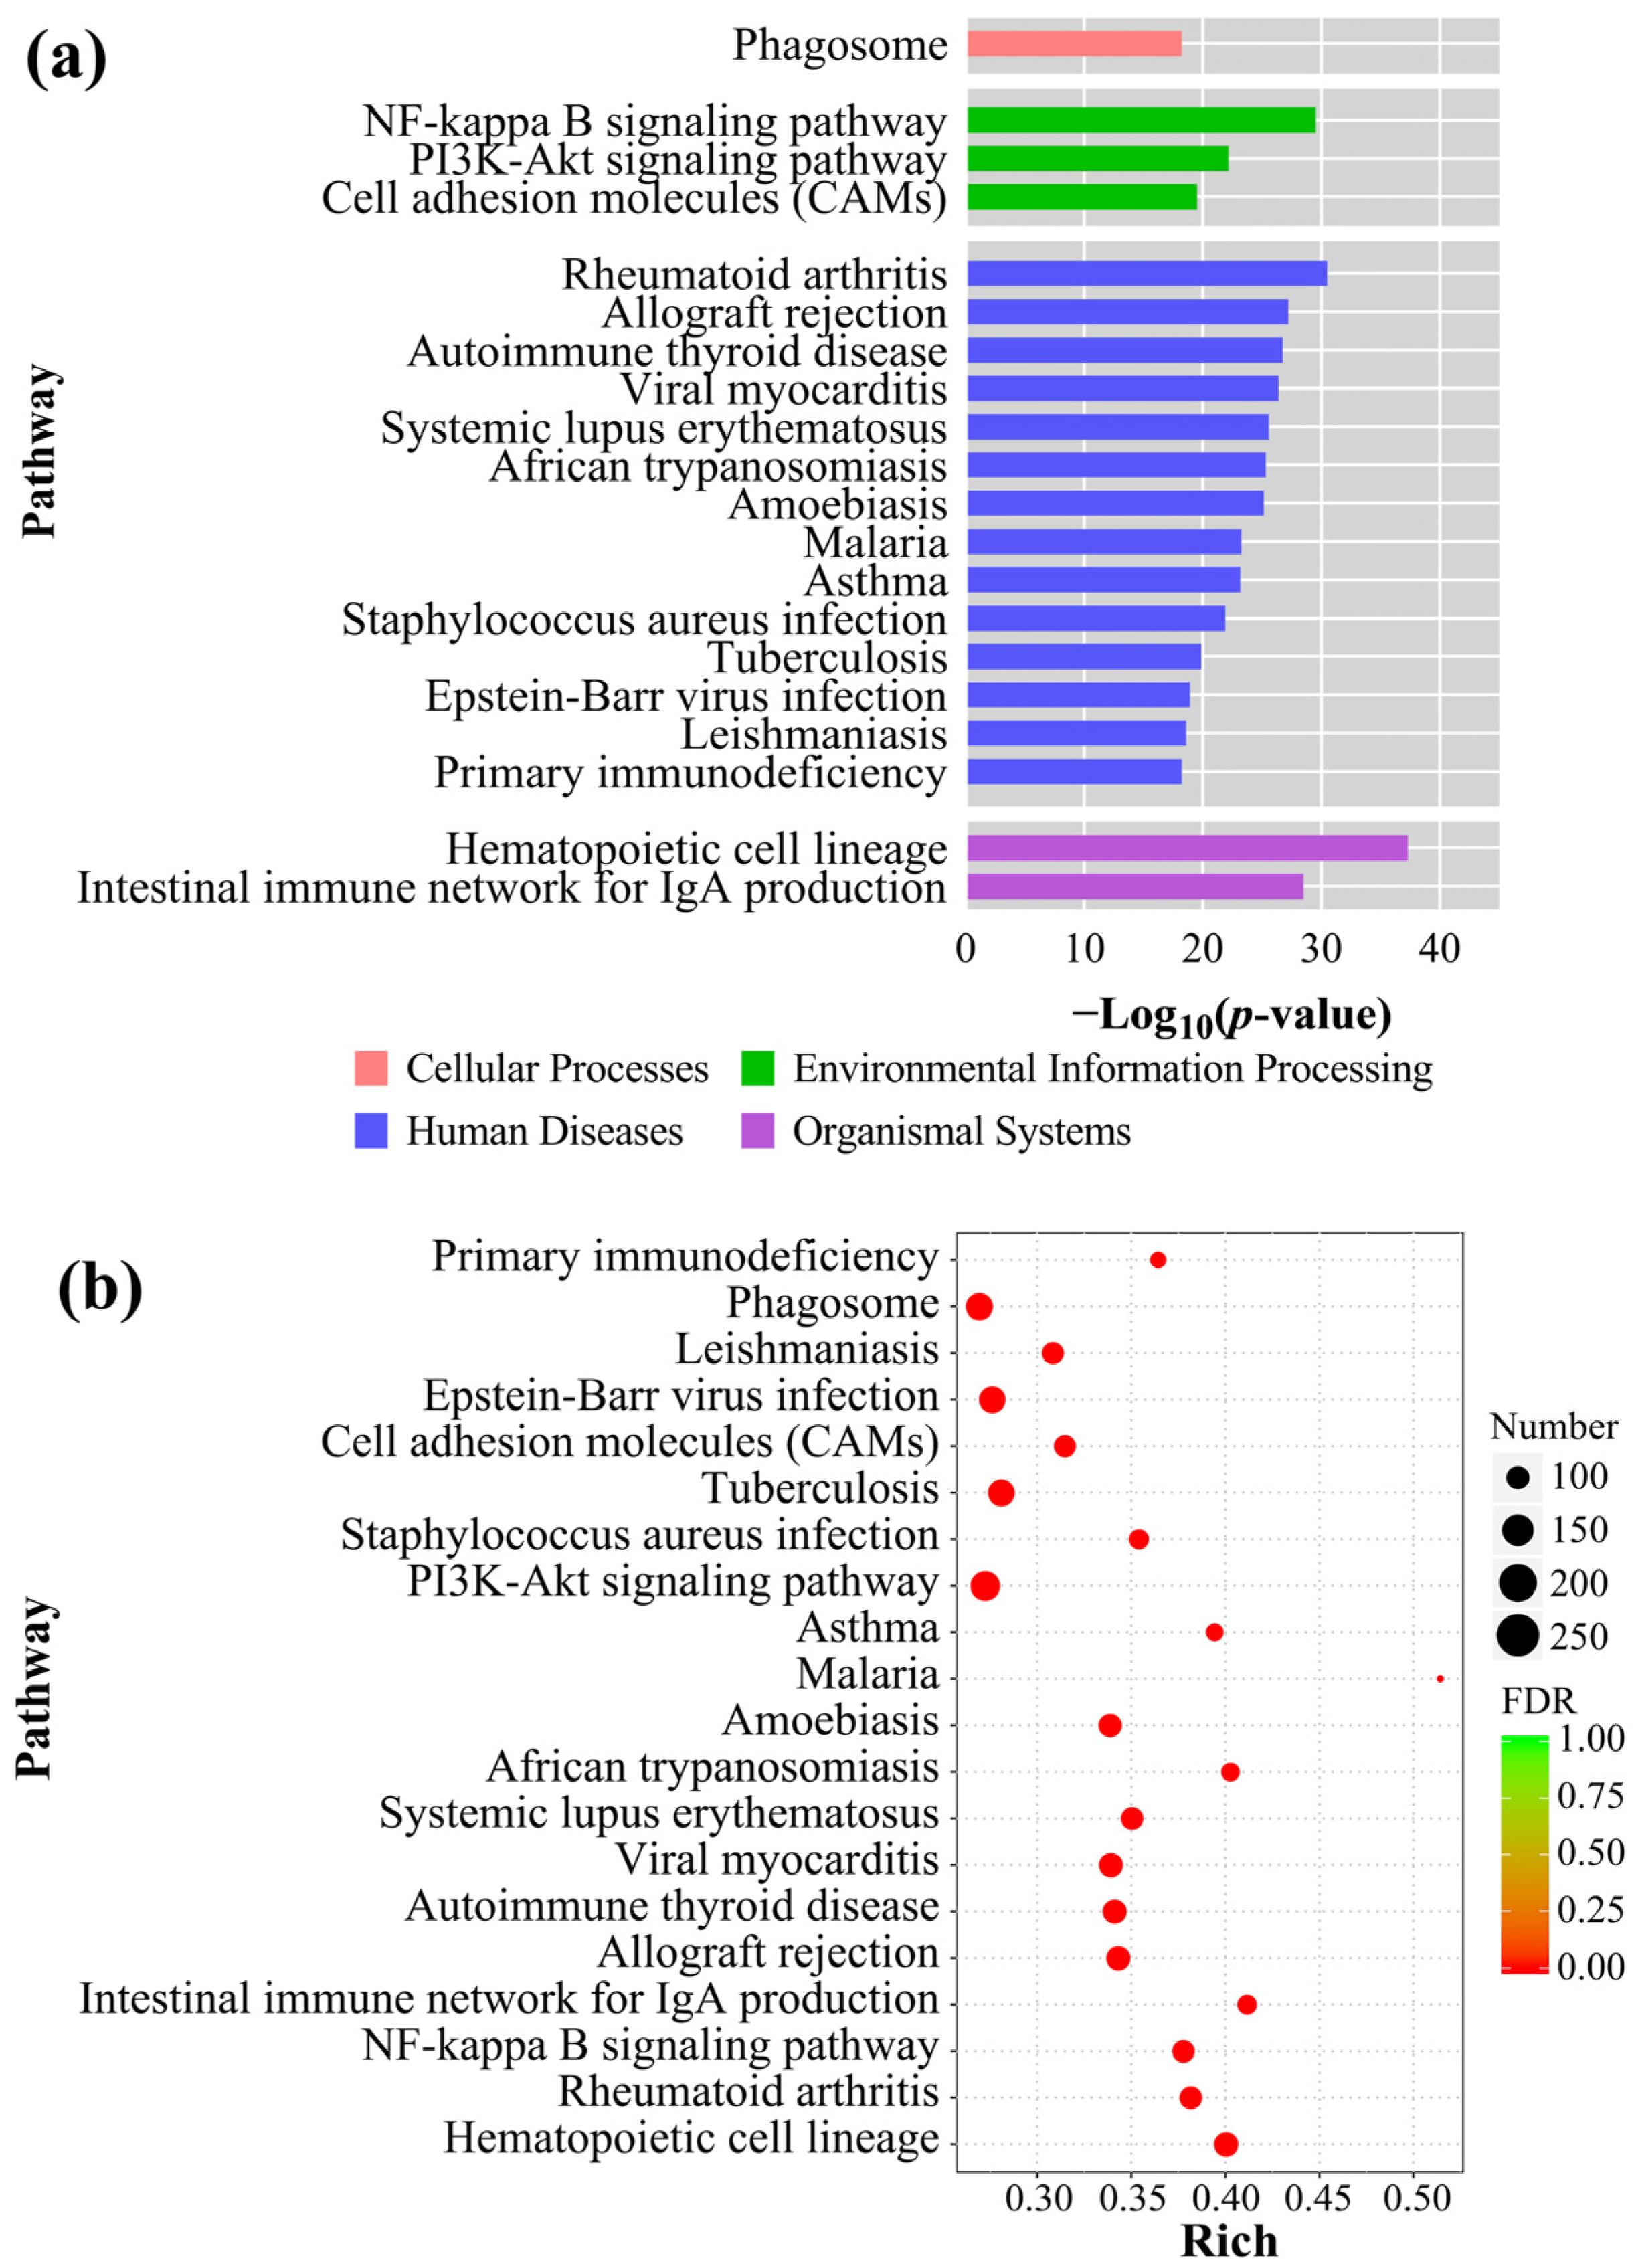
3.6. GO Analysis and KEGG Enrichment
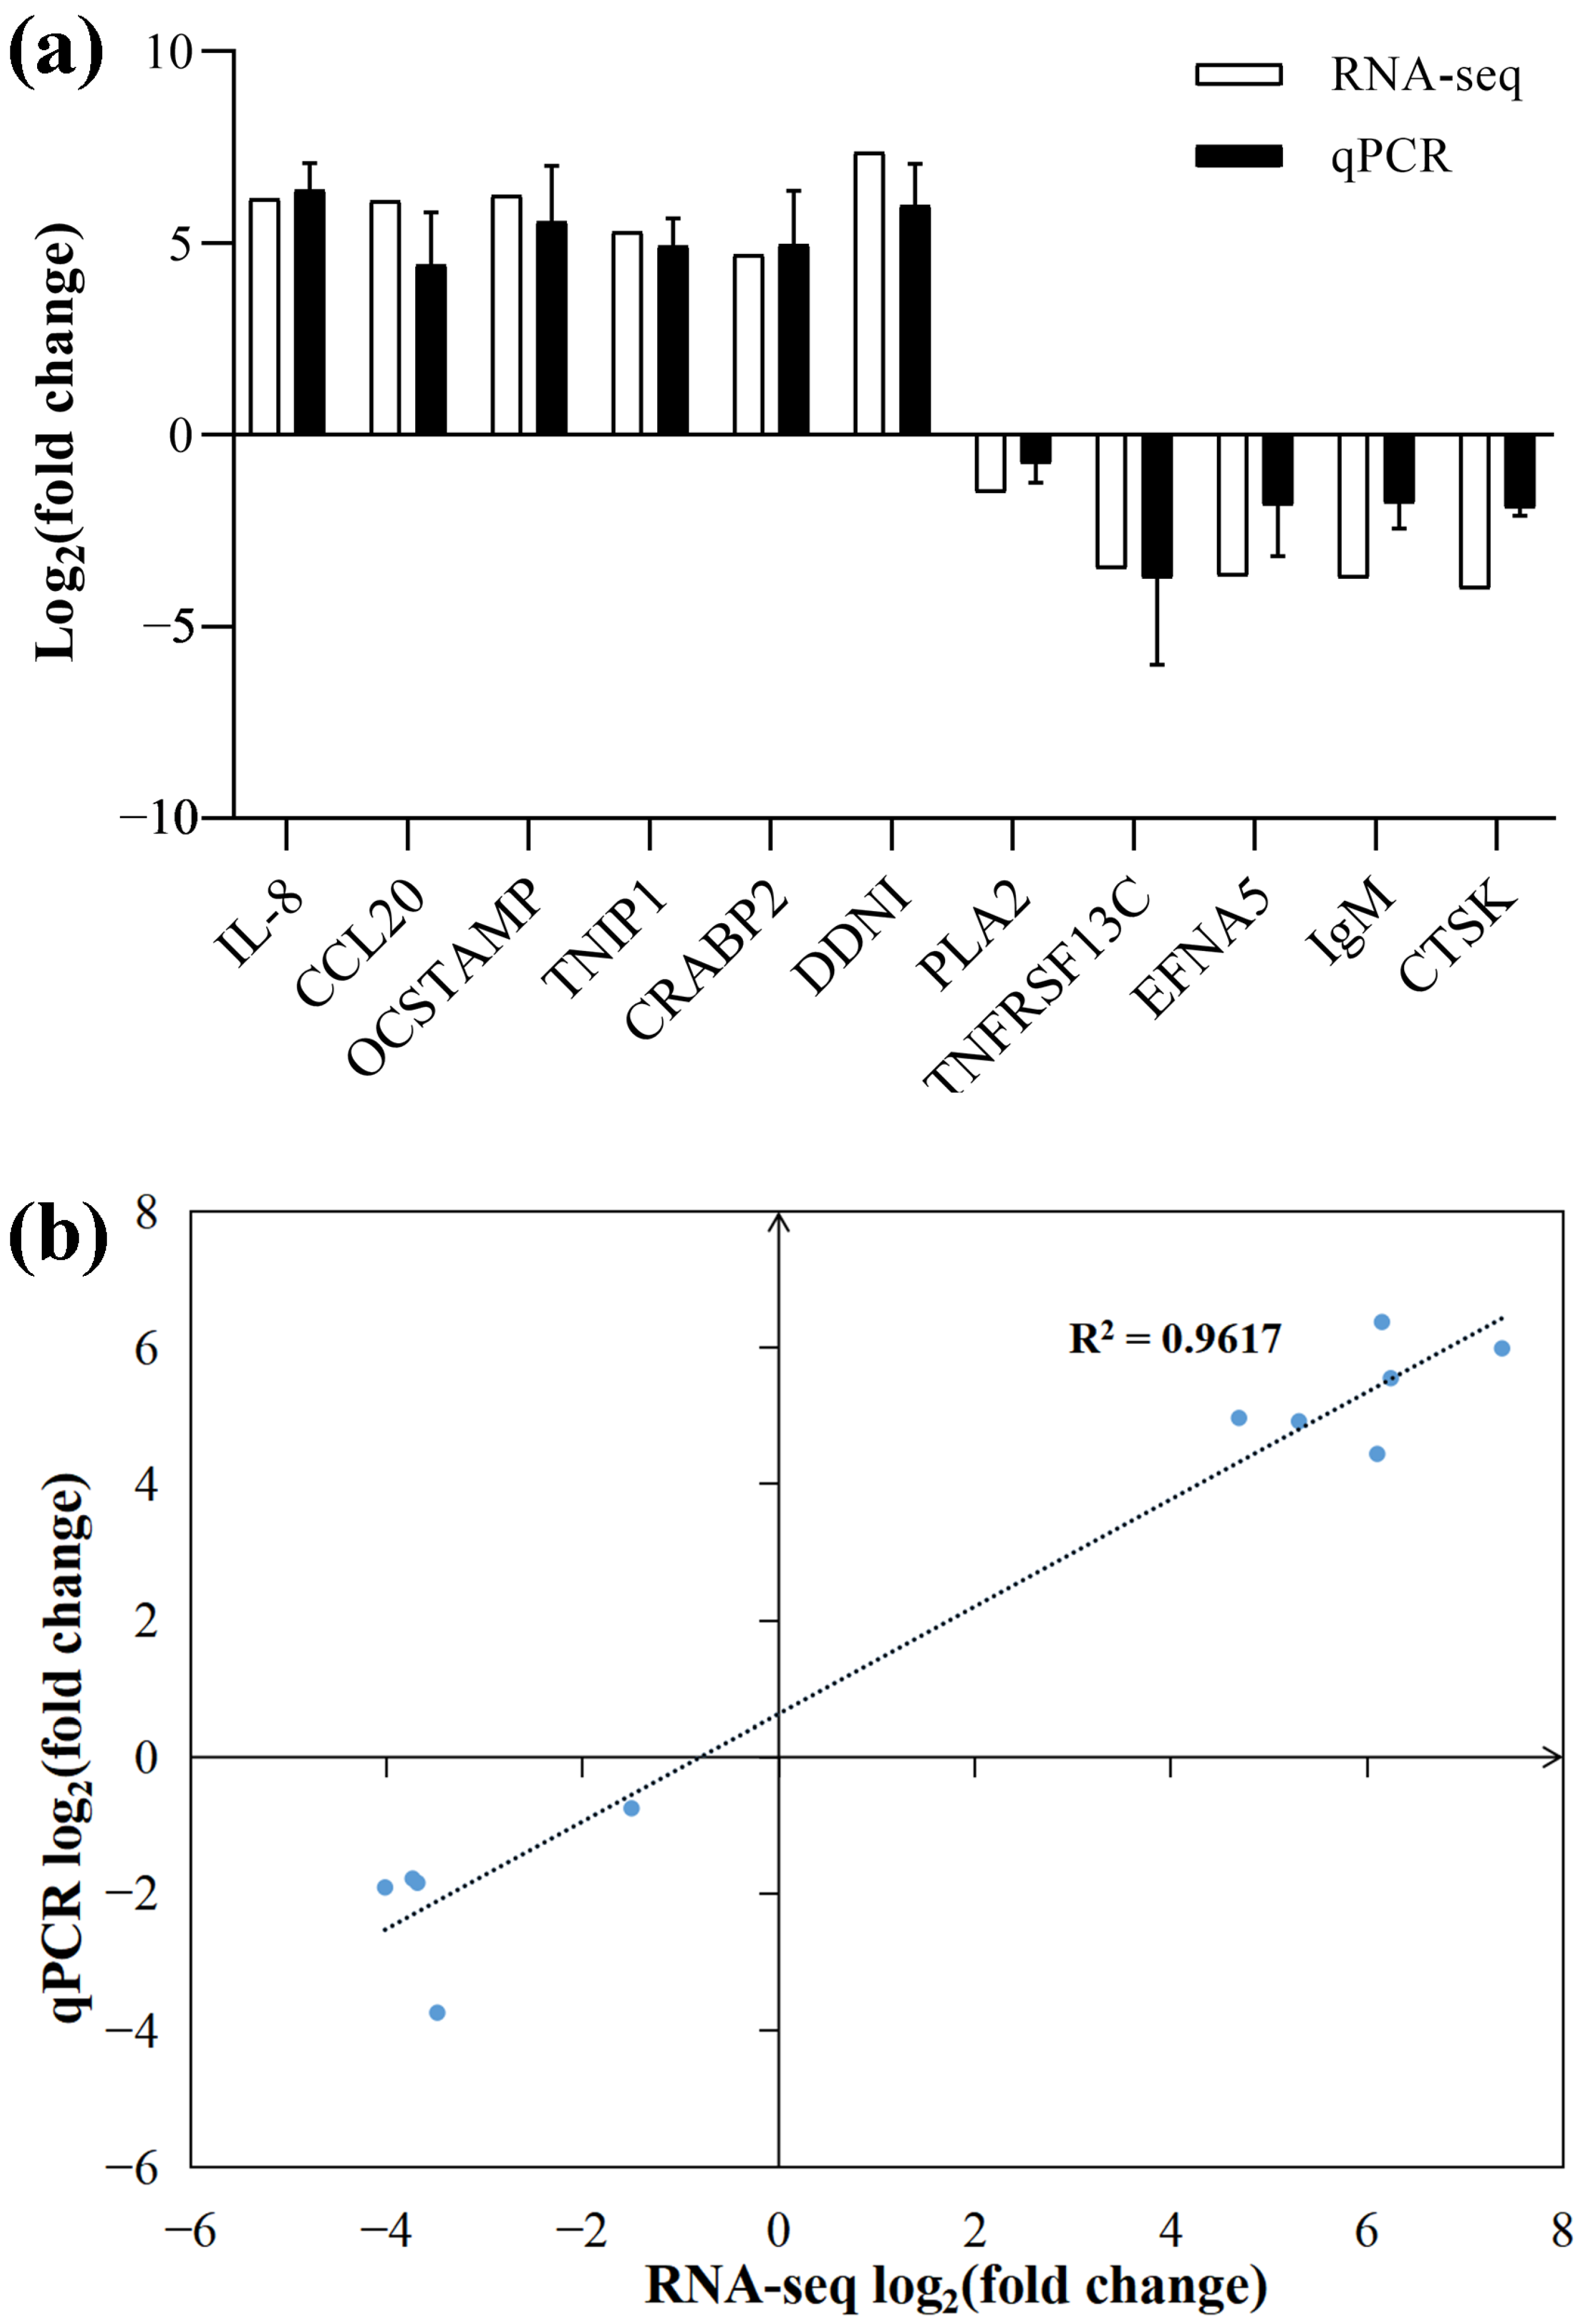
3.7. Validation of RNA-Seq Data by qPCR
4. Discussion
4.1. Pathogenicity of B. cereus
4.2. Immune-Related DEGs
4.3. Immune-Related Pathways
5. Conclusions
Supplementary Materials
Author Contributions
Funding
Institutional Review Board Statement
Informed Consent Statement
Data Availability Statement
Conflicts of Interest
References
- Park, S.B.; Aoki, T.; Jung, T.S. Pathogenesis of and strategies for preventing Edwardsiella tarda infection in fish. Vet. Res. 2012, 43, 67. [Google Scholar] [CrossRef] [PubMed]
- Zhao, W.; Dao, C.; Karim, M.; Gomez-Chiarri, M.; Rowley, D.; Nelson, D.R. Contributions of tropodithietic acid and biofilm formation to the probiotic activity of Phaeobacter inhibens. BMC Microbiol. 2016, 16, 1–17. [Google Scholar] [CrossRef] [PubMed]
- Defoirdt, T.; Sorgeloos, P.; Bossier, P. Alternatives to antibiotics for the control of bacterial disease in aquaculture. Curr. Opin. Microbiol. 2011, 14, 251–258. [Google Scholar] [CrossRef] [PubMed]
- Munang’andu, H.M. Intracellular bacterial infections: A challenge for developing cellular mediated immunity vaccines for farmed fish. Microorganisms 2018, 6, 33. [Google Scholar] [CrossRef]
- Chen, J.S.; Zhu, N.Y.; Kong, L.; Bei, Y.J.; Zheng, T.L.; Ding, X.Y.; He, Z.Y. First case of soft shell disease in Chinese soft-shelled turtle (Trionyx sinens) associated with Aeromonas sobria-A. veronii complex. Aquaculture 2013, 406, 62–67. [Google Scholar] [CrossRef]
- Chung, T.H.; Yi, S.W.; Kim, B.S.; Kim, W.I.; Shin, G.W. Identification and antibiotic resistance profiling of bacterial isolates from septicaemic soft-shelled turtles (Pelodiscus sinensis). Vet. Med. 2017, 62, 169–177. [Google Scholar] [CrossRef]
- Liu, L.; Cao, Z.; Lin, F.; Ye, X.P.; Lu, S.J.; Lyv, S.J. The histopathological characteristics caused by Trionyx sinensis hemorrhagic syndrome virus (TSHSV) and comparative proteomic analysis of liver tissue in TSHSV-infected chinese soft-shelled turtles (Pelodiscus sinensis). Intervirology 2017, 60, 19–27. [Google Scholar] [CrossRef]
- Cheng, L.W.; Rao, S.; Poudyal, S.; Wang, P.C.; Chen, S.C. Genotype and virulence gene analyses of Bacillus cereus group clinical isolates from the Chinese softshell turtle (Pelodiscus sinensis) in Taiwan. J. Fish Dis. 2021, 44, 1515–1529. [Google Scholar] [CrossRef]
- Stenfors Arnesen, L.P.; Fagerlund, A.; Granum, P.E. From soil to gut: Bacillus cereus and its food poisoning toxins. FEMS Microbiol. Rev. 2008, 32, 579–606. [Google Scholar] [CrossRef]
- Li, H.D.; Fan, S.L.; Gao, Y.; Cai, Y.Y.; Chu, Z.J.; Wang, L. Evaluation of modulatory properties of Bacillus cereus isolated from the gut of Litopenaeus vannamai on growth, intestinal morphology, digestive enzyme activities, immune responses and disease resistance of Litopenaeus vannamai. Aquacult. Res. 2021, 52, 1299–1310. [Google Scholar] [CrossRef]
- Jovanovic, J.; Ornelis, V.F.M.; Madder, A.; Rajkovic, A. Bacillus cereus food intoxication and toxicoinfection. Compr. Rev. Food Sci. Food Saf. 2021, 20, 3719–3761. [Google Scholar] [CrossRef] [PubMed]
- Velmurugan, S.; Palanikumar, P.; Velayuthani, P.; Donio, M.B.S.; Babu, M.M.; Lelin, C.; Sudhakar, S.; Citarasu, T. Bacterial white patch disease caused by Bacillus cereus, a new emerging disease in semi-intensive culture of Litopenaeus vannamei. Aquaculture 2015, 444, 49–54. [Google Scholar] [CrossRef]
- Zhang, Z.; Zhang, W.; Hu, Z.; Li, C.; Shao, Y.; Zhao, X.; Guo, M. Environmental factors promote pathogen-induced skin ulceration syndrome outbreak by readjusting the hindgut microbiome of Apostichopus japonicus. Aquaculture 2019, 507, 155–163. [Google Scholar] [CrossRef]
- Li, Y.L.; Zhang, H.Q.; Lv, S.J.; Lin, F.; Liu, L.; Yuan, X.M.; Su, S.Q. Isolation and identification of pathogen causing “head-shaking syndrome” of Pelodiscus sinensis nigrum and drug susceptibility analysis. Oceanol. Limnol. Sin. 2020, 51, 405–414. [Google Scholar] [CrossRef]
- Yuan, X.M.; Lyu, S.J.; Zhang, H.Q.; Hang, X.Y.; Shi, W.D.; Liu, L.; Wu, Y.L. Complete genome sequence of novel isolate SYJ15 of Bacillus cereus group, a highly lethal pathogen isolated from Chinese soft shell turtle (Pelodiscus Sinensis). Arch. Microbiol. 2020, 202, 85–92. [Google Scholar] [CrossRef]
- Zhu, C.K.; Pan, Z.J.; Chang, G.L.; Wu, N.; Wang, H.; Ding, H.Y.; Qiang, X.G.; Zhang, L.; Qiang, J.; Zhang, J.; et al. Transcriptomic insights into immune responses to ulcerative syndrome in Pseudobagrus ussuriensis. Aquaculture 2021, 537, 736504. [Google Scholar] [CrossRef]
- Qi, Z.T.; Zhang, Q.H.; Wang, Z.S.; Ma, T.Y.; Zhou, J.; Holland, J.W.; Gao, Q. Transcriptome analysis of the endangered Chinese giant salamander (Andrias davidianus): Immune modulation in response to Aeromonas hydrophila infection. Vet. Immunol. Immunopathol. 2016, 169, 85–95. [Google Scholar] [CrossRef]
- Wang, D.; Sun, S.M.; Li, S.W.; Lu, T.Y.; Shi, D.F. Transcriptome profiling of immune response to Yersinia ruckeri in spleen of rainbow trout (Oncorhynchus mykiss). BMC Genom. 2021, 22, 292. [Google Scholar] [CrossRef]
- Fischer, A.H.; Jacobson, K.A.; Rose, J.; Zeller, R. Hematoxylin and eosin staining of tissue and cell sections. Cold Spring Harb. Protoc. 2008, 2008, pdb.prot4986. [Google Scholar] [CrossRef]
- Hansen, B.M.; Hendriksen, N.B. Detection of enterotoxic Bacillus cereus and Bacillus thuringiensis strains by PCR analysis. Appl. Environ. Microbiol. 2001, 67, 185–189. [Google Scholar] [CrossRef]
- Ngamwongsatit, P.; Buasri, W.; Pianariyanon, P.; Pulsrikarn, C.; Ohba, M.; Assavanig, A.; Panbangred, W. Broad distribution of enterotoxin genes (hblCDA, nheABC, cytK, and entFM) among Bacillus thuringiensis and Bacillus cereus as shown by novel primers. Int. J. Food Microbiol. 2008, 121, 352–356. [Google Scholar] [CrossRef] [PubMed]
- Agata, N.; Ohta, M.; Arakawa, Y.; Mori, M. The bceT gene of Bacillus cereus encodes an enterotoxic protein. Microbiology 1995, 141, 983–988. [Google Scholar] [CrossRef] [PubMed]
- Kim, G.H.; Forghani, F.; Oh, D.H. Rapid detection of emetic toxin producing Bacillus cereus strains using triple-primer polymerase chain reaction (PCR) assay. Afr. J. Microbiol. Res. 2013, 7, 620–625. [Google Scholar] [CrossRef]
- Grabherr, M.G.; Haas, B.J.; Yassour, M.; Levin, J.Z.; Thompson, D.A.; Amit, I.; Adiconis, X.; Fan, L.; Raychowdhury, R.; Zeng, Q.; et al. Full-length transcriptome assembly from RNA-Seq data without a reference genome. Nat. Biotechnol. 2011, 29, 644–652. [Google Scholar] [CrossRef] [PubMed]
- Buchfink, B.; Xie, C.; Huson, D.H. Fast and sensitive protein alignment using DIAMOND. Nat. Methods 2015, 12, 59–60. [Google Scholar] [CrossRef] [PubMed]
- Götz, S.; García-Gómez, J.M.; Terol, J.; Williams, T.D.; Nagaraj, S.H.; Nueda, M.J.; Robles, M.; Talón, M.; Dopazo, J.; Conesa, A. High-throughput functional annotation and data mining with the Blast2GO suite. Nucleic Acids Res. 2008, 36, 3420–3435. [Google Scholar] [CrossRef]
- Moriya, Y.; Itoh, M.; Okuda, S.; Yoshizawa, A.C.; Kanehisa, M. KAAS: An automatic genome annotation and pathway reconstruction server. Nucleic Acids Res. 2007, 35, W182–W185. [Google Scholar] [CrossRef]
- Li, B.; Dewey, C.N. RSEM: Accurate transcript quantification from RNA-Seq data with or without a reference genome. BMC Bioinf. 2011, 12, 323. [Google Scholar] [CrossRef]
- Anders, S.; McCarthy, D.J.; Chen, Y.; Okoniewski, M.; Smyth, G.K.; Huber, W.; Robinson, M.D. Count-based differential expression analysis of RNA sequencing data using R and Bioconductor. Nat. Protoc. 2013, 8, 1765–1786. [Google Scholar] [CrossRef]
- Benjamini, Y.; Hochberg, Y. Controlling the false discovery rate: A practical and powerful approach to multiple testing. J. R. Stat. Soc. Ser. B Stat. Methodol. 1995, 57, 289–300. [Google Scholar] [CrossRef]
- Mao, X.; Cai, T.; Olyarchuk, J.G.; Wei, L. Automated genome annotation and pathway identification using the KEGG Orthology (KO) as a controlled vocabulary. Bioinformatics 2005, 21, 3787–3793. [Google Scholar] [CrossRef] [PubMed]
- Lyu, S.J.; Yuan, X.M.; Zhang, H.Q.; Hang, X.Y.; Li, Y.L.; Shi, W.D.; Liu, L.; Yu, Z.; Wu, Y.L. Transcriptome profiling analysis of lung tissue of Chinese soft-shell turtle infected by Trionyx sinensis hemorrhagic syndrome virus. Fish Shellfish Immunol. 2020, 98, 653–660. [Google Scholar] [CrossRef] [PubMed]
- Livak, K.J.; Schmittgen, T.D. Analysis of relative gene expression data using real-time quantitative PCR and the 2−ΔΔCT method. Methods 2001, 25, 402–408. [Google Scholar] [CrossRef] [PubMed]
- Muthukrishnan, S.; Hoong, M.C.; Chen, W.W.; Natrah, I. Efficacy of Bacillus cereus strain BP-MBRG/1b and prebiotic fructooligosaccharides dietary supplementation on growth performance and disease resistance of Macrobrachium rosenbergii (De Mann) towards Aeromonas hydrophila AH-1N. Aquacult. Res. 2021, 52, 1657–1665. [Google Scholar] [CrossRef]
- Al-Khatib, M.S.; Khyami-Horani, H.; Badran, E.; Shehabi, A.A. Incidence and characterization of diarrheal enterotoxins of fecal Bacillus cereus isolates associated with diarrhea. Diagn. Microbiol. Infect. Dis. 2007, 59, 383–387. [Google Scholar] [CrossRef] [PubMed]
- Cui, Y.F.; Wang, S.L.; Ding, S.Y.; Shen, J.Z.; Kui, Z. Toxins and mobile antimicrobial resistance genes in Bacillus probiotics constitute a potential risk for one health. J. Hazard. Mater. 2020, 382, 121266. [Google Scholar] [CrossRef]
- Godoy, S.N.; Matushima, E.R.; Chaves, J.Q.; Cavados, C.F.; Rabinovitch, L.; Teixeira, R.H.; Nunes, A.L.; Melville, P.; Gattamorta, M.A.; Vivoni, A.M. Bacillus cereus infection outbreak in captive psittacines. Vet. Microbiol. 2012, 161, 213–217. [Google Scholar] [CrossRef]
- Fagerlund, A.; Lindbäck, T.; Storset, A.K.; Granum, P.E.; Hardy, S.P. Bacillus cereus Nhe is a pore-forming toxin with structural and functional properties similar to the ClyA (HlyE, SheA) family of haemolysins, able to induce osmotic lysis in epithelia. Microbiology 2008, 154, 693–704. [Google Scholar] [CrossRef]
- Beecher, D.J.; Schoeni, J.L.; Wong, A.C. Enterotoxic activity of hemolysin BL from Bacillus cereus. Infect. Immun. 1995, 63, 4423–4428. [Google Scholar] [CrossRef]
- Tran, S.L.; Guillemet, E.; Gohar, M.; Lereclus, D.; Ramarao, N. CwpFM (EntFM) is a Bacillus cereus potential cell wall peptidase implicated in adhesion, biofilm formation, and virulence. J. Bacteriol. 2010, 192, 2638–2642. [Google Scholar] [CrossRef]
- Nfor, N.N.; Lapin, C.N.; McLaughlin, R.W. Isolation of Bacillus cereus group from the fecal material of endangered wood turtles. Curr. Microbiol. 2015, 71, 524–527. [Google Scholar] [CrossRef]
- Hsu, T.K.; Tsai, H.C.; Hsu, B.M.; Yang, Y.Y.; Chen, J.S. Prevalence, enterotoxin-gene profiles, antimicrobial resistance, and genetic diversity of Bacillus cereus group in aquatic environments and shellfish. Sci. Total Environ. 2021, 758, 143665. [Google Scholar] [CrossRef] [PubMed]
- Zhao, S.J.; Chen, J.L.; Fei, P.; Feng, H.X.; Wang, Y.; Ali, M.; Li, S.Z.; Jing, H.N.; Yang, W.W. Prevalence, molecular characterization, and antibiotic susceptibility of Bacillus cereus isolated from dairy products in China. J. Dairy Sci. 2020, 103, 3994–4001. [Google Scholar] [CrossRef] [PubMed]
- Ceuppens, S.; Boon, N.; Uyttendaele, M. Diversity of Bacillus cereus group strains is reflected in their broad range of pathogenicity and diverse ecological lifestyles. FEMS Microbiol. Ecol. 2013, 84, 433–450. [Google Scholar] [CrossRef] [PubMed]
- Li, B.; Jones, L.L.; Geiger, T.L. IL-6 promotes T cell proliferation and expansion under inflammatory conditions in association with low-level RORγt expression. J. Immunol. 2018, 201, 2934–2946. [Google Scholar] [CrossRef] [PubMed]
- Wei, X.; Li, B.; Wu, L.; Yin, X.; Zhong, X.; Li, Y.; Wang, Y.; Guo, Z.; Ye, J. Interleukin-6 gets involved in response to bacterial infection and promotes antibody production in Nile tilapia (Oreochromis niloticus). Dev. Comp. Immunol. 2018, 89, 141–151. [Google Scholar] [CrossRef]
- Unver, N.; McAllister, F. IL-6 family cytokines: Key inflammatory mediators as biomarkers and potential therapeutic targets. Cytokine Growth Factor Rev. 2018, 41, 10–17. [Google Scholar] [CrossRef]
- Ma, Y.; Ren, Y.; Dai, Z.J.; Wu, C.J.; Ji, Y.H.; Xu, J. IL-6, IL-8 and TNF-α levels correlate with disease stage in breast cancer patients. Adv. Clin. Exp. Med. 2017, 26, 421–426. [Google Scholar] [CrossRef]
- Das, S.T.; Rajagopalan, L.; Guerrero-Plata, A.; Sai, J.; Richmond, A.; Garofalo, R.P.; Rajarathnam, K. Monomeric and dimeric CXCL8 are both essential for in vivo neutrophil recruitment. PLoS ONE 2010, 5, e11754. [Google Scholar] [CrossRef]
- Zhou, X.X.; Guo, Q.L.; Dai, H.P. Molecular characterization and expression profiles in response to bacterial infection of Chinese soft-shelled turtle interleukin-8 (IL-8), the first reptilian chemokine gene. Dev. Comp. Immunol. 2009, 33, 838–847. [Google Scholar] [CrossRef]
- Strieter, R.M.; Polverini, P.J.; Kunkel, S.L.; Arenberg, D.A.; Burdick, M.D.; Kasper, J.; Dzuiba, J.; Van Damme, J.; Walz, A.; Marriott, D.; et al. The functional role of the ELR motif in CXC chemokine-mediated angiogenesis. J. Biol. Chem. 1995, 270, 27348–27357. [Google Scholar] [CrossRef] [PubMed]
- Laufer, J.M.; Legler, D.F. Beyond migration-chemokines in lymphocyte priming, differentiation, and modulating effector functions. J. Leukoc. Biol. 2018, 104, 301–312. [Google Scholar] [CrossRef]
- Yamazaki, T.; Yang, X.O.; Chung, Y.; Fukunaga, A.; Nurieva, R.; Pappu, B.; Martin-Orozco, N.; Kang, H.S.; Ma, L.; Panopoulos, A.D.; et al. CCR6 regulates the migration of inflammatory and regulatory T cells. J. Immunol. 2008, 181, 8391–8401. [Google Scholar] [CrossRef] [PubMed]
- Byadgi, O.; Chen, C.W.; Wang, P.C.; Tsai, M.A.; Chen, S.C. De novo transcriptome analysis of differential functional gene expression in largemouth bass (Micropterus salmoides) after challenge with Nocardia seriolae. Int. J. Mol. Sci. 2016, 17, 1315. [Google Scholar] [CrossRef] [PubMed]
- Liu, F.; Wang, T.; Hu, Y.; Tian, G.; Secombes, C.J.; Wang, T. Expansion of fish CCL20_like chemokines by genome and local gene duplication: Characterisation and expression analysis of 10 CCL20_like chemokines in rainbow trout (Oncorhynchus mykiss). Dev. Comp. Immunol. 2020, 103, 103502. [Google Scholar] [CrossRef] [PubMed]
- Schutyser, E.; Struyf, S.; Van Damme, J. The CC chemokine CCL20 and its receptor CCR6. Cytokine Growth Factor Rev. 2003, 14, 409–426. [Google Scholar] [CrossRef]
- Chang, K.C.; Chen, R.Y.; Wang, Y.C.; Hung, L.Y.; Medeiros, L.J.; Chen, Y.P.; Chen, T.Y.; Yang, J.C.; Chiang, P.M. Stem cell characteristics promote aggressiveness of diffuse large B-cell lymphoma. Sci. Rep. 2020, 10, 21342. [Google Scholar] [CrossRef]
- Hawksworth, O.A.; Coulthard, L.G.; Woodruff, T.M. Complement in the fundamental processes of the cell. Mol. Immunol. 2017, 84, 17–25. [Google Scholar] [CrossRef]
- Thurman, J.M.; Holers, V.M. The central role of the alternative complement pathway in human disease. J. Immunol. 2006, 176, 1305–1310. [Google Scholar] [CrossRef]
- Li, F.; Liu, X.; Ge, H.; Huang, J.; Zhang, Y.; Wang, Z. Transcriptome profiling and differential expression analysis of the immune-related genes during the early phase of acute infection with Aeromonas hydrophila in the Chinese sucker (Myxocyprinus asiaticus). Aquaculture 2021, 545, 737258. [Google Scholar] [CrossRef]
- Dang, Y.; Xu, X.; Shen, Y.; Hu, M.; Zhang, M.; Li, L.; Lv, L.; Li, J. Transcriptome analysis of the innate immunity-related complement system in spleen tissue of Ctenopharyngodon idella infected with Aeromonas hydrophila. PLoS ONE 2016, 11, e0157413. [Google Scholar] [CrossRef]
- Kishore, U.; Reid, K.B. C1q: Structure, function, and receptors. Immunopharmacology 2000, 49, 159–170. [Google Scholar] [CrossRef]
- Müller-Eberhard, H.J. The membrane attack complex of complement. Annu. Rev. Immunol. 1986, 4, 503–528. [Google Scholar] [CrossRef] [PubMed]
- Barrington, R.; Zhang, M.; Fischer, M.; Carroll, M.C. The role of complement in inflammation and adaptive immunity. Immunol. Rev. 2001, 180, 5–15. [Google Scholar] [CrossRef] [PubMed]
- DeAngelis, R.A.; Markiewski, M.M.; Lambris, J.D. Liver regeneration: A link to inflammation through complement. Adv. Exp. Med. Biol. 2006, 586, 17–34. [Google Scholar] [CrossRef] [PubMed]
- Chen, D.D.; Guo, L.F.; Yi, C.; Wang, S.Q.; Ru, Y.Y.; Wang, H. Hepatopancreatic transcriptome analysis and humoral immune factor assays in red claw crayfish (Cherax quadricarinatus) provide insight into innate immunomodulation under Vibrio parahaemolyticus infection. Ecotoxicol. Environ. Saf. 2021, 217, 112266. [Google Scholar] [CrossRef] [PubMed]
- Li, M.; Xu, C.J.; Li, D.; Wu, G.F.; Wu, G.Q.; Yang, C.Y.; Pan, Y.F.; Pan, Z.Q.; Tan, G.L.; Liu, Y.Y. Transcriptome analysis of the spleen provides insight into the immunoregulation of Cyprinus carpio koi under Aeromonas veronii infection. Aquaculture 2021, 540, 736650. [Google Scholar] [CrossRef]
- He, Z.; Chen, X.; Zhao, J.; Hou, D.; Fu, Z.; Zhong, Y.; Hu, X.; Zhang, S.; Sun, C. Establishment of infection mode and Penaeus monodon hemocytes transcriptomics analysis under decapod iridescent virus 1 (DIV1) challenge. Aquaculture 2021, 542, 736816. [Google Scholar] [CrossRef]
- Pierce, C.F.; Brown, V.R.; Olsen, S.C.; Boggiatto, P.; Pedersen, K.; Miller, R.S.; Speidel, S.E.; Smyser, T.J. Loci associated with antibody response in feral swine (Sus scrofa) infected with Brucella suis. Front. Vet. Sci. 2020, 7, 554674. [Google Scholar] [CrossRef]
- Wu, L.T.; Qin, Z.D.; Liu, H.P.; Lin, L.; Ye, J.M.; Li, J. Recent advances on phagocytic B cells in teleost fish. Front. Immunol. 2020, 11, 824. [Google Scholar] [CrossRef]
- Weiss, G.; Schaible, U.E. Macrophage defense mechanisms against intracellular bacteria. Immunol. Rev. 2015, 264, 182–203. [Google Scholar] [CrossRef] [PubMed]
- Savina, A.; Amigorena, S. Phagocytosis and antigen presentation in dendritic cells. Immunol. Rev. 2007, 219, 143–156. [Google Scholar] [CrossRef]
- Kumar, G.; Hummel, K.; Noebauer, K.; Welch, T.J.; Razzazi-Fazeli, E.; El-Matbouli, M. Proteome analysis reveals a role of rainbow trout lymphoid organs during Yersinia ruckeri infection process. Sci. Rep. 2018, 8, 13998. [Google Scholar] [CrossRef]
- Blander, J.M. Coupling toll-like receptor signaling with phagocytosis: Potentiation of antigen presentation. Trends Immunol. 2007, 28, 19–25. [Google Scholar] [CrossRef] [PubMed]
- Gilmore, T.D. The Rel/NF-kappaB signal transduction pathway: Introduction. Oncogene 1999, 18, 6842–6844. [Google Scholar] [CrossRef] [PubMed]
- Yoshida, T.; Yamashita, M.; Horimai, C.; Hayashi, M. Smooth muscle-selective inhibition of nuclear factor-κB attenuates smooth muscle phenotypic switching and neointima formation following vascular injury. J. Am. Heart Assoc. 2013, 2, e000230. [Google Scholar] [CrossRef]
- Hayden, M.S.; Ghosh, S. Shared principles in NF-kappaB signaling. Cell 2008, 132, 344–362. [Google Scholar] [CrossRef]
- Lung, H.L.; Kan, R.; Chau, W.Y.; Man, O.Y.; Mak, N.K.; Fong, C.H.; Shuen, W.H.; Tsao, S.W.; Lung, M.L. The anti-tumor function of the IKK inhibitor PS1145 and high levels of p65 and KLF4 are associated with the drug resistance in nasopharyngeal carcinoma cells. Sci. Rep. 2019, 9, 12064. [Google Scholar] [CrossRef]
- Blackwell, T.S.; Christman, J.W. The role of nuclear factor-kappa B in cytokine gene regulation. Am. J. Respir. Cell Mol. Biol. 1997, 17, 3–9. [Google Scholar] [CrossRef]
- Zhou, X.X.; Wang, L.; Feng, H.; Guo, Q.L.; Dai, H.P. Acute phase response in Chinese soft-shelled turtle (Trionyx sinensis) with Aeromonas hydrophila infection. Dev. Comp. Immunol. 2011, 35, 441–451. [Google Scholar] [CrossRef]


| Gene | Primer Sequence (5′ to 3′) | Product Length (bp) | Annealing (°C) | References |
|---|---|---|---|---|
| NheA | TACGCTAAGGAGGGGCA | 500 | 55 | [20] |
| GTTTTATTGCTTCATCGGCT | ||||
| NheB | CAAGCTCCAGTTCATGCGG | 935 | 58 | [21] |
| GATCCCATTGTGTACCATTG | ||||
| NheC | ACATCCTTTTGCAGCAGAAC | 618 | 58 | [21] |
| CCACCAGCAATGACCATATC | ||||
| NblA | GCAAAATCTATGAATGCCTA | 884 | 54 | [21] |
| GCATCTGTTCGTAATGTTTT | ||||
| HblC | CCTATCAATACTCTCGCAA | 695 | 54 | [21] |
| TTTCCTTTGTTATACGCTGC | ||||
| HblD | AATCAAGAGCTCTCACGAAT | 430 | 52 | [20] |
| CACCAATTGACCATGCTAAT | ||||
| bceT | TTACATTACCAGGACGTGCTT | 428 | 55 | [22] |
| TGTTTGTGATTGTAATTCAGG | ||||
| cytK | CGACGTCACAAGTTGTAACA | 565 | 52 | [21] |
| CGTGTGTAAATACCCCAGTT | ||||
| ces | GCATTTCGTGAAGCAGAGGT | 699 | 59 | [23] |
| CCCTTTATCCCCTTCGATGT | ||||
| entFM | GTTCGTTCAGGTGCTGGTAC | 486 | 55 | [21] |
| AGCTGGGCCTGTACGTACTT |
| Primer Name | Sequence (5′ to 3′) | Product Length (bp) |
|---|---|---|
| DDN1-F | TAAACACAGCGGGATTCAAAC | 119 |
| DDN1-R | GGCAAACACAATGCAGAAGTA | |
| OCSTAMP-F | GGTGCTCCTCTCTTTGACTCTGA | 85 |
| OCSTAMP-R | CACAGCCGTGTCTGCCAAG | |
| TNIP1-F | TACCTTGTTCCTCATCCGCC | 132 |
| TNIP1-R | TTCAACTACCAACGCCTCCA | |
| IL-8-F | CGTTGGAAATGACTTAGGCAG | 205 |
| IL-8-R | TGAAACCACAAAACCCAAGTC | |
| CCL20-F | AACTCAGGAAGATGTCACTGTAATG | 132 |
| CCL20-R | GAATCCAGGAACAATGGTCAGT | |
| CRABP2-F | CTTTCTAAACGAGGGCAGGAT | 171 |
| CRABP2-R | TTTAAGGGAGCTGTTCAGGGT | |
| PLA2-F | AGACTCAAACGAGAGACGGGT | 118 |
| PLA2-R | TAGCAGGGTCGCAATGAGAG | |
| TNFRSF13C-F | TATTGCTGGTCTGTCGAGTGAGG | 86 |
| TNFRSF13C-R | CTTCAGTCTCTTACAGGCTTGGC | |
| IgM-F | GCAAAGCCAAACACCCAAAT | 88 |
| IgM-R | CGAGCCGCAGACATTTTTCA | |
| EFNA5-F | CATTAGAACCAGCAGATGATACCG | 82 |
| EFNA5-R | CAAGACCCTGATGTTTTCTGTGAC | |
| CTSK-F | GAAGGAGAACAGGGGCATTGAC | 92 |
| CTSK-R | CGGCTGTAGAACTGGAAAGAGG | |
| β-actin-F | GAGACCTGACAGACTACCT | 156 |
| β-actin-R | AGGATGATGAAGCAGCAGT |
| Sample | Raw Read Count | N (%) | Q20 (%) | Q30 (%) | Clean Read Count |
|---|---|---|---|---|---|
| GD1 | 52,733,514 | 0.001126 | 97.19 | 93.19 | 48,898,534 |
| GD2 | 55,934,470 | 0.001126 | 97.17 | 93.27 | 51,912,132 |
| GD3 | 43,562,612 | 0.001140 | 97.35 | 93.51 | 40,488,066 |
| CK1 | 49,459,480 | 0.001144 | 97.37 | 93.50 | 46,319,408 |
| CK2 | 47,077,210 | 0.001141 | 97.43 | 93.62 | 44,012,852 |
| CK3 | 49,009,128 | 0.001136 | 97.28 | 93.37 | 45,907,658 |
| Category | Contigs | Transcripts | Unigenes |
|---|---|---|---|
| Total Length (bp) | 301,124,798 | 525,666,538 | 215,178,805 |
| Sequence Number | 994,637 | 581,291 | 348,665 |
| Max. Length (bp) | 48,048 | 48,192 | 48,192 |
| Mean Length (bp) | 302.75 | 904.31 | 617.15 |
| N50 (bp) | 404 | 1877 | 892 |
| N50 Sequence Number | 140,096 | 73,705 | 50,754 |
| N90 (bp) | 140 | 311 | 255 |
| N90 Sequence Number | 737,917 | 368,926 | 253,811 |
| GC (%) | 47.00 | 48.19 | 47.16 |
| Database | Number | Percentage (%) |
|---|---|---|
| NR | 61,527 | 17.65 |
| GO | 25,656 | 7.36 |
| KEGG | 33,764 | 9.68 |
| Pfam | 15,315 | 4.39 |
| eggNOG | 59,855 | 17.17 |
| Swissprot | 30,692 | 8.80 |
| All databases | 7496 | 2.15 |
| Description | Category | Number of Unigenes |
|---|---|---|
| RNA processing and modification | A | 891 |
| Chromatin structure and dynamics | B | 592 |
| Energy production and conversion | C | 912 |
| Cell cycle control, cell division, chromosome partitioning | D | 745 |
| Amino acid transport and metabolism | E | 660 |
| Nucleotide transport and metabolism | F | 438 |
| Carbohydrate transport and metabolism | G | 859 |
| Coenzyme transport and metabolism | H | 198 |
| Lipid transport and metabolism | I | 888 |
| Translation, ribosomal structure, and biogenesis | J | 1182 |
| Transcription | K | 3420 |
| Replication, recombination, and repair | L | 3983 |
| Cell wall/membrane/envelope biogenesis | M | 140 |
| Cell motility | N | 31 |
| Posttranslational modification, protein turnover, chaperones | O | 3251 |
| Inorganic ion transport and metabolism | P | 1015 |
| Secondary metabolite biosynthesis, transport, and catabolism | Q | 443 |
| General function prediction only | R | 26,773 |
| Function unknown | S | 13,267 |
| Signal transduction mechanisms | T | 7129 |
| Intracellular trafficking, secretion, and vesicular transport | U | 1561 |
| Defense mechanisms | V | 694 |
| Extracellular structures | W | 695 |
| Undetermined | X | 0 |
| Nuclear structure | Y | 88 |
| Cytoskeleton | Z | 1532 |
| Description | Fold Change | p-Value | Genebank |
|---|---|---|---|
| Immunoglobulin M heavy chain constant region | −2.22 | 4.35 × 10⁻² | ACU45376.1 |
| Immunoglobulin D heavy chain constant region | −20.27 | 1.30 × 10⁻⁵ | ACU45375.1 |
| Immunoglobulin Y heavy chain constant region | −169.27 | 7.78 × 10⁻¹⁰ | ACU45374.1 |
| Immunoglobulin superfamily member 8 | −18.55 | 1.09 × 10⁻⁸ | XP_006115285.1 |
| Immunoglobulin superfamily member 3-like | −2.72 | 3.08 × 10⁻² | XP_014424150.1 |
| Cathepsin D | −4.23 | 6.27 × 10⁻⁵ | XP_006134990.1 |
| Cathepsin Z | −5.79 | 1.03 × 10⁻⁶ | XP_006134717.1 |
| Cathepsin W-like | −8.21 | 4.41 × 10⁻³ | XP_006121731.2 |
| Cathepsin S | −3.65 | 8.45 × 10⁻³ | XP_006110499.1 |
| Cathepsin K-like | −11.17 | 2.53 × 10⁻² | XP_006110501.1 |
| Nuclear factor NF-kappa-B p105 subunit | +12.32 | 1.17 × 10⁻² | XP_014430902.1 |
| Nuclear factor of activated T-cells, cytoplasmic 1 | −4.58 | 1.59 × 10⁻⁵ | XP_006128931.1 |
| Nuclear factor NF-kappa-B p100 subunit | +12.00 | 7.84 × 10⁻³ | XP_006116288.1 |
| Nuclear factor interleukin-3-regulated protein | +2.36 | 1.59 × 10⁻² | XP_006131942.1 |
| Interferon kappa-like | +7.54 | 1.07 × 10⁻² | XP_006123052.1 |
| Interferon-induced protein with tetratricopeptide repeats 5 | +8.36 | 8.70 × 10⁻⁹ | XP_006121507.1 |
| Interferon alpha-inducible protein 27-like protein 2B | +4.86 | 7.30 × 10⁻⁶ | XP_006113091.1 |
| Interferon gamma receptor 1 | −4.24 | 3.09 × 10⁻⁵ | XP_006112786.2 |
| Stimulator of interferon genes protein | −4.33 | 2.35 × 10⁻⁵ | XP_014433634.1 |
| Interferon-induced transmembrane protein 1-like | −2.37 | 1.37 × 10⁻² | XP_006131716.1 |
| Interferon-induced helicase C domain-containing protein 1 | +2.40 | 1.55 × 10⁻² | XP_006114909.1 |
| Interferon regulatory factor 7 | +5.46 | 1.76 × 10⁻² | AHB33440.1 |
| Interferon-induced protein with tetratricopeptide repeats 5-like | +2.19 | 1.84 × 10⁻² | XP_014426629.1 |
| Interferon gamma receptor 2 | −2.07 | 3.06 × 10⁻² | XP_006126153.1 |
| Interleukin-12 subunit beta | +147.93 | 6.44 × 10⁻⁶ | XP_006138150.1 |
| Interleukin-8-like | +71.18 | 1.33 × 10⁻⁴ | XP_006125459.1 |
| Interleukin-6 | +12.92 | 2.61 × 10⁻³ | XP_006138413.1 |
| Interleukin-7 | −3.68 | 3.32 × 10⁻⁴ | XP_014433210.1 |
| Interleukin-20 receptor subunit alpha | −2.88 | 1.61 × 10⁻³ | XP_006112787.1 |
| Interleukin-10-like | +2.43 | 1.31 × 10⁻² | XP_006137332.1 |
| Interleukin-5 receptor subunit alpha-like | −2.74 | 1.33 × 10⁻² | XP_006135915.1 |
| Interleukin-1 receptor-like 1 | −21.26 | 6.43 × 10⁻⁷ | XP_006127707.1 |
| Interleukin-22 receptor subunit alpha-2 | −22.78 | 1.87 × 10⁻³ | XP_006112795.1 |
| Toll-like receptor 9 | −8.15 | 1.25 × 10⁻⁷ | XP_014427285.1 |
| Toll-like receptor 8 | −6.19 | 1.19 × 10⁻⁶ | XP_006122907.1 |
| Toll-like receptor 10 | −5.22 | 4.70 × 10⁻³ | XP_014432216.1 |
| Toll-like receptor 5 | +3.08 | 7.33 × 10⁻³ | XP_006115662.2 |
| Complement C1r subcomponent | +6.85 | 6.70 × 10⁻³ | XP_006130432.1 |
| Complement receptor type 1-like | +3.31 | 9.58 × 10⁻⁴ | XP_006137323.1 |
| Complement component C7 isoform X2 | −36.21 | 2.45 × 10⁻¹⁹ | XP_006139554.1 |
| Complement C1q subcomponent subunit A-like | −36.70 | 1.08 × 10⁻¹⁸ | XP_006121776.1 |
| Tumor necrosis factor receptor superfamily member 1B | −4.51 | 1.30 × 10⁻⁵ | XP_014431383.1 |
| Tumor necrosis factor receptor superfamily member 8 | −7.21 | 1.63 × 10⁻⁴ | XP_006127981.1 |
| Tumor necrosis factor receptor superfamily member 13B | −4.35 | 1.44 × 10⁻³ | XP_006126690.1 |
| Tumor necrosis factor receptor superfamily member 13C | −11.18 | 3.67 × 10⁻³ | XP_006120590.1 |
| Tumor necrosis factor ligand superfamily member 15 | +2.47 | 5.97 × 10⁻³ | XP_006137247.1 |
| Tumor necrosis factor receptor superfamily member 17 | −5.00 | 1.23 × 10⁻² | XP_014433201.1 |
| C-C motif chemokine 20-like | +68.84 | 3.25 × 10⁻⁴ | XP_006119948.1 |
| C-C motif chemokine 4-like | +54.47 | 2.01 × 10⁻⁴ | XP_006115931.1 |
| C-C chemokine receptor type 9-like | −4.24 | 4.52 × 10⁻³ | XP_014434094.1 |
| C-C chemokine receptor type 7 | −4.57 | 1.11 × 10⁻⁴ | XP_014424601.1 |
| Chemokine-like receptor 1 | −6.10 | 2.98 × 10⁻⁵ | XP_006113767.1 |
| C-C motif chemokine 3-like | −7.85 | 4.82 × 10⁻² | XP_006115927.1 |
| C-X-C chemokine receptor type 5 | −16.60 | 1.11 × 10⁻⁴ | XP_006121016.1 |
| C-X-C motif chemokine 14 | −28.46 | 2.85 × 10⁻¹⁷ | XP_006116095.1 |
Disclaimer/Publisher’s Note: The statements, opinions and data contained in all publications are solely those of the individual author(s) and contributor(s) and not of MDPI and/or the editor(s). MDPI and/or the editor(s) disclaim responsibility for any injury to people or property resulting from any ideas, methods, instructions or products referred to in the content. |
© 2023 by the authors. Licensee MDPI, Basel, Switzerland. This article is an open access article distributed under the terms and conditions of the Creative Commons Attribution (CC BY) license (https://creativecommons.org/licenses/by/4.0/).
Share and Cite
Jiao, J.; Chen, J.; Yao, J.; Li, Y.; Yuan, X.; Huang, L.; Su, S.; Zhang, H. The Pathology and Splenic Transcriptome Profiling of Trionyx sinensis Challenged with Bacillus cereus. Fishes 2023, 8, 84. https://doi.org/10.3390/fishes8020084
Jiao J, Chen J, Yao J, Li Y, Yuan X, Huang L, Su S, Zhang H. The Pathology and Splenic Transcriptome Profiling of Trionyx sinensis Challenged with Bacillus cereus. Fishes. 2023; 8(2):84. https://doi.org/10.3390/fishes8020084
Chicago/Turabian StyleJiao, Jinbiao, Jing Chen, Jiayun Yao, Yanli Li, Xuemei Yuan, Lei Huang, Shengqi Su, and Haiqi Zhang. 2023. "The Pathology and Splenic Transcriptome Profiling of Trionyx sinensis Challenged with Bacillus cereus" Fishes 8, no. 2: 84. https://doi.org/10.3390/fishes8020084
APA StyleJiao, J., Chen, J., Yao, J., Li, Y., Yuan, X., Huang, L., Su, S., & Zhang, H. (2023). The Pathology and Splenic Transcriptome Profiling of Trionyx sinensis Challenged with Bacillus cereus. Fishes, 8(2), 84. https://doi.org/10.3390/fishes8020084