Abstract
The spotted scat (Scatophagus argus) is the most widely commercially cultured fish in eastern and southern Asia that possess potential economic value. However, up to date, there are no studies reported on the selection of suitable reference genes in this fish, which is crucial for guaranteeing accurate and reliable results in RT-qPCR analyses. This study aimed at screening the most stable reference genes in the ovary and pituitary at different ovarian stages, which is of great significance for further research on the reproductive regulation mechanism of female S. argus. In this study, we selected twenty-one genes as the candidate reference genes, including four genes in the ovary (EEF1A, ACTB, B2M, and HPRT1), and seventeen genes in the pituitary (B2M, APOA1, CGBA, RPLP0, GNRHR, GUSB, TBP, SLC25A5, RPL4, PLA1A, GAPDH, GNB2L1, CTFS, HPRT1, RPS2, TFRC, and TUBB4B). To analyze the stability of the potential reference genes, we first used four commonly used software, BestKeeper, GeNorm, NormFinder, and ΔCt, and then we established comprehensive rankings with ReFinder. The results indicate that RPL4 and GNB2L1, and EEF1A and HPRT1 were the most appropriate reference genes for the pituitary and ovary of S. argus, respectively, in the three developmental stages of the ovary. Additionally, GeNorm analysis suggested that for the accurate normalization of gene expression, two reference genes were reliable in the ovary and pituitary of S. argus. To the best of our knowledge and understanding, this is the first study to identify appropriate reference genes for analyzing gene expression in S. argus. Consequently, this study can be used as a foundation for future research on the reproduction of S. argus.
1. Introduction
The reverse transcription–quantitative polymerase chain reaction (RT-qPCR) is recognized as one of the most precise and popular technologies for examining and assessing gene expression []. This approach provides various advantages, including easy operation, offering high sensitivity, excellent repeatability, and accurate quantification []. However, the accuracy of quantitative analysis is affected by several factors, such as primer amplification efficiency among different samples, reverse transcription efficiency, and RNA concentration and quantity []. To minimize these variations, a suitable normalization method is pivotal to achieving accurate results []. Endogenous reference genes are considered to be the most common and popular method for normalizing RT-qPCR data [,]. Ideally, a reference gene can indicate constant expression in a specific tissue type, regardless of the ovary developmental stages or experimental treatment states [,].
Generally, reference genes for RT-qPCR studies are usually used as housekeeping genes, such as 18S ribosomal RNA (18S), beta-actin (ACTB), and glyceraldehyde-3-phosphate dehydrogenase (GAPDH) [,]. However, it became clear that the expression of these genes may not be the same in all tissues, experimental states, or developmental stages [,,]. For example, GAPDH and ACTB were found as unstable genes in the gonads of adult female and male zebrafish (Danio rerio), where significant expression differences were found []. A study on rice field eels (Monopterus albus) indicated GAPDH, 18S, and ACTB are not appropriate as reference genes during gonad development due to their high levels of expression variations []. Many similar studies were reported [,,,,]. Consequently, it is crucial to identify relevant reference genes in expression research, particularly under certain experimental treatment states. Currently, a great number of software and algorithms, such as NormFinder [], GeNom [], ΔCt [], and BestKeeper [] were discovered to help identify stable internal reference genes. However, because these programs were created using various mathematical models [,], rankings produced using the same set of expression data are often unalike upon the usage of different software [,]. RefFounder is shown to be a user-friendly web-based tool that integrates the four methods mentioned above, which provides an extensive rating for experimental reference genes. The higher the expression stability, the lower the rank value [,,].
Spotted scat (Scatophagus argus) is the most widely commercially cultured fish in eastern and southern Asia that possesses potential economic value. Females usually grow faster than males under identical cultural conditions [,], making monosexual female populations’ culture very valuable economically. In addition, S. argus can eat algae, sick shrimp, parasites on fish bodies, and shellfish attached to the pond wall and net cage, making it a good “garbage fish”. It is thus suitable for mixed cultivation with other marine shrimp and fish. However, artificial propagation is still not effective in the actual breeding process. Elucidating the reproductive regulation mechanism of S. argus will help its artificial reproduction. Although in recent years, studies were conducted based on the reproductive biology of S. argus [,,,,], there is no research conducted on the reference genes of S. argus, making the study of its reproductive regulation mechanism difficult. Considering the important roles of the pituitary and ovary in the reproductive regulation of female S. argus, appropriate reference genes for these two tissues at different ovarian developmental stages are of great significance for future research.
This study aims to identify a suitable reference gene that can be expressed for RT-qPCR investigation in the ovary and pituitary of S. argus at different ovarian stages (stage II, stage III, and stage IV). In previous studies on reference genes in other species and on the female pituitary transcriptome of S. argus (unpublished data), for analysis of candidate reference genes, four ovarian genes and seventeen pituitary genes were selected. These genes include elongation factor 1-alpha (EEF1A), Beta-2-microglobulin-like (B2M), hypoxanthine-guanine phosphoribosyl transferase (HPRT1), and beta-actin (ACTB) in the ovary, and apolipoprotein A-IV (APOA1), Fsh beta subunit (CGBA), 60S acidic ribosomal protein PO (RPLPO), gonadotropin-releasing hormone II receptor (GNRHR), TATA box binding protein (TBP), beta-glucuronidase (GUSB), tricarboxylate transport protein (SLC25A5), 60S ribosomal protein L4 (RPL4), phospholipase A1 member A isoform XI (PLA1A), receptor of activated protein C kinase 1 (GNB2L1/RACK1), cathepsin L-like (CTFS), 40S ribosomal protein S2 (RPS2), Transferrin receptor protein 1 (TFRC), tubulin beta-2b chain (TUBB4B), B2M, HPRT1, and GAPDH in the pituitary. The RT-qPCR results were analyzed using the four-software mentioned above. Ultimately, RefFinder was used to provide a comprehensive ranking of the stability of these candidate reference genes. This study provided a reliable number of reference genes that are appropriate for RT-qPCR analysis in the pituitary and ovary of S. argus at different ovarian stages.
2. Materials and Methods
2.1. Ethical Statement
The Experimental Animal Care Committee of Guangdong Ocean University gave its approval for the experimental animals used in this study.
2.2. Experimental Fish and Sample Collection
A total number of 20 two-year-old female S. argus (weight: 242.83 ± 50.90 g, length: 19.48 ± 1.13 cm) were collected from Donghai Island in Zhanjiang, Guangdong Province, China. The fish fasted for 24 h and then were anaesthetized with MS-222 (Sigma, St. Louis, MO, USA) before sampling. Then the fish were dissected for ovarian and pituitary tissues. Then liquid nitrogen was used to snap freeze the pituitary and ovary that were then stored at −80 °C, ready for RNA extraction. Part of the ovaries was fixed in Bouin’s solution overnight. The fixed ovaries were then used for preparing paraffin sections and stained with hematoxylin-eosin according to the manipulation of Jiang et al. []. The stained fragments were observed under a Nikon Eclipse Ti-E microscope (Tokyo, Japan). The development stages of the ovary were determined according to previous findings [,].
2.3. RNA Extraction and cDNA Synthesis
The Trizol reagent kit (Invitrogen, Carlsbad, CA, USA) was used to extract total RNA from ovarian and pituitary tissue following the manufacturer’s instructions. An Agilent 2100 Bioanalyzer (Agilent Technologies, Palo Alto, CA, USA) was used to assess the RNA integrity value (RIN). The RNA quality was also checked using agarose gel electrophoresis. A total of 1 μg RNA of each sample was used to synthesize the first strand of cDNA using Prime ScriptTM RT Reagent Kit with gDNA Eraser (RR047A; Takara Bio, Dalian, China).
2.4. Primer Design
We selected seventeen candidate reference genes for the pituitary. The internal reference genes B2M, HPRT1, GAPDH, TUBB4B, GUSB, TBP, and GNB2L1 were selected, as they were used in previous reports [,,,,]. According to our transcriptome data (unpublished data), these genes APOA1, CGBA, RPLP0, GNRHR, SLC25A1, PLA1A, CTFS, RPL4, RPS2, and TFRC were selected because they are highly expressed in the pituitary of S. argus. We selected these genes, EEF1A, B2M, GAPDH, and HPRT1 for analysis since they were established as good reference genes for the ovary in Magang geese [], Mozambique tilapia [], mouse [], and sows []. Based on the candidate reference gene sequences obtained from the reference genome of S. argus [], the oligo primer analysis software Version 7.0 was used to design the primers [] (Table 1). The primers were synthesized by Sangon Biotech Co. Ltd. (Shanghai, China).

Table 1.
Primer sequences used in the present study.
2.5. Real-Time Quantitative PCR (RT-qPCR) Analysis and Determination of the Amplification Efficiencies
For real-time quantitative PCR, the SYBR Green PCR Mix (TransGen Biotech, Beijing, China) was used. The RT-qPCR reaction system (total volume 20 µL) consisted of the 10 µL of SYBR Green Mix, 1 µ template, 0.5 µL forward and reverse primer (100 μmol /mL), and 8 µL of water. Reaction conditions included one initial cycle of denaturation at 95 °C for 300 s, then followed by 40 cycles (95 °C for 30 s, annealing temperature for 20 s, and conducting elongation at 72 °C for 30 s). Melting curve analysis was used for all reactions to determine the specificity of the PCR-amplified products. For each set of primers, the amplification efficiencies (AE) were determined using standard curves with the ten-fold dilution of the cDNA template (1, 1/10, 1/100, and 1/1000). The equation AE = (10[−1/slope] −1) × 100 [] is used to calculate the AE value. RT-qPCR was performed in triplicate using a Light Cycler 96 (Roche Diagnostics, Shanghai, China).
2.6. Stability Analysis of Candidate Reference Genes
The stability of candidate reference genes was tested using the ovary and pituitary cDNA isolated from all samples, respectively. The ovarian and pituitary cDNA for RT-qPCR reactions were performed in triplicate as well. After that, NormFinder, GeNorm, ΔCt, and BestKeeper were used to analyze the stability of the genes using the average Ct values of each sample. GeNorm calculates a M value for each gene, and the gene with the lowest M value has the highest stability []. Each candidate gene’s stability was ranked by inter-group variation by NormFinder (SV) []. To determine each gene’s stability, the ΔCt method was used by obtaining the standard deviation of Cq differences within each sample for each pairwise comparison with the over genes and averaging them [,]. The best-stabilized gene with the lowest coefficient of variance and standard deviation (SD) was selected by BestKeeper. Reference genes with the SD value of <1 are considered to be stable []. Finally, RefFinder integrates the four techniques mentioned above and provides a thorough ranking for the tested candidate reference genes []. Additionally, the pairwise variation (Vn/n+1), which was carried out using the GeNorm tool, was used to select the total number of reference genes for normalizing gene expression. Universally, (Vn/n+1) less than the threshold value of 0.15 denotes that n is the most appropriate number and that the n + 1 reference gene is not required for normalization.
3. Results
3.1. Characteristics of Ovarian Stages
The HE staining revealed that a significant amount of primary growth oocyte (PG) occupied the ovary stage at stage II (N = 6), while much previtellogenic oocyte (PV) and early vitellogenic oocyte (EV) appeared in the ovary at stage III (N = 3), and plenty of late vitellogenic oocytes (LV) were found in the ovary as stage IV (N = 11) (Figure 1 and Supplementary Table S1).
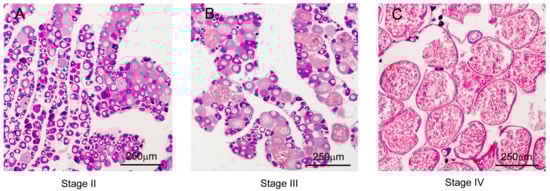
Figure 1.
Gonadal histology of the S. argus.
3.2. RNA Extraction and Quality
All the 28S:18S ratios of the total RNA samples were greater than 1, and the OD260/280 ratios were 1.8~2.0. Except for one ovary sample in stage IV, the RIN of all other sample RNAs was above 7, indicating good quality (Figure 2A,B). RT-PCR revealed that ACTB primers could amplify a single band with both ovary and pituitary cDNA, indicating that the cDNA is good for further analysis (Figure 2C,D).
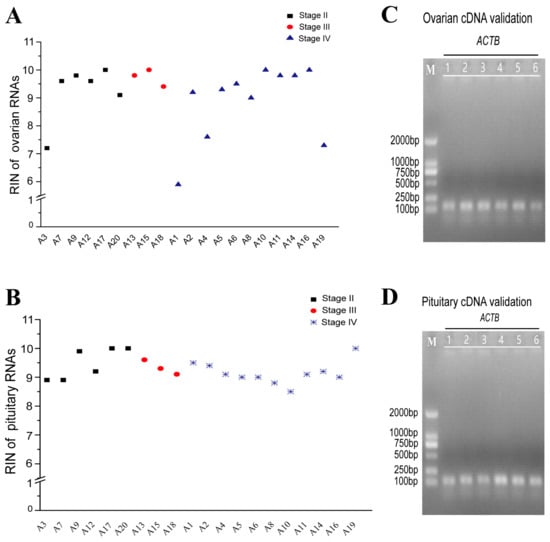
Figure 2.
Quality detection of total RNA and cDNA. RIN of ovarian (A) and pituitary (B) RNAs (RIN above 7 indicates high RNA integrity). Amplification of ovarian (C) and pituitary (D) cDNA by ACTB.
3.3. Specificity and Efficiency of the Candidate Primers
The specificity of the primers was identified by PCR amplification and testing the PCR product length using agarose to get electrophoresis. The results indicate that all the primers could amplify a single band in the ovary or pituitary samples (data are not shown). The analysis of the melting curve showed that all the primers present a single peak at the expected primer annealing temperature (Supplementary Figure S1 and Figure S2), confirming the primers pairs’ specificity. Additionally, the AE of all primer pairs ranged from 92.71 to 110.27%, meeting the basic requirement of the RT-qPCR (Table 1).
3.4. Expression Profiles of Candidate Reference Genes
RT-qPCR revealed that the candidate reference genes’ mean Ct values varied from 9.52 to 21.95 cycles in the ovary and 13.42 to 28.03 cycles in the pituitary (Figure 3A,B). In both the ovary and pituitary tissues, the candidate reference genes expression varied with the ovary development.
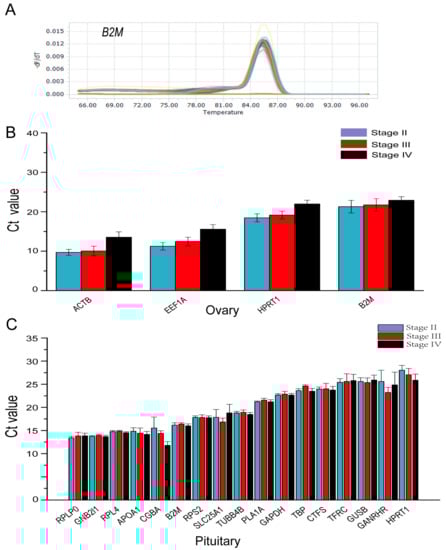
Figure 3.
Primer-specific detection and expression levels of candidate reference genes in the ovary and pituitary tissues of S. argus. (A) Expression levels of four candidate reference genes in the ovary at different stages. (B) Expression levels of four candidate reference genes in the ovary at different stages. (C) Expression levels of seventeen candidate reference genes in the pituitary at different stages.
3.5. Stability of Candidate Reference Genes in Ovaries
The GeNorm analysis indicated that in the different stages of ovaries, stage II, stage IV, and all stages, the ranking for stability was EEF1A = HPRT1 > ACTB > B2M (Figure 4A,C,D), while in the ovaries at stage III, the ranking for stability was ACTB = HPRT1 > EEF1A > B2M (Figure 4C). Interestingly, the NormFinder analysis and the ΔCt analysis share the same results: the ranking for stability was EEF1A > HPRT1 > ACTB > B2M in the ovaries at stages II and IV (Figure 4E,G,I,K). Meanwhile, in the ovaries at stage III, the ranking for ranking was ACTB > HPRT1 > EEF1A > B2M (Figure 4F,J). In ovarian samples of all stages, the ranking for stability was HPRT1 > EEF1A > ACTB > B2M (Figure 4H,L). The findings of the BestKeeper analysis revealed that the B2M gene in stage II and stage III ovaries, the ACTB gene in stage IV ovaries, and the EEF1A, HPRT1, and ACTB genes in ovarian samples of all stages were not stable for their SD > 1 (Figure 4M–P). Thus, according to the BestKeeper analysis, the stability ranking was ACTB > EEF1A > HPRT1 in ovaries at stage II, HPRT1 > EEF1A > ACTB in ovaries at stage III, and B2M > HPRT1 > EEF1A > ACTB in ovaries at stage IV.
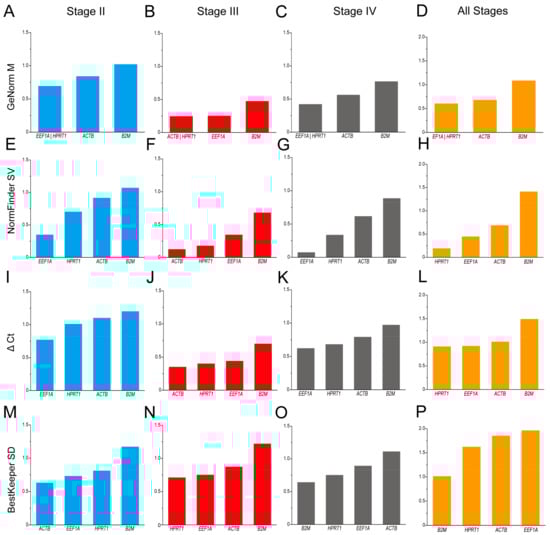
Figure 4.
Analysis of the candidate reference gene stability in ovaries at different stages based on GeNorm (A–D), NormFinder (E–H), ΔCt (I–L), and BestKeeper (M–P) programs.
Based on the four methods above, the potential gene stability was comprehensively ranked throughout all stages using RefFinder. The results indicate that the ranking of stability was EEF1A > HPRT1 > ACTB > B2M in ovaries at stage II (Figure 5A), ACTB > HPRT1 > EEF1A > B2M in ovaries at stage III (Figure 5B), EEF1A > HPRT1 > B2M > ACTB in ovaries at stage IV (Figure 5C), and finally, HPRT1 > EEF1A > B2M > ACTB in ovaries at all stages (Figure 5D).
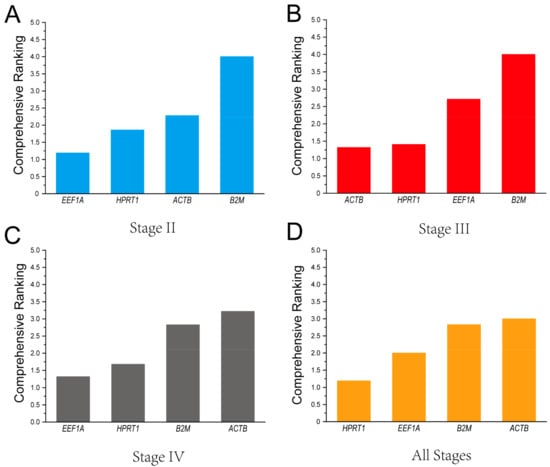
Figure 5.
Ranking of the candidate reference genes’ stability in ovaries at different stages using RefFinder. (A) Stage II; (B) Stage III; (C) Stage IV; (D) All stages.
3.6. Stability of Candidate Reference Genes in the Pituitary
In the pituitary, NormFinder, ΔCt, BestKeeper, and GeNorm analyses revealed that RPL4, GNB2L1, PLA1A, TUBB4B, GAPDH, RPS2, TBP, and B2M were more stable than other candidate reference genes because their stability ranking was always in the forefront, although their stability ranking order was different in samples of different stages (Figure 6A–D). In the GeNorm analysis, GAPDH and TUBB4B were more stable reference genes in the pituitary at stage II, GNB2L1 and PLA1A in the pituitary at stage III, RPL4 and TUBB4B in the pituitary at stage IV, and RPL4 and GNB2L1 in the pituitary at all stages (Figure 6A). In the BestKeeper analysis, the results show that SLC25A1, GNRHR, and CGBA in the pituitary at stage II; HPRT1 and TFRC in the pituitary at stage III; HPRT1, SLC25A1, and GNRHR in the pituitary at stage IV; and SLC25A1, HPRT1, GNRHR, and CGBA in the pituitary at all stages were not stable for SD > 1 (Figure 6C).
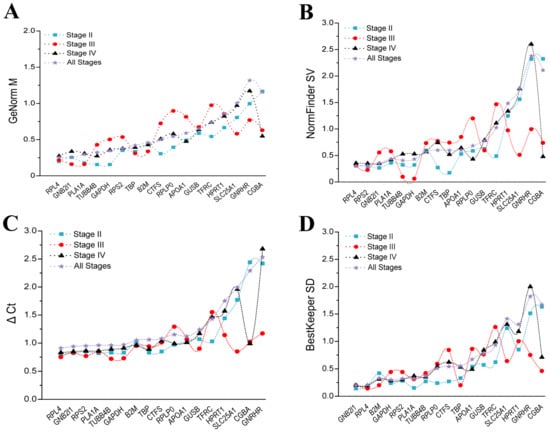
Figure 6.
Analysis of the candidate reference gene stability in the ovaries at different stages based on GeNorm (A), NormFinder (B), ΔCt (C), and BestKeeper (D) programs.
According to the RefFinder analysis, the comprehensive rankings in the pituitary at stage II were as follows: GNB2L1 > RPL4 > PLA1A > GAPDH > TUBB4B > TBP > CTFS > RPS2 > RPLP0 > B2M > APOA1 > TFRC > GUSB > HPRT1 > SLC25A1 > GNRHR > CGBA (Figure 7A). In the pituitary at stage III, the stability ranking was RPL4 > TUBB4B > GNB2L1 > GAPDH > PLA1A > RPS2 > TBP > B2M > SLC25A1 > GUSB > CGBA > CTFS > GNRHR > APOA1 > RPLP0 > HPRT1 > TFRC (Figure 7B). In the pituitary at stage IV, the stability ranking was RPL4 > GNB2L1 > RPS2 > TUBB4B > PLA1A > GAPDH > TBP > B2M > RPLP0 > CGBA > APOA1 > CTFS > GUSB > TFRC > HPRT1 > SLC25A1 > GNRHR (Figure 7C). In the pituitary at all stages, the stability ranking was RPL4 > GNB2L1 > RPS2 > PLA1A > TUBB4B > GAPDH > B2M > TBP > CTFS > RPLP0 > APOA1 > GUSB > TFRC > HPRT1 > SLC25A1 > CGBA > GNRHR (Figure 7D).
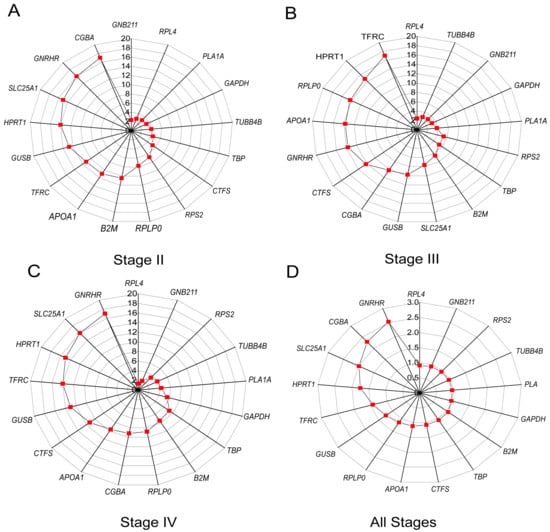
Figure 7.
Ranking of the candidate reference gene stability in the pituitary at different stages by RefFinder. (A) Stage II; (B) Stage III; (C) Stage IV; (D) All stages.
3.7. Determination of the Optimal Number of Reference Genes
The GeNorm analysis showed that the V2/3 was below 0.15 across the different developmental stages in the ovary and pituitary tissues, respectively. The two reference genes were reliable for the accurate normalization of gene expression; therefore, there is no need to introduce the next internal reference gene for correction (Figure 8). Combined with the analysis of the reference gene stability, EEF1A and HPRT1 and RPL4 and GNB2L1 can be used to combine optimal reference genes in the ovary and pituitary, respectively, at stage II, stage IV, and for all stages. In stage III, the combination of optimal reference genes was ACTB and HPRT1, and RPL4 and TUBB4B in the ovary and pituitary, respectively.
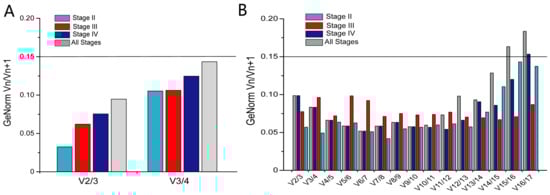
Figure 8.
The optimal number of reference genes for normalization of gene expression in the ovary (A) and pituitary (B). GeNorm was used to calculate the pairwise variation (Vn/Vn + 1, and “n” represents the number of reference genes).
4. Discussion
It is widely recognized that the selection of the appropriate endogenous reference genes is important for the study of gene expression with RT-qPCR since various studies indicated that reference genes are development-dependent, conditional, and tissue-specific [,,]. The reference genes for RT-qPCR underwent validation for various tissues in different organisms [,,,,,,,,,]. However, there is no evidence of suitable reference genes in tissues of S. argus. In this research, RT-qPCR analysis was used to evaluate the expression levels of 21 candidate reference genes, including 17 genes in the pituitary and 4 genes in the ovary of S. argus, and we identified which genes are suitable for the ovary and pituitary at different ovarian stages.
In choosing a candidate reference gene, a key characteristic that should be considered is expression stability, regardless of the tissue’s development stages or physiological conditions that they are expressed in. In the present study, five types of software were used to evaluate the candidate reference gene stability, including GeNorm [], NormFinder [], the comparative ΔCt method [], BestKeeper [], and RefFinder []. Interestingly, the rankings of GeNorm, NormFinder, comparative ΔCt, and RefFinder are always consistent with each other and different from those of BestKeeper in samples of the same stage, whether in the ovary or pituitary. This variation is probably because NormFinder and GeNorm evaluate the reference genes’ stability according to the variation in Ct values, while BestKeeper calculates stability values based on the Ct values’ correlation coefficient [,], as reported in previous studies [,,,,]. According to Robbledo et al. [], the ranking generated by the NormFinder method is the most reliable ranking for choosing reference genes for RT-qPCR analysis when the results of gene stability measurement methods differ. Therefore, several methods need to be applied to evaluate the reference genes’ stability to make a final decision.
The ovary is the hypothalamus–pituitary–gonadal (HPG) axis target organ that exhibits functional and morphological differences during developmental stages []. The stability of reference gene expression in the ovaries of vertebrates was validated in a number of studies. Ji et al. [] found that in the liver and ovaries of Zi geese (Anser cygnoides), there were the most stable GAPDH expressions. Gao et al. [] found that ACTB and CTSD were best-suited gene combinations for normalization in the ovary of turbot (Scophthalmus maximus). Cai et al. [] found that TBP is the appropriate reference gene for examining clock gene expression in vitro in the rat (Rattus norvegicus) ovarian granulosa cells. EEF1 was reported by Mahanty et al. [], to be a more appropriate reference gene in the minnows’ (Puntius sophore) ovaries. According to Hu et al. [], the gonads of M. albus may have reference genes, such as EF1 and RPL17, in the various stages of development. Meanwhile, due to the level of expression variability, the reference genes 18S, GAPDH, and ACTB are not appropriate. In this study, we found that the optimal internal reference gene combination was EEF1A and HPRT1 in stage II, stage IV, and all-stages ovaries, and ACTB and HPRT1 in the ovaries of stage III after combining the results of four software analyses. All cells expressed EEF1, which performs a number of functions during cell growth and proliferation [,,]. In the gonads of zebrafish exposed to endocrine disruptors, EEF1 was also found to be an appropriate reference gene [], and M. albus in different stages of development []. HPRT1 is an important enzyme in gout and uric acid metabolism []. In fathead minnows (Pimephales promelas), HPRT1 was recommended as the appropriate internal control in real-time PCR studies of the effects of estrogen in fish []. HPRT1 was identified as the top candidate housekeeping gene in the zebrafish xenograft model []. In the ovaries of zebrafish exposed to Roundup, HPRT1 was reported as the best stable ranked gene []. Therefore, EEF1A and HPRT1 might be widely used in fish as ovary reference genes.
In teleosts, the pituitary is an important organ that regulates the growth and maturation of the ovary. Selecting appropriate reference genes to use for normalization in this tissue is rarely investigated. According to Zhang et al. [], HPRT1 and RPL4 were found to be the best reference genes for the pituitary of the Magang goose at different stages of reproduction. Gao et al. [] found that ACTB, 18S, and CTSD were the most suited gene combination for normalization in the pituitary of S. maximus. GeNorm rated 18S as the most stable gene in the pituitary of sparrows []. In this study, except for RPL4 and TUB4B in fish with ovaries in stage III, GNB2L1 and RPL4 were the most stable reference gene combinations in the pituitary of S. argus. In any case, GNB2L1, RPL4, and TUB4B were among the top five most stable reference genes in the pituitary. GNB2L1, also known as RACK1, plays a part in cellular signaling pathways [,]. GNB2L1 was suggested to be a suitable reference gene for studying gene expression in neutrophils [] and the ovary of sows []. To the best of our knowledge, GNB2L1 was identified for the first time in fish as a reference gene. RPL4 encodes a protein that is a component of the 60S ribosomal subunit [] and was previously suggested as a suitable reference gene in many studies, such as in exfoliated cervical cells [], in ovarian tumors [], in the pituitary of Magang geese [], in Ophraella communa [], and in Atlantic cod (Gadus morhua) []. In the pituitary of S. argus, GNB2L1, RPL4, and TUB4B may serve as appropriate reference genes.
Following the Minimum Information for Publication of Quantitative Real-Time PCR Experiments (MIQE) [], the results of RT-qPCR data analysis may differ when a single reference gene is used. Therefore, it is recommended to use more than one reference gene in the experiment. In this study, the two reference genes that are most stably expressed in the ovary and pituitary both had GeNorm V values of <0.15, which means two reference genes are enough to normalize the data expression in the ovary and pituitary of each developmental stage, respectively. Consistently, numerous studies reported that the two reference genes were the optimal number required in the experiment [,,,]. Taken together, this study recommends using at least two reference genes for RT-qPCR to avoid variation in reference genes.
5. Conclusions
For the first time, the ovaries and pituitary of S. argus at different ovarian stages were used to authenticate a group of candidate reference genes in this study. In conclusion, analysis of reference gene stability using five types of software revealed that the combination of two reference genes in the ovary (HPRT1, EEF1A) and pituitary (GNB2L1, RPL4) is highly recommended to be used as reference genes in S. argus at different ovarian stages. We expect these findings will contribute to the development and advancement of molecular research on the reproduction of S. argus.
Supplementary Materials
The following are available online at https://www.mdpi.com/article/10.3390/fishes8020120/s1, Figure S1: The melting curves of the cDNA samples amplified with candidate genes in ovary; Figure S2: The melting curves of the cDNA samples amplified with candidate genes in pituitary; Table S1: Ovarian stages of the 20 female spotted scat. Table S2: Expression stability analysis of each candidate reference gene in the ovary based on five softwares; Table S3: Expression stability analysis of each candidate reference gene in the pituitary based on five softwares.
Author Contributions
Z.L.: Conceptualization, investigation, data curation, formal analysis, visualization and writing—original draft; T.W. (Tuo Wang), P.L., D.J., X.L. and S.D.: investigation, data curation and formal analysis; T.W. (Tianli Wu) and Y.H.: resources; C.Z. and G.L.: resources, funding acquisition, project administration and supervision; M.J.: conceptualization, writing—original draft, writing—review and editing, funding acquisition, project administration, and supervision. All authors have read and agreed to the published version of the manuscript.
Funding
This study was supported by grants from the National Natural Science Foundation of China (Nos. 32002368, 32172971 and 32273131), the Zhan jiang city science and technology projects (2022A01015 and 2022A01214), the Guangdong Basic and Applied Basic Research Foundation (2021A1515010430), the talent team tender grant of Zhanjiang marine equipment and biology (2021E05035), and the science and technology plan of Yang jiang city (2022011). This study was also supported by program for scientific research start-up funds of Guangdong Ocean University and the help of all teachers and students in the laboratory.
Institutional Review Board Statement
The experimental animals used in this study have been approved by the Experimental Animal care Committee of Guangdong Ocean University. Approval code: GDOU-IACUC-2020-A01860.
Data Availability Statement
The data presented in this study are available on request from the corresponding author. The data are not publicly available due to privacy.
Acknowledgments
Thanks to all the teachers and students in the lab for their support and help in my experiment.
Conflicts of Interest
The authors declare no conflict of interest.
References
- Bustin, S.A.; Benes, V.; Garson, J.A.; Hellemans, J.; Huggett, J.; Kubista, M.; Mueller, R.; Nolan, T.; Pfaffl, M.W.; Shipley, G.L.; et al. The MIQE guidelines: Minimum information for publication of quantitative real-time PCR experiments. Clin. Chem. 2009, 55, 611–622. [Google Scholar] [CrossRef]
- Zhang, Y.; Chen, J.; Chen, G.; Ma, C.; Chen, H.; Gao, X.; Tian, Z.; Cui, S.; Tian, Z.; Guo, J.; et al. Identification and validation of reference genes for quantitative gene expression analysis in Ophraella communa. Front. Physiol. 2020, 11, 355. [Google Scholar] [CrossRef]
- Cai, C.; Cai, P.; Chu, G. Selection of suitable reference genes for core clock gene expression analysis by real-time qPCR in rat ovary granulosa cells. Mol. Biol. Rep. 2019, 46, 2941–2946. [Google Scholar] [CrossRef]
- Liman, M.; Wenji, W.; Conghui, L.; Haiyang, Y.; Zhigang, W.; Xubo, W.; Jie, Q.; Quanqi, Z. Selection of reference genes for reverse transcription quantitative real-time PCR normalization in black rockfish (Sebastes schlegeli). Mar. Genom. 2013, 11, 67–73. [Google Scholar] [CrossRef]
- Dheda, K.; Huggett, J.F.; Bustin, S.A.; Johnson, M.A.; Rook, G.; Zumla, A. Validation of housekeeping genes for normalizing RNA expression in real-time PCR. BioTechniques 2004, 37, 112–119. [Google Scholar] [CrossRef]
- Zhang, B.-B.; Shen, X.; Li, X.-J.; Tian, Y.-B.; Ouyang, H.-J.; Huang, Y.-M. Reference gene selection for expression studies in the reproductive axis tissues of Magang geese at different reproductive stages under light treatment. Sci. Rep. 2021, 11, 7573. [Google Scholar] [CrossRef]
- Hu, Q.; Guo, W.; Gao, Y.; Tang, R.; Li, D. Reference gene selection for real-time RT-PCR normalization in rice field eel (Monopterus albus) during gonad development. Fish Physiol. Biochem. 2014, 40, 1721–1730. [Google Scholar] [CrossRef]
- Deloffre, L.A.M.; Andrade, A.; Filipe, A.I.; Canario, A.V.M. Reference genes to quantify gene expression during oogenesis in a teleost fish. Gene 2012, 506, 69–75. [Google Scholar] [CrossRef]
- McCurley, A.T.; Callard, G.V. Characterization of housekeeping genes in zebrafish: Male-female differences and effects of tissue type, developmental stage and chemical treatment. BMC Mol. Biol. 2008, 9, 102. [Google Scholar] [CrossRef]
- Rassier, G.T.; Silveira, T.L.R.; Remião, M.H.; Daneluz, L.O.; Martins, A.W.S.; Dellagostin, E.N.; Ortiz, H.G.; Domingues, W.B.; Komninou, E.R.; Kütter, M.T.; et al. Evaluation of qPCR reference genes in GH-overexpressing transgenic zebrafish (Danio rerio). Sci. Rep. 2020, 10, 12692. [Google Scholar] [CrossRef]
- Ma, D.; Fan, J.; Tian, Y.; Jiang, P.; Wang, J.; Zhu, H.; Bai, J. Selection of reference genes for quantitative real-time PCR normalisation in largemouth bass Micropterus salmoides fed on alternative diets. J. Fish Biol. 2019, 95, 393–400. [Google Scholar] [CrossRef]
- Andersen, C.L.; Jensen, J.L.; Ørntoft, T.F. Normalization of real-time quantitative reverse transcription-PCR data: A model-based variance estimation approach to identify genes suited for normalization, applied to bladder and colon cancer data sets. Cancer Res. 2004, 64, 5245–5250. [Google Scholar] [CrossRef]
- Vandesompele, J.; De Preter, K.; Pattyn, F.; Poppe, B.; Van Roy, N.; De Paepe, A.; Speleman, F. Accurate normalization of real-time quantitative RT-PCR data by geometric averaging of multiple internal control genes. Genome Biol. 2002, 3, research0034. [Google Scholar] [CrossRef]
- Silver, N.; Best, S.; Jiang, J.; Thein, S.L. Selection of housekeeping genes for gene expression studies in human reticulocytes using real-time PCR. BMC Mol. Biol. 2006, 7, 33. [Google Scholar] [CrossRef]
- Pfaffl, M.W.; Tichopad, A.; Prgomet, C.; Neuvians, T.P. Determination of stable housekeeping genes, differentially regulated target genes and sample integrity: BestKeeper—Excel-based tool using pair-wise correlations. Biotechnol. Lett. 2004, 26, 509–515. [Google Scholar] [CrossRef]
- Chen, C.; Wu, J.; Hua, Q.; Tel-Zur, N.; Xie, F.; Zhang, Z.; Chen, J.; Zhang, R.; Hu, G.; Zhao, J.; et al. Identification of reliable reference genes for quantitative real-time PCR normalization in pitaya. Plant Methods. 2019, 15, 70. [Google Scholar] [CrossRef]
- Robledo, D.; Hernández-Urcera, J.; Cal, R.M.; Pardo, B.G.; Sánchez, L.; Martínez, P.; Viñas, A. Analysis of qPCR reference gene stability determination methods and a practical approach for efficiency calculation on a turbot (Scophthalmus maximus) gonad dataset. BMC Genom. 2014, 15, 648. [Google Scholar] [CrossRef]
- Mao, H.; Chen, K.; Zhu, X.; Luo, Q.; Zhao, J.; Li, W.; Wu, X.; Xu, H. Identification of suitable reference genes for quantitative real-time PCR normalization in blotched snakehead Channa maculata. J. Fish Biol. 2017, 90, 2312–2322. [Google Scholar] [CrossRef]
- Yang, C.; Pan, H.; Liu, Y.; Zhou, X. Stably expressed housekeeping genes across developmental stages in the two-spotted spider mite, Tetranychus urticae. PLoS ONE. 2015, 10, e0120833. [Google Scholar] [CrossRef]
- Franzellitti, S.; Kiwan, A.; Valbonesi, P.; Fabbri, E. Selection of best-performing reference gene products for investigating transcriptional regulation across silvering in the European eel (Anguilla anguilla). Sci. Rep. 2015, 5, 16966. [Google Scholar] [CrossRef]
- Bagés, S.; Estany, J.; Tor, M.; Pena, R.N. Investigating reference genes for quantitative real-time PCR analysis across four chicken tissues. Gene 2015, 561, 82–87. [Google Scholar] [CrossRef] [PubMed]
- Mustapha, U.F.; Huang, Y.; Huang, Y.-Q.; Assan, D.; Shi, H.-J.; Jiang, M.-Y.; Deng, S.-P.; Li, G.-L.; Jiang, D.-N. Gonadal development and molecular analysis revealed the critical window for sex differentiation, and E2 reversibility of XY-male spotted scat, Scatophagus argus. Aquaculture 2021, 544, 737147. [Google Scholar] [CrossRef]
- Jiang, M.; Liu, J.; Jiang, D.; Pan, Q.; Shi, H.; Huang, Y.; Zhu, C.; Li, G.; Deng, S. Characterization and expression analysis of gpr173a and gpr173b revealed their involvement in reproductive regulation in spotted scat (Scatophagus argus). Aquac. Res. 2022, 25, 101239. [Google Scholar] [CrossRef]
- Chen, H.P.; Cui, X.F.; Wang, Y.R.; Li, Z.Y.; Tian, C.X.; Jiang, D.N.; Zhu, C.H.; Zhang, Y.; Li, S.S.; Li, G.L. Identification, functional characterization, and estrogen regulation on gonadotropin-releasing hormone in the spotted scat, Scatophagus argus. Fish Physiol. Biochem. 2020, 46, 1743–1757. [Google Scholar] [CrossRef] [PubMed]
- Cui, X.F.; Zhao, Y.; Chen, H.P.; Deng, S.P.; Jiang, D.N.; Wu, T.L.; Zhu, C.H.; Li, G.L. Cloning, expression and functional characterization on vitellogenesis of estrogen receptors in Scatophagus argus. Gen. Comp. Endocrinol. 2017, 246, 37–45. [Google Scholar] [CrossRef]
- Zhai, Y.; Deng, S.P.; Liu, J.Y.; Jiang, D.N.; Huang, Y.; Zhu, C.H.; Li, G.L.; Li, M.H. The reproductive regulation of LPXRFa and its receptor in the hypothalamo-pituitary-gonadal axis of the spotted scat (Scatophagus argus). Fish Physiol. Biochem. 2021, 47, 93–108. [Google Scholar] [CrossRef]
- Deng, S.P.; Chen, H.P.; Zhai, Y.; Jia, L.Y.; Liu, J.Y.; Wang, M.; Jiang, D.N.; Wu, T.L.; Zhu, C.H.; Li, G.L. Molecular cloning, characterization and expression analysis of spexin in spotted scat (Scatophagus argus). Gen. Comp. Endocrinol. 2018, 266, 60–66. [Google Scholar] [CrossRef]
- Gao, Y.; Gao, Y.; Huang, B.; Meng, Z.; Jia, Y. Reference gene validation for quantification of gene expression during ovarian development of turbot (Scophthalmus maximus). Sci. Rep. 2020, 10, 823. [Google Scholar] [CrossRef]
- Moermans, C.; Deliege, E.; Pirottin, D.; Poulet, C.; Guiot, J.; Henket, M.; da Silva, J.; Louis, R. Suitable reference genes determination for real-time PCR using induced sputum samples. Eur. Respir. J. 2019, 54, 1800644. [Google Scholar] [CrossRef]
- Kolkova, Z.; Arakelyan, A.; Casslén, B.; Hansson, S.; Kriegova, E. Normalizing to GADPH jeopardises correct quantification of gene expression in ovarian tumours—IPO8 and RPL4 are reliable reference genes. J. Ovarian Res. 2013, 6, 60. [Google Scholar] [CrossRef]
- Dunislawska, A.; Slawinska, A.; Siwek, M. Validation of the reference genes for the gene expression studies in chicken DT40 cell line. Genes 2020, 11, 372. [Google Scholar] [CrossRef] [PubMed]
- Filatov, M.A.; Nikishin, D.A.; Khramova, Y.V.; Semenova, M.L. Reference genes selection for real-time quantitative PCR analysis in mouse germinal vesicle oocytes. Zygote 2019, 27, 392–397. [Google Scholar] [CrossRef] [PubMed]
- Martínez-Giner, M.; Noguera, J.L.; Balcells, I.; Fernández-Rodríguez, A.; Pena, R.N. Selection of internal control genes for real-time quantitative PCR in ovary and uterus of sows across pregnancy. PLoS ONE. 2013, 8, e66023. [Google Scholar] [CrossRef] [PubMed]
- Huang, Y.; Mustapha, U.F.; Huang, Y.; Tian, C.; Yang, W.; Chen, H.; Deng, S.; Zhu, C.; Jiang, D.; Li, G. A chromosome—Level genome assembly of the Spotted Scat (Scatophagus argus). Genome Biol. Evol. 2021, 13, evab092. [Google Scholar] [CrossRef] [PubMed]
- Rychlik, W. OLIGO 7 Primer Analysis Software. Methods Mol. Biol. 2007, 402, 35–60. [Google Scholar] [PubMed]
- Kubista, M.; Andrade, J.M.; Bengtsson, M.; Forootan, A.; Jonák, J.; Lind, K.; Sindelka, R.; Sjöback, R.; Sjögreen, B.; Strömbom, L.; et al. The real-time polymerase chain reaction. Mol. Aspects Med. 2006, 27, 95–125. [Google Scholar] [CrossRef]
- Jaramillo, M.L.; Pereira, A.G.; Davico, C.E.; Nezzi, L.; Ammar, D.; Müller, Y.M.R.; Nazari, E.M. Evaluation of reference genes for reverse transcription-quantitative PCR assays in organs of zebrafish exposed to glyphosate-based herbicide, Roundup. Animal 2018, 12, 1424–1434. [Google Scholar] [CrossRef]
- Bujko, M.; Rusetska, N.; Mikula, M. Validating candidate reference genes for qRT-PCR-based gene expression analysis in nonfunctioning pituitary adenomas. Pituitary 2016, 19, 110–112. [Google Scholar] [CrossRef]
- Xia, X.; Huo, W.; Wan, R.; Xia, X.; Du, Q.; Chang, Z. Identification of housekeeping genes as references for quantitative real-time RT-PCR analysis in Misgurnus anguillicaudatus. J Genet. 2017, 96, 895–904. [Google Scholar] [CrossRef]
- Yang, C.G.; Wang, X.L.; Tian, J.; Liu, W.; Wu, F.; Jiang, M.; Wen, H. Evaluation of reference genes for quantitative real-time RT-PCR analysis of gene expression in Nile tilapia (Oreochromis niloticus). Gene 2013, 527, 183–192. [Google Scholar] [CrossRef]
- Bower, N.I.; Johnston, I.A. Selection of reference genes for expression studies with fish myogenic cell cultures. BMC Mol. Biol. 2009, 10, 80. [Google Scholar] [CrossRef] [PubMed]
- Mo, F.; Zhao, J.; Liu, N.; Cao, L.H.; Jiang, S.X. Validation of reference genes for RT-qPCR analysis of CYP4T expression in crucian carp. Genet Mol. Biol. 2014, 37, 500–507. [Google Scholar] [CrossRef] [PubMed]
- Lubzens, E.; Young, G.; Bobe, J.; Cerdà, J. Oogenesis in teleosts: How fish eggs are formed. Gen. Comp. Endocrinol. 2010, 165, 367–389. [Google Scholar] [CrossRef] [PubMed]
- Ji, H.; Wang, J.; Liu, J.; Guo, J.; Wang, Z.; Zhang, X.; Guo, L.; Yang, H. Selection of reliable reference genes for real-time qRT-PCR analysis of Zi Geese (Anser anser domestica) gene expression. Asian-Australas J. Anim. Sci. 2013, 26, 423–432. [Google Scholar] [CrossRef]
- Mahanty, A.; Purohit, G.K.; Mohanty, S.; Nayak, N.R.; Mohanty, B.P. Suitable reference gene for quantitative real-time PCR analysis of gene expression in gonadal tissues of minnow Puntius sophore under high-temperature stress. BMC Genom. 2017, 18, 617. [Google Scholar] [CrossRef]
- Hamrita, B.; Nasr, H.B.; Hammann, P.; Kuhn, L.; Guillier, C.-L.; Chaieb, A.; Khairi, H.; Chahed, K. An elongation factor-like protein (EF-Tu) elicits a humoral response in infiltrating ductal breast carcinomas: An immunoproteomics investigation. Clin. Biochem. 2011, 44, 1097–1104. [Google Scholar] [CrossRef]
- Becker, M.; Kuhse, J.; Kirsch, J. Effects of two elongation factor 1A isoforms on the formation of gephyrin clusters at inhibitory synapses in hippocampal neurons. Histochem. Cell Biol. 2013, 140, 603–609. [Google Scholar] [CrossRef]
- Vasiliou, V.; Sandoval, M.; Backos, D.S.; Jackson, B.C.; Chen, Y.; Reigan, P.; Lanaspa, M.A.; Johnson, R.J.; Koppaka, V.; Thompson, D.C. ALDH16A1 is a novel non-catalytic enzyme that may be involved in the etiology of gout via protein-protein interactions with HPRT1. Chem. Biol. Interact. 2013, 202, 22–31. [Google Scholar] [CrossRef]
- Filby, A.L.; Tyler, C.R. Appropriate ‘housekeeping’ genes for use in expression profiling the effects of environmental estrogens in fish. BMC Mol. Biol. 2007, 8, 10. [Google Scholar] [CrossRef]
- Xu, W.; Foster, B.A.; Richards, M.; Bondioli, K.R.; Shah, G.; Green, C.C. Characterization of prostate cancer cell progression in zebrafish xenograft model. Int. J. Oncol. 2018, 52, 252–260. [Google Scholar] [CrossRef]
- Zinzow-Kramer, W.M.; Horton, B.M.; Maney, D.L. Evaluation of reference genes for quantitative real-time PCR in the brain, pituitary, and gonads of songbirds. Horm Behav. 2014, 66, 267–275. [Google Scholar] [CrossRef] [PubMed]
- Wang, S.; Chen, J.-z.; Zhang, Z.; Gu, S.; Ji, C.; Tang, R.; Ying, K.; Xie, Y.; Mao, Y. Cloning, expression and genomic structure of a novel human GNB2L1 gene, which encodes a receptor of activated protein kinase C (RACK)*. Mol. Biol. Rep. 2003, 30, 53–60. [Google Scholar] [CrossRef] [PubMed]
- Guiry, A.; Flynn, D.; Hubert, S.; O’Keeffe, A.M.; LeProvost, O.; White, S.L.; Forde, P.F.; Davoren, P.; Houeix, B.; Smith, T.J.; et al. Testes and brain gene expression in precocious male and adult maturing Atlantic salmon (Salmo salar). BMC Genom. 2010, 11, 211. [Google Scholar] [CrossRef] [PubMed]
- Zhang, X.; Ding, L.; Sandford, A.J. Selection of reference genes for gene expression studies in human neutrophils by real-time PCR. BMC Mol. Biol. 2005, 6, 4. [Google Scholar] [CrossRef]
- Klinge, S.; Voigts-Hoffmann, F.; Leibundgut, M.; Arpagaus, S.; Ban, N. Crystal structure of the eukaryotic 60S ribosomal subunit in complex with initiation factor 6. Science 2011, 334, 941–948. [Google Scholar] [CrossRef]
- Steinau, M.; Rajeevan, M.S.; Unger, E.R. DNA and RNA references for qRT-PCR assays in exfoliated cervical cells. J. Mol. Diagn. 2006, 8, 113–118. [Google Scholar] [CrossRef]
- Olsvik, P.A.; Søfteland, L.; Lie, K.K. Selection of reference genes for qRT-PCR examination of wild populations of Atlantic cod Gadus morhua. BMC Res. Notes 2008, 1, 47. [Google Scholar] [CrossRef]
Disclaimer/Publisher’s Note: The statements, opinions and data contained in all publications are solely those of the individual author(s) and contributor(s) and not of MDPI and/or the editor(s). MDPI and/or the editor(s) disclaim responsibility for any injury to people or property resulting from any ideas, methods, instructions or products referred to in the content. |
© 2023 by the authors. Licensee MDPI, Basel, Switzerland. This article is an open access article distributed under the terms and conditions of the Creative Commons Attribution (CC BY) license (https://creativecommons.org/licenses/by/4.0/).