1. Introduction
The repercussions of global-warming-induced reductions in ectothermic fish body size extend beyond immediate consequences, significantly impacting population dynamics and overall ecosystem functioning [
1,
2,
3]. Understanding the intricate mechanisms driving the decrease in fish size as temperatures rise is pivotal for accurate predictions of future dispersal ranges and, consequently, is integral to species conservation efforts. In recent scientific discourse, considerable attention has been devoted to unraveling the diverse mechanisms through which global warming triggers reductions in fish size, yet a definitive consensus remains elusive within the scientific community [
1,
4,
5,
6,
7]. Given the absence of a consensus on this matter, we embarked on an exploration of behavioral size-dependent temperature preference as a prospective explanatory factor for the variance in body size. The importance of trait-based modeling is underscored, emerging as an indispensable tool for predicting future dispersal ranges and formulating effective conservation strategies [
8]. A robust and reliable framework for such modeling becomes paramount, emphasizing the critical need for consensus and clarity on the mechanisms influencing fish size reduction in the context of global warming.
Temperature can significantly influence the size of ectothermic fish through a multitude of physiological [
9] and ecological mechanisms [
10]. Physiologically, ectothermic fish exhibit temperature-dependent metabolic rates, characterized by an optimal temperature (T
pref) that enhances biochemical processes [
11]. This metabolic phenomenon is best explained by the aerobic scope, representing an organism’s capacity to elevate aerobic metabolic rates beyond maintenance levels (i.e., the difference between standard (SMR) and maximum (MMR) metabolic rates) [
12]. This scope coincides with optimal growth rates, as it describes energy available for physiological performance metrics such as growth. Deviations from this optimal temperature, both lower and higher, result in diminished metabolic energy for various fitness-related activities, including growth [
13]. Furthermore, temperature exerts significant influences on life history traits, such as the age at maturity and lifespan of fish. When the temperature rises but remains below the optimal threshold for growth, fish generally exhibit accelerated growth rates, leading to the earlier maturation of smaller fish [
14,
15], but can also extend the growing season, allowing fish to attain larger sizes [
16]. If the temperature rises above the optimal temperature it limits fishes ability to sustain its metabolism and lowers growth due to energy and oxygen constraints [
17,
18]. Additionally, higher temperatures reduces oxygen solubility making less oxygen available [
19]. Furthermore, beyond physiological aspects, temperature impacts fish size through ecological factors that indirectly affect their fitness [
10]. Much like its effects on fish size and distribution, temperature cascades through various trophic levels, thereby influencing the food sources available to the fish and, consequently, food availability within their occupied habitat [
20]. Ultimately, temperature can shape the overall quality of aquatic habitats, where warmer temperatures can alter the availability of suitable habitats, disrupt nutrient cycling, and influence the abundance and distribution of prey [
21]. These physiological and ecological dynamics can, in turn, play a pivotal role in shaping the size of fish and the population dynamics.
Fish exhibit the capacity to mitigate the adverse impacts of temperature by actively changing their distribution, seeking out environments with optimal temperature conditions, and thereby engaging in behavioral thermoregulation [
22,
23]. Within many fish species, ontogenetic shifts in temperature habitat are a common phenomenon, with larger individuals typically favoring lower ambient temperatures compared to their smaller conspecifics [
24,
25,
26]. The observed “shrinking” of fish in response to rising water temperatures could potentially be attributed to a behavioral size-dependent temperature preference, rather than changes in growth rates, wherein larger fish display a preference for lower habitat temperatures. Despite its significant implications for predicting the future dispersal ranges of species, this aspect has surprisingly garnered little attention in scientific literature. Delving into the nuances of size-dependent temperature preference promises to unveil valuable insights into the behavioral adaptations of fish to changing environmental conditions, offering a nuanced perspective for future modeling studies and conservation strategies.
The Atlantic cod,
Gadus morhua, stands as a pivotal temperate benthopelagic marine fish, showcasing a widespread distribution across the North Atlantic Sea’s shelf areas, extending its reach into Arctic waters and parts of the Baltic Sea [
27]. The Atlantic cod plays a crucial role as a keystone predator in the ecosystem, simultaneously serving as a commonly caught species in fisheries, giving it significant ecological and economic importance [
28,
29]. Notably, the past few years have witnessed substantial distribution shifts in Atlantic cod populations, thought to be driven by climate change [
28,
30]. The behavioral dichotomy between juvenile and adult cod is striking, with the former occupying shallow coastal areas, embracing a temperature spectrum from −1 °C during winter to 20 °C in the summer, while the latter thrives in deeper, colder waters [
31].
The Atlantic cod’s optimal growth and metabolic temperatures demonstrate a decreasing trend with increasing fish size [
32,
33]. This phenomenon prompts a compelling hypothesis: as decreases in fish size escalate, the larger Atlantic cod might selectively opt for habitats with colder temperatures to intricately balance and optimize its growth and metabolic performance. In the context of our study, the Atlantic cod emerges as an exemplary model organism for unraveling the intricacies of size-dependent temperature preference (T
pref). The central tenet of our hypothesis is that T
pref decreases with fish body size in accordance with previous temperature preference studies based on physiological performance metrics. In the context of global warming this sheds light on broader implications for fish populations in a changing climate. It is pivotal to investigate how the temperature and size interplay influences the cod’s susceptibility to predators and diseases, thus potentially affecting population sizes and stability. The findings from our study may serve as a foundation for predictive models that explore the potential impact of future ocean temperature changes on the spatial distribution and population dynamics of the Atlantic cod.
2. Methods
The Atlantic cod
Gadus morhua provides an optimal model species for studying size-dependent temperature preference in fish as it is a thoroughly studied and an economically important species [
34], that has undergone a major distribution shift in recent time [
28,
30]. The Atlantic cod is a species of considerable ecological prominence and has been the focus of thorough scientific investigation, providing a wealth of data and insights into its physiological and behavioral attributes.
2.1. Fish and Permits
In our study, we used Atlantic cod (Gadus morhua) individuals spanning a body mass range of 4 to 2625 g, totaling 29 specimens, as subjects for determining both their temperature preference and temperature range. The fish were ethically sourced in February 2017, through trawling and beach-seining activities conducted in Oresund, Helsingør, Denmark, under the official authorization of the Danish Agrifish Agency (permit number 12-7410-000008). Ensuring the welfare of the experimental subjects was paramount, and all procedures were meticulously aligned with the guidelines stipulated by the Danish Experimental Animal Inspectorate (2018-15-0201-01466).
Upon capture, the Atlantic cod were held and transported in large circular aerated seawater tanks to the Marine Biological Section at the University of Copenhagen, where they were acclimatized to controlled conditions. The holding environment consisted of 10 °C, 30‰ sea water, mirroring conditions representative of the natural habitat. This acclimatization phase spanned a duration of three weeks, a period during which the fish underwent careful monitoring and care. The fish were fed to satiation with chopped herring (Clupea harengus), at a frequency of three times a week. A deliberate fasting period of five to nine days preceded the experimental trials, allowing for a baseline state and minimizing potential confounding factors in the subsequent temperature preference assessments.
2.2. Experimental Setup and Procedure
The experimental set-up closely followed the methodology outlined by Bryan et al. (1990), with specific adaptations to suit the objectives of our study [
35]. To initiate the experiments, individual fish were carefully situated within a circular tank, the diameter of which varied between 90 and 150 cm, depending on the size of the fish under observation. The tank was initially filled with sea water ranging between 4 and 6 °C, and the water depth was standardized at approximately 20 cm, irrespective of whether the larger or smaller circular tank dimensions were employed.
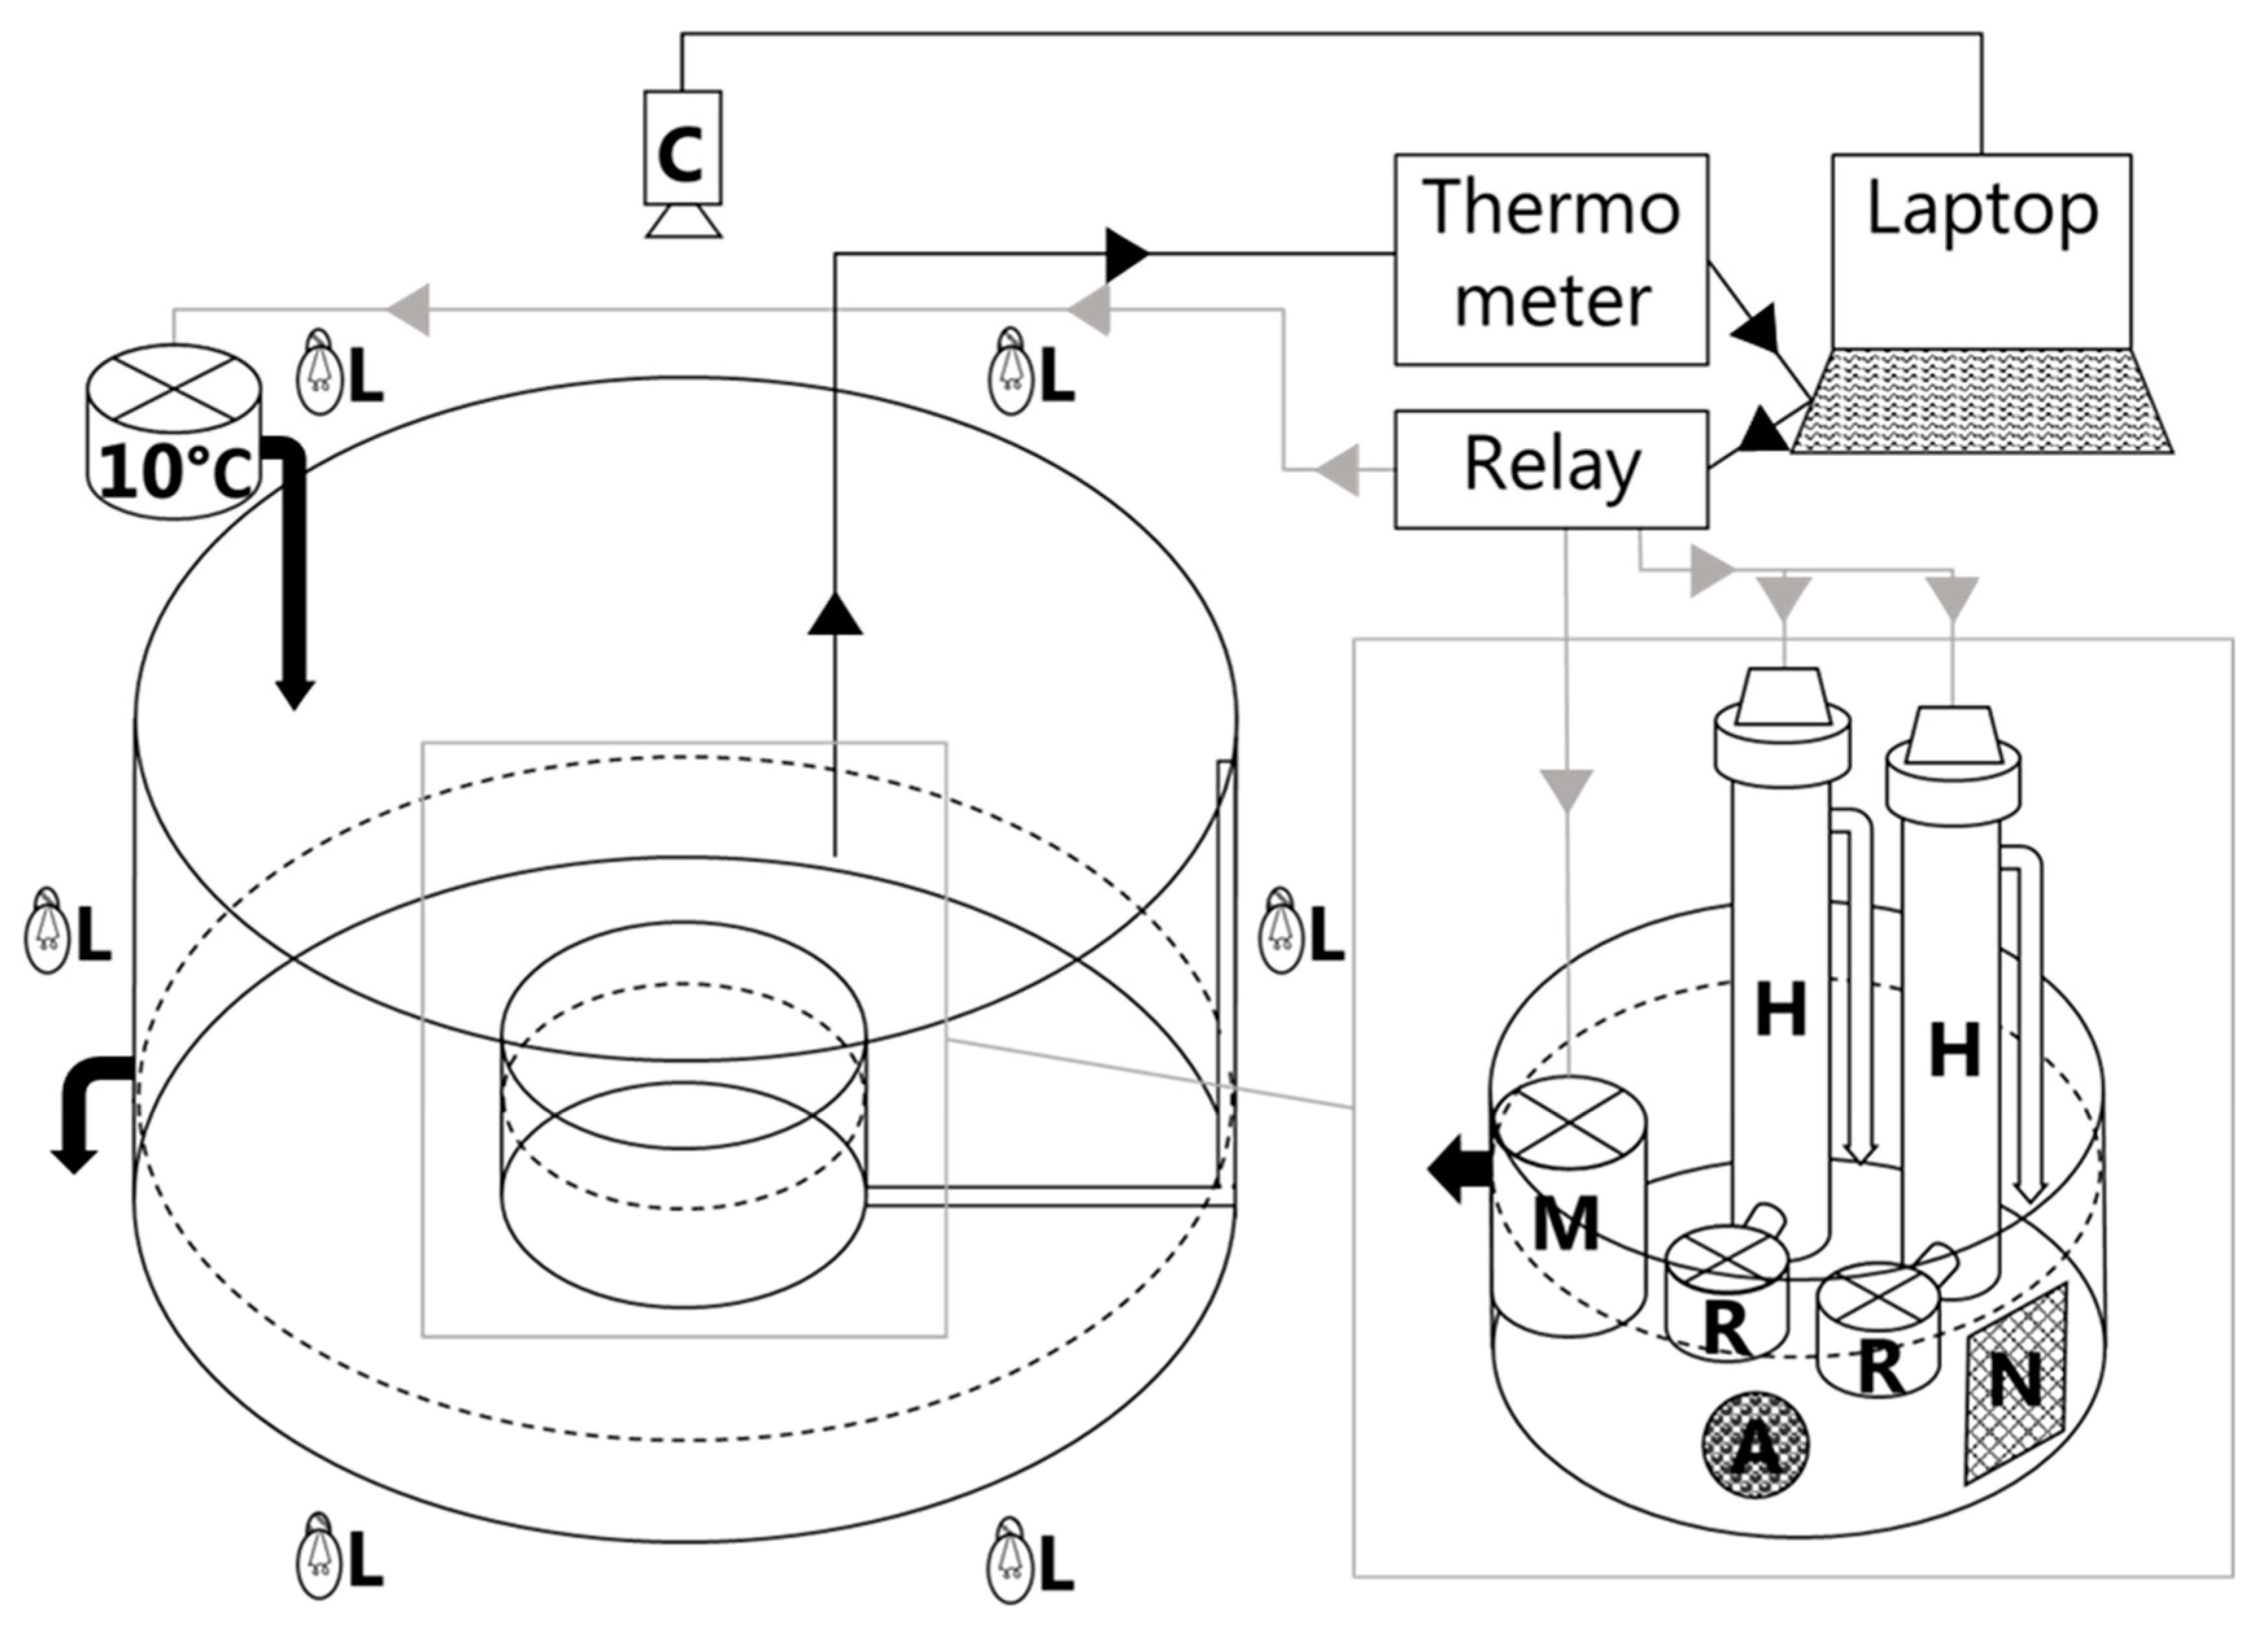
Prior to subjecting the fish to the incremental temperature increase, an acclimation period of two hours was implemented. The temperature increase was systematically executed, incrementally increasing by 2 °C (at a rate of 3.4 °C per hour), facilitated by a titanium heating unit (refer to
Figure 1 for an illustration of the experimental setup). At each pre-set temperature point, the heating unit underwent a 15 min deactivation period at which the behavior of the fish was observed. During this interval, a video camera positioned vertically above the tank recorded the fish in the tank. The camera was connected to a PC via a frame grabber and recorded at 25 frames per second, ensuring comprehensive documentation of the fish’s behavioral responses to the incremental temperature increase.
Following the completion of the experiment and reaching the final temperature treatment at 20 °C, a chilling unit was initiated. This served the purpose of lowering the temperature back to the initial starting point, closing the experimental loop. The orchestration of the various components, including the heating unit, chilling unit, thermometer, and camera, was coordinated through a PC. This not only ensured precision in temperature control but also facilitated the automated handling of video files through the utilization of Python 2.7.10. The implementation of such automated systems not only enhanced the efficiency and reliability of the experimental procedures but also contributed to the standardization of the data acquisition process, ensuring robustness in our approach.
2.3. Data Processing
The videos were analyzed in IdTracker [
36] with respect to fish X- and Y- coordinates, and the instantaneous swimming speed was calculated as a 25-frame running median of the distance covered per 25 frames, to account for tracking noise caused by pixel noise at the periphery of the target. The maximum instantaneous swimming speed (U
max in body lengths s
−1) was then calculated over each 15 min observation period following each heating phase, as a representative for the activity level of the fish under investigation.
The rate of change in the core temperature of a fish is negatively correlated with fish body mass, which was accounted for using Newton/Fourier’s law of thermal conduction, similar to Schurmann and Steffensen (1992) [
37]:
which relates body core temperature (T
b) to the ambient temperature (T
a), the initial body core temperature (T
i), and an exponential decay in the change rate of body core temperature (k) over time (t) in minutes [
37]. k is body-mass-specific according to:
where m
b is body mass in grams, and a and b are constants.
For our experiments, the smaller fish would reach a core temperature equal to the water temperature almost immediately, however, the larger fish would consistently have a lower core temperature than the water temperature with a difference between the two of up to 1.02 °C at the beginning of the 15 min observation period and 0.49 °C at the end of the 15 min period, for the largest fish at 2635 g. Furthermore, the difference between the water and core temperature would reach an equilibrium after no more than three heating and observation cycles, although, only with a difference of 0.08 °C for the start of the observation period and 0.03 °C for the end, between the first and second observation period after a temperature increase, for the largest fish. The average core temperature over the 15 min observation period, calculated using Newton’s law of cooling for all the fish regardless of size, was subsequently used to determine Tpref and Tpejus.
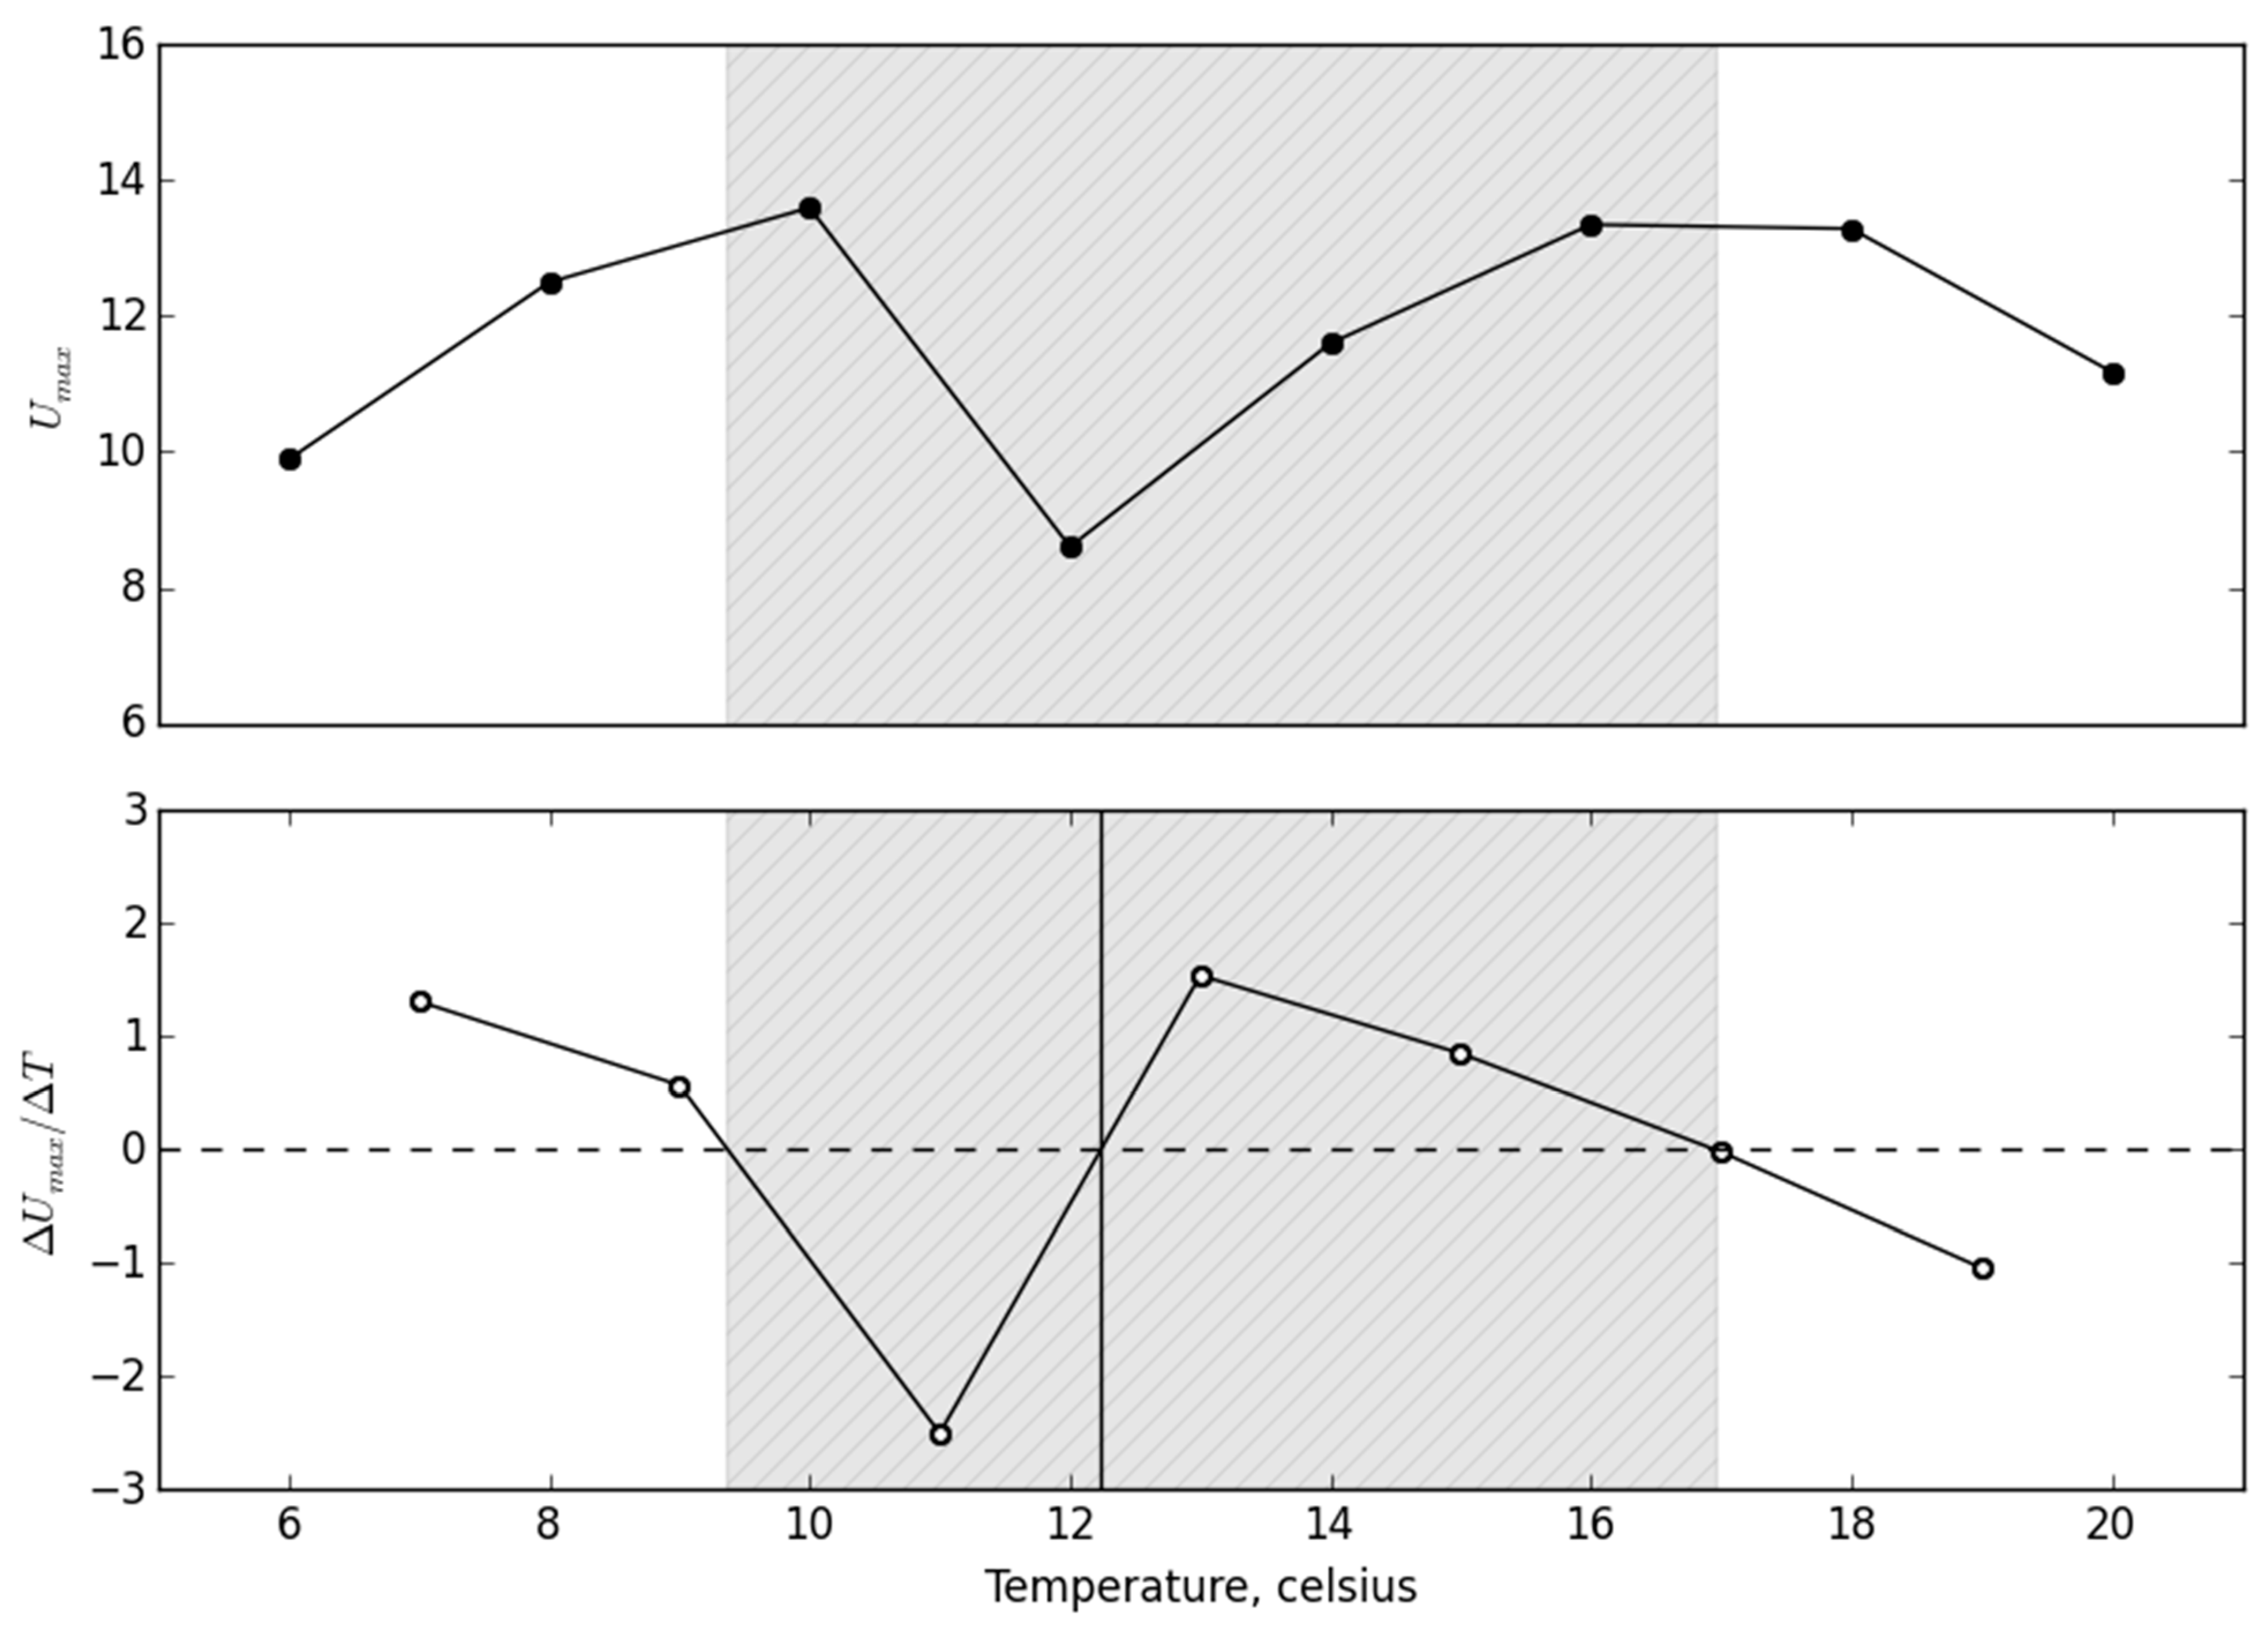
We determined T
pref as the local minima in activity along the temperature gradient (
Figure 2; [
35]). The turning points in activity before and after T
pref, that is, the two local maxima in activity along the temperature gradient, we defined as the T
pejus. To minimize the effect of temperature increment when determining T
pref and the upper and lower T
pejus from the maximum swimming speed along the temperature gradient, we calculated between each consecutive measurement temperature (
Figure 2; [
35]). The solution for the derivative was found three times along the T
b gradient using the Newton–Raphson method, where the first point determined was defined as the lower T
pejus, the second point was defined as T
pref, and the highest point was defined as upper T
pejus (see
Figure 2 for an example).
2.4. Statistics
The effect of fish body size on T
pref and T
pejus (lower and upper) was analyzed by linear regression, obtained by sum-of-squares fitting. Earlier reported temperatures, as results from studies on temperatures of optimal growth, aerobic metabolism, temperature preference studies, and in situ temperature occurrence studies were collected in a dataset (
Table 1). Student’s T-test was performed to assess whether the regression of the residuals from the results of earlier studies was significantly different from our regression. Statistical testing was completed in Python 2.7.10 using the Scipy library (function: scipy.stats.ttest_1samp) [
38].
3. Results
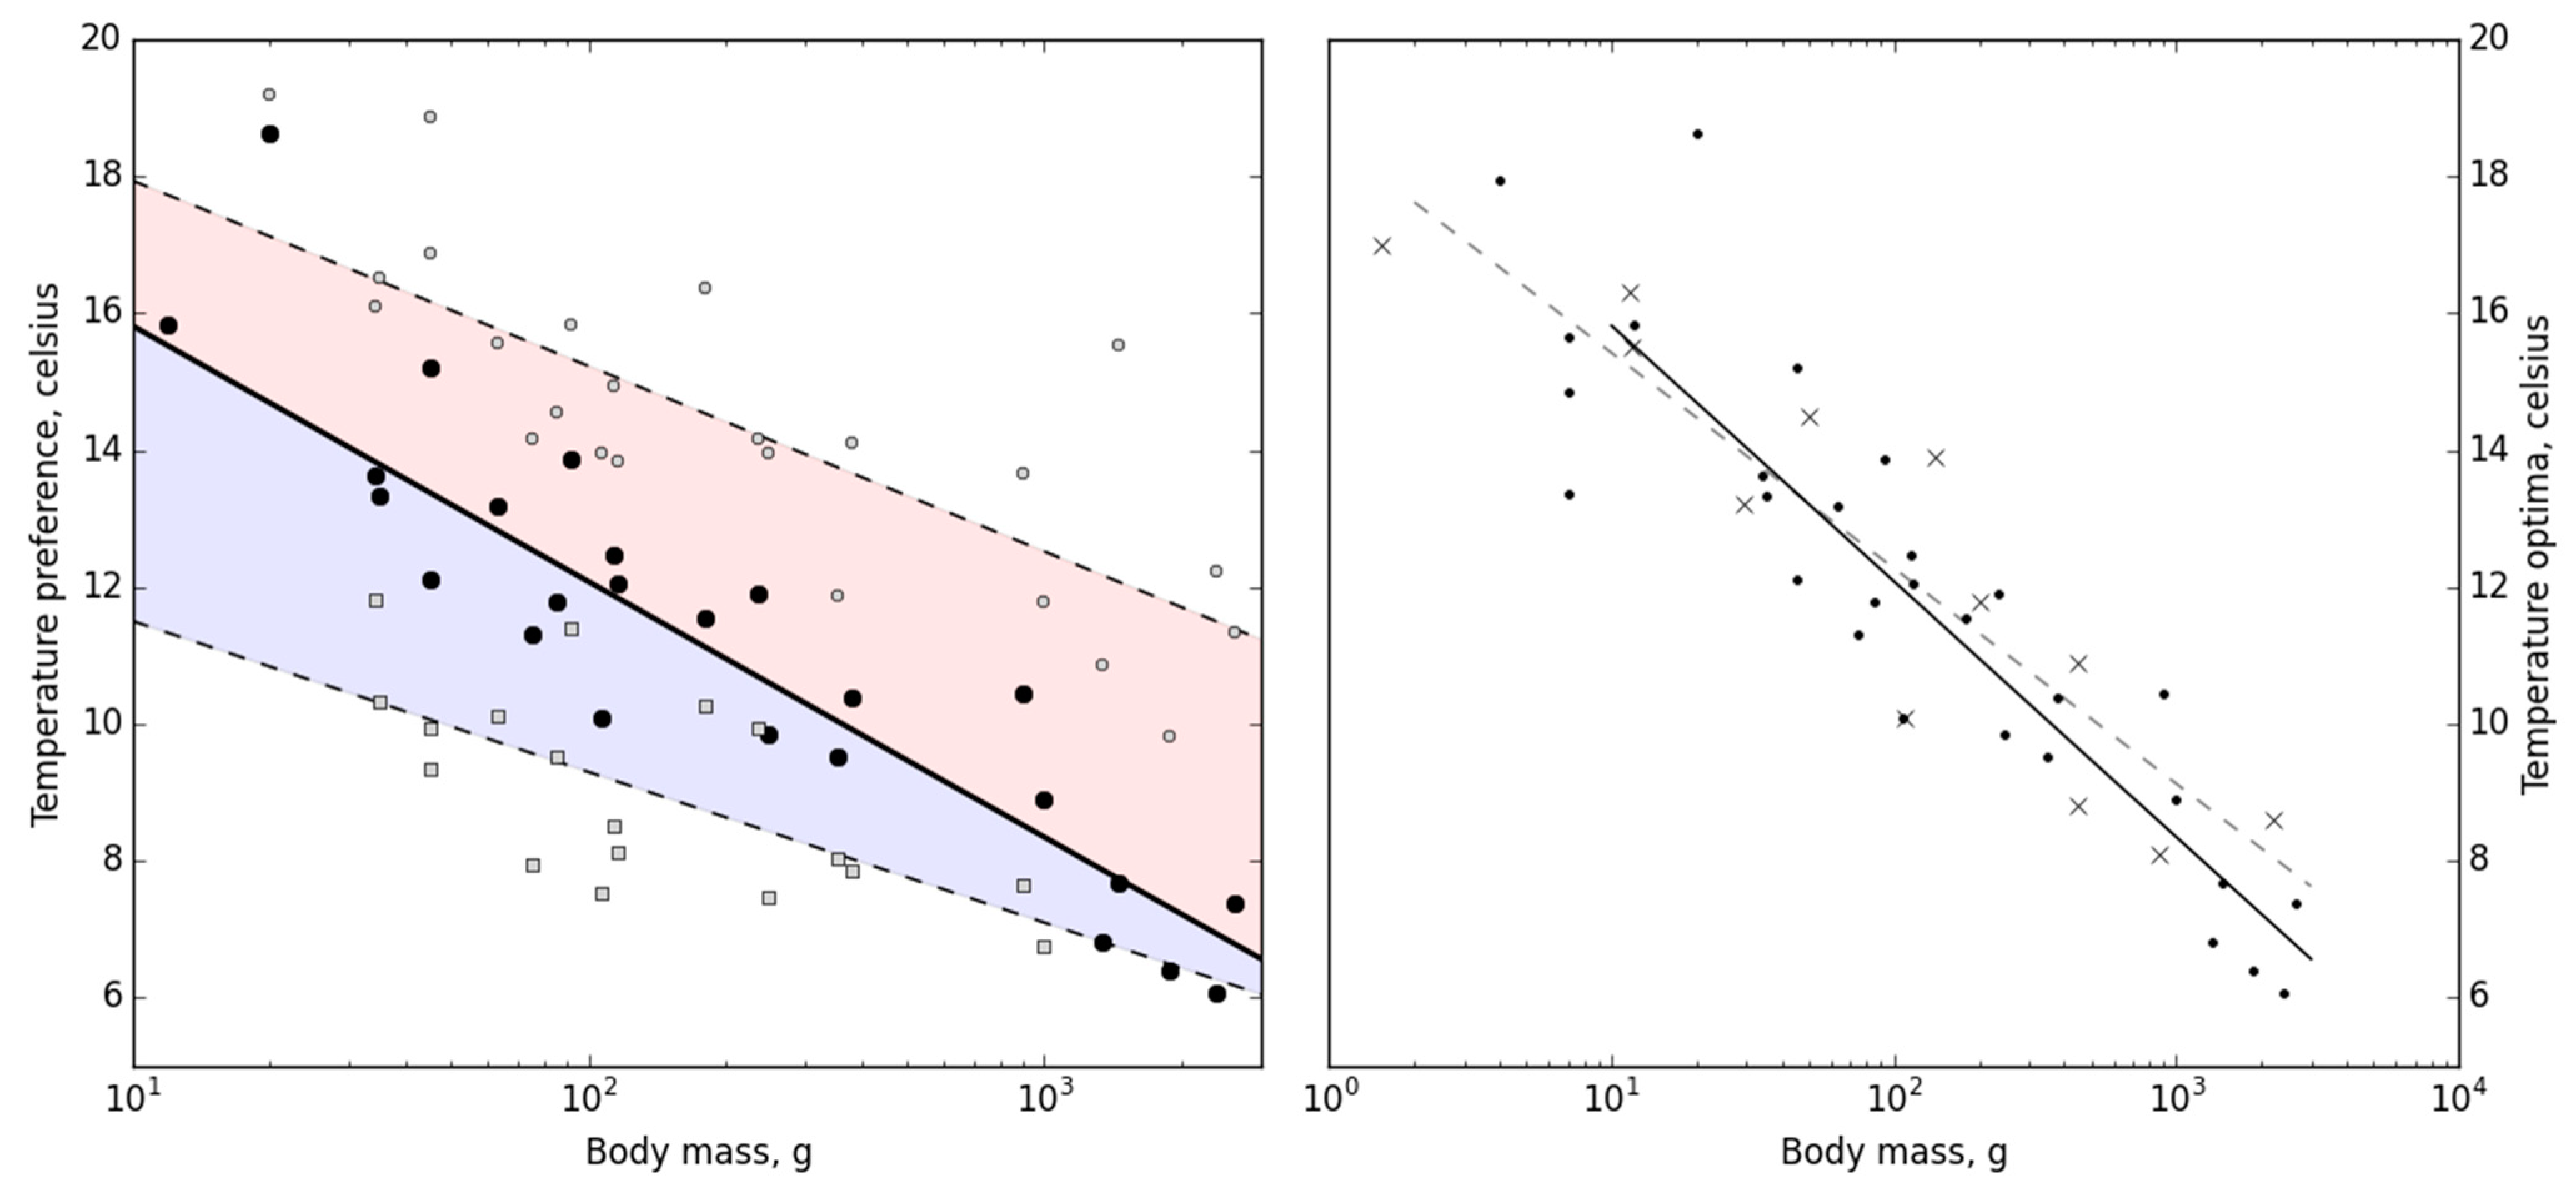
We experimentally determined the temperature preference (T
pref) of 29 Atlantic cod (
Gadus morhua) ranging from 4 g to 2625 g, and found that T
pref ranged from 6.4 °C to 18.7 °C and correlated negatively with fish body mass in a logarithmical fashion (
Figure 3; one-way ANOVA,
F(1) = 119.527,
p < 0.001). As the Atlantic cod is one of the most well-studied fish species, we were able to compare our results with earlier studies on in situ habitat temperature, optimal growth, and optimal aerobic metabolic scope temperatures, and temperature preferences of Atlantic cod (
Table 1; [
32,
33,
37,
39,
40]). In the comparison analysis, our results only deviated 1.1% on average (95 C.I.: −5.4% to 3.3%) (one-sample T-test µ = 0, T = −0.015,
p = 0.988, d.f. = 22) from the earlier studies, when taking size into account. Our results show that size-dependent temperature preference relates well to both physiological performance measures as well as in situ habitat temperature preference of Atlantic cod, thus validating the concept’s ecological importance.
Both upper and lower pejus temperatures (T
pejus) correlated negatively with fish size (one-way ANOVA,
F(1) = 58.781,
p < 0.001 and
F(1) = 11.465,
p < 0.004) (
Figure 3). The preferred thermal range for each fish, that is, the difference between upper and lower T
pejus, was on average 5.8 °C (SD: ± 1.3 °C) and was independent of body mass (one-way ANOVA,
F(1) = 1.337,
p = 0.264). Interestingly, the regression slope for both T
pejus was lower than the slope for T
pref, and consequently, the temperature span between the upper T
pejus to T
pref increased with fish size.
4. Discussion
The present study underscores the nuanced relationship between body size and thermal preference, manifesting a notable negative logarithmic correlation between the Atlantic cod’s temperature preference (T
pref) and their body mass. Intriguingly, the observed T
pref spanning 6.4 °C to 18.7 °C across various fish sizes not only aligns with but also slightly deviates from a range of prior research findings (see
Table 1), bolstering the complexity and dynamism inherent in the thermal ecology of
Gadus morhua. Moreover, the divergence in regression slopes for T
pref and T
pejus, resulting in an enlarging temperature span from upper T
pejus to T
pref with increasing fish size (
Figure 3) invites further exploration into how metabolic and physiological demands potentially scale with body size, thereby influencing thermal preferences and tolerances. Understanding the detailed mechanistic bases of these thermal preferences could hold the key to deciphering potential adaptative or maladaptive responses of Atlantic cod to future ocean warming scenarios, potentially providing crucial insights into anticipated population dynamics and distribution shifts.
In the wake of global-warming-induced reductions in ectothermic fish body size, the complex mechanisms driving this phenomenon continue to be a focal point of scientific inquiry [
1,
4,
5,
6,
7]. Our study, using the Atlantic cod (
Gadus morhua) as a model organism, investigates the behavioral size-dependent temperature preference in the context of climate change. The unearthing of a significant negative correlation between temperature preference and fish size aligns with in situ habitat temperatures and optimal physiological performance metrics reported in prior studies. This correlation suggests that larger fish, by exhibiting a behavioral preference for colder areas, may undergo shifts in distribution toward polar regions or deeper waters in response to localized global warming. In essence, our findings contribute valuable insights that enhance predictions of species distribution shifts, highlighting the pivotal role of behavioral size-dependent temperature preference in shaping fish populations and offering essential considerations for conservation efforts.
Our results show considerable overlap between the behavioral size-dependent temperature preference exhibited by Atlantic cod and their in situ habitat temperature preferences. This fits well with broad-scale findings of ecological surveys, which only observe juvenile Atlantic cod in shallow coastal areas during the warm months of the year, whereas adult individuals are found in deep colder adjacent waters [
31]. Shallow coastal areas are in general highly productive areas, and accordingly hold a high food availability [
41] yet also experience higher temperature variations compared to more temperature-stable and often cooler, deep waters [
42]. The occurrence of larger cod in deeper waters during warm months may be a compromise to food availability to meet a lower temperature preference that is more optimal for their metabolic capacity and growth. This underscores the ecological significance of size-dependent temperature preference, suggesting that the observed “shrinking” of local populations due to global warming [
1,
3] may be a direct result of behavioral size-dependent temperature preference, where larger fish prefer and hence move to colder areas at higher latitudes or deeper water due to the optimization of fitness-related activities.
Furthermore, our study not only establishes a robust correlation between size-dependent temperature preferences and the temperatures conducive to optimal physiological performance in Atlantic cod but also sheds light on the intricate dynamics of thermal habitat selection in relation to body mass. This newfound correlation deepens our comprehension of how Atlantic cod navigates and makes choices within thermal environments based on their size-dependent temperature preferences. The observed correlation implies that the temperature gradient plays a pivotal role in shaping the composition of the fish community according to their behavioral thermal preferences. Fish appear to select habitats with temperatures that align with their physiological performance optima, suggesting a strategic behavioral adaptation to maximize their fitness. In contrast to the notion that temperatures directly curtail growth and physiological parameters, our findings propose that fish size communities are influenced by the fish’s proactive behavioral response to temperature, optimizing their physiological capabilities and growth potential within specific thermal habitats. This nuanced perspective challenges conventional wisdom and underscores the significance of behavioral size-dependent temperature preference as a key determinant along size physiological temperature optima in fish population dynamics.
In the wild, fish, including the Atlantic cod, usually occupy a range of temperatures [
39,
42]. Although our study indicates that the preferred temperature range of Atlantic cod is independent of fish size, a nuanced pattern emerged. We found that small fish preferred temperatures closer to their upper T
pejus, while large fish had a lower T
pref that was markedly lower than their upper T
pejus and closer to their lower T
pejus. Temperatures above the upper T
pejus are associated with mortality and cell damage [
18], and larger fish thus seem to employ a larger behavioral thermal safety margin [
23]. This newfound revelation sheds light on the disproportionate relationship between body size and thermal safety margins in fish, a novel aspect that, to the best of our knowledge, our study is the first to explore. Larger fish, by opting for considerably lower temperatures and maintaining a noticeable distance from their preferred temperature and their upper thermal limits, subsequently contribute to the variations noted within species regarding temperature preferences. The implications of this finding extend to the understanding of how larger fish, with a higher upper thermal safety margin, tend to actively seek out lower temperatures, contributing to the observed disparity in temperature preferences. The implications of these findings, revealing a relationship between size and thermal preference, stand to significantly inform our understanding of thermal ecology and could be pivotal in forecasting the adaptive behaviors of fish in response to climatic alterations.
5. Conclusions
In conclusion, our study on the Atlantic cod reveals a significant negative correlation between body size and temperature preference, shedding light on the mechanisms driving the reduction in ectothermic fish body size in the context of global warming. This size-dependent temperature preference aligns with both habitat temperature patterns and physiological performance metrics, emphasizing its ecological relevance. It also underscores the potential for this trait to enhance our ability to predict species distribution shifts in the face of climate change, offering a valuable tool for conservation efforts.
Our study uncovers a substantial correlation between size-dependent temperature preferences and temperatures that promote optimal physiological performance in Atlantic cod. This correlation provides valuable insights into the intricate interplay between fish size and thermal habitat selection, enhancing our understanding of how Atlantic cod navigates thermal environments based on their behavioral preferences. Our findings highlight the significance of temperature gradients in shaping fish communities, where fish actively choose habitats aligned with their physiological performance optima, thus optimizing their fitness. Contrary to the notion of temperature-driven growth limitations, our results suggest that the proactive behavioral response to temperature is a pivotal factor influencing fish size communities, emphasizing the importance of behavioral size-dependent temperature preference in shaping fish population dynamics.
Furthermore, our research highlights the concept of thermal safety margins in fish behavior, as larger fish exhibit a notable preference for temperatures significantly below their upper thermal limits. This finding opens new avenues for exploring the intricate relationship between body size and thermal regulation in fish species. Altogether, our study underscores the critical role of size-dependent temperature preference in shaping the responses of fish populations to climate change and provides insights essential for effective conservation and management strategies.


 ,
, 


