Article

Efficiency Analysis of China Deep-Sea Cage Aquaculture Based on the SBM–Malmquist Model

1
School of Management, Ocean University of China, Qingdao 266100, China
2
Institute of Marine Development, Ocean University of China, Qingdao 266100, China
*
Author to whom correspondence should be addressed.
Fishes 2023, 8(10), 529; https://doi.org/10.3390/fishes8100529
Submission received: 6 September 2023 / Revised: 15 October 2023 / Accepted: 21 October 2023 / Published: 23 October 2023
(This article belongs to the Special Issue Aquaculture Economics and Fisheries Management II)

Abstract

:
Deep-sea cage aquaculture (DSCA) is an important way to expand new space for marine aquaculture, promote the transformation and upgrade of the fishery industry, and optimize the structure of marine aquaculture. Using the panel data of DSCA in China’s coastal areas from 2013 to 2021, this study constructs the SBM–Malmquist model to measure the DSCA production efficiency and analyzes its total factor productivity. The results show that the overall DSCA production efficiency exhibited an increasing trend in spite of a sharp decline in 2019. The efficiency exhibited regional differences, being the strongest in the Bohai Sea region, followed by in the Yellow Sea, the South China Sea, and the East China Sea regions. The overall total factor productivity remained generally stable, although a large fluctuation occurred between 2019 and 2021. Both pure technological efficiency and scale efficiency promoted the total factor productivity in 2019–2021, while the efficiency of technological changes in societal aspects declined. This study shows that the DSCA production efficiency is significantly influenced by input factors such as labor and capital investment. In addition, natural disasters inhibit the improvement of the production efficiency to some extent.
Key Contribution: An increasing trend of the DCSA production efficiency in China is observed and can be attributed to input factors such as labor and capital. Notably, total factor productivity remains consistent, bolstered by pure technological and scale efficiencies, yet is offset by technological shifts.

1. Introduction

Deep-sea aquaculture (DSA) is one of the important means to move aquaculture outside traditional boundaries, which can mitigate the pressure on shallow-water aquaculture, improve the marine ecological environment, and promote the sustainable development of marine aquaculture in the new era. With these advantages, DSA has become a major point of interest to both government and marine fishery researchers [1,2].
Developed countries have conducted extensive research and practices on DSA, with the United States being the first to start in the 1980s. In 1995, the US Federal Office of Technology Assessment stated that “offshore aquaculture” is a potentially effective method for increasing fishery production [3]. In addition, other countries with developed fisheries, including Norway, Japan, and Sweden, etc., have also been exploring [1].
The significance of DSA for oceanic economic development has been recently acknowledged by Chinese researchers. Studies have pointed out that developing and utilizing DSA is becoming urgent due to the increasing scarcity of oceanic resources [4,5]. An example of the Yellow Sea Cold Water Mass being used for DSA specifically demonstrates this practice [6]. The significance of deep-sea industries and offshore economies for fishery development has also been emphasized by some studies [7,8,9]. It has been argued that expanding new space for seawater aquaculture is essential for improving China’s nearshore ecological environment, ensuring food safety, and effectively utilizing oceanic resources [10].
However, challenges in this field remain outstanding. Despite China’s increased investment in technology, the utilization rate of deep-sea fisheries is still not high enough [11]. The development of China’s deep-sea fishery is constrained by multiple factors, such as industry experience and infrastructure, as well as long-term strategies [5,12,13]. A further study showed that DSA is facing several challenges, including high natural risks, weak technical systems, limited remote management experience, and a subpar level of industrialization [14].
To improve the efficiency of DSA, it is of utmost importance to measure its current production efficiency and total factor productivity. Analyses so far for the DSA efficiency can be generally classified into two categories: (1) the measurement of the efficiency of the entire deep-sea fishery industry, such as in the study by Kim et al. [15], which measured the efficiency of multi-input and -output deep-sea fishery in Korea; and (2) the measurement of the economic efficiency of specific varieties. Examples of the latter category include a study by Hassanpour et al. [16], which measured the total factor productivity (TFP) growth of rainbow trout production in Iran and found that changes in technical efficiency were the only source of growth, and a study by Vassdal et al. [17], which measured the changes in total factor productivity for Norwegian Atlantic salmon from 2001 to 2008 and concluded that the technological level of the Atlantic salmon industry has plateaued [16,17]. Additionally, Kiet et al. [18] investigated the efficiency of the extensive, intensive, and semi-intensive models of prawn cultivation in the Mekong Delta and found that the extensive model is more efficient than the intensive and semi-intensive models [18].
The DSA efficiencies in China are currently less evaluated, and most of the existing literature is based on seawater aquaculture. There have been some studies which calculated the efficiency of seawater aquaculture in Chinese coastal provinces over different periods and concluded that there is still significant room for improvement in efficiency among different sea areas. Among the coastal provinces, Shandong, Guangdong, and Fujian have relatively higher comprehensive efficiency levels [19,20,21].
In terms of the total factor productivity analysis, the conclusions become less consistent. It was found that the overall total factor productivity has improved, with technical progress as the main influencing factor [22]. In the study conducted by Zhang and Ji [23], the SBM-GML (Slack-Based Measure–Global Malmquist–Luenberger) model was employed to gauge the comprehensive productivity of various elements between 2008 and 2017. Notably, an innovative approach was adopted to dissect the productivity into four distinct dimensions, namely, pure technical efficiency, scale technical efficiency, pure technical change, and scale technical change. The investigation yielded a noteworthy finding wherein the overall total factor productivity experienced an upward trend, primarily attributable to advancements in pure technical change. On the other hand, Zhang et al. [24] measured the data from 2006 to 2012 and found that the total factor productivity had generally declined. The different conclusions can be attributed to a variety of reasons including the period of measurement, selection and calculation methods of indicators, etc.
In addition to the above-mentioned economic significance of DSA, another advantage that DSA can have is that it avoids areas with high residence times such as fjord systems. High residence times increase the effect of intense harmful algal blooms, such as those that recently occurred in Chile [25] and Norway [26], with severe impacts on salmon farming. DSA could help reduce the impacts generated by HABs.
As one of the most important means of DSA, deep-sea cage aquaculture (DSCA) is emerging as an investment direction. China’s “14th Five-Year Plan for National Fishery Development” emphasizes the need to encourage the development of facility-based DSA and large-scale smart DSA fisheries [27]. However, this emerging form of aquaculture also poses many challenges. Firstly, the DSCA in China is a new frontier and calls for development of advanced technologies and equipment. Furthermore, due to geographical restrictions, DCSA depends on large-scale automated deep-sea net cages, which can lead to high costs. With limited financial resources, it is essential to investigate factors that affect the production efficiency of the DSCA in China to attain the maximum potential.
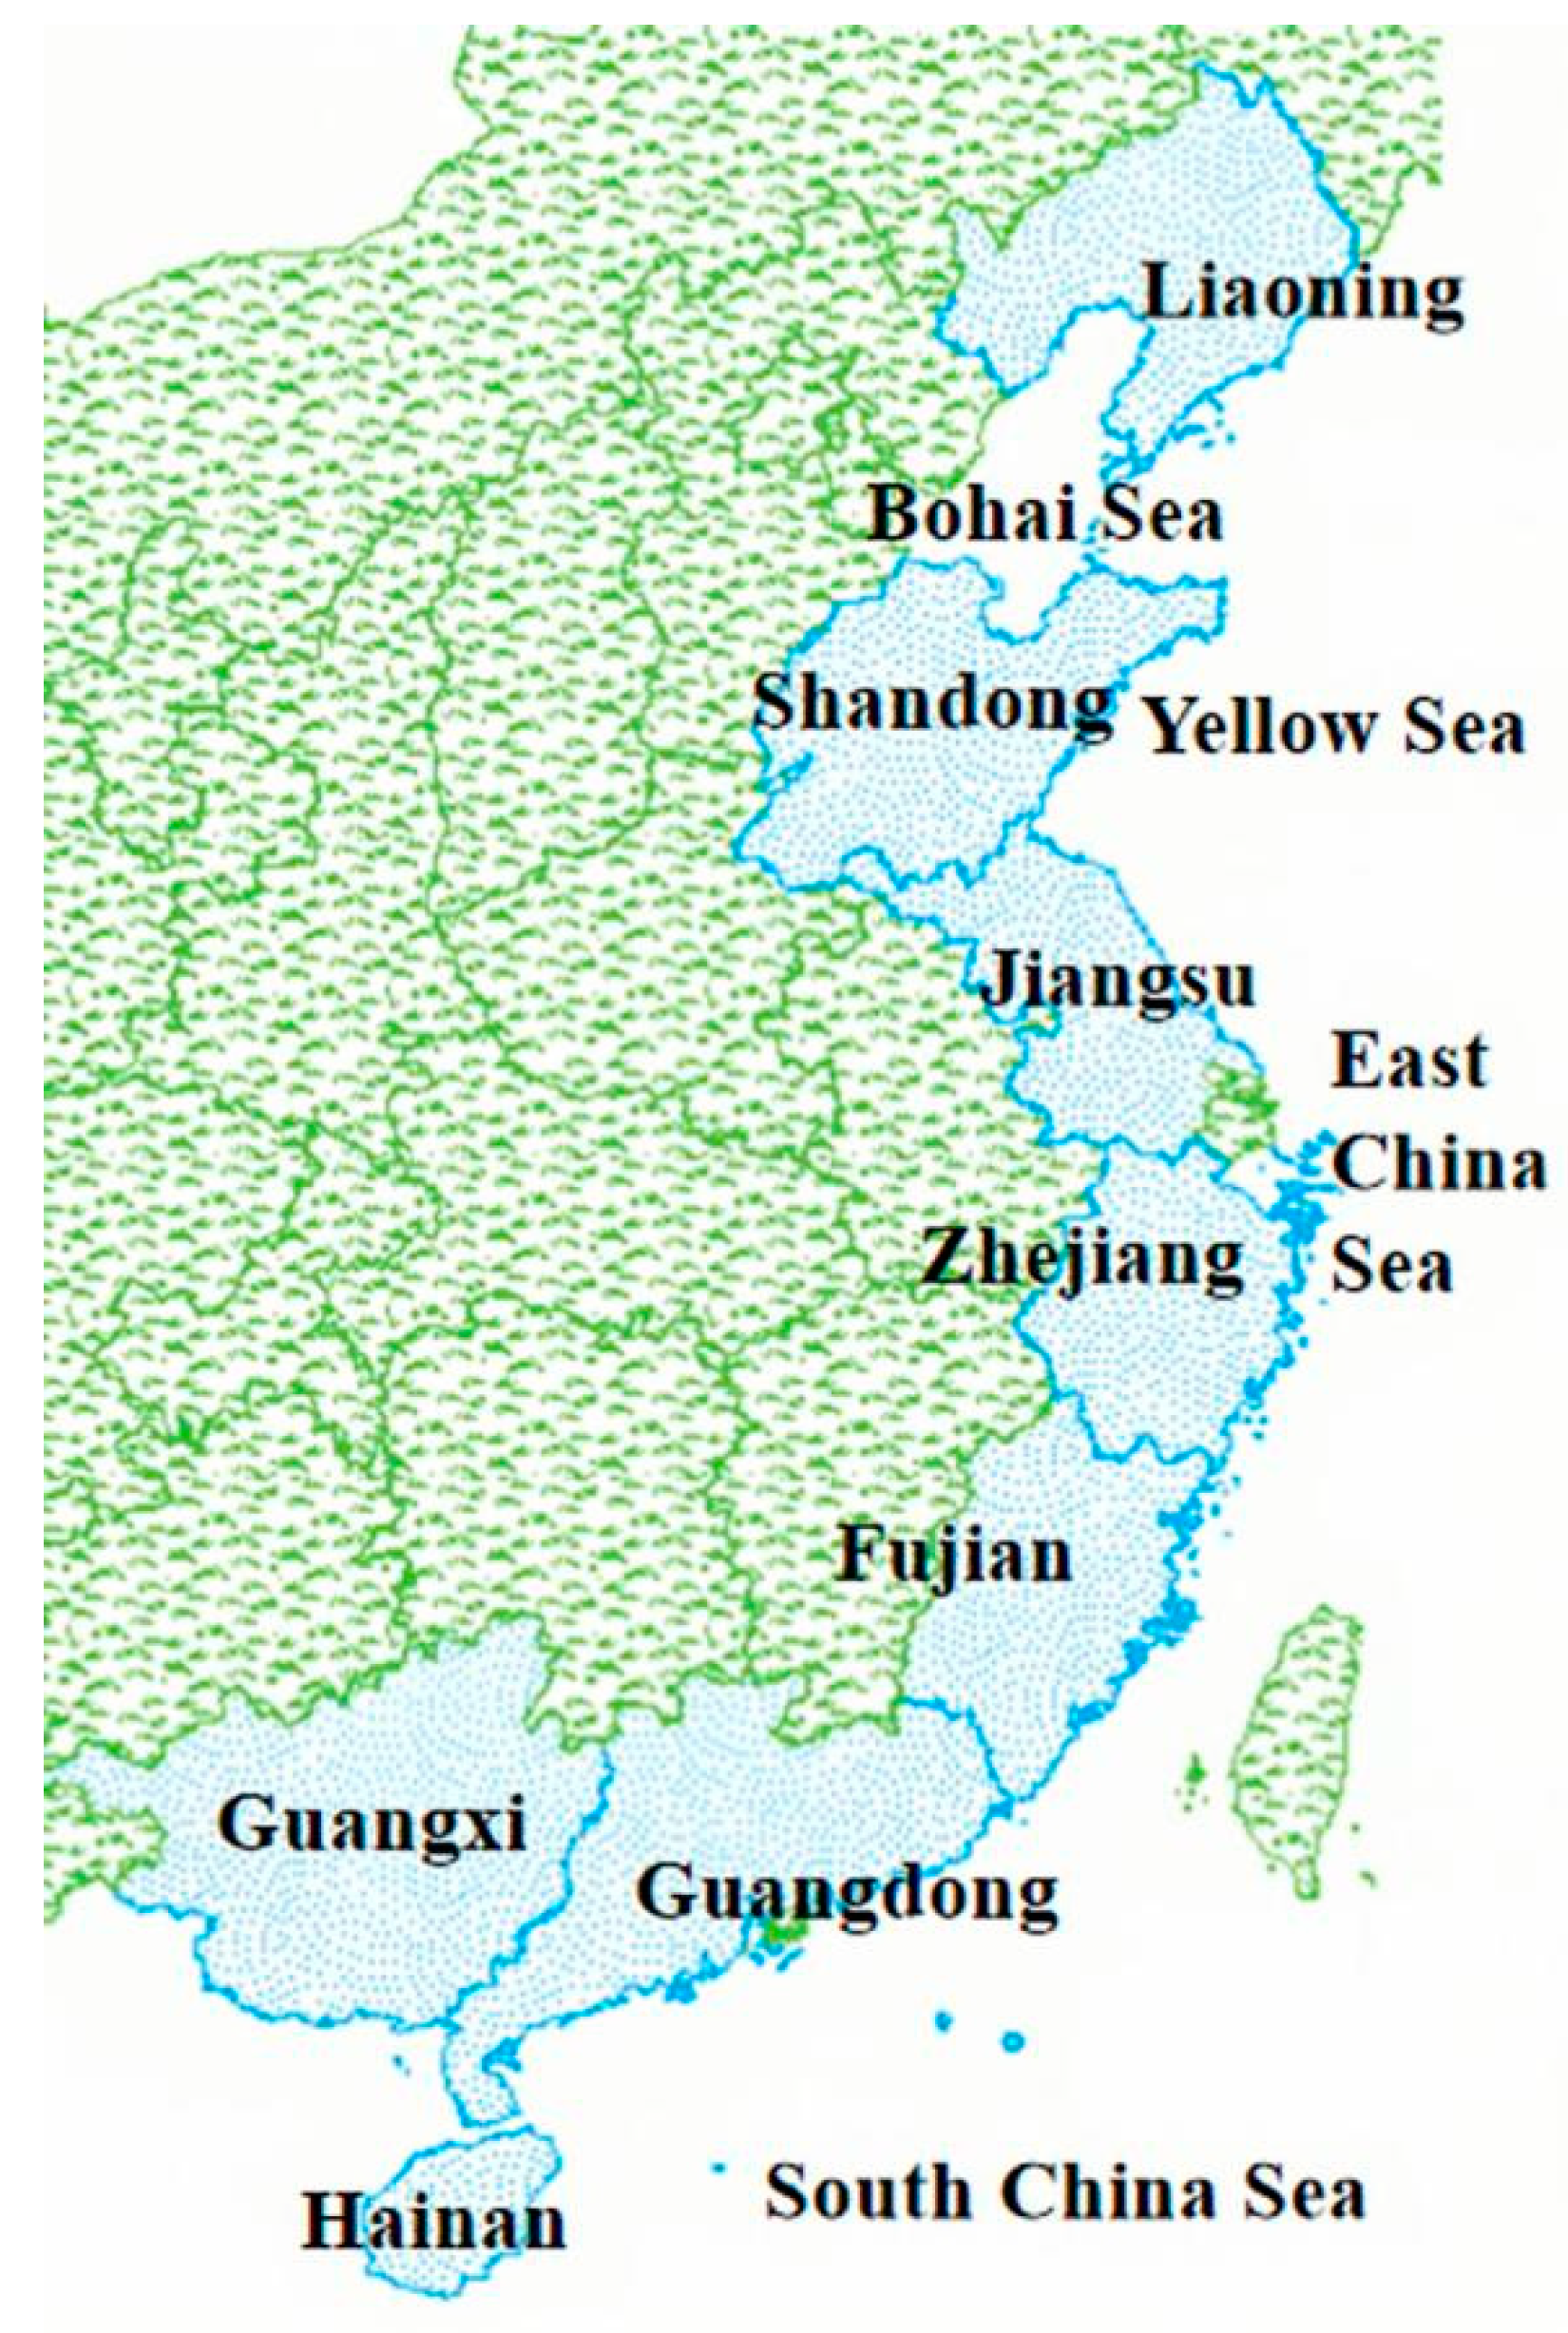
Given the rapid development of DCSA and the relatively deficient utilization rates and insufficient relevant industry expertise in China, there is a clear need to measure the current economic efficiencies of DCSA in China. This study aims to quantify the production efficiency and the total factor productivity of DSCA based on the panel data from the input–output analyses of DSCA in Chinese coastal provinces from 2013 to 2021. The study shall shed light on the future development of DSCA.

2. Materials and Methods

2.1. Materials

The input–output indicator system for DSCA in China’s coastal provinces consists of:
(1) Input indicators: These are categorized into three aspects—labor, capital, and land. Typically, the stock of human capital is used to measure labor input, and, in this study, the number of employees engaged in DSCA is used. The capital input is indicated by the registered capital (in RMB) of DSCA enterprises. To obtain these values, data on registered capital and the number of insured personnel were accumulated annually for 65 relevant enterprises engaged in DSCA. Land input is measured by the volume of the deep-water net cages (in cubic meters). The gravity-based polyethylene cages, floating rope cages, and butterfly cages used in DSCA have a volume of several hundred cubic meters and operate in water depths of more than 20 m;
(2) Output indicators: These are split into output volume and value. Due to price factors and differences in the base period, output values may be biased. Therefore, this study uses the output volume (in tons) of DSCA in each provincial area as the output indicator.
The research is focused on eight coastal provinces in China: Liaoning, Shandong, Jiangsu, Zhejiang, Fujian, Guangdong, Guangxi, and Hainan. The geographical location of the study area is shown in Figure 1. The marine environments of different provinces vary, and these differences ultimately affect the results and yields of aquaculture. Specifically, Liaoning and Shandong are located on the rim of the Bohai and Yellow Sea with the marine aquaculture environment being affected by the relatively cold Yellow Sea Cold Water Mass. Zhejiang and Jiangsu are close to the East China Sea, with the marine aquaculture environment being affected by the river discharge, the warm Kuroshio Current, and others. Fujian, Guangdong, Guangxi, and Hainan are closer to the tropics, more suitable for cultivating species better adapted to warmer waters. Both storms and monsoons have significant impacts on these regions, especially for DSCA. The breeding species in these regions mainly include flounders, sea bass, grouper, rainbow trout, yellow croaker, puffer fish, and other varieties. In this paper, we measure the economic efficiency of the entire DCSA industry throughout each region rather than specific varieties cultivated.
The timeframe to be analyzed for the DCSA in this paper spans from the year 2013 to 2021. DCSA, as an emerging sector, has developed rapidly over the past decade with innovation of the DCSA technologies. Before that, the DCSA scale was small, and the data are not representative for analysis here. We collect data from the Chinese National Enterprise Credit Information Publicity System and the China Fishery Statistical Yearbook (China Agricultural Publishing House, 2014–2022) [28,29,30,31,32,33,34,35,36]. For Jiangsu Province, some data are missing, so multiple imputations are performed using SPSS 27.0, and the group with the highest Cronbach’s alpha coefficient is selected to complete the data. Table 1 and Table 2 summarize the specific indicators and descriptive statistics.

2.2. Methods

2.2.1. The SBM-DEA Model

The Data Envelopment Analysis (DEA) is a classic efficiency measurement method that builds a mathematical model using linear programming to find the optimal linear programming point in economic terms. The data envelopment frontier reflects the efficiency frontier and the production possibility set and calculates the relative efficiency of each decision-making unit [37]. Due to its advantages—considering multiple inputs and outputs and being unaffected by input–output dimensions—the DEA has been widely used in non-parametric efficiency and total factor productivity analysis [38].
The slack-based measure (SBM) model is a non-radial model based on slack variables. This model was first proposed by Tone [39]. The SBM differs from the traditional DEA models in that slack variables are directly incorporated into the objective function, making efficiency measurement and improvement measures more accurate and more practical. An output-oriented SBM model can maximize output under given input conditions, making it suitable for the DSCA industry. Assuming that there are n decision-making units (DMUs), where DMUj (j = 1, 2,…, n) represents a unit, p inputs and q outputs are selected for each unit, with rij representing the j-th decision-making unit’s input in the i-th factor and mtj representing its output in the t-th factor. Therefore, the input and output vectors are distinguished by their respective values:
r j = ( r 1 j , r 2 j , , r p j ) T , j = 1 , , n
m j = ( m 1 j , m 2 j , , m q j ) T , j = 1 , , n
Thus, we can obtain the output-oriented SBM model:
θ = max λ , s , s + 1 1 + 1 q t = 1 q s t + s t o
  s . t .   { r i 0 = j = 1 n λ j r i j + s i ( i = 1 , 2 , , p ) ; m t 0 = j = 1 n λ j m t j s t + ( t = 1 , 2 , , q ) ; λ j 0 ( j ) , s i 0 ( i ) , s t + 0 ( t )
The slack variables for inputs are denoted as s i   ( i = 1 , , p ) , representing excessive input, while the slack variables for outputs are denoted as s t +   ( t = 1 , 2 , , q ) , indicating output shortfall.

2.2.2. The Malmquist Index Model

Production efficiency measures the relationship between input and output. However, output can still vary even when all inputs remain constant. The profits or losses from this part that are not caused by input factors are referred to as TFP. Solow [40] first introduced this concept and showed that the TFP growth is the result of output growth caused by all factors except for input, including improvements in technology, technical efficiency, and other aspects. The Malmquist Index is a classical method for calculating TFP which was developed based on the DEA and first proposed by Malmquist [41]. It has since been widely used by Caves et al. [42]. In this paper, following Caves et al. [42], we define TFP as the average value for output-oriented TFP research.
Assuming constant returns to scale, the Malmquist Index for period t is:
M 0 t ( r t + 1 , m t + 1 , r t , m t ) = d 0 t ( r t + 1 , m t + 1 ) / d 0 t ( r t , m t )
Similarly, the Malmquist Index for period t + 1 is:
M 0 t + 1 ( r t + 1 , m t + 1 , r t , m t ) = d 0 t + 1 ( r t + 1 , m t + 1 ) / d 0 t + 1 ( r t , m t )
where ( r t + 1 , m t + 1 )     and   ( r t , m t ) represent the input and output vectors for periods t + 1 and t, respectively, while d 0 t + 1   and   d 0 t are the corresponding distance functions based on the technological frontier of the respective periods. Therefore, the change in TFP between period t and t + 1 is as follows:
Δ T F P = M 0 ( r t + 1 , m t + 1 , r t , m t ) = d 0 t ( r t + 1 , m t + 1 ) d 0 t ( r t , m t ) × d 0 t + 1 ( r t + 1 , m t + 1 ) d 0 t + 1 ( r t , m t ) = d 0 t + 1 ( r t + 1 , m t + 1 ) d t ( r t , m t ) × d 0 t ( r t + 1 , m t + 1 ) d 0 t + 1 ( r t + 1 , m t + 1 ) × d 0 t ( r t , m t ) d 0 t + 1 ( r t , m t ) = Δ EFF × Δ TE
The efficiency change (ΔEFF) represents the catching-up effect of the DMU’s technological progress through imitation and efficient resource utilization. The technical change (ΔTE) represents the progress of the DMU’s efficiency driven by advances in technology in societal or entire-industry contexts.
After considering the concept of returns to scale, ΔEFF can be further analyzed in terms of pure efficiency change (ΔPE) and scale efficiency change (ΔSE). In particular, ΔPE, similar to ΔEFF, represents the catching-up effect of the DMU’s (decision-making unit’s) technological progress under variable returns to scale, and sech reveals the degree of deviation between the actual scale of production and the optimal scale, which indicates whether the current level of production is optimal or not:
Δ E F F = d 0 t + 1 ( r t + 1 , m t + 1 C ) / d 0 t + 1 ( r t + 1 , m t + 1 V ) d 0 t ( r t , m t C ) / d 0 t ( r t , m t V ) × D i t + 1 ( x t + 1 , y t + 1 V ) D i t ( x t , y t V ) = Δ P E × Δ S E
Therefore, ΔTFP can be represented as:
Δ T F P = Δ E F F × Δ T E = Δ P E × Δ S E × Δ T E
This suggests that when ΔTFP is greater than 1, ΔTFP increases, whereas it being less than 1 indicates a decrease in ΔTFP. Similarly, ΔEFF, ΔTE, ΔPE, and ΔSE are each considered improved if they exceed 1. These values respectively suggest an increase in technical efficiency under constant returns to scale, a progression in the efficiency, an improvement in pure technical efficiency under variable returns to scale, and the production scale moving closer to the optimal point. Conversely, if these values are less than 1, it indicates a decline in their respective beneficial effects.

3. Results

3.1. Calculation of DCSA Production Efficiency in China

This study uses panel data from 2013 to 2021 on DSCA in China. The MaxDEA 1.87 software and DEA-SBM model are used to calculate the production efficiency of DSCA in eight coastal provinces of China, representing four coastal sea regions: the Bohai Sea, Yellow Sea, East China Sea, and South China Sea regions. A line graph (Figure 2) and table (Table 3) are created to display the production efficiency of China’s DSCA industry in each sea region.

3.1.1. Time-Varying Characteristics

As shown in Figure 2, the DSCA production efficiency decreased in 2014 compared to in 2013, which is likely attributable to the high input of deep-water cage aquaculture volumes. However, from 2014 to 2018, the production efficiency increased, indicating a gradual improvement in the DSCA level with China’s growing marine innovation capabilities. In 2019, the efficiency reached its lowest value of 0.674, particularly in the South China Sea region, as shown in Table 2. This can be attributed to frequent natural disasters such as typhoons and storm surges, which have posed challenges for DSCA in recent years. For example, the tropical storms “Mun” and “Wipha” significantly impacted the Guangdong, Guangxi, and Hainan provinces in 2019. Additionally, the gradual deployment of large-scale DSCA platforms such as the LingShui DSCA platform in Hainan contributed to a rapid increase in factors of production. However, DSCA is characterized by lag periods, where fries are released in the current year can only be caught in the following year or beyond, creating an imbalance in input and output ratios. The significant increase in efficiency values in 2020 confirms this point.
Next, we will analyze the production efficiency of each sea region (Table 3). The Bohai Sea region displayed the best performance, with an SBM efficiency value reaching the optimal levels. This indicates that the development of the DSCA in Liaoning Province is well aligned with the industry’s input and output scale, in part due to strong government support for the DSCA. For example, in Dalian, the Marine Development Bureau fully considers the long construction cycle and high cost of the DSCA projects, aiming to optimize policies and reduce expenses. In addition to the central financial subsidies, they provide an additional 10–30% of funding to enterprises to encourage them to commence projects in advance.
The Yellow Sea region also displayed good efficiency, with an average value of 0.935. Shandong, being a major DSCA province, boasts a strong industry foundation with flourishing fishing cities such as Qingdao and Weihai, etc. In addition, the construction of large-scale deep-sea cages such as the “Deep Blue 1” and “Long Whale 1” contributes to higher breeding efficiency. However, the efficiency decline in 2019 is connected to the aforementioned deployment of large-scale DSCA platforms.
After the Bohai and Yellow Sea regions, the South China Sea region ranks third in terms of efficiency. The lowest value was also recorded in 2019, likely due to the impact of natural disasters along the southeastern coast, particularly in Guangxi. Specifically, Guangxi’s economic development level is not particularly elevated compared to that of other coastal provinces (Figure 3), resulting in insufficient investment in the DSCA. From 2014 to 2018, the efficiency gradually improved, but there was a decline in 2019 due to frequent natural disasters in the South China Sea, such as storm surges and tropical cyclones, which hampered the DSA development. In 2019, Guangxi’s efficiency value was 0.323, which was affected by tropical storms “Mun” and “Wipha”.
The East China Sea region ranks the lowest in efficiency, with an average value of 0.777, but the efficiency gap is significant among the three provinces. Fujian and Jiangsu have reached a frontier level of efficiency, with an SBM efficiency value reaching the optimal levels. In comparison with other fishing provinces such as Guangdong and Shandong, Fujian and Jiangsu have a higher production output level despite a less outstanding breeding scale. It implies that the development model and direction are viable and promising. Take Fujian, for instance. With its unique geographic location that features a long coastline and abundant fishery resources, as well as the highly effective development model of DSCA, Fujian has adopted bank–enterprise matchmaking to provide strong financial support for the DSCA enterprises. In 2019, the Fujian Provincial People’s Government’s State-Owned Assets Supervision and Administration Commission proposed “Bank-enterprise matchmaking, good-faith cooperation, promoting healthy development of DSCA industry”. By relying on banks as auxiliary forces, enterprise financing becomes more convenient, making it easier for small-scale breeding businesses to gain access to funds, which results in fast industry development. In contrast, Jiangsu’s fishery breeding is in a downstream stage compared to other coastal provinces, but its DSCA has achieved exceptional performance. Take the Jiangsu Smart DSCA Platform project, for example. Most breeding platforms are renovated from discarded ships with surplus capacity in the market, resulting in significantly lower costs and increased efficiency. Moreover, Jiangsu’s economic development level is high, and its per capita GDP ranks first among the coastal provinces, which also contributes to its DSCA. With support from its cost-saving development model and high economic level, Jiangsu has also achieved SBM efficiency. However, as a sharp comparison, Zhejiang’s average efficiency is as minimal as 0.330 and has never reached the optimal efficiency, indicating an unreasonable input–output combination that requires urgent improvement. As the second-largest economic province after Jiangsu in this region, Zhejiang has a strong economic foundation and should be able to reach efficiency via certain means of adjustment.

3.1.2. The DSCA Redundancy

The SBM model is advantageous in that it incorporates all slack variables of input and output into the objective function, making efficiency measurement and improvement more realistic. For a given DMU to be considered efficient, all slack variables of input and output should be equal to 0, and the efficiency value should be 1. Conversely, any DMU that does not satisfy these conditions is considered inefficient. By employing non-radial adjustments based on input redundancy or output insufficiency, non-efficient DMUs can be transformed into efficient ones, thereby maximizing output with minimum consumption. In this study, the redundancy ratio of input and the ratio of input and output variables are computed from 2013 to 2021, and the average redundancy ratio of inputs and outputs is then obtained. Subsequently, the average input–output index redundancy ratio for DSCA production efficiency is computed for the same period and presented in Table 4.
The redundancy rate measures the degree to which various input–output data can be optimized. A large redundancy rate means that an input factor is not fully utilized to attain its maximum functions. When adding up the performance of each province in different sea areas and taking the average value, it is found that the Bohai Sea region displays good efficiency without a lot of redundancy. Liaoning’s input and output are both non-redundant, indicating that the development status of the DSCA in Liaoning is consistent with the current scale of input and output. The Yellow Sea region also shows good performance in terms of input and output without significant redundancy or insufficiency. As major DSCA provinces, Liaoning and Shandong both have a strong industrial foundation in DSA. Take Shandong as an example; it has well-developed fishing cities such as Qingdao and Weihai, as well as large-scale deep-sea cages such as the “Deep Blue 1” and “Long Whale 1”, which contribute to higher breeding efficiency.
The redundancy in the East China Sea region mainly stems from Zhejiang Province, where there is significant input redundancy and output insufficiency. The output insufficiency is particularly severe, reaching 68.31%. Taking personnel as an example, about 20% of employees are in an idle working or underutilized state. Similarly, redundancy in terms of farming volume and enterprise capital conveys a similar concept. As a province with a higher level of economic development, the demand for deep-sea products from residents will increase, leaving a vast market space for DSA. However, as mentioned earlier, Zhejiang’s DSCA started late and has a relatively lower technological level, resulting in insufficient production.
The input redundancy in the South China Sea region mainly stems from the volume of deep-water cage aquaculture, which is most typical in Guangxi and Hainan provinces, while the output insufficiency is also significant, particularly in Guangxi. The redundancy rate for deep-water cage aquaculture volume in Hainan Province is as high as 30.81%, indicating an issue of excessive input. Therefore, it is essential to control the breeding area and scale appropriately and conduct cost-saving and precision aquaculture. Additionally, in Guangxi Province, the redundancy rate is 39.11%, while the output insufficiency rate is 36.20%. Due to its lower level of economic development, the volume of DSCA is relatively smaller, and it naturally cannot compete with the coastal provinces in terms of production. The output insufficiency is attributed to the lack of advanced aquaculture technology, which hinders scientific breeding practices while pursuing expanding breeding volume. Therefore, the key to improving efficiency is to enhance the DSCA technology to optimize its breeding structure.

3.2. Measurement and Decomposition of TFP in China’s DSCA

3.2.1. TFP Trend

To further analyze the changes of the DSCA efficiency in China, this study uses DEAP2.1 software to calculate the Malmquist Index and its decomposition. As mentioned earlier, if the efficiency value is greater than 1, it means an increase, and if it is less than 1, it indicates a decrease. As shown in Figure 4, from 2014 to 2018, the ΔTFP of DSCA in China remained generally stable. It can be noted that the trend of ΔTE over this period was generally the same as that of ΔTFP. Consequently, DMUs without independent innovation capabilities were still at the same level as before, despite the ΔEFF being in a stable state.
The changes described above occurred in 2019. While the ΔTFP did not increase significantly that year, both ΔTE and ΔEFF exhibited significant volatility. This was primarily due to the issuance of the “Opinions on Accelerating the Green Development of Aquaculture” by the Ministry of Agriculture and Rural Affairs in February 2019. The document called for support of green DSA and encouraged the construction of large–scale intelligent aquaculture fishing grounds in deep–sea areas. This policy directive reflected the government’s efforts and support for the development of DSA. As mentioned earlier, macro–level policies coupled with the deployment of large–scale DSA platforms such as “Fubao No. 1” and “Zhenyu No. 1” in 2019 helped to improve the overall technological capability of DSA in society. This led to a change in the efficiency frontier and a continuous improvement in the independent innovation capabilities of the decision–making units (DMUs). In 2019, the technological change index significantly increased, promoting total factor productivity. Meanwhile, the ΔEFF decreased to 0.446, indicating that DSA faced challenges in resource and management aspects, and DMUs had weak imitation abilities, leading to ineffective resource use. In 2020, the ΔEFF experienced a significant increase, but ΔTE decreased, leading to ΔTFP decreasing again, which demonstrated that the positive impact of policies was short–lived, and the primary factor impeding total factor productivity remained ΔTE. Going forward, it can be expected that the government’s continued efforts to develop DSA, bolster science and technology contributions, and promote the transformation of research and development results will have a significant effect on improving ΔTFP. In 2021, the restrictive factors of 2020 were alleviated, and total factor productivity once again increased.
We break down the ΔEFF further into ΔPE and ΔSE, as shown in Figure 5. As for ΔPE, its efficiency value was consistently above 1 in all years except for 2019 and 2021. In contrast, ΔSE had an opposite trend, with its efficiency value being generally below 1 in most years, except for 2016, 2018, and 2020. Moreover, it can be seen that the trends of ΔEFF and ΔSE generally matched each other. Thus, the technical efficiency is primarily influenced by scale technical efficiency, indicating that the technical efficiency of China’s DSCA is primarily determined by production scale, making the enterprise mainly a scale economy type.

3.2.2. TFP Regional Heterogeneity

Table 5 presents the TFP index of the DSCA in different regions. It should be noted here that the average of total factor productivity refers to the geometric mean. While the average TFP of the Bohai Sea did not show an obvious change, the East China Sea region exhibited an annual growth rate of 11%, except for in 2017 and 2021, which ranked the first in the TFP index among other regions. Specifically, Zhejiang had the best performance with an average increase of 30% in the total factor productivity index in China. The Yellow Sea and South China Sea regions experienced varying degrees of decline in the total factor productivity index, with the Yellow Sea declining faster. In general, the total factor productivity of DSCA in China ranged from an increase of 11% (the East China Sea) to a decrease of 12.7% (the Yellow Sea), with disparate trends and significant differences. Due to the vast expanse of the China sea areas with differing climates and hydrological conditions, significant differences in TFP were anticipated. It should be noted that there were significant variations across various years, primarily driven by the extreme values observed in 2019 with a surge in factors such as labor and capital investment, as mentioned earlier. This led to a large standard deviation and consequent statistical significance of the estimation.
We further analyze the decomposition index of total factor productivity. The mean of the pure technical efficiency of DSCA in each sea area is shown in Table 6. As per the table, on the whole, the pure technical efficiency of DSCA in China sea regions is relatively stable, and resources have been effectively utilized. The primary issue arose in 2019 when catch-up effects were not high, leading to significant resource underutilization. In 2019, the Southeast Coast was considerably affected by natural disasters such as typhoons and storm surges, with most coastal areas suffering some impact. A substantial bouncing occurred in 2020, strongly associated with improvement of far-reaching marine aquaculture technology. For instance, the new technology has successively carried out breeding work for yellow fin bream, yellow tail mullet, sea bass, and other cultured varieties for the seedling production enterprises and provided seed supply information and remote online technical guidance for enterprises and farmers, solving the problems of supply and marketing of fish seedlings. In addition, a total factor productivity of 3.099 in Guanxi province in 2020 was also strongly associated with the province’s accelerated development and the promotion of the marine strong zone construction within the framework of the Blue Granary strategy. Meanwhile, Shandong province in the Yellow Sea region made massive resource inputs in 2019 but did not utilize them effectively, causing lower pure technical efficiency and restraining the total factor productivity. However, the lag effect of these massive inputs led to a significant output increment in 2020. The change rate of 21.9% in Zhejiang is particularly noteworthy. It is found that, except for in 2019 and 2021, the pure technical efficiency of Zhejiang has been continuously improving, reflecting the high standards and strict requirements of Zhejiang Province in far–reaching marine technology.
Table 7 illustrates the changes in scale efficiency of DSCA across different regions. The data suggest that the mean values of the four sea areas were approximately 1, with negligible differences. Of these regions, Jiangsu Province in the East China Sea area had the relatively better performance, with an average annual growth rate of 9.2%. This indicates that most of the DSCA enterprises in China benefit from economies of scale, as the sector’s annual growth rate is relatively consistent over time, adding value to the promotion of total factor productivity. Analyzing the standard deviation reveals that Jiangsu and Hainan exhibited higher levels of variability, with extreme values also appearing in 2020. This aligns with the earlier discussed perspective, where there was rapid growth in input variables in 2019, while, in 2020, there was a lagged increase in substantial output, demonstrating significant scale efficiency improvement.
Table 8 illustrates the changes in the technical change index of DSCA across different regions. It can be seen that, except for the Bohai Sea region, the mean values of all the sea regions were below 1, showing that the technical change, to certain extent, has restrained the total factor productivity of DSCA in various regions. Among these regions, both the Yellow Sea and the South China Sea region had a relatively large decline rate. It is found that the technological change index among all regions in 2019 was above 2 and declined sharply in 2020, opposite to both scale efficiency and pure technical efficiency. The technical level across the society has been generally progressing, associated with frequent introduction of far-reaching marine aquaculture promotion policies; however, reasons such as the diseconomy of enterprise scale and the failure of individual enterprise technology to keep up with the across-society development trend led to a backlash in 2020, restricting the change of technology.

4. Conclusions and Discussion

4.1. Conclusions

This study uses the SBM–Malmquist model to measure the production efficiency of DSCA in different provinces of China and further analyze the TFP and its decomposition indices. From these indices, the following conclusions are drawn:
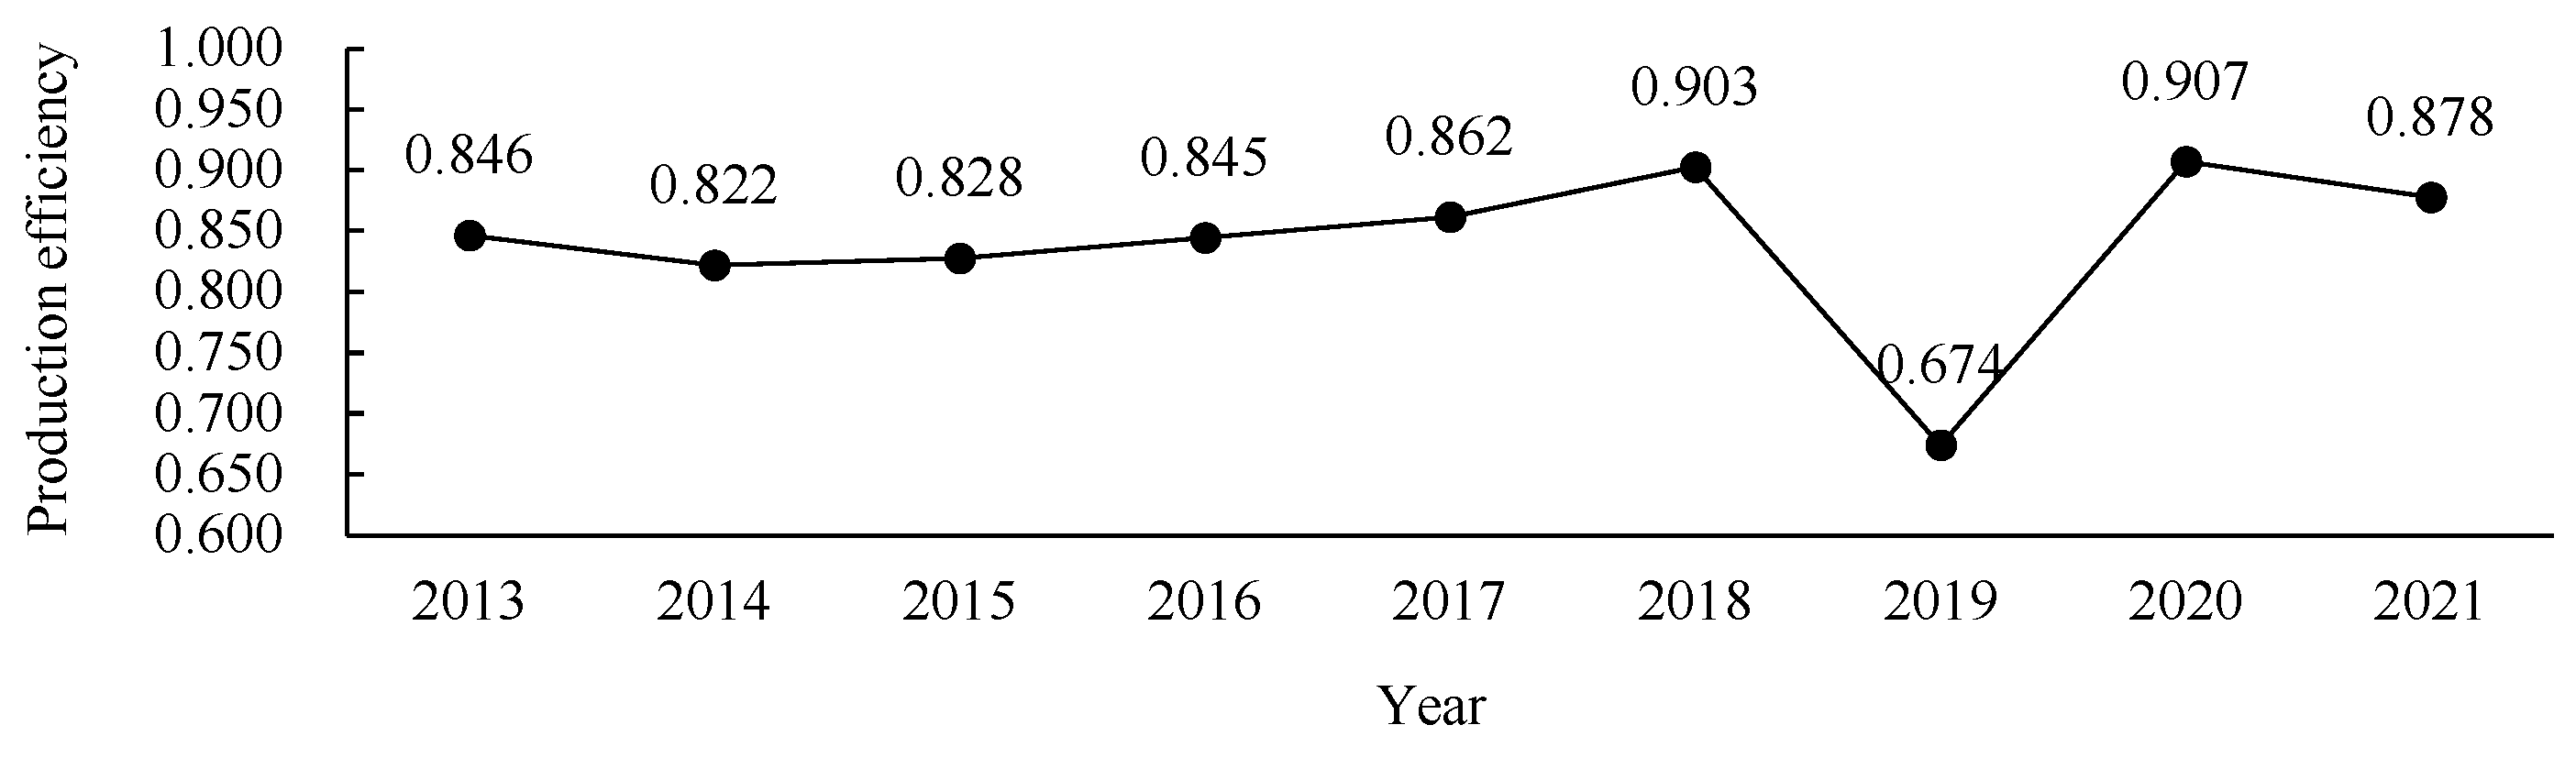
The overall production efficiency of the DSCA showed an increasing trend, as the level of DSCA improved gradually. In 2019, the efficiency experienced a sharp decline due to frequent natural disasters and a significant surge in labor and capital investments resulting from the massive construction of aquaculture platforms. This led to a severe imbalance in input and output ratio. In terms of regional differences, both the Bohai and Yellow Sea regions had a relatively better performance and achieved the effective SBM value. The next is the South China Sea region, but it also experienced lower efficiency in 2019 due to natural disasters. The efficiency over the East China Sea region was relatively scant and exhibited significant disparities among provinces.
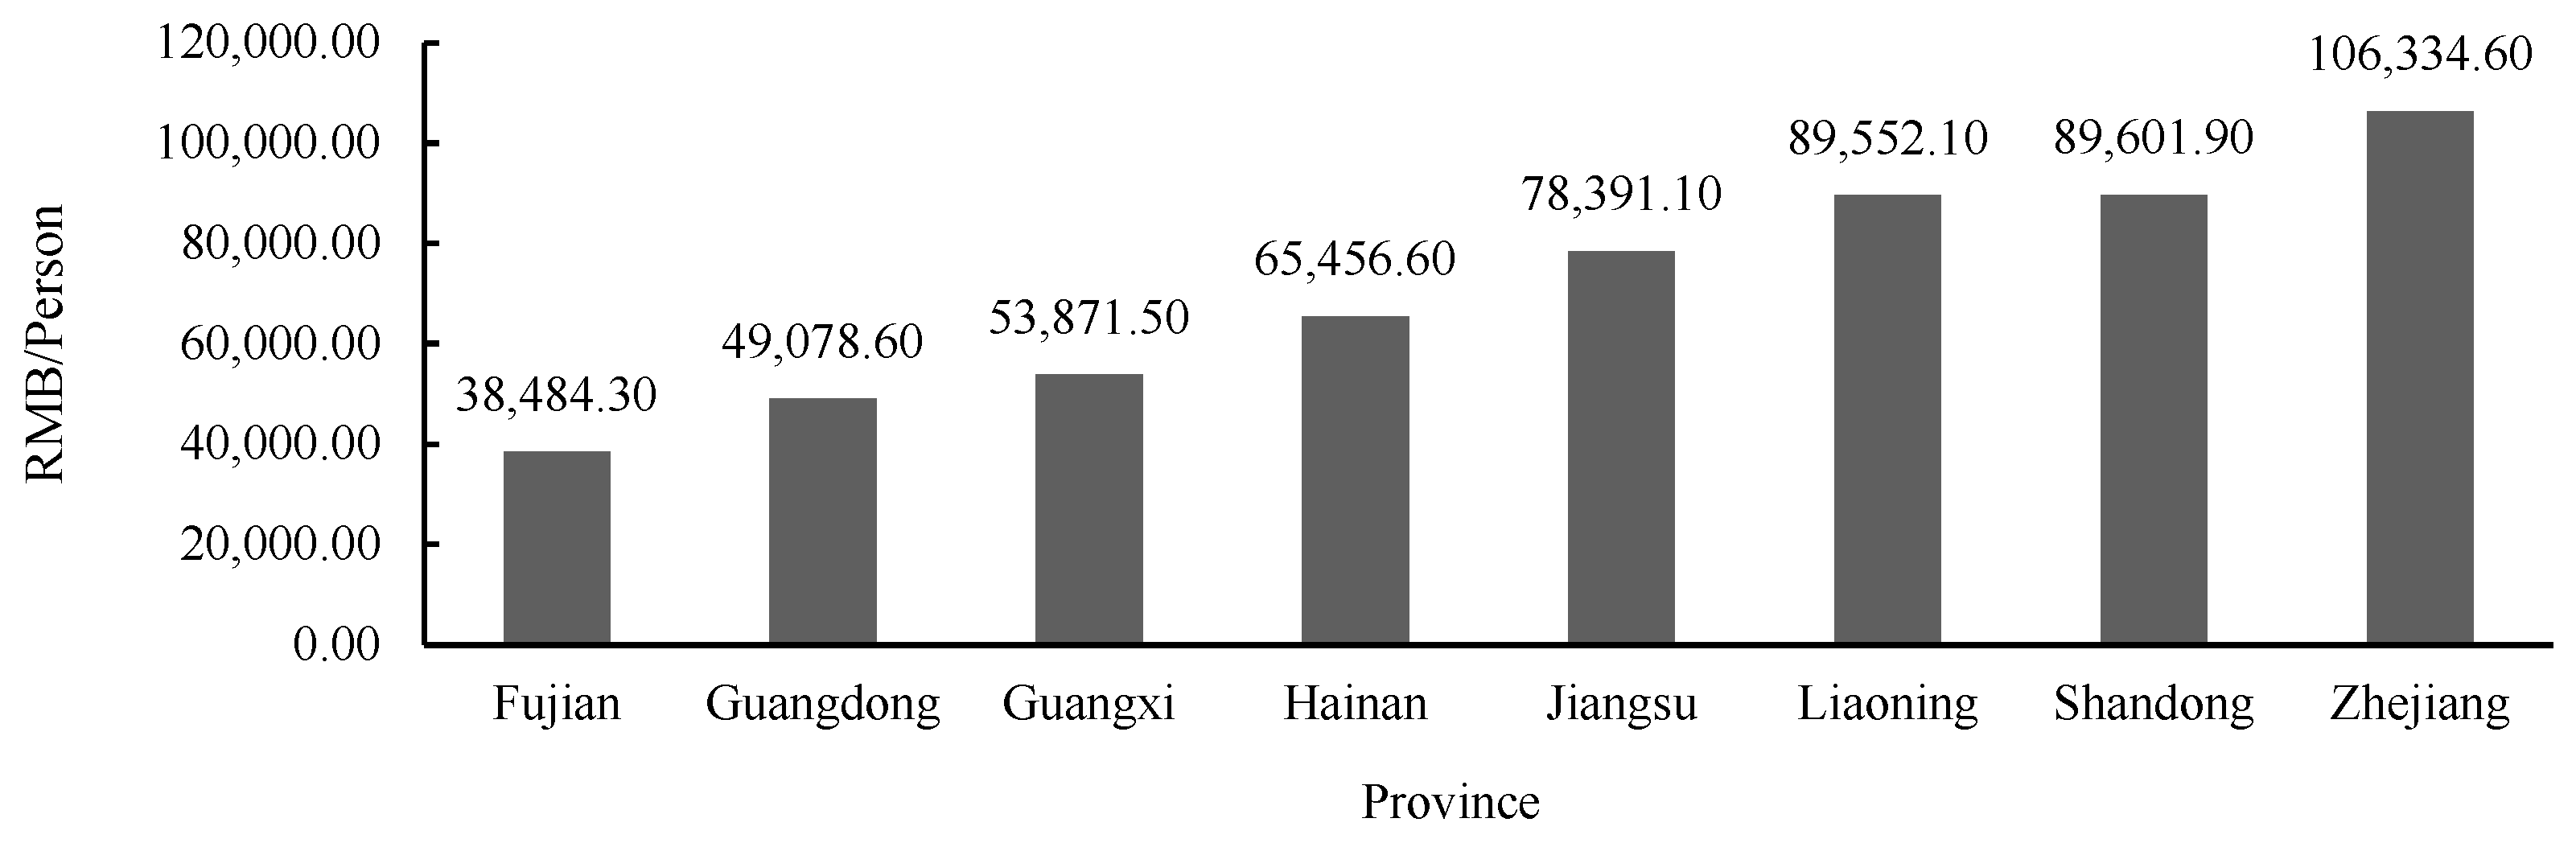
In terms of the redundancy rate, both the Bohai and Yellow Sea regions demonstrated better performance due to their ability to adapt to current input and output scales. The relative high redundancy rate in the East China Sea region was primarily derived from Zhejiang Province. Given large demand potential and inadequate production in this area, it is important to increase the stocking of fish fry and improve their survival rate. In the South China Sea region, the redundancy in input primarily arose from the DSCA volume, and the shortage of output is also significant. To change the situation, a more efficient and precise aquaculture approach should be adopted. This requires moderate control of farming area and scale, alongside a focus on improving the DSA technology in economically underdeveloped areas to optimize their aquaculture structure.
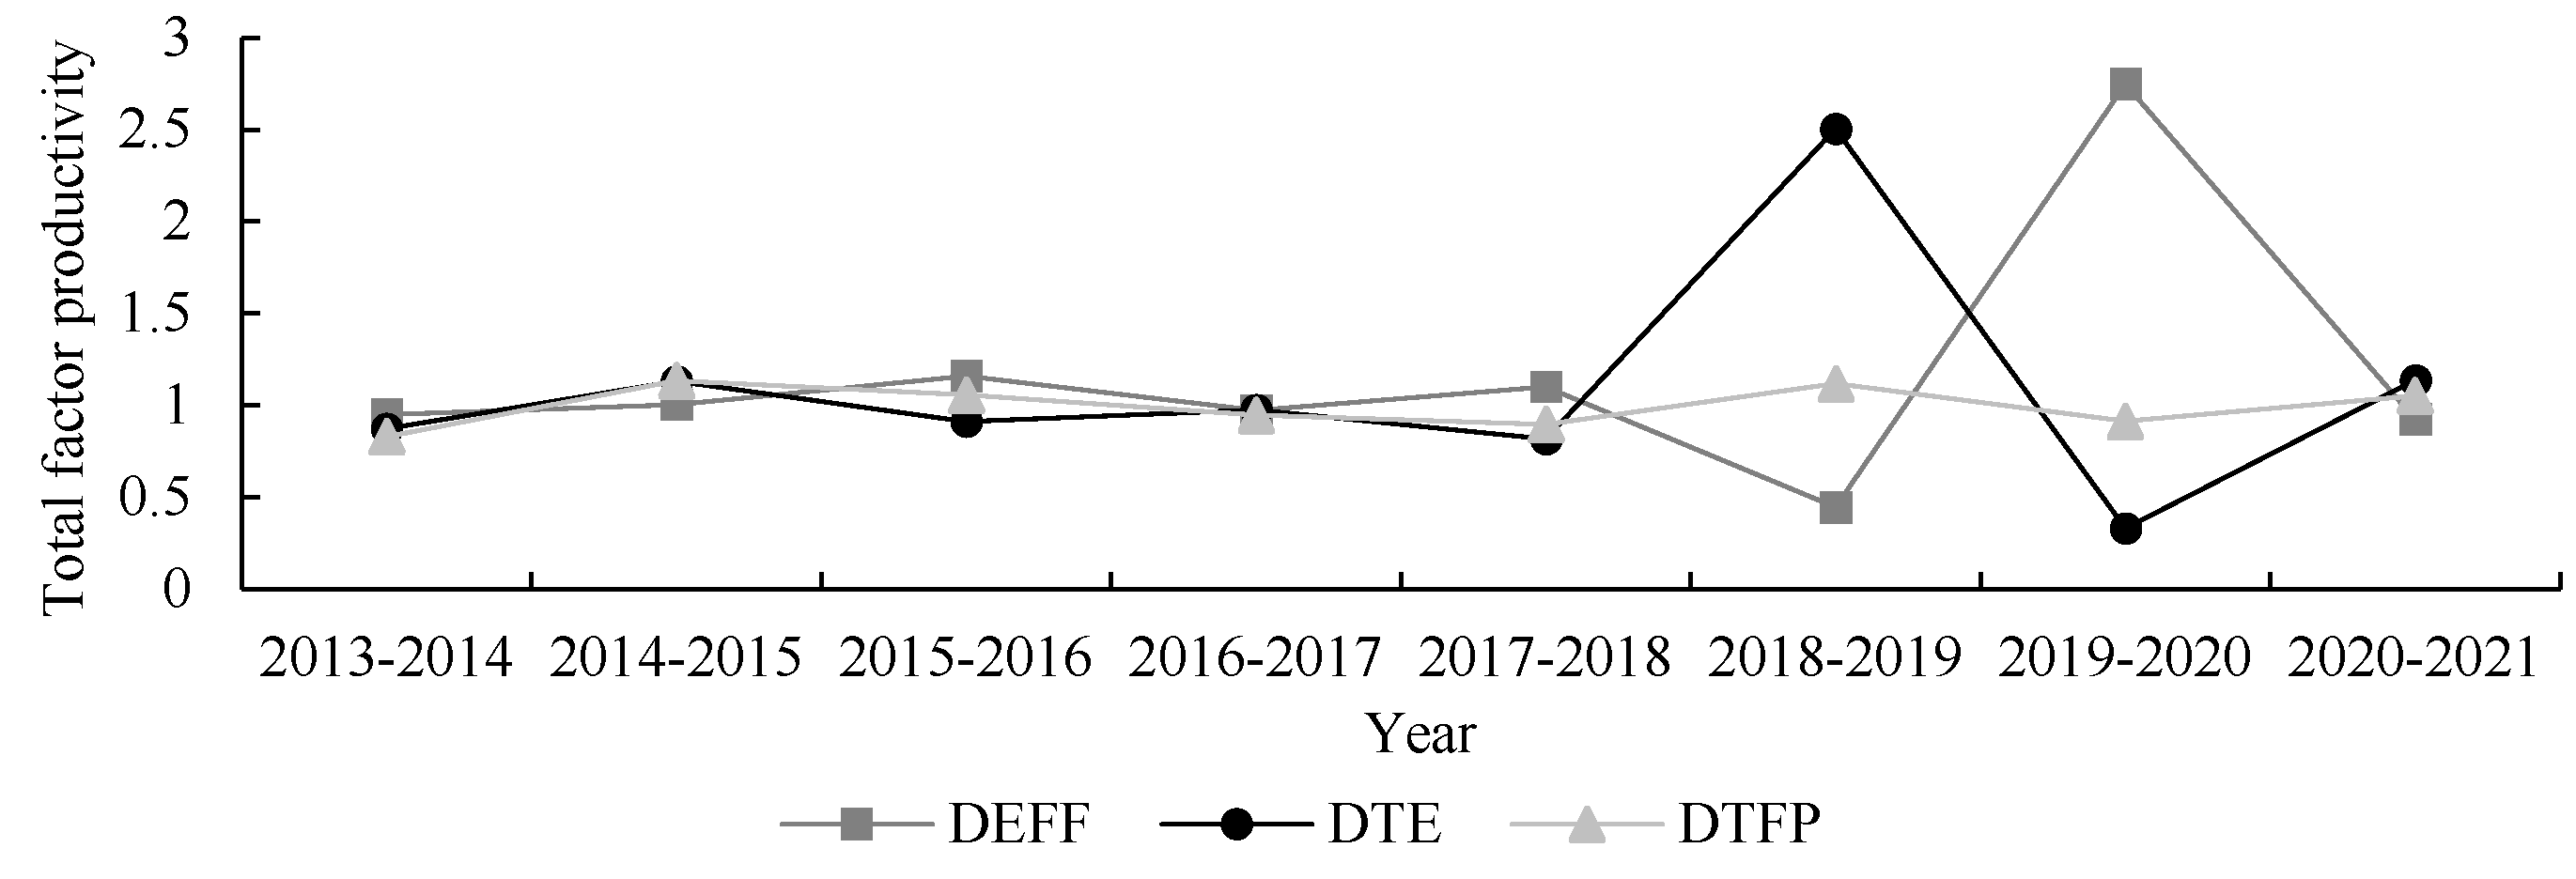
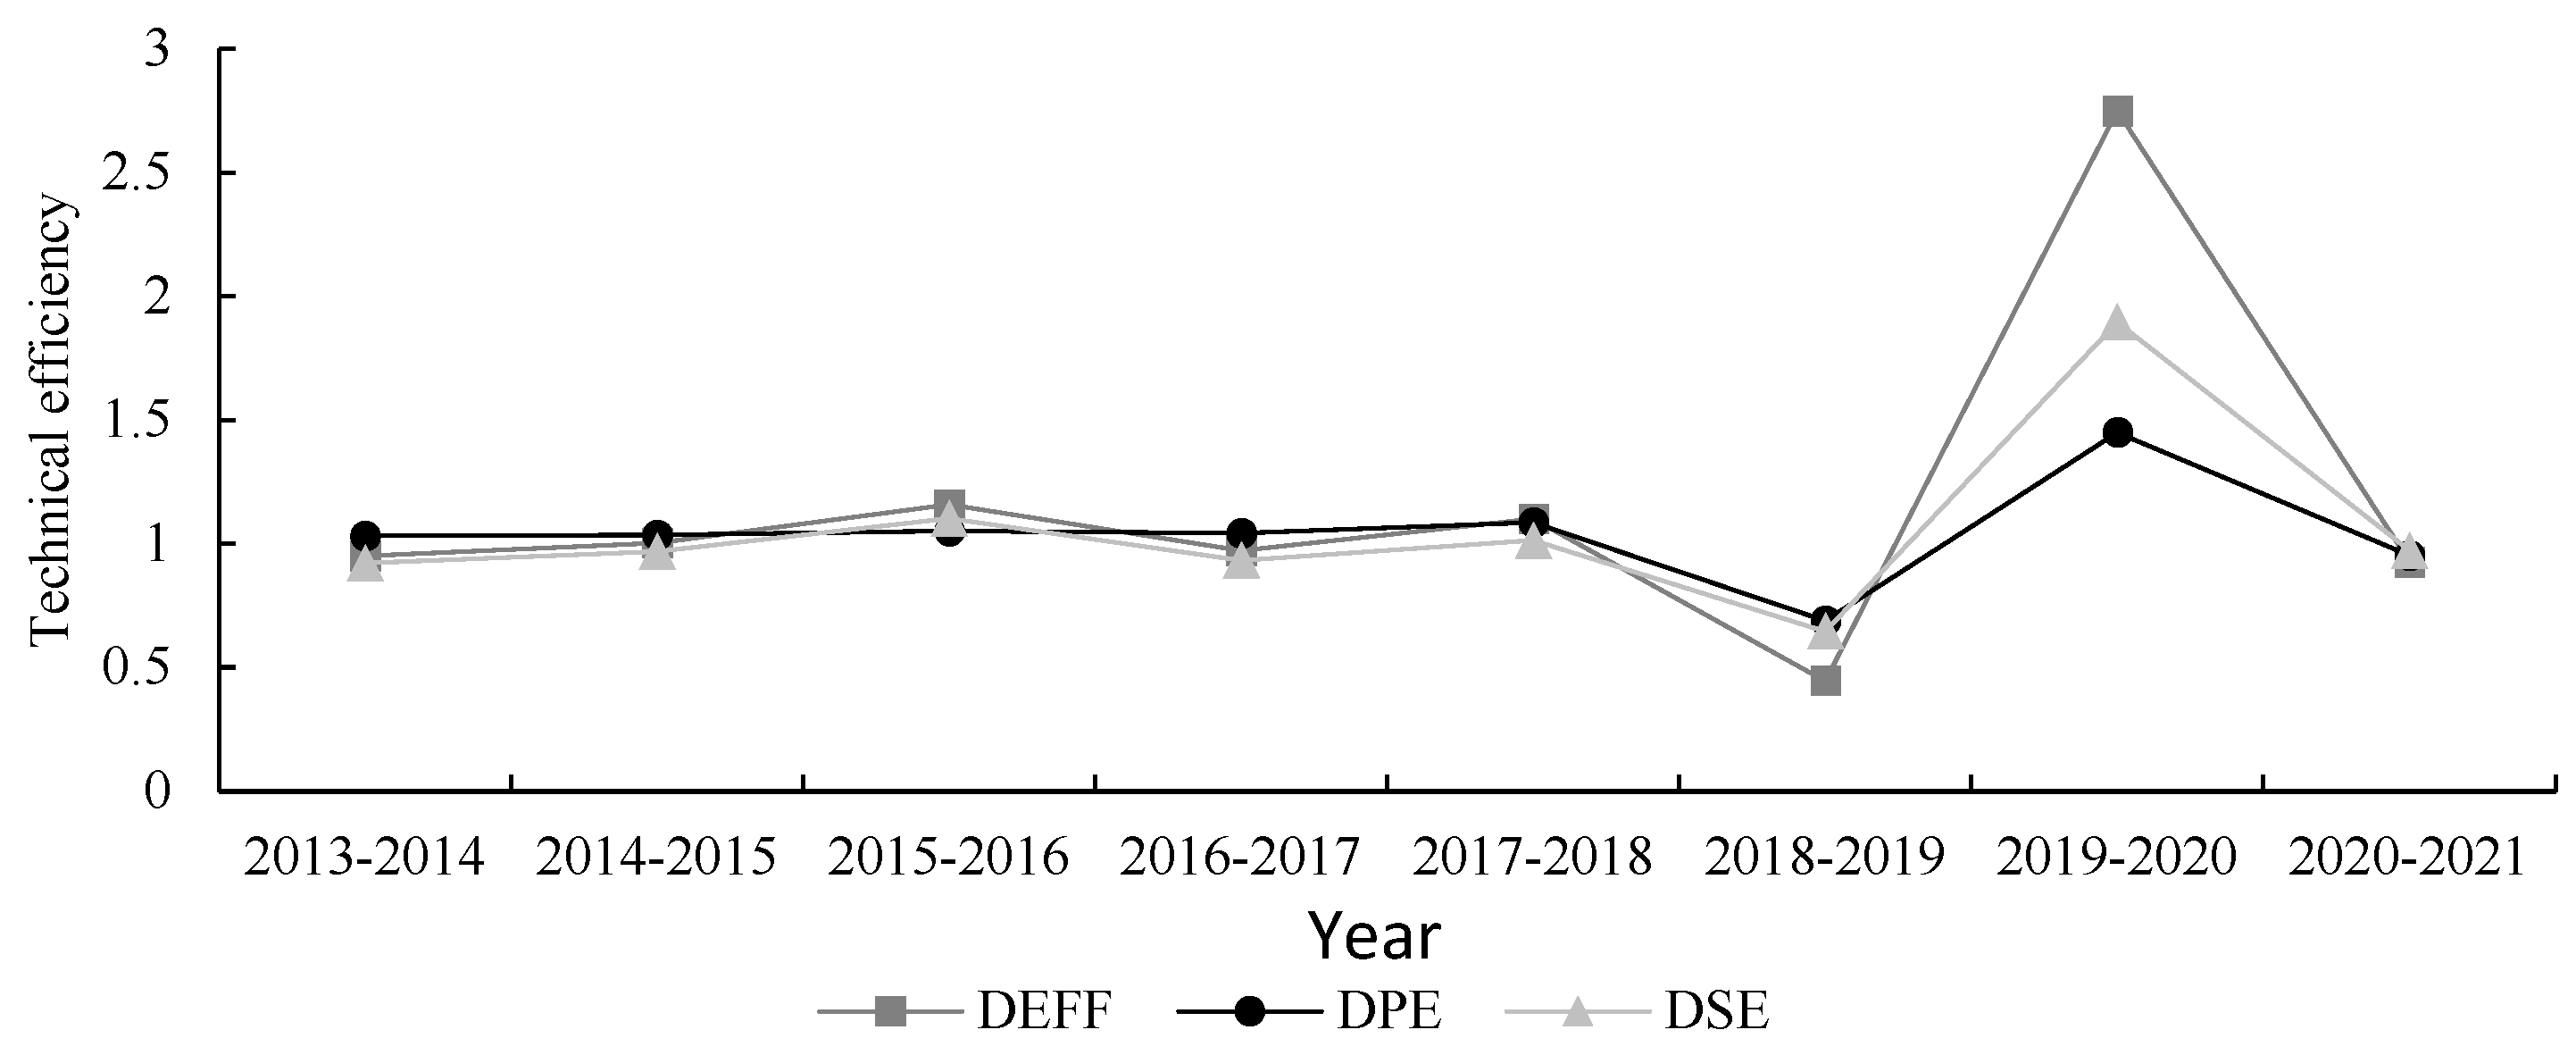
The ΔTFP from 2014 to 2018 remained relatively stable. After that, the regression of the technology efficiency frontier driven by across-society technology change was identified as the primary factor restricting ΔTFP. A decomposition analysis of efficiency shows that technical efficiency is primarily affected by scale technical efficiency, indicating that the technical efficiency of China’s DSCA is heavily influenced by production scale. As a result, most enterprises in this sector benefit from economies of scale.
In terms of the regional heterogeneity of TFP, the East China Sea had the better performance, with an average annual growth rate of 11%, while the Bohai Sea did not show a change. In contrast, the TFP in the Yellow Sea and South China Sea regions declined by certain degrees, with the Yellow Sea region having a faster decline rate. Overall, the TFP trends for China’s DSCA differed significantly across regions. After decomposing the total factor productivity, it is found that pure technical efficiency remained relatively stable, indicating that resources have been effectively utilized and had a positive impact on TFP. The mean change of the scale efficiency was around 1, and most enterprises in DSCA benefited from economies of scale and had a positive impact on TFP. However, the technical change generally appeared to have a restraining effect on TFP in various DSCA regions, leading to the retrogression of the efficiency in enterprises.

4.2. Discussion

This article reveals the efficiency and productivity of DSCA in eight of China’s coastal provinces over a nine-year period, providing insights into the economic aspects of this vital sector. The study indicates that deceleration or even retreat of efficiency of technological change in terms of societal aspects has a significant impact on overall efficiency and productivity, representing a major challenge for the entire industry. While individual DMUs may be striving for technological progress, the industry as a whole still matters. Addressing this issue is crucial for the economic development of the deep-sea cage aquaculture sector in future. Therefore, improvements must begin at the societal forefront. The government may enact policies to promote deep-sea aquaculture, vigorously developing aquaculture technologies and drawing on the experiences of advanced deep-sea aquaculture nations. In addition, the analysis of redundancy rates including both labor investment and farming volume also highlights the need for further analysis and improvement. Measures can be taken to foster innovation, enhance work efficiency, and build a positive work environment and teamwork and individual achievements to reduce labor redundancy. Farming volume can be optimized by adopting new DCSA technologies to maximize its utilization.
Additionally, due to the emerging nature of the deep-sea sector, there is a lack of comprehensive data and research in various aspects, such as the analysis of the marine ecosystem, ecological environment, pollution, and so on. Variances in water temperature, ocean currents, and natural factors such as monsoons lead to differences in aquaculture outcomes and yields. The marine environments of different provinces vary, and these distinctions significantly affect the results and yields of aquaculture. In addition, the current study only measures the efficiency of the entire DCSA sector without consideration of specific species being cultured over different regions. Given the large latitudinal extensions of the China coastal waters, it will be very important to consider specific species cultured by DCSA. That will be a future research theme, with relevant data accumulated.

Author Contributions

Conceptualization, Y.Z.; Formal Analysis, M.-F.L.; Investigation, Y.Z.; Writing—Original Draft, M.-F.L.; Writing—Review and Editing, Y.Z. and X.-H.F.; Visualization, M.-F.L. and X.-H.F.; Supervision, Y.Z.; Project Administration, Y.Z.; Funding Acquisition, Y.Z. All authors have read and agreed to the published version of the manuscript.

Funding

This work was supported by the National Natural Science Foundation General Program of China (grant number 42176218).

Data Availability Statement

The data used in this paper were collected from the Chinese National Enterprise Credit Information Publicity System and the China Fishery Statistical Yearbook [26,27,28,29,30,31,32,33,34].

Conflicts of Interest

The authors declare no conflict of interest.

References

  1. Lin, M. Developing large-scale deep-sea aquaculture: Problems, models, and implementation paths. Manag. World 2022, 38, 39–60. [Google Scholar]
  2. Xu, H.; Liu, H.; Xu, Y.F. The current situation and prospects of deep-sea aquaculture development in China. China Fish. 2021, 36–39. [Google Scholar]
  3. Han, X. Model Experiment on Hydrodynamic Characteristics of a Semi-Submersible Deep Sea Aquaculture Platform; Dalian University of Technology: Dalian, China, 2018. [Google Scholar]
  4. Dong, S.L. On the Ecological Intensive Development of China’s Aquaculture. Ind. China Fish. Econ. 2015, 33, 4–9. [Google Scholar]
  5. Liu, H.; Xu, Y.F.; Miao, M. The Development of Deep-Sea Aquaculture in China Based on SWOT Model. Ocean Dev. Manag. 2019, 36, 45–49. [Google Scholar]
  6. Han, L.M.; Guo, Y.C.; Dong, S.L. Research on Developing the Yellow Sea Cold Water Mass and Establishing a National Offshore Aquaculture Pilot Zone. Pac. J. 2016, 24, 79–85. [Google Scholar]
  7. Mai, K.S.; Xu, H.; Xue, C.H.; Gu, W.D.; Zhang, W.B.; Li, Z.J.; Yu, B. Strategic research on exploring new space for deep sea aquaculture in China. China Eng. Sci. 2016, 18, 90–95. [Google Scholar]
  8. Li, D.H.; Han, L.M. Research on the Development of Strategic Emerging Marine Industries in Qingdao. Mar. Dev. Manag. 2016, 33, 18–22. [Google Scholar]
  9. Liang, P. Feasibility Study on the Investment of H Company’s Deep-Sea Fisheries and Aquaculture Platform Project; Dalian Maritime University: Dalian, China, 2020. [Google Scholar]
  10. Hou, J.; Zhou, W.F.; Wang, L.M.; Fan, W.; Yuan, Z.H. Spatial analysis of the aquaculture potential in China’s deep and distant seas. Resour. Sci. 2020, 42, 1325–1337. [Google Scholar]
  11. Liu, Y.X.; Liu, H.; Fang, H.; Xu, H.; Wang, L.M.; Liu, Y.J. The Current Situation and Future Vision of China’s Deep Blue Fisheries Development. J. Fish. 2022, 46, 706–717. [Google Scholar]
  12. Zhang, Y.; Li, D.H.; Geng, T. Research on the Development Strategy of Deep Blue Fisheries in China under the Background of Climate Change. J. Shandong Univ. Philos. Soc. Sci. Ed. 2018, 06, 121–129. [Google Scholar]
  13. Zhang, Y.; Chen, Y.S.; Wang, S.P. Empirical Study on the Growth Strategy of Marine Fisheries Economy—Taking Shandong as an Example. J. Shandong Univ. Philos. Soc. Sci. Ed. 2021, 03, 152–160. [Google Scholar]
  14. Xu, J.; Han, L.M.; Zhang, Y. The industrial characteristics and policy support of deep-sea aquaculture in China. China Fish. Econ. 2021, 39, 98–107. [Google Scholar]
  15. Kim, J.H.; Choi, K.D.; Kim, S.K. A Data Envelopment Analysis Model for Evaluation of Efficiency of Deep-Sea Fishing Industry. J. Fish. Bus. Adm. 2008, 39, 49–65. [Google Scholar]
  16. Hassanpour, B.; Ismail, M.M.; Mohamed, Z.; Kamarulzaman, N.H. Sources of productivity growth in rainbow trout aquaculture in Iran: Technical efficiency change or technological progress? Aquac. Econ. Manag. 2010, 14, 218–234. [Google Scholar] [CrossRef]
  17. Vassdal, T.; Sorensen, H.M.; Holstr, R. Technical Progress and Regress in Norwegian Salmon Farming: A Malmquist Index Approach. Mar. Resour. Econ. 2011, 26, 329–341. [Google Scholar] [CrossRef]
  18. Kiet, T.N.; Timothy, C.G. Fisher. Efficiency analysis and the effect of pollution on shrimp farms in the Mekong River delta. Aquac. Econ. Manag. 2014, 18, 325–343. [Google Scholar]
  19. Wang, P.P. Research on Efficiency Evaluation and Improvement Strategies for China’s Seawater Aquaculture Industry Considering Unexpected Output; Ocean University of China: Qingdao, China, 2015. [Google Scholar]
  20. Ji, J.Y.; Zeng, Q. Analysis of the spatiotemporal evolution of green technology efficiency in China’s marine aquaculture industry based on global DEA. Chin. Manag. Sci. 2016, 24, 774–778. [Google Scholar]
  21. Qin, H.; Zhang, Y.; Lu, Y.Y. Measurement of Ecological and Economic Efficiency of Seawater Aquaculture in China Based on SBM Model. Agric. Technol. Econ. 2018, 09, 67–79. [Google Scholar]
  22. Liu, Y. Research on Dynamic efficiency of input and output of mariculture in China—Based on panel data analysis of 9 provinces and cities from 2004 to 2013. Mar. Dev. Manag. 2015, 32, 94–99. [Google Scholar]
  23. Zhang, Y.; Ji, J.Y. Decomposition and influencing factor analysis of green total factor productivity in China’s aquaculture industry. Sci. Technol. Manag. Res. 2022, 42, 206–213. [Google Scholar]
  24. Zhang, C.; Zhang, W.H.; Gao, Z.P. Research on Technical Efficiency and Total Factor Productivity of China’s Aquaculture Industry. Agric. Technol. Econ. 2014, 06, 38–45. [Google Scholar]
  25. Díaz, P.A.; Pérez-Santos, I.; Basti, L.; Garreaud, R.; Pinilla, E.; Barrera, F.; Tello, A.; Schwerter, C.; Arenas-Uribe, S.; Soto-Riquelme, C.; et al. How local and climate change drivers shaped the formation, dynamics and potential recurrence of a massive fish-killer microalgal bloom in Patagonian fjord. Sci. Total Environ. 2023, 865, 161288. [Google Scholar] [CrossRef]
  26. John, U.; Supraha, L.; Gran-Stadniczeñko, S.; Bunse, C.; Cembella, A.; Eikrem, W.; Janouskovec, J.; Klemm, K.; Kühne, N.; Naustvoll, L.; et al. Spatial and biological oceanographic insights into the massive fish-killing bloom of the haptophyte Chrysochromulina leadbeateri in northern Norway. Harmful Algae 2023, 118, 102287. [Google Scholar] [CrossRef]
  27. Fisheries and Fisheries Office. Notice of the Ministry of Agriculture and Rural Affairs on Issuing the “14th Five Year Plan for National Fisheries Development”; Ministry of Agriculture and Rural Affairs: Beijing, China, 2022.
  28. Fisheries Administration Bureau of the Ministry of Agriculture and Rural Affairs. Fishing Industry in China Statistical Yearbook; Agricultural Publishing House: Beijing, China, 2014; pp. 35–61.
  29. Fisheries Administration Bureau of the Ministry of Agriculture and Rural Affairs. Fishing Industry in China Statistical Yearbook; Agricultural Publishing House: Beijing, China, 2015; pp. 35–61. [Google Scholar]
  30. Fisheries Administration Bureau of the Ministry of Agriculture and Rural Affairs. Fishing Industry in China Statistical Yearbook; Agricultural Publishing House: Beijing, China, 2016; pp. 35–61.
  31. Fisheries Administration Bureau of the Ministry of Agriculture and Rural Affairs. Fishing Industry in China Statistical Yearbook; Agricultural Publishing House: Beijing, China, 2017; pp. 35–61.
  32. Fisheries Administration Bureau of the Ministry of Agriculture and Rural Affairs. Fishing Industry in China Statistical Yearbook; Agricultural Publishing House: Beijing, China, 2018; pp. 35–61.
  33. Fisheries Administration Bureau of the Ministry of Agriculture and Rural Affairs. Fishing Industry in China Statistical Yearbook; Agricultural Publishing House: Beijing, China, 2019; pp. 35–61.
  34. Fisheries Administration Bureau of the Ministry of Agriculture and Rural Affairs. Fishing Industry in China Statistical Yearbook; Agricultural Publishing House: Beijing, China, 2020; pp. 35–61.
  35. Fisheries Administration Bureau of the Ministry of Agriculture and Rural Affairs. Fishing Industry in China Statistical Yearbook; Agricultural Publishing House: Beijing, China, 2021; pp. 35–61.
  36. Fisheries Administration Bureau of the Ministry of Agriculture and Rural Affairs. Fishing Industry in China Statistical Yearbook; Agricultural Publishing House: Beijing, China, 2022; pp. 35–61.
  37. Farrell, M.J. The Measurement of Productive Efficiency. J. R. Stat. Soc. Ser. A Gen. 1957, 120, 253–281. [Google Scholar] [CrossRef]
  38. Sun, C.Z.; Ma, Q.F.; Zhao, L.S. Research on the Changes in Green Efficiency of Water Resources in China Based on the SBM Malmquist Productivity Index Model. Resour. Sci. 2018, 40, 993–1005. [Google Scholar]
  39. Tone, K. A Slacks-based Measure of Efficiency in Data Envelopment Analysis. Eur. J. Oper. Res. 2001, 130, 498–509. [Google Scholar] [CrossRef]
  40. Solow, R.M. Production function and the theory of economic growth. Q. J. Econ. 2000, 70, 65–94. [Google Scholar] [CrossRef]
  41. Malmquist, S. Index Numbers and Indifference Surfaces. Trab. Estad. 1953, 4, 209–242. [Google Scholar] [CrossRef]
  42. Caves, D.W.; Christensen, L.R.; Diewert, W.E. The Economic Theory of Index Numbers and the Measurement of Input, Output, and Productivity. Econometrica 1982, 50, 1393–1414. [Google Scholar] [CrossRef]
Figure 1. Map of China coastal provinces and seas.
Fishes 08 00529 g001
Figure 2. DSCA production efficiency in China from 2013 to 2021.
Fishes 08 00529 g002
Figure 3. Mean per capita regional gross domestic product (GDP) from 2013 to 2021 (RMB/person). Data source: National Bureau of Statistics of China official website.
Fishes 08 00529 g003
Figure 4. Total factor productivity changes in China’s deep–sea cage aquaculture.
Fishes 08 00529 g004
Figure 5. Technical efficiency changes and their decomposition indexes in China’s DSCA.
Fishes 08 00529 g005
Table 1. Efficiency measurement index for DSCA in China.
Tiered IndicatorSpecific IndicatorUnitData Source
InputNumber of employees engaged in DSCApersonsChinese National Enterprise Credit Information Publicity System
Registered capital of DSCA enterprisesthousand RMBChinese National Enterprise Credit Information Publicity System
Volume of deep-water cagesm3China Fishery Statistical Yearbook
OutputOutput volume of DSCAtonChina Fishery Statistical Yearbook
Table 2. The descriptive statistics of input and output indicators for the period between 2013 and 2021.
YearStatistical MeasuresInput IndicatorsOutput Indicator
Number of Employees Engaged in DSA (Persons)Registered Capital of DSA Enterprises (Thousand RMB)Volume of Deep-Water Cages (m3)Output Volume of DSA (ton)
2013mean38.146,307.7519,103.49235.6
standard deviation93.152,743.1523,125.89335.9
2014mean40.150,057.7756,971.611,092.1
standard deviation96.353,224.9565,303.011,900.5
2015mean41.352,807.71,170,129.013,216.4
standard deviation98.058,411.91,379,534.013,719.1
2016mean43.454,807.71,334,471.014,912.1
standard deviation97.257,736.51,531,034.015,489.2
2017mean45.572,182.71,523,076.016,879.0
standard deviation96.580,647.31,966,942.017,455.1
2018mean49.882,495.21686903.019,259.1
standard deviation104.587,772.41,901,204.017,131.2
2019mean52.6108,745.22,423,027.025,668.4
standard deviation103.797,115.22,161,856.020,204.6
2020mean54.4126,870.24,779,485.036,660.4
standard deviation103.3134,327.04,512,130.032,680.6
2021mean55.4129,120.24,959,322.042,168.1
standard deviation105.4137,696.44,097,889.034,898.8
Table 3. DSCA production efficiency in China coastal areas from 2013 to 2021.
YearBohai SeaYellow SeaEast China SeaSouth China Sea
LiaoningMeanShandongMeanJiangsuZhejiangFujianMeanGuangdongGuangxiHainanMean
20131.0001.0001.0001.0001.0000.0801.0000.6931.0000.6901.0000.897
20141.0001.0001.0001.0001.0000.1761.0000.7251.0000.4001.0000.800
20151.0001.0001.0001.0001.0000.2561.0000.7521.0000.3641.0000.788
20161.0001.0001.0001.0001.0000.3131.0000.7711.0000.4441.0000.815
20171.0001.0001.0001.0001.0000.3771.0000.7921.0000.5151.0000.838
20181.0001.0001.0001.0001.0000.5931.0000.8641.0000.6291.0000.876
20191.0001.0000.4530.4531.0000.3091.0000.7700.5820.3230.7250.543
20201.0001.0001.0001.0001.0000.4791.0000.8261.0001.0000.7780.926
20211.0001.0000.9650.9651.0000.3901.0000.7971.0001.0000.6670.889
Mean1.0001.0000.9350.9351.0000.3301.0000.7770.9540.5960.9080.819
Table 4. Average redundancy ratios of input–output indices for DSCA production efficiency in China from 2013 to 2021.
RegionProvinceEfficiencySlack Variables
Input Redundancy RatiosOutput Insufficiency Ratio
Number of Employees Engaged in DSCA (Persons)Volume of Deep-Water Cages (in Cubic Meters)Registered Capital (in RMB) of DSCA EnterprisesOutput Volume (in Tons) of DSCA
Bohai SeaLiaoning10.00%0.00%0.00%0.00%
Mean10.00%0.00%0.00%0.00%
Yellow SeaShandong0.9352.56%0.00%8.01%5.50%
Mean0.9352.56%0.00%8.01%5.50%
East China SeaJiangsu10.00%0.00%0.00%0.00%
Zhejiang0.33021.63%36.51%20.96%68.31%
Fujian10.00%0.00%0.00%0.00%
Mean0.7777.21%12.17%6.99%22.77%
South China SeaGuangdong0.9547.02%16.34%9.40%7.33%
Guangxi0.5965.33%39.11%7.05%36.20%
Hainan0.9089.16%30.81%14.49%19.27%
Mean0.8197.17%28.76%10.31%20.93%
Table 5. Index of changes in ΔTFP of DSCA in different regions.
RegionsProvinces2013–20142014–20152015–20162016–20172017–20182018–20192019–20202020–2021GeomeanAverage Rate of ChangeStandard Deviation
Bohai SeaLiaoning0.7601.5911.0411.0010.7982.2210.4771.0141.0101%0.549
Mean0.7601.5911.0411.0010.7982.2210.4771.0141.0101%0.549
Yellow SeaShandong0.7621.1960.9710.6460.7440.9730.7831.0430.873−12.7%0.185
Mean0.7621.1960.9710.6460.7440.9730.7831.0430.873−12.7%0.185
East China SeaJiangsu1.1411.1671.2180.6270.8010.9671.2580.9590.994−0.6%0.221
Zhejiang2.0391.6431.1541.1651.5231.0571.1880.9461.30030%0.366
Fujian1.1951.0520.8071.0240.7812.6870.5771.0651.0373.7%0.652
Mean1.4581.2871.0600.9391.0351.5701.0080.9901.11011%0.239
South China SeaGuangdong0.6851.0731.1041.4660.6870.5831.0901.1930.942−5.8%0.304
Guangxi0.6530.9611.1170.9341.2470.8481.3271.2051.0131.3%0.228
Hainan0.3150.6891.0940.9740.8670.8321.0371.0230.805−19.5%0.254
Mean0.5510.9081.1051.1250.9340.7541.1511.1400.920−8%0.217
Table 6. Index of changes in pure technical efficiency (ΔPE) of DSCA in different regions.
RegionProvinces2013–20142014–20152015–20162016–20172017–20182018–20192019–20202020–2021GeomeanAverage Rate of ChangeStandard Deviation
Bohai SeaLiaoning1.0001.0001.0001.0001.0001.0001.0001.0001.00000
Mean1.0001.0001.0001.0001.0001.0001.0001.0001.00000
Yellow SeaShandong1.0001.0001.0001.0001.0000.4532.2080.9650.995−0.5%0.494
Mean1.0001.0001.0001.0001.0000.4532.2080.9650.995−0.5%0.494
East China SeaJiangsu1.0001.0001.0001.0001.0001.0001.0001.0001.00000
Zhejiang2.2071.4541.2231.2071.5710.5201.5520.8141.21921.9%0.513
Fujian1.0001.0001.0001.0001.0001.0001.0001.0001.00000
Mean1.4021.1511.0741.0691.1900.8401.1840.9381.0737.3%0.171
South China SeaGuangdong1.0001.0001.0001.0001.0000.5821.7181.0001.00000.311
Guangxi0.5800.9101.2201.1591.2210.5133.0991.0001.0474.7%0.810
Hainan1.0001.0001.0001.0001.0000.7251.0730.8570.951−4.9%0.111
Mean0.8600.9701.0731.0531.0740.6071.9630.9520.999−0.1%0.393
Table 7. Index of changes in scale efficiency (ΔSE) of DSCA in different regions.
RegionProvinces2013–20142014–20152015–20162016–20172017–20182018–20192019–20202020–2021GeomeanAverage Rate of ChangeStandard Deviation
Bohai SeaLiaoning1.0001.0001.0001.0001.0001.0001.0001.0001.00000
Mean1.0001.0001.0001.0001.0001.0001.0001.0001.00000
Yellow SeaShandong1.0001.0001.0001.0001.0000.9931.0070.9820.998−0.2%0.007
Mean1.0001.0001.0001.0001.0000.9931.0070.9820.998−0.2%0.007
East China SeaJiangsu1.2771.1611.2540.5111.1960.4375.0910.7981.0929.2%1.503
Zhejiang0.8321.0271.1941.0090.9860.7891.4920.9991.0222.2%0.220
Fujian1.0001.0001.0001.0001.0001.0001.0001.0001.00000
Mean1.0361.0631.1490.8401.0610.7422.5280.9321.0383.8%0.565
South China SeaGuangdong0.6171.0681.1371.1941.0000.4112.7171.0001.00000.691
Guangxi1.0660.9561.0410.8571.0830.5921.9231.0001.0141.4%0.382
Hainan0.7450.6341.2341.0760.8730.3704.1671.0230.982−1.8%1.204
Mean0.8090.8861.1371.0420.9850.4582.9361.0080.999−0.1%0.748
Table 8. Index of ΔTE in DSCA in different regions.
RegionProvinces2013–20142014–20152015–20162016–20172017–20182018–20192019–20202020–2021GeomeanAverage Rate of ChangeStandard Deviation
Bohai SeaLiaoning0.7601.5911.0411.0010.7982.2210.4771.0141.0101.0%0.549
Mean0.7601.5911.0411.0010.7982.2210.4771.0141.0101.0%0.549
Yellow SeaShandong0.7621.1960.9710.6460.7442.1640.3521.1020.879−12.1%0.544
Mean0.7621.1960.9710.6460.7442.1640.3521.1020.879−12.1%0.544
East China SeaJiangsu0.8941.0050.9711.2280.6702.2140.2471.2020.910−9.0%0.565
Zhejiang1.1111.1010.7900.9570.9832.5740.5131.1651.0434.3%0.613
Fujian1.1951.0520.8071.0240.7812.6870.5771.0651.0373.7%0.652
Mean1.0671.0530.8561.0700.8112.4920.4461.1440.997−0.3%0.599
South China SeaGuangdong1.1101.0050.9711.2280.6872.4340.2331.1930.942−5.8%0.627
Guangxi1.0571.1050.8800.9400.9442.7910.2231.2050.953−4.7%0.729
Hainan0.4231.0860.8860.9050.9933.1000.2321.1660.863−13.7%0.871
Mean0.8631.0650.9121.0240.8752.7750.2291.1880.919−8.1%0.729
Disclaimer/Publisher’s Note: The statements, opinions and data contained in all publications are solely those of the individual author(s) and contributor(s) and not of MDPI and/or the editor(s). MDPI and/or the editor(s) disclaim responsibility for any injury to people or property resulting from any ideas, methods, instructions or products referred to in the content.

